Article

Synergistic Optimization Strategy for Cavitation Suppression of Piston Pumps Based on Low-Pressure Loss Flow Passages

1
School of Mechanical Engineering, Yanshan University, Qinhuangdao 066000, China
2
Hangzhou Ruisheng Marine Instruments Co., Ltd., Hangzhou 310012, China
3
AVIC Changchun Control Technology, Changchun 130102, China
4
State Key Laboratory of Crane Technology, Yanshan University, Qinhuangdao 066000, China
5
Hebei Provincial Key Laboratory of Heavy Machinery Fluid Power Transmission and Control, Qinhuangdao 066000, China
*
Author to whom correspondence should be addressed.
Machines 2025, 13(10), 901; https://doi.org/10.3390/machines13100901
Submission received: 4 September 2025 / Revised: 24 September 2025 / Accepted: 26 September 2025 / Published: 1 October 2025
(This article belongs to the Special Issue High-Performance Compressor Design, Model Analysis and Application)

Abstract

For axial closed-circuit piston pumps, cavitation often causes a reduction in volumetric efficiency during operation, and flow passage pressure loss is a key factor inducing cavitation. To address this issue, this study aims to suppress pump cavitation and improve volumetric efficiency through a synergistic approach involving low-pressure loss flow passages and parameter optimization. First, a flow field model based on a full cavitation model is established to meet the requirements for accurate cavitation simulation of piston pumps. The segmented approximation method is used to decompose complex flow passages inside the pump, a mathematical model of flow passage pressure loss is developed, and the traditional flow rate model is optimized by introducing a pressure loss correction term, thus reducing flow rate prediction error. Further, variance-based sensitivity analysis is used to quantify the effects of pressure loss influencing parameters on cavitation. Results indicate that inlet pressure is the core independent parameter affecting cavitation, and interaction effects between parameters are dominated by antagonism. Accordingly, a single-parameter control and a multi-parameter optimization strategy is proposed based on the sensitivity of different parameters, providing technical support and a quantitative basis for pump cavitation suppression and volumetric efficiency improvement.

1. Introduction

Axial closed-circuit piston pumps act as core power components in hydraulic systems for construction machinery, marine propulsion, and aerospace fields. Owing to their advantages of high pressure, large displacement, and compact structure, they have been widely applied in relevant industrial scenarios [1]. However, cavitation is a dynamic process involving the generation and collapse of vapor bubbles in low-pressure regions, which restricts their performance. When rotational speed exceeds the upper limit, cavitation intensifies significantly, leading to up to 15% reduction in volumetric efficiency, increased flow pulsation, and even erosion on flow passage surfaces. This issue is closely related to the speed limit of axial piston pumps and volumetric efficiency loss caused by flow passage pressure changes [2,3].
Existing studies on pump cavitation mostly rely on computational fluid dynamics simulations based on cavitation models to qualitatively describe the effects of parameters such as inlet pressure and rotational speed [4,5]. Nevertheless, two core limitations remain. First, the relative intensity of the impacts of dynamic parameters and static flow passage geometric parameters on cavitation cannot be quantified, making it difficult to identify dominant control factors [6]. Second, few studies focus on parameter interaction effects, such as how inlet pressure offsets cavitation caused by high rotational speed, resulting in optimization strategies that are mostly experience-based rather than systematically analyzed [7]. Additionally, traditional volumetric efficiency models only consider clearance leakage while ignoring pressure losses in irregular flow passages, leading to significant deviations from actual operating conditions [8,9]. These shortcomings hinder the targeted development of cavitation suppression methods for axial closed-circuit piston pumps.
Research on cavitation in hydraulic machinery dates back to the early 20th century. Rayleigh first proposed the bubble collapse equation, which was later modified by Plesset to incorporate liquid viscosity and surface tension, forming the basic Rayleigh–Plesset Equation (RPE) model [10,11]. For multiphase flow simulation in pumps, cavitation models are mainly categorized into homogeneous mixture models and three-component two-phase flow models. The former assumes uniform velocity across phases and is suitable for high-speed flow fields where the velocity slip between vapor and liquid is negligible [12]. Singhal et al. proposed the Full Cavitation Model (FCM), a typical homogeneous mixture model that comprehensively considers vapor transport, turbulent fluctuations, and the influence of non-condensable gases; this model has since become mainstream in pump cavitation simulation [13]. Xie et al. conducted a same-platform comparison of three common cavitation models; they managed to control the cavitation simulation error within 10% except in local complex flow areas [14]. Zhang et al. optimized the pump structure through bionic design, which effectively suppressed dynamic flow separation and reduced both cavitation and noise [15]. Fu et al. studied the influence of fluid composition and found that increased gas content lowers the saturation pressure, thereby intensifying cavitation [16]. Gullapalli and Zhu et al. focused on suction dynamic characteristics and pointed out that the pressure dip in the piston chamber is the main cause of cavitation [17,18].
Pressure losses in pump flow passages are an important trigger for cavitation. Studies have shown that sharp bends and sudden cross-sectional changes in flow passages easily trigger flow separation, which contributes significantly to local pressure losses [19]. To reduce such losses, Ye et al. optimized the relief groove structure of the valve plate, which reduced local vortices and weakened cavitation intensity [20]. Xu et al. combined cross-angle design with relief grooves to suppress flow backflow, which is a key source of pressure dips [21]. Yin et al.’s research on seawater hydraulic pumps showed that increasing inlet pressure via a supercharging device can alleviate cavitation but reduce power density [22]. Manring conducted a scaling analysis on the rotational speed limit of swash plate pumps; by linking flow passage resistance to the pump’s high-speed operation performance, flow passage resistance is the core constraint limiting high-speed operation [23].
For quantifying the impact of various parameters, variance-based sensitivity analysis (VB-SA) has emerged as a key tool. It enables the breakdown of output variance into main effects and interaction effects, without depending on linearity assumptions [6]. Saltelli et al. developed an efficient VB-SA approach built on paired sampling matrices, allowing for the simultaneous estimation of the first-order sensitivity index Si and the total sensitivity index STi [24]. Later, Saltelli et al. further extended this VB-SA approach to complex systems and validated its applicability in the field of hydraulic machinery [25]. Kucherenko and colleagues introduced derivative-based global sensitivity indices to enhance VB-SA’s applicability in computationally intensive models [26]. Oakley and O’Hagan established a Bayesian VB-SA framework that incorporates parameter uncertainty [27]. Tarantola et al. devised a random balance design to estimate Si with fewer model evaluations, thereby lowering the computational burden of pump simulations [7]. Storlie et al. employed a multiple predictor smoothing technique to boost VB-SA accuracy in non-smooth pump flow fields [28]. Leavy et al. leveraged VB-SA to conduct a quantitative analysis of how system cascading failures respond to changes in system variables, validating its reliability [29]. That said, VB-SA has seen limited application in axial closed-circuit piston pumps, particularly in analyzing static parameters like radial radius.
Topology optimization attains optimal performance through optimizing material distribution in the design domain, and has been widely used to improve flow passages [30]. Borrvall and Petersson pioneered research into topology optimization for Stokes flow fields, aiming to minimize dissipative energy and reduce pressure losses [31]. Alexandersen and Andreasen optimized fluid topology, underscoring its potential applications in hydraulic components [32]. Han et al. put forward a single-objective topology optimization method with fluid energy dissipation as a constraint, conducting a systematic analysis of both 2D and 3D topology optimization models. Their numerical results reveal an equivalence between fluid energy dissipation constraints and pressure drop constraints [33]. Dilgen et al. optimized turbulent flow fields in pumps, confirming that topology optimization outperforms empirically based designs [34]. Nevertheless, existing studies primarily focus on suction flow passages, with few optimizations targeting the waist-shaped grooves of the valve plate, which is a key component in closed-circuit piston pumps.
Tribological optimization plays a pivotal role in ensuring the efficient and reliable performance of piston machinery such as piston pumps and compressors, since wearing of core tribo-pairs directly restricts equipment service life and energy efficiency [35]. Sola et al. investigated swashplate axial piston pumps and observed that DLC coatings cut the friction coefficient by over fivefold, and PLC coatings remained effective in lowering the wear rate by more than 60% even after 20,000 operating laps [36]. Mamazhonov et al. validated that silicon carbide-reinforced epoxy resin coatings prolonged the service life of pump components by 3–8 times relative to wear-resistant cast iron [37]. Erdemir et al. pointed out that ta-C coatings featuring high sp3 hybridization demonstrated superior wear resistance in parts such as piston rings [38]. Strmčnik et al. further confirmed the wear resistance of DLC coatings under water-lubricated conditions in hydraulic motors, underscoring the key role of advanced materials in tribological optimization [39].
Although progress has been made in research on cavitation mechanisms, flow passage pressure loss mechanisms, and structural optimization methods, shortcomings remain. Traditional volumetric efficiency models only consider clearance leakage and ignore pressure losses in irregular flow passages, such as the waist-shaped grooves of the valve plate, leading to large volumetric efficiency prediction errors under normal rotational speeds and making it difficult to accurately support pump efficiency analysis and optimization. In the application of VB-SA to axial closed-circuit piston pumps, research on systematically quantifying the interaction effects between dynamic parameters, such as rotational speed and inlet pressure, and static parameters, such as flow passage geometric parameters, is insufficient, making it impossible to clarify the inherent laws of multi-parameter collaborative control of cavitation and volumetric efficiency. Existing flow passage optimizations mostly focus on a single component, lacking comprehensive strategies for parameter regulation, and the coordination between cavitation suppression and volumetric efficiency improvement needs to be enhanced.
Relevant preliminary studies had previously been conducted to lay a foundation and ensure continuity. In the field of energy loss and cavitation of axial piston pumps, an empirical model of churning loss between the cylinder block and pistons under high-speed operating conditions was established. The model was verified through experiments, and a multi-piston flow resistance correction coefficient was proposed [40]. Research was also carried out to explore the influence of piston quantity on churning loss, clarifying the hydrodynamic shielding effect and the loss suppression effect of cavitation [41]. However, these studies did not involve modeling pressure loss in irregular flow passages or quantification of dynamic–static parameter interactions. Accordingly, this study is advanced to address these gaps.
This study focuses on a 110 mL/r axial closed-circuit piston pump, investigating the correlation mechanism among cavitation, flow passage pressure loss, and volumetric efficiency. It conducts flow passage pressure loss modeling, quantifies dynamic–static parameter interactions via VB-SA, and performs parameter–structure synergistic optimization. It aims to clarify geometric parameter regulation rules and working parameter optimization ranges, achieving over 30% reduction in flow passage pressure loss, more than 28% decrease in gas volume fraction, and providing a quantitative basis for precise pump design and parameter matching to significantly enhance operational performance.

2. Geometry Parameters and CFD Modeling of Flow Channels

2.1. Geometry Parameters

In this study, the axial closed-type piston pump is taken as the research object, and its 2D cross-sectional view is shown in Figure 1. The basic parameters of this closed-type pump are as follows: theoretical maximum displacement of 110 mL/r, maximum speed of 2700 r/min, rated pressure of 40 MPa; main structural parameters are presented in Table 1.

2.2. CFD Modeling

2.2.1. Full Cavitation Model

Cavitation models can be categorized based on core modeling approaches and physical considerations, such as the Rayleigh–Plesset Equation (RPE) model, Transport Equation Model (TEM), Equation of State model, Interface Tracking Model, and Multiscale model. Among these, the homogeneous mixture-based TEM is widely applied in hydraulic machinery due to its balance between physical fidelity and computational efficiency. Another common division in hydraulic machinery contexts is between homogeneous mixture models and three-component two-phase flow models: the former assumes uniform velocity and pressure across liquid–vapor phases, while the latter incorporates non-condensable gas (NCG) and phase velocity slip [10]. This incorporation adds complexity but is often unnecessary for specific pump operating conditions.
For the 110EP closed-type pump, its core operating characteristics, such as closed structural design, high-pressure working conditions, and narrow flow passages, dictate the choice of cavitation model. In the pump’s low-pressure regions, high flow velocities minimize velocity slip between vapor and liquid phases. Additionally, while NCG can influence cavitation in some hydraulic systems, the 110EP’s closed loop and strict fluid quality control reduce NCG content to negligible levels, making the phase transition’s dependence on NCG irrelevant for this study. These traits align with the homogeneous mixture model’s assumptions, ruling out more complex three-component or multiscale models that would introduce unnecessary computational cost without improving accuracy.
Within homogeneous mixture models, the Full Cavitation Model (FCM) is selected for simulating cavitation in the 110EP pump. This model stands out by addressing three key first-order effects critical to pump cavitation: the transport of vapor bubbles, turbulent fluctuations of pressure and velocity, and the influence of residual NCG [13]. The FCM lies in tracking the spatiotemporal evolution of vapor via a transport equation, which couples vapor convection with phase change. This equation directly models vapor mass transfer through a transport equation:
( ρ m f v ) t + ( ρ m u f v ) = R e R c
where ρm is the mixture density, fv is the vapor mass fraction, u is the mixture velocity vector, Re is the evaporation rate, and Rc is the condensation rate. ρm is derived as follows:
1 ρ m = f v ρ v + f g ρ g + 1 f v f g ρ l
where fg is the NCG mass fraction, ρv is the pure vapor density, ρg is the NCG density, and ρl is the pure liquid density. The vapor evaporation rate Re and condensation rate Rc are modeled as:
R e = C e k σ ρ l ρ v 2 3 p v p ρ l ( 1 f v f g )
R c = C c k σ ρ l 2 2 3 p v p ρ l f v
where k is the turbulent kinetic energy, σ is the liquid-vapor surface tension, pv is the vaporous pressure, and p is the liquid pressure. The empirical coefficients Ce and Cc are 0.02 and 0.01, respectively.
The NCG density ρg is calculated by the ideal gas law:
ρ g = W P R T
where W is the molar mass of NCG, R is the universal gas constant, and T is the temperature.

2.2.2. CFD Model and Parameter Set

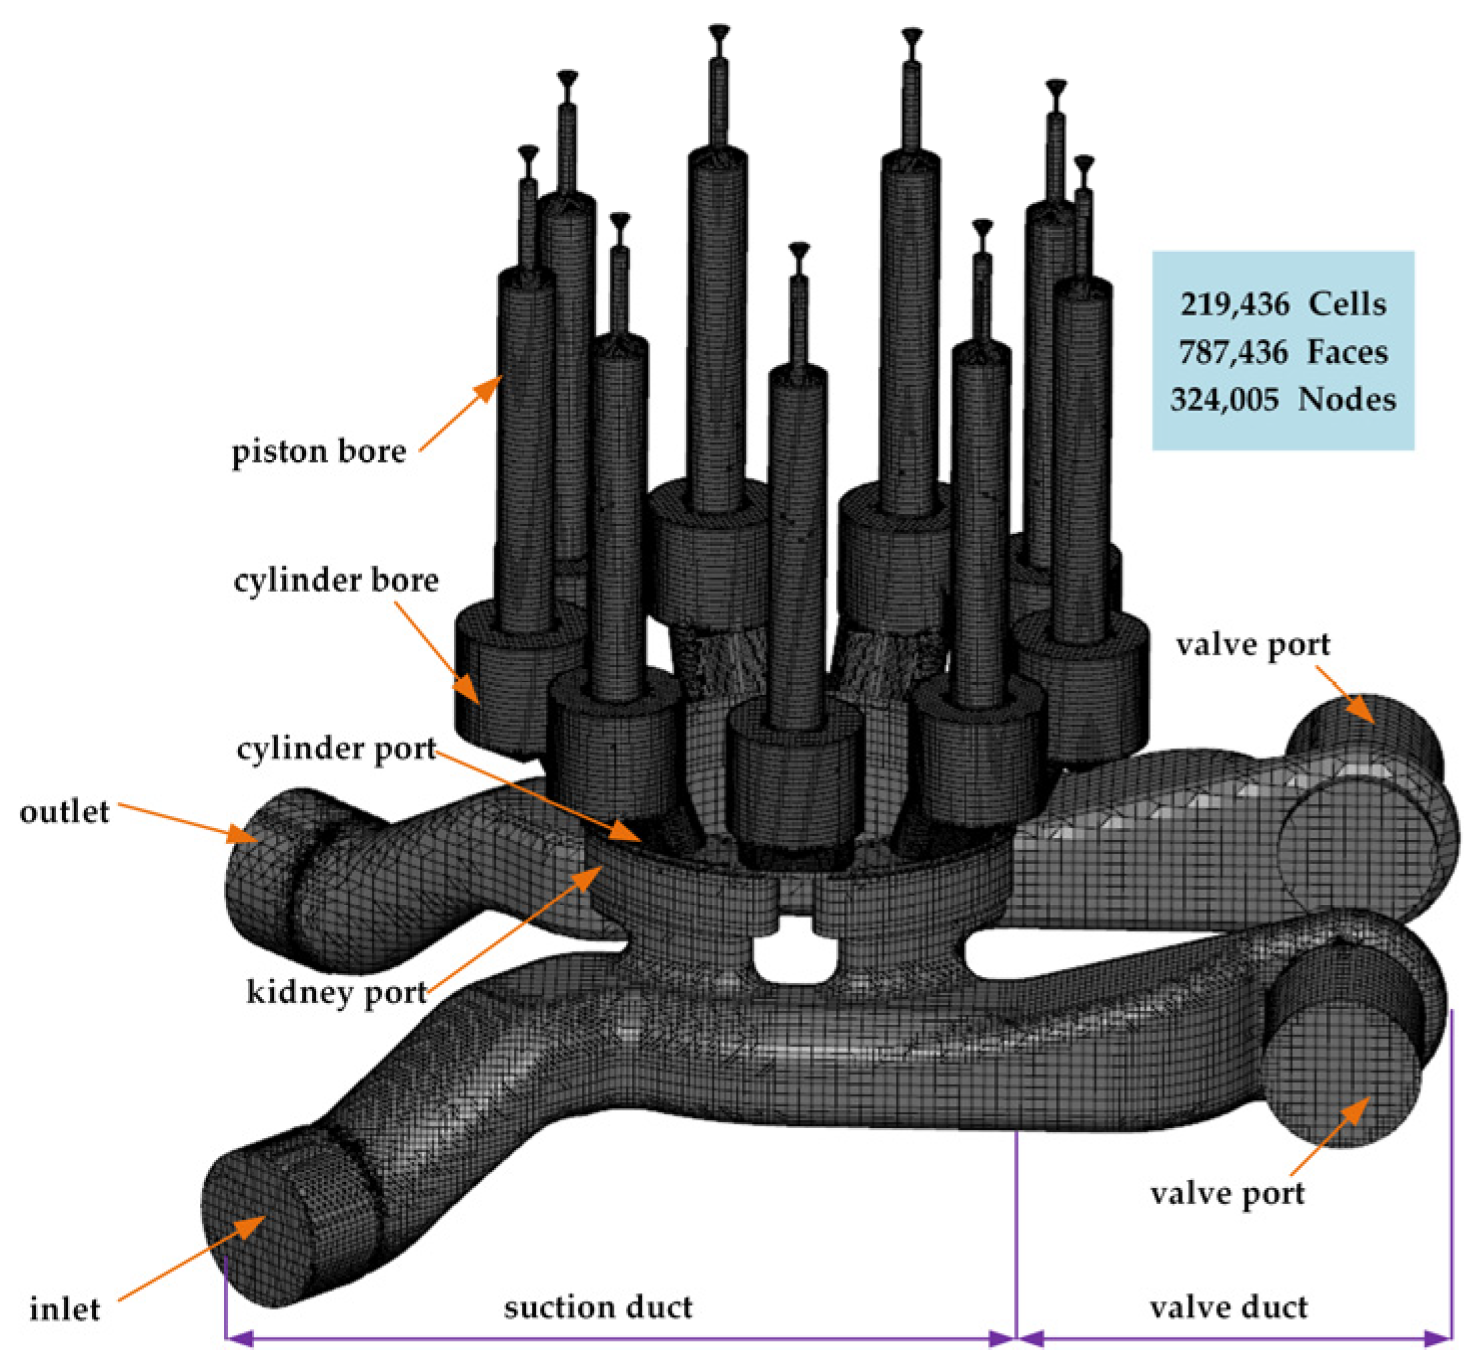
A CFD model is established for the valve plate flow passage of the closed-type piston pump. First, mesh generation is performed. Similarly, the mesh is divided into three parts: inlet and outlet, valve plate, and piston cavity. After selecting the flow passage surfaces of each part, the inlet and outlet, as well as the valve plate, are meshed using the binary tree mesh generation method to create ordinary Cartesian grids. For the piston cavity part, the rotor-type mesh generation template of the software is used to generate a dynamic mesh for the piston cavity that reciprocates up and down as the cylinder block rotates. The fully implicit mismatched grid interface technology is utilized to achieve an effective connection between dynamic and static flow regions. For complex structural regions such as the interfaces between various parts and the damping grooves of the valve plate, smaller mesh sizes need to be adopted for refinement. The meshed valve plate flow passage model of the piston pump is shown in Figure 2. Parameters of the CFD model are shown in Table 2. The simulation is performed using the standard k-ε model. Results are considered stable after five rotations.
Mesh quality is critical to the accuracy of simulation analysis. A high-quality mesh ensures that simulation results are closer to actual operating conditions. However, an excessive number of meshes increases computational load, leading to reduced simulation computational efficiency. Therefore, on the premise of ensuring the accuracy of computational results, mesh independence verification is performed to minimize the number of meshes and improve simulation speed. By adjusting parameters such as surface mesh and volume mesh sizes, five sets of fluid domain models with different mesh counts are obtained, whose parameters are shown in Table 3. As the mesh size decreases, the number of meshes increases gradually, and the flow rate error decreases accordingly. Although the mesh count of Model Set 5 is significantly larger than that of Model Set 4, the flow rate error does not change significantly; instead, due to the larger number of meshes, the simulation requires more computational time. Therefore, on the premise of ensuring simulation reliability and accuracy, Model Set 5 is selected as the simulation model for subsequent analysis and research to improve simulation speed.

3. Experiment

3.1. Test Rig

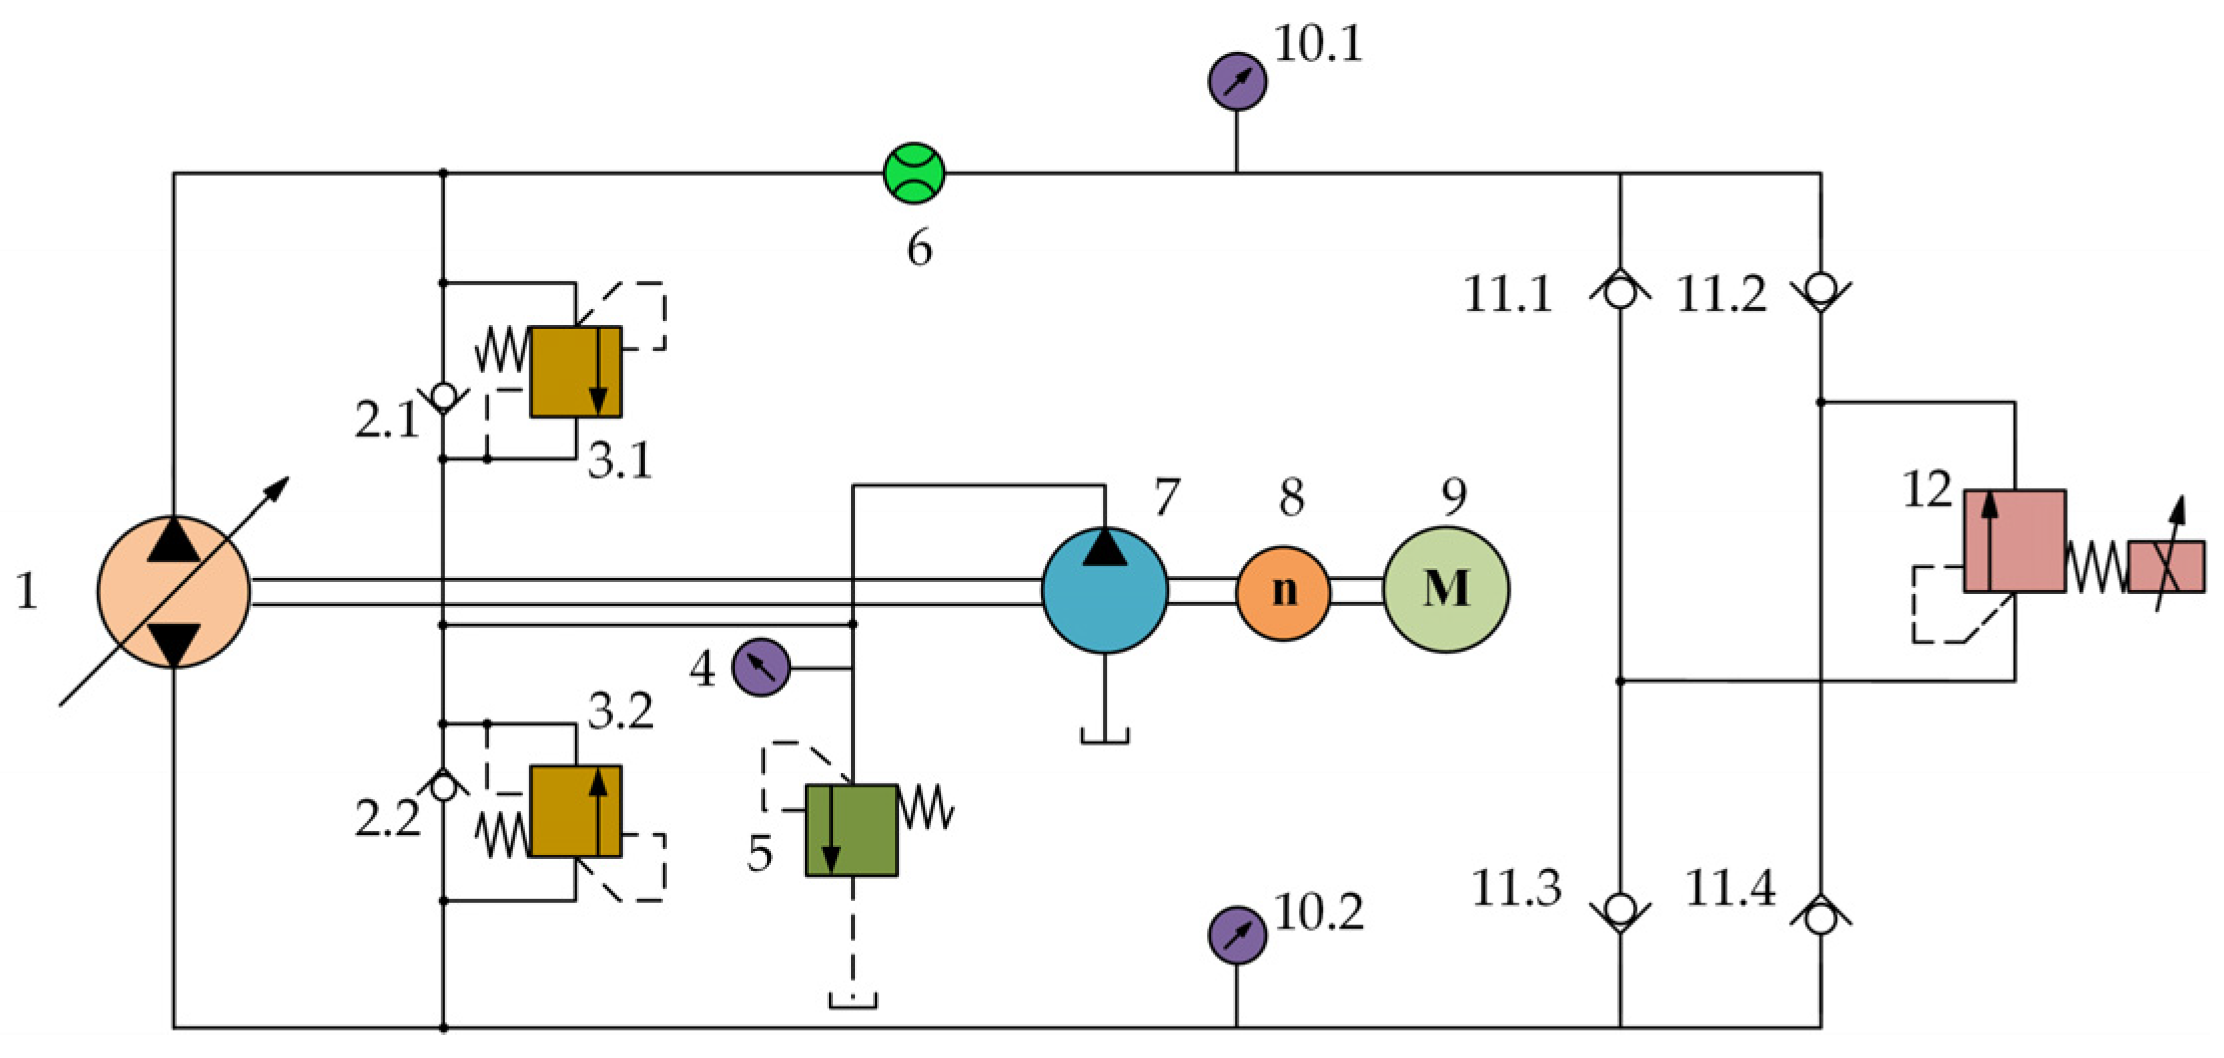
To validate the simulation results, an experiment was conducted to test the closed-type pump. The experimental schematic diagram and test rig are shown in Figure 3 and Figure 4, respectively. The high-pressure relief valve is composed of check valve 2 and relief valve 3, and thus integrates the oil replenishment function and pressure protection function. Relief valve 5 serves as the safety valve for the oil replenishment circuit; check valve group 11 provides bidirectional flow selection for the oil in the test circuit; proportional pressure reducing valve 12 supplies the load pressure to the test circuit by adjusting the spool opening. Finally, the spindle speed sensor 8, flow sensor 6, and pressure sensor 10 are used to measure the relevant experimental data, respectively. In the experiment, the load pressure is set to 40 MPa, consistent with that in the CFD model; specific experimental details are listed in Table 4. Dynamic characteristics of the functional valve group on the closed-type pump can affect pump stability [42]. It should be noted that in this experiment, the high-pressure relief valve and relief valve 5 are integrated into the closed-type pump as part of the functional valve group. The high-pressure relief valve limits the maximum pressure of the closed-type pump and provides oil replenishment for it, while relief valve 5 controls the oil replenishment pressure of the closed-type pump. Parameter settings in the experiment ensure that the high-pressure relief valve and relief valve 5 remain in a closed state. This design aims to prevent the dynamic characteristics of the valves from interfering with the pump test.

3.2. Experimental Results and Discussion

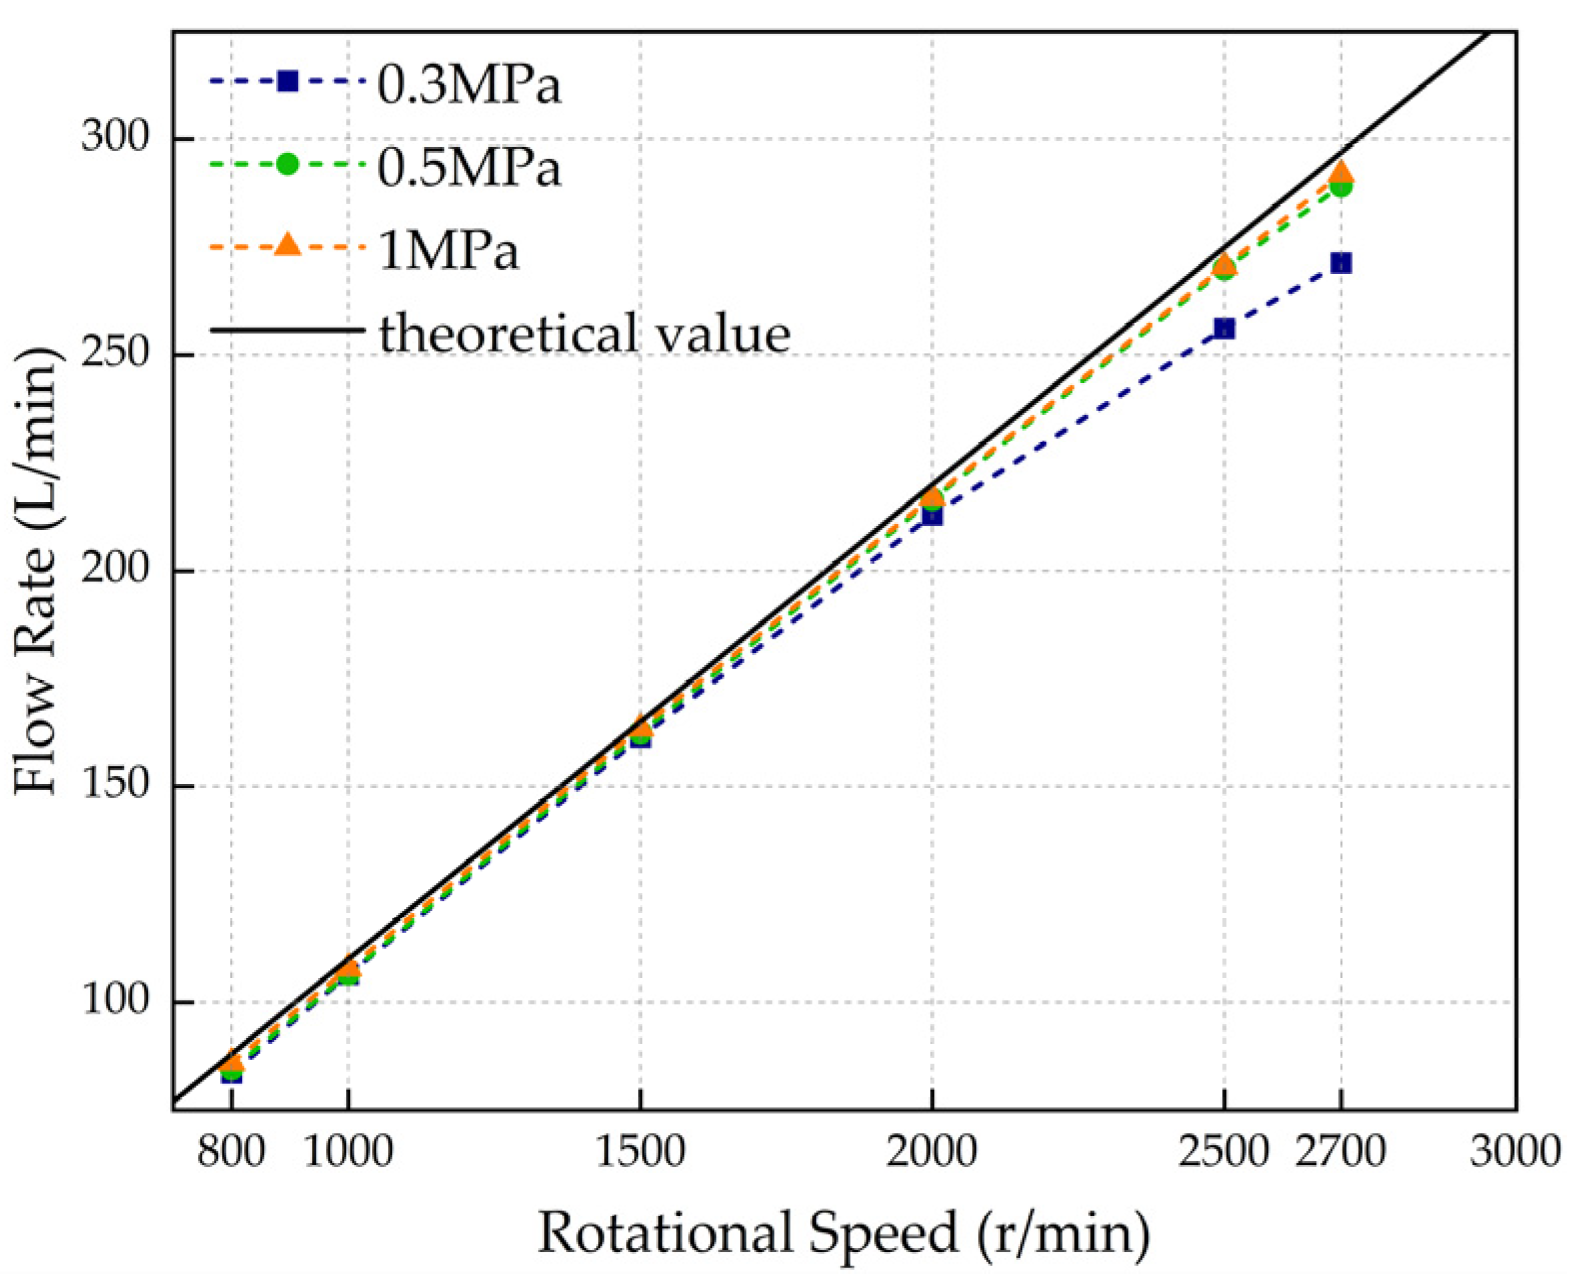
The motor was adjusted to control the speed range of the closed-type pump from 800 rpm to 2700 rpm. The oil replenishment relief valve was set to control the pump inlet pressures at gauge pressures of 0.3 MPa, 0.5 MPa, and 1 MPa. The closed-type pump was adjusted to maximum displacement via the input variable control current. Figure 5 shows the relationship between the piston pump speed and flow rate under different inlet pressures.
To ensure data reliability, experiments under all operating conditions were repeated three times. The average values of key parameters such as flow rate and pressure were taken as the final results. During the experiment, boundary conditions, including load pressure and oil replenishment pressure, were strictly fixed to reduce external interference. The relative deviation of multiple repeated tests is ≤2%, which verifies the stability and repeatability of the experimental data. Regarding measurement uncertainty, it mainly originates from inherent instrument errors and slight fluctuations in the experimental environment. The root sum square method commonly used in engineering tests was adopted in this study for comprehensive evaluation. Results show that the comprehensive measurement uncertainties of flow rate and pressure are ≤3% and ≤2%, respectively. Both fall within the acceptable range for hydraulic machinery testing and do not essentially affect the reliability of experimental conclusions.
As the speed increases, the flow rate initially increases proportionally and is close to the theoretical flow rate; when the speed exceeds 2000 rpm, the flow rate curve slows down and decreases to different degrees, indicating that the volumetric efficiency of the piston pump is decreasing. Experimental results show that the inlet pressure has a significant impact on the volumetric efficiency of the piston pump, and specifically, the lower the inlet pressure, the lower the volumetric efficiency. Therefore, reducing pressure loss by optimizing the inlet valve plate flow passage of the piston pump can improve the pump’s volumetric efficiency.

3.3. Simulation Model Validation

Figure 6 presents the flow rates from the CFD simulation and experiment at different speeds. Consistent with the experiment, three different inlet pressures were set. At low inlet pressures, the deviation between simulation results and experimental values increases as the speed rises. The deviation originates from cavitation and the leakage of the actual pump during testing, which is not considered in the CFD simulation model. The deviation decreases as the inlet pressure increases, and at this point, the deviation is mainly caused by leakage. However, such deviation is acceptable for the CFD simulation model, as it does not exceed 4%. Therefore, this simulation model can be used to predict cavitation.

4. Optimization

As indicated in Section 3, it can be concluded that increasing the inlet pressure enhances the delivery flow rate of the axial piston pump. In other words, reducing the flow passage pressure loss can contribute to the improvement of both the delivery flow rate and volumetric efficiency of the axial piston pump. This paper establishes a model for the pressure loss of the flow passage to identify key parameters, improves the calculation method of volumetric efficiency, and thereby achieves flow passage optimization and the refinement of theoretical formulas.

4.1. Mathematical Model of the Flow Passage

4.1.1. Flow Passage Simplification

The flow passages of the closed-type pump are irregular and complex, characterized by multiple cross-sectional variations and frequent flow direction changes. Direct modeling and calculation of pressure loss for such passages pose significant challenges. Therefore, the segment approximation method is adopted, where the entire flow passage is divided into multiple typical flow passage units along the fluid flow direction (as shown in Figure 7). Typical flow passage units matching the flow characteristics are selected based on the features of the original flow passages, and the total pressure loss is obtained by calculating and superimposing the pressure loss of each unit. The flow passages of the pump consist of oil suction flow passages, oil discharge flow passages, and piston bore flow passages. The diagram of the oil suction flow passage after segment approximation is shown in Figure 8. It can be observed from Figure 2 that the closed-type pump exhibits the structural feature of flow passage symmetry. The oil discharge flow passages are geometrically symmetric to the oil suction flow passages, with consistent pressure loss laws, thus enabling model reuse.
It should be noted that non-critical structures, such as tiny burrs on the flow passage surface, are ignored during flow passage simplification. The structural parameters of each typical unit are determined in accordance with the actual structural dimensions of the pump, ensuring that the simplified model still reflects the real flow state.
It should be emphasized that incorporating the valve group sub-model into flow passage system modeling is crucial from the perspective of theoretical modeling integrity and accuracy. The flow passages of the closed-type pump are coupled with the functional valve group. Dynamic responses of the valves, including spool opening and closing hysteresis and flow–pressure characteristics, can directly induce local pressure fluctuations and flow separation in the flow passages, thereby affecting pressure loss distribution and cavitation initiation, making them an integral part of the flow passage system. However, based on the experimental setup described in the previous section, this study ensures all functional valve groups remain in a closed state through precise parameter settings to avoid interference of valve group dynamic characteristics with the core research variables of flow passage parameters, pressure loss, and cavitation, thus eliminating the impact of their dynamic characteristics on experimental data. Accordingly, targeted simplification is applied to the flow segments related to the valve group when establishing the piston pump flow passage model in this study. The positions of the valve groups are treated as static flow passage nodes without incorporating dynamic parameters such as spool movement, while only retaining their geometric connection characteristics. Such simplification is a reasonable adjustment based on experimental conditions. It avoids interference from non-core variables and ensures the model can focus on the analysis of geometric and flow characteristics of the flow passages themselves.

4.1.2. Mathematical Model of Flow Passage Pressure Loss

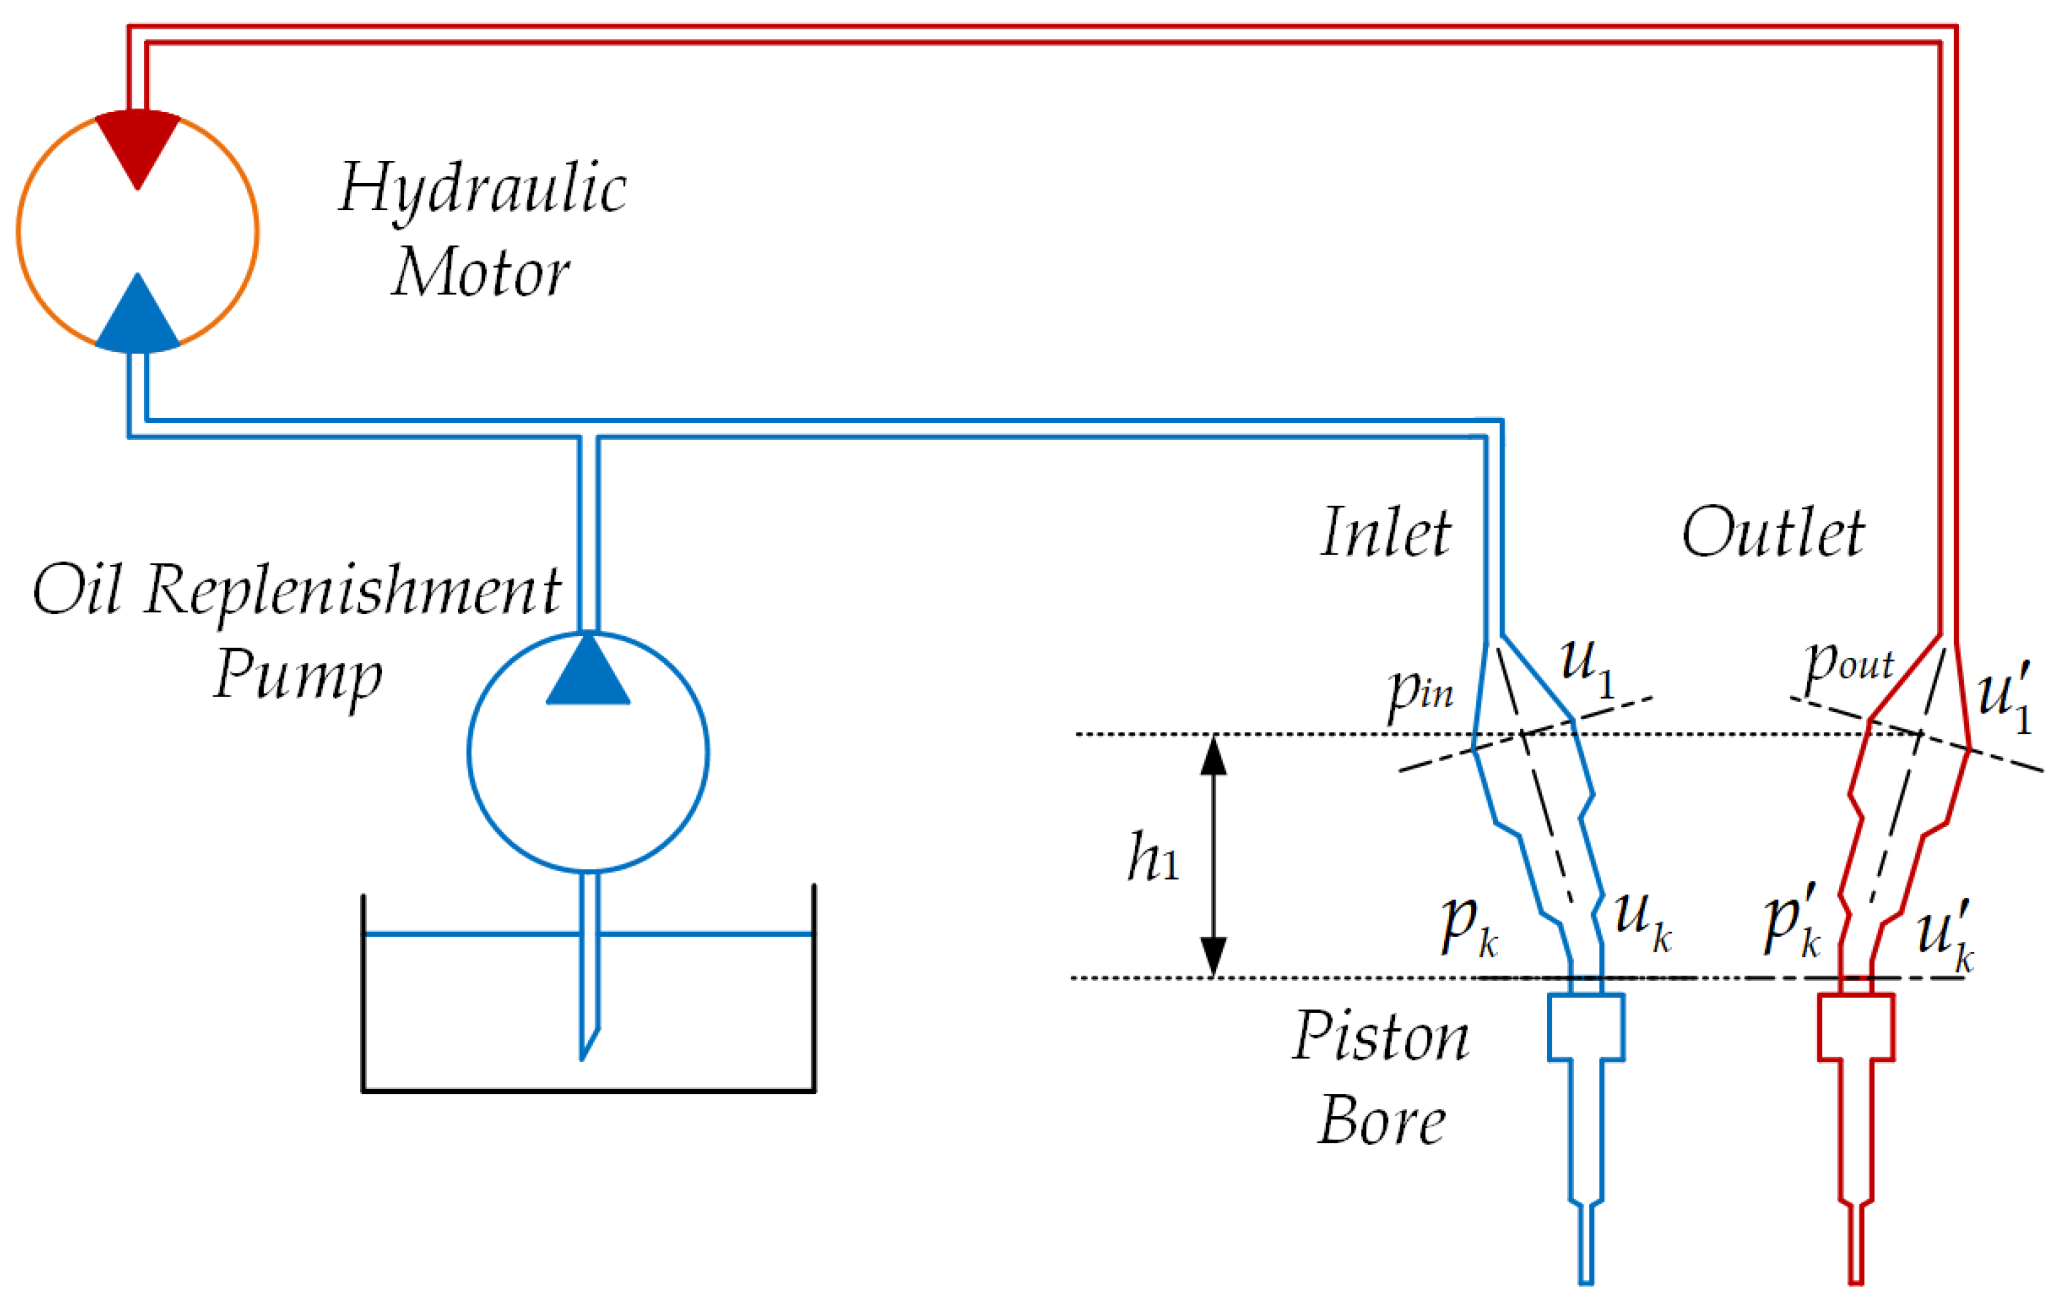
The complete operation schematic diagram of the closed-type pump is shown in Figure 9.
The inlet pressure is provided by the oil replenishment pump. The head loss generated in the suction flow passage ranges from the pump inlet to the piston bore, and the frictional head loss produced therein can be expressed via the Bernoulli equation as follows:
p i n ρ g + α 0 u 1 2 2 g + h 1 = p k ρ g + α k u k 2 2 g + h w O S
The pressure loss ΔpOS of the oil suction flow channel is as follows:
Δ p O S = p i n p k
Δ p O S = ρ 2 ( α k u k 2 α 1 u 1 2 ) + ρ g h w O S h 1
The head loss hw consists of the frictional resistance loss hλ and the local resistance loss hξ:
h w = h λ + h ξ
h λ = λ l d u 2 2 g = 1 2 g i = 1 n λ i l i d i u i 2
h ξ = ξ u 2 2 g = i = 1 n ξ i u i 2 2 g = 1 2 g i = 1 n ξ i u i 2
λ denotes the frictional resistance coefficient. Due to the complexity of turbulent flow, the calculation formula for frictional resistance losses in turbulent flow is generally established using dimensional analysis. For laminar flow, λ = 64/Re; for turbulent flow, λ is a function of the Reynolds number Re and the relative roughness Δ/d, where Δ is the absolute roughness and d is the pipe diameter. Under certain simplified conditions, λ can be expressed as λ = f (Re, Δ/d). To simplify calculations, the value of λ is typically obtained by referring to the Moody Chart in engineering applications [43]. ξ is the local resistance loss coefficient. Different pipeline components correspond to different local resistance loss coefficients. The local resistance loss coefficients of different pipeline components are related to the geometric dimensions of the pipeline and the properties of the fluid flowing through the pipeline. α is the kinetic energy correction coefficient. α is a number greater than 1. The larger the cross-sectional flow velocity vector is, the larger the value of α is. The typical value range of α is generally between 1.01 and 1.10. In engineering applications, it is generally assumed that α = 1. hwOS and hwOD are the head losses of the oil suction flow channel and the oil discharge flow channel.
In axial piston pumps, the flow velocity uk at the piston bore, as shown in Figure 10, can be decomposed into the normal velocity un caused by the reciprocating motion of the piston and the tangential velocity ut caused by the rotational motion of the cylinder block, and their relationship is expressed as [23]:
u k 2 = u n 2 + u t 2
u n = A p A k r f tan α ω
u t = r f ω
u 1 = m A p r f tan α ω π A 1
Ap denotes the area of the piston bore, A1 denotes the inlet area, Ak denotes the area of the cylinder block bore, rf denotes the distributor circle radius of the piston, α denotes the swash-plate angle, and ω denotes the rotational speed of the cylinder block.
The formula for calculating the area of the kidney-shaped port of the cylinder block is [23]:
A k = cos ( 90 δ ) [ π r r 2 + π { ( r f 2 + r r 2 ) 2 ( r f 2 r r 2 ) 2 } × ϕ 360 ° ]
where ϕ denotes the radial angle of the piston bore of the cylinder block, rr denotes the radial radius of the piston bore, rf denotes the distributor circle radius of the piston bore, m denotes the number of pistons, and δ denotes the inclination angle of the piston bore.
The pressure loss of the flow passage Δpdis in closed-type pumps consists of the pressure loss of the oil inlet flow passage ΔpOS and the pressure loss of the oil outlet flow passage ΔpOD. Under rated operating conditions, the symmetric flow passages of closed-type pumps exhibit identical pressure loss mechanisms on both the oil inlet and oil outlet sides, including viscous frictional loss caused by fluid–wall interaction and local pressure loss at geometric transitions. This symmetry results in the equality of ΔpOS and ΔpOD, thereby enabling Δpdis to be expressed as twice ΔpOS and reducing the complexity of subsequent calculations. In the context of mathematical modeling, substituting Equations (9)–(16) into Equation (8) allows Δpdis to be expressed as:
Δ p d i s = Δ p O S + Δ p O D = 2 Δ p O S     ρ r 2 w 2 1 + α 2 π 2 r p 4 cos 2 ( 90 δ ) π r r 2 + π { ( r f 2 + r r 2 ) 2 ( r f 2 r r 2 ) 2 } × ϕ 360 2 α 1 m A p 2 π A 1 2 2 tan 2 α   + i = 1 n λ i l i d i + i = 1 n ξ i u i 2 2 ρ g h 1

4.1.3. Mathematical Model Validation

To verify the prediction accuracy of Equation (17) under variations in the static structural parameters of the axial piston pump, three sets of parameters are selected, including the radial angle, radial radius, and inclination angle of the kidney-shaped port. Comparative verification between theoretical calculations and CFD simulation models is conducted under rated operating conditions, with a rotational speed of 2500 rpm, inlet pressure of 0.5 MPa, outlet pressure of 40 MPa, and swash-plate angle of 20°. The FCM is adopted for the CFD model, consistent with the previous setup.
Results are shown in Figure 11. The radial radius represents the curvature radius of the kidney-shaped groove along the radial direction; an increase in this parameter improves flow passage smoothness and reduces the frictional resistance coefficient λ. When the radial radius increases from 4.0 mm to 6.0 mm, both the simulated and calculated values of pressure loss decrease with the increasing radius, and the error gradually decreases. The radial angle is defined as the cone angle of radial contraction of the flow passage; the contraction effect is most significant at 10°, where the local resistance reaches a peak, and the simulated pressure loss also reaches the global peak. When the angle increases to 14°, the contraction effect weakens, the pressure loss decreases to a minimum, and the trend of theoretical calculations is completely consistent with that of simulations. The relative error is slightly higher at 14°, which is attributed to the more complex flow separation in the flow passage, as the theoretical model simplifies the additional loss induced by vortices.
The axial inclination angle represents the axial angle of the flow passage; an increase in this angle intensifies flow passage transition and increases local pressure loss. When the inclination angle increases from 50° to 60°, both the simulated pressure loss and the theoretical calculation results increase. In the verification of the three factors, the maximum relative error between theoretical calculations and CFD simulations is ≤10.77%. This confirms that the established flow passage pressure loss model can quantify the contribution of the static structure of the axial piston pump to pressure loss reduction, providing a theoretical calculation basis for subsequent correlation analysis between static parameters and cavitation.
The theoretical flow rate calculation model for traditional axial piston pumps is established with geometric displacement and leakage compensation as the core. Its pressure loss term only accounts for flow attenuation caused by clearance leakage, and does not incorporate the influence of flow passage pressure loss on effective flow rate. The formula for leakage flow rate QL is expressed as [44]:
Q L = Q s s + Q s p + Q p c + Q c v   = p d p 0 μ m π δ s s 3 6 ln r s 2 / r s 1 + m π δ s p 3 3 ln tan β 2 / tan β 1 + tan 2 β 2 tan 2 β 1 + i = 1 m π d p δ p c 3 12 l 0 + R p tan γ 1 cos φ + i 1 π 2 1 + 1.5 ε 2 + α w δ c v 3 2 1 ln R v 4 / R v 3 + 1 ln R v 2 / R v 1
where Qss denotes the leakage between slipper and swashplate, Qsp denotes the leakage between slipper and piston, Qpc denotes the leakage between piston and cylinder piston chamber, and Qcv denotes the leakage between cylinder block and valve plate. Since the attenuation of oil suction capacity caused by frictional and local pressure loss in the flow passage is not considered, this traditional model exhibits a deviation from the actual flow rate under normal operating conditions. On the basis of the traditional model, this paper introduces a new pressure loss correction term, Δpdis, induced by flow passage pressure loss. After incorporating this pressure loss correction term, the pressure loss term becomes Δpd − Δp0 − Δpdis, and an improved theoretical leakage flow rate model is established. Equation (18) is expressed as:
Q L = 1 μ p d p 0 ρ r 2 w 2 1 + α 2 π 2 r p 4 cos 2 ( 90 δ ) π r r 2 + π { ( r f 2 + r r 2 ) 2 ( r f 2 r r 2 ) 2 } × ϕ 360 2 α 1 m A p 2 π A 1 2 2 tan 2 α + i = 1 n λ i l i d i + i = 1 n ξ i u i 2 2 ρ g h 1       m π δ s s 3 6 ln r s 2 / r s 1 + m π δ s p 3 3 ln tan β 2 / tan β 1 + tan 2 β 2 tan 2 β 1 + i = 1 m π d p δ p c 3 12 l 0 + R p tan γ 1 cos φ + i 1 π 2 1 + 1.5 ε 2 + α w δ c v 3 2 1 ln R v 4 / R v 3 + 1 ln R v 2 / R v 1
To verify the applicability of the improved theoretical flow rate model that incorporates flow passage pressure loss correction under variations of the axial piston pump’s dynamic parameters, verification is conducted by selecting inlet pressures of 0.3 MPa, 0.5 MPa, and 1.0 MPa, and a rotational speed range of 800 to 2700 rpm. The deviations between the theoretical flow rates of the improved model, the traditional model, and the test values are compared.
Results are shown in Figure 12. Within the rotational speed range of 800–2000 rpm, the improved model exhibits a significantly higher degree of agreement with the test values than the traditional model due to the supplementary flow passage pressure loss correction. This is because the improved model compensates for the flow rate attenuation caused by flow passage pressure loss, which validates the role of flow passage pressure loss correction in improving the traditional model. In the high rotational speed range above 2000 rpm, the actual test values begin to decrease due to cavitation or saturation of oil suction capacity. However, neither model incorporates the effects of such extreme operating conditions, leading to a continuous increase in the calculated values of both models. Although the improved model is more accurate in the early stage due to flow passage pressure loss correction, it does not incorporate additional extreme operating condition compensation at high rotational speeds, resulting in an error that exceeds that of the traditional model. This reflects that both models have limitations in adapting to high rotational speeds.
In terms of the overall error pattern, as the inlet pressure increases, the relative influence of flow passage pressure loss on the flow rate weakens, and the advantages of the improved model become more stable. At an inlet pressure of 0.3 MPa, the average error over the entire range is 4.18% compared with 4.22% for the traditional model; at 0.5 MPa, the average error is 0.67% compared with 0.76% for the traditional model; and at 1.0 MPa, the average error is 0.88% compared with 1.19261% for the traditional model.
In conclusion, by adding a flow passage pressure loss correction term to the traditional model, the improved model in this paper significantly enhances the prediction accuracy of the theoretical flow rate within the normal rotational speed range (≤2000 rpm), providing a more reliable calculation basis for subsequent correlation analysis between flow passage pressure loss and cavitation.

4.2. Optimization Strategy

4.2.1. Optimization Process

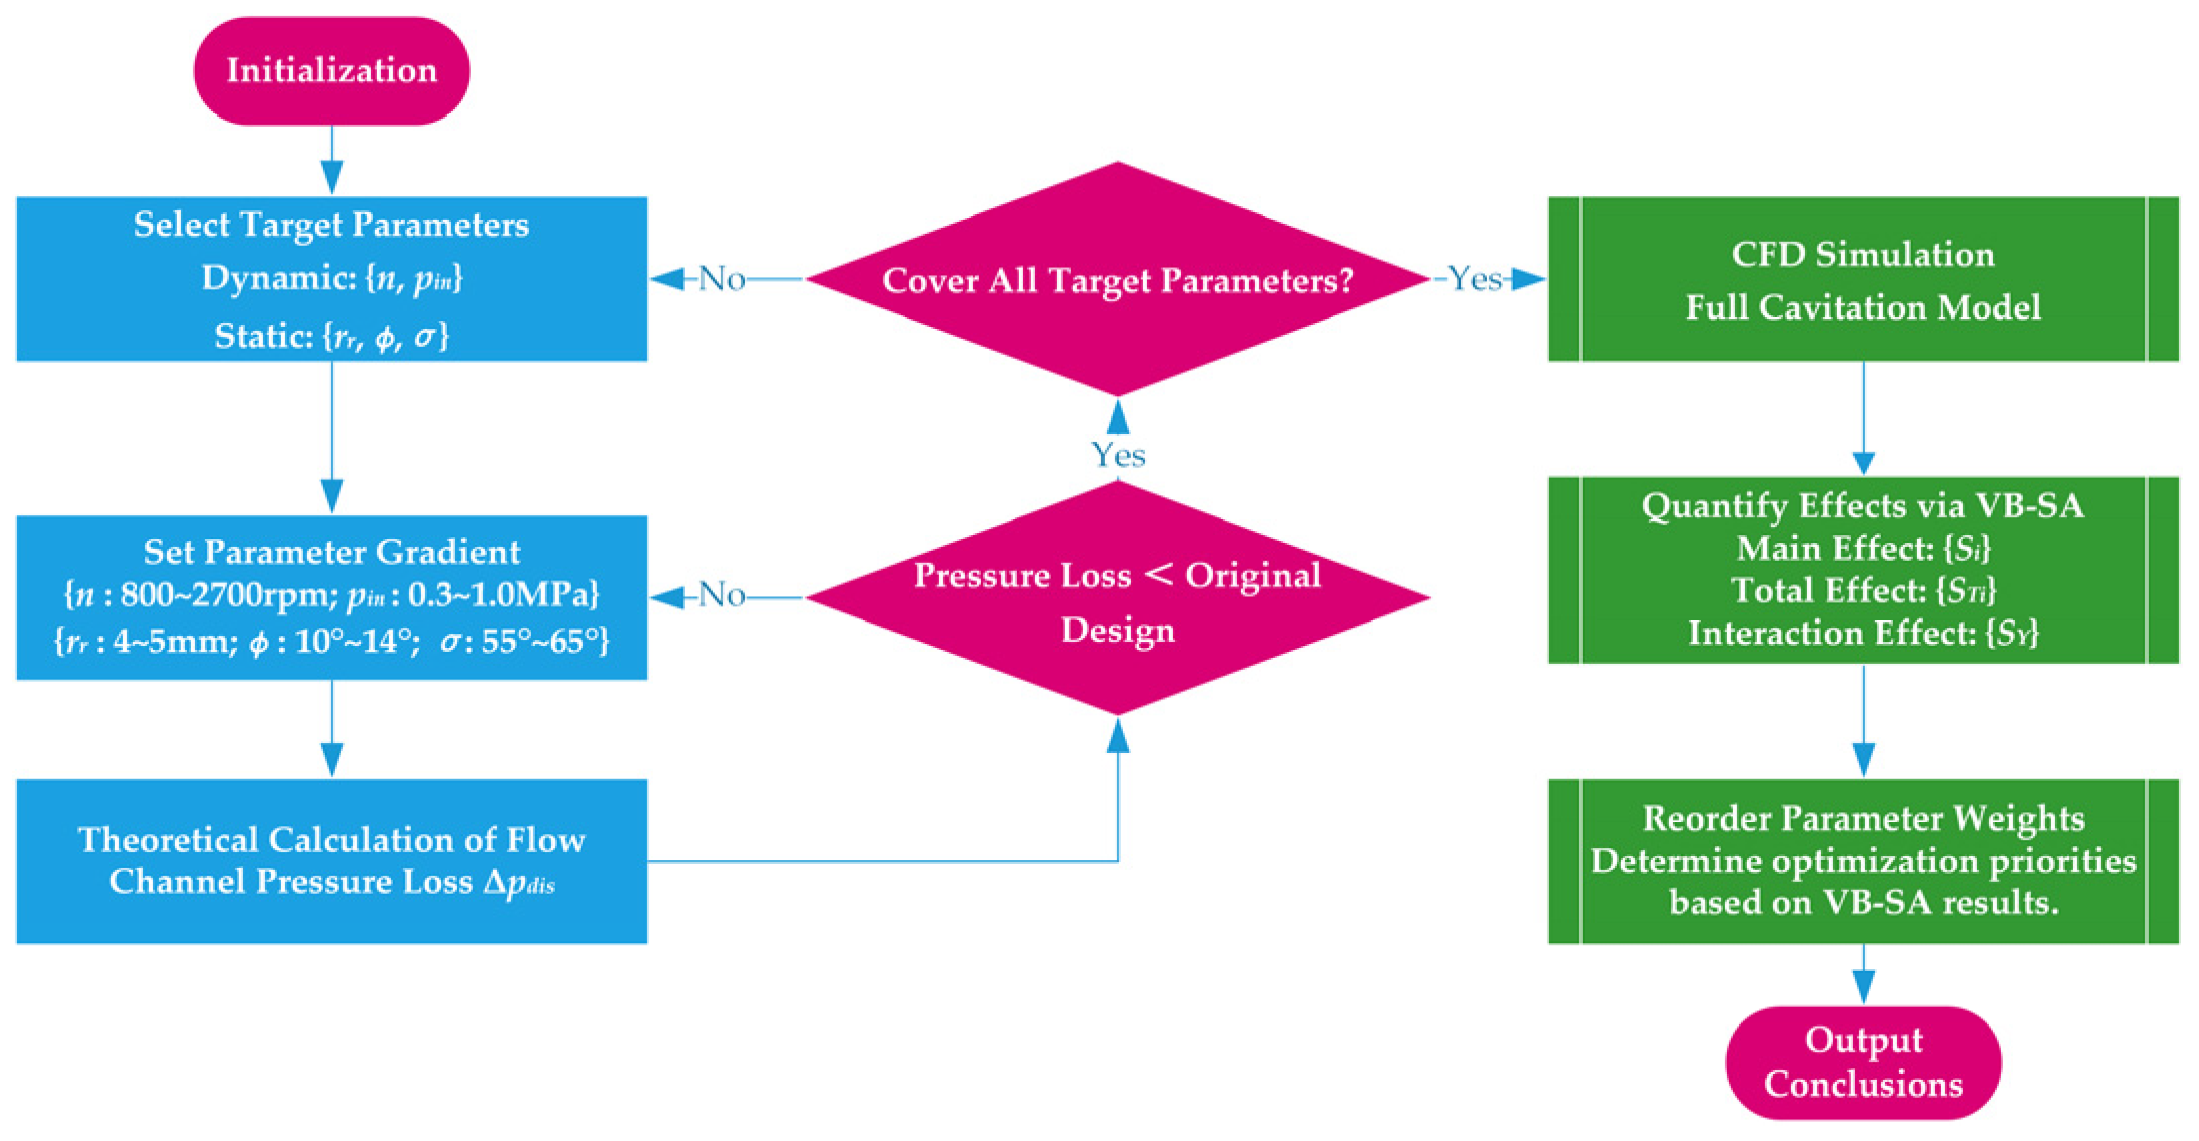
The optimization process proceeds in accordance with a structured flow chart, as shown in Figure 13. It sequentially goes through the stages of initialization, target parameter selection, parameter gradient setting, theoretical calculation of flow passage pressure loss, CFD simulation, quantification of influence laws, parameter weight rearrangement, and conclusion output. Two decision nodes are set, namely, pressure loss reduction determination and parameter coverage integrity verification.
Target parameters are determined based on the pressure-influencing terms in Equation (17), focusing on flow passage resistance correlation and engineering adjustability. Dynamic parameters include the inlet pressure pin, pump rotational speed n. Static structural parameters include kidney-shaped groove radial radius rr, radial angle ϕ, and inclination angle δ. Noncritical or uncontrollable factors, such as flow passage surface roughness, are excluded. Parameter gradients are set to align with the pump operating range and the compact constraint of the closed-type pump housing. The rotational speed ranges from 800 to 2700 rpm, the inlet pressure is set between 0.1 and 1 MPa, the rr is set between 4 and 6 mm, the radial angle is set between 10 and 14 degrees, and the inclination angle is set between 55 and 65 degrees.
The theoretical calculation of flow passage pressure loss takes Equation (17) as the core, combined with the formulas for frictional head loss and local pressure loss. The frictional resistance coefficient λ is obtained from the Moody chart, and the local resistance coefficient ξ is determined with reference to values of similar flow passages.
CFD simulation is validated using the FCM, with fluid properties, mesh, and boundary conditions consistent with the theoretical setup. Steady-state results are obtained by simulating five rotation cycles of the pump main shaft, and the flow passage pressure loss Δpdis and gas volume fraction, which is a cavitation evaluation index, are extracted.

4.2.2. Optimization Results and Discussion

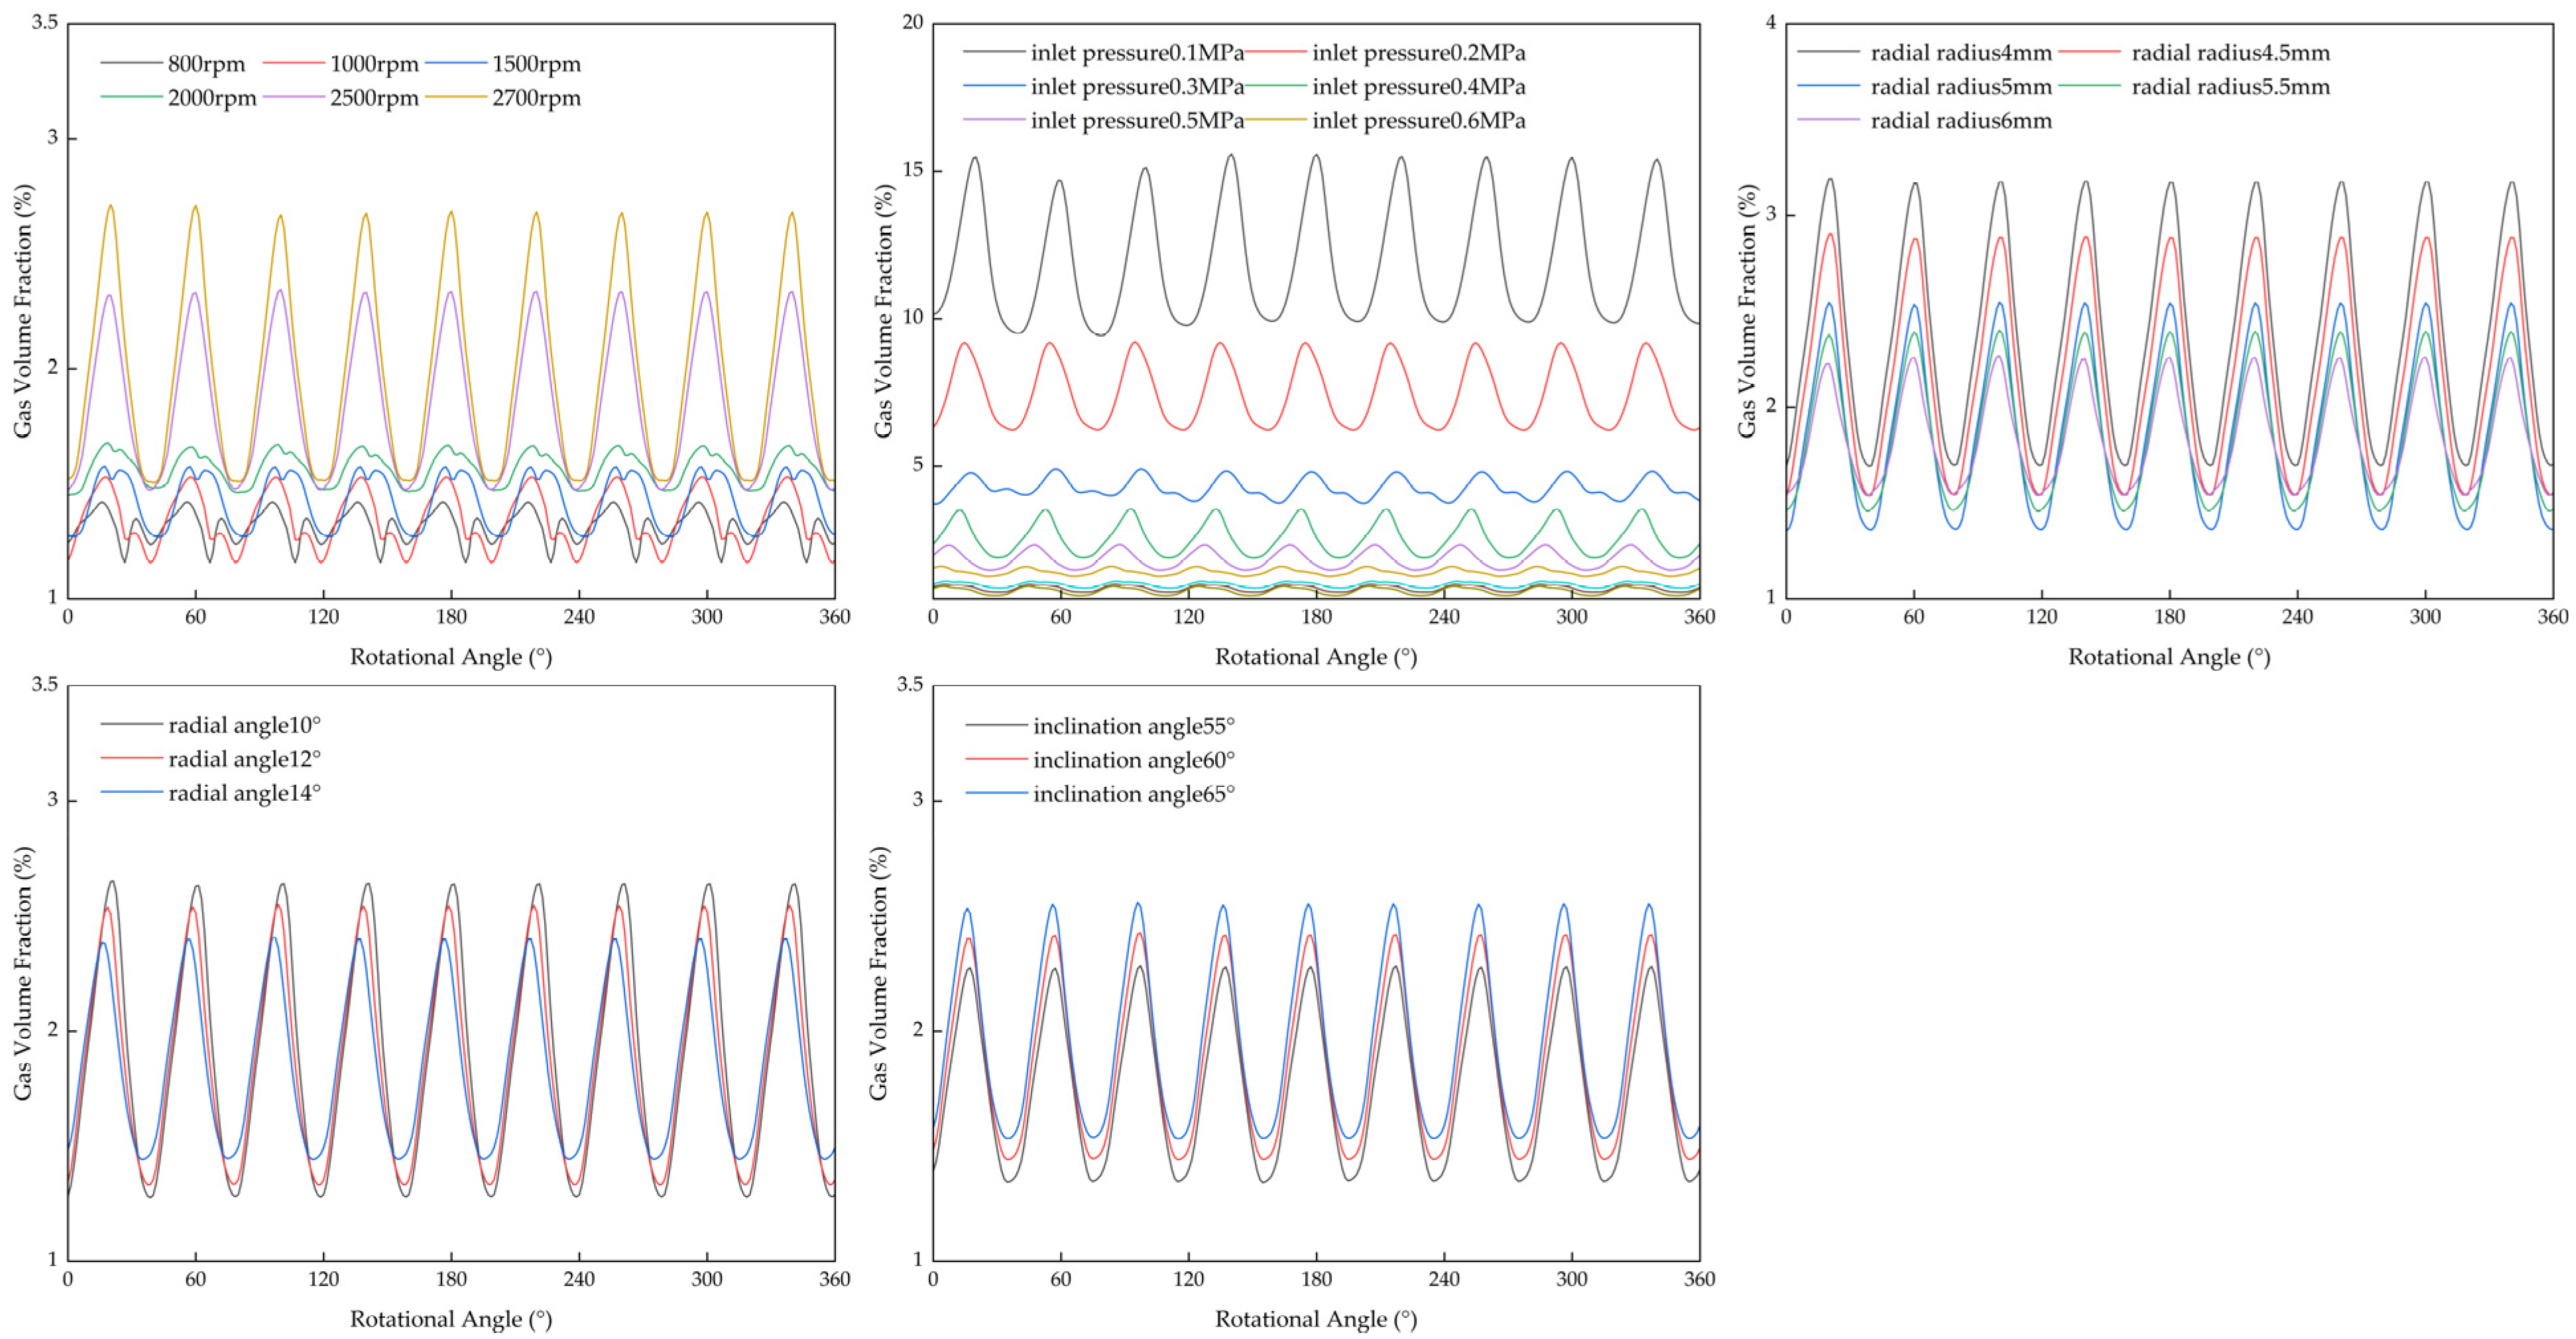
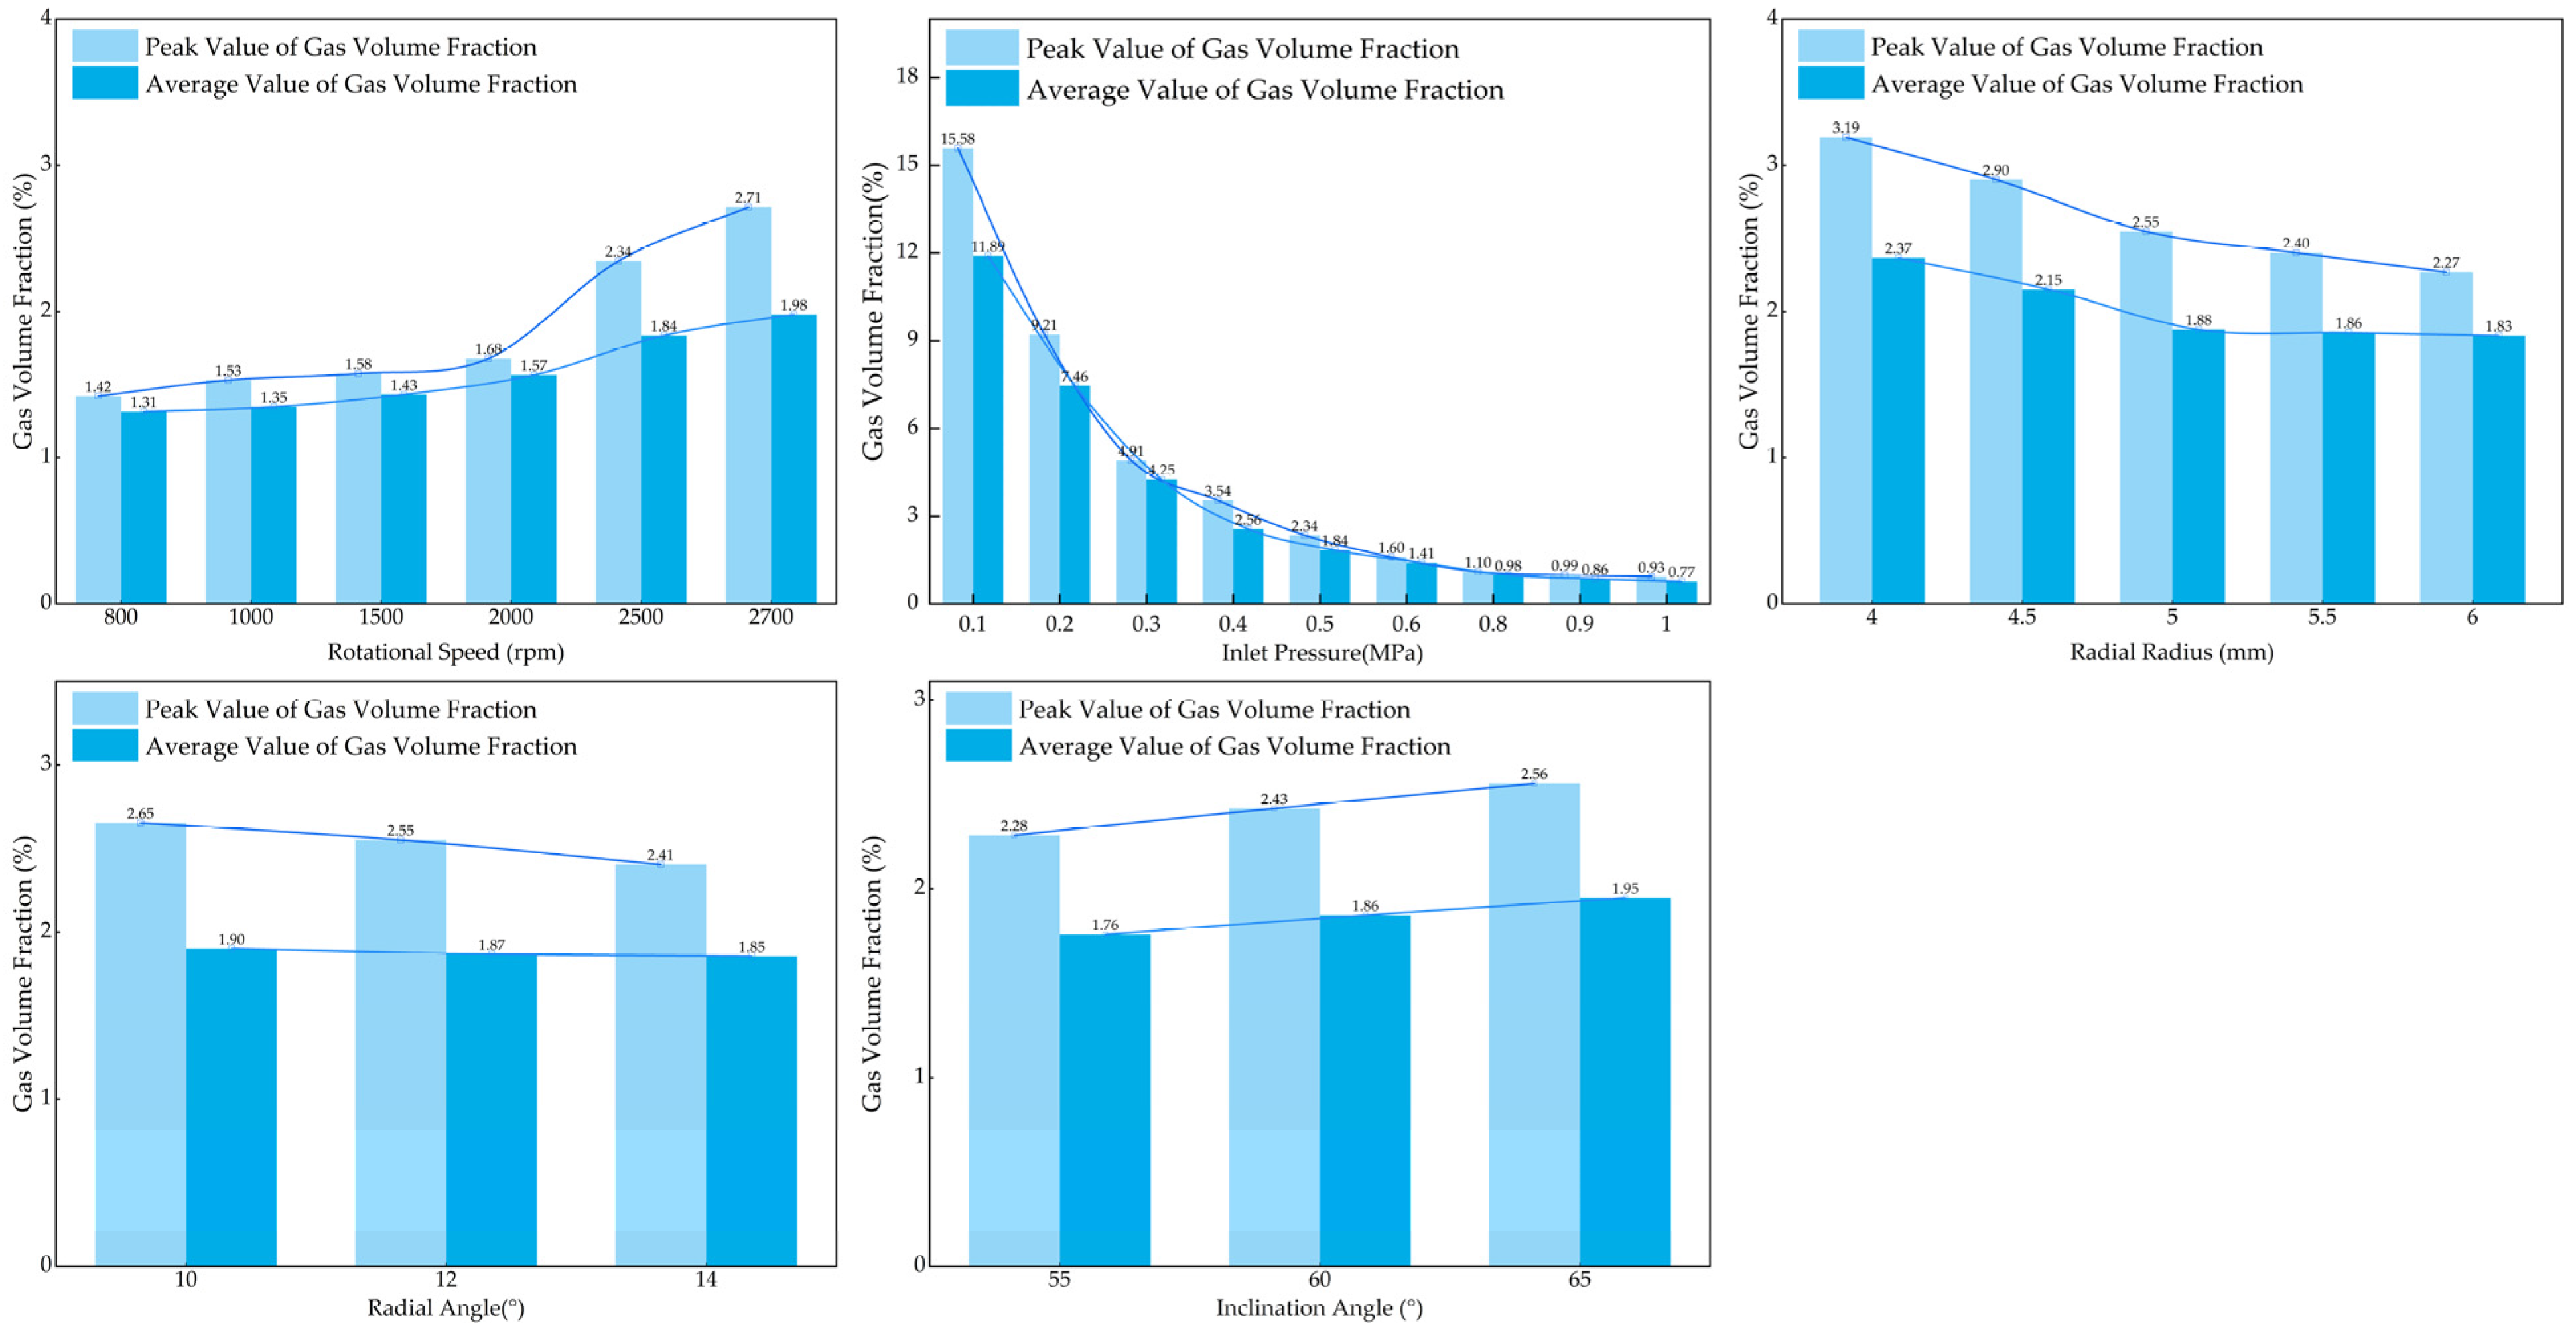
After setting up the gradients of dynamic parameters and static parameters for CFD simulation, the variation trend of gas volume fraction with rotational speed is shown in Figure 14, and the peak values and average values of gas volume fraction corresponding to each parameter are shown in Figure 15. Preliminary observations from the simulation results indicate that as the rotational speed increases, the gas volume fraction shows an upward trend, while an increase in inlet pressure significantly reduces the peak cavitation value. However, an increase in radial radius and changes in inclination angle and radial angle exhibit significant differences in their effects on cavitation. These trends provide a basis for the qualitative judgment of how parameters affect cavitation.
Nevertheless, the existing CFD simulation results only present the variation trends of individual parameters and have two key limitations. First, they fail to quantify the difference in the intensity of the effects of dynamic and static parameters on cavitation. For example, it is impossible to determine whether the cavitation suppression effects of dynamic and static parameters are equivalent, nor to identify which type of parameter exerts a stronger dominant effect on cavitation. Second, they do not clarify the interaction effects between parameters. For instance, under high rotational speed conditions (>2000 rpm), it is unclear to what level the inlet pressure needs to be simultaneously increased to offset the cavitation-promoting effect of rotational speed, and whether changes in inclination angle and radial radius will strengthen or weaken the cavitation effect. The lack of such information makes it impossible to determine parameter optimization priorities and difficult to develop a systematic cavitation control strategy.
Saltelli et al. proposed that the aforementioned issues can be addressed by two core indices in the variance-based sensitivity analysis (VB-SA) framework, the first-order sensitivity index for quantifying independent effects, which is the main effect Si, and the total sensitivity index for quantifying total effects, including independent effects and interaction effects, which is the total effect STi, combined with Hoeffding variance decomposition [6]. The core advantage of this framework lies in its ability to decompose the total variance V(Y) of the cavitation model output, which is the gas volume fraction, into two components: the main effect variance that reflects the independent contribution of a single parameter and the interaction effect variance that reflects the coupled contribution of multiple parameters. This decomposition does not rely on the linear assumption of the model, thus being fully applicable to nonlinear problems such as the closed-circuit pump cavitation studied in this paper.
For the closed-circuit pump cavitation model Y = f (n, pin, rr, ϕ, σ), where Y denotes the gas volume fraction, n denotes the rotational speed, pin denotes inlet pressure, rr denotes radial radius, ϕ denotes radial angle, σ denotes inclination angle, the first-order sensitivity index Si is first introduced to solve the limitation of unquantified independent effect intensity. It is defined as the ratio of the main effect variance of parameter Xi to the total variance of the output Y, with the formula [44]:
S i = V X i E X ~ i Y | X i V Y
In the formula, Xi denotes any one of the five input parameters, and X~i represents the matrix composed of all parameters except Xi. The numerator VXi (EX~i(Y|Xi)) refers to the variance of the conditional expectation of Y with respect to X~i, calculated over the entire range of Xi values. Its core function is to quantitatively indicate the independent uncertainty contribution of Xi, the effect of Xi changing alone, excluding interaction effects with other parameters. The denominator V(Y) is the total variance of the model output Y, which is calculated from the gas volume fraction obtained via CFD simulations. This denominator is used to normalize Si to the interval [0, 1]; a larger Si value indicates a stronger independent influence of the parameter on cavitation. To further address the limitation of unclear interaction effects, the framework introduces the Total Sensitivity Index STi. This index incorporates the main effect of Xi and its interaction effects with all other parameters, and its definition formula is expressed as [45]:
S T i = E X ~ i V X i Y | X ~ i V Y
where EX~i(VXi(Y|X~i)) represents the expectation of the conditional variance of Y with respect to Xi when all parameters except Xi are fixed. This term includes both the main effect of Xi (the independent influence of a single parameter) and all interaction effects between Xi and other parameters. V(Y) denotes the total variance of the cavitation model output, which needs to be calculated through simulations. For STi ∈ [0, 1], a larger value indicates a more significant total effect of the parameter on cavitation, and this index can be directly used to distinguish the priority of effects between dynamic and static parameters. The difference between STi and Si, denoted as SY, can directly quantify the intensity of interaction effects between parameter Xi and other parameters. To further decompose the specific contributions of the main effects and interaction effects of parameters, the Hoeffding variance decomposition theory is proposed in the literature [6]. This theory decomposes the total variance V(Y) into the sum of the main effects of each parameter and interaction effects, and the formula is expressed as [46]:
V Y = i V i + i j > i V i j + + V 12 k
where Vi = VXi (EX~i(Y|X~i)) is defined as the main effect variance of a single parameter, representing effects such as the independent suppression effect of inlet pressure and the independent promotion effect of inclination angle. Vij = VXi VXj (EX~ij(Y|XiXj)) − ViVj is the second-order interaction effect variance between two parameters, representing coupled effects such as the rotational speed–inlet pressure interaction or the inclination angle–radial radius interaction. In cavitation models for hydraulic machinery, the contribution of third-order and higher-order interaction effects (such as Vijk) is less than 5% and can be neglected. This characteristic greatly simplifies the analysis difficulty of cavitation parameters for closed-circuit pumps, allowing the focus to be placed on main effects and second-order interaction effects.
To accurately calculate STi in Equation (21), the estimator proposed by Jansen is adopted [47]:
E X ~ i V X i Y | X ~ i = 1 2 N j = 1 N f A j f A B i j 2
where N denotes the effective number of simulation samples, and A and B represent independent sampling matrices. A B i refers to the matrix where the i column of matrix A is replaced by the i column of matrix B, and this matrix is used to simulate the scenario where only parameter Xi is perturbed. f (x) denotes the gas volume fraction obtained from simulation calculations. The calculation results of the sensitivity analysis are shown in Table 5.
Analysis is conducted based on the results of cavitation sensitivity analysis for closed-circuit pumps, and the findings are as follows. At the first order effect Si level, under the independent action of individual parameters, the inlet pressure with Si equal to 0.9673 is the strongest independent factor affecting cavitation. Increasing the inlet pressure alone can significantly suppress cavitation. The independent effect of radial radius with Si equal to 0.0133 ranks second. Increasing the radial radius can suppress cavitation to a certain extent by reducing the flow velocity in the flow passage, but its effect is much weaker than that of the inlet pressure. Rotational speed with Si equal to 0.0042 and inclination angle with Si equal to 0.0011 exhibit weak independent effects, while the independent effect of the radial angle with Si equal to 0.0001 is extremely weak. Adjusting these parameters individually exerts almost no significant effect on cavitation. In terms of total effect STi, the total effects of inlet pressure with STi equal to 0.0434 and rotational speed with STi equal to 0.0003 are much smaller than their first-order effects. The total effects of the radial radius, radial angle, and inclination angle exhibit negative values, indicating that the interaction effects between parameters are dominated by antagonistic effects. The strong independent influence of a single parameter is reduced when coupled with other parameters. For the interaction effect SY, the interaction effect of the inlet pressure is SY equal to −0.9239, which shows a strong coupling effect with other parameters and is of the antagonistic type, thereby reducing its own independent cavitation suppression effect. The interaction effect of rotational speed is SY equal to −0.0039, and its coupling with other parameters is also antagonistic. The interaction effect of radial radius is close to 0, indicating an extremely weak interaction with other parameters. The interaction effects of radial angles and inclination angles are weak and antagonistic, which slightly reduces their own independent influences.
In conclusion, inlet pressure is the core independent parameter for cavitation control, followed by radial radius. The coupling effect between inlet pressure and other parameters is extremely strong and antagonistic; the coupling between rotational speed and other parameters is also antagonistic, with a weaker strength than that of inlet pressure; the interaction effects of parameters such as radial radius are generally weak. For cavitation control, inlet pressure should be prioritized in single-parameter adjustment. For multi-parameter joint optimization, attention should be paid to the matching of inlet pressure with rotational speed, radial radius, and inclination angle to avoid the reduction of cavitation control effects due to interactive antagonistic effects.

5. Conclusions

This study focuses on cavitation characteristic prediction, parameter influence analysis, and optimization strategy, using an axial closed-circuit piston pump with 110 mL/r displacement as the research object. By integrating CFD simulation, theoretical modeling, and experimental verification, it addresses the limitations of qualitative analysis and insufficient prediction accuracy in traditional cavitation research. Core results are as follows.
(1)
A CFD simulation model based on the FCM is established, where the dynamic mesh technique enables effective coupling between piston chamber reciprocation and dynamic and static flow fields. A test rig is built for model verification; test results show the deviation between simulated and measured flow rates is ≤4%, confirming the model’s reliability. Meanwhile, complex flow passages are decomposed into typical units via segmented approximation, and a mathematical model of flow passage pressure loss is derived. By introducing a pressure loss correction term into the traditional flow rate model, under normal rotational speeds, specifically those ≤2000 rpm, the average flow rate prediction error is effectively reduced, improving the issue of neglected flow passage pressure loss in traditional models.
(2)
The variance-based sensitivity analysis (VB-SA) framework is applied to cavitation research of closed-circuit piston pumps, using the first-order sensitivity index Si and the total sensitivity index STi to quantify the effects of five key parameters on cavitation. Results indicate inlet pressure is the core independent parameter affecting cavitation with an Si value of 0.9673, followed by radial radius with an Si value of 0.0133. Interaction effects between parameters are dominated by antagonism, with the interaction between inlet pressure and other parameters being the most significant, with an SY value of −0.9239, providing support for quantitative analysis of parameter influences.
(3)
Based on sensitivity analysis results, a hierarchical cavitation optimization strategy is proposed. For single parameter adjustment, inlet pressure should be prioritized with a recommended range of 0.5 to 1.0 MPa. For multi-parameter joint optimization, attention should be focused on matching inlet pressure with radial radius and rotational speed, where the radial radius has a recommended value of no less than 5.5 mm, to mitigate inter-parameter antagonistic effects. This strategy significantly reduces the gas volume fraction inside the pump under extreme operating conditions, such as 2700 rpm and 0.1 MPa, offering a reference for improving the pump’s cavitation resistance and volumetric efficiency.
The above results address the limitations of traditional studies to a certain extent. The FCM-based CFD model has been verified through experiments, with the deviation between simulated and measured flow rates ≤4% reflecting good engineering reliability. The flow passage pressure loss model and correction term derived via the segmented approximation method improve the issue that traditional models ignore pressure loss in irregular flow passages to a certain extent, providing more practical support for flow rate prediction under normal rotational speeds ≤ 2000 rpm. The application of the VB-SA framework in the study of closed-type piston pump cavitation represents the first attempt to quantify the individual effects and interaction effects of five key parameters. The clarified core position of the inlet pressure Si value of 0.9673 and the antagonistic rules of parameters provide a quantitative basis for parameter influence analysis, helping reduce reliance on experience during the optimization process. The hierarchical optimization strategy converts theoretical conclusions into operable design references based on the above analysis. Its effect in reducing gas volume fraction under extreme operating conditions, such as 2700 rpm and 0.1 MPa, preliminarily verifies the feasibility of parameter–structure synergistic regulation. It should be noted that the current model does not incorporate the dynamic characteristics of the valve group for now in order to focus on core variables, which also leaves room for expansion in subsequent research.

Author Contributions

Methodology, Y.W.; software, X.W.; validation, Y.W. and X.W.; formal analysis, Y.W.; investigation, F.X.; resources, F.X. and L.C.; data curation, Y.L. and X.K.; writing—original draft preparation, Y.W.; writing—review and editing, J.Z.; visualization, L.C.; supervision, J.Z.; funding acquisition, J.Z. All authors have read and agreed to the published version of the manuscript.

Funding

This work was funded by the National Key Research and Development Program of China (No. 2023YFB3406701).

Data Availability Statement

The data presented in this study are available on request from the corresponding author.

Conflicts of Interest

Author Lin Chen was employed by the company Hangzhou Ruisheng Marine Instruments Co., Ltd. Author Fei Xiao was employed by the company AVIC Changchun Control Technology. The remaining authors declare that the research was conducted in the absence of any commercial or financial relationships that could be construed as a potential conflict of interest.

References

  1. Fu, Y.; Ma, J.; Fu, J.; Chao, Q.; Wang, Y. Review of cylinder block/valve plate interface in axial piston pumps: Theoretical models, experimental investigations, and optimal design. Chin. J. Aeronaut. 2021, 34, 111–134. [Google Scholar] [CrossRef]
  2. Fang, Y.; Zhang, J.; Xu, B.; Mao, Z.; Li, C.; Huang, C.; Guo, Z. Raising the speed limit of axial piston pumps by optimizing the suction duct. Chin. J. Mech. Eng. 2021, 34, 105. [Google Scholar] [CrossRef]
  3. Kunkis, M.; Weber, J. Experimental and numerical assessment of an axial piston pump’s speed limit. Fluid Power Syst. Technol. 2016, 50060, V001T01A048. [Google Scholar]
  4. Guo, D.; Wang, C.; Ruan, Y.; Yin, H.; Fan, X.; Wang, Z.; Zhang, L. Numerical analysis of hydrophobic surface effects on cavitation inception and evolution in high-speed centrifugal pumps for thermal energy storage and transfer systems. Phys. Fluids 2024, 36, 93315. [Google Scholar] [CrossRef]
  5. Zhao, B.; Guo, W.; Quan, L. Cavitation of a submerged jet at the spherical valve plate/cylinder block interface for axial piston pump. Chin. J. Mech. Eng. 2020, 33, 67. [Google Scholar] [CrossRef]
  6. Saltelli, A.; Annoni, P.; Azzini, I.; Campolongo, F.; Ratto, M.; Tarantola, S. Variance based sensitivity analysis of model output. Design and estimator for the total sensitivity index. Comput. Phys. Commun. 2010, 181, 259–270. [Google Scholar] [CrossRef]
  7. Tarantola, S.; Gatelli, D.; Mara, T.A. Random balance designs for the estimation of first order global sensitivity indices. Reliab. Eng. Syst. Saf. 2006, 91, 717–727. [Google Scholar] [CrossRef]
  8. Wang, S. The analysis of cavitation problems in the axial piston pump. J. Fluids Eng. 2010, 132, 74502. [Google Scholar] [CrossRef]
  9. Xu, B.; Song, Y.; Yang, H. Pre-compression volume on flow ripple reduction of a piston pump. Chin. J. Mech. Eng. 2013, 26, 1259–1266. [Google Scholar] [CrossRef]
  10. Plesset, M.S. The dynamics of cavitation bubbles. J. Appl. Mech. 1949, 16, 27–32. [Google Scholar] [CrossRef]
  11. Rayleigh, L. On the pressure developed in a liquid during the collapse of a spherical cavity. Philos. Mag. Ser. 6 1917, 34, 94–98. [Google Scholar] [CrossRef]
  12. Luo, X.W.; Ji, B.; Tsujimoto, Y. A review of cavitation in hydraulic machinery. J. Hydrodyn. 2016, 28, 335–358. [Google Scholar] [CrossRef]
  13. Singhal, A.K.; Athavale, M.M.; Li, H.; Jiang, Y. Mathematical basis and validation of the full cavitation model. J. Fluids Eng. 2002, 124, 617–624. [Google Scholar] [CrossRef]
  14. Xie, H.; Luo, X.Q.; Feng, J.J.; Zhu, G.J.; Li, C.H. Application of three cavitation models in centrifugal pump cavitation flow simulation. J. Phys. Conf. Ser. 2024, 2707, 12141. [Google Scholar] [CrossRef]
  15. Zhang, J.; Xi, W.; Tang, J.; Huang, Z. Exploring cavitation dynamics and noise reduction in hydraulic machinery with bionic leading-edge impeller. Phys. Fluids 2024, 36, 95133. [Google Scholar] [CrossRef]
  16. Fu, J.F.; Liu, X.W.; Yang, J.J.; Yin, D.W.; Zhou, Z.H. Optimization of cavitation characteristics of aviation fuel centrifugal pump inducer based on surrogate model. Struct. Multidiscip. Optim. 2023, 66, 241. [Google Scholar] [CrossRef]
  17. Gullapalli, S.; Michael, P.; Kensler, J.; Cheekolu, M.; Taylor, R.I.; Lizarraga, G.E. An investigation of hydraulic fluid composition and aeration in an axial piston pump. Fluid Power Syst. Technol. 2017, 8332, V001T01A028. [Google Scholar]
  18. Zhu, H.; Qiu, N.; Li, Y.; Li, M.; Zheng, Y.; Rao, H. Flow separation-induced cavitation dynamics and pressure pulsation in mixed-flow pumps. Phys. Fluids 2025, 37, 83368. [Google Scholar] [CrossRef]
  19. Bügener, N.; Klecker, J.; Weber, J. Analysis and improvement of the suction performance of axial piston pumps in swash plate design. Int. J. Fluid Power 2014, 15, 153–167. [Google Scholar] [CrossRef]
  20. Ye, S.; Zeng, C.; Tang, H.; Bao, Y.; Wang, J.; Zhao, S.; Ren, Y. Research on the cavitation characteristics of axial piston pump based on computational fluid dynamics models. Phys. Fluids 2025, 37, 75131. [Google Scholar] [CrossRef]
  21. Xu, B.; Ye, S.; Zhang, J.; Zhang, C. Flow ripple reduction of an axial piston pump by a combination of cross-angle and pressure relief grooves: Analysis and optimization. J. Mech. Sci. Technol. 2016, 30, 2531–2545. [Google Scholar] [CrossRef]
  22. Yin, F.L.; Nie, S.L.; Xiao, S.H.; Hou, W. Numerical and experimental study of cavitation performance in sea water hydraulic axial piston pump. Proc. Inst. Mech. Eng. Part I J. Syst. Control Eng. 2016, 230, 716–735. [Google Scholar] [CrossRef]
  23. Manring, N.D.; Mehta, V.S.; Nelson, B.E.; Graf, K.J.; Kuehn, J.L. Scaling the speed limitations for axial-piston swash-plate type hydrostatic machines. J. Dyn. Syst. Meas. Control 2014, 136, 31004. [Google Scholar] [CrossRef]
  24. Saltelli, A. Making best use of model evaluations to compute sensitivity indices. Comput. Phys. Commun. 2002, 145, 280–297. [Google Scholar] [CrossRef]
  25. Saltelli, A.; Ratto, M.; Andres, T.; Campolongo, F.; Cariboni, J.; Gatelli, D.; Tarantola, S. Global sensitivity analysis: The primer. J. Stat. Softw. 2008, 27, 1–13. [Google Scholar]
  26. Kucherenko, S.; Rodriguez-Fernandez, M.; Pantelides, C.; Shah, N. Monte Carlo evaluation of derivative-based global sensitivity measures. Reliab. Eng. Syst. Saf. 2009, 94, 1135–1148. [Google Scholar] [CrossRef]
  27. Oakley, J.E.; O’Hagan, A. Probabilistic sensitivity analysis of complex models: A Bayesian approach. J. R. Stat. Soc. Ser. B Stat. Methodol. 2004, 66, 751–769. [Google Scholar] [CrossRef]
  28. Storlie, C.B.; Helton, J.C. Multiple predictor smoothing methods for sensitivity analysis: Description of techniques. Reliab. Eng. Syst. Saf. 2008, 93, 28–54. [Google Scholar] [CrossRef]
  29. Leavy, A.S.; Nakas, G.A.; Papadopoulos, P.N. A method for variance-based sensitivity analysis of cascading failures. IEEE Trans. Power Deliv. 2022, 38, 463–474. [Google Scholar] [CrossRef]
  30. Li, H.; Wang, C.; Zhang, X.; Li, J.; Shen, J.; Zhou, S. A mini review on fluid topology optimization. Materials 2023, 16, 6073. [Google Scholar] [CrossRef]
  31. Borrvall, T.; Petersson, J. Topology optimization of fluids in Stokes flow. Int. J. Numer. Methods Fluids 2003, 41, 77–107. [Google Scholar] [CrossRef]
  32. Alexandersen, J.; Andreasen, C.S. A Review of topology optimization for fluid-based problems. Fluids 2020, 5, 29. [Google Scholar] [CrossRef]
  33. Han, H.; Han, Y.; Lin, Y.; Wang, C.; Korvink, J.G.; Deng, Y. Topology optimization of microchannel heat sinks for laminar flows of thermal–fluid. Appl. Therm. Eng. 2025, 270, 126153. [Google Scholar] [CrossRef]
  34. Dilgen, C.B.; Dilgen, S.B.; Fuhrman, D.R.; Sigmund, O.; Lazarov, B.S. Topology optimization of turbulent flows. Comput. Methods Appl. Mech. Eng. 2018, 331, 363–393. [Google Scholar] [CrossRef]
  35. Tyagi, A.; Walia, R.S.; Murtaza, Q.; Pandey, S.M.; Tyagi, P.K.; Bajaj, B. A critical review of diamond like carbon coating for wear resistance applications. Int. J. Refract. Met. Hard Mater. 2019, 78, 107–122. [Google Scholar] [CrossRef]
  36. Sola, R.; Veronesi, P.; Zardin, B.; Borghi, M. A study on PVD coatings for reduction of friction and wear of swashplate axial piston pumps and motors. Metall 2020, 3, 14–23. [Google Scholar]
  37. Mamazhonov, M.; Shakirov, B.; Matyakubov, B.; Makhmudov, A. Polymer materials used to reduce waterjet wear of pump parts. J. Phys. Conf. Ser. 2022, 2176, 12048. [Google Scholar] [CrossRef]
  38. Erdemir, A.; Martin, J.M. Superior wear resistance of diamond and DLC coatings. Curr. Opin. Solid State Mater. Sci. 2018, 22, 243–254. [Google Scholar] [CrossRef]
  39. Strmčnik, E.; Majdič, F.; Kalin, M. Water-lubricated behaviour of AISI 440C stainless steel and a DLC coating for an orbital hydraulic motor application. Tribol. Int. 2019, 131, 128–136. [Google Scholar] [CrossRef]
  40. Zhang, J.; Ying, L.; Bing, X.; Min, P.; Qun, C. Experimental study of an insert and its influence on churning losses in a high-speed electro-hydrostatic actuator pump of an aircraft. Chin. J. Aeronaut. 2019, 32, 2028–2036. [Google Scholar] [CrossRef]
  41. Li, Y.; Chen, X.; Luo, H.; Zhang, J. An empirical model for the churning losses prediction of fluid flow analysis in axial piston pumps. Micromachines 2021, 12, 398. [Google Scholar] [CrossRef]
  42. Milojević, S.; Savić, S.; Mitrović, S.; Marić, D.; Krstić, B.; Stojanović, B.; Popović, V. Solving the problem of friction and wear in auxiliary devices of internal combustion engines on the example of reciprocating air compressor for vehicles. Teh. Vjesn. 2023, 30, 122–130. [Google Scholar]
  43. Moody, L.F. Friction factors for pipe flow. Trans. Am. Soc. Mech. Eng. 1944, 66, 671–678. [Google Scholar] [CrossRef]
  44. Bergada, J.M.; Kumar, S.; Davies, D.L.; Watton, J. A complete analysis of axial piston pump leakage and output flow ripples. Appl. Math. Model. 2012, 36, 1731–1751. [Google Scholar] [CrossRef]
  45. Saltelli, A.; Tarantola, S. On the relative importance of input factors in mathematical models: Safety assessment for nuclear waste disposal. J. Am. Stat. Assoc. 2002, 97, 702–709. [Google Scholar] [CrossRef]
  46. Sobolprime, I.M. Sensitivity analysis for nonlinear mathematical models. Math. Model. Comput. Exp. 1993, 1, 407–414. [Google Scholar]
  47. Jansen, M.J. Analysis of variance designs for model output. Comput. Phys. Commun. 1999, 117, 35–43. [Google Scholar] [CrossRef]
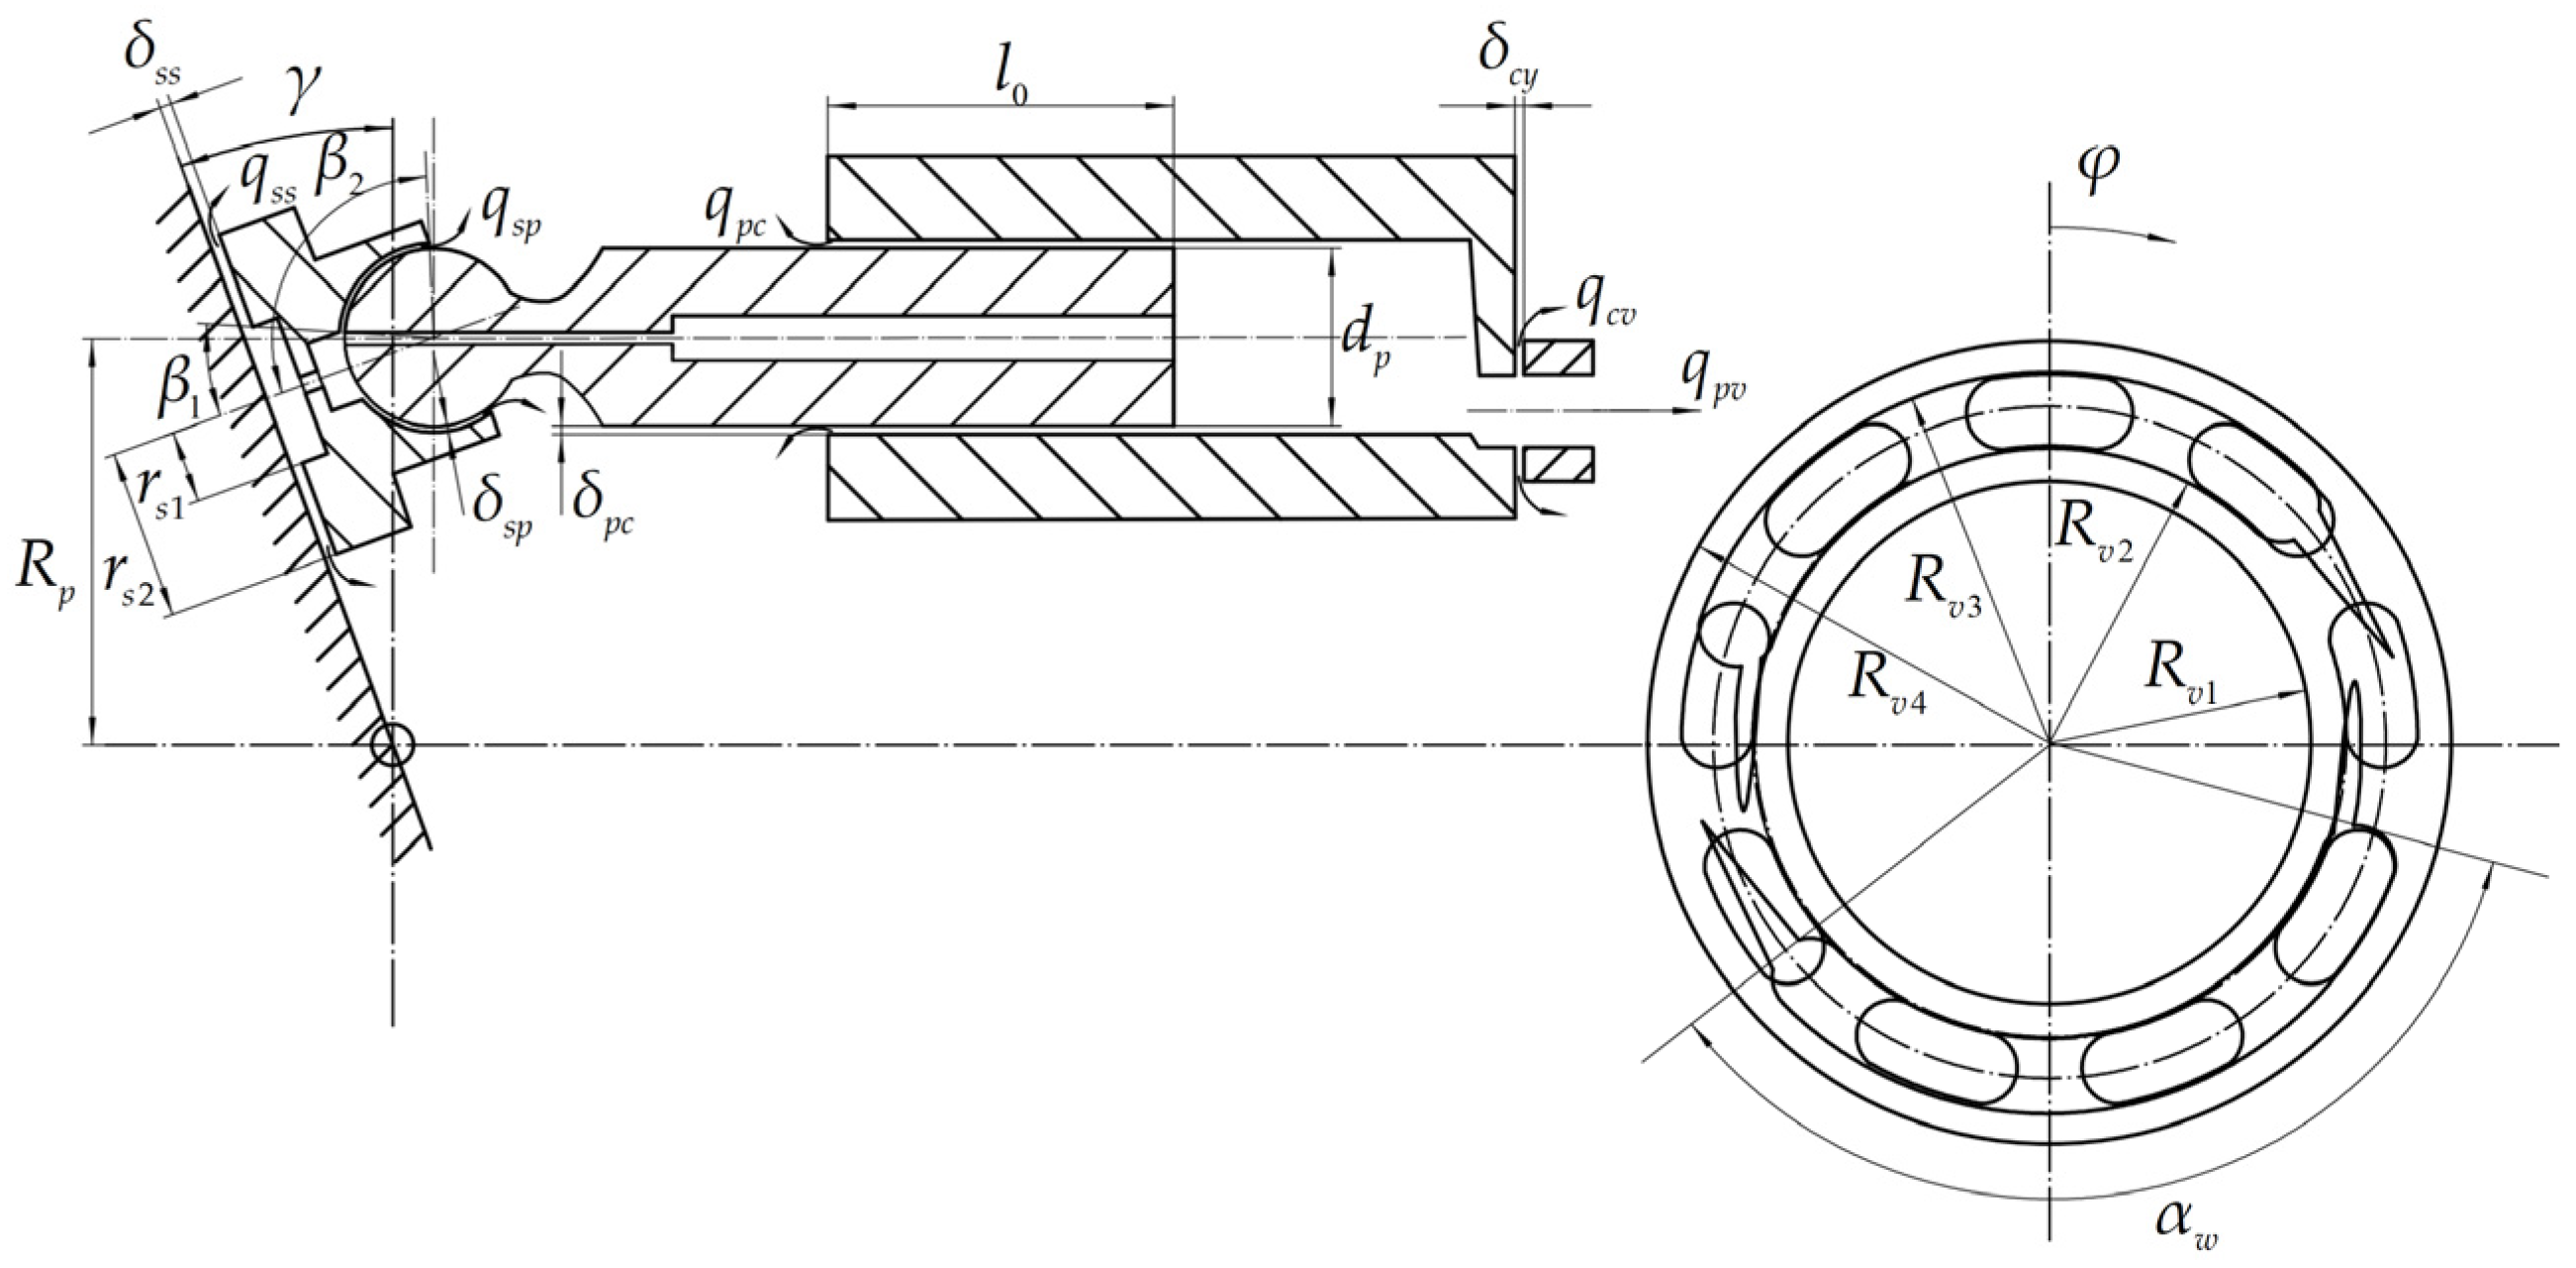
Figure 1. Two-dimensional cross-section of an axial piston pump.
Machines 13 00901 g001
Figure 2. Internal flow channels of the piston pump.
Machines 13 00901 g002
Figure 3. Schematic diagram of the experimental test.
Machines 13 00901 g003
Figure 4. Picture of the test rig.
Machines 13 00901 g004
Figure 5. Experimental test flow rate.
Machines 13 00901 g005
Figure 6. Comparison of flow rates between experimental test and simulation.
Machines 13 00901 g006
Figure 7. Causes for pressure losses in the flow passage.
Machines 13 00901 g007
Figure 8. Oil suction flow channel.
Machines 13 00901 g008
Figure 9. Schematic diagram of the closed-circuit pump principle.
Machines 13 00901 g009
Figure 10. Piston internal flow field model.
Machines 13 00901 g010
Figure 11. Comparison diagram of pressure loss.
Machines 13 00901 g011
Figure 12. Comparison diagram of flow rate.
Machines 13 00901 g012
Figure 13. Optimization flow chart.
Machines 13 00901 g013
Figure 14. Curve of gas volume fraction.
Machines 13 00901 g014
Figure 15. Peak values and average values of gas volume fraction.
Machines 13 00901 g015
Table 1. Main parameters of the closed-circuit piston pump.
VariablesParameterValue
Number of pistonsm9
Piston diameter (m)dp0.02147
Pitch circle radius of piston (m)Rp0.0465
Swash plate inclination angle (°)γ20
Piston shoe-to-swash plate clearance (m)δss0.00003
Dynamic viscosity of oil (Pa∙s)μ0.028
Oil density (kg/m3)ρ850
Inner radius of the slipper base circle (m)rs10.0037
Outer radius of the slipper base circle (m)rs20.01515
Piston ball end-to-piston shoe clearance (m)δsp0.000009
Effective working angle of piston ball end (°)β1110
Effective working angle of piston shoe (°)β220
Piston-to-cylinder block clearance (m)δpc0.00002
Contact length between plunger and plunger bore at top dead center (m)l00.04263
Relative eccentricity between plunger and plunger bore (m)ε0.00001
Included angle of kidney-shaped grooves on valve plate (°)αw131.37
Cylinder block-to-valve plate clearance (m)δcv0.00001
Inner radius of the inner sealing land on valve plate (m)Rv10.0285
Outer radius of the inner sealing land on valve plate (m)Rv20.0326
Inner radius of the outer sealing land on valve plate (m)Rv30.0409
Outer radius of the outer sealing land on valve plate (m)Rv40.0445
Table 2. Parameter setting in the CFD model.
ParameterValue
CFD software: PumpLinxVersion v4.6.0
Displacement (mL/r)110
Number of pistons9
Liquid density (kg/m3)850
Liquid bulk modulus (GPa)1.4
Dynamic viscosity (Pa·s)0.017
Air separation pressure (MPa)0.101
Temperature (°C)40
Gas Mass Fraction9 × 10−5
Gas Molecular Weight (kg/kmol)28.97
Vapor Molecular Weight (kg/kmol)300 m
Table 3. Mesh independence verification.
Model SetSurface MeshMaximum MeshMesh CountFlow Rate Error
10.02 mm0.04 mm146,3265.61%
20.015 mm0.03 mm170,2633.69%
30.01 mm0.02 mm196,9852.03%
40.005 mm0.01 mm238,1781.54%
50.0025 mm0.005 mm290,3741.43%
Table 4. Experimental Test Parameters.
NumberDescriptionManufacturerDetail
1Test pumpLIYUAN (L4VG110EP): Suzhou, China110 mL/r
2Check valveHuade (M-SRKE02): Beijing, China0~0.5 bar
3High-Pressure Relief ValveHengli (50R50): Changzhou, China0~60 MPa
4Pressure sensorIFM (PT5443): Esslingen, Germany0~5 MPa, accuracy ±0.5%
5Low-Pressure Relief ValveHuade (DBK20): Beijing, China0~5 MPa
6FlowmeterHYDAC (EVS3106): Neustadt, Germany0~600 L/min, accuracy ±0.5%
7Charge pumpRexroth (1PF2G3): Stuttgart, Germany40 mL/r
8Rotational speed sensorSoway (SP13): Shanghai, China0~4000 r/min, accuracy ±0.5%
9Electrical motorABB (M2BAX25HP):
Zurich, Switzerland
0~5000 r/min
10Pressure sensorIFM (PT5560): Esslingen, Germany0~60 MPa, accuracy ±0.5%
11Check valveHuade (M-SRKE05):
Beijing, China
0.5~1 bar
12Proportional relief valveHengli (DBE/M32): Changzhou, ChinaManual adjustment
Table 5. Sensitivity analysis.
ParameterSiSTiSY = STiSi
Rotational Speed (rpm)0.00420.0003−0.0039
Inlet Pressure (MPa)0.96730.0434−0.9239
Radial Radius (mm)0.01330.0126−0.0007
Radial Angle (°)0.0001−0.0004−0.0003
Inclination Angle (°)0.0011−0.0028−0.0039
Disclaimer/Publisher’s Note: The statements, opinions and data contained in all publications are solely those of the individual author(s) and contributor(s) and not of MDPI and/or the editor(s). MDPI and/or the editor(s) disclaim responsibility for any injury to people or property resulting from any ideas, methods, instructions or products referred to in the content.