Abstract
The vehicle braking system is the system that provides the greatest safety when driving on public roads. That is why European legislation places great emphasis on carrying out periodic technical inspections (PTIs) (annually or whenever necessary) to protect both the driver and especially other traffic participants. Our paper analyzes a group of 54 Dacia-Logan cars, participating in traffic both in Romania and in Europe, especially in terms of braking systems, upon arrival at PTI stations, presenting the efficiency of these systems and the variation pattern depending on the frequency of the cars. It is thus found that the efficiency of the service brake has values between 53 and 87%, with an average of about 69%, and the efficiency of the safety brake has values between 23 and 67%, with a much lower average of only 34% (there are, obviously, few extreme positive values, but also negative ones). There are also imbalances both in terms of the necessary braking force, which is up to 24% for the front axle (between the left–right wheels) and up to 30% between the wheels for the rear axle. The braking force values on the two wheels were in the ranges of 2000–2200 N for the front axle, between 1715–1850 N for the rear axle and for the service brake, and between 1360 and 1435 N for the safety brake.
1. Introduction
The safety of motor vehicle operation depends essentially on the proper functioning of the braking system, whose main components—brake calipers and brake pads—contribute to the efficient reduction in speed. These elements, in direct contact with the brake disc, ensure the transformation of kinetic energy into heat through friction, a process essential for the controlled stopping of the vehicle. The performance and reliability of these parts directly influence the braking capacity and, implicitly, the safety of road users.
The disc brake in automobiles is a braking system in which, when the pedal is actuated, brake pads are pressed against a rotating metal disc (the brake disc—Figure 1), creating friction and slowing the car. This system provides superior braking power and better cooling of the components compared to other types of brakes, and is widely used in modern vehicles to increase safety on public roads.
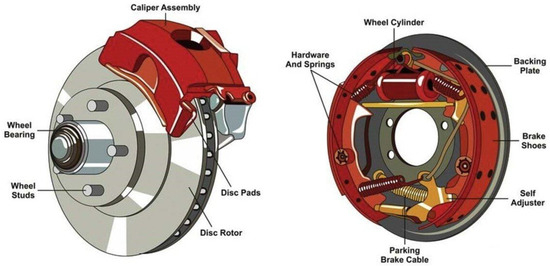
Figure 1.
The main components of disc and drum brakes, existing on the first Dacia Logan cars. https://www.spinny.com/blog/drum-brakes-vs-disc-brakes/ (accessed on 20 September 2025).
The performance of the braking system in real operating conditions is influenced by a series of dynamic factors, which depend both on the vehicle’s operating conditions and on the physical characteristics of the components involved in the braking process (Figure 1). Unlike standardized tests performed in controlled environments (brake stands), real operation involves a high variability of driving conditions, payload, road conditions, driving style and braking frequency [1].
Therefore, braking efficiency depends on several factors, including the tires used, the condition of the braking system (pads, discs, brake fluid) and road conditions. Also, the safety distance that the driver maintains, calculated according to the 2 s rule, is essential to allow an effective stop, while judicious use of the engine brake can reduce sudden and dangerous braking.
The braking system in urban driving is characterized by frequent and medium-intensity braking, with an accelerated increase in disc temperature, which leads to the phenomenon of “fading” (temporary decrease in braking efficiency). Also, the wear of the pads is more pronounced compared to constant driving conditions [1,2,3].
It has been found that aggressive driving style (late braking, additional loading) accelerates pad wear by up to 30–40% compared to an economical style. Additional loading of the vehicle (over 80% of the permissible load) also has a direct impact on braking time, which can increase by up to 25%, requiring periodic adaptation of maintenance intervals [2].
Along with steering and gear shifting, braking is one of the most frequent operations performed when driving a car. The components of the braking system must take this into account, optimally utilizing the force applied to the pedal by the driver and ensuring that the required force remains as constant as possible for the desired braking effect [2].
The condition of a vehicle’s braking system is one of the key factors that determines the safety of the driver, passengers and other road users [3,4]. Normal braking must have good performance, meaning that in addition to pedal sensitivity, it must not be too long, not be partial and not squeak, with an average actuation of approximately four times per minute [4]. During the operation of a vehicle, the elements of its braking system are subject to wear and tear and are exposed to damage. Deterioration of the efficiency of the braking system has a direct impact on the collision speed, so diagnosing the system during vehicle operation is of paramount importance. Therefore, the authors of the papers [3,4] tried to identify the influence of the state of a certain element on the braking system on the collision speed and the kinetic energy of the impact. The results obtained through CAD simulations proved the significant role of brake system diagnostics in eliminating vehicles with brake systems that do not function properly, as the use of inefficient brakes poses a significant threat to road traffic participants and vehicles.
In [5], the authors analyze the limits of operator effort on the brake pedal and braking performance for all-terrain vehicles, introducing brake design and system development guidelines, along with the design selection procedure. It is specified that the ultimate goal of the braking system is to lock all four wheels of the vehicle at the same time and stop its movement in a minimum braking distance. The result of the project proposed by the authors is an optimized, lightweight hydraulic braking system that provides adequate braking torque for effective braking of the vehicle in a hostile racing environment.
In addition, repeated operation of the anti-lock braking system (ABS) causes the accumulation of structural damage in the various subsystems, a phenomenon that leads to a reduction in their functional lifespan. In [6], a fuzzy logic-based life extension control (FLEC) system is proposed to increase the life of ABS by significantly improving the life period and safe operation. Based on the predicted wear rates, the fuzzy logic controller proposed by the authors modifies its online control strategy to maintain safe operation, which leads to an increase in ABS operating time and the FLEC being fine-tuned by means of a genetic algorithm, with the effectiveness verified by appropriate simulations.
Vehicle characteristics and government regulations affect the design process of the brake system, which must achieve maximum braking capacity during the braking process. These limit the design of an optimal brake system, requiring the determination of the pressure generated during the braking process, which must exceed the pressure required for proper operation of the brake system. Thus, the authors of [7] conducted a case study of a braking system that can generate a pressure of 4.14 MPa, when a pressure of 3.13 MPa and 2.34 MPa is required at the front and rear calipers of a vehicle weighing 78.48 kN to decelerate by 5 m·s−2, as required by Indonesian government regulations. The authors also made a comparison with other methods proposed by various researchers, and the results showed that the proposed method can be applied under various conditions, minimizing the pressure difference between the generated pressure and the required pressure to avoid oversizing.
In [8], the authors proposed a specific controller for controlling tire slip and maximizing braking forces depending on road conditions, performing vehicle dynamics simulations using CarSim software 2023.0. The controller proposed by the authors is able to make tire slip follow a certain reference based on the friction coefficient for different road conditions, knowing that road conditions significantly affect the braking performance of vehicles.
The importance of using an optimal and efficient braking system is also emphasized in [9], with optimization and efficiency being determined through successive tests with a brake dynamometer, according to road safety regulations, and the results are correlated with consecutive braking tests at different speeds, tracking braking time and distance.
For periodic testing of the braking system, in the study [10], the authors propose revising and supplementing the Standard Operating Procedure (SOP) by including a comprehensive risk assessment using Fault Tree Analysis (FTA) and Failure Mode and Effect Analysis (FMEA) tools, based on accident investigation data compiled by the National Transportation Safety Board (NTSC) during the period 2017–2022. Based on the analysis, thirteen failure cases classified as intolerable risk instances were identified, for each of which customized additions to the SOP were recommended that provide information to stakeholders, allowing for the review and refinement of regulations for periodic vehicle testing.
The paper [11] attempts to find a relationship between the implemented system of periodic technical inspections of vehicles and the number of road accidents, which indicate the reliability of vehicles and road safety, respectively, using the results of comparative tests in which the parameters could be directly observed both in cases where the system was implemented and where there were no periodic technical inspections. Although the analysis of the results shows that periodic technical inspections of vehicles do not have a statistically significant effect on the number of accidents, it is important to carry them out [12].
The possibilities of expanding the scope of application of periodic technical inspections of vehicles in the field of road safety are also analyzed in [13], by analyzing the mechatronic systems that can be implemented in vehicles, proposing four diagnostic levels, which successively allow, more and more precisely, the state of the tested system to be determined to detect malfunctions of the mechatronic system that have not been detected by the on-board diagnostic systems. However, this diagnostic method requires synchronization of the test program (excitation signals) with the measurements in the station.
Examining statistical data on road accidents caused by technical defects of vehicles, as well as data on IT, the first finding of the authors of [14] was that, with the approaching end of IT validity, the probability of road accidents caused by technical defects increases for vehicles, and the second finding was that, with the increase in the number of vehicles evaluated at periodic technical inspection stations (PTI), the number of accidents caused by technical defects of vehicles is decreasing.
There are also papers that deal with dynamic and stationary testing of vehicle braking systems on defined test areas, using decelerometers that record braking deceleration [15], or papers that analyze the efficiency of the vehicle’s braking force by applying three different braking actions: sudden braking, gradual braking and intermittent braking by pressing and releasing, tested on a roller brake tester [16]. The braking efficiency is higher (about 44%) when sudden braking is applied and lower when braking occurs by pressing lightly.
There are disc brakes with self-boosting that use the rotational energy of the brake disc to amplify the braking force, obtained with a ramp mechanism or a wedge, where friction converts the motion of the rotating disc into increased pressure on the brake pads, leading to stronger braking and improved efficiency. Tretsiak (2011) [17] demonstrated their effectiveness for medium-duty trucks on test benches, as well as for road tractors through driving tests.
Also, the ABS, which is an active safety system installed on cars, has the role of preventing the wheels from locking during sudden braking, with sensors mounted on each wheel permanently monitoring the speed: if one or more wheels tend to lock (even when the car is still moving), ABS temporarily reduces the pressure of the brake fluid on that wheel, then applies pressure again in a very fast cycle (dozens of times per second), the result being that the wheels continue to rotate partially and do not skid. The advantages of ABS are that it maintains steering control during heavy braking (obstacles can be avoided), reduces the risk of skidding on slippery roads, and can shorten the braking distance, especially on dry asphalt.
The objective of our paper is to highlight and statistically model the efficiency of the braking systems (service and safety) for Dacia-Logan cars that presented themselves at the PTI station for their diagnosis, as well as the imbalance of friction forces in relation to the front–rear axles of the vehicle and to its sides, as these cars are frequently found on the roads of Romania and Europe.
It is obvious that not all brake pads are new at the time of technical inspection, but all must comply with the standard regarding the thickness of the friction layer. We intend to continue our research with the condition of brake pads for cars that arrive at the service station for technical inspection.
2. Materials and Methods
Dacia Logan is a family of automobiles produced and marketed by the French manufacturer Renault through its Romanian subsidiary Dacia since mid-2004. It has been marketed as Renault Logan, Nissan Aprio, Mahindra Verito, Renault L90, Lada Largus (MCV), Nissan NP200 (pick-up) or Renault Symbol. It is estimated that Dacia Logan has reached over 4 million sales worldwide. The model is now in its third generation, which was launched in 2020, using the new CMF-B platform. Dacia sold 573,800 vehicles in 2022, 6.8% more than the previous year, with over 92% of Dacia’s production being exported and only 8% remaining in Romania.
Therefore, this car brand is not to be neglected, and the topic is addressed in a doctoral thesis. Initially, Dacia-Logan cars had drum brakes on the rear, but the current versions have disc brakes on both axles.
In general, braking efficiency in passenger cars is estimated using relationships that relate the obtained deceleration, the braking forces at the wheels and the adhesion conditions. These relationships appear both in road legislation (RAR technical regulations, EU regulations, other regulations), and in vehicle dynamics or auto mechanics manuals.
The main indicators of braking efficiency are as follows [18]:
- Average braking deceleration:
- Equivalent braking coefficient:
Modern cars can reach ηf ≥ 0.7 in the case of a dry road.
- Braking efficiency on braking stands at PTI stations:
For the service brake, all 4 wheels are taken into account, while for the parking brake, the forces on the rear axle of the car are measured. The distribution on the axles/wheels is also checked to avoid imbalances. The calculation relationship for the imbalance between the wheels is as follows:
The ECE R13-H regulation and the harmonized EU Directives provide minimum values for the average deceleration for passenger cars of about 5.8 m·s−2, and for the efficiency related to weight of about 50%, while the RAR/PTI standards provide a minimum efficiency of service brakes ≥ 50% for passenger cars, and ≥16% for the parking brake.
The research was conducted at the Service Auto PTI—Etytehnic srl-Cyclon Lubricants Partner, an authorized periodic technical inspection and auto repair station. This unit is located in the city of Craiova, Romania, and operates under the aegis of collaboration with the lubricant manufacturer Cyclon.
The station has modern equipment, including test stands for periodic technical inspections (PTIs), equipment for measuring the efficiency of braking systems (dynamometers), electronic diagnostic equipment, equipment for checking and replacing brake fluid, and devices for checking the wear of mechanical components. The RBT (roller brake tester) stand for cars allows the measurement of the following values: maximum braking force on each wheel and the handbrake, with the drawing of the force/time diagram for each brake category; static and dynamic braking imbalance for each axle; braking efficiency on each axle, in total and for the handbrake; pedal braking effort; brake force vs. pedal force diagram; parasitic forces; and wheel slip threshold and friction.
The composition and elements of the braking system with different types of brakes on the two axles and the appearance of a Dacia Logan, model 2025 are presented in Figure 2a,b and Figure 3 shows the interior an periodic technical inspection station.
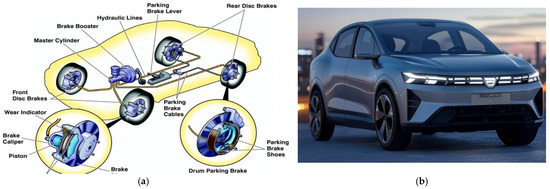
Figure 2.
The composition and elements of the braking system with different types of brakes on the two axles (a), and the appearance of a Dacia Logan, model 2025 (b); https://service.sdfauto.ro/; https://www.idevice.ro/2025/01/02/dacia-logan-2025 (both accessed 19 September 2025).
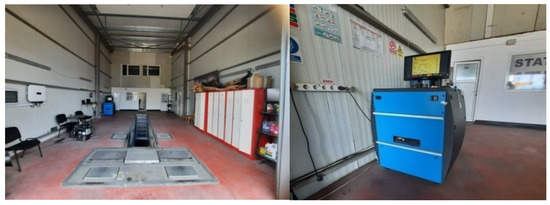
Figure 3.
The interior of an authorized periodic technical inspection station.
In a PTI, the concepts of static and dynamic imbalance refer to the way in which the vehicle wheel reacts to the applied forces, which influences the safety and comfort of the ride. Static imbalance is the imbalance of a wheel that occurs when its center of mass does not coincide with the axis of rotation (vertical vibration appears on the respective axle because the balancing weights are missing or incorrectly mounted), and at the brake stand, it can be detected by vibrations felt when the wheel that occurs rolls on rollers without a large external load. Dynamic imbalance is the imbalance when the wheel has an uneven distribution of mass on different planes (not only up and down, but also laterally), with more complex vibrations, felt both vertically and laterally, usually at higher speeds. On the brake stand, dynamic imbalance affects how the braking force is transmitted to the ground, with the wheel starting to shake or transmit variable impulses during braking, affecting the measurements.
The stand also provides information on the rolling resistance on the two wheels of an axle, the force applied to the brake pedal and the vehicle mass value. Its technical and metrological characteristics are presented in Table 1.

Table 1.
Technical and metrological characteristics of the brake system test stand.
The calibration system allows 3-point checks of the measuring range of 1000 N, 3000 N and 5000 N. Measurements of the imbalance and effective braking are made with a resolution of <1%, and the braking efficiency is presented in real time through appropriate diagrams. The calculation program of the PTI station calculates the imbalance as the ratio between the difference between the braking forces on the two wheels (or axles) and the highest value of the two braking force values. The program also calculates the braking efficiency as the ratio of the total braking force and the vehicle mass (corresponding to the service brake and to the safety brake).
It is possible to calibrate the threshold for braking efficiency to a maximum of 50% for the service brake, 25% for the emergency brake and 15% for the handbrake.
The equipment monitors memorize and print the maximum braking force on the left–right wheels of the same axle, the braking imbalance between the left/right wheels of the same axle, and the braking efficiency for the service brake, emergency brake and handbrake.
The station carries out inspection and maintenance of braking systems on various types of cars, but for our research, only Dacia-Logan cars were of interest. Data on 54 such cars were taken from the station statistics, and the centralized values are presented in Table 2 and in the Supplementary Materials.
Table 2.
Centralized data on the efficiency of braking systems for Dacia Logan cars *.
For a detailed assessment of the braking system performance, the service (main) brake and the safety brake (reserve, handbrake or auxiliary system) were taken for analysis.
At the time of the technical inspection, the inspector first visually checks each tire and, if necessary, uses a caliper or profile indicator. The inspector also checks if the tires are unevenly worn (on the inside or outside), which is a sign of geometry, suspension or incorrect pressure problems. The minimum legal limit in Romania is 1.6 mm for passenger cars (in the main groove of the tread), below which the car is rejected at the PTI.
We deduce from this that all the cars that were the subject of our work complied with this standard, but we cannot comment on the profile and wear of the tires of each car at the time of the technical inspection.
It should be noted that the cars for which technical inspections were carried out were presented at the PTI station within the deadline provided for by the legislation in force in Romania (1 year).
3. Results and Discussion
Table 2 presents the vehicle weight distribution on the front–rear and left–right axles, as well as the braking forces on the respective axles and parts, for both the service and parking brakes. The imbalances on the front–rear axles for the service and parking brakes are also presented, as well as the efficiency presented by the PTI for the two braking systems.
Based on the data presented in Table 2, several categories of charts were drawn in order to analyze the efficiency of the braking systems, in relation to the number of cars analyzed. Thus, the efficiency of the braking systems could be plotted in relation to the number of vehicles tested (Figure 4). It is found that the efficiency of the service brake is much higher than that of the parking brake (68% compared to 34%), even if there are vehicles with weaker service brake efficiency or vehicles with higher parking brake efficiency.
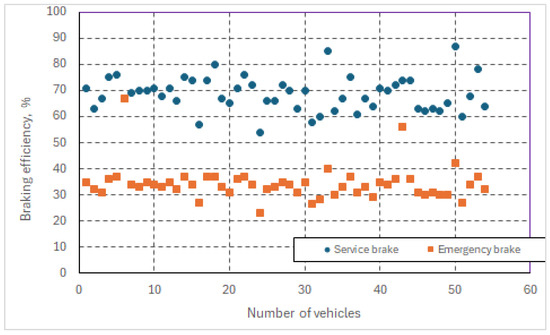
Figure 4.
Variation of braking system parameters in relation to the number of vehicles.
The two colored groups of points highlight the service brake (in blue), with an efficiency generally between 60% and 80% (average 68%), with significant point variations, and the safety brake (in red), which remains in the range of 30–40% (average 34%), with a relatively more constant general trend, but at a lower efficiency level.
An important observation is that the service brake is, as expected, much more efficient than the safety brake, but there are quite pronounced efficiency fluctuations, especially in the service brake, which suggests possible differences in wear of the components (discs, pads, brake fluid), as well as uneven calibration or maintenance of the system in some vehicles.
In the case of the safety brake, the efficiency is constantly lower but remains within an acceptable range for its backup function (generally above 25%, according to the minimum legislative requirements for road vehicles). It is worth noting that out of the 54 Dacia-Logan cars checked, only one was rejected for remediation, as can be seen from both the data table and the graph presented above.
It should be noted here that the maximum braking force is limited by the adhesion of the wheels to the road and, even if the braking system is in very good condition, the car cannot brake faster than the coefficient of friction between the tires and the road surface allows. When braking, the kinetic energy of the car is converted into heat (classical brakes) or partially into recovered electrical energy (regenerative brakes in hybrid cars). However, no system can convert 100% of the energy into something useful, losses through heat, mechanical and electrical resistance being inevitable.
During the PTI, brake efficiency does not refer to a physical ideal (100%), but to the ratio between the measured braking force and the weight of the car. If the car stops safely, it is considered OK even if the efficiency is not maximum. The measured efficiency may be relatively low, but acceptable, for two reasons: the wear of the components (discs, drums, pads, brake fluid) and the test conditions on the stand (the brake stand measures wheel by wheel, under artificial conditions, on rollers, with mechanical losses, pressure variations in the system, temperature differences in the pads and discs). In addition, the legislation requires that the service brake efficiency be at least 50% of the vehicle mass (for passenger cars), which means that the car brakes enough to stop within reasonable distances, even if it does not use all the available grip. So, the result is always lower than the “theoretical maximum on real asphalt”, but as long as the braking force remains above the legal limit, the car is considered safe for the road.
Therefore, the braking efficiency at PTI appears lower because it is measured under standardized conditions, on a stand, with all the losses and limitations of the real system. It is important that the value is above the minimum limit required by law, which guarantees traffic safety.
We also remember that the handbrake acts mechanically, through cables, on the drums or discs of the rear wheels and does not have servo-assistance like the main brake, being designed to keep the car immobilized (e.g., on an 18% slope), not to stop it at high speed. The cables and mechanisms wear out, internal friction appears and efficiency decreases, with the limits being much higher compared to the service brake.
Also, this paper statistically analyzes the centralized data, both in terms of the distribution of the number of cars by service brake efficiency, and in terms of the safety brake efficiency, as shown in Figure 5 and Figure 6, in which the three curves present the relative distribution of the number of cars tested in relation to brake efficiency, as well as the cumulative and inverse cumulative distributions for the frequency of cars in relation to braking efficiency.
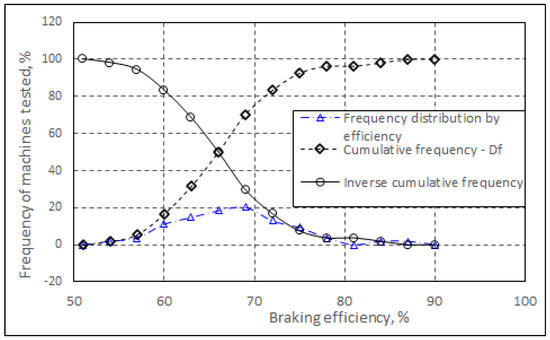
Figure 5.
Distribution of the number of cars by service brake efficiency.
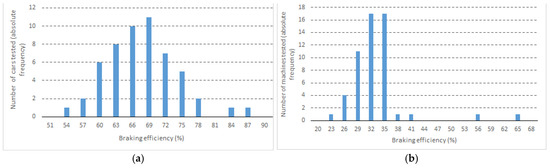
Figure 6.
Frequency distribution of tested cars according to braking efficiency. (a) Service brake; (b) emergency brake.
The non-cumulative distribution f(x) in Figure 5 (blue curve), being a probability density representation, shows where the braking efficiency values are concentrated, with most cars having a braking efficiency between ~65% and ~75%, i.e., the percentage of cars that have a certain efficiency value. The cumulative frequency (orange line) is the equivalent of the CDF (Cumulative Distribution Function) and shows the percentage of cars with efficiency less than or equal to a given value, being used to determine decision thresholds (e.g., at 70% efficiency, ~60% of cars have an efficiency less than or equal to this value). The inverse cumulative frequency (with a black line) shows the percentage of machines that have an efficiency greater than a certain value, being useful in analyzing failures or risks (for their reliability), that is, to see how much equipment exceeds a certain threshold.
Based on the frequency vs. efficiency value pairs presented for the probability density function f(x), the weighted average μ can be calculated with the following relation [19,20]:
where xi—efficiency value (%); fi—relative frequency (%).
For values presented and calculated, the standard deviation σ has the relation
and the calculated values for the two parameters are μ = 72.54% for the average braking efficiency, with a standard deviation σ = 7.56%.
For the safety brake, the graph in the figure shows a weighted average μ = 33.06% and a standard deviation σ = 4.88%, but with a coefficient of variation (VC = σ/μ) of ~14.76%. An asymmetric distribution can also be observed in which the coefficient of asymmetry is calculated with the relation [19,20,21]
This has a slightly negative value g = −0.3 (i.e., a slight left asymmetry), which may show that there are a few cars with poor braking efficiency (23%, 26%), which leads to a low average value. A peak in efficiency is observed around 32–35%, which confirms that most cars have a braking efficiency in that range.
At the same time, we also analyzed the imbalance of braking forces on the front axle for the car group tested (Figure 7a), as well as the same imbalance for the left wheel in relation to the braking force on the right wheel (Figure 7b). The same imbalance of braking forces was also analyzed for the rear axle of the car (Figure 8a,b).
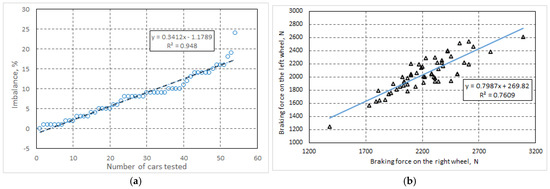
Figure 7.
Imbalance of braking force in relation to the number of cars tested (a), and that between the left wheel and the right wheel (b), for the front axle of the car.
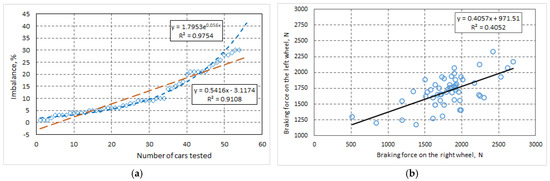
Figure 8.
Braking force imbalance in relation to the number of Dacia-Logan cars tested (a), and that between the left wheel and the right wheel (b), for the rear axle of the car.
For the group of tested cars, the imbalance of braking forces presents an upward slope, generally not exceeding the value of 20% (with very few exceptions) for the front axle and 30% for the rear axle of the car. We can say that if the number of tested cars increases, the imbalance value will fall within the same range mentioned and presented in the figure. Also at the front axle of the car, in the same group of tested cars, an imbalance was found between the braking forces on the two wheels, with a tendency for the braking force to be greater on the right wheel compared to the left wheel, and the angle made by the regression line (Figure 6b) with the horizontal axis (braking force on the right wheel) was approximately 38.5° (slope of the line approximately 0.798).
The imbalance between the two wheels is even greater at the rear axle of the car (Figure 7b), where the regression line makes an even smaller angle with the horizontal axis (same friction force on the right wheel), presenting a value of about 28.5° (remembering that a perfect balance between the two wheels presents a slope equal to unity—m = 1). If the number of machines tested increases, they will present imbalances between the minimum and maximum values presented on the graph, so we cannot say that the greater the number of machines tested, the greater the imbalance than that presented in Table 2 or in Figure 7a,b and Figure 8a,b. The legislation requires that the difference between wheels on the same axle be less than 30%, usually 0–20% with properly maintained brakes, and average values of 10–15% (typical).
However, there is a relatively larger spread of the values of the braking force imbalance between the two wheels on the same axle (the R2 coefficient has very low values), which may lead us to the hypothesis that the adjustments on the two wheels for the brake pads and the components related to the pressure on the friction disc were not properly made, or the pads were worn differently on the left compared to the right. This may also be due to the uneven distribution of the car’s weight on the two axles (front–rear) but also on the two sides (left–right), as shown in the charts from Figure 9.
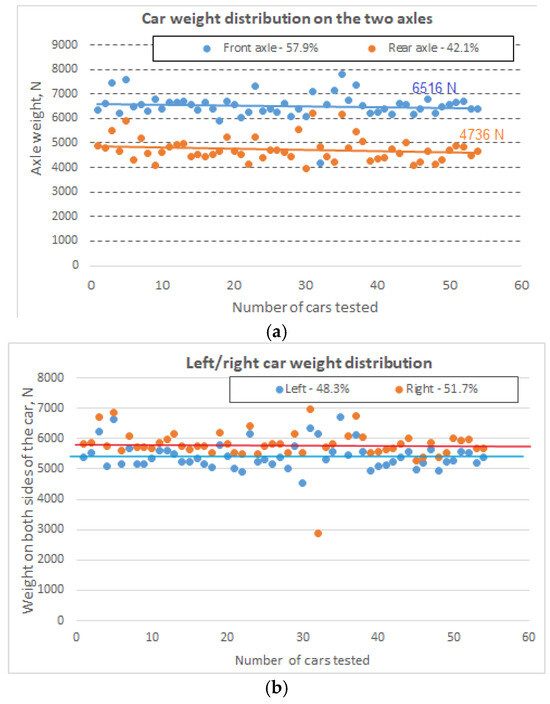
Figure 9.
Weight distribution of the cars on the two front–rear axles (a) and on the two sides (b), for the Dacia-Logan cars tested.
Regarding the correlation between the braking force in relation to the weight on the two axles of the car, the data in Table 2 (processed) and Figure 10a show a relatively significant grouping of the experimental points, i.e., lower values for the rear axle (which would be normal, because the engine and the main mechanisms of the car are on the front) in relation to the front axle, i.e., for an average value of the weight on the rear axle of about 4600 N, the braking force on the same axle is about 3500 N, while for a weight of about 6500 N on the front axle, the average braking force on the same axle is about 4300 N.
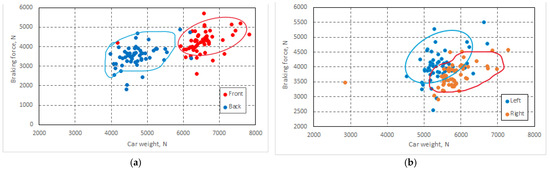
Figure 10.
Distribution of braking force in relation to the weight of the car on the two axles (a), and with the weight on the sides (b), for the Dacia-Logan cars tested.
For a correlation between the braking force relative to the weight of the car on the sides (Figure 9b), here we find an overlap between the values for the left side and those for the right side (again with slightly higher weights for the right side, but with relatively lower braking forces). The average weight–braking force pairs, as shown in Figure 9b, but also the data in Table 1 (processed), fall between 4000 N and 5300 N for the left side, and between 3800 N and 5700 N for the right side.
For the theoretical analysis of the efficiency of the two braking systems, the distributions of the values, both relative and cumulative, were graphically represented, as shown in the charts from Figure 11a,b, after the data had been previously processed for such an analysis. The analysis was performed in the MicroCall OriginPro program, vers. 7 [22,23]. For the relative distribution of the percentage of cars by efficiency values, the Gauss model was used [22], which has the relationship presented below (8), and for the cumulative distribution, the Boltzmann model was used with the relationship shown in (9), as presented by the Microcall Origin program:
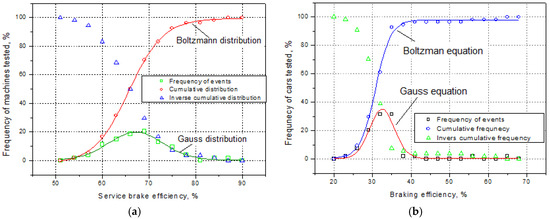
Figure 11.
Frequency distribution of tested machines according to the efficiency value of the braking systems: (a) for the service brake; (b) for the safety brake.
- -
- Gaussian distribution:
- -
- Boltzmann distribution:
The parameters (coefficients) of the relationships used in the regression analysis, provided by the analysis program, are presented in a table for the two braking systems (Table 3). The regression analysis performed on the data collected on the braking systems of passenger cars shows that the Boltzmann model used to describe the cumulative percentage of cars is useful for understanding the general distribution of efficiency, while the Gaussian model shows the relative frequency of braking performance around a central value. Thus, for the service brake, the Boltzmann and Gaussian analysis models present an excellent fit, indicating a coherent cumulative distribution and a reasonable probability density, while for the safety brake, the Gaussian distribution has a significantly poorer fit, indicating a more dispersed or less symmetrical distribution (even though the values of the R2 determination coefficient are excellent).
Table 3.
Regression analysis parameters for the two Dacia-Logan braking systems.
Using the same type of analysis for the frequency distribution of the tested machines after the imbalance presented by the service brake for the wheels on the front axle and the rear axle, respectively, the charts from Figure 12a,b also show a good correlation of the cumulative frequency data when using the Boltzmann distribution (the coefficient of determination R2 having values above 0.996), while for the relative frequency, the Gaussian distribution shows a lower degree of correlation (R2 > 0.83) (see Table 4).
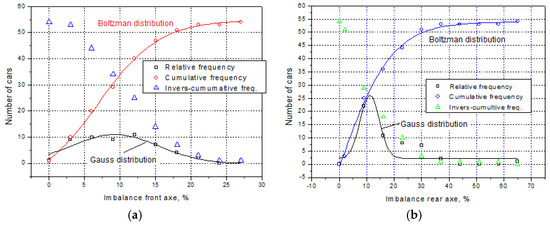
Figure 12.
Frequency distribution of the tested machines in relation to the service brake imbalance, for the front axle (a) and the rear axle (b).
Table 4.
Regression analysis parameters for the braking force imbalance for the front–rear axles of Dacia-Logan cars.
As a conclusion, the cumulative distribution (Boltzmann) provides a much more precise description of the behavior of the two braking systems, while the Gaussian distribution is useful for understanding local variations, but does not capture the global character of the data as well (especially in the presence of asymmetric or flat distributions) and departs from the classical Gaussian form, especially for the safety brake. The higher values of the χ2 test, in the case of the Gaussian model, confirm a discrepancy between the real data and the theoretical distribution, especially in the presence of significant deviations from symmetry.
As recommendations, for the global evaluation of the braking performance of a series of cars, the use of the Boltzmann model is recommended, due to its high stability and fidelity in representing the cumulative behavior, and the Gaussian model can be used complementarily to detect non-uniformities in the distribution of values.
Values of χ2 below 1 indicate an excellent fit of the analyzed data with the theoretical model, values between 1 and 5 suggest an acceptable fit, but with possible local deviations, and values above 5 (e.g., 7.441) indicate that the model does not fit the data well and that the real distribution is probably asymmetric or multi-modal, as in the analyzed case.
We can appreciate that the Boltzmann and Gaussian distributions are often used in physics/statistics to model the probability of a system being in a certain state (applied analogously here to the efficiency of braking systems), as well as in quality control, identifying deviations from normal performance, defining periodic technical inspection (PTI) standards, optimizing brake design (depending on the real efficiency distribution), risk management (by establishing a minimum threshold below which the system is considered unsafe), and preventive maintenance planning.
These curves can also be used to identify deviations in the manufacturing process, with designers and process engineers being able to intervene to establish tighter tolerances or choose better materials, but also to determine the minimum safety threshold. The curves can also be used to optimize production costs, but also to make decisions regarding inspection and maintenance.
From the data presented in tables, it is found that the parameters of the distribution equations present smaller or larger ± deviations. These deviations indicate the degree of confidence in the estimation of the parameters, and it is obvious that the smaller the deviation, the more robust and reliable the model is, with the parameters being estimated with greater precision for the Boltzmann model compared to the Gauss model.
4. Conclusions
The braking system of Dacia-Logan cars has two components—the service brake and the parking (safety) brake. Many scholars in the field state that the closer the deadline for periodic technical inspections of vehicles, the more accidents are possible due to the efficiency of the braking system beginning to decrease, which has led the authorities to impose this type of testing.
For Dacia-Logan cars, as presented in our work, the braking systems presented the following characteristics when performing PTI tests:
- -
- The braking forces for the service brake fall within the value ranges of 1380–3090 N and 1240–2610 N for the left and right wheels on the front axle, respectively. On the rear axle, the values fall within 510–2700 N and 1180–2330 N for the left and right wheels, respectively. The average values are 2210–2020 N on the front axle, and 1850–1715 N on the rear axle (due to the large imbalance, the car that presented a braking force of 510 N on the left-rear wheel with 1300 N on the right-rear wheel was rejected at the ITP inspection—it also had a low efficiency below the limit).
- -
- For the parking brake, the braking forces presented values within the limits of 420–2290 N (average value 1435 N) for the left wheel, and between 840 and 1760 N (average value 1360 N) for the right wheel.
- -
- The imbalance in the braking forces at the service brake presented values between 6 and 24% (with an average value of 8%) for the front axle of the car, and between 1 and 61% (with an average value of 9%) for the rear axle (the car with an imbalance of 61% was rejected at the PTI check). For the parking brake, the average value of the imbalance between the two rear wheels was about 13.5% (with a minimum of 1% and a maximum of 76%, the latter presenting braking forces of 420 N and 1760 N, respectively, for the two left–right wheels at the parking brake).
- -
- The efficiency presented during the PTI verification ranged between 54 and 87% (average value 68.5%) for the service brake, and between 23 and 67% (average value 34%) for the safety brake, with only one machine being rejected for efficiency values of 54% for the service brake and 23% for the safety brake.
It was shown that for the service brake and safety brake, the frequency distribution of the tested machines, according to the value of the braking system efficiency, follows Gaussian-type distributions for the relative frequency in relation to the braking efficiency, and Boltzmann-type distributions for the cumulative frequency of the tested machines. The same type of distribution also follows the values of the imbalances for the service brake and for the safety brake, respectively.
Even though some machines showed large differences between the braking forces on the two axles (front–rear) and on the sides (left–right), they fell within the limits provided by the regulations in force, so that only one machine was rejected during the PTI verification, requiring a repair of the braking system failures.
The results presented in this paper can be used by designers and process engineers to establish tighter tolerances or choose better materials in the manufacture of braking systems, but also to determine the minimum safety threshold on public roads, as well as to optimize production costs and make decisions regarding inspection and maintenance.
Supplementary Materials
The following supporting information can be downloaded at: https://www.mdpi.com/article/10.3390/machines13100896/s1.
Author Contributions
Conceptualization, G.V. and C.A.; methodology, G.V., C.A. and I.S.; software, G.V., G.-A.C., and P.T.; validation, G.V., I.S. and G.I.; formal analysis, C.A., S.-D.I., and G.-A.C.; investigation, C.A. and S.-D.I.; resources, C.A., S.-D.I., and P.T.; data curation, G.V.; writing—original draft preparation, G.V. and P.T.; writing—review and editing, G.V. and G.-A.C.; visualization, G.I. and I.S.; supervision, G.V.; project administration, G.V.; funding acquisition, C.A. and S.-D.I. All authors have read and agreed to the published version of the manuscript.
Funding
This research received no external funding.
Data Availability Statement
The data presented in this study are available on request from the corresponding author.
Conflicts of Interest
The authors declare no conflicts of interest.
References
- ISO 611:2017; Road Vehicles—Braking of Automotive Vehicles and Their Trailers—Vocabulary. ISO: Geneva, Switzerland, 2017. Available online: https://www.iso.org/obp/ui/#iso:std:iso:611:ed-4:v1:en (accessed on 12 February 2025).
- Post, W. Car braking-system components. In Brakes, Brake Control and Driver Assistance Systems; Springer: Wiesbaden, Germany, 2014. [Google Scholar]
- Aleksandrowicz, P. The impact of a vehicle braking system state on safe driving—part one. MATEC Web Conf. 2018, 182, 01025. [Google Scholar] [CrossRef]
- Xu, Z. Talking about the Automobile Braking System. IOP Conf. Ser. Mater. Sci. Eng. 2017, 274, 012141. [Google Scholar] [CrossRef]
- Diwakar, L.B.; Diwakar, S.L.; Deshpande, V.V. Design and selection of the braking system for all terrain vehicle. Int. J. Eng. Res. Technol. (IJERT) 2020, 9. [Google Scholar] [CrossRef]
- El-Garhy, A.M.; El-Sheikh, G.A.; El-Saify, M.H. Fuzzy life-extending control of anti-lock braking system. Ain Shams Eng. J. 2013, 4, 735–751. [Google Scholar] [CrossRef]
- Hibatullah, N.A.; Subardjah, A.M. Numerical Simulation of Designing a Braking System by Comparing Pressure in Minibus Type Vehicle. INVOTEK J. Inov. Vokasional Dan Teknol. 2023, 22, 169–178. [Google Scholar] [CrossRef]
- Melendez-Useros, M.; Jimenez-Salas, M.; Viadero-Monasterio, F.; Lopez Boada, M.J. Tire Slip H∞ control for optimal braking de-pending on road condition. Sensors 2023, 23, 1417. [Google Scholar] [CrossRef] [PubMed]
- Cristescu, A.-C.; Ilie, F. A way to determine the car braking system efficiency in correlation with the travel speed, the time, and distance of braking. Acta Tech. Corviniensis—Bull. Eng. 2023, XVI, 4. Available online: https://acta.fih.upt.ro/pdf/2023-4/ACTA-2023-4-08.pdf (accessed on 15 July 2025).
- Waskito, D.H.; Ansori, I.; Mutharuddin, M.; Irawati, N.; Nugroho, S.; Sulastry, T.; Subaryata, S.; Siregar, N.A.M. enhancing brake system evaluation in periodic testing of goods transport vehicles through FTA-FMEA risk analysis. Automot. Exp. 2023, 6, 320–335. [Google Scholar] [CrossRef]
- Jarosinski, W. Periodic technical inspections of vehicles and road traffic safety with the number of road accidents involving fatalities. Eksploat. I Niezawodn.—Maint. Reliab. 2014, 16, 105–111. [Google Scholar]
- Brake Testing in Periodic Technical Inspection. Recommendation N 8, CITA/WG1-09-2017-110. 2018. Available online: https://citainsp.org/wp-content/uploads/2017/10/CITA_Recommendation_8_brakes.pdf (accessed on 12 February 2025).
- Gajek, A. Directions for the development of periodic technical inspection for motor vehicles safety systems. Arch. Automot. Eng.—Arch. Motoryz. 2018, 80, 37–51. [Google Scholar] [CrossRef]
- Hudec, J.; Sarkan, B. Effect of periodic technical inspections of vehicles on traffic accidents in the Slovak Republic. Commun.—Sci. Lett. Univ. Zilina 2022, 24, A142–A159. [Google Scholar] [CrossRef]
- Kozuch, P.; Hujo, L.; Muslewski, L.; Markiewicz-Patalon, M. Dynamic and stationary testing of vehicle braking systems. Acta Technol. Agric. 2023, 26, 238–243. [Google Scholar] [CrossRef]
- Firdaus, R.M.; Supriyo, B.; Suharjono, A. Analysis of braking force efficiency measurements for various braking strategy applied for vehicle tested on roller brake tester. J. Phys. Conf. Ser. 2020, 1517, 012079. [Google Scholar] [CrossRef]
- Tretsiak, D. Experimental investigation of the brake system’s efficiency for commercial vehicles equipped with disc brakes. Proc. Inst. Mech. Eng. Part D J. Automob. Eng. 2011, 226, 725–739. [Google Scholar] [CrossRef]
- Dascalescu, D. Dynamics of Road Vehicles; Politehnium Publishing House: Iasi, Romania, 2008; p. 264. (In Romanian) [Google Scholar]
- Trimbitas, R. Classical Probability Distributions, Main Laws of Probability. 2012. Available online: https://math.ubbcluj.ro/~tradu/geologi/dprobclasice_article.pdf (accessed on 15 July 2025). (In Romanian).
- Statistics—Standard Deviation. Available online: https://www.w3schools.com/statistics/statistics_standard_deviation.php (accessed on 25 June 2025).
- National Institute of Standards and Technology. EDA: Exploratory Data Analysis. Measures of Skewness and Kurtosis, Engineering Statistics. Available online: https://www.itl.nist.gov/div898/handbook/eda/section3/eda35b.htm (accessed on 10 July 2025).
- Brereton, R.G. The Normal Distribution. J. Chemom. Columnist 2014, 28, 789–792. [Google Scholar] [CrossRef]
- OriginLab Corporation. Available online: https://www.originlab.com/index.aspx?go=Support/ServiceReleases&pid=475 (accessed on 17 April 2025).


Disclaimer/Publisher’s Note: The statements, opinions and data contained in all publications are solely those of the individual author(s) and contributor(s) and not of MDPI and/or the editor(s). MDPI and/or the editor(s) disclaim responsibility for any injury to people or property resulting from any ideas, methods, instructions or products referred to in the content. |
© 2025 by the authors. Licensee MDPI, Basel, Switzerland. This article is an open access article distributed under the terms and conditions of the Creative Commons Attribution (CC BY) license (https://creativecommons.org/licenses/by/4.0/).