Article

Performance Analysis of a Waste-Gated Turbine for Automotive Engines: An Experimental and Numerical Study

Department of Mechanical, Energy, Management and Transportation Engineering, University of Genoa, 16145 Genoa, Italy
*
Author to whom correspondence should be addressed.
Machines 2025, 13(1), 54; https://doi.org/10.3390/machines13010054
Submission received: 2 December 2024 / Revised: 30 December 2024 / Accepted: 30 December 2024 / Published: 13 January 2025

Abstract

:
In this article, the results of an experimental investigation and a 1D modeling activity on the steady-state performance of a wastegated turbocharger turbine for spark ignition engines are presented. An experimental campaign to analyze the turbine performance for different waste-gate valve openings was conducted at the test bench for components of propulsion systems of the University of Genoa. Thanks to the experimental activity, a 1D model is developed to assess the interaction between the flow through the impeller and the by-pass port. Advanced modeling techniques are crucial for improving the assessment of turbocharger turbines performance and, consequently, enhancing the engine–turbocharger matching calculation. The initial tuning of the model is based on turbine characteristic maps obtained with the by-pass port kept closed. The study then highlights the waste-gate valve behavior considering its different openings. It was found that a more refined model is necessary to accurately define the mass flow rate through the waste-gate valve. After independently tuning the 1D models of the turbine and the waste-gate valve, their behavior is analyzed in parallel-flow conditions. The results highlight significant interactions between the two components that must be taken into account to reduce inaccuracies in the engine-turbocharger matching calculation. These interactions lead to a reduced swallowing capacity of the turbine impeller. This reduction has an impact on the power delivered to the compressor, the boost pressure, and, consequently, the engine backpressure. The results suggest that methods generally adopted that consider the by-pass valve and the turbine as two nozzles working in parallel under the same thermodynamic condition could be insufficient to accurately assess the turbocharger behavior.

1. Introduction

The automotive industry is faced with a major challenge in reducing emissions. The European Union (EU) aims to achieve net-zero greenhouse gas emissions by 2050 through the Green Deal program. Notably, the legislation sets even stricter targets for the transport sector, mandating that all new cars and light commercial vehicles must achieve zero CO2 tailpipe emissions by 2035 [1]. Interim targets require a 55% reduction in emissions from cars and a 50% reduction from heavy vehicles by 2030, relative to 1990 levels [2,3,4]. Currently, the focus is on implementing the Euro 7 standard, which imposes even stricter limits than previous regulations [5]. To ensure compliance with this standard, extensive research is being conducted on engine geometries and materials, new technologies for measuring and controlling pollutant concentrations, and the development of innovative fuels [6,7,8,9,10].
To meet these stringent targets, the engine performance has to be optimized over a wide operating range. To achieve these results a correct matching between the internal combustion engine and the turbocharging system is crucial since it involves parameters such as low-end torque, pumping losses, and fuel consumption [11]. The correct selection of the boosting system must consider several factors, and it is often a matter of compromise. The size of the turbine and compressor is closely related to the operating conditions of the engine where performance and fuel consumption are to be optimized [12,13]. Additionally, it has a significant impact on the engine’s transient performance and, consequently, on the vehicle’s drivability [14,15,16].
Furthermore, it is important to consider both the operational simplicity and the cost associated with the turbine regulating system. An improvement in the management strategy of the turbocharger regulating device can significantly refine the engine performance and help to reduce emissions and fuel consumption [17,18]. This refinement process requires a control strategy to prevent over-boost and over-speed conditions, as well as to manage the engine torque at acceptable values [19].
The waste-gate valve is the simplest method for controlling boost pressure level, and many authors studied in detail its impact on turbocharger performance. In [20], an experimental investigation was developed by Capobianco and Marelli to measure the swallowing capacity of the turbine impeller and by-pass port, highlighting an interaction between each flow component. In [21], an experimental methodology was developed by Serrano et al. to characterize the discharge coefficient of a waste-gate valve to be fitted into 1D gas dynamic codes. To achieve these results, the turbocharger was tested at the gas stand under steady flow conditions at different valve positions and high turbine inlet temperatures. Another experimental study was presented by Capobianco and Marelli in [22] to analyze the effects of pulsating flow on a turbocharger turbine with a waste-gate valve in open position. In particular, the instantaneous mass flow rate factor and the total-to-static efficiency define hysteresis loops surrounding the steady-state curve, the size of which increases when the waste-gate valve is open. The opening of the waste-gate increased flow unsteadiness, and the filling and emptying effects in the circuit. Instead, a modeling approach was used by Deng et al. [23] to study the impact of pulsating flow on a wastegated turbine. The turbine was modeled using a dual-orifice approach, a lumped capacitance heat transfer model, and a novel pneumatic actuator mechanism model, all validated against experimental data. The study revealed that at frequencies above 100 Hz, the mass flow parameter showed significant dynamic behavior, making the quasi-steady assumption invalid. The waste-gate actuator system exhibited quasi-steady behavior below 10 Hz, while the turbine’s mechanical inertia dampened shaft speed fluctuations between 0.1 and 10 Hz. Additionally, the turbocharger housing’s thermal inertia suppressed temperature variations at frequencies above 0.01 Hz.
Other authors instead considered the impact of different waste-gate openings on engine performance and emissions. For example, the impact of the waste-gate openings on the soot emission of a diesel engine was experimentally evaluated by Ghazikhani et al. [24]. They found that by reducing the by-pass port opening, the intake manifold pressure increases, which improves soot emissions by enhancing soot burnout during late combustion. However, at very high-pressure levels, soot emissions rise due to lower in-cylinder gas temperatures at the end of combustion. The impact of the waste-gate on the performance and NOx emissions of a CNG SI engine was experimentally analyzed by Kharazmi et al. [25]. The study highlights that at lower engine speeds, low boost pressure is due to inefficient compressor and turbine performance, which wastegated turbochargers help to mitigate. At mid-range speeds, waste-gate openings stabilize boost pressure by lowering exhaust manifold pressure, reducing residual gases, and increasing volumetric efficiency.
In recent years, the need for accurate simulation models has consistently increased. Within this context, the availability of simulation models capable of precisely evaluating the performance of a turbocharger turbine is a crucial aspect for determining its power output, which directly impacts both engine intake pressure and backpressure [26]. Usually in 0D/1D models for turbocharged engines, the turbine and the compressor are modeled only with reference to the characteristic curves provided by the manufacturer. In the case of turbines with a waste-gate valve, the data available are referred to the position of the by-pass port fully closed [27]. Moreover, commercial software often estimates the waste-gate valve mass flow rate using an expansion through an orifice, with an equivalent diameter based on the turbine pressure ratio. This approach assumes that the by-pass port and the rotor work as parallel nozzles, sharing the same pressure ratio [28]. However, this assumption leads to inaccuracies when the waste-gate valve is open, resulting in unreliable predictions of the engine pumping losses, which affects the engine performance estimation [29,30].
In this paper, a 1D model of a wastegated turbine that considers the interaction between the waste-gate flow and the impeller flow is described. In particular, an experimental characterization of a turbocharger turbine characterized by a waste-gate valve fully integrated into the volute is presented in the first Section. The experimental tests were conducted at the University of Genoa’s test rig under steady-state conditions, with various waste-gate valve opening positions. In addition, the mass flow rate of the waste-gate valve was assessed by closing the rotor circuit. This approach revealed a significant difference in swallowing capacity in parallel-flow operation, where both the impeller and by-pass circuit operate simultaneously, and in single-flow operation calculated by summing the individually measured flows in each channel. Then, the experimental layout was modeled in the GT-Power Environment. Each section of the turbine was specifically modeled, taking into account its precise geometrical dimensions. Additionally, the 1D model incorporates the performance maps of the turbine, which were experimentally assessed. The waste-gate valve is modeled as an orifice whose equivalent diameter varies with the valve opening based on the experimental results. After modeling and validating the turbine and waste-gate behavior in single-flow operation, parallel-flow operation is studied, and the 1D model results are compared to the experimental ones both in terms of mass flow rates and efficiencies. Finally, the flow distribution between the rotor and the waste-gate channel is analyzed to assess the deviation from a standard approach. In particular, it is found that at high waste-gate openings, the interaction between the two flows leads to a significant reduction in the impeller channel swallowing capacity that must be taken into account to make the calculation more accurate. The work presented in this article is partially based on a previous study [31] performed by the authors on the same turbocharger. The present work provides a comprehensive analysis, examining a wider operating range and, most importantly, modeling in detail both the mechanical losses of the turbocharger and the isentropic efficiency of the turbine. Additionally, it focuses more in detail on the accurate modeling of the internal geometries of the turbine volute to properly simulate the loss contributions (friction and mixing losses) responsible for the reduction in the turbine performance with the by-pass port open.

2. Experimental Activity

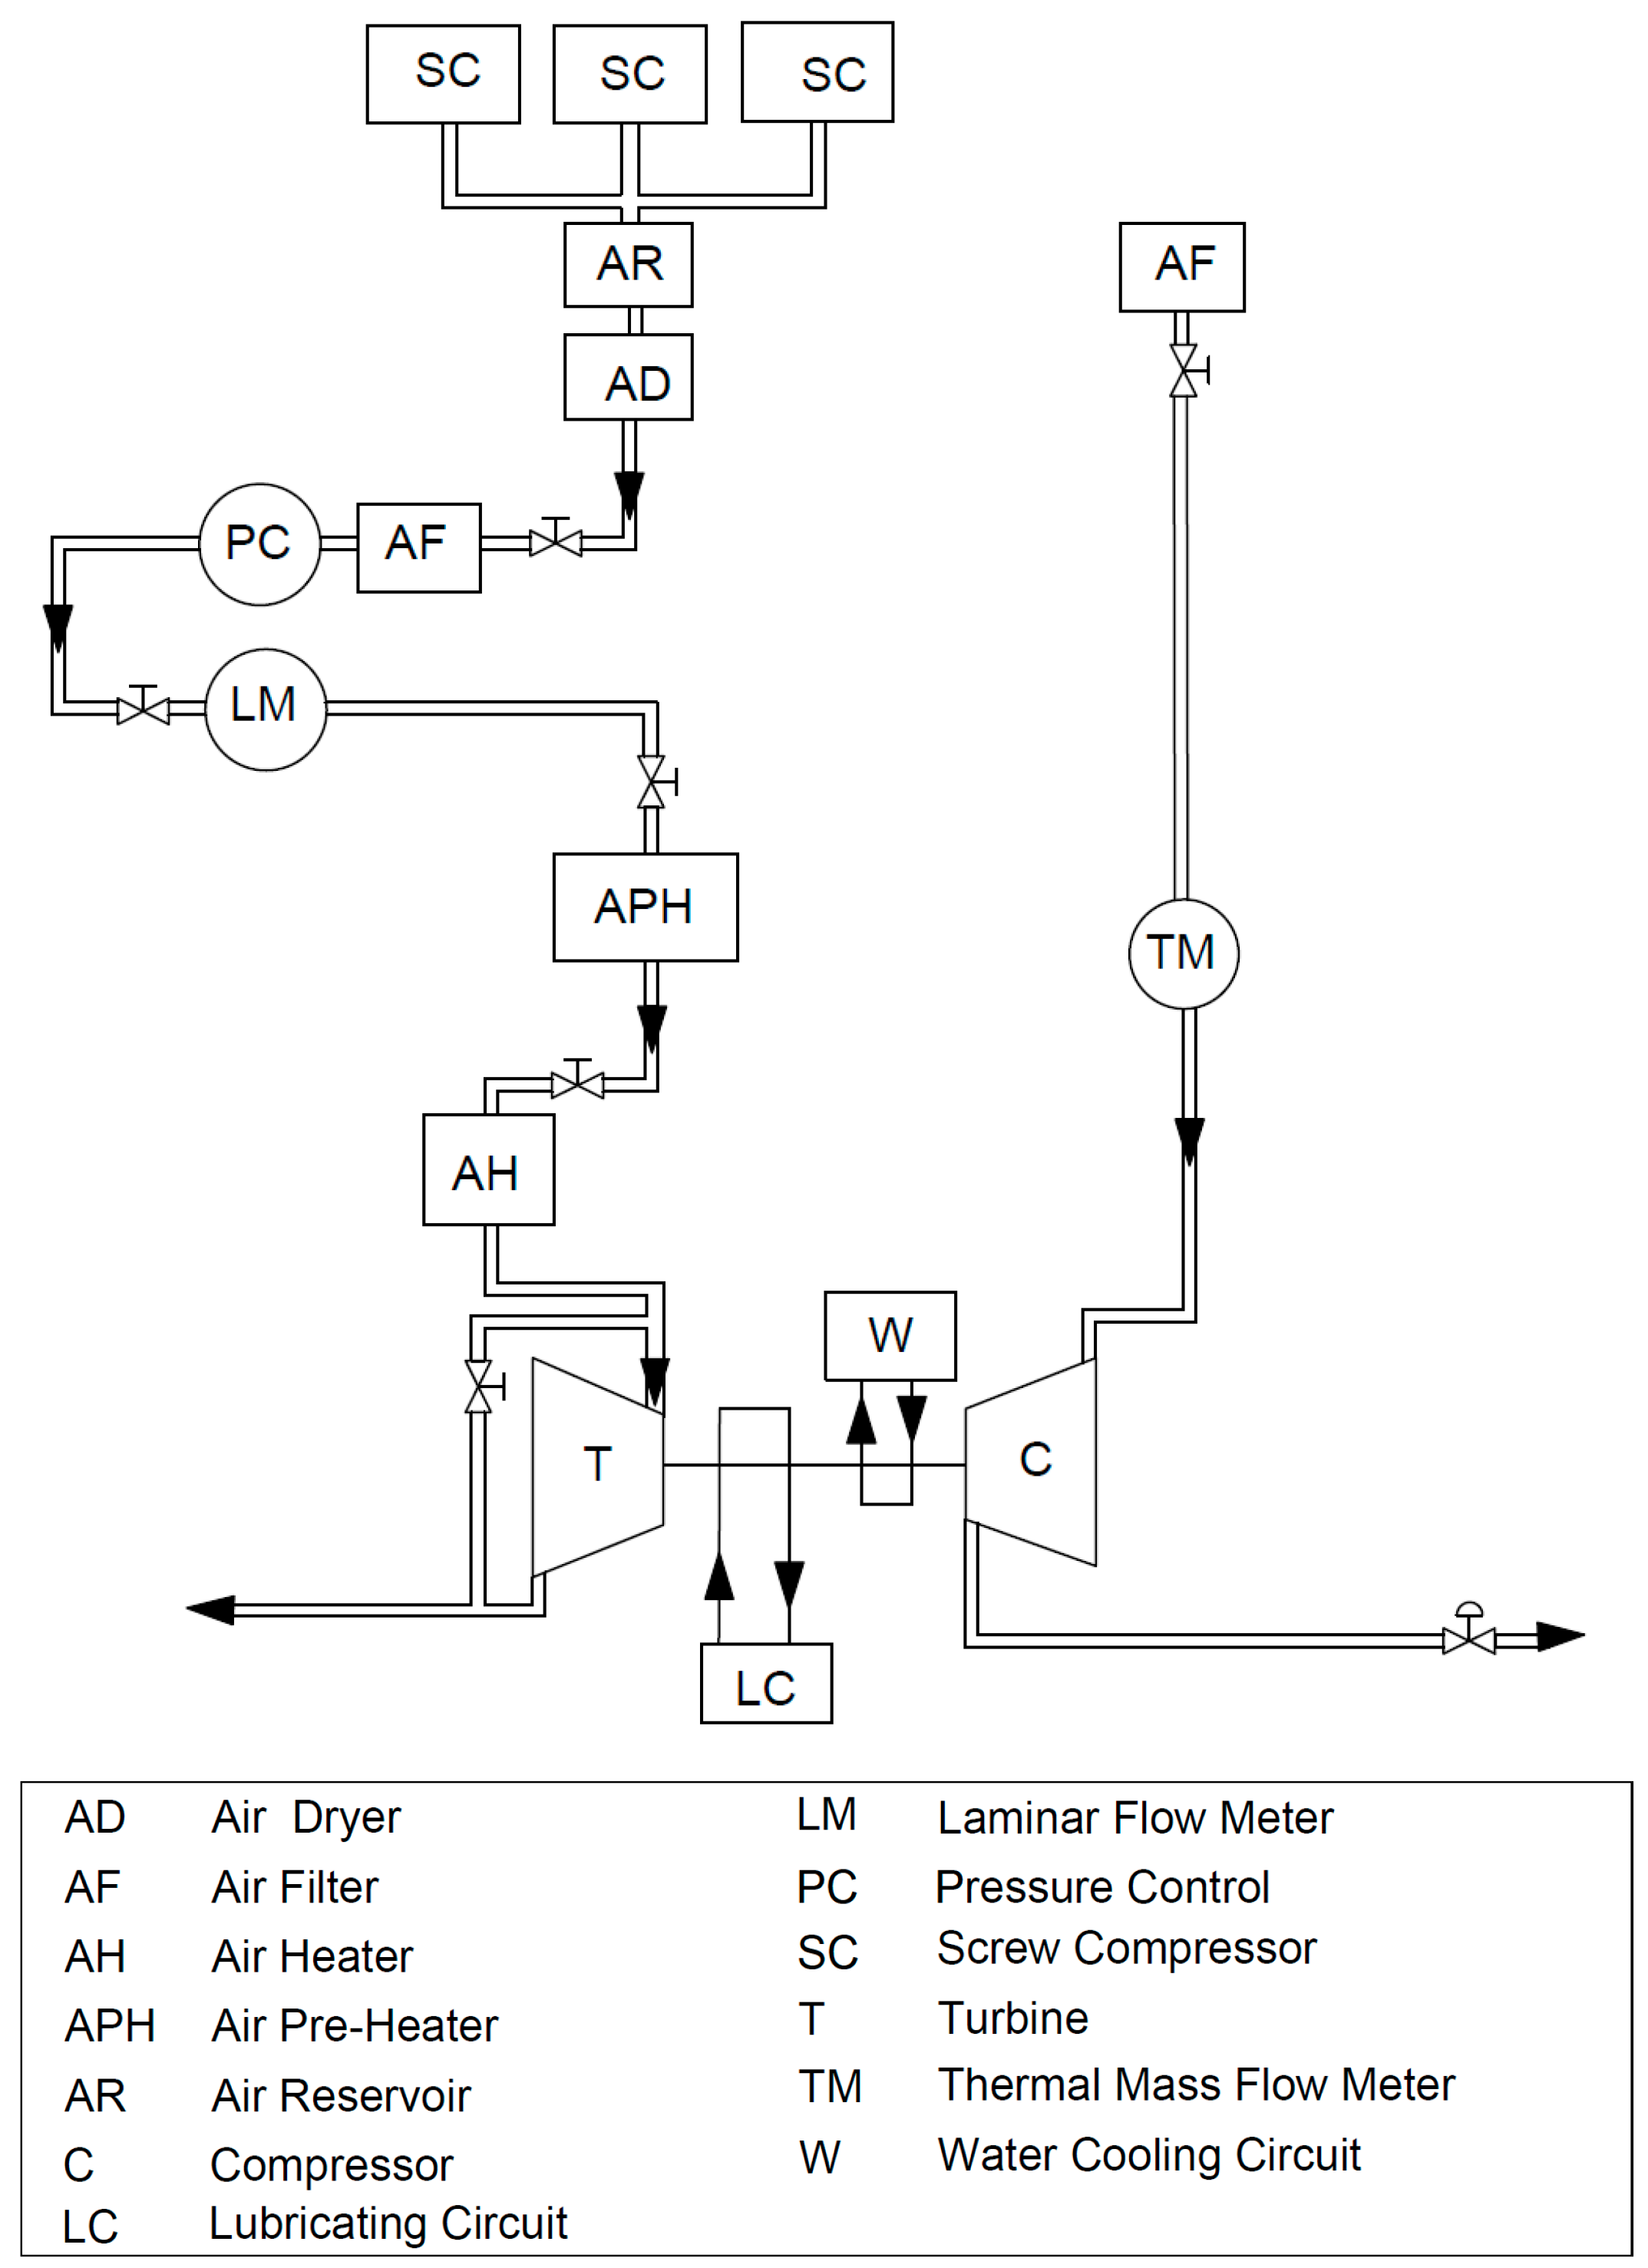
2.1. Test Bench Setup and Measuring Equipment

The experimental activity presented in this article was conducted on a wastegated turbocharger turbine for spark ignition engines at the test facility for components of propulsion systems of the University of Genoa (observable in Figure 1 and fully described in [32]). Given its importance for this research, the waste-gate valve channel has been schematized as a circuit operating in parallel with the turbine. It is important to note that this component is, in reality, highly integrated into the turbine volute. Consequently, the assessment of the flow rate should consider the overall mass flow rate of the turbocharger turbine, accounting for the contributions of both the rotor and the waste-gate valve channels. The test rig is equipped with two separate lines for compressor and turbine characterized by a maximum air mass flow rate of 0.8 kg/s, and an electric heater station enables turbine inlet temperatures to reach up to 600 °C depending on the tested turbine size. Furthermore, a thermostatic system ensures accurate control of temperatures, pressures, and flow rates of lubricating oil and cooling water.
Fluid temperatures are measured using platinum resistance thermometers or K-type thermocouples. Pressure measurements are performed with piezoresistive probes. The mass flow rate in the compressor circuit is measured by a thermal mass flow meter, while in the turbine line a laminar flow meter, calibrated against the thermal mass flow meter, is used. The rotational speed of the turbocharger is detected by an eddy current probe. The waste-gate valve position is monitored by a sealed rotary position sensor. The uncertainties of the adopted sensors are reported in Table 1.

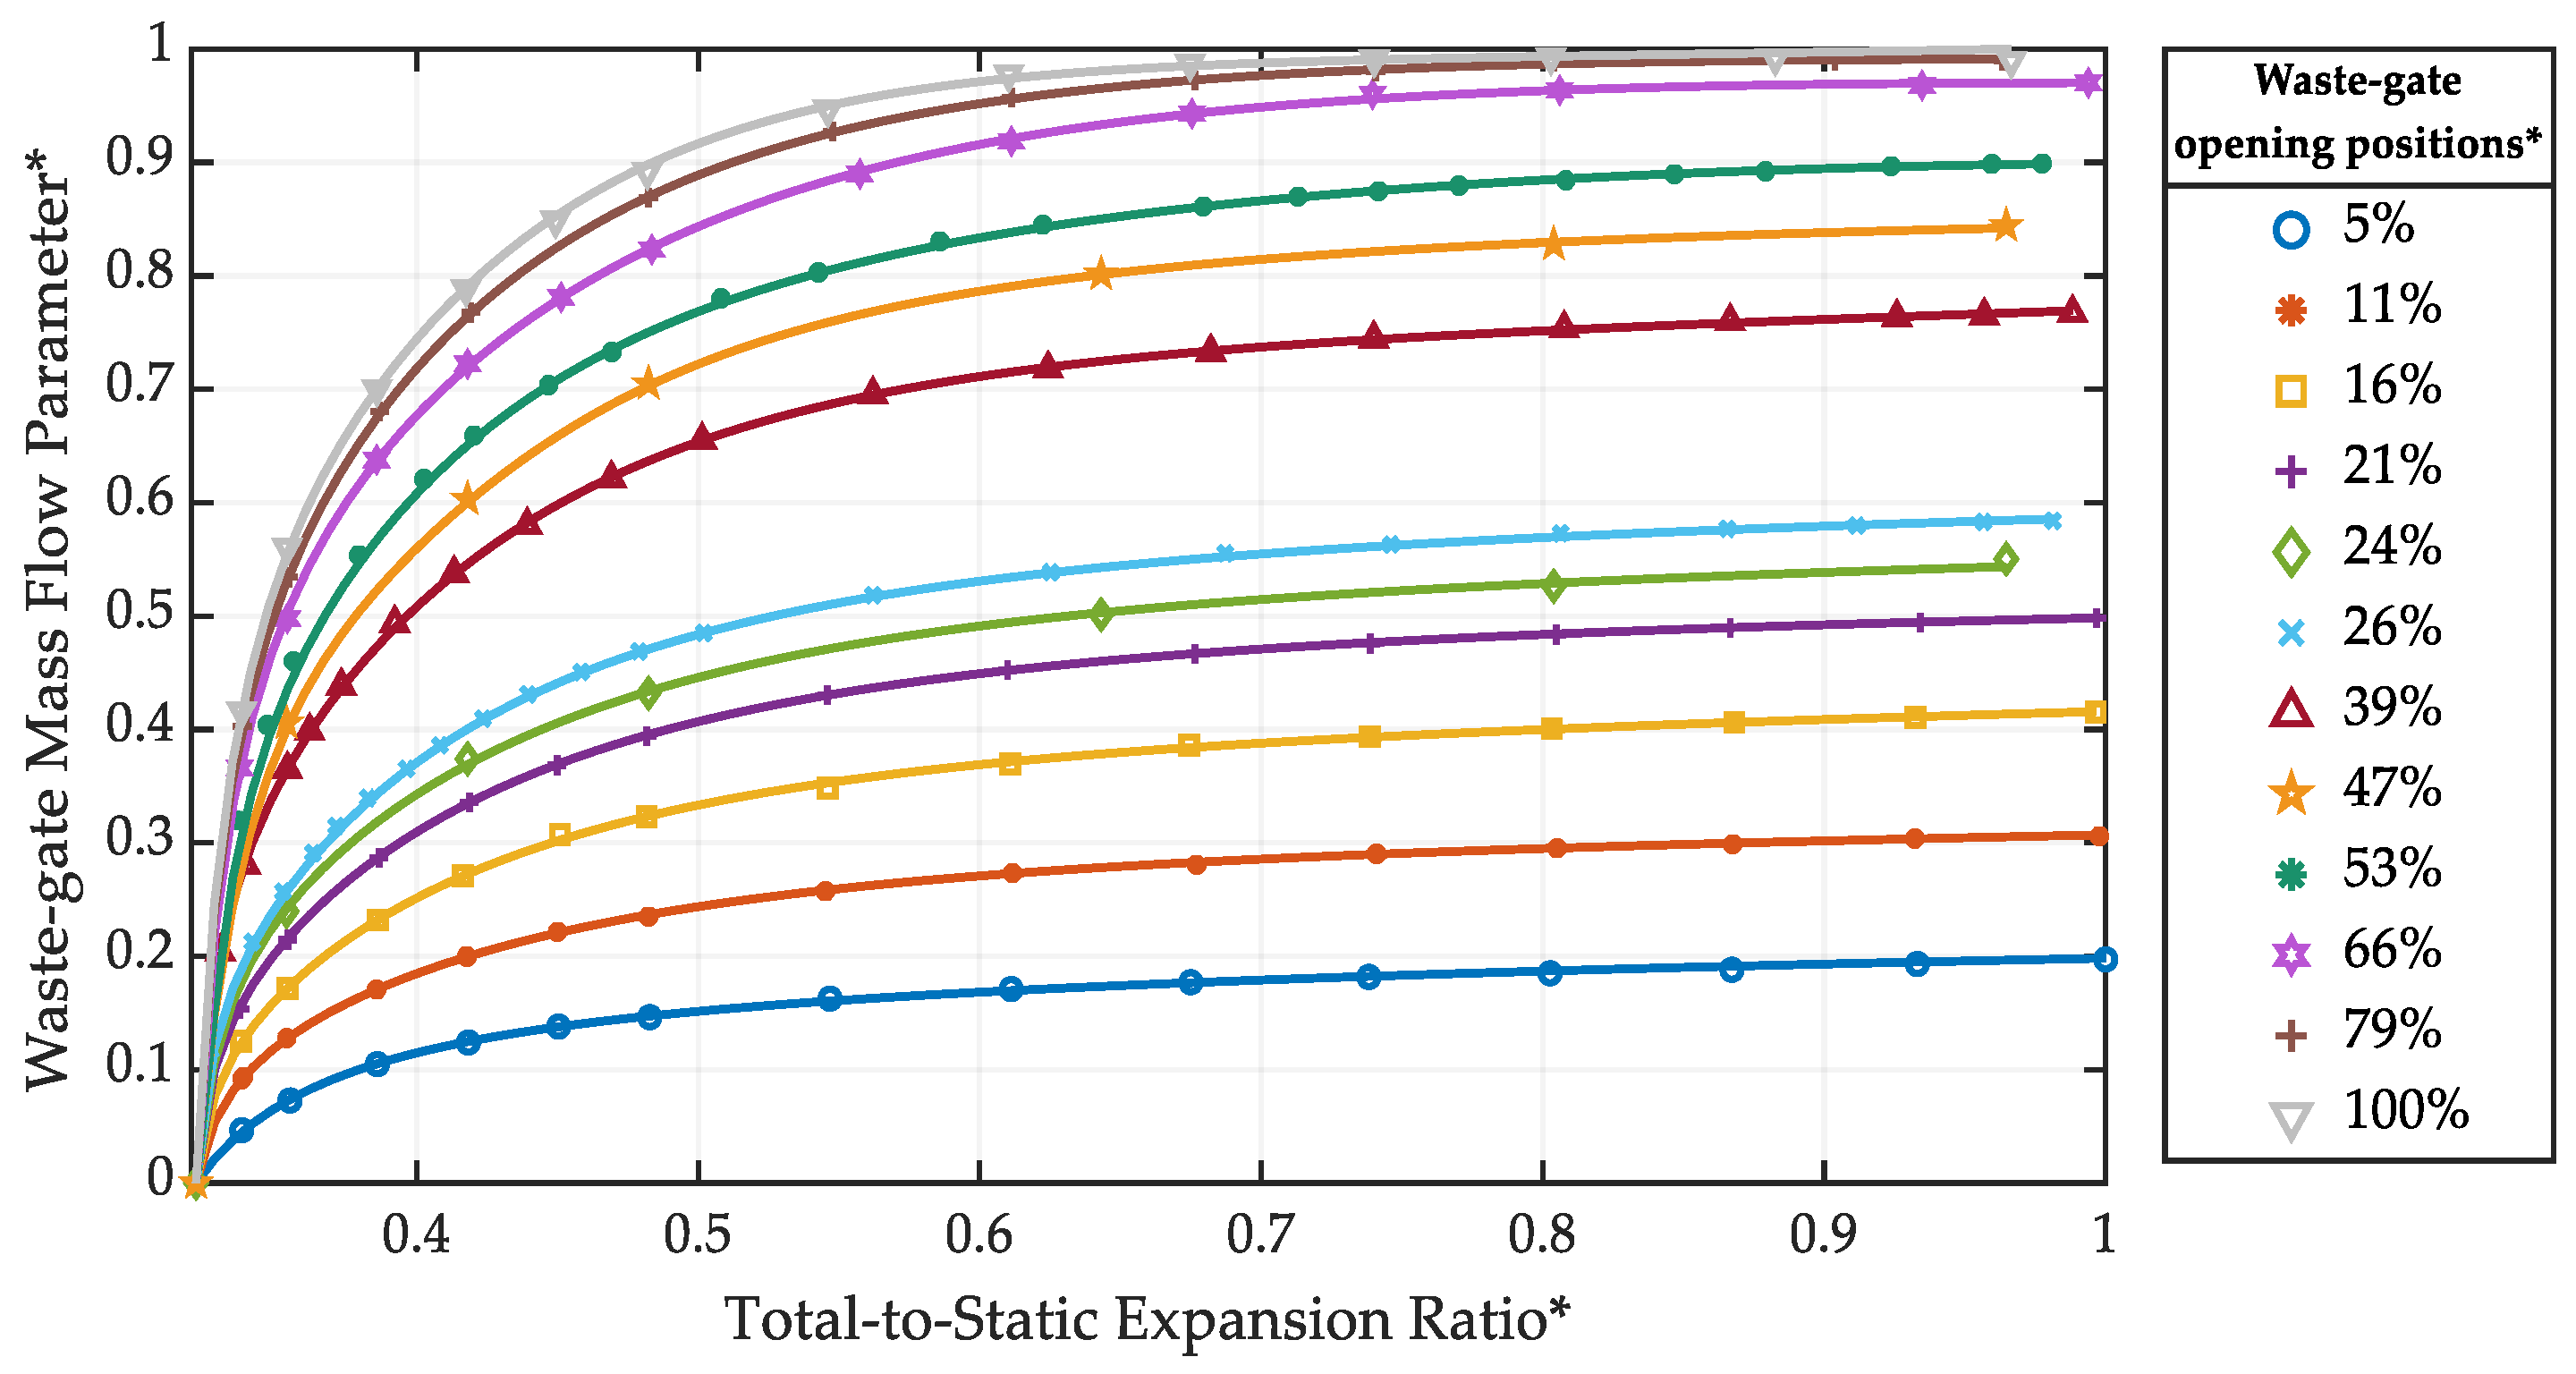
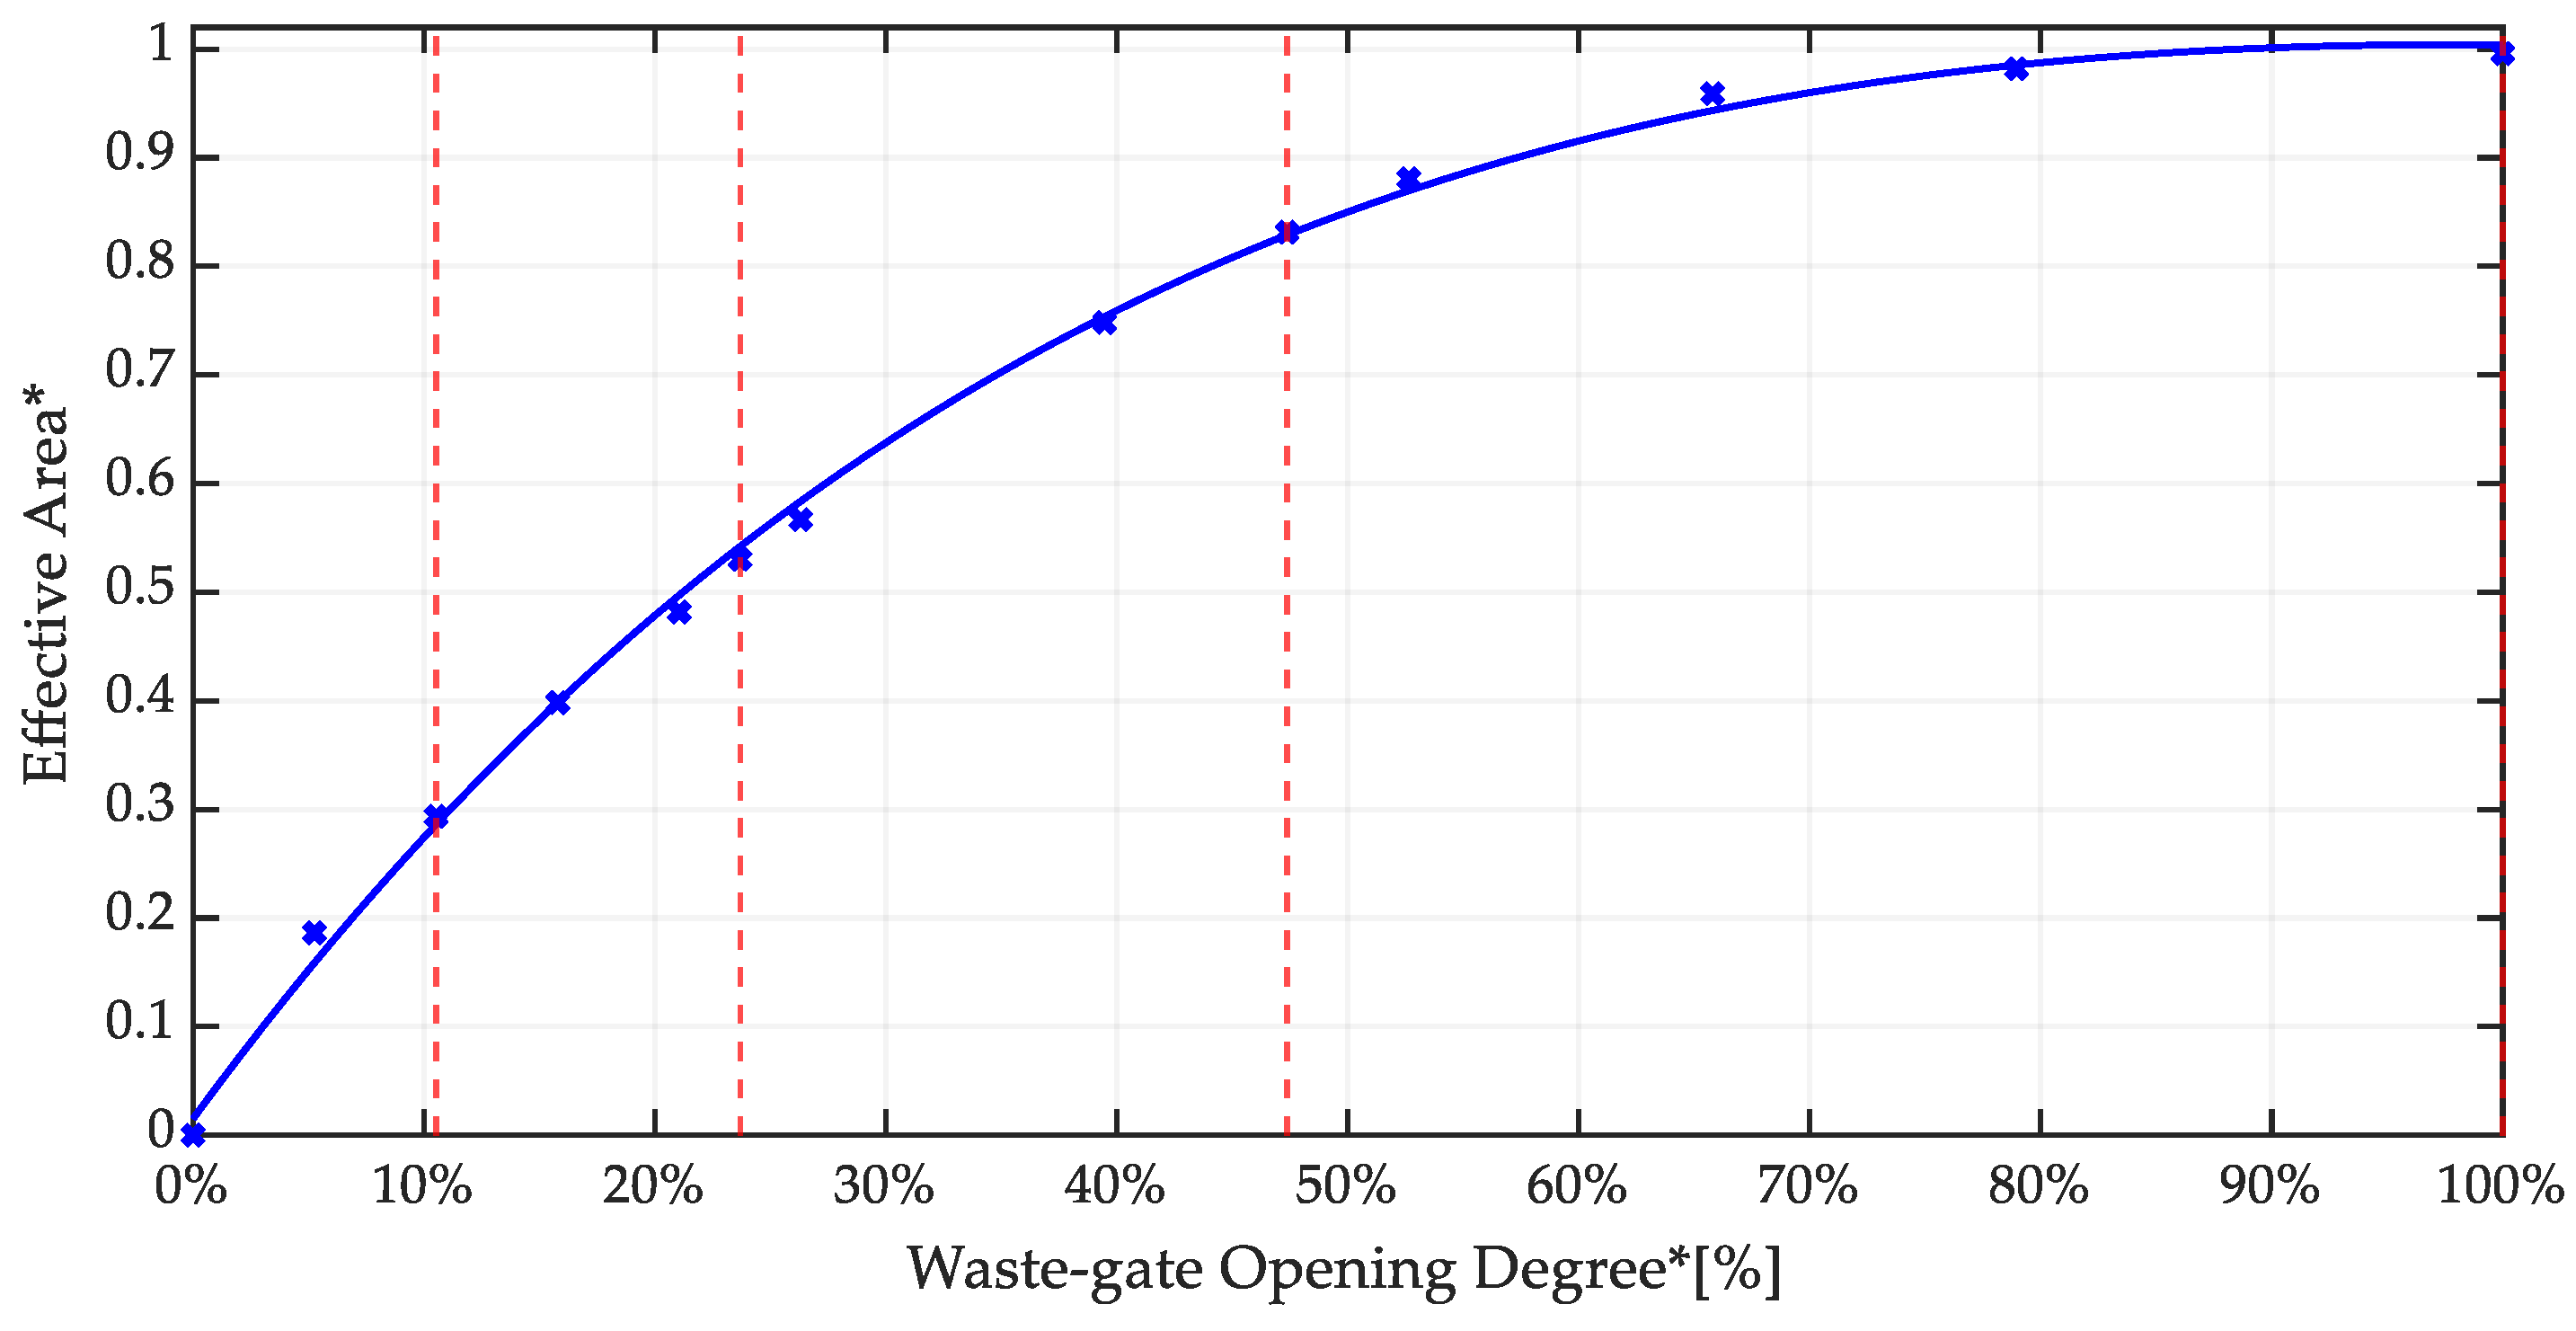
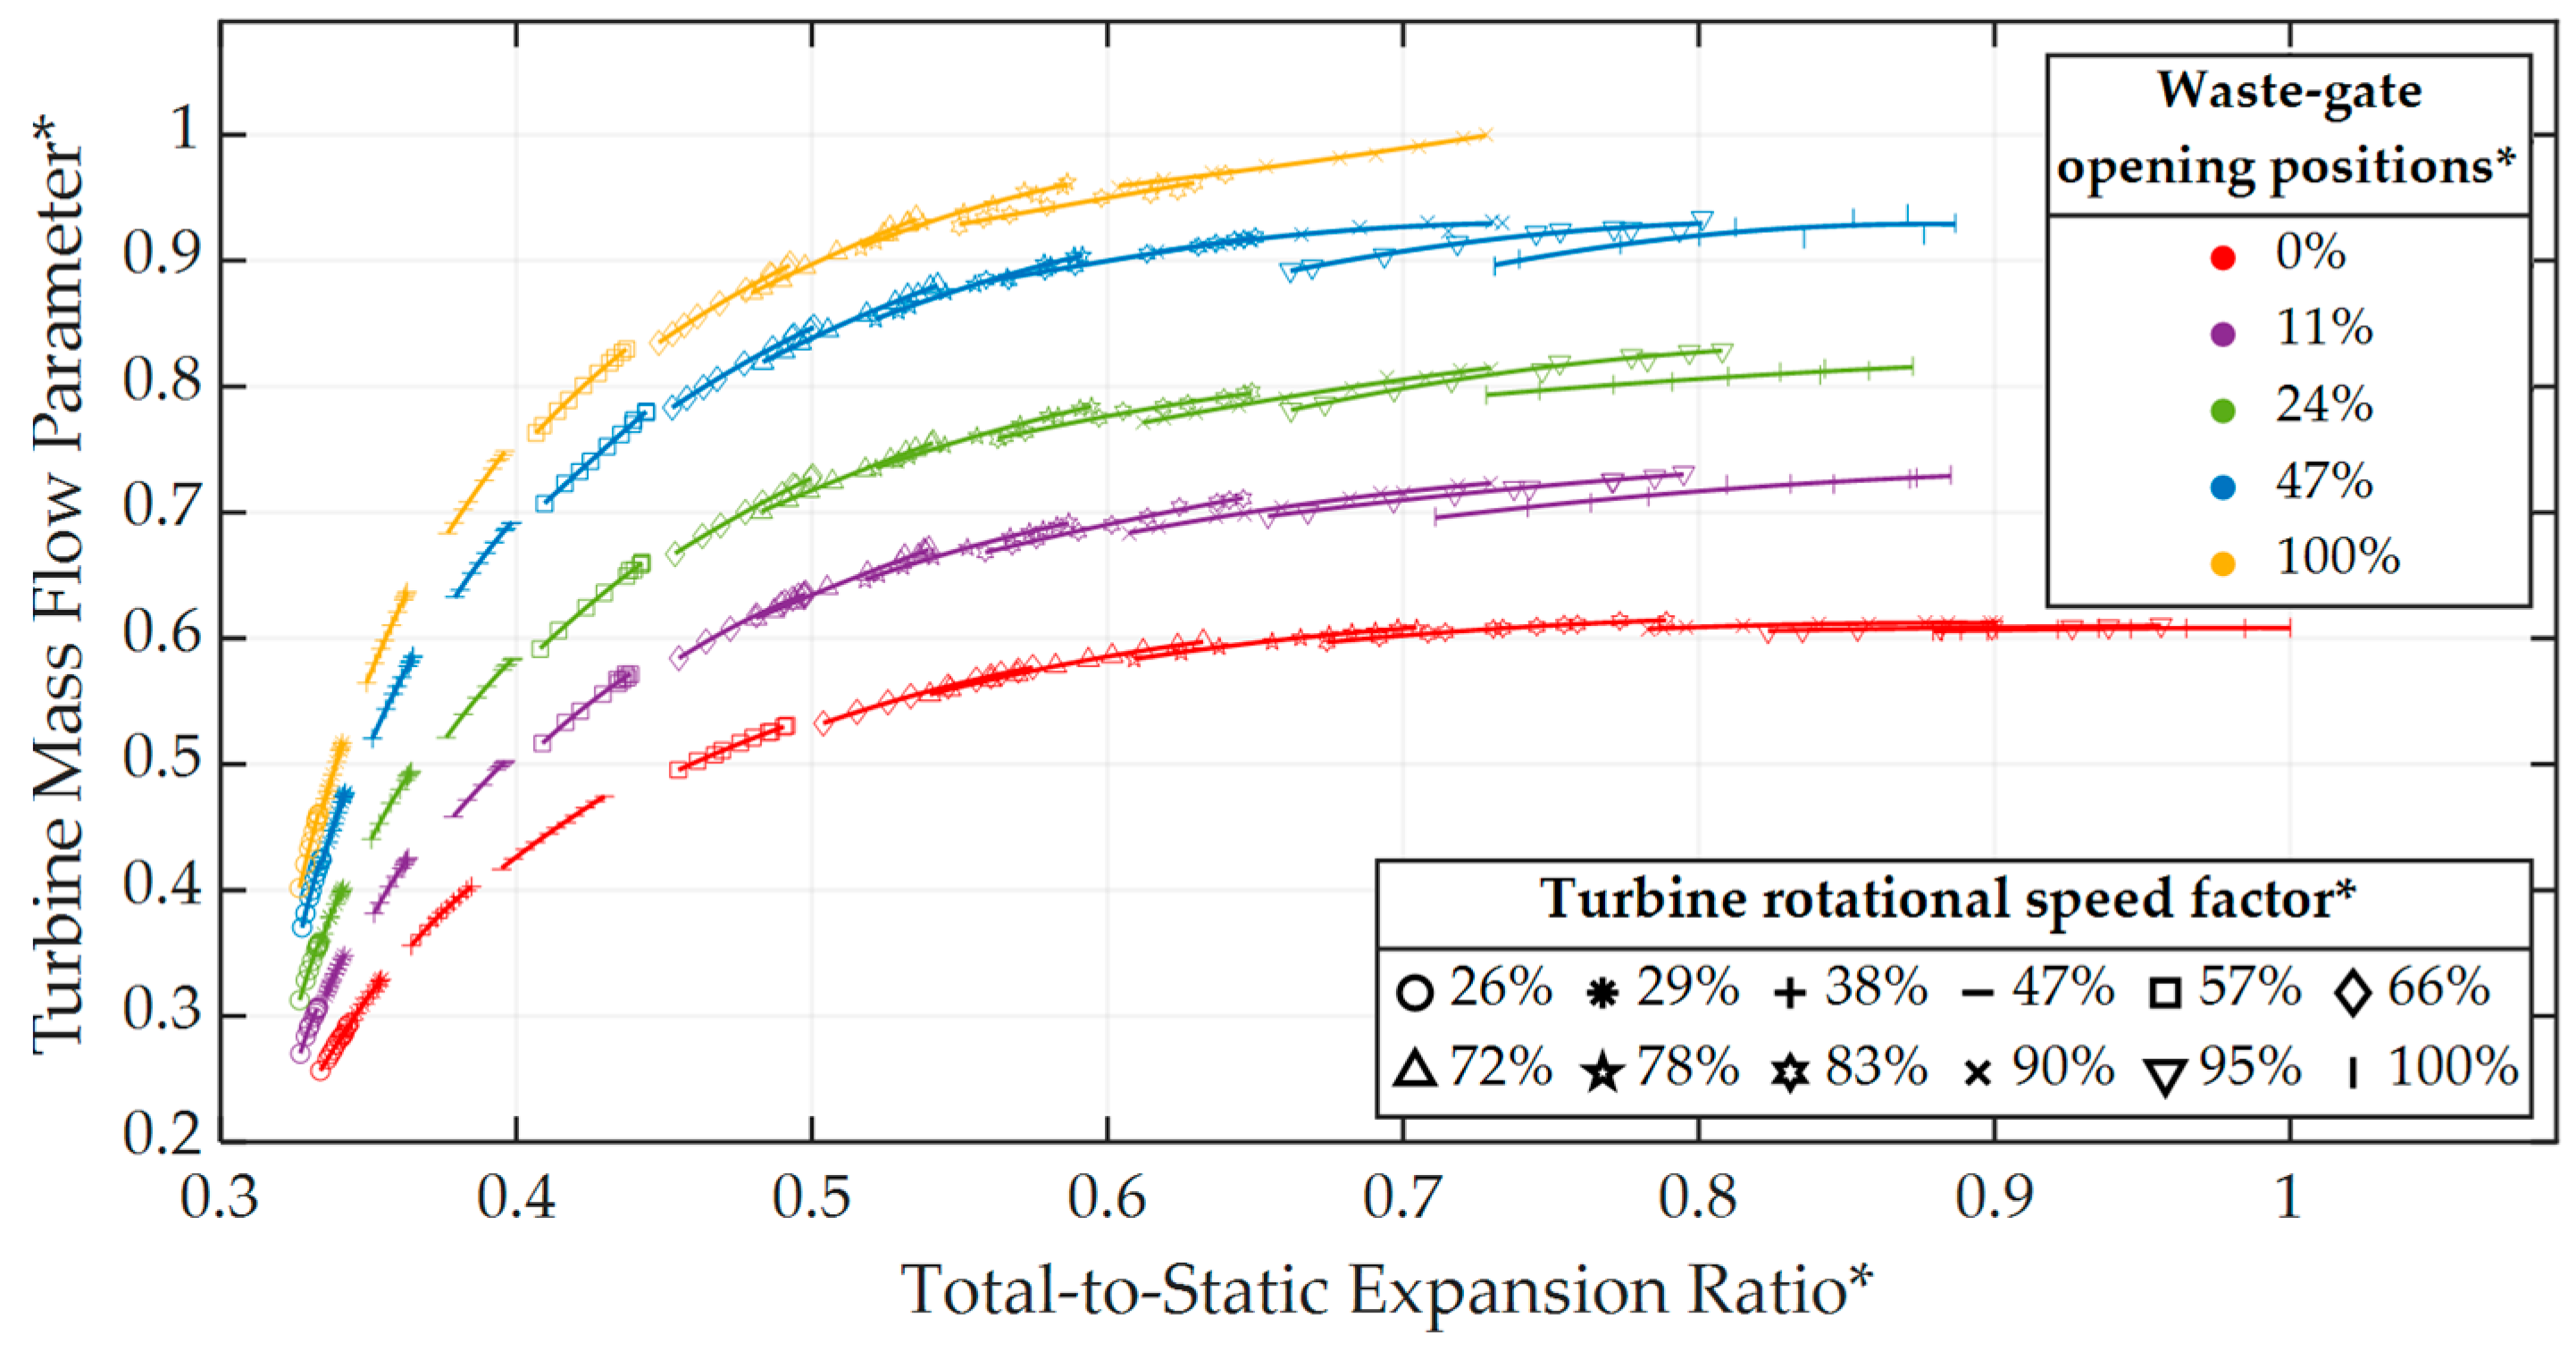
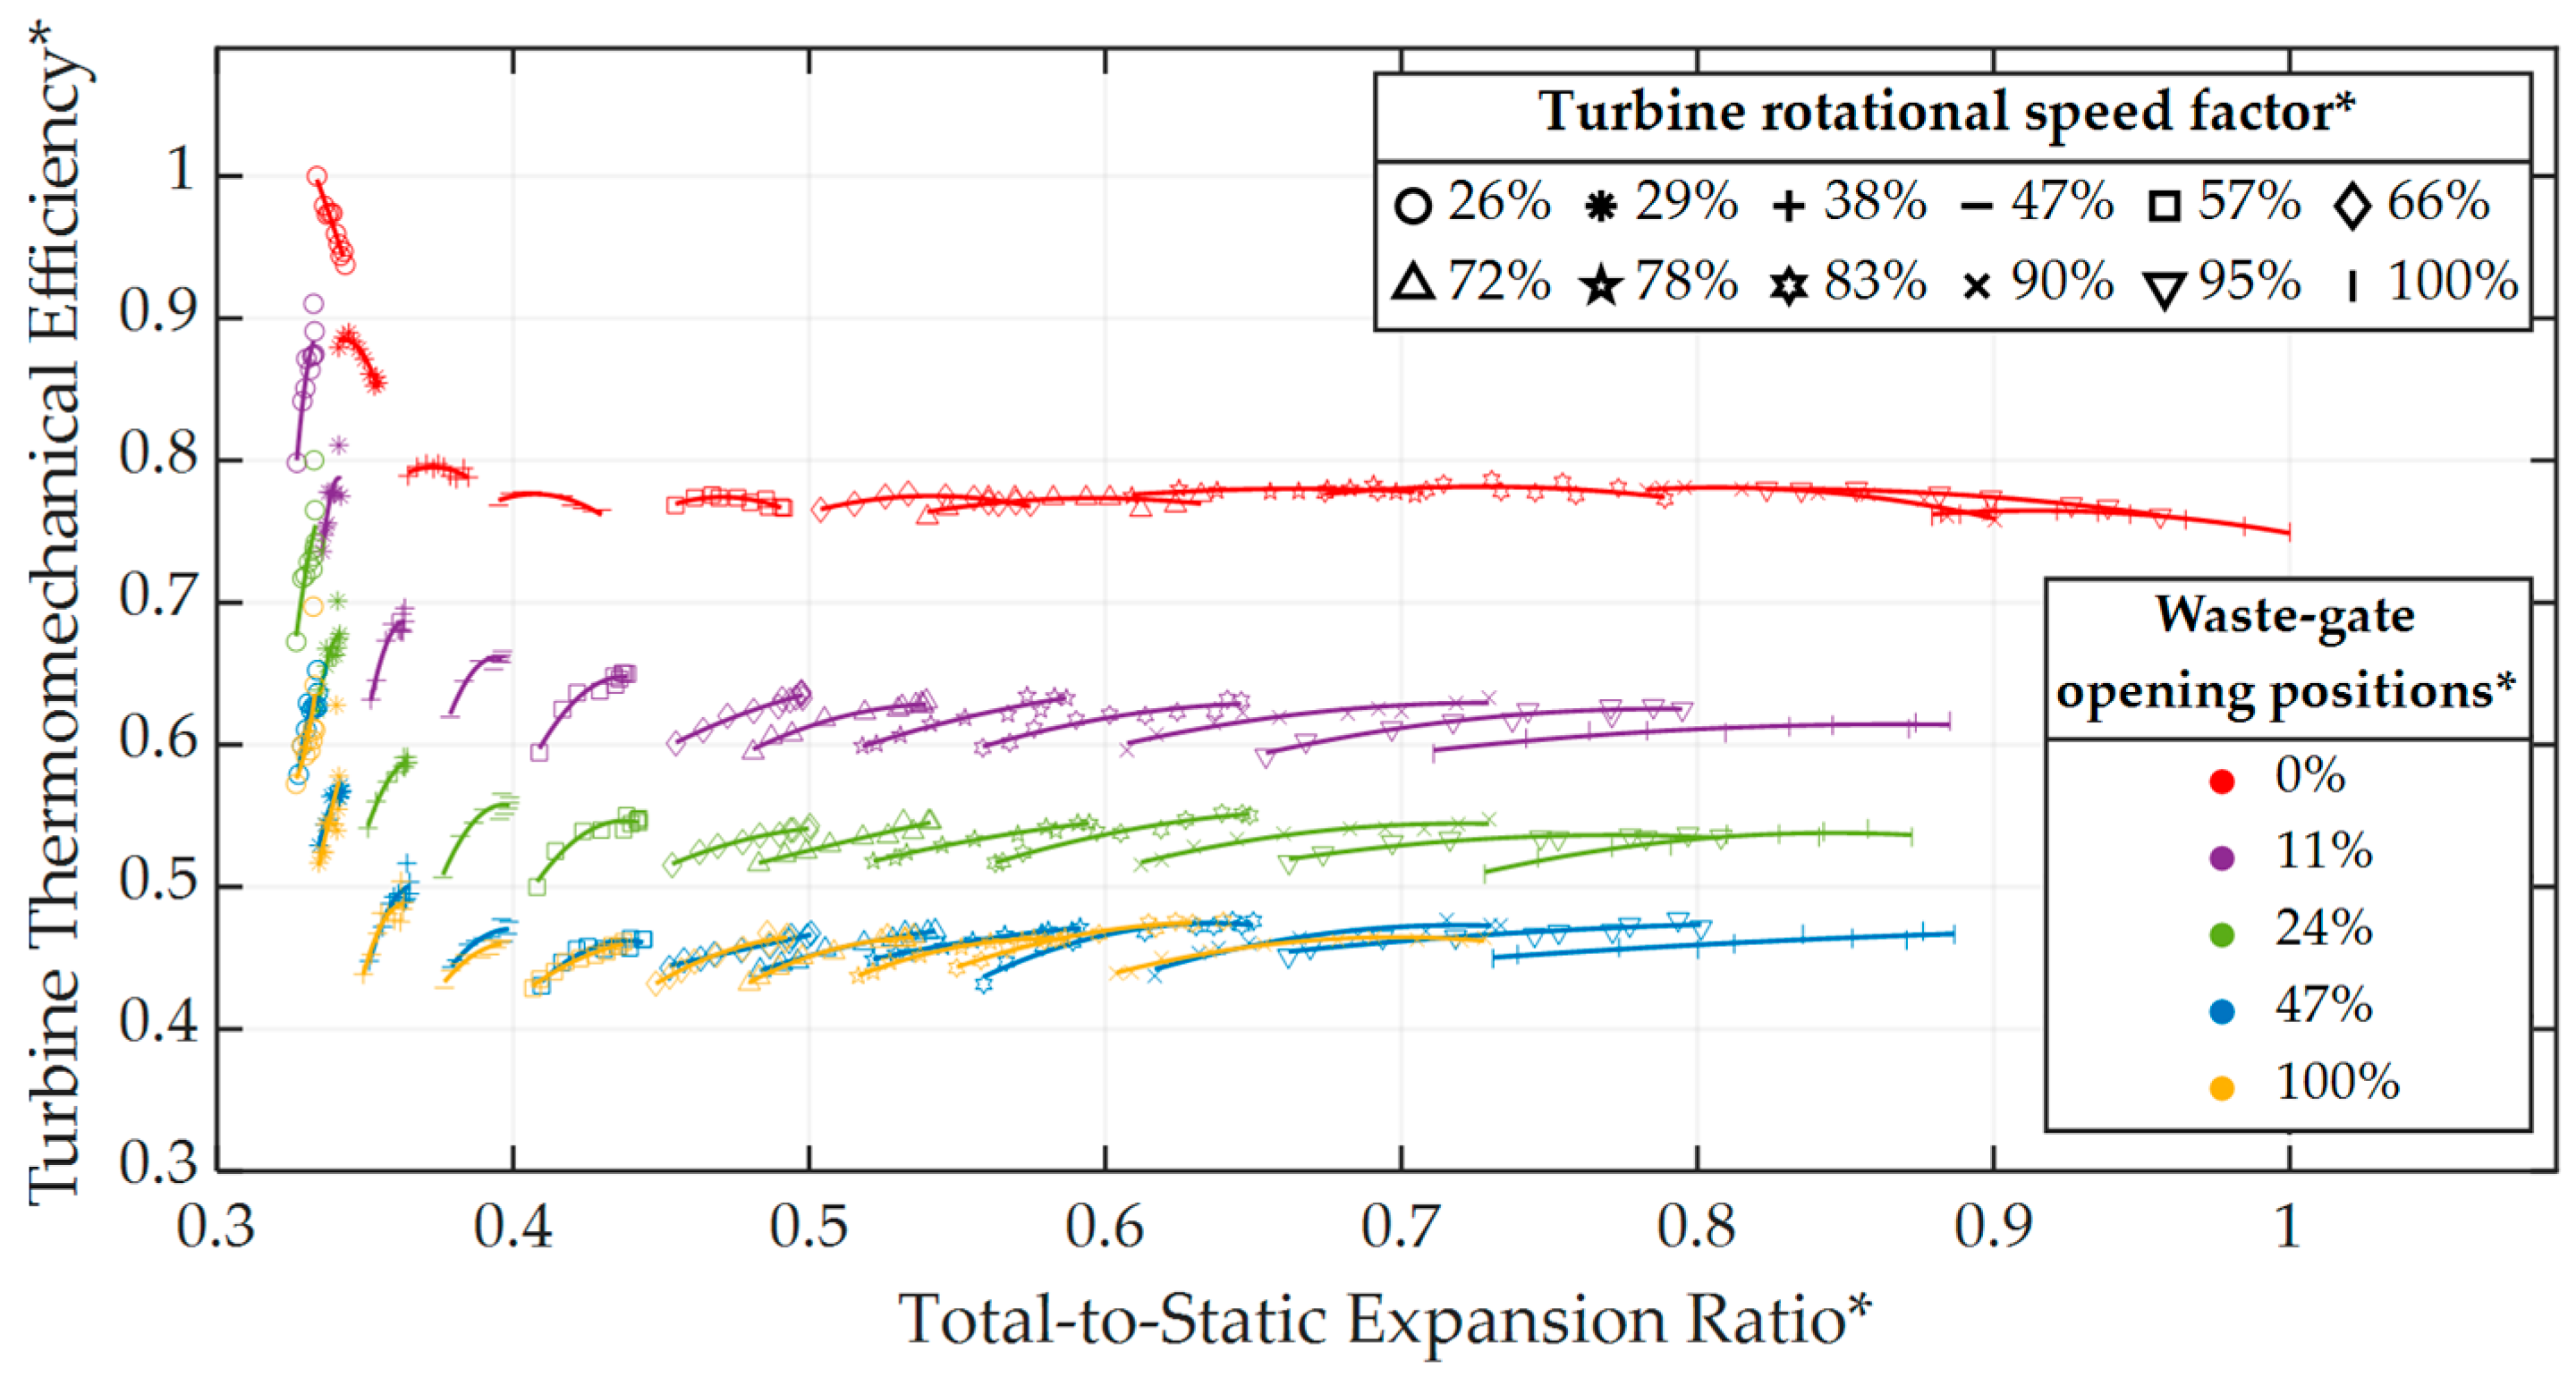
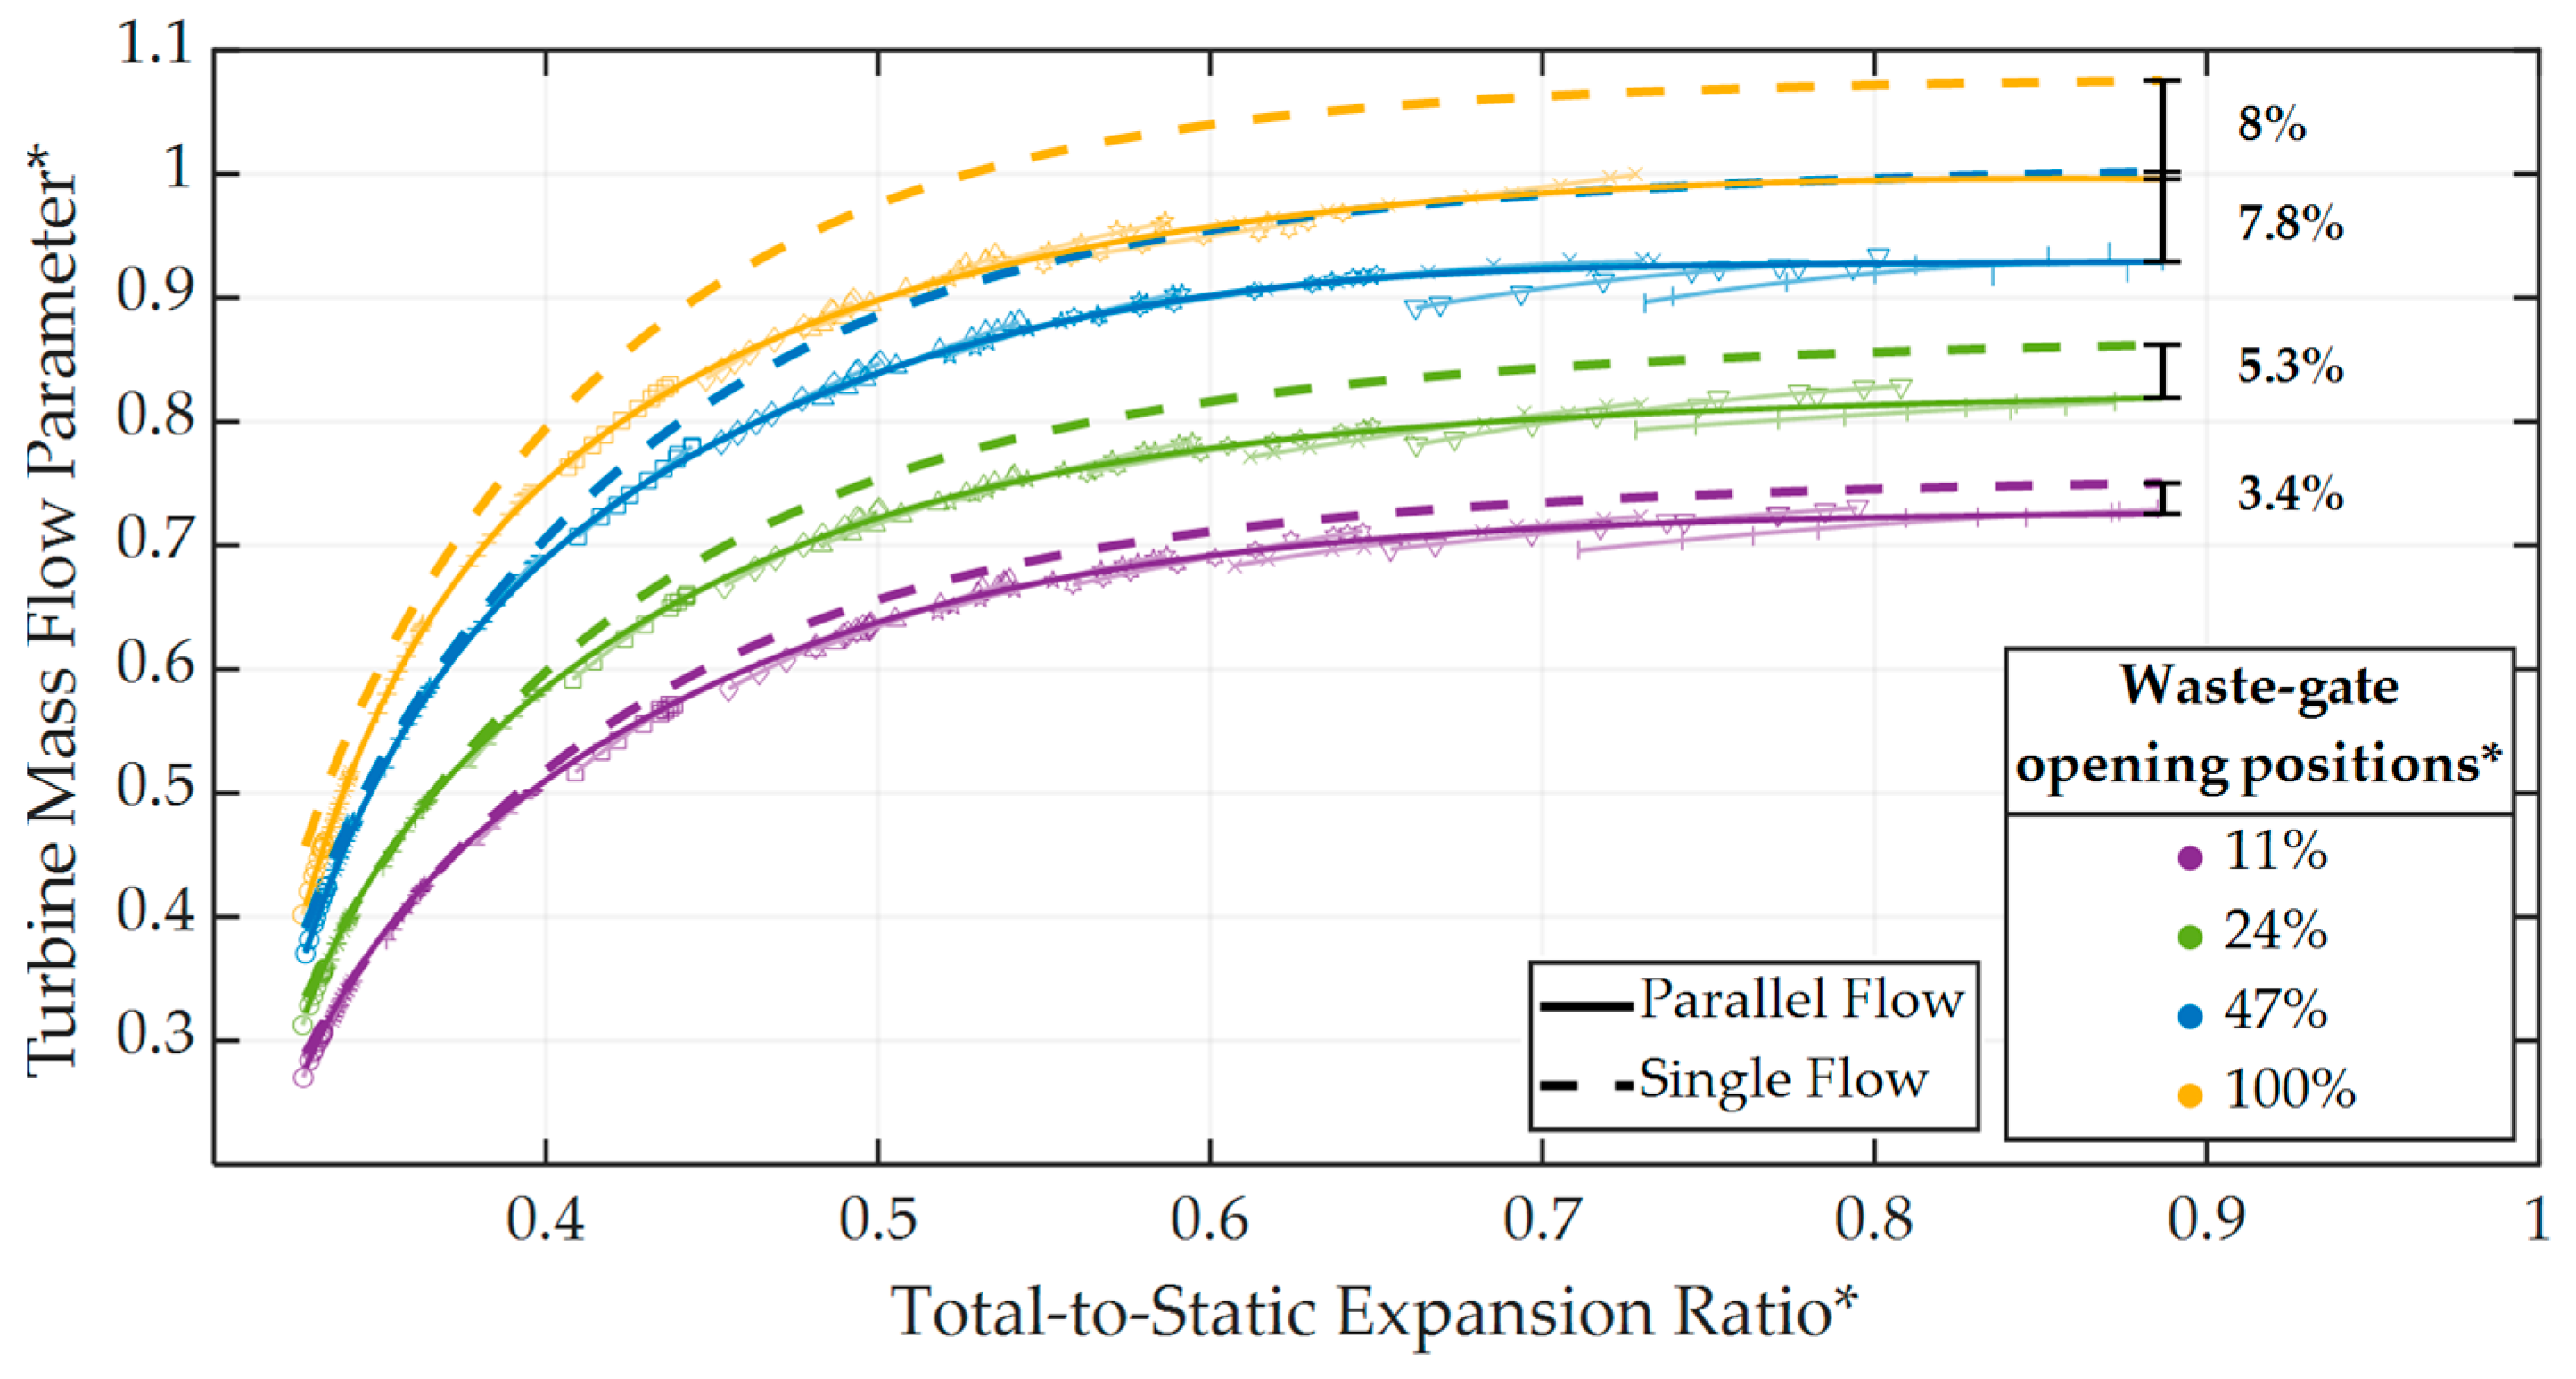
2.2. Experimental Results

For confidentiality reasons, all operating parameters reported in the article have been rescaled to their maximum measured value and indicated by the superscript (*). Similarly, the waste-gate valve openings and the turbocharger rotational speeds are expressed as percentage values of the maximum value considered.
The performance of the waste-gate valve and the turbine are assessed by referring to the following parameters:
  • Turbine rotational speed factor [rpm/√K].
N t = n T C T T 3
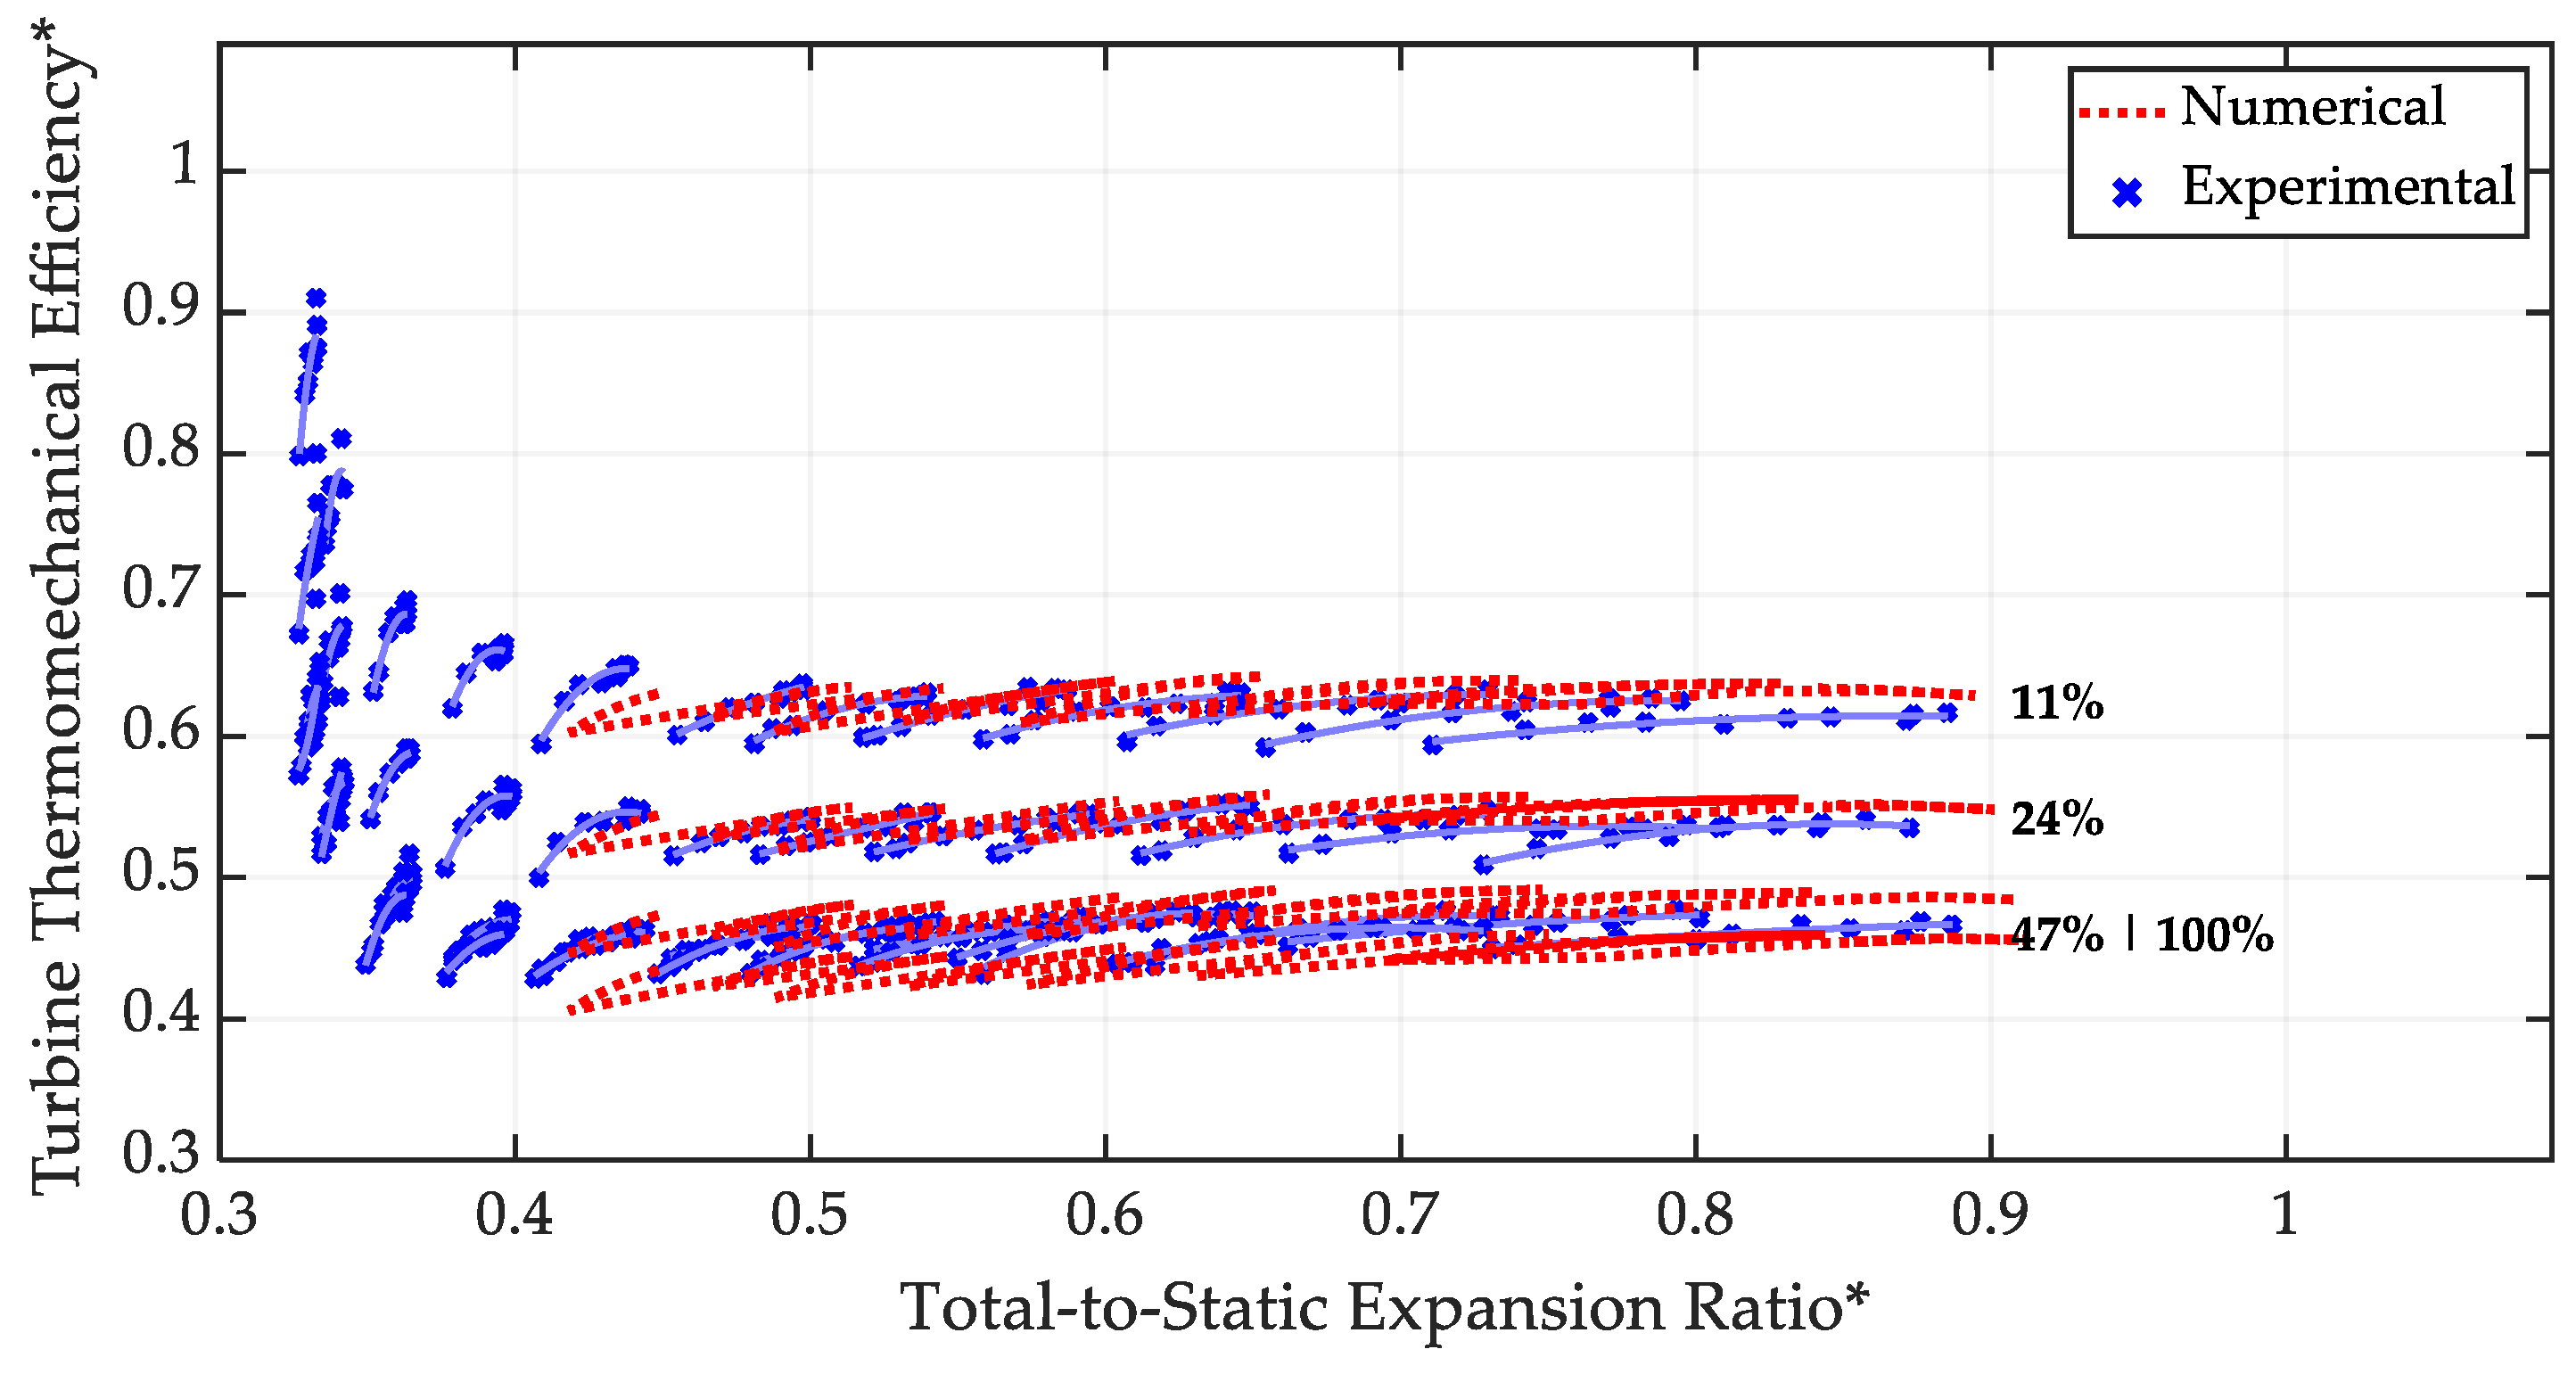
  • Total-to-static expansion ratio [-]
ε T S = p T 3 p S 4
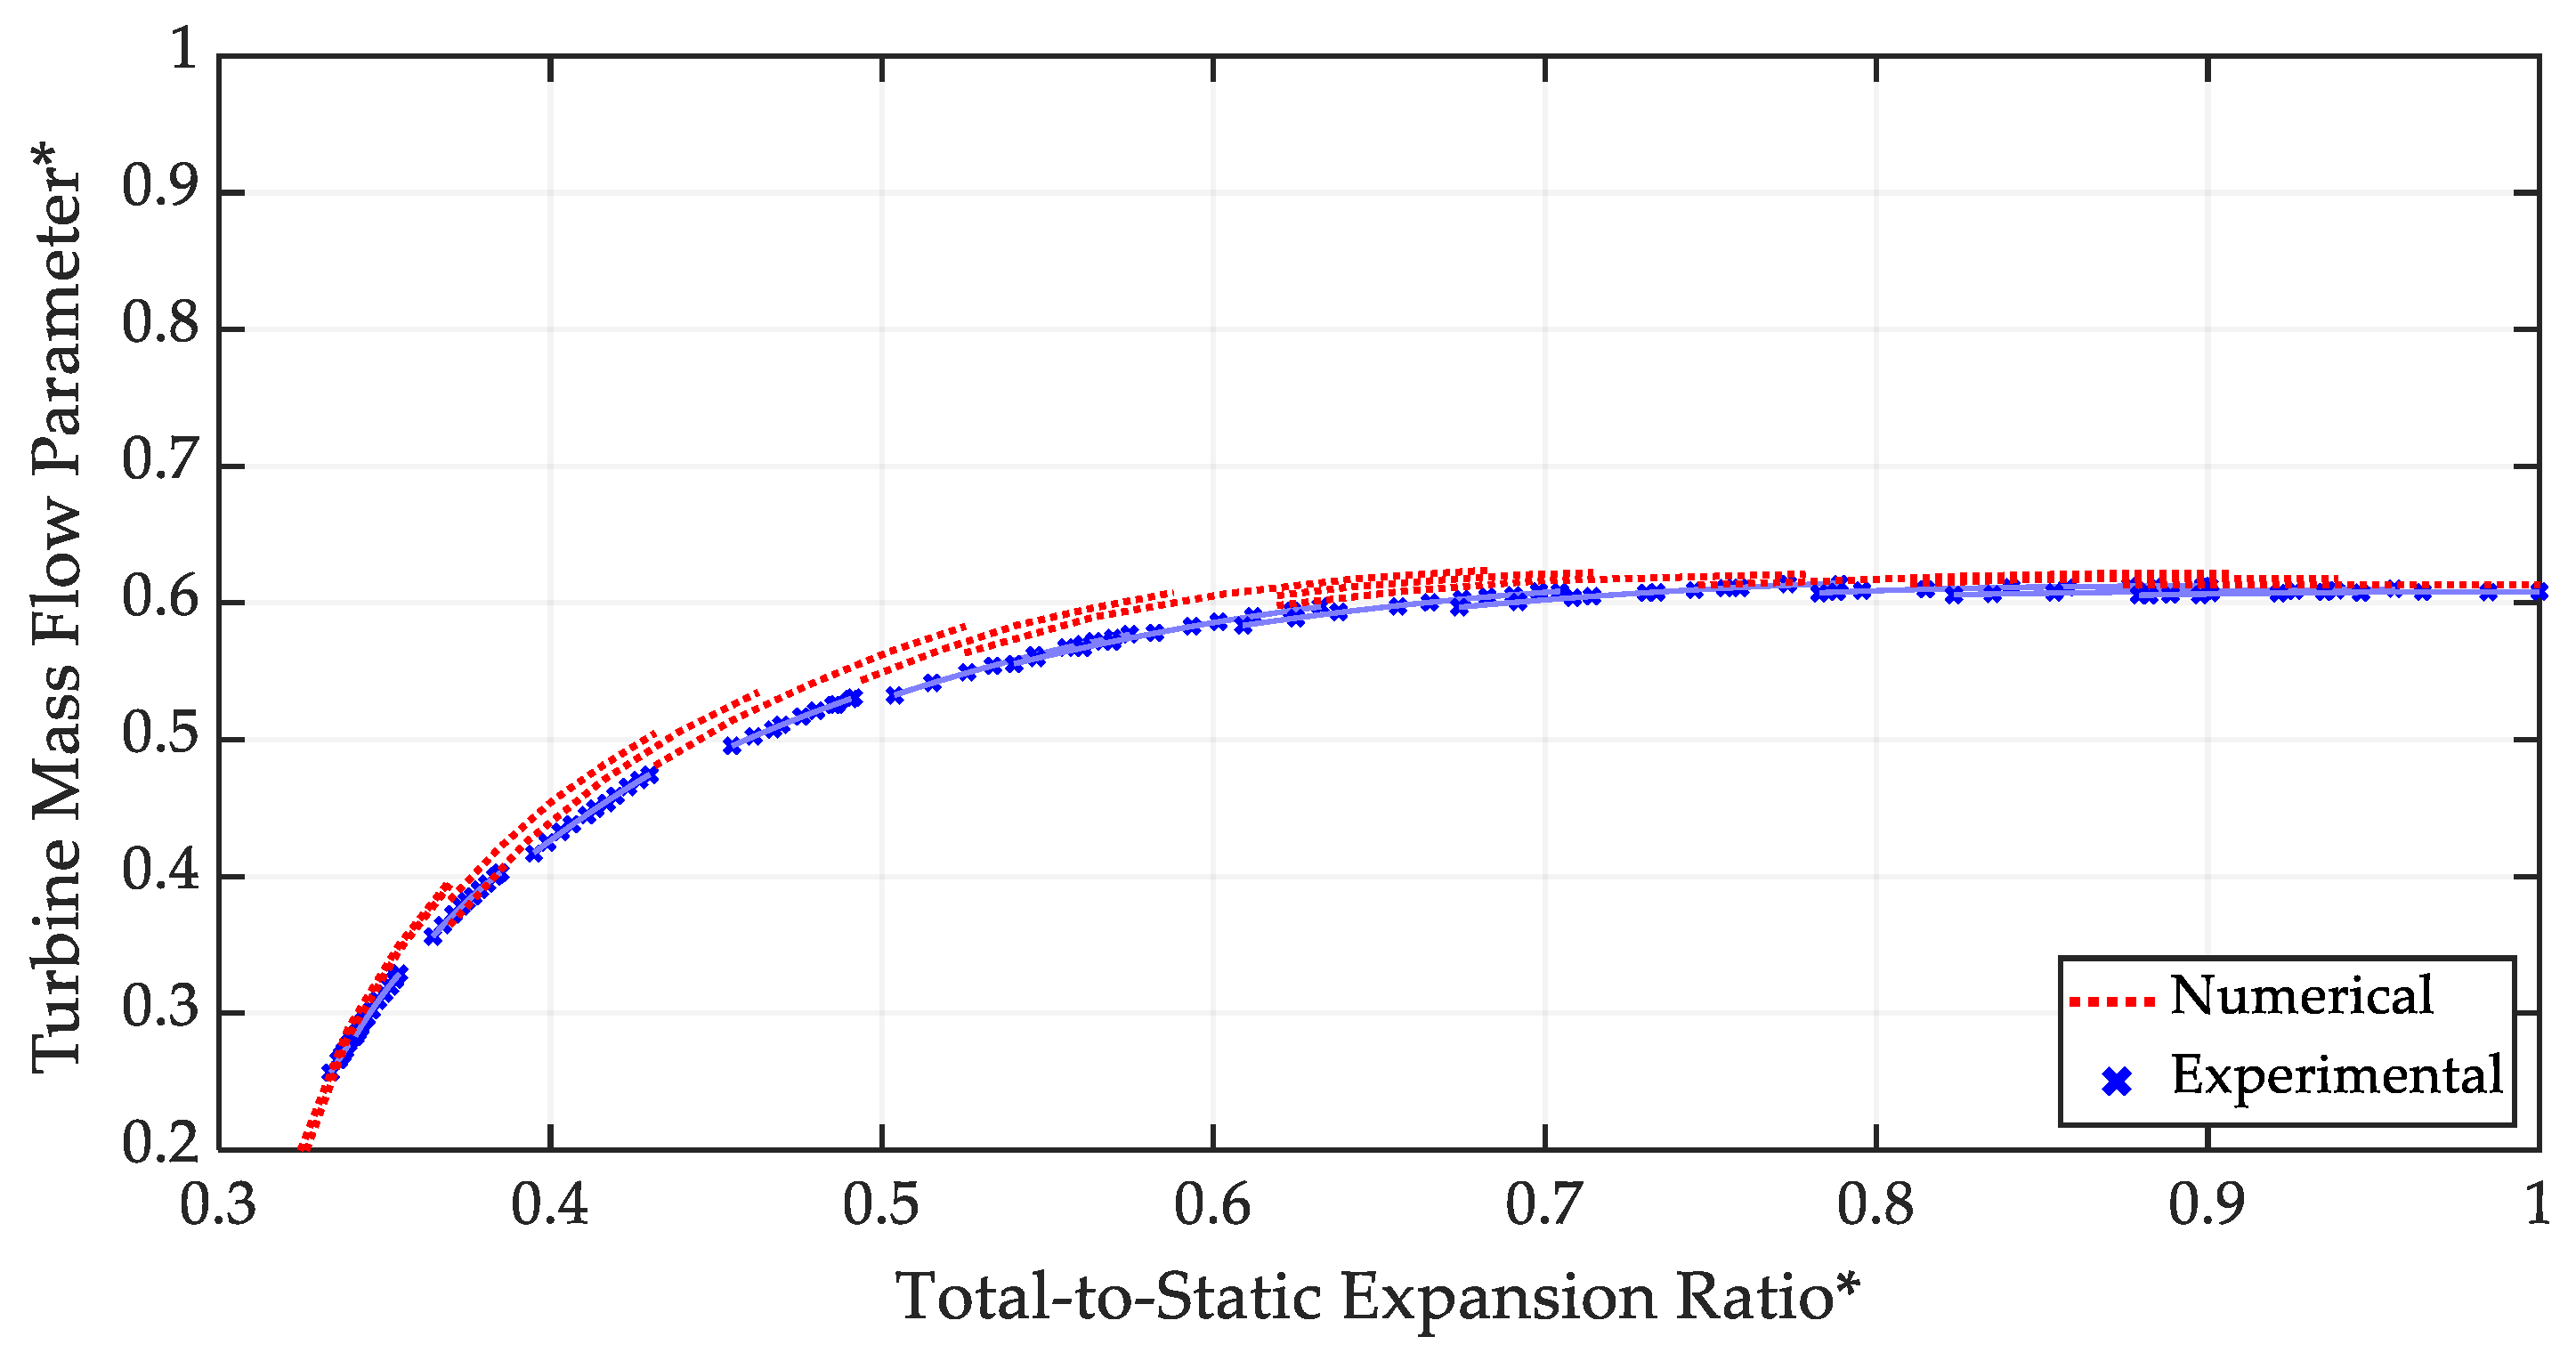
  • Turbine mass flow rate factor [(kg·√K)/(s·bar)]
Φ t = M t T T 3 p T 3
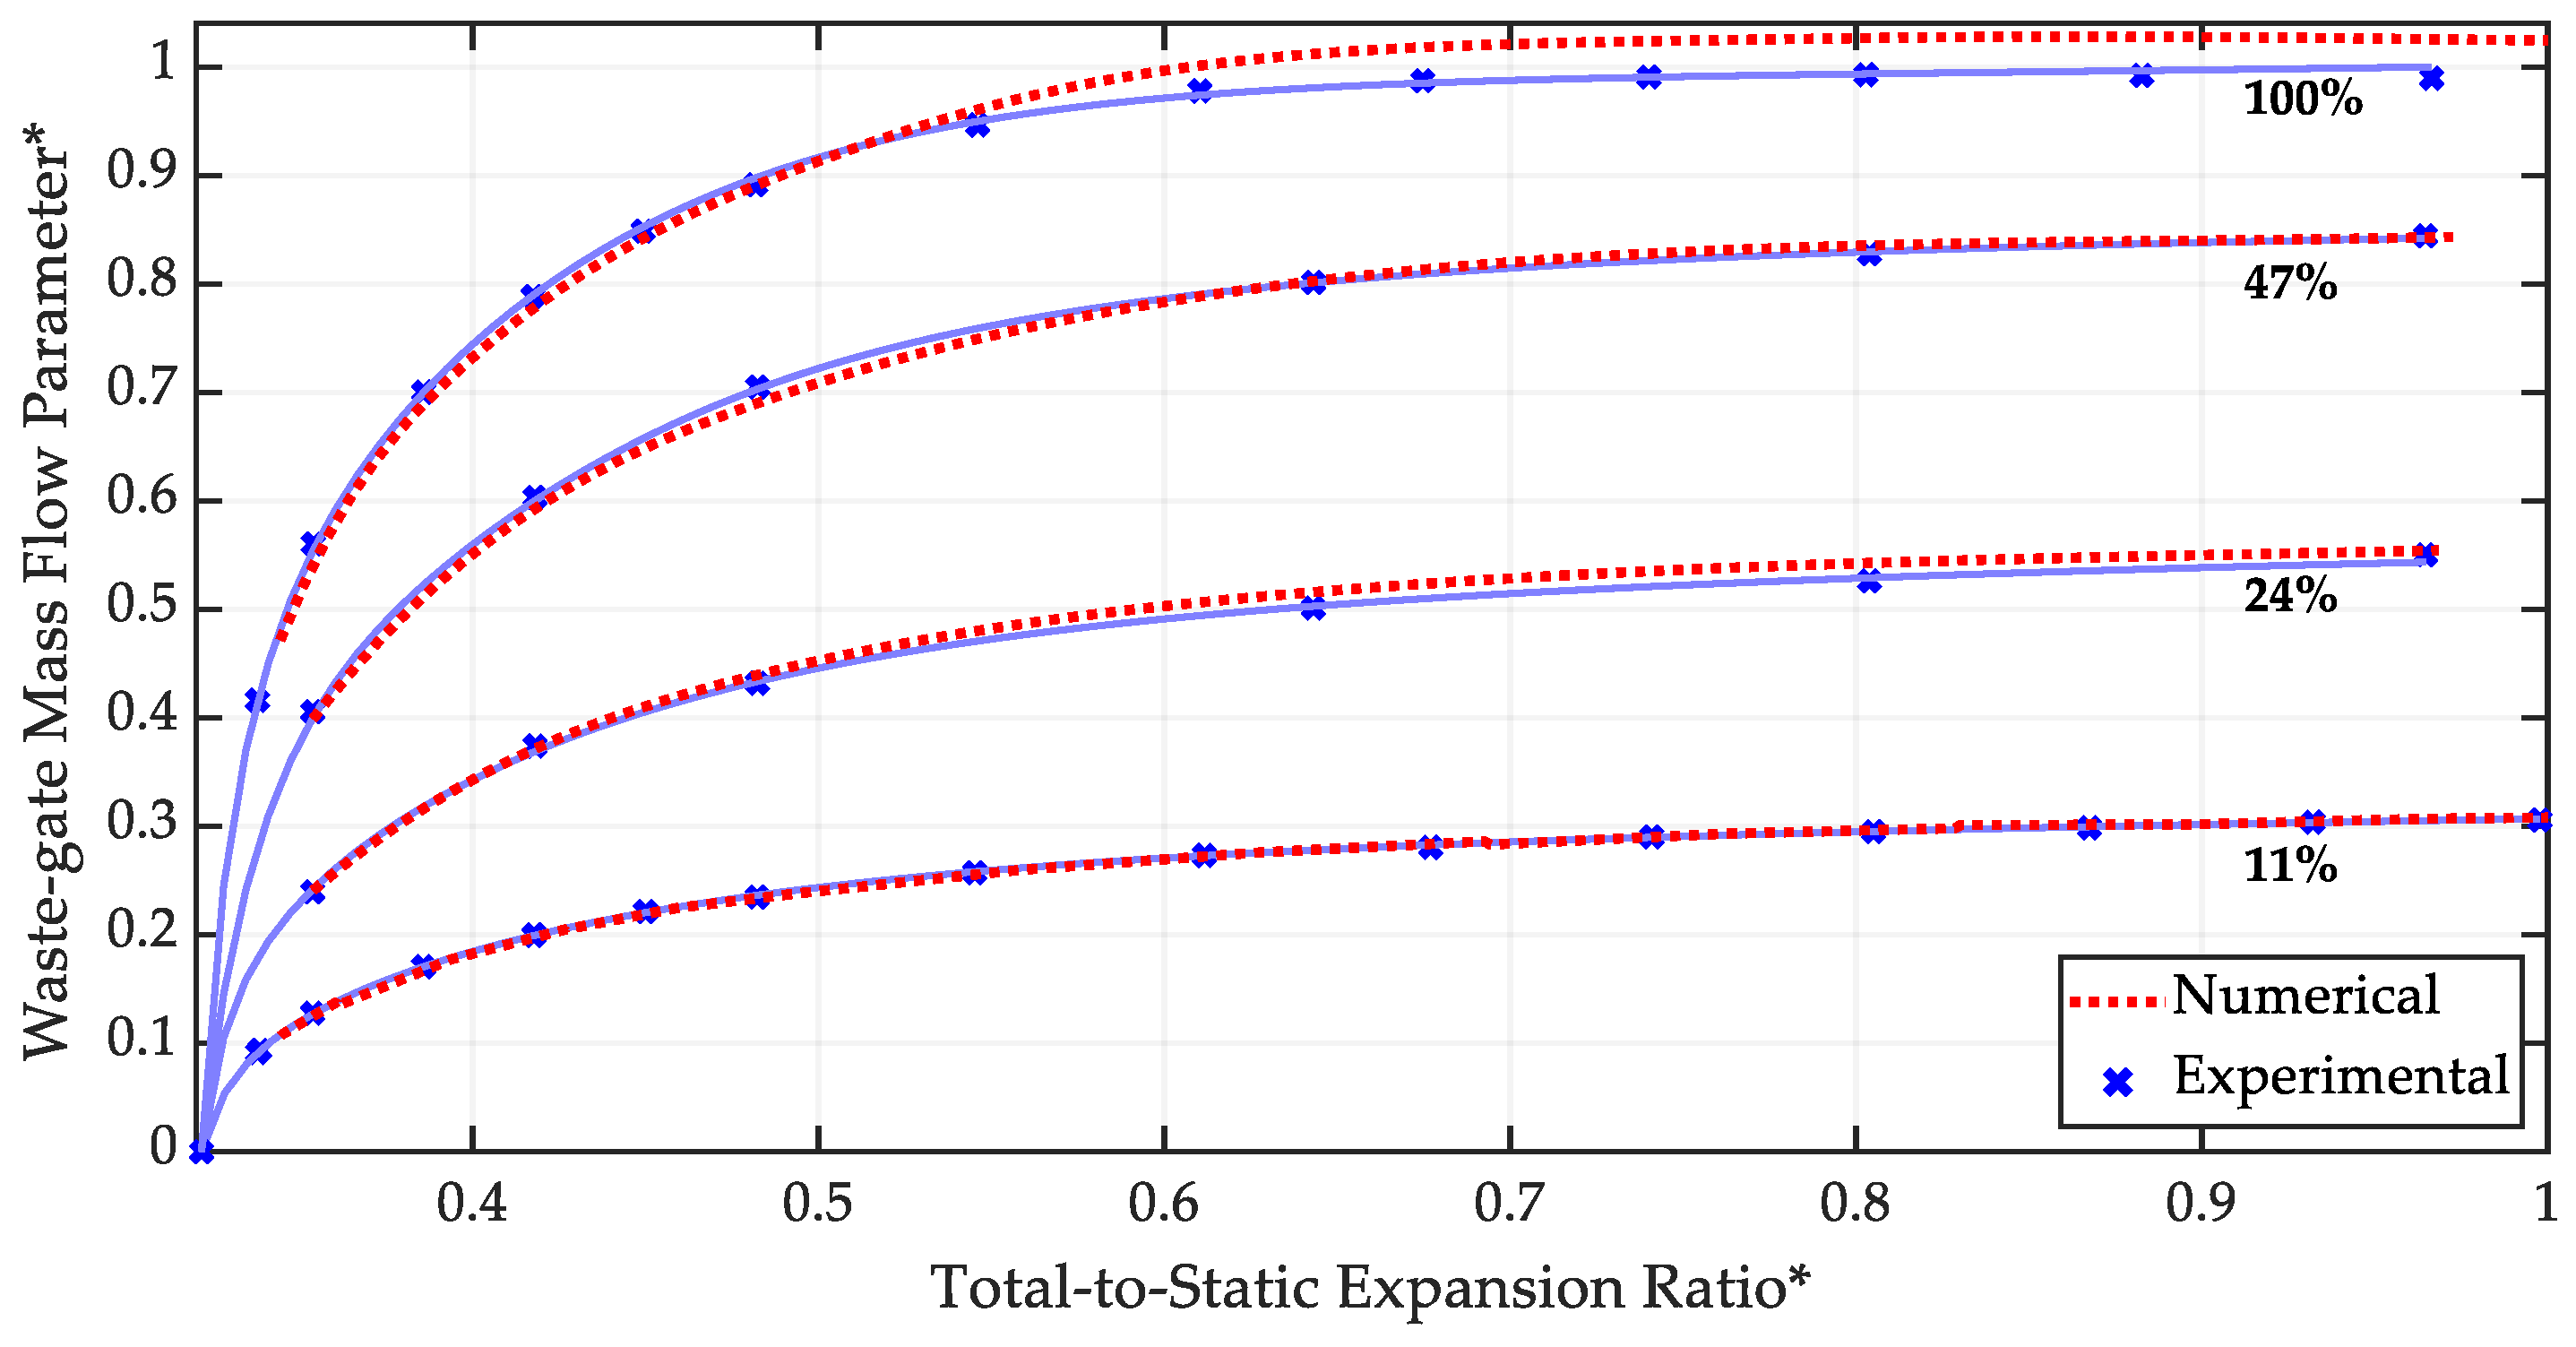
  • Waste-gate mass flow rate factor [(kg·√K)/(s·bar)]
Φ w g = M w g T T 3 p T 3
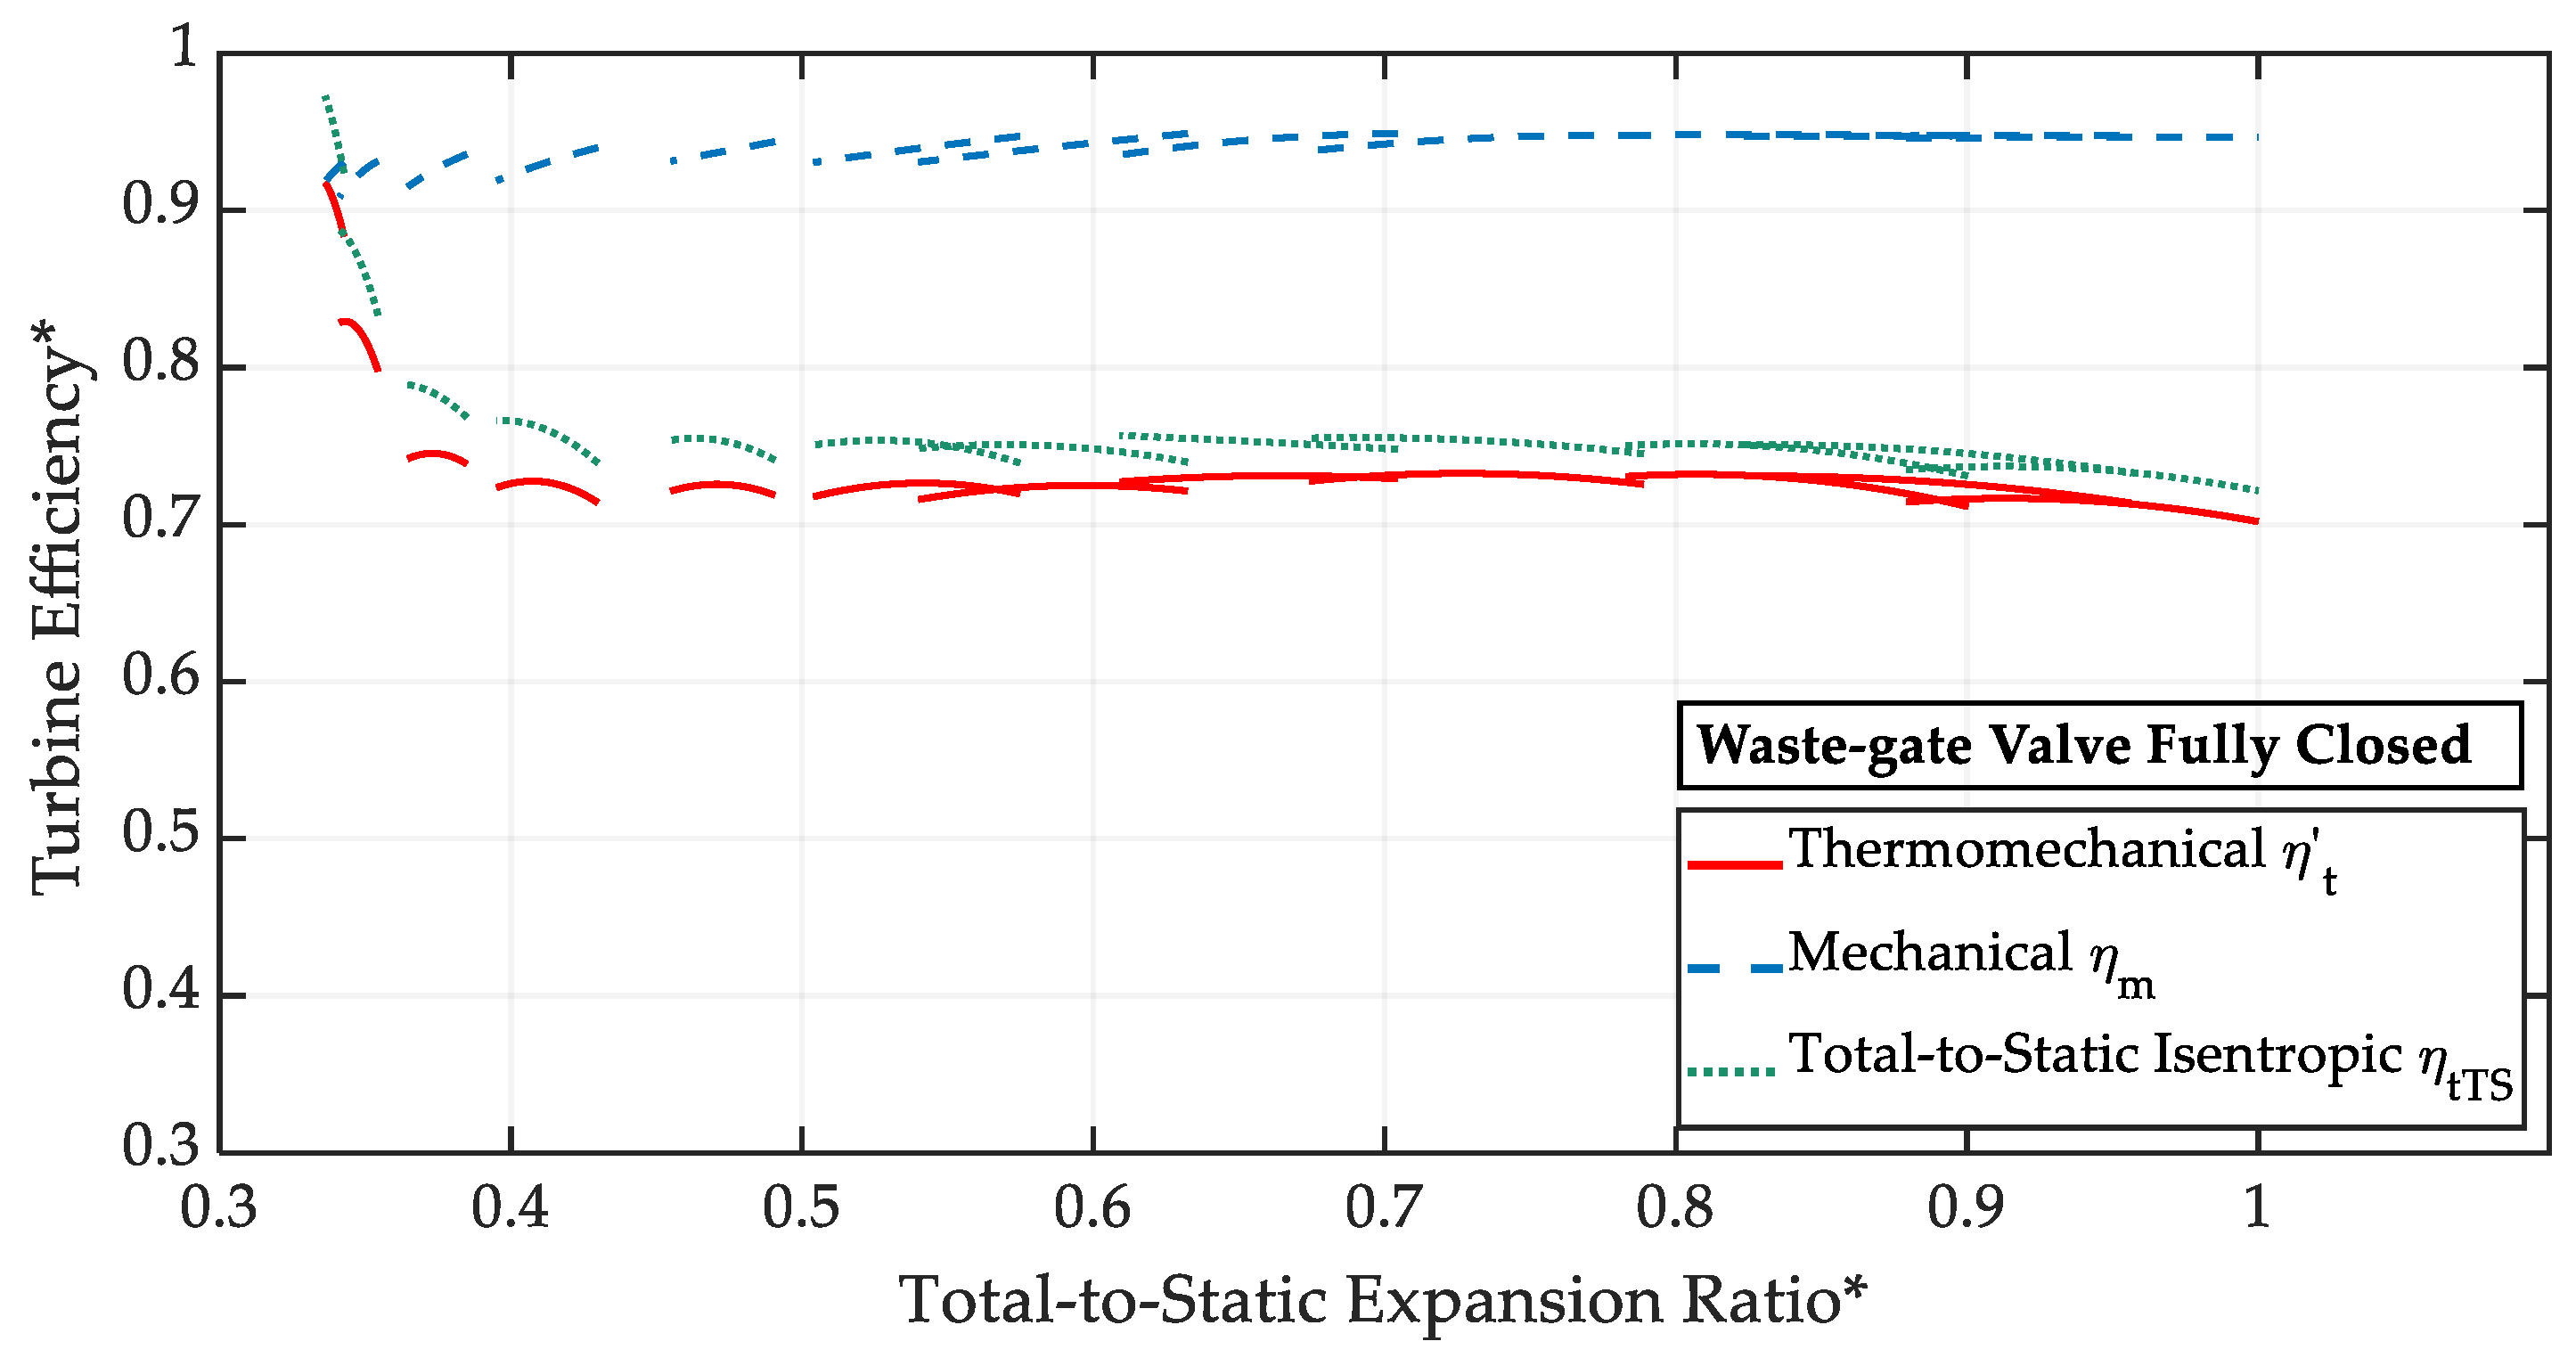
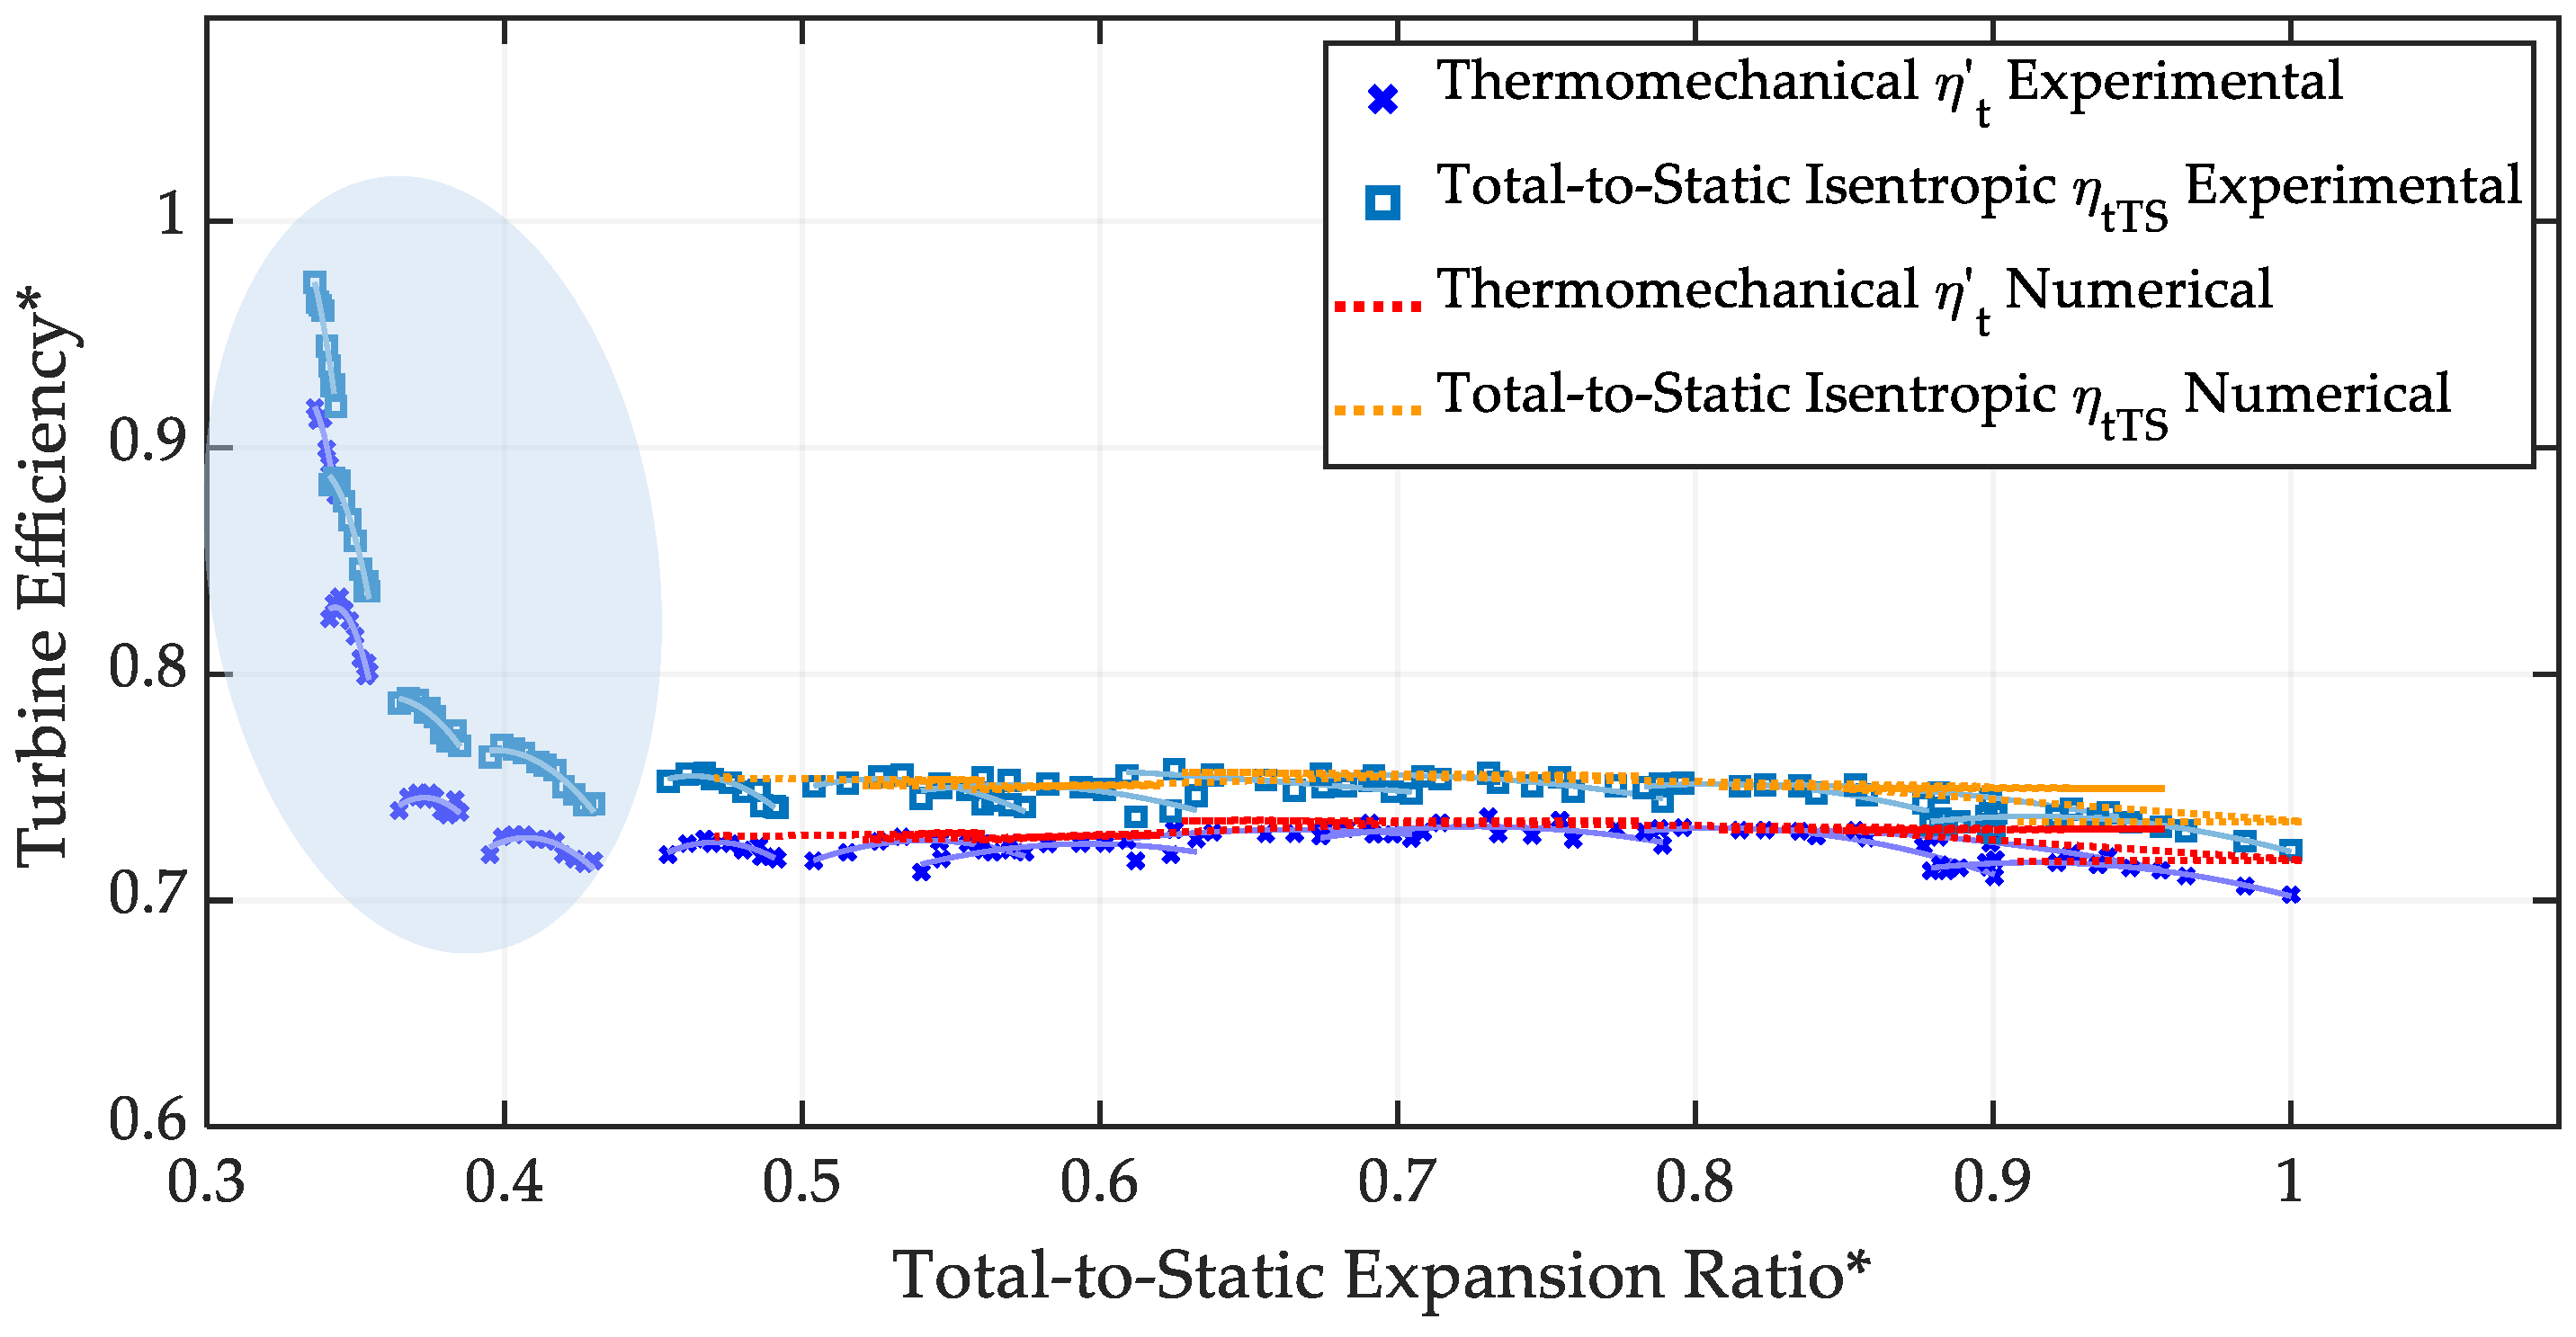
  • Turbine isentropic efficiency [-]
η t T S = P t P t i s = M t c p t T T 3 T S 4 M t c p t T T 3 1 p S 4 p T 3 k 1 k
  • Turbocharger mechanical efficiency [-]
η m = P c P t = P t P p m   P t
  • Turbine thermomechanical efficiency [-]
η t = η t T S η m = P c P t i s = P t P p m P t i s
The experimental activity is divided into three main parts.
In the first part of the experimental activity, the waste-gate valve behavior was analyzed for 12 opening positions (Table 2), with the rotor circuit closed in order to measure its swallowing capacity.
During the test campaign, the position of the waste-gate valve was kept fixed to measure the mass flow rate ranging from a minimum pressure ratio up to the typical asymptotic condition at a high-pressure ratio, as reported in Figure 2. It can be noticed that the mass flow rate of the waste-gate valve is sensitive already in the minimum opening position, while for large openings the change in the mass flow rate is almost negligible, thus avoiding the feasibility of fine adjustment.
Moreover, this experimental activity allows the assessment of the effective area of the waste-gate valve (i.e., the flow discharge coefficient C D in Equation (8)) as a function of the valve position, as shown in Figure 3. This information is then implemented in the 1D code, later described.
M = A e f f · ρ i s · u i s = C D · A r e f · ρ i s · u i s
Subsequently, the turbine performance was assessed for different rotational speed levels, keeping the waste-gate valve fully closed, as shown in Table 3.
This last information is generally provided by the turbocharger manufacturer, and it is the base for the development of any modeling activity on turbocharging systems. In Figure 4 and Figure 5, the characteristic curves of the turbine, both in terms of swallowing capacity and thermomechanical efficiency are shown. Regarding thermomechanical efficiency, despite the necessity to represent non-dimensional values for confidentiality reasons, it can be stated that at lower expansion ratios (i.e., lower turbocharger rotational speeds) heat transfer effects became significant [33,34]. Equation (7) highlights the dependence of thermomechanical efficiency on the compressor power, which acts as a dynamometer in the case of turbine testing. The compressor power is affected by the heat transfer phenomena from the turbine side to the compressor, leading to an overestimation of the measured values of the compressor outlet temperature.
In the third phase of the study, the turbine performance was evaluated in parallel-flow conditions, considering 4 waste-gate valve opening positions and the same 12 turbine rotational speed levels, as detailed in Table 4.
In Figure 6 and Figure 7 the turbine performance maps are reported, both in terms of swallowing capacity and thermomechanical efficiency for different waste-gate valve openings. Since the waste-gate valve is integrated within the turbine volute, it was not possible to experimentally evaluate the flow distribution between the rotor circuit and the by-pass port, as reported in [20]. The increase in flow shown in Figure 6 is precisely related to this aspect: as the waste-gate opens, the measured flow through the turbine circuit increases since it refers to the common channel. It can be observed that in the maximum opening condition (yellow lines), the mass flow parameter rises by 65% compared to the waste-gate valve in closed conditions (red lines). The same effect can be highlighted on the thermomechanical efficiency values (Figure 7), which decrease when the waste-gate valve opens, since the turbine mass flow term is in the denominator of the formula reported in Equation (7).
In order to highlight the interaction between the turbine impeller and the waste-gate valve when this last is integrated into the turbine volute, a comparison between mass flow curves defined following different approaches is shown in Figure 8. The sum of the mass flow rates through the waste-gate valve and the rotor channel in the single-flow condition is shown with dashed lines in Figure 8, considering the turbine swallowing capacity as an equivalent nozzle of the same effective area. Experimental data measured in parallel-flow conditions are represented by solid lines in Figure 8, for the same waste-gate valve opening conditions reported in Table 3. A significant deviation ranging from a minimum of 3.4% to a maximum of 8% can be observed, with the largest deviation for the waste-gate valve fully open.
This result can be attributed to a different pressure ratio across the channels, with a lower pressure ratio through the waste-gate valve and the turbine impeller when the by-pass valve is open. This reduction becomes more important at higher waste-gate valve openings. The variation in the pressure ratio is caused by pressure losses between the upstream measuring section and the actual inlet of the waste-gate valve and the turbine impeller. As the valve opens, the mass flow rate (i.e., the flow velocity) increases, leading to higher pressure losses and a corresponding reduction in the inlet pressure. Moreover, the mixing losses at the turbine outlet between the waste-gate valve and the impeller flows cannot be neglected [27,35]. Since the waste-gate valve disc is placed on the rotor side, its opening defines important interactions between the bypassed flow and the main flow from the rotor. The interaction between the two flows is significantly affected by the valve opening degree, with its influence becoming more pronounced at higher openings due to the higher energy content of the waste-gate flow. As a matter of fact, as the valve opens, mixing losses intensify, leading to a greater reduction in the overall mass flow rate.

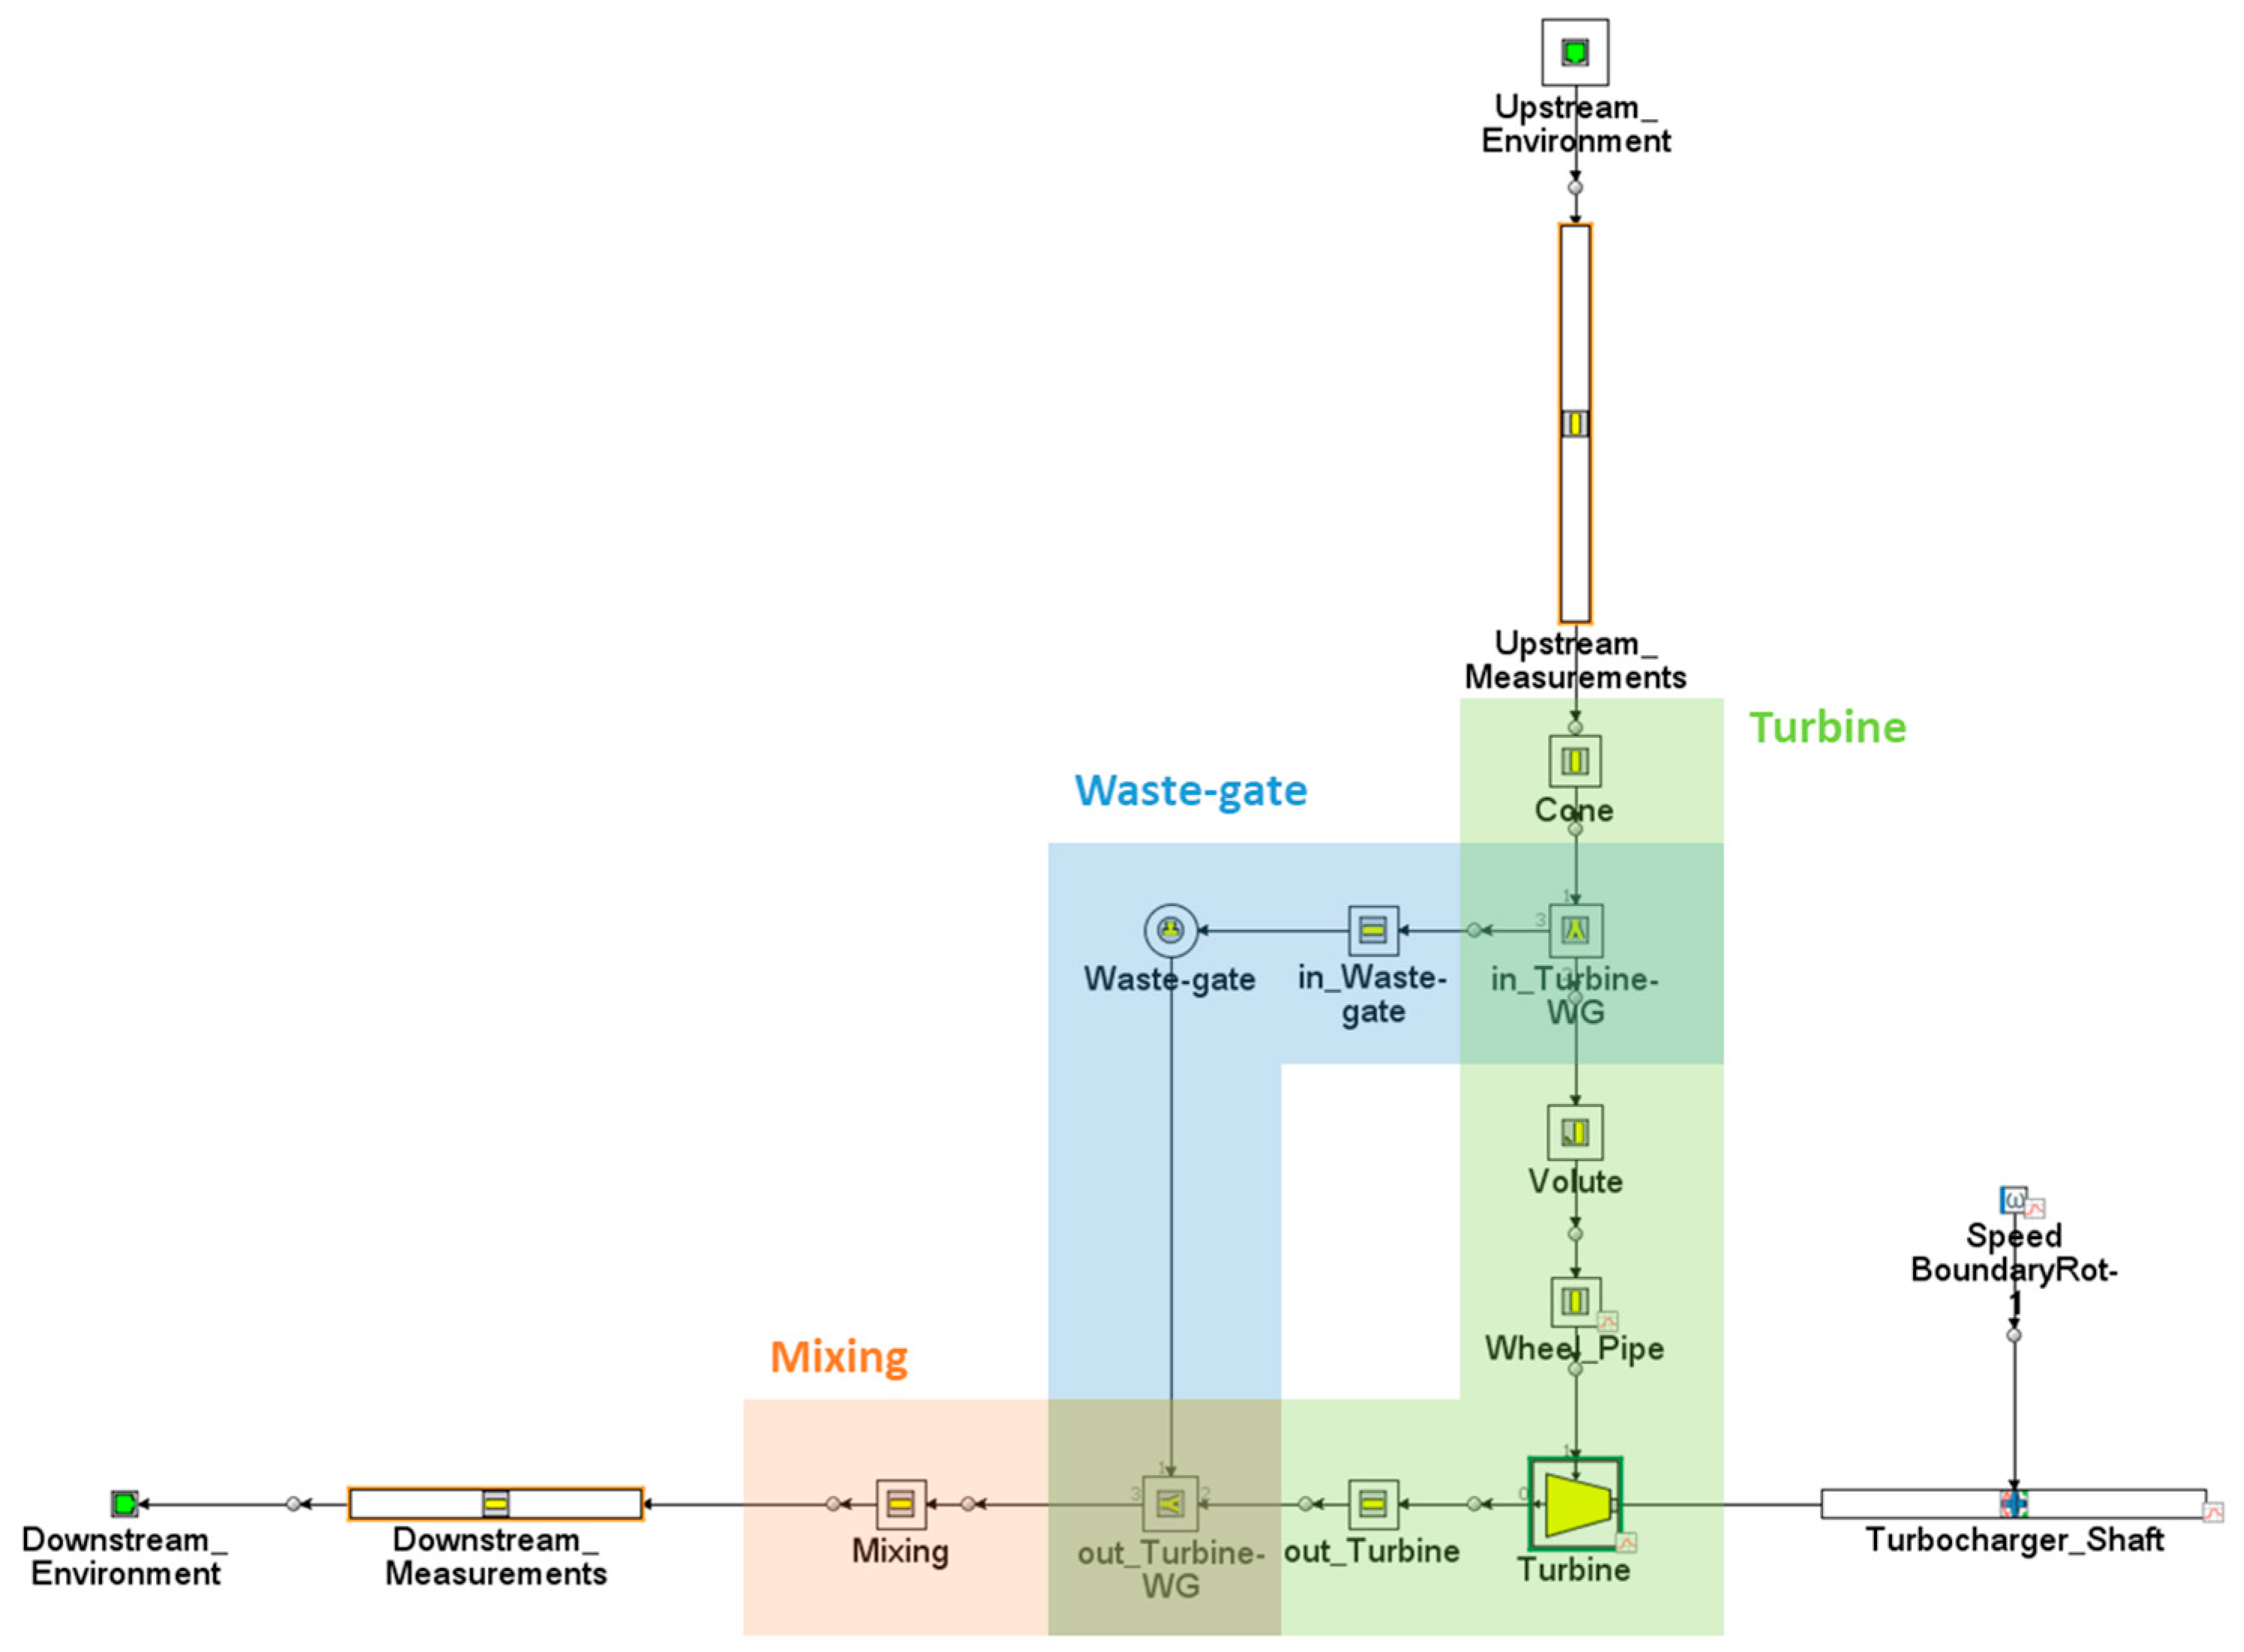
3. One-Dimensional Model

Based on the experimental campaign previously described, the 1D model of the experimental layout was then developed in the GT-Power Environment. The main aim of the model is the prediction of the turbine performance both in terms of swallowing capacity and efficiency when the waste-gate valve is open, along with the assessment of the interaction between flows of the turbine rotor channel and the waste-gate valve.
The model is presented in Figure 9, highlighting three main areas of interest: the turbine (in green), the waste-gate valve (in blue), and the mixing zone (in orange), along with the measurement stations used for experimental characterization.
The modeled waste-gate circuit is composed of an orifice (“Waste-gate”), a straight pipe element (“in_Waste-gate”), and two flow-splits, called “In_Turbine-WG” and “Out_Turbine-WG”, which connect the waste-gate valve with the turbine circuit. The characteristic of the variable diameter orifice and its discharge coefficient was defined on the basis of the experimental campaign and, in particular, on the data reported in Figure 3. This method enables the definition of various equivalent diameter orifices based on the opening position of the waste-gate valve.
The proposed turbine sub-model reported in Figure 9, is composed of four elements: the “cone”, the “volute”, the “wheel pipe”, and the “out_Turbine”. The “cone” is a converging pipe that reproduces the region between the turbine inlet flange and the housing tongue. The “volute” represents the circumferential section of the volute structure based on the geometrical dimensions. Then, the turbine performance maps have been implemented in the “Turbine” object. To consider wave propagation phenomena within the impeller, it is introduced a virtual pipe (“Wheel_Pipe” in Figure 9) in the model. This pipe represents the equivalent length and volume of the rotating blade-to-blade ducts. Then, a straight pipe element (“out_Turbine” in Figure 9) is modeled downstream of the turbine to reproduce the region between the impeller outlet and the waste-gate valve outlet. Finally, the mixing zone, consisting of a flow-split object and a straight pipe (respectively “out_Turbine-WG” and “Mixing” in Figure 9), represents the volume at the turbine outlet. These elements are particularly significant in reproducing the interaction between the waste-gate valve and the impeller. Specifically, the flow downstream of the waste-gate valve defines a noticeable interaction with the flow that arrives from the impeller. The difference in swallowing capacity between single-flow and parallel-flow operation, as highlighted in Figure 8, is mainly due to two phenomena: mixing losses and the distribution of pressure losses between the waste-gate valve and the turbine rotor channel. Modeling these phenomena required particular attention to the dimensions of the element at the turbine outlet (“out_Turbine”) and the geometry of the two flow splits, considering both the relative position of the channels and their characteristic diameters. Furthermore, accurately distributing the pressure losses as the flow rate increases with the opening of the waste-gate valve requires precise modeling of the pipe element connecting the turbocharger turbine inlet to the waste-gate valve (“in_Waste-gate”) and the “Volute”.
A preliminary activity related to the pre-processing of the turbine thermomechanical efficiency curves was developed to assess the isentropic values. Due to experimental issues for an accurate measurement of the turbine outlet temperature, direct evaluation of the isentropic efficiency is not feasible [36,37]. For this reason, the turbine isentropic efficiency was evaluated by combining Equations (6) and (7): starting from the thermomechanical efficiency thanks to the assessment of mechanical efficiency. This last one was evaluated by estimating the heat flux of the lubricating oil in quasi-adiabatic conditions [38]. Therefore, the turbine isentropic values were inserted in the “Turbine” object of the 1D model (Figure 9) and the mechanical losses in the bearings were inserted in the “Turbocharger_Shaft” element as a function of the turbocharger rotational speed. In Figure 10, the thermomechanical efficiency curves (continues red lines), turbine isentropic efficiency curves (dotted green lines), and mechanical efficiency curves (dashed blue lines) are reported with reference to the normalized values that have been experimentally evaluated and included the 1D model. This approach is crucial to accurately evaluate how the turbine rotor delivers power to the turbocharger shaft, thereby ensuring that the assessment of the mass flow rate through the turbine rotor is correct.
The validation procedure was developed following the same steps as the experimental campaign. The first phase is related to the validation of the waste-gate valve swallowing capacity for four waste-gate opening conditions (11%, 24%, 47%, and 100%, highlighted by the red vertical cursors in Figure 3). The validation is carried out by imposing a quasi-steady variation of the pressure in the upstream environment and the same thermal condition of the experimental activity. Moreover, in order to provide a more realistic model, the pressure ratio is numerically evaluated within the measuring stations, as reported in Figure 9. Figure 11 shows a comparison between numerical (solid blue lines) and experimental (dotted red lines) waste-gate mass flow rate values in single-flow operation. The waste-gate valve model shows a good agreement with the experimental data for all the considered cases with a maximum deviation condition of less than 2.78% at the maximum opening.
The turbine model in single-flow operation was then analyzed. In particular, for the turbine mass flow rate parameter, the same procedure used for the waste-gate valve was adopted; a good agreement between experimental data (in solid blue lines) and the numerical data (in dotted red lines) can be observed in Figure 12 with a maximum deviation of 4.35% with respect to experimental results.
In Figure 13, a comparison between numerical data (dotted lines) and experimental data (solid lines) can be observed with reference to isentropic and thermomechanical turbine efficiencies. As stated before, the isentropic experimental efficiency values were assessed by combining Equations (6) and (7). Numerical thermomechanical efficiency values were evaluated as the difference between the power produced by the turbine and the power lost because of friction in the bearings, with respect to the turbine isentropic power as reported in Equation (7).
At lower pressure ratios (light-blue circled region in Figure 13), due to heat transfer effects predominant in this region [33,34], simulations were not performed due to the unrealistic experimental data. However, these phenomena are not the focus of this article. For these reasons, results related to efficiencies do not consider the lowest rotational speed condition (i.e., lowest values of expansion ratio) in order to avoid unreliable results when the 1D model extrapolates the turbine maps [28].
As a further validation of the approach used for the evaluation of turbine efficiency and power levels, Figure 14 shows the trend of the turbine actual power (shown in blue) experimentally evaluated as the ratio between the power absorbed by the compressor and the mechanical efficiency, compared to the turbine power calculated through the 1D Model (shown in red in Figure 14). This last information is calculated at the rotor level in the turbine tool of GT-Power considering expansion ratio and temperature levels to guarantee coherence between the model and the experimental setup.
Once the single-flow operation of both the waste-gate valve and the turbine is validated, the modeling activity continued with the evaluation of the turbine behavior in parallel-flow conditions, where both the impeller and the wastegate circuits are open at the same time. The model results are presented in Figure 15 for waste-gate valve opening positions experienced during the experimental campaign (11%, 24%, 47%, and 100%). These results were obtained by imposing the effective orifice diameter corresponding to the analyzed waste-gate valve positions and turbine rotational speed levels considered. It must be remarked that the system was treated as its behavior in single-flow conditions with no additional adjustments or tuning applied to the model referred to as the parallel-flow operation. A good agreement between experimental data (blue lines) and numerical results (red lines) is reported in Figure 15. The average difference between the model and experimental results is around 2%, which is considered acceptable with reference to the accuracy of the sensors adopted. Hence, the model appears to effectively estimate the increase in the turbine mass flow rate in parallel-flow conditions as the waste-gate valve openings increase.
In Figure 16, the same analysis is reported with reference to thermomechanical efficiency values. The maximum deviation between experimental and numerical data is around 2%, which represents a satisfactory result. Then, a more detailed analysis of the flow split between the turbine rotor and the waste-gate port in parallel-flow conditions was conducted. Since the overall mass flow rate has been previously validated and the mass flow rate through the impeller is crucial to assess the turbine thermomechanical efficiency, it is possible to analyze how the mass flow rates are divided between the two channels in a parallel-flow configuration. This last information is crucial for the evaluation of the distribution of mass flow rates between the two channels. The thermomechanical efficiency depends not only on the overall turbine mass flow rate (validated in Figure 15) but also on the actual mass flow rate through the rotor, which is responsible for power delivered to the turbocharger shaft. Thanks to this information, the split of the mass flow rate through the by-pass port and the turbine rotor in parallel-flow conditions can be analyzed.
Figure 17 presents a comparison between mass flow rates measured in single-flow conditions and these assessed by the 1D model in parallel-flow conditions in order to highlight the behavior of the system with respect to an approach that treats the by-pass port and the impeller circuit as two nozzles working in parallel under the same pressure ratio. In Figure 17, the mass flow distribution between the by-pass channel and the rotor is shown with the waste-gate valve partially (Figure 17a) and fully (Figure 17b) open.
As expected, at lower waste-gate openings, the interaction between the two flows is negligible. For higher waste-gate valve openings, the interaction between the two flow components becomes more significant, leading to a noticeable decrease in the mass flow rate of both the waste-gate valve and the impeller with respect to the curves measured in single-flow conditions. The deviation highlighted in Figure 17 suggests that an interaction between the waste-gate valve and the impeller must be taken into account with the higher deviation at high waste-gate valve opening conditions. If the only information provided by the turbocharger manufacturer refers to the turbine swallowing capacity map with the waste-gate valve closed, inaccuracy in the calculation can be introduced in the 1D model, which generally considers the waste-gate valve and the impeller as two nozzles working in parallel conditions. Thanks to the experimental campaign aimed at the definition of the waste-gate valve behavior in single-flow conditions, it was possible to optimize the 1D model setup in order to define the magnitude of the interaction between the two flow components, as shown in Figure 17. If this optimization is not implemented in 1D models, turbine performance can be inaccurately calculated causing errors in the engine-turbocharger matching calculation that reflect differences in turbine power and, consequently, in the engine backpressure required to achieve the boost pressure target. This difference affects the engine Brake Specific Fuel Consumption (BSFC) and the engine torque and power output, along with an increase in the time required for engine calibration due to the difference between the estimated position of the waste-gate valve and the actual required position to achieve the target in engine torque demand.

4. Conclusions

This article presents an experimental and numerical investigation on the steady-state performance of a turbocharger turbine fitted with a waste-gate valve fully integrated into the volute.
The performances of the turbine and the waste-gate valve are first analyzed separately through an extensive experimental activity and the development of a 1D model. The study then analyzes the turbine behavior considering different positions of the waste-gate valve. The analysis highlights that the interaction between the flows through the impeller and by-pass port reduces the overall mass flow rate if compared to the sum of the swallowing capacities during single-flow operation. The experimental results are used to develop a 1D model, considering both the turbine and waste-gate valve channels. The first step of the validation procedure considers both the waste-gate valve and the turbine rotor operating in single-flow conditions. At this stage, based on an extensive experimental campaign, the mechanical losses of the turbocharger shaft and the turbine isentropic efficiency were included in the model to accurately define the power delivered by the turbine. This aspect is crucial to perform reliable simulations with the complete model operating under parallel-flow conditions. Thanks to the accurate development and validation of the components of the model, the predicted overall turbine mass flow rate and thermomechanical efficiency curves in parallel-flow conditions show good agreement with the experimental data. Thanks to the correct evaluation of the turbine performance, both in terms of overall swallowing capacity and thermomechanical efficiency (i.e., the power delivered to the turbocharger shaft by the turbine rotor), it was possible to analyze how the flow rates are distributed between the rotor and the waste-gate valve. In particular, the 1D model results highlight a decrease in the mass flow rate through the bypass port and the turbine rotor, as well as how the mass flow rates are split between these two channels working in parallel, confirming the sensitivity of turbine behavior to the interaction of the two flows. In particular, results indicate an important reduction in the turbine swallowing capacity, with reductions of up to 5% for high waste-gate valve openings. This outlines a significant dependency of the rotor channel behavior on the position of the waste-gate valve, which standard models do not capture. This effect impacts the turbine power delivered to the compressor, with non-negligible consequences on the performance estimation of the turbocharged engine.
In summary, a comprehensive experimental characterization of a wastegated turbocharger turbine in both single and parallel-flow configurations can help to improve the turbocharger engine modeling calculation allowing the development of a more accurate 1D model that predicts turbine performance, and provides information on the phenomena occurring within the turbine when the waste-gate valve is open.

Author Contributions

C.C., S.M. and V.U. have jointly contributed to the work concerning conceptualization, methodology, formal analysis, and investigation. All authors have read and agreed to the published version of the manuscript.

Funding

This research received no external funding.

Data Availability Statement

Data presented in this paper are not available due to confidentiality aspects.

Conflicts of Interest

The authors declare no conflicts of interest.

Nomenclature

Acronyms
1DOne-dimensional
BSFCBrake-Specific Fuel Consumption
CNGCompressed Natural Gas
CO2Carbon Dioxide
FSFull Scale
MVMeasured Value
NOxNitrogen Oxides
Notations
AArea, [m2]
C D Discharge coefficient, [-]
c p Specific heat at constant pressure, [J/(kg·K)]
kHeat capacity ratio
MMass Flow Rate, [kg/s]
NRotational speed factor, [rpm/√K]
nRotational speed, [rpm]
PPower, [W]
pPressure, [bar]
TTemperature, [K]
uVelocity, [m/s]
WGWaste-gate
εExpansion ratio, [-]
ηEfficiency, [-]
ΦMass flow rate factor, [(kg·K)/(s·bar)]
ρ Density, [kg/m3]
Subscripts and Superscripts
3Turbine inlet
4Turbine outlet
cCompressor
effEffective
isIsentropic
mMechanical
pmMechanical losses
refReference
SStatic condition
TTotal condition
tTurbine
TCTurbocharger
wgWaste-gate valve
Thermomechanical
*Normalized value

References

  1. Möring-Martínez, G.; Senzeybek, M.; Jochem, P. Clustering the European Union electric vehicle markets: A scenario analysis until 2035. Transp. Res. Part D Transp. Environ. 2024, 135, 104372. [Google Scholar] [CrossRef]
  2. Molina, S.; Novella, R.; Gomez-Soriano, J.; Olcina-Girona, M. Impact of medium-pressure direct injection in a spark-ignition engine fueled by hydrogen. Fuel 2024, 360, 130618. [Google Scholar] [CrossRef]
  3. ACEA. Vehicles in Use Europe 2022; ACEA: Brussels, Belgium, 2022. [Google Scholar]
  4. European Green Deal n.d. Available online: https://ec.europa.eu/clima/eu-action/european-greendeal_en (accessed on 17 March 2022).
  5. Samaras, Z.C.; Kontses, A.; Dimaratos, A.; Kontses, D.; Balazs, A.; Hausberger, S.; Ntziachristos, L.; Andersson, J.; Ligterink, N.; Aakko-Saksa, P.; et al. A European Regulatory Perspective towards a Euro 7 Proposal. SAE Int. J. Adv. Curr. Pract. Mobil. 2022, 5, 998–1011. [Google Scholar] [CrossRef]
  6. Di Blasio, G.; Ianniello, R.; Beatrice, C.; Pesce, F.; Vassallo, A.; Belgiorno, G. Additive manufacturing new piston design and injection strategies for highly efficient and ultra-low emissions combustion in view of 2030 targets. Fuel 2023, 346, 128270. [Google Scholar] [CrossRef]
  7. Molden, N. Innovative Emissions Measurement and Perspective on Future Tailpipe Regulation Real-world measurement and role of VOCs and N2O emissions. Johns. Matthey Technol. Rev. 2023, 67, 130–137. [Google Scholar] [CrossRef]
  8. Onorati, A.; Payri, R.; Vaglieco, B.M.; Agarwal, A.; Bae, C.; Bruneaux, G.; Canakci, M.; Gavaises, M.; Günthner, M.; Hasse, C.; et al. The role of hydrogen for future internal combustion engines. Int. J. Engine Res. 2022, 23, 529–540. [Google Scholar] [CrossRef]
  9. Misul, D.A.; Scopelliti, A.; Baratta, M. High-Performance Hydrogen-Fueled Internal Combustion Engines: Feasibility Study and Optimization via 1D-CFD Modeling. Energies 2024, 17, 1593. [Google Scholar] [CrossRef]
  10. de Lima, A.J.T.B.; Gallo, W.L.R. Investigations on energy efficiency enhancement under knock threshold limit conditions for a turbocharged direct-injection spark-ignition engine fueled with wet ethanol. Appl. Therm. Eng. 2023, 232, 121003. [Google Scholar] [CrossRef]
  11. Brin, J.; Waldron, T. Hydrogen Engine Testing with SuperTurbo Compared to Simulation; SAE Technical Paper 2024-01-2087; SAE International: Warrendale, PA, USA, 2024. [Google Scholar] [CrossRef]
  12. Andrisani, N.; Bagal, N. Benefits of Supercharger Boosting on H2 ICE for Heavy Duty Applications; SAE Technical Paper 2024-01-3006; SAE International: Warrendale, PA, USA, 2024. [Google Scholar] [CrossRef]
  13. Lai, F.Y.; Sun, B.G.; Xiao, G.; Luo, Q.H.; Bao, L.Z. Research on optimizing turbo-matching of a large-displacement PFI hydrogen engine to achieve high-power performance. Int. J. Hydrogen Energy 2023, 48, 38508–38520. [Google Scholar] [CrossRef]
  14. Usai, V.; Marelli, S. Evaluation of the transient performance of a two-stage hybrid boosting system for spark ignition engines. Proc. Inst. Mech. Eng. Part D J. Automob. Eng. 2023, 09544070231209082. [Google Scholar] [CrossRef]
  15. Stoffels, H.; Quiring, S.; Pingen, B. Analysis of transient operation of turbo charged engines. SAE Int. J. Engines 2010, 3, 438–447. [Google Scholar] [CrossRef]
  16. Tang, Q.; Fu, J.; Liu, J.; Boulet, B.; Tan, L.; Zhao, Z. Comparison and analysis of the effects of various improved turbocharging approaches on gasoline engine transient performances. Appl. Therm. Eng. 2016, 93, 797–812. [Google Scholar] [CrossRef]
  17. Galindo, J.; Serrano, J.R.; De la Morena, J.; Gómez-Vilanova, A. Physical-based variable geometry turbines predictive control to enhance new hybrid powertrains’ transient response. Energy 2022, 261, 125189. [Google Scholar] [CrossRef]
  18. Ismail, M.I.; Costall, A.; Martinez-Botas, R.; Rajoo, S. Turbocharger Matching Method for Reducing Residual Concentration in a Turbocharged Gasoline Engine; SAE Technical Papers 2007-01-0381; SAE International: Warrendale, PA, USA, 2015. [Google Scholar] [CrossRef]
  19. Bozza, F.; Gimelli, A.; Strazzullo, L.; Torella, E.; Cascone, C. Steady-State and Transient Operation Simulation of a “Downsized” Turbocharged SI Engine; SAE Technical Paper 2007-01-0381; SAE International: Warrendale, PA, USA, 2007. [Google Scholar] [CrossRef]
  20. Capobianco, M.; Marelli, S. Waste-Gate Turbocharging Control in Automotive SI Engines: Effect on Steady and Unsteady Turbine Performance; SAE Technical Papers 2007-01-3543; SAE International: Warrendale, PA, USA, 2007. [Google Scholar] [CrossRef]
  21. Serrano, J.R.; Arnau, F.J.; Andrés, T.; Samala, V. Experimental procedure for the characterization of turbocharger’s waste-gate discharge coefficient. Adv. Mech. Eng. 2017, 9, 1687814017728242. [Google Scholar] [CrossRef]
  22. Capobianco, M.; Marelli, S. Experimental analysis of unsteady flow performance in an automotive turbocharger turbine fitted with a waste-gate valve. Proc. Inst. Mech. Eng. Part D J. Automob. Eng. 2011, 225, 1087–1097. [Google Scholar] [CrossRef]
  23. Deng, Q.; Burke, R.D.; Zhang, Q.; Pohorelsky, L. A Research on Waste-Gated Turbine Performance Under Unsteady Flow Condition. In Proceedings of the ASME Turbo Expo 2016: Turbomachinery Technical Conference and Exposition, Seoul, Republic of Korea, 13–17 June 2016. [Google Scholar] [CrossRef]
  24. Ghazikhani, M.; Davarpanah, M.; Mousavi Shaegh, S.A. An experimental study on the effects of different opening ranges of waste-gate on the exhaust soot emission of a turbo-charged DI diesel engine. Energy Convers. Manag. 2008, 49, 2563–2569. [Google Scholar] [CrossRef]
  25. Kharazmi, S.; Hajilouy-Benisi, A.; Mozafari, A. Experimental Investigation of Waste Gate Effects on Performance and NOx Emissions in a Turbocharged Aftercooled CNG SI Engine and its Turbocharger; SAE Technical Paper 2015-01-1957; SAE International: Warrendale, PA, USA, 2015. [Google Scholar] [CrossRef]
  26. Serrano, J.R.; Arnau, F.J.; Novella, R.; Reyes-Belmonte, M.A. A Procedure to Achieve 1D Predictive Modeling of Turbochargers under Hot and Pulsating Flow Conditions at the Turbine Inlet; SAE Technical Paper 2014-01-1080; SAE International: Warrendale, PA, USA, 2014. [Google Scholar] [CrossRef]
  27. De Bellis, V.; Bozza, F.; Marelli, S.; Capobianco, M. Advanced Numerical/Experimental Methods for the Analysis of a Waste-Gated Turbocharger Turbine. SAE Int. J. Engines 2014, 7, 145–155. [Google Scholar] [CrossRef]
  28. Gamma Technologies Inc. GT-Power User’s Manual and Tutorial, GT Suite; Gamma Technologies Inc.: Westmont, IL, USA, 2022. [Google Scholar]
  29. Ketata, A.; Driss, Z.; Abid, M.S. Impact of the wastegate opening on radial turbine performance under steady and pulsating flow conditions. Proc. Inst. Mech. Eng. Part D J. Automob. Eng. 2020, 234, 652–668. [Google Scholar] [CrossRef]
  30. Salehi, R.; Vossoughi, G.; Alasty, A. Modeling and Estimation of Unmeasured Variables in a Wastegate Operated Turbocharger. J. Eng. Gas Turbines Power 2014, 136, 052601. [Google Scholar] [CrossRef]
  31. Cordalonga, C.; Usai, V.; Marelli, S. Experimental and numerical analysis of a waste-gated turbine for automotive turbocharged engine. J. Phys. Conf. Ser. 2024, 2893, 012098. [Google Scholar] [CrossRef]
  32. Usai, V.; Marelli, S. Steady state experimental characterization of a twin entry turbine under different admission conditions. Energies 2021, 14, 2228. [Google Scholar] [CrossRef]
  33. Aghaali, H.; Ångström, H.E. Turbocharged si-engine simulation with cold and hot-measured turbocharger performance maps. In Proceedings of the ASME Turbo Expo 2012: Turbine Technical Conference and Exposition, Copenhagen, Denmark, 11–15 June 2012. [Google Scholar] [CrossRef]
  34. Chung, J.E.; Chung, J.; Kim, N.H.; Lee, S.W.; Kim, G.Y. An investigation on the efficiency correction method of the turbocharger at low speed. Energies 2018, 11, 269. [Google Scholar] [CrossRef]
  35. Toussaint, L.; Marques, M.; Morand, N.; Davies, P.; Groves, C.; Tomanec, F.; Zatko, M.; Vlachy, D.; Mrazek, R. Improvement of a turbocharger by-pass valve and impact on performance, controllability, noise and durability. In Proceedings of the Institution of Mechanical Engineers—11th International Conference on Turbochargers and Turbocharging, London, UK, 13–14 May 2014. [Google Scholar] [CrossRef]
  36. Zimmermann, R.; Baar, R.; Biet, C. Determination of the isentropic turbine efficiency due to adiabatic measurements and the validation of the conditions via a new criterion. Proc. Inst. Mech. Eng. Part C J. Mech. Eng. Sci. 2018, 232, 4485–4494. [Google Scholar] [CrossRef]
  37. Zhihui, W.; Chaochen, M.; Nian, J. Temperature measurement at turbine outlet achieved by a sensing net and infrared thermometry method. Int. J. Therm. Sci. 2024, 196, 108706. [Google Scholar] [CrossRef]
  38. Cordalonga, C.; Marelli, S.; Usai, V.; Capobianco, M. Indirect Assessment of Isentropic Efficiency in Turbocharger Turbines via Mechanical Efficiency Evaluation under Quasi-Adiabatic Test; SAE Technical Papers 2023-24-0121; SAE International: Warrendale, PA, USA, 2023. [Google Scholar] [CrossRef]
Figure 1. Layout of the test rig for components of propulsion systems of the University of Genoa.
Machines 13 00054 g001
Figure 2. Waste-gate mass flow rate parameter normalized map with the rotor channel closed (single-flow conditions) [31].
Machines 13 00054 g002
Figure 3. Waste-gate valve effective area normalized versus its position in single-flow conditions [31].
Machines 13 00054 g003
Figure 4. Turbine mass flow rate parameter normalized map with the waste-gate valve kept closed (single-flow conditions).
Machines 13 00054 g004
Figure 5. Turbine thermomechanical normalized map with the waste-gate valve kept closed (single-flow conditions).
Machines 13 00054 g005
Figure 6. Turbine mass flow parameter normalized map for different positions of the waste-gate valve (parallel-flow conditions) [31].
Machines 13 00054 g006
Figure 7. Turbine thermomechanical efficiency normalized map for different positions of the waste-gate valve (parallel-flow conditions) [31].
Machines 13 00054 g007
Figure 8. Comparison of turbine mass flow parameters in single flow (dashed lines) and parallel flow (continuous lines) [31].
Machines 13 00054 g008
Figure 9. Wastegated turbine GT-Power model.
Machines 13 00054 g009
Figure 10. Normalized turbine efficiencies (thermomechanical, mechanical, and isentropic).
Machines 13 00054 g010
Figure 11. Experimental and numerical swallowing capacities of the waste-gate valve in single-flow conditions.
Machines 13 00054 g011
Figure 12. Experimental and numerical turbine swallowing capacities in single-flow conditions.
Machines 13 00054 g012
Figure 13. Experimental and numerical turbine thermomechanical and isentropic efficiencies in single-flow conditions.
Machines 13 00054 g013
Figure 14. Experimental and numerical turbine power in single-flow conditions.
Machines 13 00054 g014
Figure 15. Experimental and numerical turbine swallowing capacity map in parallel-flow conditions for different waste-gate valve openings.
Machines 13 00054 g015
Figure 16. Experimental and numerical thermomechanical efficiency curves in parallel-flow conditions for different waste-gate valve openings.
Machines 13 00054 g016
Figure 17. Experimental swallowing capacities of rotor and waste-gate valve channels in single-flow conditions and numerical swallowing capacities of rotor and waste-gate valve channels in parallel-flow conditions.
Machines 13 00054 g017
Table 1. Uncertainties of the sensors.
Measured QuantitiesSensorsUncertainty
PressurePiezoresistive transducers±0.10% FS
TemperaturePlatinum resistance thermometers±0.15 °C and ±0.2% MV
TemperatureK-Type Thermocouples±0.5 °C
Mass flow rateThermal mass flow meter±0.9% MV and ±0.05% FS
Turbocharger rotational speedEddy current probe±0.009% FS
Waste-gate valve positionRotary position sensor±0.5°
Table 2. Test program for the waste-gate valve analysis in single-flow operation.
Waste-Gate Valve Opening Positions:
5%21%39%66%
11%24%47%79%
16%26%53%100% (fully open)
At least 14 different measuring points for each waste-gate opening position
Table 3. Test program for the turbine characterization in single-flow operation.
Turbine Rotational Speed Factor *:
Nt = 26%Nt = 47%Nt = 72%Nt = 90%
Nt = 29%Nt = 57%Nt = 78%Nt = 95%
Nt = 38%Nt = 66%Nt = 83%Nt = 100%
At least 10 different measuring points for each iso speed
Table 4. Test program under parallel-flow conditions.
Turbine Rotational Speed Factor *:
Nt = 26%Nt = 47%Nt = 72%Nt = 90%
Nt = 29%Nt = 57%Nt = 78%Nt = 95%
Nt = 38%Nt = 66%Nt = 83%Nt = 100%
Waste-gate opening positions *:
11%24%47%100%
Disclaimer/Publisher’s Note: The statements, opinions and data contained in all publications are solely those of the individual author(s) and contributor(s) and not of MDPI and/or the editor(s). MDPI and/or the editor(s) disclaim responsibility for any injury to people or property resulting from any ideas, methods, instructions or products referred to in the content.

