Article

Electrical and Thermal Anisotropy in Additively Manufactured AlSi10Mg and Fe-Si Samples †

1
Department of Electrical Power Engineering and Mechatronics, Tallinn University of Technology, 19086 Tallinn, Estonia
2
Department of Mechanical and Industrial Engineering, Tallinn University of Technology, 19086 Tallinn, Estonia
3
Electrical Engineering Unit, Tampere University, P.O. Box 692, FI-33014 Tampere, Finland
*
Author to whom correspondence should be addressed.
This paper is an extended version of our paper published in 2022 International Conference on Electrical Machines (ICEM), Valencia, Spain, 5–8 September 2022.
Machines 2025, 13(1), 1; https://doi.org/10.3390/machines13010001
Submission received: 26 November 2024 / Revised: 13 December 2024 / Accepted: 21 December 2024 / Published: 24 December 2024
(This article belongs to the Special Issue Additive Manufacturing of Electrical Machines)

Abstract

:
In the context of rising power densities in electrical machines, additive manufacturing presents an opportunity to develop more powerful thermal solutions. However, the physical properties of objects manufactured using this process remain unclear. This research examines the directional thermal and electrical conductivities of aluminum alloy (AlSi10Mg) and silicon steel (Fe-3.7%wt. Si) samples produced via laser powder bed fusion (LPBF), both prior to and following heat treatment. The findings indicate that the as-built aluminum samples exhibit higher conductivities in the orientation parallel to the LPBF build direction, while annealing results in higher conductivities overall and an absence of anisotropy. On the other hand, the silicon steel samples show constant conductivities and lack of anisotropy both before and after heat treatment. These results have practical applications in the design of additively manufactured electrical machines, where the thermal and electrical resistance of the materials have a major impact on thermal and electromagnetic performance.

1. Introduction

Additive manufacturing (AM) offers unparalleled design freedom in many fields, including electrical machines, where laser powder bed fusion (LPBF) can be used to manufacture all parts of the machine. Currently, commercial use of LPBF is limited to highly demanding applications such as aerospace, meaning that AM electrical machines are currently in the research phase. However, ongoing trends in the wider adoption of AM and more cost- and time-efficient machines (e.g., multi-laser systems) ensure that the technology is becoming prevalent in other fields as well.
While AM can be used with a wide selection of materials to manufacture parts with high complexity (the cost of manufacturing is only weakly dependent on part complexity), the physical properties of the final parts are not always the same as the base material and can be anisotropic [1]. This includes the material’s thermal conductivity (TC) and electrical conductivity (EC), which can depend on several manufacturing parameters, such as the build orientation, laser energy density [2], and laser scan speed [3]. The main effects that influence the physical properties of the final AM part are porosity and crystal structure. The effects of porosity have become less relevant, as relative densities well above 99% are routinely achieved with LPBF [4]. Therefore, the often anisotropic crystal structure resulting from the LPBF process, which involves high-temperature gradients [5] and rapid directional cooling rates [6], is the main contributor to changes in the physical properties of the final part.
The two most relevant materials in the field of AM electrical machines are silicon steel as the soft-magnetic material [7] and the aluminum alloy AlSi10Mg as the electrically and thermally conductive material [8]. Electrical machines can have relevant heat flux and electrical current through both of these materials in any direction, meaning that knowing the TC and EC in each axis is needed to create optimal designs.
The crystal structure of high-silicon steel (6.9%wt. Si) manufactured via LPBF was analyzed by Garibaldi et al., who found columnar grains oriented towards the build direction, which depended on the laser energy [9]. Kang et al. [10] measured the magnetic properties of LPBF Fe-Ni-Si samples and found a more favorable hysteresis loop when magnetizing the part in the build direction, which they attributed to the columnar grain structure. Therefore, while the magnetic properties of silicon steel manufactured with LPBF have been shown to be anisotropic, its thermal conductivity has not been thoroughly researched.
The physical and mechanical properties of the aluminum alloy AlSi10Mg have been previously studied and are known to be anisotropic. Mfusi et al. [11] manufactured AlSi10Mg samples with different build orientations and found higher ultimate tensile strength in the build direction. Anisotropic thermal conductivities in AlSi10Mg samples have been measured by several groups [12,13], with around 10% higher TC in the build direction and a reduction in anisotropy with heat treatment being the common result.
Knowing the thermal properties of the relevant materials is essential when designing optimized electrical machines. In the case of additive manufacturing, this extends to a need to know the properties in the case of the specific manufacturing method. This article is an extension of our previously published conference paper [1], in which the direction-dependent TC of silicon steel (3.7%wt. Si) and AlSi10Mg samples manufactured via LPBF are determined. As an extension of that work, we have measured the electrical conductivity of the materials. Furthermore, we have utilized optical and electron microscopy for visualizing the crystal structure of the materials, in order to give an explanation for the measurement results.

2. Methodology

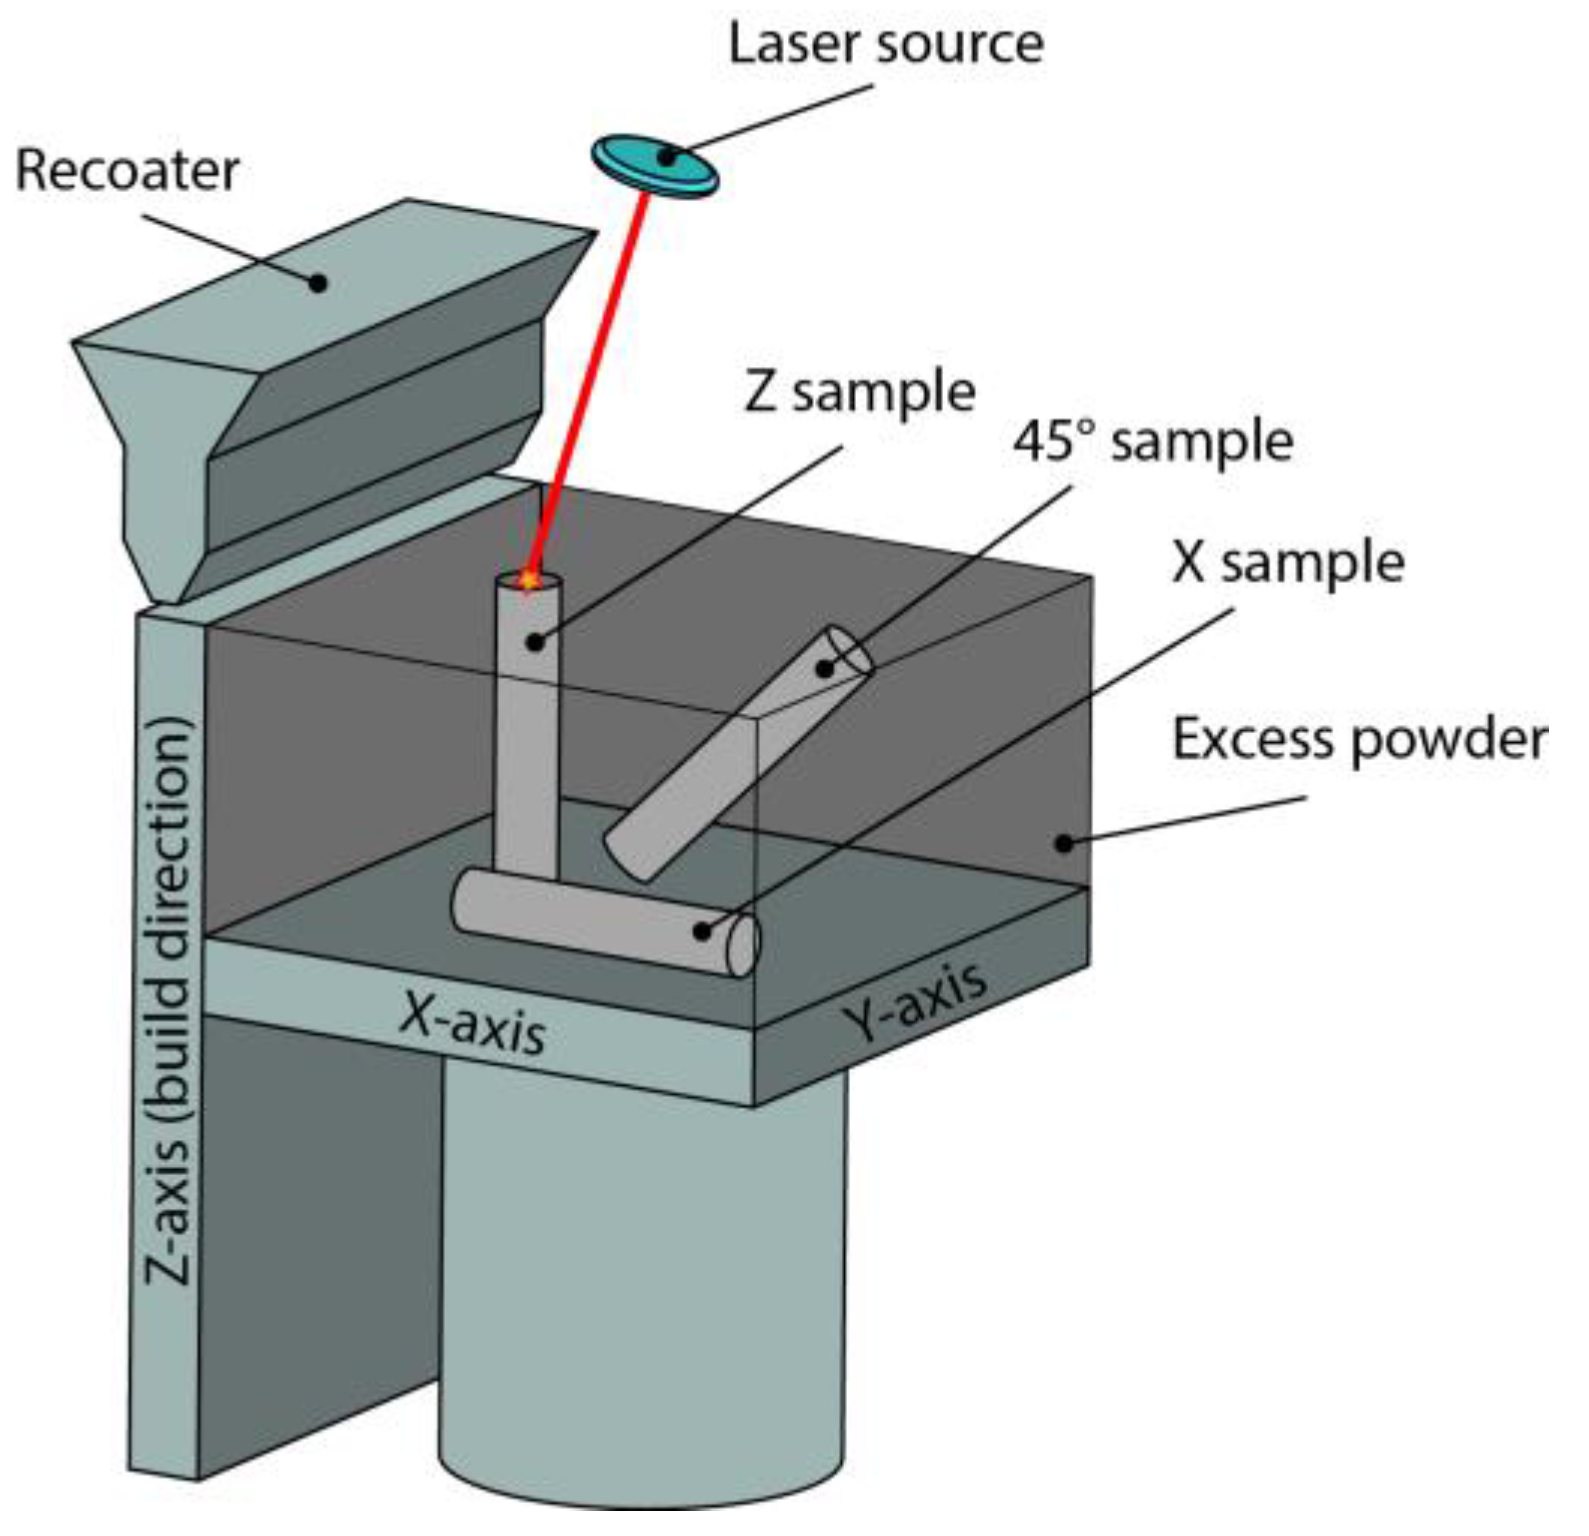
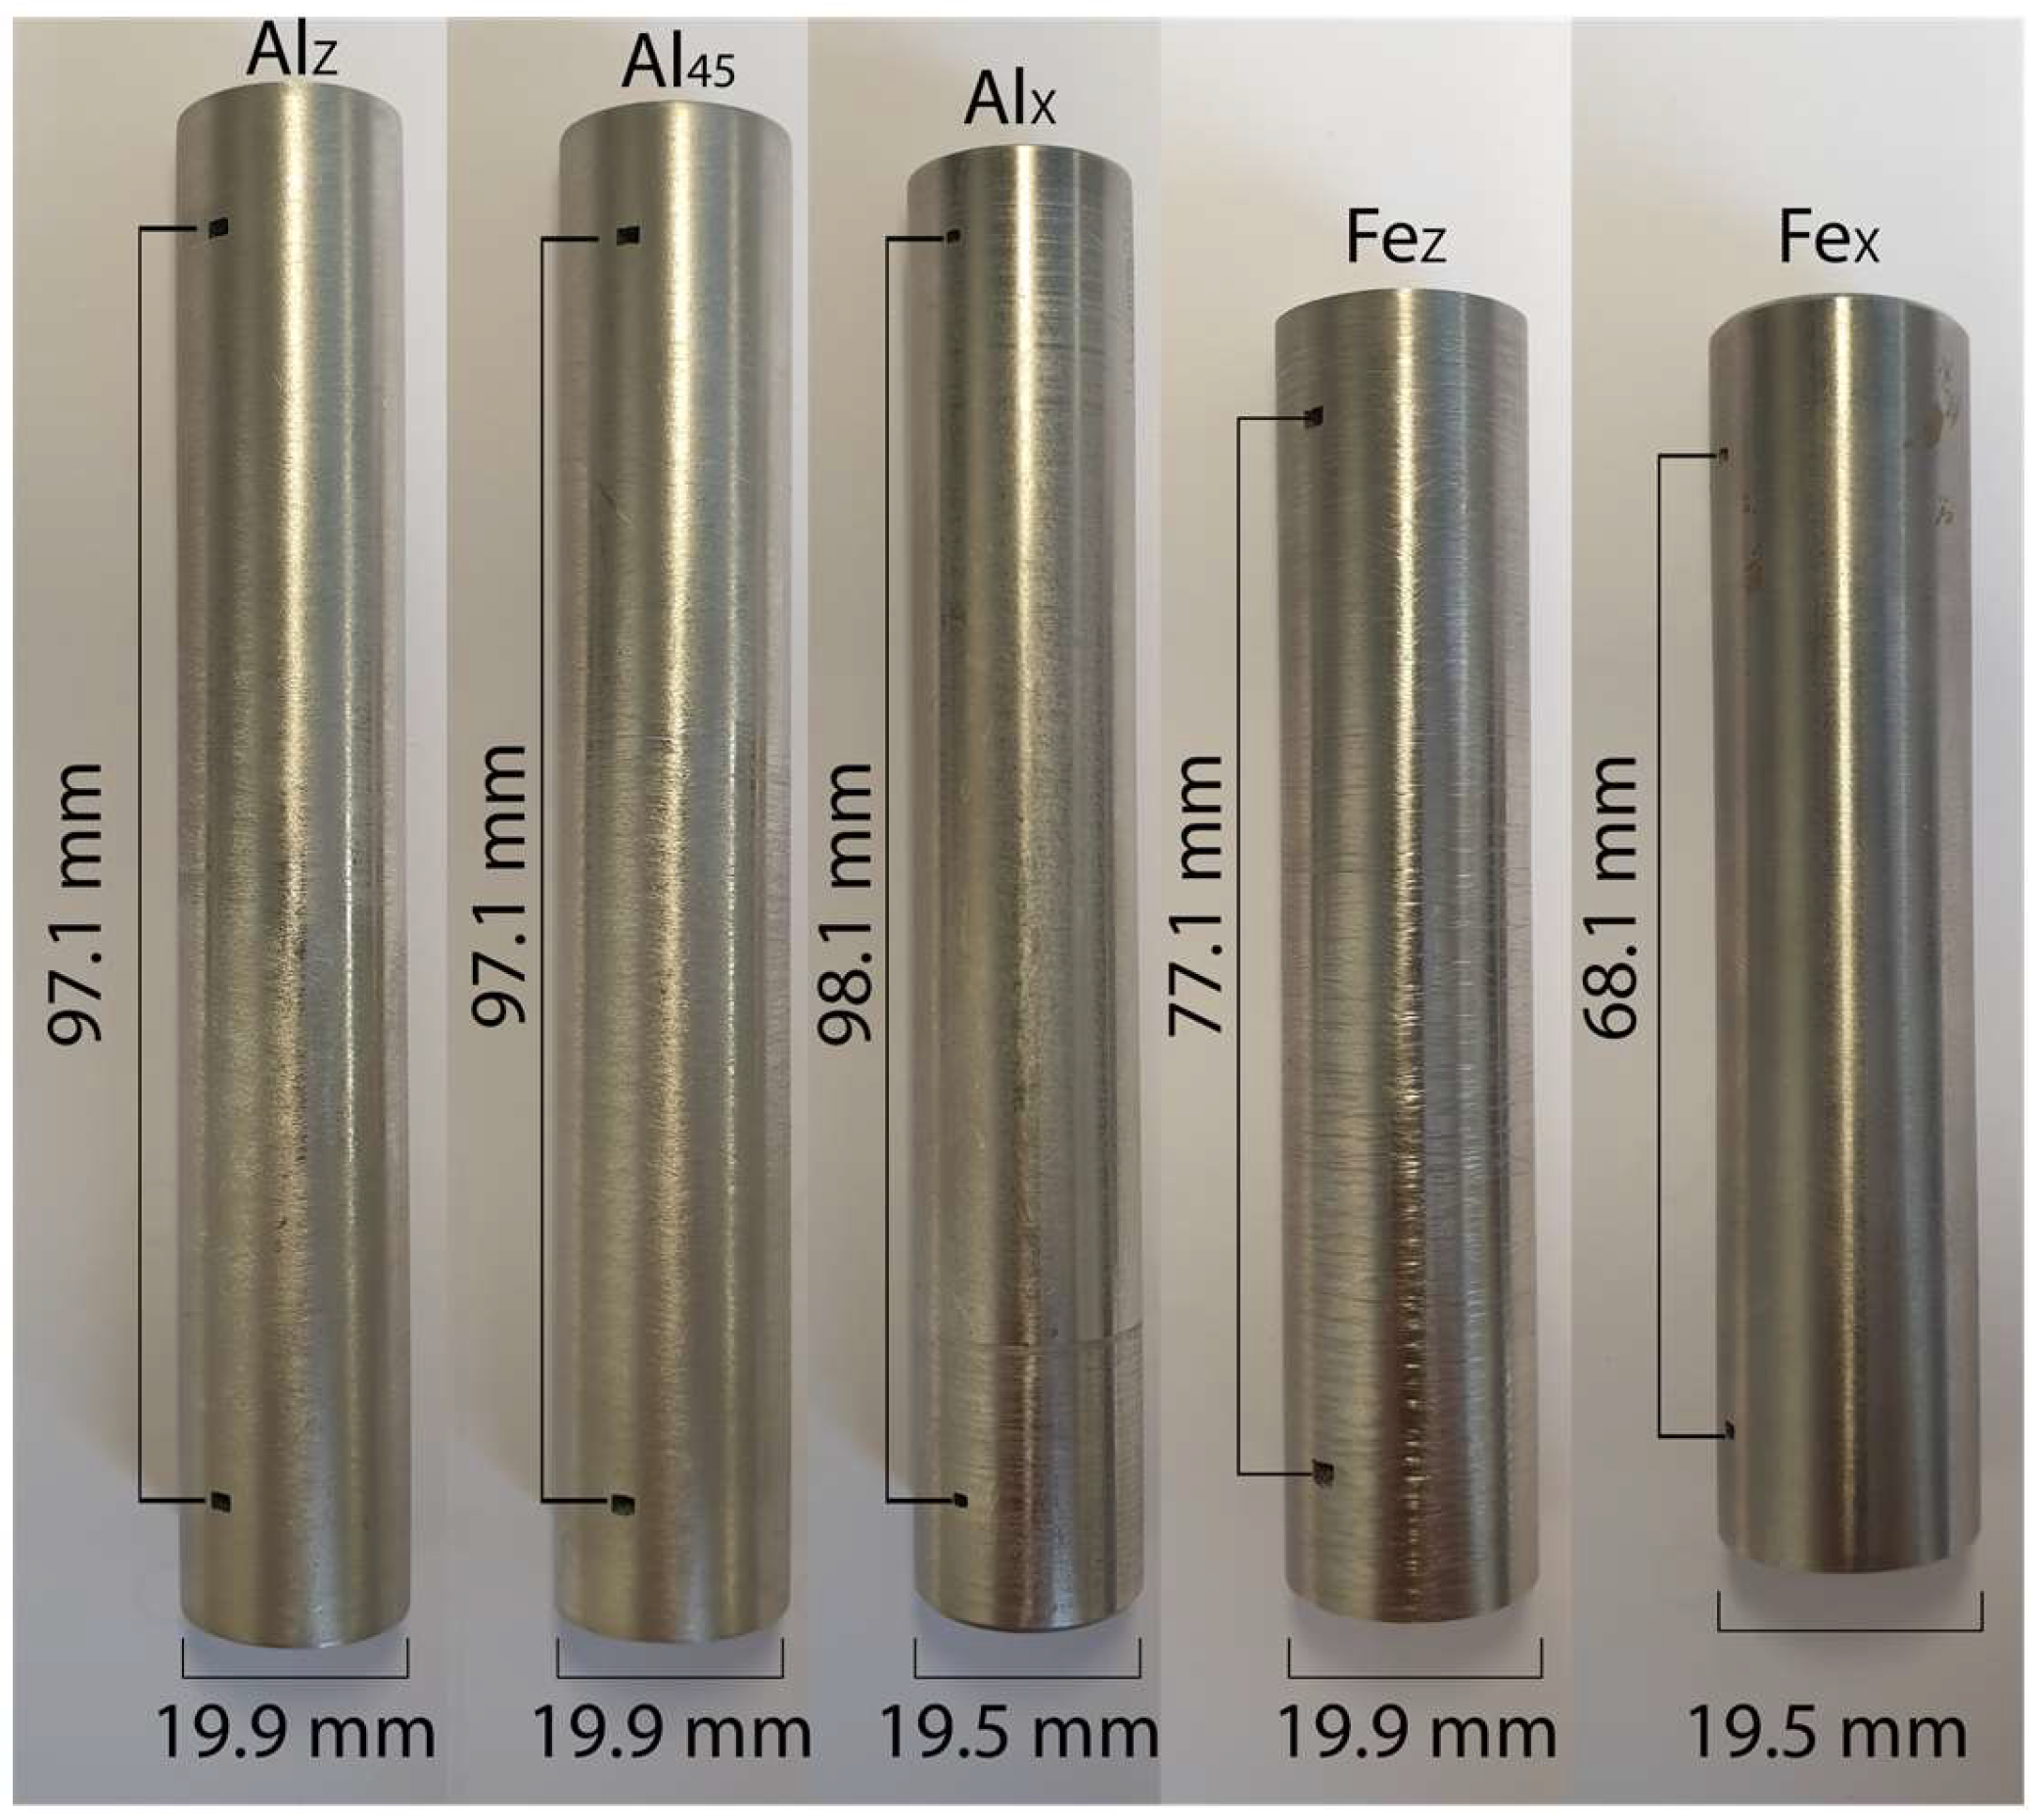
2.1. Sample Preparation

All the samples measured in this paper were manufactured using LPBF, of which a simplified illustration is provided in Figure 1. This is an AM method, where thin layers of powder are melted with one or more lasers to form a three-dimensional object. Modern LPBF devices are capable of manufacturing single parts with outer dimensions in excess of 1 × 1 × 1 m and without any degradation in mechanical properties throughout the part. However, the inherent directionality of heat flux during the LPBF process and the rapid cooling rates involved can create anisotropicity in the part, which can have significant effects on physical properties such as thermal and electrical conductivity. It should be noted that in principle, the location of the object on the build platform changes the direction of heat flux in both heating and cooling. Therefore, it can have an appreciable effect on its physical parameters. However, in this article, each sample is printed near the center of the platform, meaning that any effects of part location are not observed.
A number of AlSi10Mg and Fe-Si (3.7%wt. Si) samples were built using LPBF in different orientations, to study the effects of manufacturing direction on the thermal and electrical conductivities of LPBF samples. Table 1 includes a list of the samples used in this paper. The designators Z, X, and 45° correspond to a manufacturing orientation that is parallel, perpendicular, and at a 45° angle to the LPBF build direction, respectively.
The physical and mechanical properties of objects manufactured via LPBF depend on the specific manufacturing parameters; however, the exact details of the causes are not always known. Generally, the variations in properties are explained through variations in energy density when heating the material. For example, laser energy density (directly defined by laser power) and part porosity are highly correlated [14,15], with low energies and high energies both resulting in increased porosity through partial melting and melt pool instabilities, respectively. The effective power density of the heating is also dependent on the path of the laser, which is in part defined by hatch spacing (the distance between adjacent scan tracks of the laser). It is known that layer thickness, laser power, and scanning velocity can affect the relative density and hardness of the LPBF part [16]. The scan strategy, which describes the exact pattern of the laser beam during the manufacturing process, can affect the object’s crystallographic texture and therefore create anisotropy in the final part [17]. Therefore, when describing the material properties of LPBF parts, knowing the specific manufacturing parameters is crucial in order to reproduce the results and apply the knowledge in practical designs. Table 2 presents the parameters used for manufacturing the samples in this article. These can be considered typical values, which have an excellent success rate and result in effectively non-porous parts with mechanical properties equal to the base material.
Metal parts produced through additive manufacturing are often subjected to annealing to improve their properties through enhanced crystallographic texture and reduced anisotropy. The process involves heating the part above its recrystallization temperature for some duration, followed by cooling. The crystal structure of the material can be altered in a desirable manner by precisely controlling the temperature of the processed part over the duration of the process. For the samples used in this paper, post-manufacturing thermal treatments were performed in a graphite chamber Webb-107 vacuum furnace. The samples were heated in a ~0.1 mbar vacuum environment, with a heating rate of 300 °C/h up to the target temperature, then held for the desired duration, which was followed by slow furnace cooling. The target temperature and annealing duration were 1200 °C and 1 h for the silicon steel and 300 °C and 2 h for the aluminum.

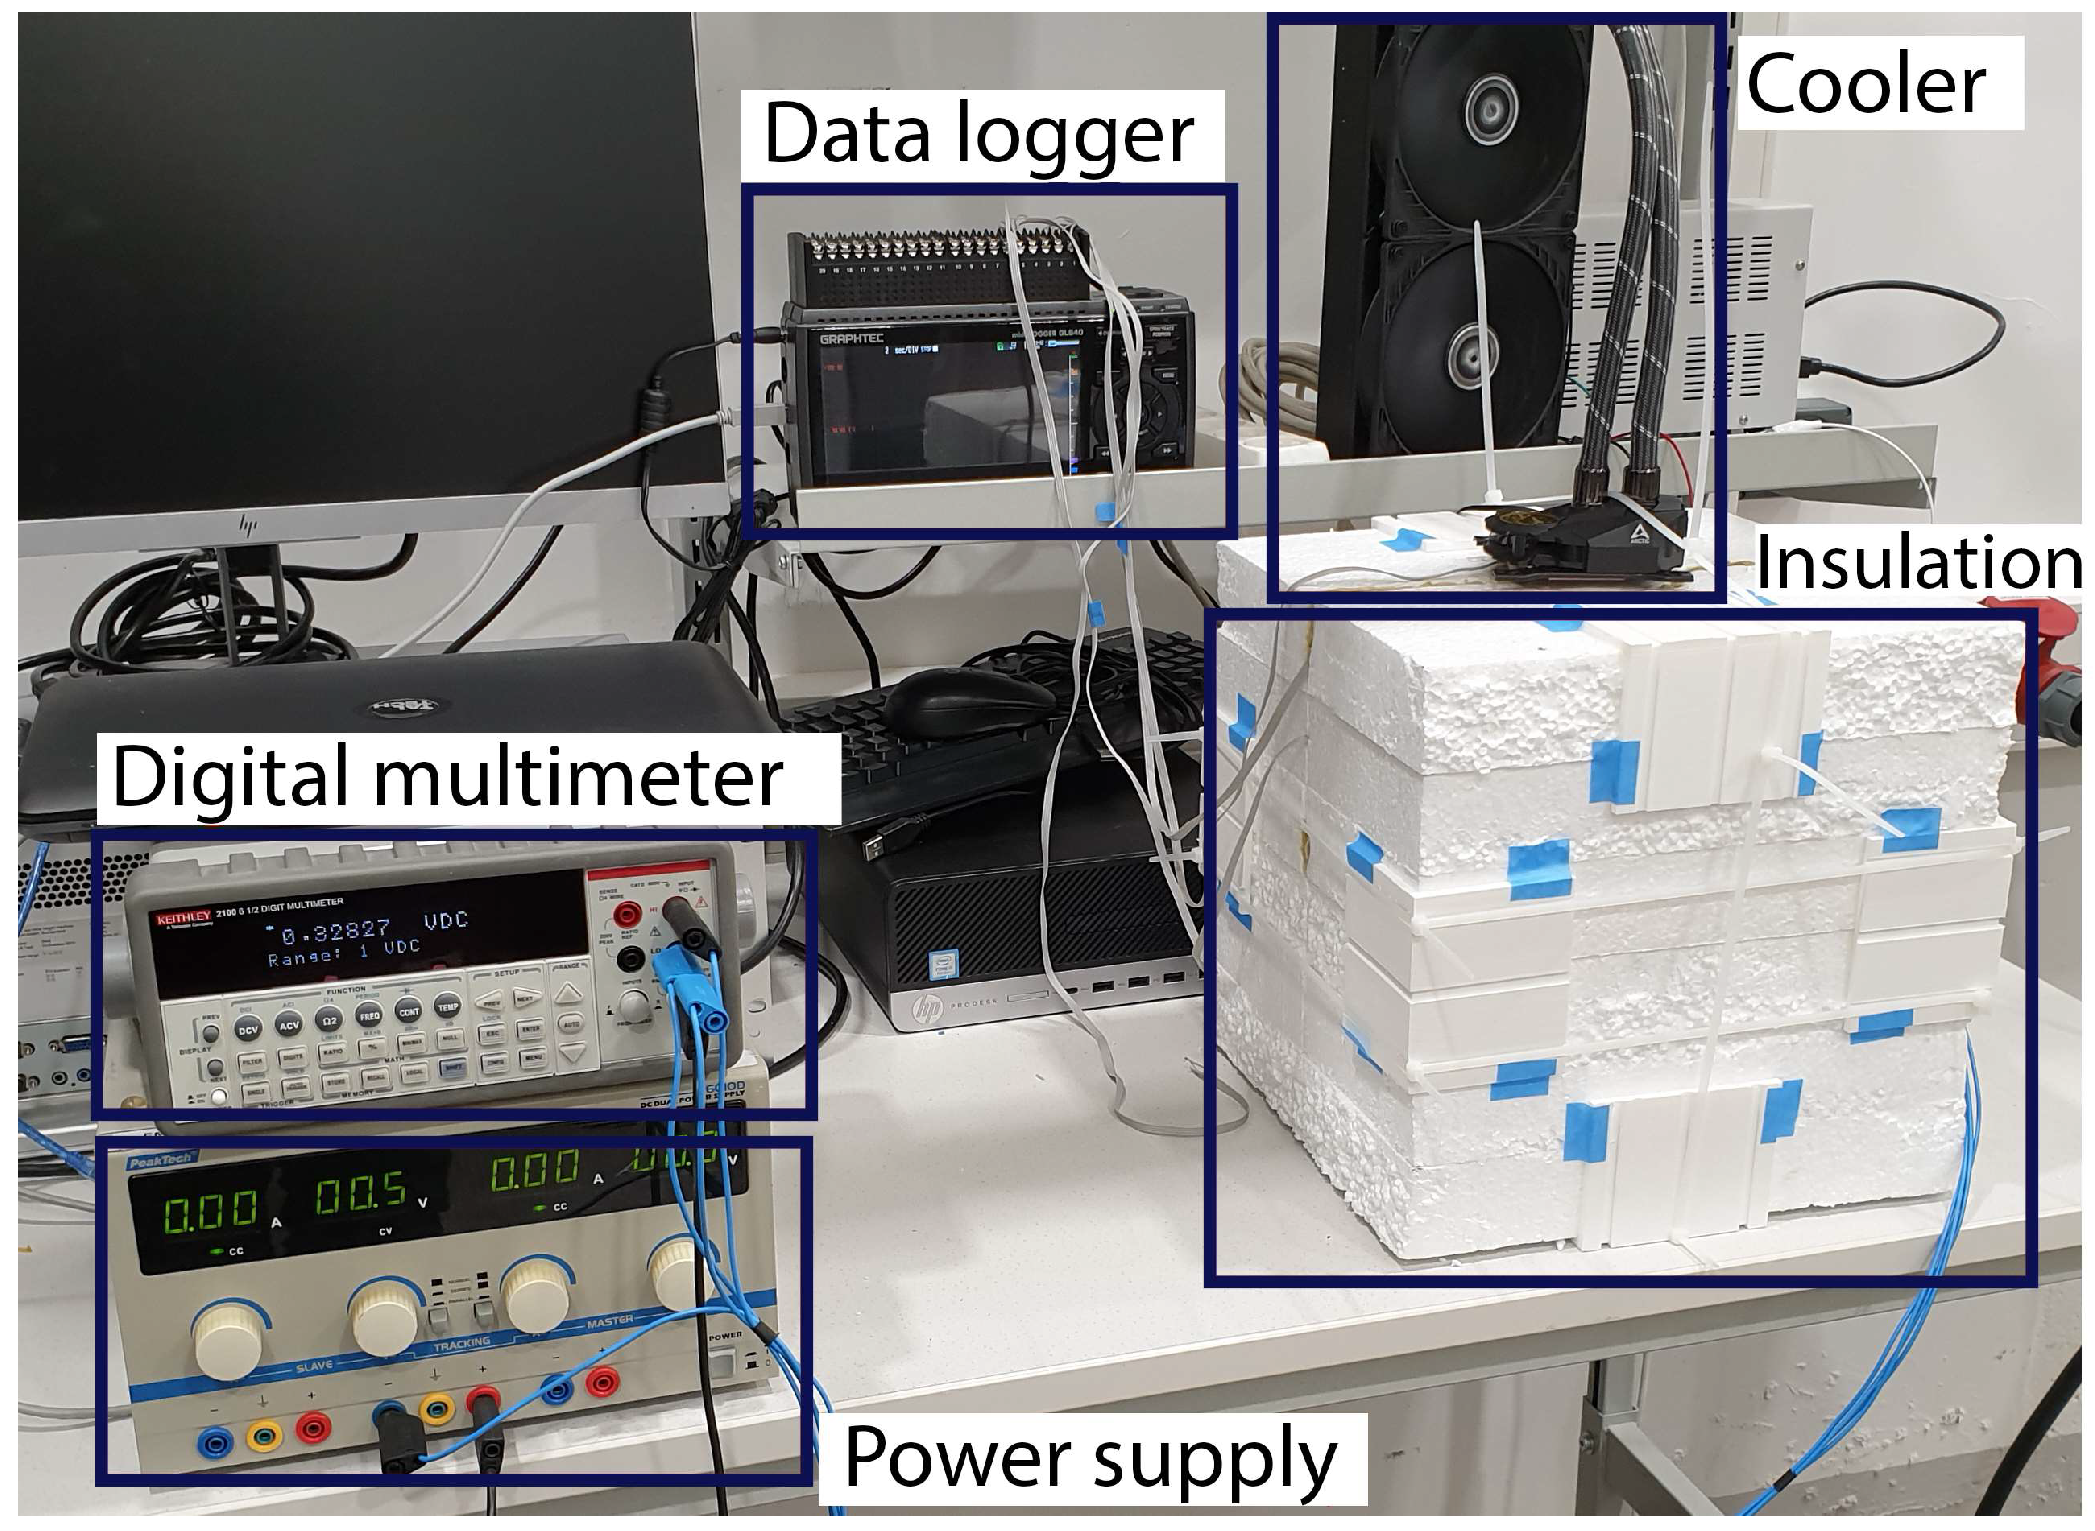
2.2. Measuring Thermal Conductivity

The thermal conductivity of solid materials can be measured in different ways. The most common is laser flash analysis (LFA), which is frequently used in the literature for measuring LPBF samples. However, it is only applicable for fully dense and homogeneous materials [18], making it potentially inaccurate when measuring AM samples. Therefore, the TC of the samples is measured using the longitudinal heat flow method. This method consists of heating the sample from one end and cooling it from the other end, while measuring the temperature difference over a specified length when a steady state has been reached. As the total input power can be accurately measured, the TC of the material can be derived from Fourier’s law. The measurement schematic is presented in Figure 2.
The specific method used in this paper omits the direct measurement of heat flux through the sample, which is normally achieved through two reference standards with known conductivity at the ends of the sample. By measuring this flux directly, any leakage heat flow through the insulation is effectively made irrelevant. However, using reference standards introduces additional uncertainties, such as in the value of their TC, additional temperature sensors (uncertainties in both positioning and readings) and added surfaces with thermal contact resistances.
Instead, in the method used in this paper, the flux is calculated numerically using a simple 3D model with inputs for the temperatures of the heatsink and the surface of the insulation. As long as the sample is properly insulated, the leakage heat flow through the insulation is several orders of magnitude lower than the total power input. In this case, considering the simplicity of the geometry, it is reasonable to claim that calculating the leakage flow results in a high degree of certainty in addition to a simpler testing setup.
Three AlSi10Mg samples were manufactured to measure the effect of build orientation on the TC of the parts. According to the manufacturer, the TC of this material is 130–150 W/m/K at 20 °C after annealing [19]. Another manufacturer of the same alloy [20] gives the as-built TC as 100–110 W/m/K.
Two samples ( F e z and F e x ) were manufactured from silicon steel (3.7%wt. Si), which is a material widely used for AM soft-magnetic applications. The composition and magnetic properties of this specific material have been measured previously in [21]. As the thermal properties of AM silicon steel are not well known, a commercially available material (3.0%wt. Si) with a thermal conductivity of 28 W/m/K [22] is used as a comparison.
Each sample includes small rectangular holes for the PT100 temperature sensors, which allow the location of the sensors, and therefore the active length of the samples, to be accurately known, reducing one of the main sources of uncertainty normally present in TC measurements. After the AM process, the samples received post-processing to achieve a uniform diameter and smooth finish on all surfaces. The ends of the samples were polished for reduced thermal resistance. The samples together with the relevant dimensions are presented in Figure 3.
The TC measurements were performed in a thermally stable room with no appreciable airflow affecting the cooler and the insulation around the test samples. Several different values for the input power were used to measure the TC of the samples at different temperatures. For each separate measurement, the system was given several hours to reach a steady state to eliminate any transient effects caused by thermal capacitance. A TO-220 power resistor screwed to the bottom of the sample was used to provide the input heat through a very low thermal resistance, while allowing the total electrical input power to be accurately measured. The cold side of the sample was cooled by a water-cooling unit to create a large temperature gradient over the length of the sample. The performance of the cooling is important, as it helps decrease the overall thermal resistance of the sample stack and therefore reduces the unwanted heat flow through the insulation. The measurement setup is presented in Figure 4.
The uncertainties of the TC measurements are calculated by using the maximum and minimum possible values based on the uncertainty of each individual measurement. The largest source of uncertainty comes from the accuracy of the temperature sensors, which is specified as ±0.1 + 0.00017|T|. Another contributing factor is the measurement error of the physical dimensions of the samples, particularly the distance between the temperature sensors, which was measured via digital calipers with an accuracy of 0.01 mm. The approximation of insulation losses through the use of a numerical model is also a contributor, with a relative uncertainty of the effective heat flow estimated to be around 0.5–1%, depending on the conductivity of the sample. Other smaller sources of uncertainty, such as measuring the electrical input power, were also considered. The resulting relative errors for the TC measurements fell between 3% and 5%. It is worth mentioning that the uncertainty is mostly relevant when considering absolute values, and the method can be used to compare different samples with very high consistency.

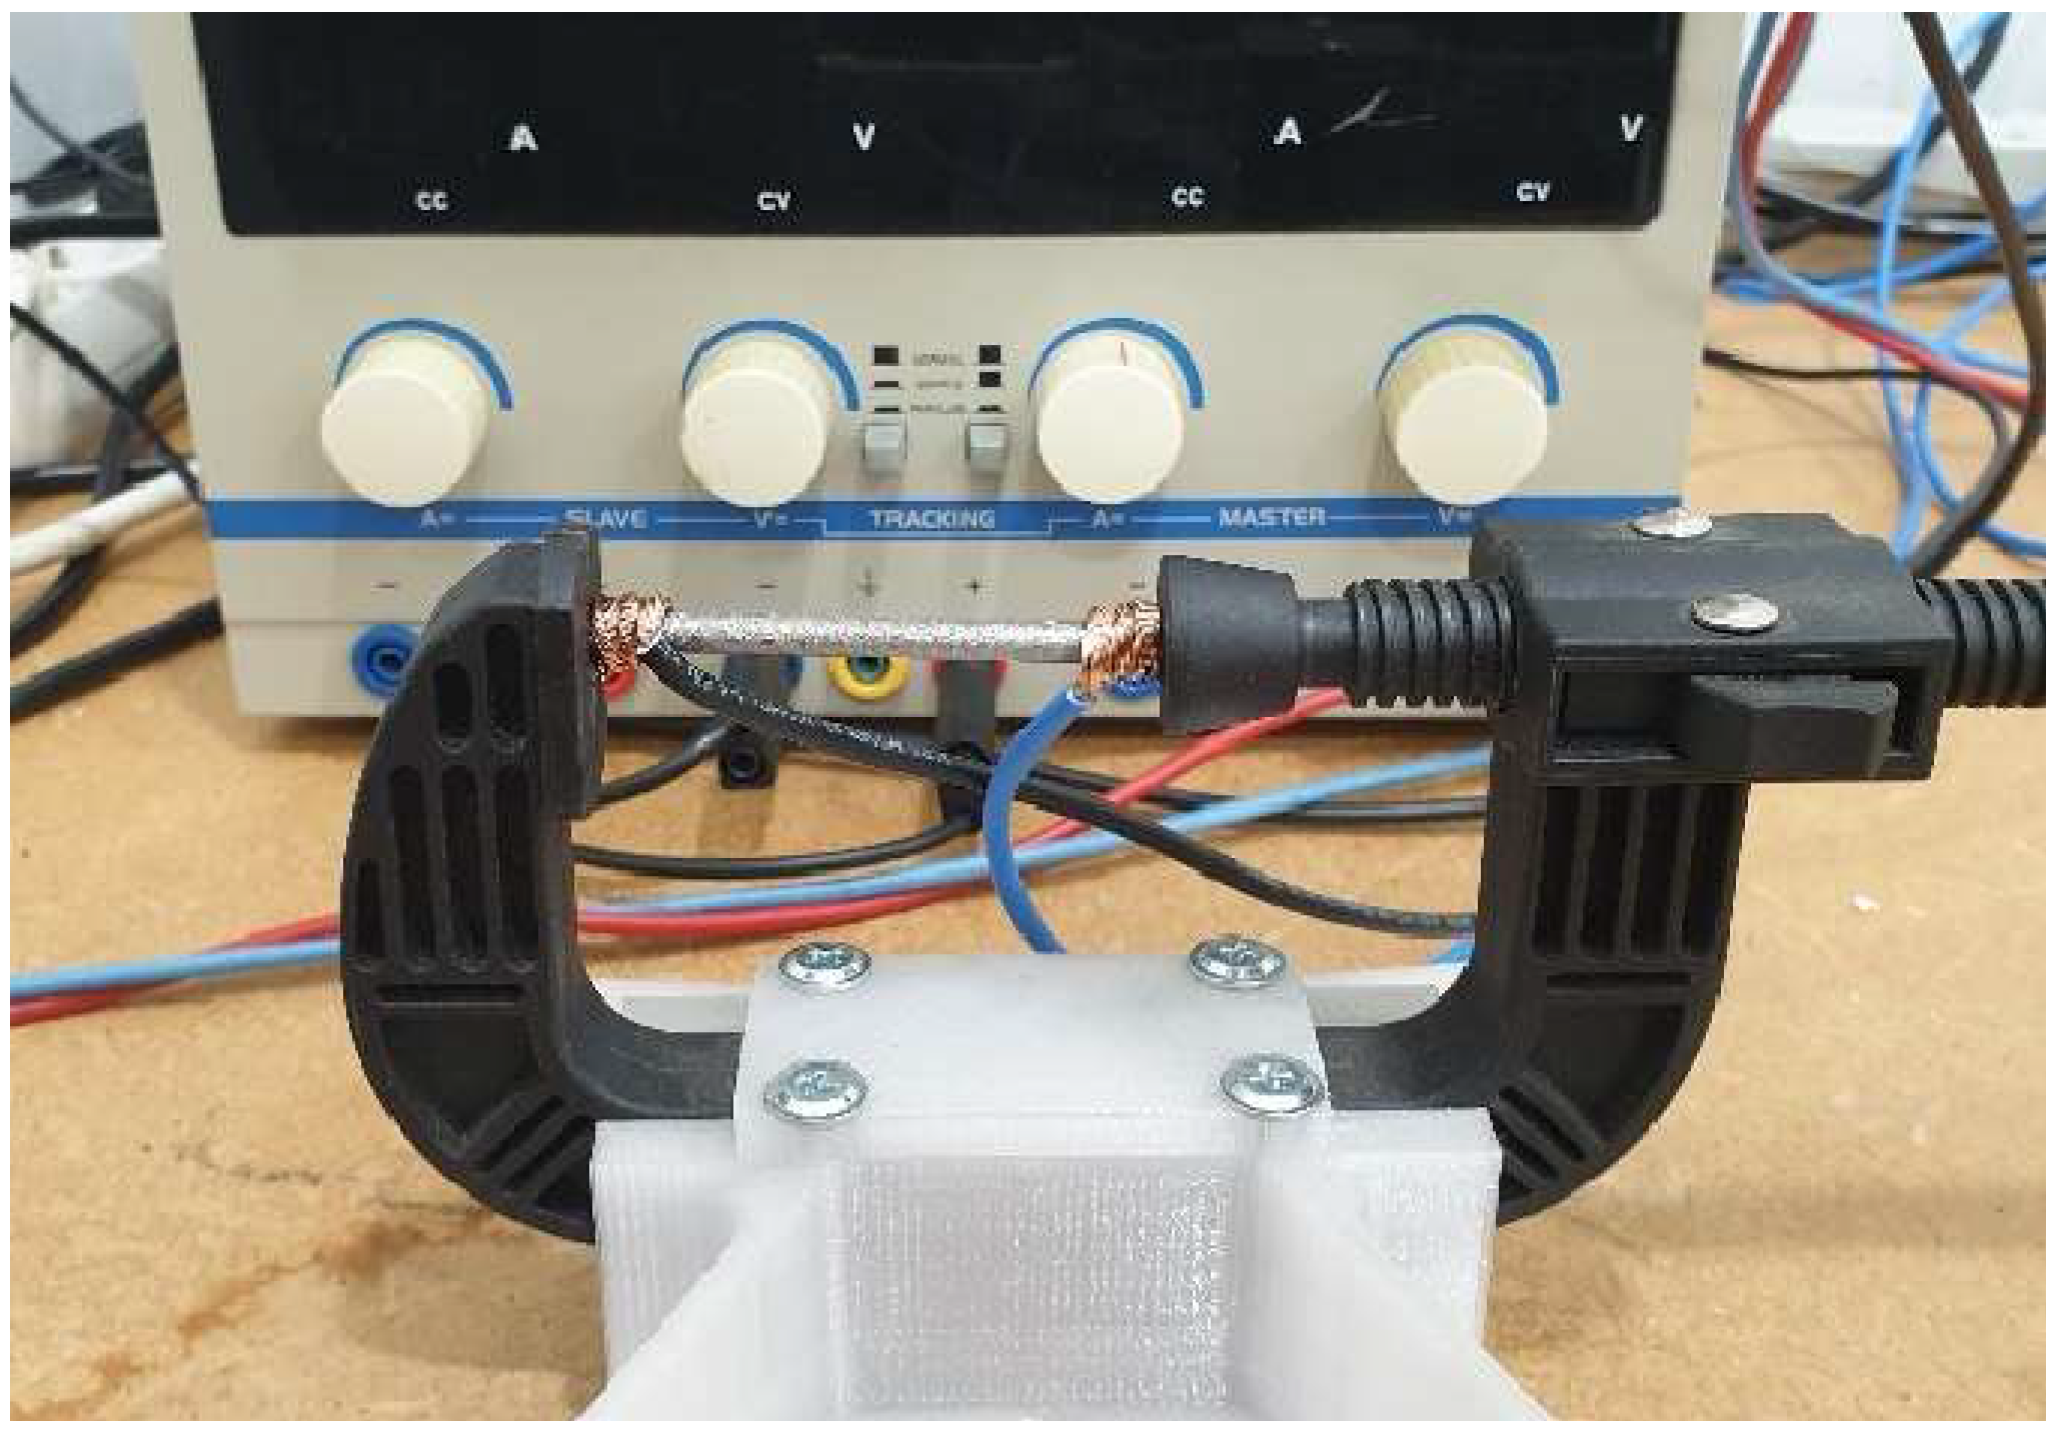
2.3. Measuring Electrical Conductivity

Additional cylindrical test samples were manufactured from both materials using LPBF for measuring the electrical conductivity. The measurements were performed using the four-probe Kelvin method. The sample measurements were verified with a digital caliper. A current of up to 3 A was passed through the sample, and the voltage drop over a set distance was measured at a temperature of 20 °C. Each sample was measured three times with results averaged and the corresponding measurement uncertainty was calculated similarly to the TC samples. The electrical measurements were performed using Keithley 2100 6-digit multimeters. The electrical conductivity test samples were printed both in parallel (Z) and perpendicular (X) to the build direction, similar to the TC samples. The aluminum samples had an average cross-section area of 15.5 mm2 and the voltage drop was measured over an average length of 35.6 mm. The silicon steel samples had an average cross-section area of 9.0 mm2, and the voltage drop was measured over an average length of 40.2 mm. The electrical conductivity measurement setup with an AlSi10Mg sample is presented in Figure 5.

2.4. Microstructure Imaging

Test cubes (10 × 10 × 10 mm) for both materials were manufactured for microstructure analysis. It was conducted through standard metallographic practices of polishing, etching, and optical/electron microscopy, involving SEM-EDS ZEISS Ultra 55 (for scanning electron micrography, Oberkochen, Germany) and Zeiss Axiovert 25 (for light optical micrography, Oberkochen, Germany). Etching of the silicon steel samples was conducted after polishing the surfaces up to 0.05 µm and treating the surface for 15 s using Nital 5.0%. For AlSi10Mg samples, NaOH + C6FeK3N6 treatment for two 15 s steps was used with 0.05 µm polishing between the etching steps. The grain structure was evaluated according to the mean value intercepted method.

3. Results and Discussion

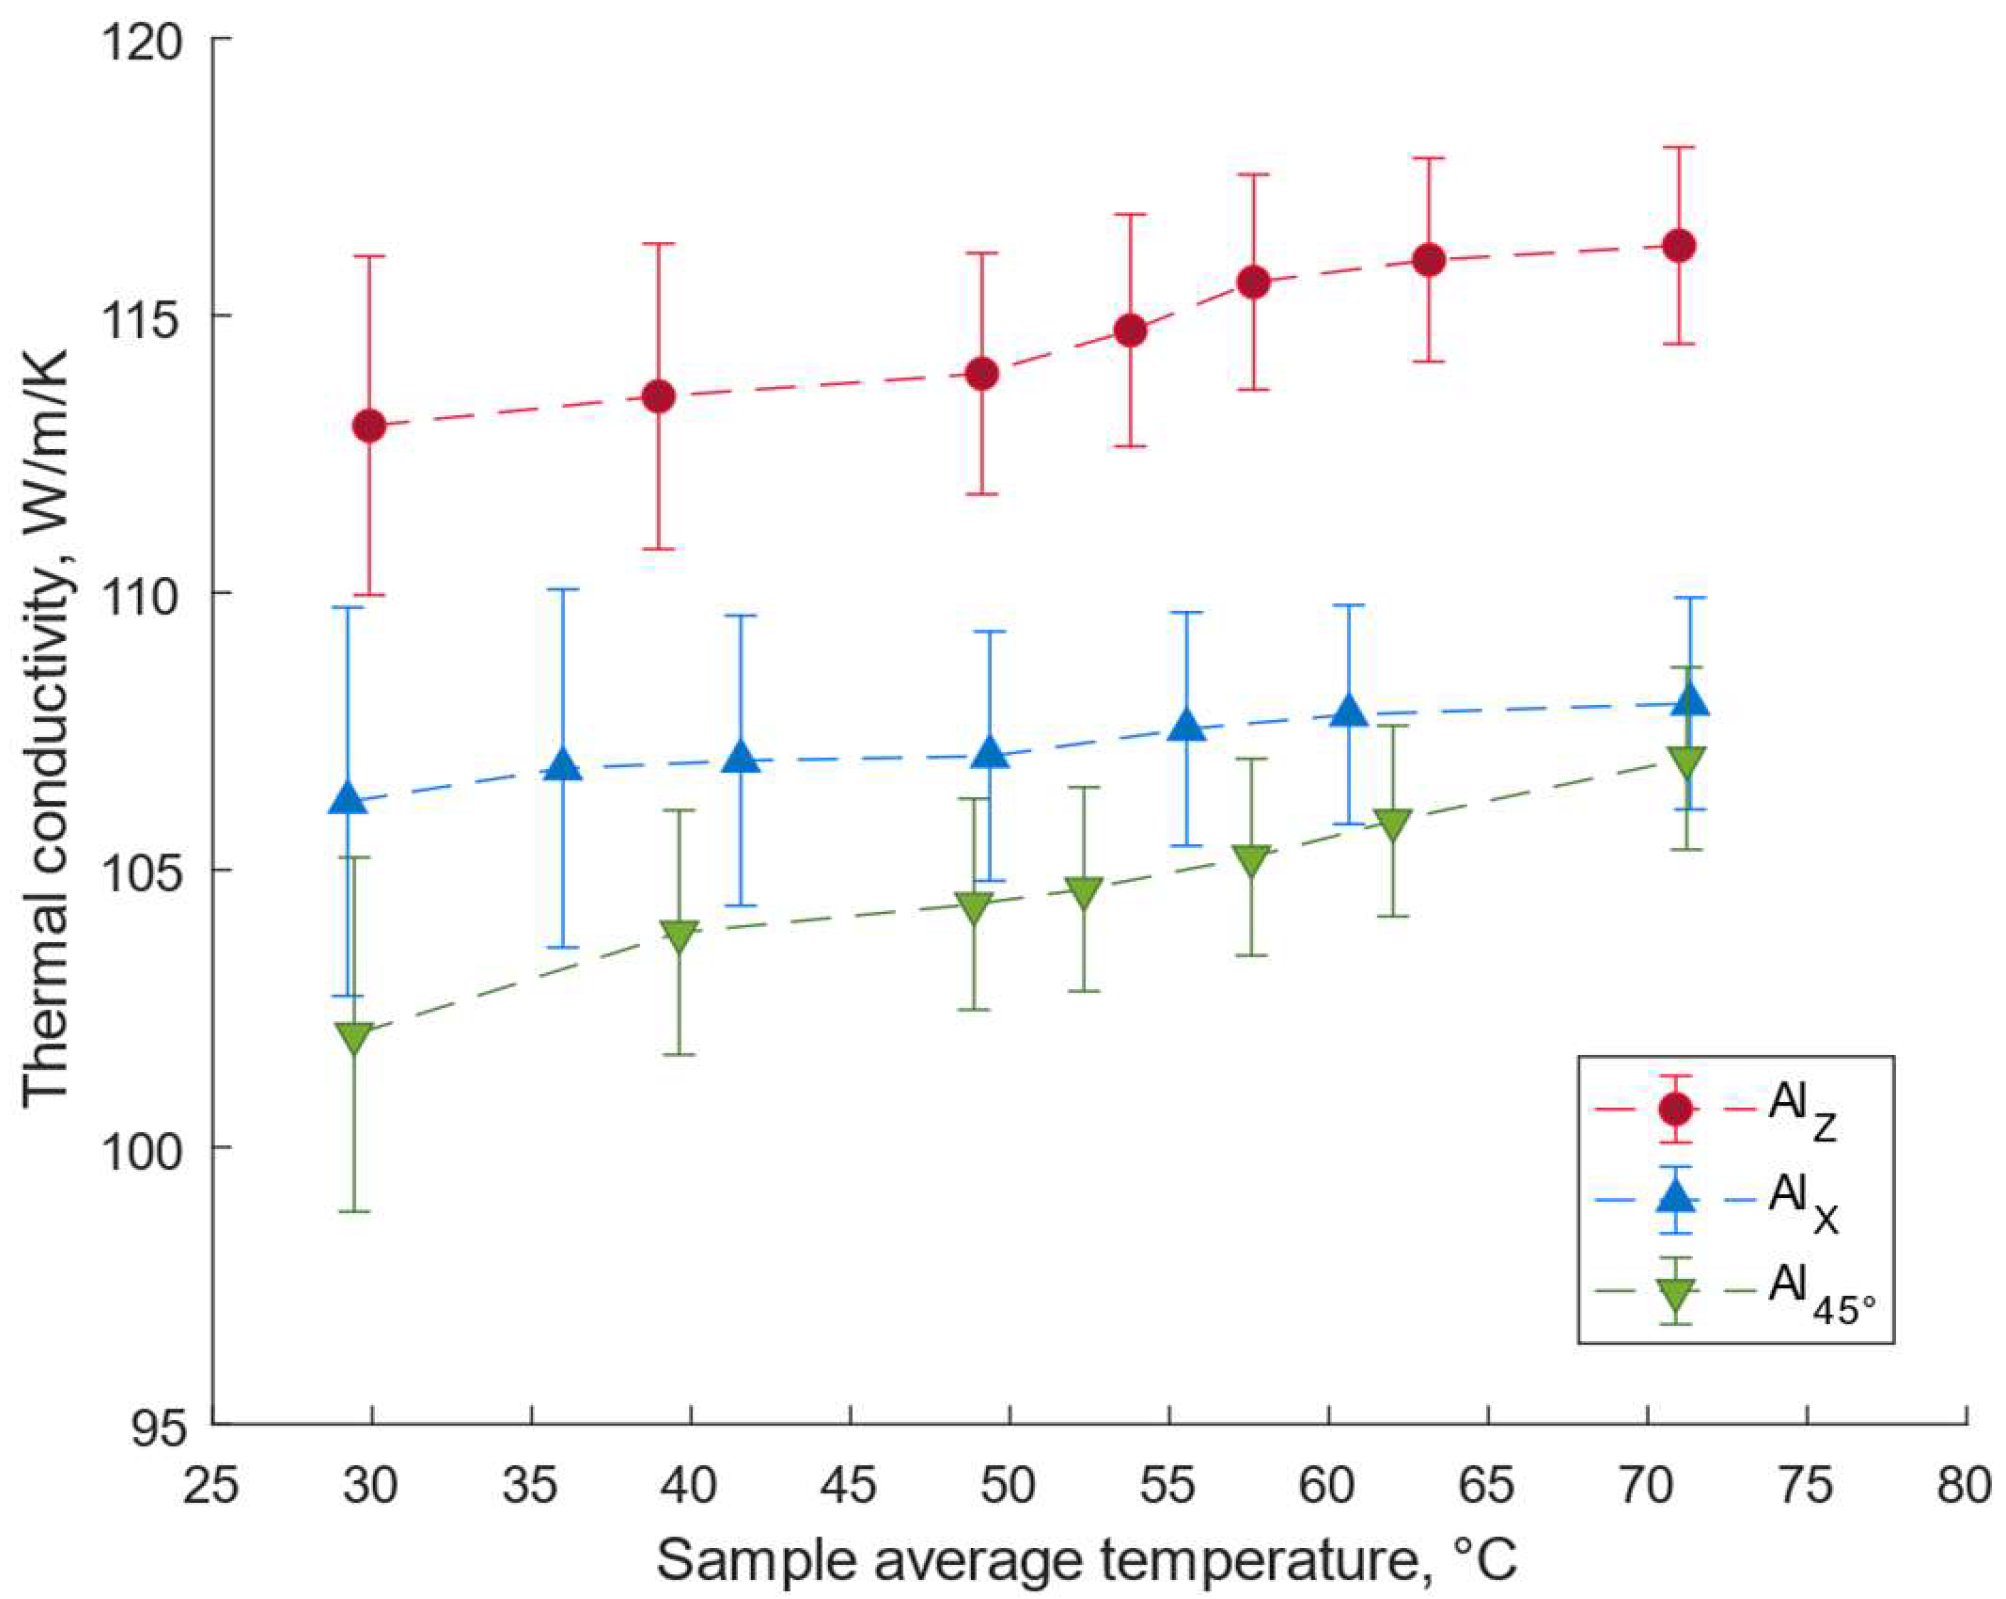
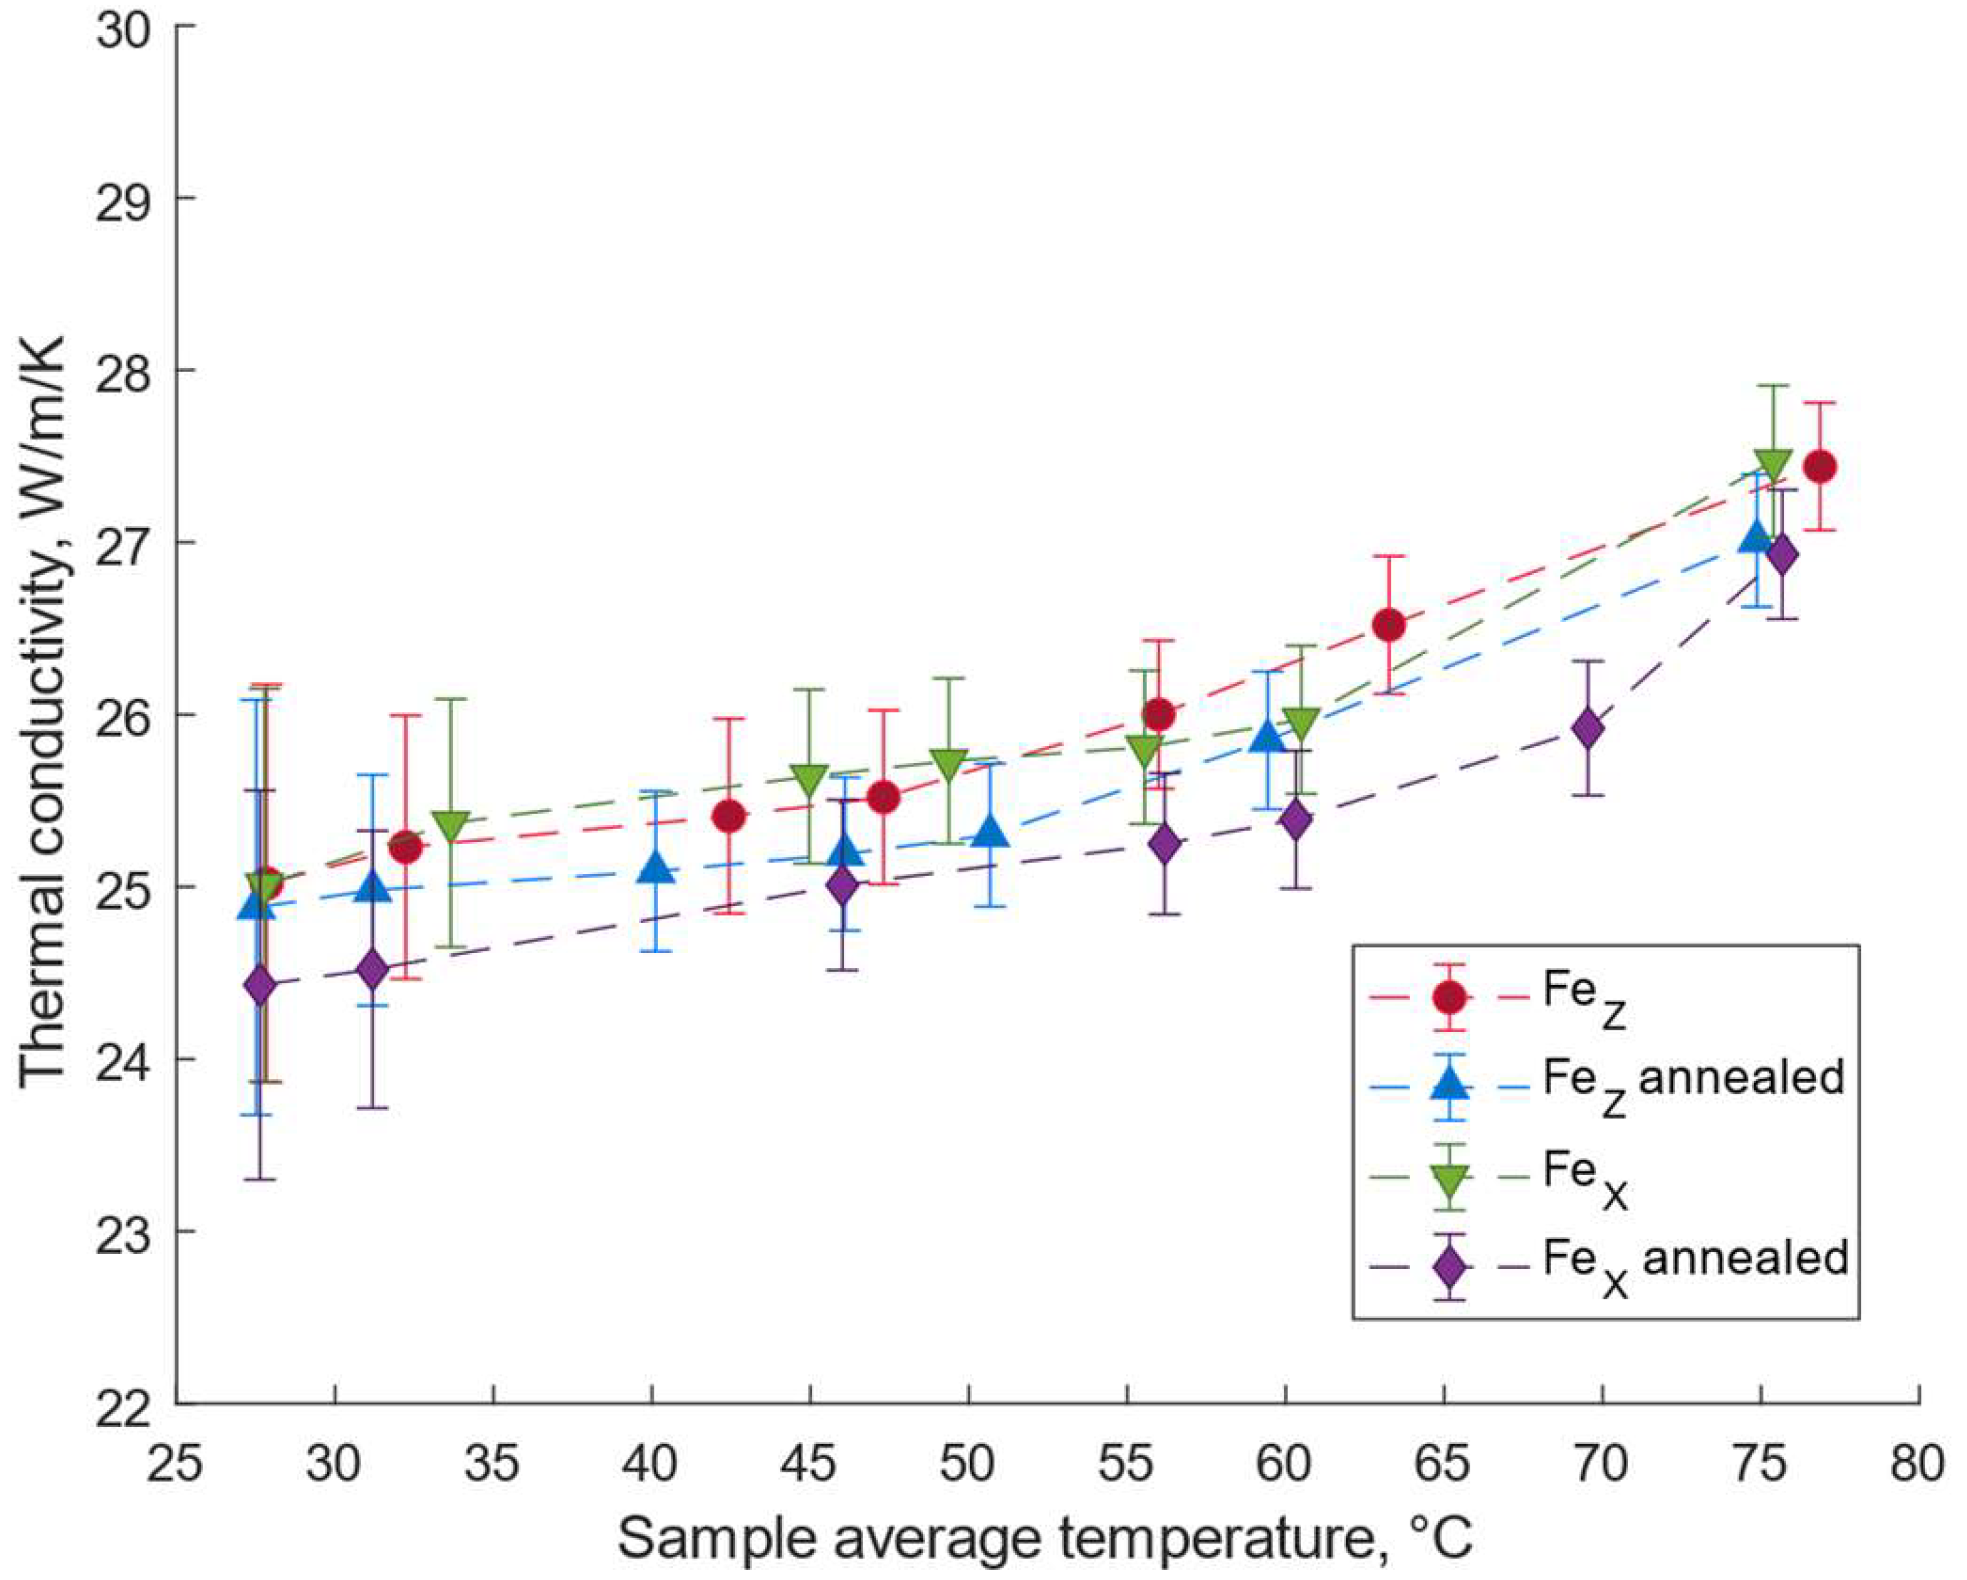
3.1. Thermal Conductivity Results

The graph in Figure 6 displays the results of the TC measurements for the as-built aluminum samples along with the calculated uncertainties. The measurement conducted on the pre-annealed samples showed a 10% rise in TC in the Z-direction, roughly 115 W/m/K compared to the approximately 105 W/m/K in the X-direction. For each sample, it was observed that there was a roughly linear correlation between TC and temperature, which is a common characteristic of this alloy at the measured temperature range [12].
The increased TC in the Z-direction is generally explained in the literature by a preferred grain orientation in the material, which is formed during the LPBF process [23]. Additionally, the bulk TC of the material can be affected by the presence of Si in the crystal structure [24]. It is interesting to note that the measured conductivity of the Al45 sample is slightly lower than that of the AlX sample, suggesting that the correlation between TC and build direction is not simply linear.
The measurement results for the annealed samples are displayed in Figure 7. The values are consistently high, ranging from 148 to 150 W/m/K. The results clearly show that annealing eliminates any manufacturing orientation effects, as no significant anisotropy was observed. However, the TC of the samples is still correlated with temperature.
The results of the silicon steel samples are presented in Figure 8. The measured values, which range from 24.43 to 27.47 W/m/K, are nearly the same for each sample, indicating no noticeable influence of either manufacturing orientation or heat treatment on the TC of the material. The TC of the samples increases with increasing temperature, which is typical for steel at this temperature range [25]. In comparison to a commercial 3.0% Si electrical steel, the measured TC of the AM material is somewhat lower. This is an expected result, as the comparatively lower TC of silicon has a larger effect at higher concentrations. Therefore, it can be said based on the measurement results that the LPBF process does not negatively impact the TC of silicon steel.
The measurements indicate no difference in the TC between the as-built and annealed samples. This is different from the magnetic properties of LPBF silicon steel, which have been shown to be anisotropic. Additionally, heat treatment has been shown to affect the properties of LPBF silicon steel, as Garibaldi et al. [26] measured the impact of heat treatment on the magnetic properties of Fe-6.9%wt. Si samples. They noted a decrease of roughly 50% in power losses after annealing the sample at 1150 °C for 1 h, which they attributed to the increase in grain size within the steel. Thus, while it seems that the LPBF process can produce some anisotropy in silicon steel, the material’s TC is not significantly affected. Table 3 provides a summary of the measurements. The values for specific temperatures are interpolated, and the uncertainty of the measurement at the nearest lower temperature is used.

3.2. Electrical Conductivity Results

The results of the electrical conductivity for the as-built and annealed samples are presented in Table 4. The measured values are similar to the TC, as the aluminum samples manufactured parallel to the build direction show notably higher electrical conductivity. The increase in electrical conductivity with the annealing process for the aluminum sample is comparatively high but in line with other measurements of the same alloy. The Fe-Si samples similarly did not show any deviation from the characteristics of the thermal results, with the electrical conductivity of the samples being invariant of manufacturing orientation and heat treatment.

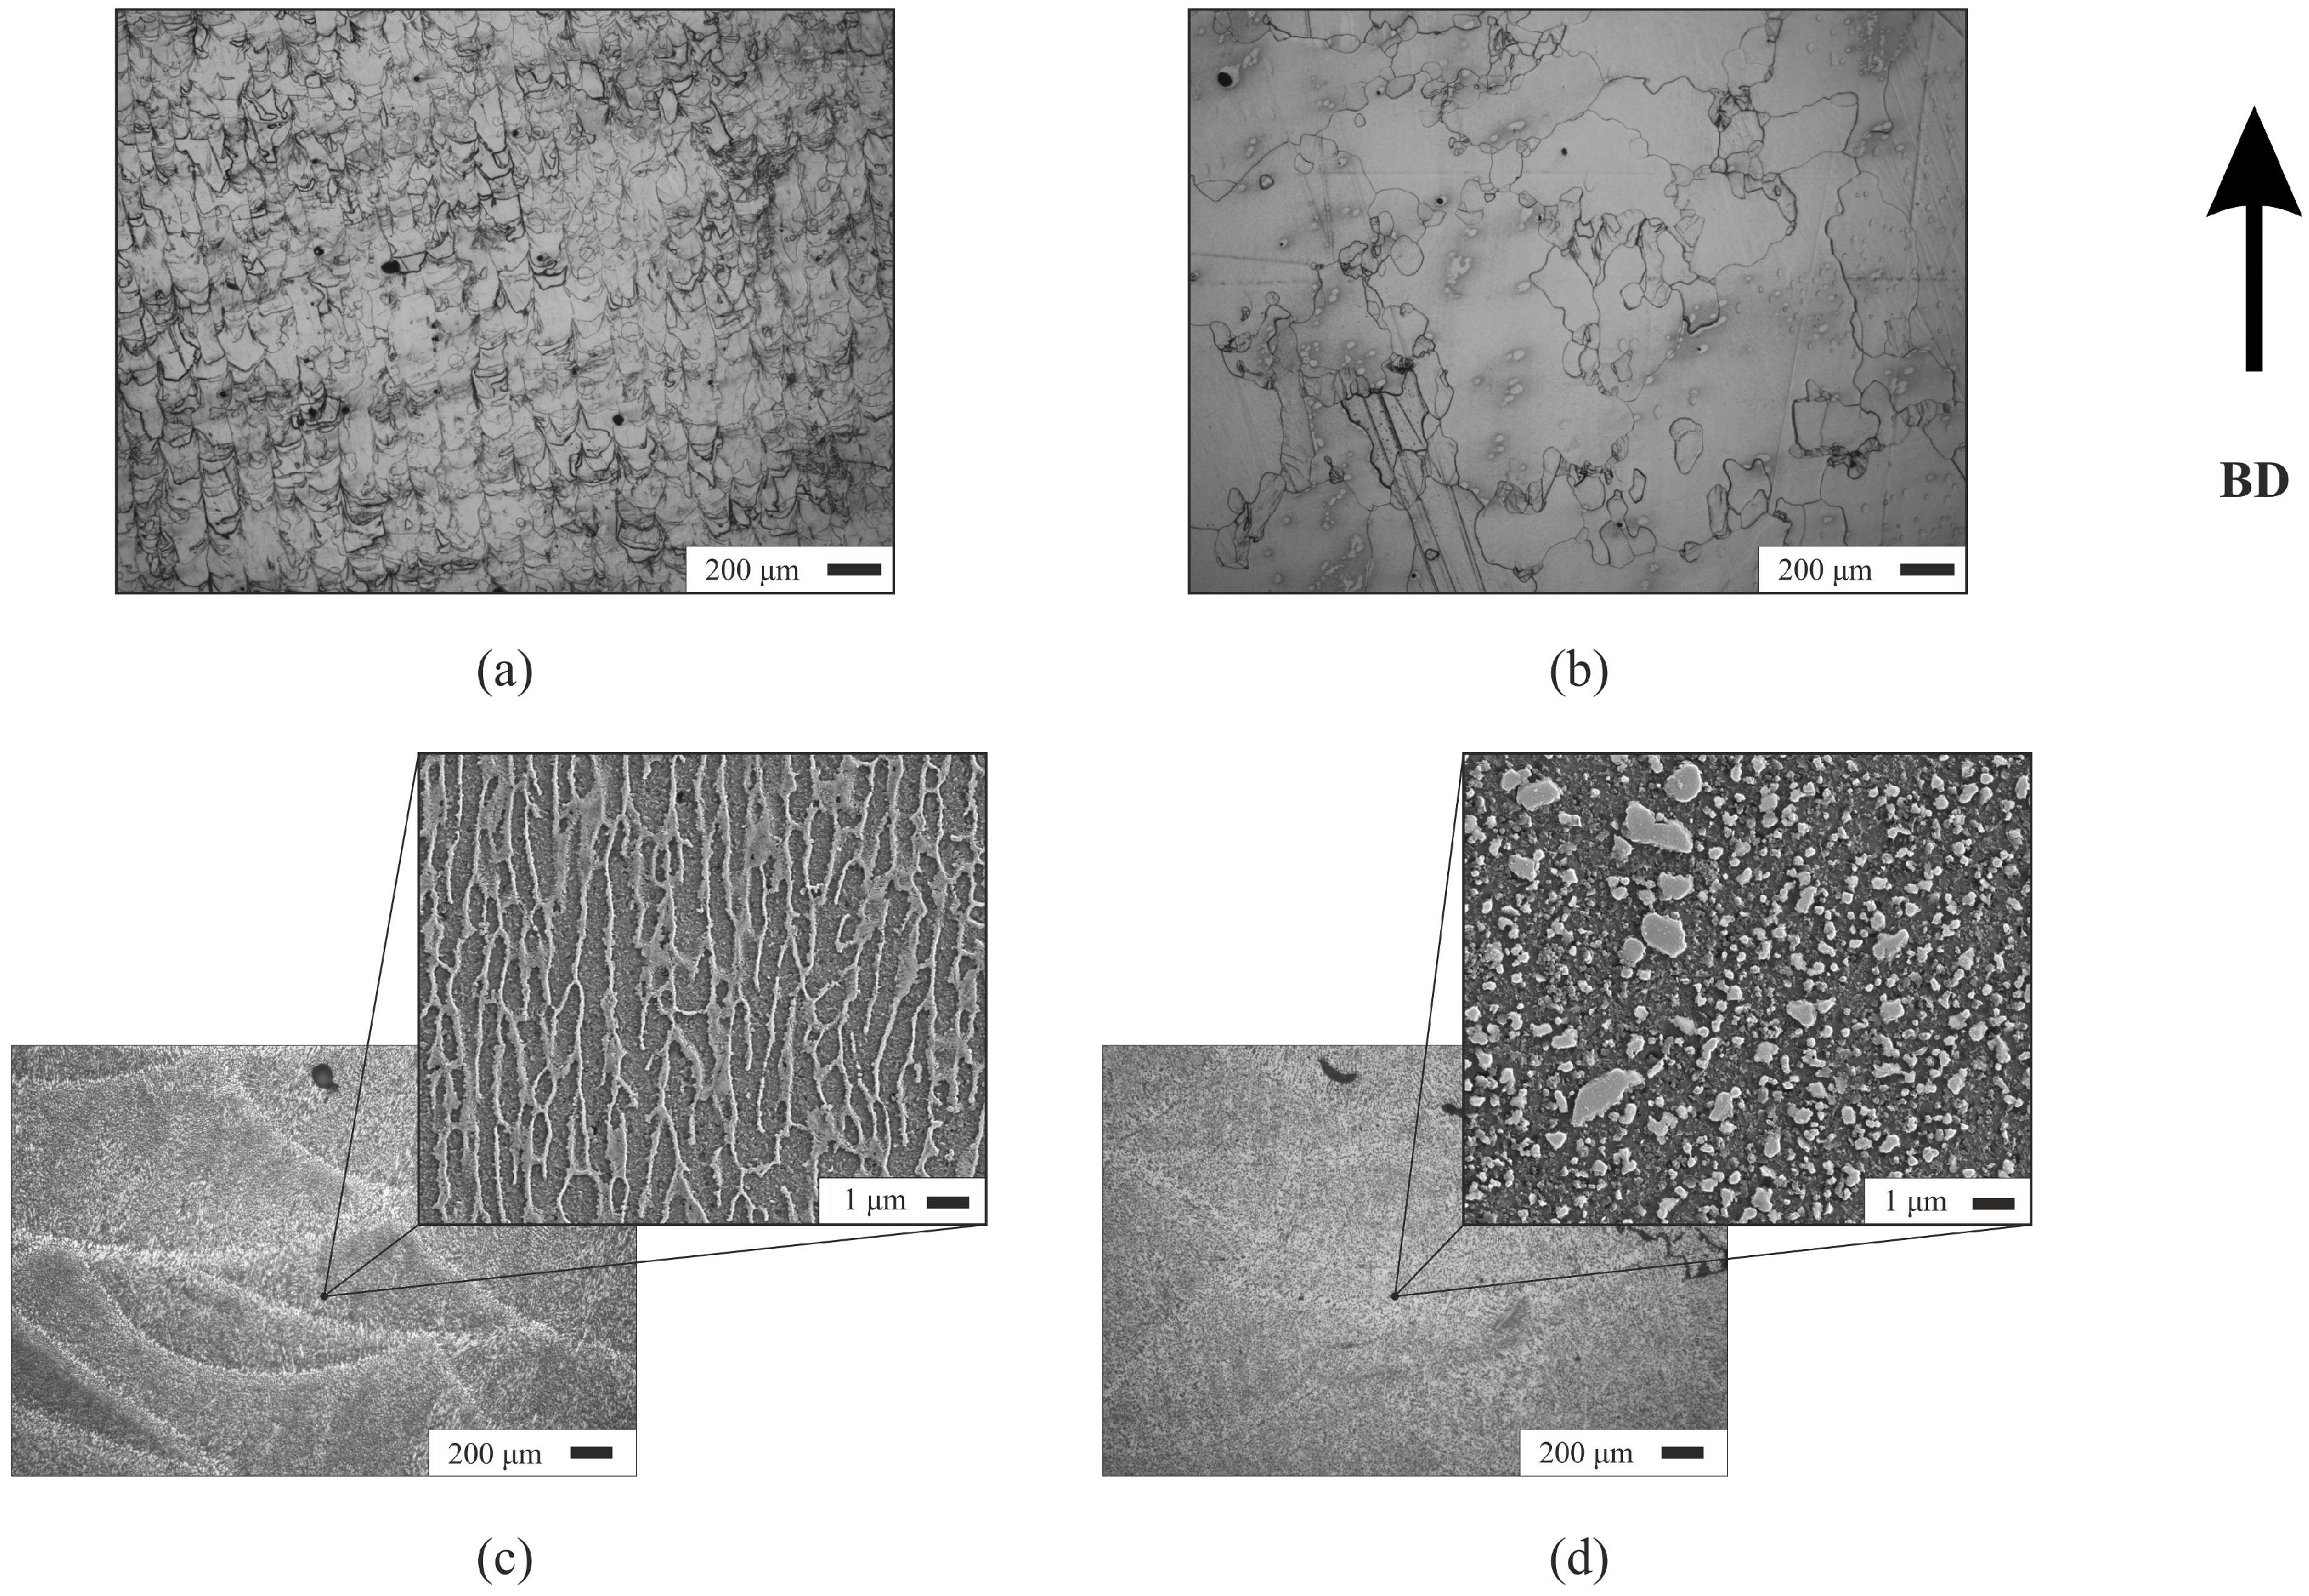
3.3. Microstructure Analysis

The microstructural imaging results are presented in Figure 9, with the build direction (Z-axis) of the process indicated.
The as-built microstructure of the unannealed XZ plane samples shows typical columnar structures with an oriented growth in the build direction. This can be related to rapid solidification (103–106 K/s) and vertical directionality of the manufacturing process: from the bottom to top, inducing a characteristic solidification along the build direction. The fused microstructures of the two materials did exhibit significant differences.
The as-built silicon steel samples showed a uniform, relatively fine crystallographic structure in the range of 18–140 µm, with an average grain size of 65 µm. The structure coarsened substantially after the thermal treatment, up to approximately 195 µm. Post-annealing, the range of the crystallographic grains varied significantly, ranging from 40 to 600 µm.
Compared to the uniformly fused structure of the Fe-Si, the structure of both as-built and heat-treated AlSi10Mg exhibited Si-phase depositions within the Al matrix. In this case, the EN ISO 643:2020 standard was not applicable for grain size evaluation. It could be verified, however, that the α-Al features within the silicon-rich matrix were in the range of 0.5–1 µm. It was also evident that the annealing process changed the Si distribution of the eutectic microstructure and created coarser Si particles within the Al matrix instead of the initial eutectic lamellar Si microstructure. A similar breakdown of the silicon-rich areas into smaller roughly spherical agglomerations has been documented in other works as well [27].
This change in the material microstructure is responsible for the effect of annealing on the thermal and electrical conductivity of the AlSi10Mg samples. The anisotropic boundaries of Si segregating the elongated α-Al structures act as additional resistance for any electrical charge attempting to pass the material. After the heat treatment, these boundaries are broken and a lower resistance path for the electrical charge is created. When considering the transmission of thermal energy, the mechanism is similar: This is because both thermal and electrical conductivity are strongly dependent on the inherent electron mobility within the material. As the AM silicon steel exhibited a largely uniform microstructure, the obtained properties were also isotropic. Unlike magnetic properties, thermal and electrical conductivities are considered mostly invariant of grain size [7], and thus, significant changes in the conductive behavior of silicon steel were not observed post-annealing.

4. Conclusions

The thermal and electrical conductivities of AlSi10Mg and Fe-Si samples manufactured using laser powder bed fusion were measured using longitudinal heat flow and 4-probe Kelvin measurements, respectively.
The as-built AlSi10Mg samples exhibited marked anisotropy, with higher thermal and electrical conductivities in the orientation parallel to the LPBF build direction. This anisotropy disappeared after annealing, which also enhanced the overall conductivities. This suggests that post-processing treatments are crucial for optimizing the material properties of AlSi10Mg for applications requiring high thermal and electrical performance. On the other hand, if heat treatment is not possible for any reason, it means that the anisotropicity must be accounted for during the design phase. Furthermore, as the annealing process seems to have a larger impact on TC than EC, in some electrical machine applications, such as heat exchangers for direct-conductor cooling, forgoing heat treatment can be beneficial for reducing AC losses in aluminum without sacrificing too much thermal performance.
On the other hand, the silicon steel samples showed uniform thermal and electrical conductivities, with no significant anisotropy regardless of the build direction or heat treatment. This is somewhat different from the magnetic properties, which have shown some anisotropy in the literature. However, this uniformity indicates that Fe-Si is a reliable material for applications where isotropic properties are essential. In practice, it means that when manufacturing a silicon steel core with LPBF, the build direction can be freely chosen based on magnetic, mechanical (this is especially relevant when manufacturing laminated structures), and post-processing limitations. Future work should look into non-standard manufacturing parameters in order to purposefully reduce the electrical conductivity of silicon steel, which in turn would help reduce eddy currents. This would likely also decrease thermal conductivity; however, depending on the machine topology and cooling method, the TC of the soft magnetic material can be insignificant in terms of overall thermal performance.
The microstructure analysis performed on the samples using LOM and SEM imaging was in line with the measurement results and provided extra context for the measured results. The AlSi10Mg samples showed a breakdown of the initial eutectic lamellar Si microstructure into coarser Si particles after annealing, which contributed to the improved conductivities. The Fe-Si samples, however, maintained a uniform microstructure, explaining the consistent conductivity values.
In conclusion, this study underscores the importance of considering both the manufacturing process and post-processing treatments in the design and application of additively manufactured materials. The insights gained here will aid in the development of more efficient and reliable electrical machines, paving the way for advancements in additive manufacturing technologies.

Author Contributions

Conceptualization, M.S. (Martin Sarap); methodology, M.S. (Martin Sarap), H.T. and M.S. (Mart Saarna); validation, M.S. (Martin Sarap) and M.S. (Mart Saarna); writing—original draft preparation, M.S. (Martin Sarap), H.T. and M.S. (Märt Saarna); writing—review and editing, A.K., M.K. and P.S.G.; visualization, M.S. (Martin Sarap); supervision, A.K. and P.S.G.; project administration, A.K.; funding acquisition, A.K. and T.V. All authors have read and agreed to the published version of the manuscript.

Funding

This research was funded by the Estonian Research Council grant PRG-1827.

Data Availability Statement

Data are contained within the article.

Conflicts of Interest

The authors declare no conflicts of interest.

References

  1. Sarap, M.; Kallaste, A.; Ghahfarokhi, P.S.; Tiismus, H.; Vaimann, T. The Effect of Build Direction on the Thermal Conductivity of Additively Manufactured AlSi10Mg and Silicon-steel Samples. In Proceedings of the 2022 International Conference on Electrical Machines (ICEM), Valencia, Spain, 5–8 September 2022; pp. 538–543. [Google Scholar] [CrossRef]
  2. Wang, D.; Wei, Y.; Wei, X.; Khanlari, K.; Wang, Z.; Feng, Y.; Yang, X. Selective Laser Melting of Pure Ag and 925Ag Alloy and Their Thermal Conductivity. Crystals 2022, 12, 480. [Google Scholar] [CrossRef]
  3. Kim, M.S. Effects of Processing Parameters of Selective Laser Melting Process on Thermal Conductivity of AlSi10Mg Alloy. Materials 2021, 14, 2410. [Google Scholar] [CrossRef] [PubMed]
  4. Attar, H.; Calin, M.; Zhang, L.C.; Scudino, S.; Eckert, J. Manufacture by selective laser melting and mechanical behavior of commercially pure titanium. Mater. Sci. Eng. A 2014, 593, 170–177. [Google Scholar] [CrossRef]
  5. Barba, D.; Alabort, C.; Tang, Y.T.; Viscasillas, M.J.; Reed, R.C.; Alabort, E. On the size and orientation effect in additive manufactured Ti-6Al-4V. Mater. Des. 2020, 186, 108235. [Google Scholar] [CrossRef]
  6. Rosenthal, I.; Stern, A.; Frage, N. Microstructure and Mechanical Properties of AlSi10Mg Parts Produced by the Laser Beam Additive Manufacturing (AM) Technology. Metallogr. Microstruct. Anal. 2014, 3, 448–453. [Google Scholar] [CrossRef]
  7. Tiismus, H.; Kallaste, A.; Vaimann, T.; Lind, L.; Virro, I.; Rassõlkin, A.; Dedova, T. Laser Additively Manufactured Magnetic Core Design and Process for Electrical Machine Applications. Energies 2022, 15, 3665. [Google Scholar] [CrossRef]
  8. Wohlers, C.; Juris, P.; Kabelac, S.; Ponick, B. Design and direct liquid cooling of tooth-coil windings. Electr. Eng. 2018, 100, 2299–2308. [Google Scholar] [CrossRef]
  9. Garibaldi, M.; Ashcroft, I.; Simonelli, M.; Hague, R. Metallurgy of high-silicon steel parts produced using Selective Laser Melting. Acta Mater. 2016, 110, 207–216. [Google Scholar] [CrossRef]
  10. Kang, N.; El Mansori, M.; Guittonneau, F.; Liao, H.; Fu, Y.; Aubry, E. Controllable mesostructure, magnetic properties of soft magnetic Fe-Ni-Si by using selective laser melting from nickel coated high silicon steel powder. Appl. Surf. Sci. 2018, 455, 736–741. [Google Scholar] [CrossRef]
  11. Mfusi, B.J.; Tshabalala, L.C.; Popoola, A.P.I.; Mathe, N.R. The effect of selective laser melting build orientation on the mechanical properties of AlSi10Mg parts. IOP Conf. Ser. Mater. Sci. Eng. 2018, 430, 012028. [Google Scholar] [CrossRef]
  12. Strumza, E.; Yeheskel, O.; Hayun, S. The effect of texture on the anisotropy of thermophysical properties of additively manufactured AlSi10Mg. Addit. Manuf. 2019, 29, 100762. [Google Scholar] [CrossRef]
  13. Yang, P.; Deibler, L.A.; Bradley, D.R.; Stefan, D.K.; Carroll, J.D. Microstructure evolution and thermal properties of an additively manufactured, solution treatable AlSi10Mg part. J. Mater. Res. 2018, 33, 4040–4052. [Google Scholar] [CrossRef]
  14. Kim, W.R.; Bang, G.B.; Kwon, O.; Jung, K.H.; Park, H.K.; Kim, G.H.; Jeong, H.T.; Kim, H.G. Fabrication of porous pure titanium via selective laser melting under low-energy-density process conditions. Mater. Des. 2020, 195, 109035. [Google Scholar] [CrossRef]
  15. Peng, T.; Chen, C. Influence of energy density on energy demand and porosity of 316L stainless steel fabricated by selective laser melting. Int. J. Precis. Eng. Manuf.—Green Technol. 2018, 5, 55–62. [Google Scholar] [CrossRef]
  16. Greco, S.; Gutzeit, K.; Hotz, H.; Kirsch, B.; Aurich, J.C. Selective laser melting (SLM) of AISI 316L—Impact of laser power, layer thickness, and hatch spacing on roughness, density, and microhardness at constant input energy density. Int. J. Adv. Manuf. Technol. 2020, 108, 1551–1562. [Google Scholar] [CrossRef]
  17. Thijs, L.; Kempen, K.; Kruth, J.P.; van Humbeeck, J. Fine-structured aluminium products with controllable texture by selective laser melting of pre-alloyed AlSi10Mg powder. Acta Mater. 2013, 61, 1809–1819. [Google Scholar] [CrossRef]
  18. ASTM E1461; Standard Test Method for Thermal Diffusivity by the Flash Method. ASTM: West Conshohocken, PA, USA, 2013.
  19. SLM Solutions, Material Data Sheet Al-Alloy AlSi10Mg/EN AC-4300/EN AC-AlSi10Mg. Available online: https://www.slm-solutions.com/fileadmin/Content/Powder/MDS/nw/2024/MDS_AlSi10Mg_2024-04.1_EN.pdf (accessed on 23 December 2024).
  20. EOS Aluminium AlSi10Mg Material Data Sheet Metal Solutions. Available online: https://www.eos.info/var/assets/03_system-related-assets/material-related-contents/metal-materials-and-examples/metal-material-datasheet/aluminium/material_datasheet_eos_aluminium-alsi10mg_en_web.pdf (accessed on 23 December 2024).
  21. Tiismus, H.; Kallaste, A.; Belahcen, A.; Tarraste, M.; Vaimann, T.; Rassõlkin, A.; Asad, B.; Shams Ghahfarokhi, P. AC Magnetic Loss Reduction of SLM Processed Fe-Si for Additive Manufacturing of Electrical Machines. Energies 2021, 14, 1241. [Google Scholar] [CrossRef]
  22. Si 3 and, A. 0 4%, Chemical Composition, Typical Electrical Steel, Thin Non-Oriented Grades Coating SURALAC® 7000. Available online: https://www.polarislaserlaminations.com/Cogent.pdf (accessed on 23 December 2024).
  23. Silbernagel, C.; Ashcroft, I.; Dickens, P.; Galea, M. Electrical resistivity of additively manufactured AlSi10Mg for use in electric motors. Addit. Manuf. 2018, 21, 395–403. [Google Scholar] [CrossRef]
  24. Kimura, T.; Nakamoto, T.; Mizuno, M.; Araki, H. Effect of silicon content on densification, mechanical and thermal properties of Al-xSi binary alloys fabricated using selective laser melting. Mater. Sci. Eng. A 2017, 682, 593–602. [Google Scholar] [CrossRef]
  25. Xing, Y.; Wang, W.; Al-azzani, H. Assessment of thermal properties of various types of high-strength steels at elevated temperatures. Fire Saf. J. 2021, 122, 103348. [Google Scholar] [CrossRef]
  26. Garibaldi, M.; Ashcroft, I.; Lemke, J.N.; Simonelli, M.; Hague, R. Effect of annealing on the microstructure and magnetic properties of soft magnetic Fe-Si produced via laser additive manufacturing. Scr. Mater. 2018, 142, 121–125. [Google Scholar] [CrossRef]
  27. Takata, N.; Kodaira, H.; Sekizawa, K.; Suzuki, A.; Kobashi, M. Change in microstructure of selectively laser melted AlSi10Mg alloy with heat treatments. Mater. Sci. Eng. A 2017, 704, 218–228. [Google Scholar] [CrossRef]
Figure 1. Illustration of the LPBF process with the directional thermal conductivity samples shown.
Machines 13 00001 g001
Figure 2. Illustration of the technique used to measure the TC of the samples with T showing the location of the temperature sensors used to determine the temperature drop across a known length.
Machines 13 00001 g002
Figure 3. The LPBF aluminum alloy and silicon steel samples for measuring thermal conductivity with the distance between the temperature sensor openings shown [1].
Machines 13 00001 g003
Figure 4. Thermal conductivity measurement setup [1].
Machines 13 00001 g004
Figure 5. The experimental setup for measuring the electrical conductivity.
Machines 13 00001 g005
Figure 6. Thermal conductivity measurement results for the as-built aluminum samples [1].
Machines 13 00001 g006
Figure 7. Results of the TC measurements for the aluminum samples [1].
Machines 13 00001 g007
Figure 8. Measured thermal conductivity values for the as-built and annealed silicon steel samples [1].
Machines 13 00001 g008
Figure 9. Annealing induced microstructure evolution of the printed material. Grain growth in silicon steel: (a) as-built state and (b) post-annealing. Breakdown of lamellar Si microstructures: (c) as-built state and (d) post-annealing.
Machines 13 00001 g009
Table 1. List of created samples.
Measured PropertyMaterialManufacturing OrientationNo. of Samples Created
Thermal conductivityAlSi10MgZ1
45°1
X1
FeSi (3.7%wt. Si)Z1
X1
Electrical conductivityAlSi10MgZ2
X2
FeSi (3.7%wt. Si)Z2
X2
Table 2. Important manufacturing parameters [1].
ParameterValue (Aluminum)Value (Steel)
Layer thickness50 µm50 µm
Hatch distance170 µm120 µm
Laser power350 W250 W
Scanning velocity1.15 m/s0.5 m/s
Scan strategyStripesStripes
EnvironmentNitrogenNitrogen
Oxygen content~0.1%~0.1%
Table 3. Measurement results for the thermal conductivities of the as-built and annealed samples [1].
SampleThermal Conductivity at 35 °C (W/m/K)Thermal Conductivity at 70 °C (W/m/K)
A l Z as-built113.3 ± 3.1116.2 ± 1.8
A l Z annealed148.2 ± 3.5149.5 ± 2.3
A l 45 as-built103.0 ± 3.2106.9 ± 1.7
A l 45 annealed148.5 ± 3.7149.9 ± 2.4
A l X as-built106.7 ± 3.5108.0 ± 2.0
A l X annealed148.2 ± 3.8149.8 ± 2.3
F e Z as-built25.3 ± 0.827.0 ± 0.4
F e Z annealed25.0 ± 0.726.6 ± 0.4
F e X as-built25.4 ± 0.726.9 ± 0.4
F e X annealed24.6 ± 0.826.0 ± 0.4
Table 4. Measured electrical conductivities of the samples.
SampleElectrical Conductivity at 20 °C (MS/m)
A l Z as-built14.70 ± 0.27
A l Z /annealed23.88 ± 0.50
A l X as-built13.08 ± 0.36
A l X /annealed24.72 ± 0.86
F e Z as-built1.76 ± 0.03
F e Z /annealed1.78 ± 0.03
F e X as-built1.76 ± 0.03
F e X /annealed1.77 ± 0.03
Disclaimer/Publisher’s Note: The statements, opinions and data contained in all publications are solely those of the individual author(s) and contributor(s) and not of MDPI and/or the editor(s). MDPI and/or the editor(s) disclaim responsibility for any injury to people or property resulting from any ideas, methods, instructions or products referred to in the content.

