Abstract
Silicon carbide particle-reinforced aluminum matrix (SiCp/Al) composites are significant lightweight metal matrix composites extensively utilized in precision instruments and aerospace sectors. Nevertheless, the inclusion of rigid SiC particles exacerbates tool wear in mechanical machining, resulting in a decline in the quality of surface finishes. This work undertakes a comprehensive investigation into the problem of tool wear in SiCp/Al composite materials throughout the machining process. Initially, a comprehensive investigation was conducted to analyze the effects of cutting velocity vc, feed per tooth fz, milling depth ap, and milling width ae on tool wear during high-speed milling under SCCO2-MQL (Supercritical Carbon Dioxide Minimum Quantity Lubrication) ultrasonic vibration conditions. The results show that under the condition of SCCO2-MQL ultrasonic vibration, proper control of milling parameters can significantly reduce tool wear, extend tool service life, improve machining quality, and effectively reduce blade breakage and spalling damage to the tool, reduce abrasive wear and adhesive wear, and thus significantly improve the durability of the tool. Furthermore, a prediction model for tool wear was developed by employing the orthogonal test method and multiple linear regression. The model’s relevance and accuracy were confirmed using F-tests and t-tests. The results show that the model can effectively predict tool wear, among which cutting velocity vc and feed rate fz are the key parameters affecting the prediction accuracy. Finally, a genetic algorithm was used to optimize the milling parameters, and the optimal parameter combination (vc = 60.00 m/min, fz = 0.08 mm/z, ap = 0.20 mm) was determined, and the optimized milling parameters were tested. Empirical findings suggest that the careful selection of milling parameters can significantly mitigate tool wear, extend the lifespan of the tool, and enhance the quality of the surface. This work serves as a significant point of reference for the processing of SiCp/Al composite materials.
1. Introduction
The SiCp/Al composite material is produced by incorporating SiC particles as reinforcement into an aluminum matrix material using advanced manufacturing processes. This material has a high tensile strength, a high stiffness-to-weight ratio, good resistance to wear, and a low coefficient of thermal expansion. It demonstrates great physical qualities and mechanical characteristics. It is extensively employed in the production of lightweight telescopes for accurate optical equipment [1]. This material is also used in the manufacturing of bomber tail fins and fighter aircraft ventral fins [2,3]. Nevertheless, the presence of hard SiC particles in this material often results in significant tool wear and diminished surface quality during mechanical machining. As a result, SiCp/Al is considered a challenging material for machines, which limits its application [4,5]. Conventional mechanical machining techniques not only face challenges in meeting the demands of environmentally friendly machining but also fall short in guaranteeing efficient processing and high quality. Hence, researching processing technologies and specialized machining procedures [6] is of great significance. SCCO2-MQL was chosen for its environmental sustainability, cooling and lubrication efficiency, and economic benefits. As a green cooling medium, SCCO2 produces no harmful waste and can be recycled, supporting sustainable development. Its low-temperature cooling minimizes heat buildup, while MQL technology creates a micro-lubricating film that reduces friction and tool wear, improving machining accuracy. Compared with LN2 cooling, SCCO2-MQL offers lower operational costs and maintenance, making it ideal for machining difficult materials such as SiCp/Al composites. Ultrasonic vibration further reduces the cutting force and friction, improves lubrication, facilitates chip removal, and enhances surface finish, all while optimizing the cooling and lubrication effects of SCCO2-MQL, increasing overall machining efficiency and reducing tool wear.
Researchers, both domestically and internationally, have undertaken thorough investigations of SiCp/Al composite materials. Zha Huiting et al. conducted a study on the wear characteristics of SiCp/Al composites with a high volume fraction when subjected to rotating ultrasound. The findings indicate that, when exposed to ultrasonic vibration, the primary wear mechanisms seen in diamond particles are micro-fracture and abrasion [7]. Ma Guohong and colleagues simulated the cutting process of composites, analyzing SiC particle damage, surface morphology, and subsurface damage under conventional and ultrasonic vibration-assisted cutting. The results show that ultrasonic cutting improves surface integrity, reduces subsurface damage, and enhances overall surface quality compared with conventional methods [8]. Mohamed Baraya et al. developed an ultrasonic vibration device controlled by LabView and conducted statistical analysis on machining and vibration parameters. The results showed improved surface roughness and a significant reduction in slot width error compared with traditional milling [9]. Neeraj Deswal and colleagues used ultrasonic vibration technology to improve the surface quality of AZ31B magnesium alloy. Their study found it significantly enhances surface properties and reduces residual stress compared with other methods [10].
Wu Yuchao et al. studied surface damage formation in the cutting of SiCp/Al composites. They found that a two-dimensional cutting model and high-speed linear motor test effectively analyze cutting damage mechanisms. The position of SiC particles affects damage type, and higher cutting velocity improves surface quality [11]. Harmesh Kumar et al. used a central composite design and response surface method to optimize the material removal rate of SiCp/Al composites during turning. They found that cutting velocity is the main factor affecting surface roughness [12]. A study conducted by J. Paulo Davim et al. investigated the influence of cutting velocity on tool life in the machining of SiCp/Al composites using a PCD tool. Their findings revealed that tool wear was 1.5 times larger at 250 m/min compared with 700 m/min, indicating that higher cutting velocities led to increased tool wear [13]. Jiang Zenghui et al. developed a tool wear simulation model for turning 34CrNiMo6 high-strength steel. Their research shows that while rear tool face wear increases with cutting width, it is significantly more influenced by cutting velocity and feed [14].
Dhananchezian M. investigated the impact of cutting speed on the turning process of Inconel 600 using TiAlN blade-based tools. The investigation revealed notable blade tip wear at low cutting speeds of 25 and 38 m/min, combined with decreased cutting efficiency at 102 m/min while observing minor material loss on the blade [15]. Rashid Ali Laghari and his colleagues conducted a study on milling SiCp/Al composites in SCCO2-MQL. They investigated the impacts of lubricant cooling and dry cutting at various cutting velocities and feeds per tooth. The test findings indicate that adhesive wear is the primary mechanism of wear, and the use of SCCO2-MQL technology can significantly decrease material surface roughness and improve the lifespan of the tool [16]. Pradyut Kumar Swain and team conducted dry-cutting experiments on SiCp/Al composites, comparing uncoated and coated cemented carbide tools. They found that uncoated tools experienced significant wear, while coated tools showed reduced wear at lower temperatures [17]. Volodymyr Bushlya and colleagues found that machining SiCp/Al composites with PCBN tools formed a stable built-up edge at low cutting velocities, leading to significant tool-workpiece adhesion. However, at 400 m/min, the absence of a built-up edge caused rapid tool wear [18].
Jozef Zajac and other researchers employed various materials to evaluate and analyze the durability of tools. They also introduced accurate prediction techniques, which served as a theoretical foundation and practical reference for future cutting research and industrial implementation [19]. Xing Zhang et al. optimized milling parameters for Ti5Al5Mo5VCrFe titanium alloy in CNC roughing. They found that precise adjustments improve machining efficiency and stability and reduce tool wear [20]. J. Duplak developed a surface roughness prediction model for S355 steel using a factorial design in plasma arc cutting. The regression model predicts Rz values, aiding in optimizing plasma cutting and surface quality [21]. In order to confirm their tool wear prediction and cutting force monitoring model, Pengfei Ding and colleagues conducted micro-milling experiments on Al6061. The model offers precise theoretical direction for both static and dynamic analysis, hence enhancing processing efficiency and sustainability [22]. Niu Qiulin et al. used experimental design, neural networks, and response surface methods to study the effects of ultrasonic amplitude, cutting velocity, feed per tooth, and depth on cutting force, temperature, and surface roughness. Multi-objective optimization with evolutionary algorithms showed significant reductions in these factors, validating the model’s accuracy and optimization effectiveness [23].
Presently, the majority of research on SiCp/Al composite materials, both locally and globally, employ materials with volume fractions that vary from 15% to 36%. There is a scarcity of studies on the milling processes of aluminum-based composites containing medium to high-volume fractions. Furthermore, previous studies have examined the machining mechanisms involved in the cutting process of SiCp/Al composite materials. These studies have emphasized the considerable influence of milling settings on the indicators of tool wear after milling. Several process optimizations have been investigated regarding tool wear in SiCp/Al composite materials. Nevertheless, there is a dearth of comprehensive studies on the systematic prediction and management of tool wear based on production needs, as well as the optimization of milling settings to minimize tool wear and extend tool lifespan in SCCO2-MQL ultrasonic vibration circumstances.
2. Experimental Conditions and Procedures
2.1. Experimental Equipment and Tools
The PCD tool manufactured by Shenzhen Huichuan Technology Co., Ltd. (Shenzhen, China) has dimensions of D6 × 6H × D6 × 50L × 2F (tool diameter 6 mm, cutting edge length 6 mm, the total length of the tool 50 mm, the number of cutting edges 2, anterior angle 0°, posterior angle 15°, medium grade). In comparison to other tool materials, such as the carbide tool and cubic boron nitride CBN, the PCD tool exhibits exceptional characteristics such as high hardness, wear resistance, low friction coefficient, and good thermal conductivity. The choice of the bespoke PCD tool in this work was mostly based on its exceptional wear resistance when used to produce SiCp/Al composites. The SiCp/Al composite material is a hard material that causes quick wear in conventional tools used in machining processes. However, the PCD tool, with its high hardness and endurance to wear, may significantly prolong the lifespan of the tool, decrease wear during processing, and enhance surface quality. Furthermore, the chosen tool geometry is tuned to reduce cutting forces and enhance machining stability. The experimental material consisted of a composite material made of 6063DL31 aluminum alloy, which contained SiC particles with a volume proportion of 45%. The SiCp/Al composite material was manufactured using a meticulously planned procedure and subsequent stabilization techniques, with its chemical composition provided in Table 1. The experiment was performed using a VDL-1000 three-axis vertical machining center, as depicted in Figure 1. Throughout the trial, the Supercritical Carbon Dioxide equipment was connected and placed onto the machine tool. This equipment employed the Cry0lube-i0oW model, a supercritical CO2 micro lubrication device developed by Dongguan Anlin Mechanical Manufacturing Technology Co., Ltd. (Dongguan, China). The primary measuring devices utilized in the investigation were the VHX-1000 Ultra-Depth Microscope produced by Keyence Co., Ltd. (Shanghai, China) and the inVia-Reflex Raman confocal microscope produced by Horiba Instruments Co., Ltd. (Shanghai China).

Table 1.
Composition Percentage of Materials.
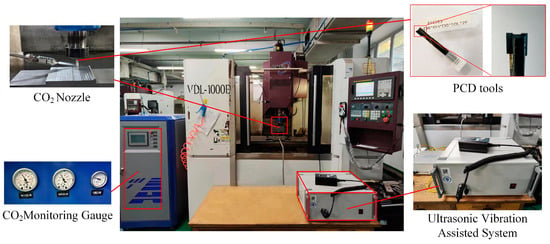
Figure 1.
Experimental site equipment.
2.2. Experimental Plan
The experimental plan consists of single-factor tests that focus on the cutting velocity vc, feed per tooth fz, milling depth ap, and milling width ae [24]. Table 2 displays the test parameters. The ultrasonic vibration frequency in the test is 27 kHz, with an amplitude of 7 μm. By monitoring and documenting the deterioration of cutting tools at various milling distances, following the guidelines established in International standard. Testing the cutting capabilities of milling tools made of cemented carbide for metal cutting—Part 2: Evaluating the comparative efficiency of face milling cutters. The VHX-1000 microscope produced by Keyence Co., Ltd. (Shanghai China) with ultra-depth field capability was utilized to visually examine and quantify the extent of wear on the rear surface of the tool. The procedure is as follows: Repair the tool on the microscope sample table and fine-tune the focal length and magnification settings to ensure the wear area is distinctly apparent. Within the image analysis software, a linear segment that runs parallel to the surface of the tool’s back is drawn across the worn region. The wear depth is then determined by measuring the distance between the point where the linear segment intersects the edge of the worn area and the adjacent non-worn area. The wear VB value of the rear tool surface was determined by conducting five measurements at various points and calculating the average value. The results of the tool wear test are shown in Table 3.

Table 2.
Experimental Parameters.

Table 3.
Tool Wear Test Results.
This study used VBmax (Maximum Wear) to assess tool wear, as it represents the most severe wear point and is commonly used to evaluate overall tool wear. VBmax was chosen for its ability to capture the uneven wear distribution typical in machining SiCp/Al composites. This measurement technique provides reliable data for analyzing tool wear and cutting performance. Considering that the cutting method used in this study belongs to the domain of precision machining, it is crucial to keep tool wear within a narrow range. Thus, a value of VB = 0.09 mm is established as the threshold for determining when the tool has become dull.
3. Experimental Results and Analysis
3.1. Impact of Cutting Velocity on Tool Wear
Figure 2 illustrates the impact of cutting velocity vc on the level of tool wear VB, whereas Figure 3 displays the amount of tool wear VB at a milling length of L = 4800 mm. These two graphs demonstrate that when the milling length L and cutting velocity vc rise, the tool wear amount VB initially decreases and subsequently increases. At a cutting velocity of 60 m/min, the tool wear amount VB is minimized. Increasing the cutting velocity vc from 40 m/min to 60 m/min results in a decrease in the amount of tool wear VB, suggesting that tool wear progresses relatively slowly at this stage. The reason for this is that when the cutting velocity is reduced at 40 m/min, the area of contact between the tool and the chips becomes larger. As a result, it takes more time for the chips to disengage from the tool, leading to a higher degree of tool wear VB compared with the scenario at 60 m/min. Nevertheless, when the cutting velocity vc is raised from 60 m/min to 100 m/min, there is a noticeable increase in the amount of tool wear VB, particularly on the rake face of the tool. Once the cutting velocity vc reaches around 100 m/min, the tool wear has already met the requirement for becoming dull. This occurs because, in high-speed cutting operations, the rate at which chips are removed increases. Nevertheless, as a result of the overly rapid cutting velocity, the duration of contact between the chips and the tool diminishes, resulting in inadequate cooling of the chips. The cumulative heat will result in thermal degradation of the tool, intensifying wear. Figure 4a shows the peeling of the tool coating when the milling length L is 4800 mm, and the cutting velocity vc is 80 m/min. Figure 4b shows that when the milling length L is 4800 mm, and the cutting velocity vc is 100 m/min, the tool edge breakage occurs.
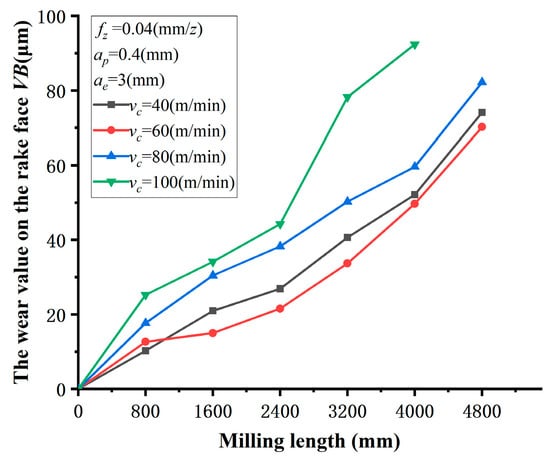
Figure 2.
The curve of the variation of tool wear amount VB.
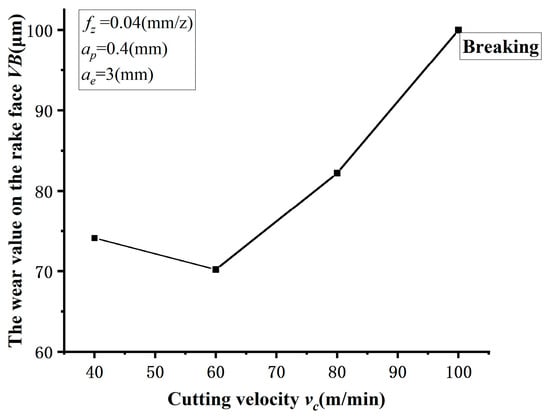
Figure 3.
The curve shows the tool wear amount of VB for a milling length of L = 4800 mm.
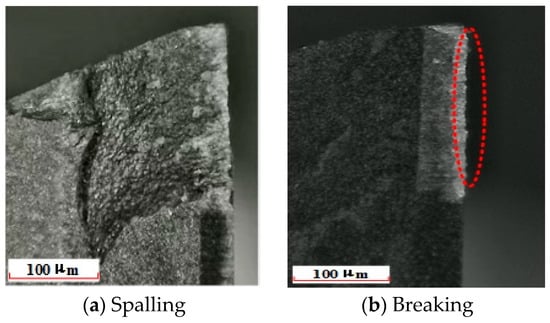
Figure 4.
The tool shape after wear.
Hence, the choice of cutting velocity vc must take into account both the longevity of the tool and the efficiency of the machining process. To achieve a balance between tool life and processing efficiency, it is advisable to maintain a cutting velocity vc of around 60 m/min. This will help ensure the quality of the machined parts. This supports the conclusion made by experts such as Niu Qiulin and others, who suggested a direct relationship between the amount of tool wear VB and the cutting velocity vc. As the cutting velocity vc increases, the occurrence of tool failure caused by excessive wear on the rake face intensifies [25].
3.2. The Impact of Feed per Tooth on Tool Wear
Figure 5 depicts the correlation between the feed per tooth fz and the amount of tool wear VB on the rake face. Meanwhile, Figure 6 displays the tool wear amount VB for a milling length of L = 4800 mm. Figure 7 shows the tool wear conditions when the milling length L is 4800 mm, and the feed per tooth is different. The graph clearly demonstrates that the feed per tooth fz has a substantial influence on the amount of tool wear VB. Using a smaller feed per tooth fz on the milling machine results in a decrease in the feed rate, which in turn increases the duration of contact between the workpiece and the tool. Conversely, a higher value of feed per tooth fz can shorten the cutting time needed to remove a given amount of material, minimize the abrasive impact of particles on the tool, and expedite the bonding process between the treated surface and the reinforcing particles. This significantly decreases the amount of wear on the tool. Optimizing tool longevity and machining efficiency relies heavily on adjusting the feed per tooth fz. Figure 8 displays the wear patterns on the rake face under various feed per tooth fz settings. It is evident that the rake face shows varying degrees of wear phenomena, such as little chipping of the tool, under different feed per tooth fz settings. At a feed per tooth fz of 0.08 mm/z, the arithmetic mean height Ra of the material surface, as determined by the white light interferometer, is 0.127 μm. Decreasing the feed per tooth fz results in a reduction in the surface roughness of the material. When the feed per tooth fz is 0.02 mm/z, the tool experiences minimal wear, resulting in an arithmetic mean roughness Ra of the treated surface of 0.093 μm, indicating the ideal condition. Additionally, there are no noticeable signs of damage on the rake face. According to researchers such as Lin Jieqiong, it has been observed that as the feed per tooth fz grows, the impact of a worn tool on the arithmetic mean roughness Ra becomes more significant [26]. Research findings suggest that when using SCCO2-MQL with ultrasonic vibration, the cutting process can endure for a maximum duration of 50 min. This not only prolongs the duration between tool replacements but also effectively reduces the rate of tool deterioration.
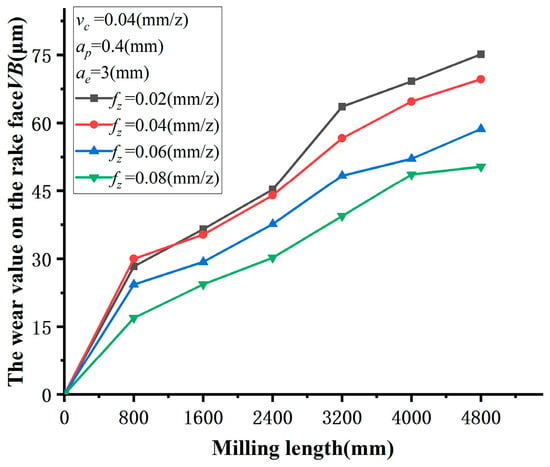
Figure 5.
The curve of the variation of tool wear amount VB.
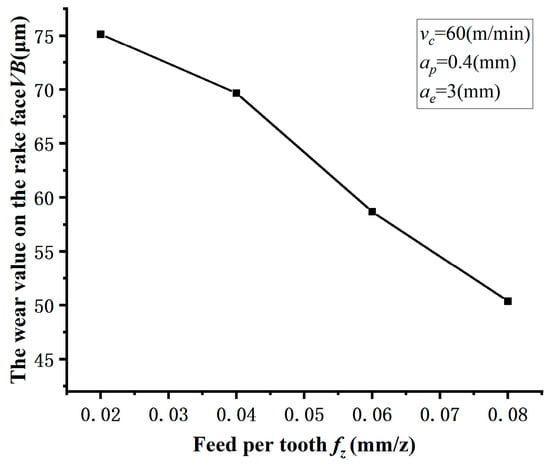
Figure 6.
The curve shows the tool wear amount of VB for a milling length of L = 4800 mm.
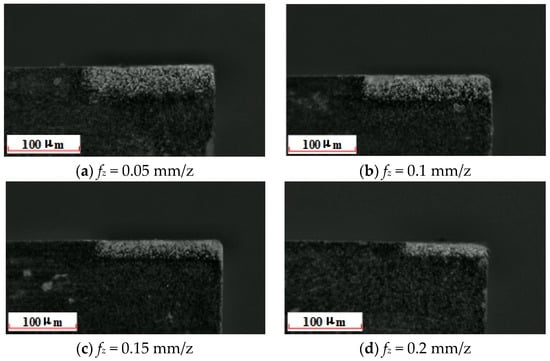
Figure 7.
The wear morphology of the rake face is under different feeds per tooth fz.
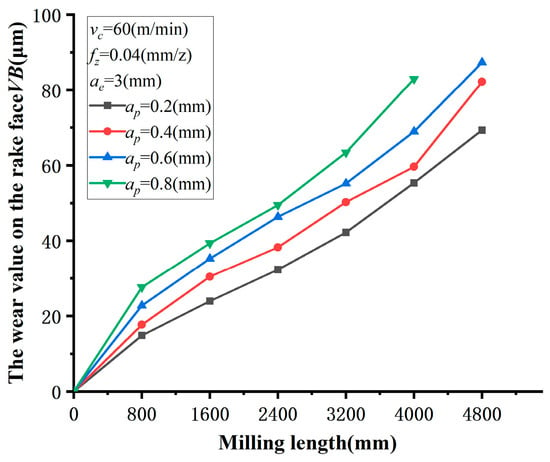
Figure 8.
The curve of the variation of tool wear amount VB.
3.3. The Influence of Milling Depth on Tool Wear
Figure 8 depicts the relationship between the milling depth ap and the amount of tool wear VB on the rake face. Meanwhile, Figure 9 displays the amount of tool wear VB for a milling length of L = 4800 mm. These two graphs demonstrate that when the milling depth ap grows, the tool wear amount VB value noticeably increases. Figure 10 illustrates the variations in damage phenomena and severity on the flank face when the milling depths ap are adjusted to 0.6 mm and 0.8 mm, respectively. The escalation in this form of damage can be attributed to the elevation in temperature that occurs during milling as the milling depth ap increases. The tool surface is very susceptible to cold welding, resulting in heightened chemical reactivity and diminished material malleability, ultimately causing escalated tool deterioration. This experimental finding suggests that using a milling depth ap that is too large is not appropriate for cutting activities. This finding aligns with the conclusion put forth by scholars such as Sun Wenlong et al., which states that when the milling depth ap increases, the milling temperature also increases, resulting in a rise in tool flank wear [27].
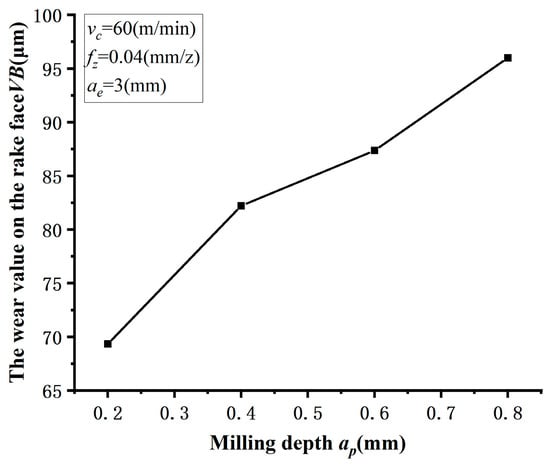
Figure 9.
The curve shows the tool wear amount of VB for a milling length of L = 4800 mm.
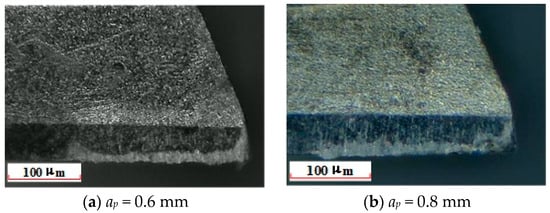
Figure 10.
The tool wear condition at milling depths of 0.6 mm and 0.8 mm.
3.4. The Effect of Milling Width on Tool Wear
Figure 11 illustrates the impact of milling width ae on the tool flank wear VB. Figure 12 shows the VB value of tool wear for a milling length of 4800. Figure 11 and Figure 12 demonstrate that as the milling width ae increases, the rate of tool wear VB increases at a rather slow pace. The effect of the milling width ae on the tool wear VB value is not significant within a narrow fluctuation range. According to this trend analysis, we can deduce that the milling width ae and milling depth ap have comparable effects on tool wear VB, both in terms of amplitude and trend. Based on the findings of this experiment, it is recommended to refrain from employing overly wide milling widths during the milling procedure.
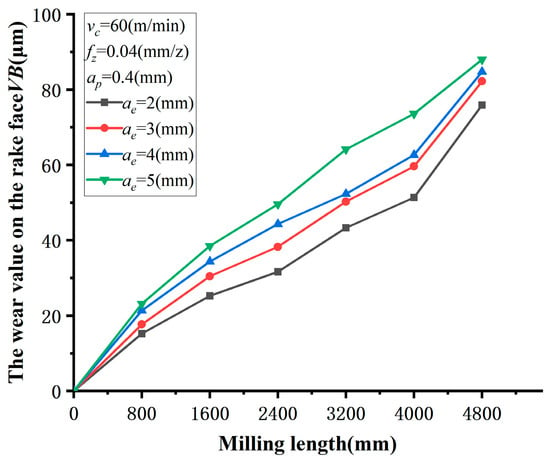
Figure 11.
The curve of the variation of tool wear amount VB.
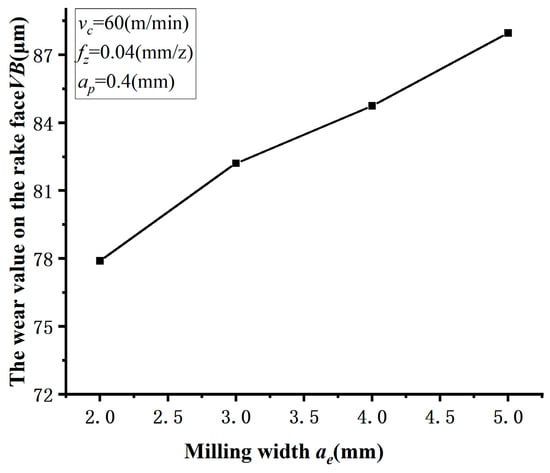
Figure 12.
The curve shows the tool wear amount of VB for a milling length of L = 4800 mm.
3.5. Analysis of Tool Wear Mechanism
3.5.1. Grain Abrasion
During the cutting process, grain abrasion inevitably occurs, so when cutting SiCp/Al composite materials, grain abrasion is one of the main reasons for tool wear [28]. Figure 13 illustrates the tool’s abrasive wear in two distinct conditions: dry cutting and SCCO2-MQL ultrasonic vibration cutting. The cutting parameters and cutting length of 800 mm remain the same in both scenarios. The tool wear amount VB value for dry cutting is measured to be 50 μm, but for SCCO2-MQL ultrasonic vibration cutting, it is measured to be 12 μm. Upon comparing (a) and (b) in Figure 13, it is evident that while using SCCO2-MQL ultrasonic vibration, the wear pattern on the flank face of the tool is more optimal compared with dry cutting. Additionally, the abrasive wear pattern is also less pronounced. The experiment demonstrates that the SCCO2-MQL ultrasonic vibration technology successfully reduces the high temperature at the cutting point, leading to a significant improvement in the abrasive wear condition. This technology is particularly notable for its superior low-temperature cooling effect. The findings of Liang Xu and other academics in their research on titanium alloy milling, which compared dry cutting with SCCO2-MQL ultrasonic vibration technology, support this conclusion [29].
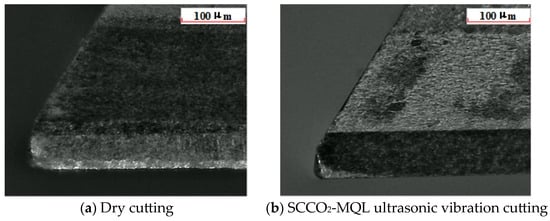
Figure 13.
Tool wear diagram under different machining conditions.
3.5.2. Adhesive Wear
The SEM pictures in Figure 14a,b depict the tool wear observed during cutting at a length of 800 mm. The two situations compared are dry cutting and SCCO2-MQL ultrasonic vibration cutting, both using identical cutting parameters. The presence of trace elements such as carbon, aluminum, silicon, copper, and oxygen on the tool was confirmed by Energy Dispersive Spectrum (EDS) analysis, as depicted in Figure 14c. Specific content data may be found in Table 4. By comparing these data, it is evident that the element content in the bond material is lower under the SCCO2-MQL ultrasonic vibration cutting environment compared with the dry cutting environment. Furthermore, SCCO2-MQL ultrasonic vibration can effectively reduce the adhesive wear of the tool.
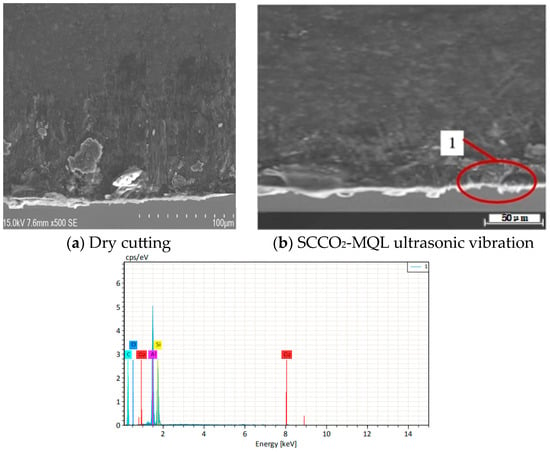
Figure 14.
Adhesive wear image on the tool’s back surface.

Table 4.
The Percentage Content of Elements in the Bond Material on the Rake Face.
3.5.3. Breaking and Spalling
Figure 15 clearly shows that the cutting edge of the PCD tool has suffered from chipping and spalling. Research and analysis have revealed that the PCD tool experiences continual chipping and spalling during the machining process, with variations in the extent of these damages. When using SCCO2-MQL ultrasonic vibration with the same cutting parameters and a cutting length of 800 mm, the tool demonstrates notable benefits compared with dry cutting. These advantages include reduced chipping and spalling damage. The benefits of the SCCO2-MQL ultrasonic vibration technology are achieved through its several functional processes. The supercritical CO2 minimum quantity lubrication efficiently cools the cutting region, minimizing heat buildup. This leads to decreased temperatures of both the tool and the workpiece, resulting in a reduced rate of tool wear. Ultrasonic vibration enhances lubrication and facilitates uniform dispersion of lubricant in the cutting region, resulting in a more stable lubricating layer. This reduces frictional resistance during cutting and effectively safeguards the tool’s surface. In addition, ultrasonic vibration causes the chips to break and disperse easily, preventing them from accumulating in the contact area between the tool and the workpiece. This reduces friction during the cutting process, minimizes interaction between the tool, workpiece, and chips, and decreases mechanical stress and thermal shock. Consequently, the wear rate of the tool is reduced, and chipping and spalling phenomena are improved.
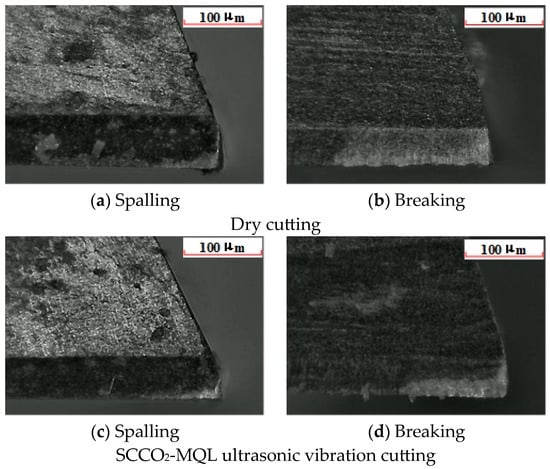
Figure 15.
Spalling and breaking on the rake face.
4. Prediction Model and Parameter Optimization of Tool Wear in SiCp/Al Composite
4.1. Orthogonal Experimental Design and Result Analysis
The orthogonal experiment involved the comprehensive specification of the variables cutting velocity vc, feed per tooth fz, milling depth ap, and milling width ae. The milling length for all experiments was uniformly set at 1600 mm. The specific milling parameters of each experimental group can be referred to in Table 5, and the orthogonal test results are shown in Table 6.

Table 5.
Orthogonal Parameter Table.

Table 6.
Orthogonal Experimental Results.
The ideal combination of components was identified by completing a range analysis of experimental data, as presented in Table 7. According to the findings of the range analysis, the cutting velocity vc and feed per tooth fz are the primary factors that have a major impact on tool wear. When conducting milling operations, it is crucial to consider the settings of these two parameters carefully.

Table 7.
Range Analysis.
4.2. Development of Tool Wear Model
Through an analysis of the law of tool wear, the key parameters that have an impact on the amount of tool wear, known as VB, were determined. The parameters that need to be considered are the cutting velocity vc, feed per tooth fz, milling depth ap, and milling width ae. An empirical mathematical model was developed to establish a relationship between the amount of tool wear VB and the milling process parameters based on the principles of metal cutting. The formula is as stated:
The formula utilizes CVB as the inherent coefficient of the empirical formula, with b1, b2, b3, and b4 serving as correction coefficients.
When the milling length L = 1600 mm, the prediction model of tool wear under SCCO2-MQL ultrasonic vibration was established by Matlab 2020b. Presented below is the model that predicts the wear of the tool:
To determine if the model accurately represents the impact of each cutting parameter on tool wear and assess the accuracy of these data, this study utilized SPSS 20.0 software to perform an effect test on experimental data presented in Table 6. The test result yielded an R2 value of 0.963, indicating a strong correlation between the predicted and actual values and confirming the reliability of the prediction model.
SPSS software was utilized to perform an F-test in order to evaluate the statistical significance of the predictive model created earlier and its coefficients. At a significance level of α = 0.05, which is equivalent to a 5% significance level, the crucial F-value is 3.36, as determined by the F-distribution table. Given that our computed F-statistic exceeds the critical value of 3.36, F > F0.05(4, 11) = 3.36, we can confidently assert that the multivariate linear regression model developed in this experiment possesses statistical significance. This validates the robustness of the tool wear prediction model.
Although the empirical model used to predict tool wear has statistical significance as a whole, it is important to note that not all independent factors have a significant influence on VB. To further examine the impact of each regression coefficient, it is necessary to perform individual significance tests for each of them [30]. For the purpose of this investigation, we utilized the t-test approach, employing calculations based on the following formula [31].
When performing t-tests in SPSS, a significance level of α = 0.05 was selected. The significance level for the t-test is obtained using the formula t(α/2)(n-p) = t0.025(11) = 2.2010, as shown in the table. The results of the regression coefficient tests in Table 8 indicate that β1 is larger than β2, β2 is larger than β3, and β3 is larger than 2.2010, which is also larger than β4. The analysis reveals that the cutting velocity vc and feed per tooth fz exert a more substantial influence on the projected values than the milling width ae and milling depth ap. Furthermore, the milling width ae has a negligible impact on the model. This method aligns well with the maximum deviation obtained from the orthogonal experiment, indicating the importance of the coefficients in the tool wear prediction model.

Table 8.
Model Coefficient Test.
In order to verify the reliability and accuracy of the constructed tool wear prediction model, the application range of the model’s milling parameters (40 < vc < 100; 0.02 < fz < 0.08; 0.2 < ap < 0.8; 2 < ae < 5), six groups of milling tests were designed, the specific parameters and results are shown in Table 9. The results show that the average relative error between these test data and the predicted value of the tool wear model is 3.25%, so the prediction accuracy of the model is high.

Table 9.
Experimental Values and Model Prediction Results.
4.3. Establishment of Multi-Objective Optimization Function and Optimization of Milling Parameters
Due to the low impact of milling width ae on the tool wear model, the accuracy of tool wear modeling is enhanced when milling width ae is not taken into consideration. Thus, the milling width ae was eliminated from the model. The model is formulated with the objective function of maximizing the metal removal rate Q while minimizing the tool wear VB value, as indicated in Formula 4. The genetic algorithm is employed to optimize the milling parameters based on the empirical model of tool wear. This is performed in order to approximate or achieve the preset objective function, as expressed in Equation (5).
The formula uses the variables “d” to represent the tool diameter and “F” to represent the minimum amount of tool wear, denoted as VB.
In this experiment, parameters matching the milling properties of SiCp/Al composite material were carefully determined and adjusted using Matlab 2020b software. The optimal milling parameters were successfully achieved by feeding the goal function and restrictions into Matlab and running the specially constructed genetic algorithm program.
During the critical phase of solving the optimization model, it is imperative to precisely establish the computational bounds, which refer to the constraint conditions. The parameter optimization bounds in this scenario were established using experimental data and encompassed the following constraint conditions: The cutting velocity vc must fall within the range of 40 to 100 m/min. The feed per tooth fz is limited to a range of 0.02 to 0.08 mm/z. The milling depth ap must be between 0.2 and 0.8 mm. The utilization of Matlab software facilitated a thorough study, yielding the most favorable combination of milling parameters: a cutting velocity vc of 60.00 m/min, a feed per tooth fz of 0.08 mm/z, and a milling depth ap of 0.20 mm.
A controlled experiment was conducted in this study to validate the impact of the optimized milling parameter combination on minimizing tool wear. The experiment consisted of two groups: the optimal parameter group and the unoptimized parameter group. The tool wear VB value of each group was measured at the same machining length L = 4800 mm. In order to minimize the impact of other factors, the milling width ae was fixed at a constant value of 3.00 mm in this test, as it was found to have negligible effect on tool wear. The rationale behind selecting a milling width of 3 mm is to strike a balance within the spectrum of milling widths. This ensures an adequate cutting area during the actual machining process without overburdening the tool. The optimization group in the test had the following parameters: vc = 60.00 m/min, fz = 0.08 mm/z, ap = 0.20 mm, ae = 3.00 mm. The experimental findings can be found in Table 10. The control group had the following parameters: vc = 80.00 m/min, fz = 0.06 mm/z, ap = 0.60 mm, and ae = 3.00 mm. The empirical findings are presented in Table 11.

Table 10.
Experimental Results of Optimization Group.

Table 11.
Control Group Experimental Results.
In comparison to the non-optimized parameter group, the optimized parameter group exhibits a statistically significant decrease in tool wear and surface roughness. The optimal parameter group achieves tool wear of 52.46 μm and surface roughness of 0.085 μm when the milling length is 4800 mm. The unoptimized parameter group exhibits tool wear of 70.21 μm and surface roughness of 0.130 μm. The findings indicate that altering milling settings has a direct impact on reducing tool wear, reducing surface roughness, and extending tool life. By prolonging the lifespan of the tool, the frequency of tool replacement is decreased, resulting in an indirect reduction in production costs.
5. Conclusions
The investigation of high-speed milling parameters for SiCp/Al composite materials using SCCO2-MQL ultrasonic vibration technology revealed that the cutting velocity vc reaches its lowest value for tool wear VB at 60 m/min. However, once surpassing this threshold, wear intensifies, resulting in significant deterioration on both the front and posterior tool surfaces. As the feed per tooth fz grows, the tool wear VB reduces. This effect is particularly pronounced when the feed per tooth is 0.02 mm/z, resulting in decreased tool wear VB and optimal surface roughness Ra. Augmenting the milling depth ap and milling width ap results in an escalation of tool wear VB, particularly when the milling depth ap surpasses 0.6 mm, causing a substantial intensification of tool wear. The research findings suggest that by optimizing milling parameters under SCCO2-MQL ultrasonic vibration conditions, it is possible to effectively decrease tool wear, prolong tool lifespan, and enhance processing quality. Under these circumstances, it is efficient in minimizing tool wear, such as fractures and chipping, reducing grain erosion and sticking, thereby greatly improving tool longevity. Hence, it is advisable to refrain from employing overly elevated cutting velocity and milling depths while conducting the milling procedure in order to guarantee optimal processing efficiency and superior workpiece quality.
The orthogonal test approach was employed to methodically encompass the parameter combination using a restricted number of tests. Ultimately, it was concluded that the cutting velocity vc and feed per tooth fz had a greater impact on the projected values compared with the milling width ae and milling depth ap. Additionally, the milling width ae had a minimal effect on the model. A predictive model for tool wear was developed utilizing range analysis and multiple linear regression approaches based on experimental data. The tool wear predictive model was analyzed using F-tests and t-tests, which demonstrated that the model can accurately predict tool wear. The prediction accuracy is influenced by two important parameters: cutting velocity vc and feed per tooth fz. The optimization of milling settings was accomplished by combining the global search capabilities of genetic algorithms with the programming advantages of Matlab. By performing iterations that involve encoding, selection, crossover, and mutation processes, as well as the actual machining situation, the most effective combination of milling parameters has been successfully determined: vc = 60.00 m/min, fz = 0.08 mm/z, ap = 0.20 mm. Ultimately, the experimental findings demonstrate that the optimized milling settings have a significant impact on diminishing tool wear and extending its lifespan.
In brief, this work successfully decreased the tool wear of SiCp/Al composite material by the use of SCCO2-MQL ultrasonic vibration technology. It also developed a precise tool wear prediction model, optimized cutting parameters, greatly prolonged the tool life, and enhanced the machining quality. This offers a significant process optimization option for precision manufacturing in diverse sectors such as aerospace, while the ecological compatibility of SCCO2-MQL technology contributes to the advancement of green manufacturing. In addition to offering theoretical support for tool wear control, the research results also suggest a route for future optimization of machining settings in conjunction with intelligent algorithms.
Author Contributions
Writing—review and editing, H.Z.; Writing—original draft preparation, B.W.; Investigation, Resources, L.Q.; Review, English editing, and proofreading, X.W. All authors have read and agreed to the published version of the manuscript.
Funding
This work was supported by the National Natural Science Foundation of China (Grant nos. 52275417).
Data Availability Statement
Data are contained with the article.
Conflicts of Interest
The authors declare no conflict of interest.
References
- Yu, H.; Zhou, X.; Zhang, C. Research Progress of SiC Reflecting Mirror. New Technol. New Process 2006, 5, 26–30. [Google Scholar]
- Liu, J.W.; Cheng, K.; Ding, H. An Investigation of Surface Defect Formation in Micro Milling the 45% SiCp/Al Composite. Procedia CIRP 2016, 45, 211–214. [Google Scholar] [CrossRef]
- Li, M.; Wang, A.; Xie, J. The present research situation and progress of SiC particle-reinforced aluminum matrix composites. Powder Metall. Ind. 2015, 25, 55–60. [Google Scholar] [CrossRef]
- Weinert, K.; König, W. A Consideration of Tool Wear Mechanism When Machining Metal Matrix Composites (MMC). Ann. CIRP 2008, 42, 95–98. [Google Scholar] [CrossRef]
- Wolff, E.G. An Introduction to Metal Matrix Composites. Mater. Res. Bull. 1995, 30, 1585–1587. [Google Scholar] [CrossRef]
- Lv, D. Research on SiCp/Al Composite Machining Technology. Electro-Mech. Eng. 2011, 27, 29–32. [Google Scholar] [CrossRef]
- Zha, H.; Feng, P.; Zhang, J. Wear characteristics of cutting tools in ultrasonic vibration-assisted scratching high volume fraction SiC particle reinforced aluminum matrix composites. J. Jilin Univ. Chang. China 2019, 49, 458–465. [Google Scholar] [CrossRef]
- Ma, G.; Zhang, J.; Yan, F. Finite element analysis of cutting process and surface formation of SiCp/Al composites under conventional and ultrasonic vibration assisted conditions. Manuf. Technol. Mach. Tool. 2024, 4, 51–56. [Google Scholar] [CrossRef]
- Baraya, M.; Yan, J.; Hossam, M. Improving and Predicting the Surface Roughness and the Machining Accuracy in Ultrasonic Vibration-Assisted Milling. J. Vib. Eng. Technol. 2024, 3, 23–27. [Google Scholar] [CrossRef]
- Deswal, N.; Kant, R. Comparative Study of Surface Integrity for AZ31B Magnesium Alloy during the Application of Ultrasonic Vibration and Laser Energies in the Turning Process. J. Mater. Eng. Perform. 2023, 19, 37–41. [Google Scholar] [CrossRef]
- Wu, Y.; Guo, M.; Guo, W. Surface Damage Formation Mechanism of SiCp/Al Composites Based on 2D Cutting. Surf. Technol. 2024, 53, 145–155. [Google Scholar] [CrossRef]
- Kumar, H.; Wadhwa, S.A.; Akhai, S.; Kaushik, A. Parametric optimization of the machining performance of Al-SiCsubp/sub composite using combination of response surface methodology and desirability function. Eng. Res. Express 2024, 6, 025505. [Google Scholar] [CrossRef]
- Davim, J.P.; Baptista, A.M. Relationship between cutting force and PCD cutting tool wear in machining silicon carbide reinforced aluminium. J. Mater. Process. Technol. 2020, 103, 417–423. [Google Scholar] [CrossRef]
- Jiang, Z.; Zhang, W.; Wang, S. Simulation of cutting parameters on tool wear in cutting high-strength steel. Ordnance Mater. Sci. Eng. 2021, 44, 28–32. [Google Scholar] [CrossRef]
- Dhananchezian, M. A Tool Wear Analysis of an Inconel 600 Turned TiAlN Coated Carbide Insert at Various Cutting Speeds. Mater. Today Proc. 2023, 72, 2217–2220. [Google Scholar] [CrossRef]
- Laghari, R.A.; He, N.; Jamil, M.; Gupta, M.K. Tribological and machining characteristics of milling SiCp/Al MMC composites under sustainable cooling conditions. Int. J. Adv. Manuf. Technol. 2023, 128, 2613–2630. [Google Scholar] [CrossRef]
- Swain, P.K.; Mohapatra, K.D.; Swain, P.K. Investigations, Analysis and Performance Comparison of Uncoated CNMG 120408 TTR and Coated 12040822 Carbide Tools during Dry Turning of Al-SiCp Nano Composites. Mater. Today Proc. 2020, 26, 2. [Google Scholar] [CrossRef]
- Bushlya, V.; Lenrick, F.; Gutnichenko, O.; Petrusha, I.; Osipov, O.; Kristiansson, S.; Stahl, J.-E. Performance and Wear Mechanisms of Novel Superhard Diamond and Boron Nitride Based Tools in Machining Al-SiCp Metal Matrix Composite. Wear 2017, 376–377, 152–164. [Google Scholar] [CrossRef]
- Zajac, J.; Duplak, J.; Duplakova, D.; Cizmar, P.; Olexa, I.; Bittner, A. Prediction of Cutting Material Durability by T = f(vc) Dependence for Turning Processes. Processes 2020, 8, 789. [Google Scholar] [CrossRef]
- Zhang, X.; Pan, T.; Ma, A.; Zhao, W. High efficiency orientated milling parameter optimization with tool wear monitoring in roughing operation. Mech. Syst. Signal Process. 2022, 165, 108394. [Google Scholar] [CrossRef]
- Duplák, J.; Hatala, M.; Dupláková, D.; Botko, F. Prediction model of surface roughness parameters of structural steel created by plasma arc cutting via full factor experiment. Mater. Und Werkst. 2019, 50, 1207–1220. [Google Scholar] [CrossRef]
- Ding, P.; Huang, X.; Zhao, C.; Liu, H.; Zhang, X. Online monitoring model of micro-milling force incorporating tool wear prediction process. Expert. Syst. Appl. 2023, 223, 119886. [Google Scholar] [CrossRef]
- Dai, F.; Niu, Q.; Jing, L.; Wang, X.; Liu, L.; Xiao, Y. Multi-objective parameter optimization of longitudinal-torsional ultrasonic vibration assisted milling 60% SiC_p/Al. Aeronaut. Manuf. Technol. 2024, 67, 14–26. [Google Scholar] [CrossRef]
- Niu, Q.; Gao, H.; Zhang, S.; Xiang, D.; Jing, L.; Li, C. Experimental Study on Surface quality and Chip Morphology of SiCp/Al Composites by Ultrasonic vibration assisted milling. Tool. Technol. 2012, 56, 12–17. [Google Scholar]
- Niu, Q.; Tang, L.; Xiang, D. Study on tool wear of cemented carbide coated tool in milling of SiCp/Al composites. J. Henan Polytech. Univ. (Nat. Sci.) Jiaozuo China 2018, 37, 90–93+111. [Google Scholar] [CrossRef]
- Lin, J.; Jia, R.; Zhou, Y. PCD tool wear in cutting SiCp/6005Al composites. Diam. Abras. Eng. 2023, 43, 322–331. [Google Scholar] [CrossRef]
- Sun, W.; Shi, W.; Liu, Y. Study on Tool Wear of Aramid Fiber Reinforced Plastic Composites in Micromilling. Tool. Eng. 2021, 55, 35–40. [Google Scholar] [CrossRef]
- Liu, Z.; Ai, X. Wear Characteristics of Cutting Tools in High Speed Machining. Tribology 2002, 22, 468–471. [Google Scholar] [CrossRef]
- Liang, X.; Cai, C.; An, Q. Cooling and Lubrication Performance of SCCO2 Mixed Oil Film with Water Droplets in TC4 Milling. China Mech. Eng. 2020, 31, 328–335. [Google Scholar] [CrossRef]
- Gao, M.; Tao, C.; Shi, L. Data Analysis and Test of an Uniform Design Experiment Based SAS. J. Ordnance Eng. Coll. 2015, 27, 6–9. [Google Scholar] [CrossRef]
- Yi, Z.J. Mathematical Statistics and Its Engineering Application; Tsinghua University Press: Beijing, China, 2014. [Google Scholar]
Disclaimer/Publisher’s Note: The statements, opinions and data contained in all publications are solely those of the individual author(s) and contributor(s) and not of MDPI and/or the editor(s). MDPI and/or the editor(s) disclaim responsibility for any injury to people or property resulting from any ideas, methods, instructions or products referred to in the content. |
© 2024 by the authors. Licensee MDPI, Basel, Switzerland. This article is an open access article distributed under the terms and conditions of the Creative Commons Attribution (CC BY) license (https://creativecommons.org/licenses/by/4.0/).