Abstract
Cavitation phenomena in pumps are major determinants of the lifespan of both the impeller and the pump itself, causing significant vibration and noise, which are critical concerns for pump designers. This study focuses on the influence of various geometric factors of the impeller, including the shape of the blade leading edge, blade inlet angle, number and thickness of blades, surface roughness, wrap angle, impeller outlet width, inlet hub diameter, and tip clearance. The pump analyzed in this study, which exhibited issues of vibration and noise in actual industrial settings, was evaluated by varying only the shroud diameter based on Gulich’s theory, while keeping other parameters constant, to assess the effects on cavitation phenomena across five different impellers. Single-phase analysis was initially conducted to evaluate the performance of each pump model, with the reliability of the numerical analysis methods validated by comparison with experimental data. Furthermore, to analyze cavitation phenomena, a multiphase flow analysis was performed using the Rayleigh–Plesset model within a computational fluid dynamics framework. Quantitative analysis of cavitation occurrence, NPSH3% head-drop performance, and bubble volume was conducted. The results confirmed that the M1 model, featuring a shroud diameter of 560 mm, exhibited superior cavitation resistance. Variations in cavitation occurrence observed under three different flow conditions demonstrated a nonlinear trend, but overall, improvements were noted within a specific diameter range. This study offers valuable insights and data for pump design applicable in real-world industrial settings.
1. Introduction
A centrifugal pump is a mechanical device that transfers fluid from one location to another within a system. Recent industrial advancements have escalated the demand for high-performance and efficient pumps. The performance of a pump is contingent on various factors, notably the impeller and casing, which are essential components. The impeller, in particular, continuously induces a vacuum through blade rotation, invariably leading to cavitation. Cavitation occurs when the pressure at the pump inlet falls below the saturation vapor pressure, causing bubbles to form and block the impeller’s flow path. The subsequent collapse of these bubbles decreases efficiency, head, and power, and inflicts damage on the impeller and casing [1,2], resulting in vibrations and noise [3,4,5]. Therefore, understanding and mitigating cavitation is crucial.
Recent advances in computational fluid dynamics (CFD) have increased interest in the numerical analysis of cavitation, a method previously constrained to experimental approaches. Numerous studies have validated the accuracy of numerical simulations in analyzing cavitation, demonstrating that these analyses, which were once costly and labor-intensive, can now be performed economically and efficiently [6,7,8,9].
The expanding body of literature includes studies such as those by Zhu et al. [10], who applied the diffusion-angle integral design method, genetic algorithms, and CFD to minimize pressure drop in mixed-flow pumps by modifying the leading edge (LE) shape of the impeller. Their optimization efforts resulted in an optimized impeller design. Sano et al. [11] examined the impact of variations in the ellipse ratio at the LE of a circulation pump impeller on cavitation, concluding that increases in flow rate and ellipse ratio mitigated cavitation. Tao et al. [12] explored various LE shapes—initially blunt, sharp, round, and elliptical—and their effects on cavitation, head, and flow separation, finding that smooth transitions in LE geometry significantly influence cavitation and overall pump performance. Liu et al. [13] analyzed the effects of changes in the angle and wrap angle of the centrifugal pump impeller’s LE, identifying that these modifications significantly impact the severity of cavitation.
Several studies have explored the effect of alterations in impeller blade shapes on cavitation, consistently highlighting that the geometry of the impeller’s LE crucially influences suction performance. Additionally, the integration of inducers within impellers as a preventative measure against cavitation is a focal area of ongoing research. For instance, Huan et al. [14] conducted both experimental and numerical analyses on cavitation phenomena in a centrifugal pump equipped with a two-blade inducer. Guo et al. [15] assessed the impact of varying the number of inducer blades on cavitation resistance and overall performance, finding that an optimal blade count enhances the net positive suction head required (NPSHre), thereby improving cavitation resistance although at the expense of reduced head and efficiency. Campos-Amezcua et al. [16] explored the effects of radial tip clearance on pump performance and cavitation behavior in an inducer. They found that numerical analysis of models considering clearance was more accurate and consistent with experimental results compared to models without clearance. The study emphasizes the important role of considering clearance in optimizing the performance of axial inducers. Moreover, they identified that local cavitation flow instabilities in the inducer result from interactions with recirculating flow [17].
However, the universal application of inducers is constrained by environmental and economic factors, limiting their effectiveness in fundamentally addressing cavitation. Research aimed at diminishing recirculating flow and cavitation by modifying the impeller outlet width is also prevalent. Shi et al. [18] conducted an extensive study—experimental, theoretical, and numerical—on the performance of a multi-stage centrifugal pump with varied impeller outlet widths, observing that increased widths enhance head and shift efficiency to higher flow points, though excessive width may lead to overloads and vortices owing to increased shaft power, thus necessitating a balance. Tan et al. [19] used CFD to investigate the impact of changes in impeller outlet width on vortices and recirculating flow, noting that narrower widths increase vortex formation at the outlet, while wider widths are more prone to backflow into the impeller owing to recirculating flow.
Recirculating flow not only induces vibrations but also generates high-pitched noises that could cause severe pump damage due to cavitation [20]. Shim et al. [21] employed a multi-objective genetic algorithm combined with CFD to optimize pump performance by reducing suction recirculating flow and cavitation. Subsequent research [22] focused on the effects of adjusting the volute cross-sectional area, while Kim et al. [23] demonstrated that reducing the impeller inlet diameter effectively mitigates recirculating flow and enhances pump performance. However, the study by Schiavello et al. [24] assessed that the effects of cavitation and recirculation worsen as pump size (impeller eye diameter) and design capacity increase. This contrasts with the findings of Kim et al. [23] and many other researchers, suggesting that the results may vary depending on the pump’s geometry and operating conditions.
Extensive research has been conducted on pump performance, recirculation flow, and cavitation, but studies related to cavitation concerning impeller inlet diameter vary depending on the pump’s geometry and operating conditions. This study aims to address the gap in research that has been primarily focused on single-suction pumps, and it discusses the geometric design and procedures of the pump along with numerical validation. The research findings are discussed in Section 3, where the flow characteristics of each model are analyzed, and the onset of cavitation is described. The primary objective is to computationally analyze changes in the inlet shape that can improve the performance and cavitation resistance of pumps, particularly those experiencing issues with vibration and noise in the field.
2. Study Design
2.1. Research Subject
The subject of this study is a double-suction, single-stage centrifugal pump with a specific speed of 260, currently encountering issues related to vibration and noise in industrial settings. This pump comprises an impeller, suction, volute, and wearing parts. The three-dimensional configuration of the pump is shown in Figure 1, and the analysis includes five impeller blades per side (a total of 10 blades).
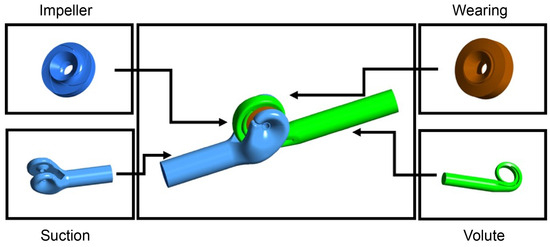
Figure 1.
Three-dimensional geometry of double suction pump.
Key design specifications of the analysis model are detailed in Table 1, and the blade angle for each model is specified in detail in Table 2. Aside from minor variations due to changes in inlet diameter, the angle differences are negligible. The specific speed (ns), suction specific speed (nss), and efficiency (η) are calculated using the following equations:
where N is the rotational speed (rev/min), fq is the number of impeller eyes per impeller (single-entry fq = 1; double-entry fq = 2), Q is the flow rate (m3/h), H is the head (m), NPSH is the net positive suction head (m), ρ is the liquid density (kg/m3), g is gravitational acceleration (m/s2), T is torque (Nm), and ω is angular velocity (rad/s). Modifications to the impeller design focused solely on the inlet diameter of the shroud while the hub dimensions remained constant. The design equation utilized, proposed by Gulich [25], is expressed as follows:
where QLa denotes the flow rate through the impeller (m3/s), kn represents the blockage caused by the hub (kn =1 − dn2/d12, dn = hub diameter), α1 is the angle between the direction of circumferential and absolute velocity (°), and β1 is the angle between the relative velocity vector and the negative direction of circumferential velocity (°). Figure 2 shows the side view of the impeller models used in this study based on this formula and experiential design, labeled O1 (original impeller), M1 (modified impeller), M2, M3, and M4, with diameters of 586, 560, 550, 530, and 520 mm, respectively.

Table 1.
Design specifications.

Table 2.
Impeller blade angle data.
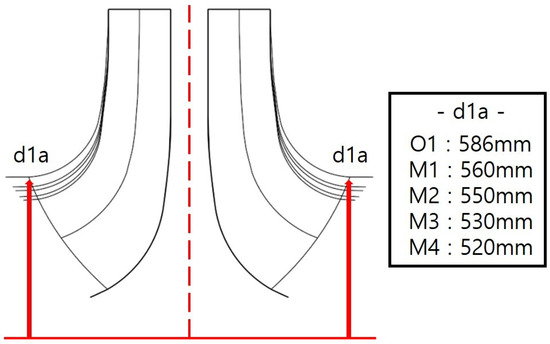
Figure 2.
Case of impeller eye diameter.
2.2. Governing Equations
In CFD, the methods for simulating turbulent flow are primarily classified into three types: direct numerical simulation (DNS), large eddy simulation (LES), and Reynolds-averaged Navier–Stokes (RANS). DNS provides detailed calculations of vortices of all sizes, whereas LES focuses on large vortices, offering an accurate analysis of turbulent flows. However, owing to their high computational costs and extensive time requirements, both DNS and LES are often impractical for routine studies [26,27,28]. Therefore, this study utilizes the three-dimensional incompressible RANS equations, known for their cost-effectiveness and numerical stability. The continuity and momentum equations, incorporating time-averaged variables, are represented as follows:
Here, the term in the momentum equation is treated as the Reynolds stress, which models the mean flow in regions affected by turbulence.
2.3. Cavitation Model
For cavitation analysis, the Rayleigh–Plesset model is employed, as shown in Equation (7):
Here, RB is the bubble radius (m), Pv is the pressure inside the bubble (Pa), and P is the external liquid pressure (Pa). The equation is simplified by ignoring the second-order term and surface tension results in Equation (8). Franc et al. [29] stated in their paper that this equation is applicable when the bubble radius is sufficiently large or when the bubble oscillates at low frequencies. They also indicated that this simplification can be an appropriate approximation in scenarios where the bubble radius is large or where pressure differences are the dominant factors. The rate of change of bubble volume and mass are described in Equations (9) and (10), respectively.
Incorporating the number of nuclei per unit volume (NB), the vapor volume fraction is expressed in Equation (11). The general formula for evaporation and condensation, considering bubble growth and collapse, is given in Equation (12), with evaporation initiated from nuclei as described in Equation (13).
Here, rg is the vapor volume fraction, rnc is the volume fraction of nucleation sites, and F is the empirical coefficient accounting for the phase change time disparity between condensation and evaporation. Fcond = 0.01 and Fvap = 50 are applied for condensation and evaporation, respectively. The default values for the volume fraction of nucleation sites and bubble nuclei radius used in this study are rnc = 5 × 10⁻⁴ and Rnc = 1 μm, respectively [30].
2.4. Mesh Generation
Table 3 details the grid configurations used in the domain for this analysis. For the blades, the flow field was initially generated using Blade Editor and subsequently constructed with hexahedral grids using TurboGrid. All blades were modeled considering symmetry and replication techniques. The meshes for the suction, volute, and wearing parts were developed using the ICEM-CFD grid generation program provided by ANSYS, incorporating both tetra-prism and hexahedral grids, as shown in Figure 3. Figure 4 presents the results of a mesh independence test conducted to verify the reliability of the simulations, indicating that variations in pump head were negligible beyond 800,000 grids per impeller. The head difference between the maximum grid count and 800,000 grids is approximately 0.61%. Therefore, the mesh was optimized to approximately 800,000 grids.

Table 3.
Mesh type and number of elements.
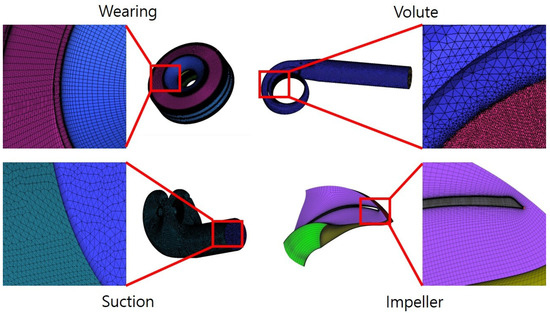
Figure 3.
Mesh of analysis domain.
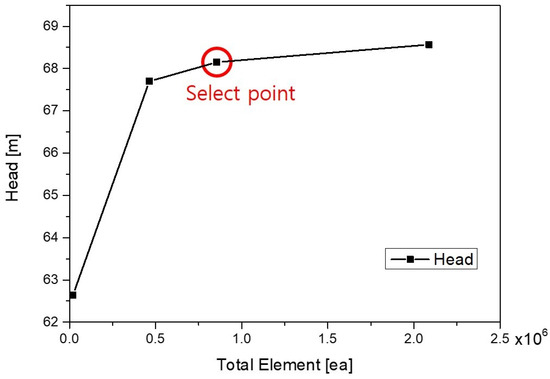
Figure 4.
Mesh dependency test.
Turbulence modeling plays a crucial role in numerical analysis, particularly owing to the effects of the wall’s physical properties and the fluid’s viscosity, which significantly influence the flow near the wall. To accurately simulate this interaction, the dimensionless length concept y+ is utilized, combining the fluid’s viscosity and the wall shear stress at a specified distance from the wall; y+ is calculated as shown in Equation (14):
where uτ represents the friction velocity (m/s), y is the absolute distance from the wall (m), and ν is the kinematic viscosity (m2/s). In CFD simulations, y+ is critical for adjusting grid density near the wall to ensure accurate flow predictions. The impeller, a crucial component in pump analysis, necessitates precise implementation of wall flow within the domain. Research has indicated that a y+ value below 5 is generally appropriate for rotating machinery [31,32,33]. This study adhered to this standard and maintained it consistently.
2.5. Analysis Method
The analysis in this study was conducted using the commercial CFD software ANSYS CFX-21.2. The entire flow field was modeled as an incompressible three-dimensional steady state.
The boundary conditions are summarized in Table 4. The nominal rotational speed of the pump was set at 710 rpm. To account for the backflow phenomenon in the pump, the inlet condition was configured as an opening with a total pressure condition, and the outlet was set to manage a specified mass flow rate. The components such as the suction, volute, wearing parts, and the impeller’s hub, shroud, and blades were defined as walls to inhibit fluid flow. For the analysis of the rotating impeller domain and the stationary domains of the suction, volute, and wearing parts, the multiple reference frame model was utilized. The wearing-impeller interface, where fluid enters the suction domain, was modeled with the frozen-rotor method, and the impeller-wearing interface, where fluid exits into the volute, was handled with the stage mix method. The mesh’s connectivity between the rotating and stationary domains was facilitated by the General Grid Interface (GGI). The shear stress transport (SST) turbulence model, well-suited for rotating fluid machinery, was employed [34,35,36]. To closely simulate the actual pump environment, a surface roughness [37,38,39] of 30 microns was applied. The working fluid was water at 25 °C, with properties such as a density of 997 kg/m3 and a saturation vapor pressure of 3170 Pa.

Table 4.
Boundary conditions.
2.6. Reliability Verification
The reliability of the CFD analysis results was substantiated using experimental data provided by the pump manufacturer. Figure 5 shows a schematic of the experimental setup employed to evaluate the performance of the O1 model, one of the five impeller models tested. Flow measurements were obtained at the pump outlet using an electronic flowmeter (KTM-800, Korea Flowmeter Co., Ltd., Incheon, Republic of Korea), and head measurements were conducted at points three diameters from the pump casing inlet and five diameters from the outlet. Pressure was measured using a pressure transmitter (266GST, ABB Asea Brown Boveri Ltd., Zurich, Switzerland), with a maximum error margin of 0.5% for flow and 0.04% for pressure.
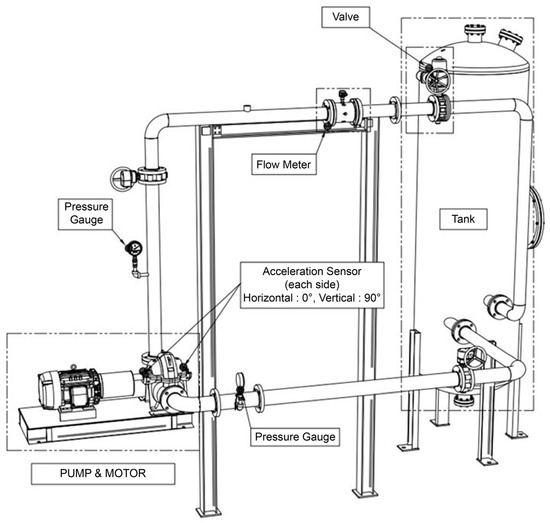
Figure 5.
Schematic of experimental setup.
Figure 6 presents a comparison between the experimental results and the numerical values obtained from CFD analysis. The analysis was performed for the O1 model across various flow rates, specifically at 5220, 6000, 6750, 7500, 8250, and 9000 m3/h. At the designated flow rate of 7500 m3/h, discrepancies between the experimental outcomes and numerical predictions were 6.22% for efficiency and 3.63% for head. At the best efficiency point (BEP), the deviations were noted as 5.27% for efficiency and 6.01% for head. The overall errors were approximately 6.88% for head and 5.65% for efficiency, indicating significant accuracy considering the potential leakage losses from bearings and piping, as well as losses attributable to surface roughness observed in actual experimental conditions.
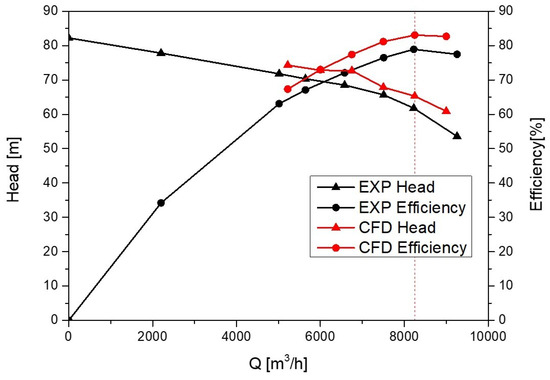
Figure 6.
Comparison of experiment and numerical test.
3. Results
3.1. Performance Analysis
Performance analysis was conducted by observing changes in the inlet diameter of each impeller. Initially, the BEP flow rate was set at 8250 m3/h for the original impeller model, O1, and then adjusted by ±10%. The resultant head and efficiency metrics at varying flow rates are shown in Figure 7. The flow rate criteria for this study adhere to the preferred operating region (POR), defined as 70% to 120% of the BEP according to API Standard 610 [40]. Numerical analysis was performed for each impeller model, and results were non-dimensionalized by dividing by the flow rate at the peak efficiency point. Figure 7a shows the variations in head across different flow rates. The difference in head between the impeller with the largest inlet diameter (O1) and the smallest inlet diameter (M4) is 0.3% at a flow rate of 0.7 and −0.81% at a flow rate of 1.2, indicating that minor adjustments in shroud diameter do not substantially impact head performance. Figure 7b shows the efficiency changes across impeller models. As the shroud diameter decreases, efficiency improves across all flow rates, with the gap narrowing at higher flows. This occurs because changes in inlet diameter increase torque and energy consumption due to flow characteristics like recirculation at the impeller inlet. These findings indicate that inlet diameter significantly affects efficiency.
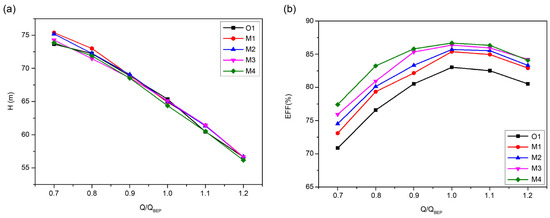
Figure 7.
Performance curves of each impeller model: (a) head curves, (b) efficiency curves.
Figure 8 shows the meridional plane geometry of the impeller, including the leading edge (LE), trailing edge (TE), shroud, hub, and the spanwise direction. This diagram visually represents the key geometrical features of the impeller, providing a comprehensive view of its design characteristics.
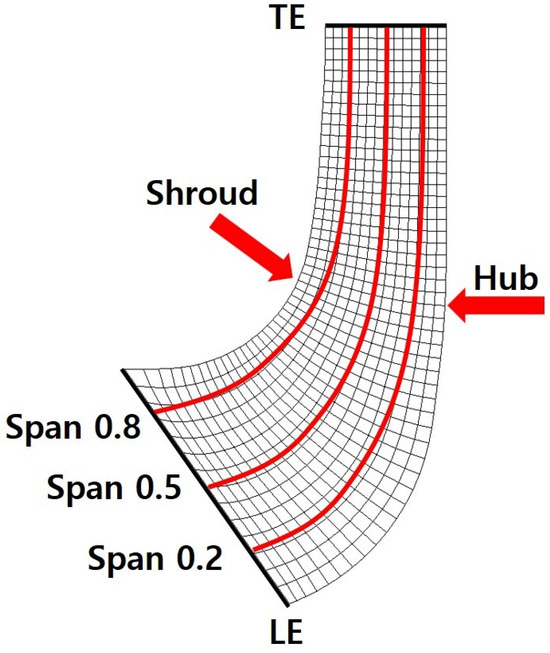
Figure 8.
Meridional plane geometry.
Figure 9 provides an in-depth examination of the pressure field at the impeller’s LE for each model at a flow rate of 1.0, depicted through pressure contours calculated using the pressure coefficient in Equation (15):
where P is the static pressure at the pump (Pa), Pinlet is the static pressure at the pump inlet (Pa), and u2 is the peripheral speed at the impeller exit (m/s). Negative pressure indicates a pressure distribution lower than the pump inlet pressure, which increases the likelihood of cavitation in those areas. The centrifugal force generated by impeller rotation creates a positive pressure gradient in the radial direction. However, the local pressure reduction near the shroud can be attributed to factors beyond centrifugal force, such as the complex flow patterns between the impeller and the shroud. These factors may collectively contribute to pressure reductions near the shroud, as well as near the hub.
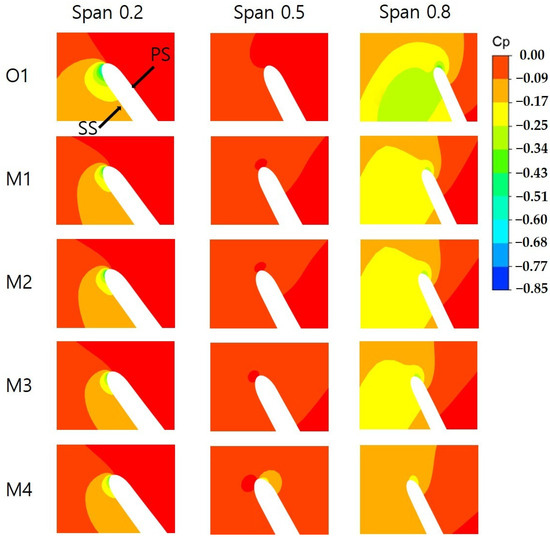
Figure 9.
Cp contour on blade by impeller model at Q 1.0.
Turbulence kinetic energy (TKE), which represents turbulence intensity, is calculated as the mean of the squared turbulent velocity components. Although directly correlating TKE with efficiency and pump performance is challenging, it offers indirect insights into fluid behavior. Figure 10 presents the TKE values at a flow rate of 1.0 for each impeller model at a spanwise position of 0.5. As the impeller inlet diameter decreases, the TKE correspondingly decreases, indicating that the increased flow velocity results in relatively reduced recirculating flow, which consequently induces turbulence. Analysis from Figure 8 indicates that across all impeller models, turbulence intensity and pressure drops are more pronounced on the suction side (SS) than on the pressure side (PS), providing valuable insights into potential bubble formation sites during cavitation analysis.

Figure 10.
Turbulence kinetic energy at Q 1.0.
3.2. Suction Performance Analysis
To assess the potential for cavitation in a double-suction pump, it is crucial to quantify the cavitation characteristics of the rotating machinery. In this study, the pump suction analysis was performed by progressively reducing the suction pressure while maintaining a constant speed in the simulation. The NPSH3% head, which is the head at which a 3% head drop due to cavitation occurs at flow rates of 0.7, 1.0, and 1.2, was measured and non-dimensionalized as the cavitation number (). The fluid dynamic cavitation number () is defined by Equation (16):
Here, P is the fluid pressure (Pa), and V is the fluid velocity (m/s), illustrating the relationship between the fluid pressure, saturation vapor pressure, and the kinetic energy per unit volume. A lower cavitation number indicates a greater likelihood of cavitation, while a higher number suggests reduced susceptibility to cavitation. In this study, Thoma’s cavitation number (σ) was utilized to predict and analyze cavitation during pump fluid suction, as shown in Equation (17):
The head was non-dimensionalized by dividing it by the head under conditions where cavitation does not occur for each impeller model. Figure 11a shows the head drop curve at a flow rate of 0.7. The values corresponding to σ3% in the low-flow region range from 0.03 to 0.045, with σ3% values of 0.033 for O1, 0.036 for M1, 0.039 for M2, 0.042 for M3, and 0.045 for M4. This indicates that the cavitation number increased by 9%, 18%, 27%, and 39%, respectively, compared to the O1 impeller, suggesting that suction performance decreases as the inlet diameter decreases in the low-flow region.
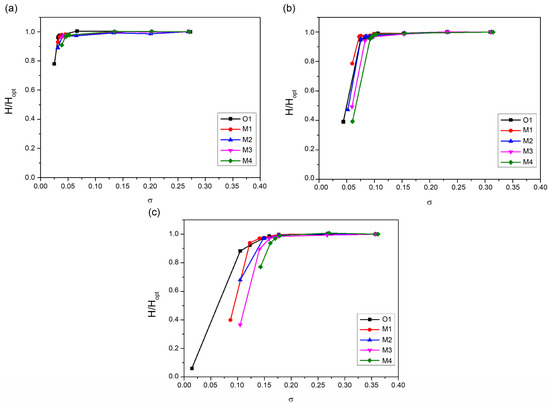
Figure 11.
Head drop curves for each impeller: (a) Q 0.7, (b) Q 1.0, (c) Q 1.2.
Figure 11b shows the head drop curve at a flow rate of 1.0. The σ3% values at this flow rate range from 0.073 to 0.095. As the flow rate increases, the velocity increases, and the pressure decreases. Consequently, cavitation occurs earlier than in the low-flow region. The σ3% values are 0.095 for O1, 0.073 for M1, 0.085 for M2, 0.099 for M3, and 0.095 for M4. As the inlet diameter decreases, the changes in cavitation number are −23.1%, −10.5%, 4.2%, and 0%, respectively. Under BEP flow conditions, the suction performance of the M1 and M2 impellers is significantly improved compared to the O1 impeller.
Figure 11c shows the head drop curve at a flow rate of 1.2, with σ3% values ranging from 0.141 to 0.170. The σ3% values are 0.148 for O1, 0.141 for M1, 0.148 for M2, 0.159 for M3, and 0.170 for M4. As the inlet diameter decreases, the changes in cavitation number are −4.7%, 0%, 7.4%, and 14.8%, respectively. According to referenced studies, there is generally a tendency for cavitation to occur earlier as the pump inlet diameter decreases and the flow rate increases. Even under these conditions, the M1 model still exhibits better suction performance than the O1 model. The analysis results at a flow rate of 1.2 indicate that the suction performance of the M1 impeller improves compared to the O1 impeller, while the suction performance of the M3 and M4 impellers decreases compared to the BEP flow. The σ3% values for each model at varying flow rates are summarized in Table 5.

Table 5.
Cavitation number (σ3%) for each flow rate (Q).
Figure 12 shows the cavitation numbers corresponding to NPSH3% at flow rates of 0.7, 1.0, and 1.2 for each impeller type. As the flow rate increases, the suction velocity of the pump increases at higher flow rates, causing cavitation to occur earlier than in the low-flow region.
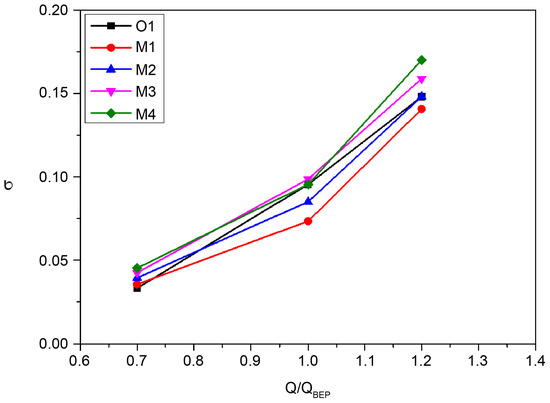
Figure 12.
NPSH3% head drop performance curves.
3.3. Bubble Volume Analysis
This section examines cavitation phenomena within each impeller model just before the onset of head collapse at various flow rates. Figure 13 presents iso-surface contours that illustrate these dynamics. Across all models, as the flow rate increases, the point of head collapse is reached as the number and size of bubbles decrease. Cavitation typically involves the formation and collapse of bubbles; while many studies have visually examined bubble development and used indirect metrics such as efficiency and head to quantify this, these methods provide useful trends but have limitations in quantitatively assessing cavitation itself.
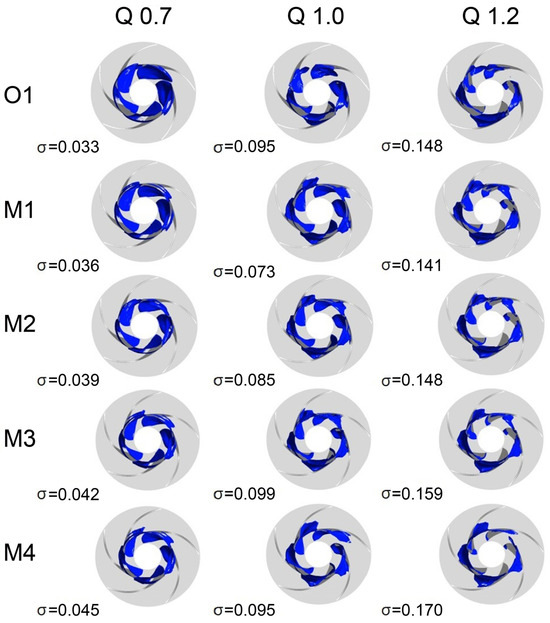
Figure 13.
Iso-surfaces of vapor volume fraction at σ3%.
To quantitatively analyze the bubble volume within the impeller at the same cavitation number, Figure 14 shows the bubble volume relative to the impeller volume. Here, Vvap represents the total vapor volume within the impeller, and Vimp is the impeller volume. The ratio Vvap/Vimp is non-dimensionalized. At a flow rate of 0.7 and a σ of 0.0333, Vvap/Vimp for O1 is 0.129; Vvap/Vimp for M1, M2, M3, and M4 are 0.132, 0.152, 0.140, and 0.174, respectively, indicating corresponding increases of 2.33%, 17.8%, 8.5%, and 34.9% compared to the O1 impeller. This trend suggests that the O1 model exhibits the smallest relative bubble volume at low flow rates, correlating to the later occurrence of the NPSH3% point among all impellers.
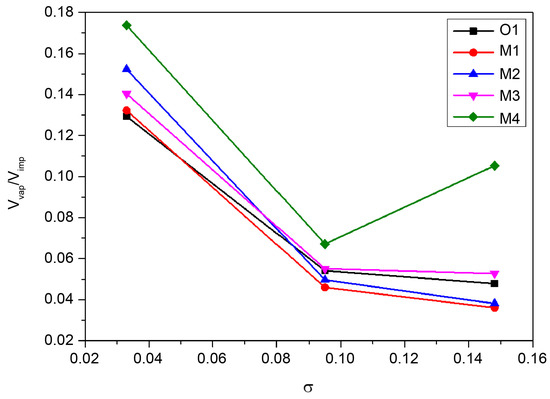
Figure 14.
Ratio of impeller volume to vapor volume fraction at σ3%.
At a flow rate of 1.0 and a σ of 0.095, the Vvap/Vimp values are 0.054 for O1, 0.046 for M1, 0.050 for M2, 0.055 for M3, and 0.067 for M4, showing decreases of −14.8% and −7.4% for M1 and M2, and increases of 1.9% and 24.1% for M3 and M4, respectively, compared to the O1 impeller.
At a flow rate of 1.2 and a σ of 0.148, the Vvap/Vimp values are 0.048 for O1, 0.036 for M1, 0.038 for M2, 0.053 for M3, and 0.105 for M4, indicating decreases of −25.0% and −20.8% for M1 and M2, and increases of 10.4% and 118.8% for M3 and M4, respectively, compared to the O1 impeller. Notably, the M1 impeller demonstrates a significant increase in suction performance, while the M2 impeller shows a comparable occurrence of NPSH3% but with fewer bubbles, suggesting better resistance to impeller damage and vibration. The M4 impeller exhibits the largest increase in Vvap/Vimp at a flow rate of 1.2. These results are summarized in Table 6.

Table 6.
Vvap/Vimp and compared ratio to O1 impeller.
To further explore the impact of cavitation on impeller blades, Figure 15 shows graphs of the vapor volume fraction in the streamwise direction at σ3% for each model under different flow rates. Here, 0 represents the LE, and 1 represents the trailing edge.
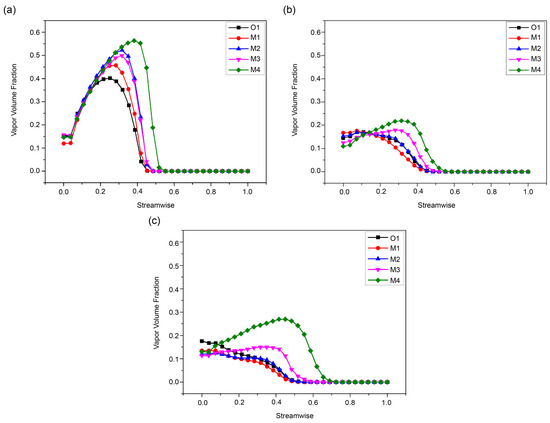
Figure 15.
Streamwise vapor volume fraction: (a) σ = 0.033, (b) σ = 0.095, (c) σ = 0.148.
Figure 15a shows the vapor volume fraction in the streamwise direction at a σ of 0.033. The initial bubble development at the LE shows values of 0.154 for O1, 0.119 for M1, 0.150 for M2, 0.157 for M3, and 0.146 for M4. This indicates slower initial development in the M1 impeller. Up to approximately 0.2 streamwise, the development is consistent across models; however, beyond this point, bubble development at the trailing edge increases with reduced inlet diameter at low flow rates.
Figure 15b shows the vapor volume fraction in the streamwise direction at a σ of 0.095. Bubble development at the LE is recorded as 0.145 for O1, 0.167 for M1, 0.153 for M2, 0.125 for M3, and 0.109 for M4, indicating slower initial development in the M3 impeller. The development and decay patterns of O1 and M2 are notably similar.
Figure 15c shows the vapor volume fraction in the streamwise direction at a σ of 0.148. Bubble development at the LE is 0.176 for O1, 0.135 for M1, 0.119 for M2, 0.113 for M3, and 0.131 for M4, indicating the slowest initial development in the M3 impeller and the highest initial development in the O1 impeller. Under high-flow conditions, the least bubble development is observed in the M1 impeller, with the most active development towards the TE observed in the M3 and M4 impellers.
However, it is important to note that in actual operation, cavitation phenomena within the impeller are influenced by various complex factors such as surface roughness, site conditions, operator skill, and fluid temperature, among others. These factors make it challenging to precisely predict cavitation through simulation alone. Therefore, discrepancies may exist between the simulation results and actual cavitation experiments.
4. Conclusions
Geometric factors at the impeller eye significantly influence the suction performance of pumps. While various factors such as hub and shroud diameters, blade angle and thickness, number of blades, surface roughness, and LE profile play a role, this study specifically investigates cavitation phenomena based on variations in shroud diameter, with all other variables held constant. Utilizing impeller designs derived from Gulich’s equations and the designer’s experience, five impeller models, including the original, were examined. The performance regarding efficiency, head, and cavitation resistance at different flow rates was analyzed through CFD using a multiphase model.
The accuracy of the numerical analyses was validated by comparing experimental values with numerical results. It was confirmed that operating the pump in a cavitation-free environment could enhance efficiency without significant alterations in head. However, achieving such ideal conditions poses substantial challenges in actual industrial applications. To create models and numerical analyses applicable to real-world scenarios, cavitation numerical analysis was conducted using widely referenced theories and commercial codes. The findings indicate that the M1 model exhibited the best overall suction performance. Given that the impeller eye diameter linearly affects recirculation flow in the performance analysis, the optimal d1a value for the pump used in this study is determined to be between 560–550 mm, balancing both cavitation resistance performance and recirculation flow.
The improved NPSH3% values were demonstrated in the head drop curves at flow points commonly referenced by pump users. By comparing the bubble volume to the impeller volume under cavitation conditions, the potential for bubble volume was quantified. Results indicate that the M1 model exhibited the least bubble growth and occurrence, with Vvap/Vimp values of 0.046 at BEP flow and 0.036 at high flow, suggesting that this model could extend impeller lifespan under consistent operating conditions.
In summary, this study confirms that the design of the impeller inlet diameter in double-suction single-stage pumps significantly affects recirculation flow, which can cause vibration and noise, as well as impact cavitation resistance. Based on the numerical analysis of five impeller models, it is recommended that a moderate reduction in inlet diameter can reduce recirculation flow. However, excessive reduction may decrease cavitation resistance, indicating the necessity for a balanced approach in impeller inlet diameter design to optimize efficiency and minimize cavitation in industrial settings. Building on the M1 model, future research will involve experimental validation incorporating variations in additional parameters such as surface roughness and throat area, to improve cavitation phenomena and optimize pump performance under various operating conditions.
Author Contributions
Conceptualization, K.O. and J.K.; Validation, K.O. and J.K.; Formal analysis, K.O.; Writing—original draft, K.O.; Visualization, K.O. and J.K. All authors have read and agreed to the published version of the manuscript.
Funding
This research received no external funding.
Data Availability Statement
The original contributions presented in the study are included in the article, further inquiries can be directed to the corresponding author.
Acknowledgments
The authors acknowledge the support from the Department of Marine Engineering at the Mokpo National Maritime University.
Conflicts of Interest
The authors declare no conflicts of interest.
Nomenclature
| Abbreviations | Description |
| CFD | Computational Fluid Dynamics |
| LE | Leading Edge |
| NPSH | Net Positive Suction Head |
| NPSHre | Net Positive Suction Head Required |
| DNS | Direct Numerical Simulation |
| LES | Large Eddy Simulation |
| RANS | Reynolds-averaged Navier–Stokes |
| GGI | General Grid Interface |
| SST | Shear Stress Transport |
| O1 | Original Impeller |
| M1 | Modified Impeller |
| BEP | Best efficiency point |
| TKE | Turbulence Kinetic Energy |
| SS | Suction Side |
| PS | Pressure Side |
References
- Minami, S.; Kawaguchi, K. Experimental study on cavitation in centrifugal pump impellers. Bull. JSME 1960, 3, 19–29. [Google Scholar] [CrossRef]
- Binama, M.; Muhirwa, A.; Bisengimana, E. Cavitation effects in centrifugal pumps: A review. Int. J. Eng. Res. Appl. 2016, 6, 52–63. [Google Scholar]
- Li, Y.; Feng, G.; Li, X.; Si, Q.; Zhu, Z. An experimental study on the cavitation vibration characteristics of a centrifugal pump at normal flow rate. J. Mech. Sci. Technol. 2018, 32, 4711–4720. [Google Scholar] [CrossRef]
- Chudina, M. Noise as an indicator of cavitation in a centrifugal pump. Acoust. Phys. 2003, 49, 463–474. [Google Scholar] [CrossRef]
- Lu, Y.; Tan, L.; Zhao, X.; Ma, C. Experiment on cavitation-vibration correlation of a centrifugal pump under steady state and start-up conditions in energy storage station. J. Energy Storage 2024, 83, 110763. [Google Scholar] [CrossRef]
- George, A.; Muthu, P. CFD Analysis of performance characteristics of centrifugal pump impeller to minimising cavitation. In Proceedings of the International Conference on Current Research in Engineering Science and Technology, Tamilnadu, India, 25–27 October 2016. [Google Scholar]
- Li, G.; Ding, X.; Wu, Y.; Wang, S.; Li, D.; Yu, W.; Wang, X.; Zhu, Y.; Guo, Y. Liquid–vapor two-phase flow in centrifugal pump: Cavitation, mass transfer, and impeller structure optimization. Vacuum 2022, 201, 111102. [Google Scholar] [CrossRef]
- Chao, W.X.; Wang, W.C.; Zhang, W.; Bai, G.Y.; Dong, W. The cavitation characteristics of aerospace high-speed centrifugal pumps with different tip clearance. Sci. Rep. 2024, 14, 7532. [Google Scholar] [CrossRef]
- Norman, M. CFD Simulations of Cavitation in a Condensate Pump. Master’s Thesis, Department of Physics, Umeå University, Umeå, Sweden, 2023. [Google Scholar]
- Zhu, D.; Tao, R.; Xiao, R. Anti-cavitation design of the symmetric leading-edge shape of mixed-flow pump impeller blades. Symmetry 2019, 11, 46. [Google Scholar] [CrossRef]
- Sano, T.; Iino, M.; Maeda, S. Effect of leading edge profile on cavitation performance of mixed flow impeller. J. Phys. Conf. Ser. 2021, 1909, 012018. [Google Scholar] [CrossRef]
- Tao, R.; Xiao, R.; Wang, Z. Influence of blade leading-edge shape on cavitation in a centrifugal pump impeller. Energies 2018, 11, 2588. [Google Scholar] [CrossRef]
- Liu, X.; Zhang, H.; Li, P. Influence of inlet vane and wrap angles on cavitation behavior of a centrifugal pump. J. Appl. Fluid Mech. 2022, 144, 061201. [Google Scholar]
- Huan, Y.; Liu, Y.; Li, X.; Zhu, Z.; Qu, J.; Zhe, L.; Han, A. Experimental and numerical investigations of cavitation evolution in a high-speed centrifugal pump with inducer. J. Hydrodyn. 2021, 33, 140–149. [Google Scholar] [CrossRef]
- Guo, X.; Zhu, Z.; Cui, B.; Shi, G. Effects of the number of inducer blades on the anti-cavitation characteristics and external performance of a centrifugal pump. J. Mech. Sci. Technol. 2016, 30, 3173–3181. [Google Scholar] [CrossRef]
- Campos-Amezcua, R.; Khelladi, S.; Mazur-Czerwiec, Z.; Bakir, F.; Rey, R. Numerical and experimental study of cavitating flow through an axial inducer considering tip clearance. Proc. Inst. Mech. Eng. Part A J. Power Energy 2013, 227, 926–936. [Google Scholar] [CrossRef]
- Campos-Amezcua, R.; Khelladi, S.; Bakir, F.; Mazur-Czerwiec, Z.; Sarraf, C.; Rey, R. Numerical analysis of unsteady cavitating flow in an axial inducer. Proc. Inst. Mech. Eng. Part A J. Power Energy 2010, 224, 223–238. [Google Scholar] [CrossRef]
- Shi, W.; Zhou, L.; Lu, W.; Pei, B.; Lang, T. Numerical prediction and performance experiment in a deep-well centrifugal pump with different impeller outlet width. Chin. J. Mech. Eng 2013, 26, 46–52. [Google Scholar] [CrossRef]
- Tan, M.; Liu, H.; Yuan, S.; Wang, Y.; Wang, K. Effects of blade outlet width on flow field and characteristic of centrifugal pumps. In Proceedings of the ASME 2009 Fluids Engineering Division Summer Meeting, Vail, CO, USA, 2–6 August 2009. [Google Scholar]
- Fraser, W.H. Recirculation Centrifugal Pumps. In 10th Turbomachinery Symposium; Turbomachinery Laboratories, Texas A&M University: College Station, TX, USA, 1981. [Google Scholar]
- Shim, H.S.; Kim, K.Y.; Choi, Y.S. Three-objective optimization of a centrifugal pump to reduce flow recirculation and cavitation. J. Fluids Eng. 2018, 140, 091202. [Google Scholar] [CrossRef]
- Shim, H.S.; Kim, K.Y. Effects of the cross-sectional area of a volute on suction recirculation and cavitation in a centrifugal pump. J. Fluids Eng. 2020, 142, 051204. [Google Scholar] [CrossRef]
- Kim, Y.I.; Yang, H.M.; Lee, K.Y.; Choi, Y.S. Numerical investigation on hydraulic performance at low flow rates of a mixed-flow pump with impeller inlet diameter effects. IOP Conf. Ser. Earth Environ. Sci. 2022, 1037, 012037. [Google Scholar] [CrossRef]
- Schiavello, B. Cavitation and Recirculation Troubleshooting Methodology; Turbomachinery Laboratories, Department of Mechanical Engineering, Texas A&M University: College Station, TX, USA, 1993. [Google Scholar]
- Gülich, J.F. Centrifugal Pumps, 3rd ed.; Springer: Berlin, Germany, 2014; pp. 375–396. ISBN 978-3-642-40114-5. [Google Scholar]
- Posa, A.; Lippolis, A.; Verzicco, R.; Balaras, E. Large-eddy simulations in mixed-flow pumps using an immersed-boundary method. Comput. Fluids 2011, 47, 33–43. [Google Scholar]
- Kato, C.; Mukai, H.; Manabe, A. Large-eddy simulation of unsteady flow in a mixed-flow pump. Int. J. Rotating Mach. 2003, 9, 345–351. [Google Scholar]
- Raoelison, R.N.; Koithara, L.L.; Costil, S.; Langlade, C. Turbulences of the supersonic gas flow during cold spraying and their negative effects: A DNS CFD analysis coupled with experimental observation and laser impulse high-speed shadowgraphs of the particles in-flight flow. Int. J. Heat Mass Transf. 2020, 147, 118894. [Google Scholar] [CrossRef]
- Franc, J.P. The Rayleigh-Plesset equation: A simple and powerful tool to understand various aspects of cavitation. Fluid Dyn. Cavitation Cavitating Turbopumps 2007, 496, 1–41. [Google Scholar]
- ANSYS CFX-Solver Theory Guide; Release 2021R2; ANSYS Inc.: Canonsburg, PA, USA, 2021; pp. 240–241.
- Menter, F.R.; Langtry, R.; Völker, S. Transition modelling for general purpose CFD codes. Flow Turbul. Combust. 2006, 77, 277–303. [Google Scholar] [CrossRef]
- Davidson, A.A.; Salim, S.M. Wall y+ strategy for modelling rotating annular flow using CFD. In Proceedings of the International Multiconference of Engineers and Computer Scientists, Hong Kong, China, 14–16 March 2018; IMECS 2018 (Lecture Notes in Engineering and Computer Science; Volume 2). Newswood Limited: Hong Kong, China, 2018. [Google Scholar]
- Ariff, M.; Salim, S.M.; Cheah, S.C. Wall y+ approach for dealing with turbulent flow over a surface mounted cube: Part 2—High Reynolds number. In Proceedings of the Seventh International Conference on CFD in the Minerals and Process Industries, CSIRO, Melbourne, Australia, 9–11 December 2009. [Google Scholar]
- Adanta, D.; Fattah, I.M.R.; Muhammad, N.M. Comparison of standard k-epsilon and SST k-omega turbulence models for breastshot waterwheel simulation. J. Mech. Sci. Eng. 2020, 7, 39–44. [Google Scholar] [CrossRef]
- Murugesan, C.; Rudramoorthy, R. Numerical and experimental study of single stage and multistage centrifugal mixed flow submersible borewell pumps. Int. J. Fluid Mach. Syst. 2016, 9, 107–118. [Google Scholar] [CrossRef][Green Version]
- Gattoronchieri, A.; Cravero, C.; De Franco, L. The application of CFD to vortical flow structures detection in sea water pumping stations. In Proceedings of the VI International Conference on Computational Methods in Marine Engineering, Rome, Italy, 15–17 June 2015. [Google Scholar]
- Lipej, A.; Muhič, S.; Mitruševski, D. Wall roughness influence on the efficiency characteristics of centrifugal pump. J. Mech. Eng. 2017, 63, 529–536. [Google Scholar] [CrossRef]
- Echouchene, F.; Belmabrouk, H.; Le Penven, L.; Buffat, M. Numerical simulation of wall roughness effects in cavitating flow. Int. J. Heat Fluid Flow 2011, 32, 1068–1075. [Google Scholar] [CrossRef]
- Xu, W.; He, X.; Hou, X.; Huang, Z.; Wang, W. Influence of wall roughness on cavitation performance of centrifugal pump. J. Braz. Soc. Mech. Sci. Eng 2021, 43, 314. [Google Scholar] [CrossRef]
- API610; Centrifugal Pumps for Petroleum, Petrochemical and Natural Gas Industries. 10th ed. American Petroleum Institute: Washington, DC, USA, 2010.
Disclaimer/Publisher’s Note: The statements, opinions and data contained in all publications are solely those of the individual author(s) and contributor(s) and not of MDPI and/or the editor(s). MDPI and/or the editor(s) disclaim responsibility for any injury to people or property resulting from any ideas, methods, instructions or products referred to in the content. |
© 2024 by the authors. Licensee MDPI, Basel, Switzerland. This article is an open access article distributed under the terms and conditions of the Creative Commons Attribution (CC BY) license (https://creativecommons.org/licenses/by/4.0/).