1. Introduction
In the current context of water scarcity, the overpopulation of the planet, and the climate crisis, it has become vitally important to promote renewable energies for sustainable development and thus accelerate the decarbonization of the energy system. Approximately 7.4% of the world’s total electricity production was covered by renewable energy in 2016 (excluding hydropower), rising to 12.8% in 2021. Over the same period, wind power grew almost twice as much, from 487 GW to 845 GW [
1], but it is still insufficient.
The positive impact of renewable energies applies both environmentally and economically. Renewable projects continue to have strong incentives, thanks to their low marginal generation costs. Between 2010 and 2021, onshore wind energy reduced its global weighted average energy cost of new commercial-scale projects by 68% [
2], and, overall, it presented the lowest marginal cost of all renewable energies in 2021. Wind farms stand out for their flexibility, their considerable amount of equipment, and their ability to overcome unreliable operating conditions [
3]. Due to the uncertainty of the working conditions and the high cost of operation and maintenance, it is essential to monitor the different states during operation [
4]. Most wind turbines in service are equipped with supervisory control and data acquisition systems (SCADAs) and condition monitoring systems (CMSs). These systems mainly provide real-time monitoring, event alarming, and fault report outputs. However, they lack historical data extraction and analysis. Traditional fault maintenance and routine maintenance are regular maintenance modes that have serious shortcomings in coping with changing conditions and do not take full advantage of the diagnostic data [
5].
As the installation of new wind farms has grown, the number of studies on wind turbine maintenance and analysis has significantly increased. To get a sense of this growth, Shafiee and Sørensen [
6] presented only 12 studies between the years 1997 and 2006. However, this field of investigation notoriously increased from 2007 to 2016, with the number of investigations reaching 234. Unfortunately, the studies have been hampered by the limited availability of real data; in fact, it has not been possible to analyze in practice any case with SCADA alarms in Latin America for modern Wind Turbine Generators (WTGs). This is a region that offers an ideal environment for harnessing wind energy, with its low population density, large distances, and energy needs in remote locations [
7]. Additionally, in this region, it is possible to think about wind energy’s combination with the production of synthetic fuels or derivatives.
In the field of wind turbine design, the offer is becoming more ambitious due to the enormous competition in the industry. This has led to offering bigger turning diameters, reducing supply chain costs, and even offering very short delivery times. The downside of this situation is that there is little time for the necessary development, manufacturing, and quality controls, accelerating component failures and thus making operation and maintenance (O&M) more difficult. Therefore, the behavior of the failures (or alarms) of WTGs can be caused not only by the lack of maintenance but also by a design with flaws or quality problems prior to assembly. If design flaws are recognized, these flaws should not ideally continue to propagate in the new WTGs to be manufactured.
The purpose of this paper is precisely to propose a methodology that allows us to analyze, in a systemic way, the alarms delivered by the SCADA to help identify the most relevant critical subsystems and failure modes, which will serve as an input for the definition of the root cause. It is exemplified with a concrete case from the Southern Cone.
In the current situation, it can be noted that there are specific studies that help one part of the analysis and others where predictive models are presented to cover it differently.
On the one hand, some approaches propose the filtering of alarms and the categorization and elimination of false alarms to be able to analyze their reliability more accurately. On the other hand, some approaches use artificial intelligence, probabilities, or neural networks to apply predictive or classification models in the direct analysis of the reliability of or in the reduction in false alarms. The following is a review of the literature, as well as the differences or complements that can be found with this study.
In the research conducted by Zhang and Ma [
8], the K-means algorithm was combined with parallel factor analysis to achieve the visualization and identification of wind turbine operating conditions. However, the validity of this approach has not yet been determined and more details on the associated failures are needed. In the studies of [
9,
10,
11], several machine learning algorithms were used for SCADA false alarm detection, which helped to optimize the SCADA times and to avoid unnecessary operations or false conclusions. These could become a part of the overall methodology process presented in this article when the methods become more accurate. In this study, they are not something that has been applied, since the database has been previously reviewed.
With the same objective of reducing false alarms, Teixeira et al. [
12] sought a more robust combination of neural networks, previously performing a modal analysis of failures and effects. This allowed the agents to collaborate through shared signals, generating several models of artificial neural networks that facilitated the effective detection of false alarms. From a different perspective and applying a more in-depth analysis, Segovia et al. [
13] proposed an approach based on principal component analysis and artificial neural networks for signal processing, fault detection, and diagnosis. This all took place with a previous filtering process that also sought the detection of alarms not relevant to the analysis, thus making the neural network more accurate. Meng et al. [
14] performed a signal processing method, combining empirical mode decomposition (EMD) with intrinsic mode functions (IMFs). Then, they provided a fault analysis method based on the K-nearest neighbor EMD (EMD-KNN). All this was smartly applied only to wind power bearings, but it would be interesting to scale it to more parts. Zare and Ayati [
15] extended the use of neural networks in another way, using them for the simultaneous diagnosis of wind turbine faults, with signal images as the input to properly identify WTG faults based on SCADA data. The use of neural networks and artificial intelligence tools are usually computationally expensive, due to having to train the model and requiring a lot of training data. However, there is no doubt that the optimal algorithms will continue to be developed, so that the use can be scaled to the industrial level, and the time or CPU of the computer is not a major constraint.
Furthermore, other approaches to wind turbine fault diagnosis have been developed. Qiu et al. [
16] used the Dempster–Shafer (D-S) theory of evidence, quantifying the failure probabilities of SCADA alarms. It turned out to be a method that is very sensitive to the quality of the maintenance records, including how the data are handled, but it could be effective if one proceeds correctly. Moreover, Rodriguez et al. [
17] presented a series of indicators for the detection of component or wind turbine failures, and the remaining life of the components was estimated from the signals recorded by the SCADA. These two approaches could also be used with the proposed methodology to complement the analysis.
Finally, it is worth noting that alarm categorization has been commonly used in several studies to group wind turbine failure modes. Gonzalez et al. [
18] applied an analysis with a temporal sequence and probability approach, seeking to predict failures and excluding alarms that corresponded to operational states. Unfortunately, this approach impacted directly on the SCADA alarm system, which ended up resulting in a major limitation. On the other hand, Sarma et al. [
19] performed an analysis applied to a wind farm in Turkey in its first years of operation, classifying the alarms in the subsystems and components applicable to type III onshore wind turbines to determine which are the most critical according to their downtime and failure rates. This is a great approach, where the focus is simplified in assigning failures to each subsystem and normalizing the times and rates. From this, a dependency in the assignment is seen, as well as any shortcomings with respect to the alarms that are related to the states of the wind turbine. These can be analyzed from the transition states, providing greater vision and robustness in the identification of critical subsystems.
Considering the above-mentioned limitations, the purpose of this paper is precisely to propose a methodology that allows us to analyze, in a systemic way, the alarms delivered by the SCADA to help identify the most relevant critical subsystems and failure modes, which will serve as an input for the definition of the root cause. It is exemplified with a concrete case from the Southern Cone.
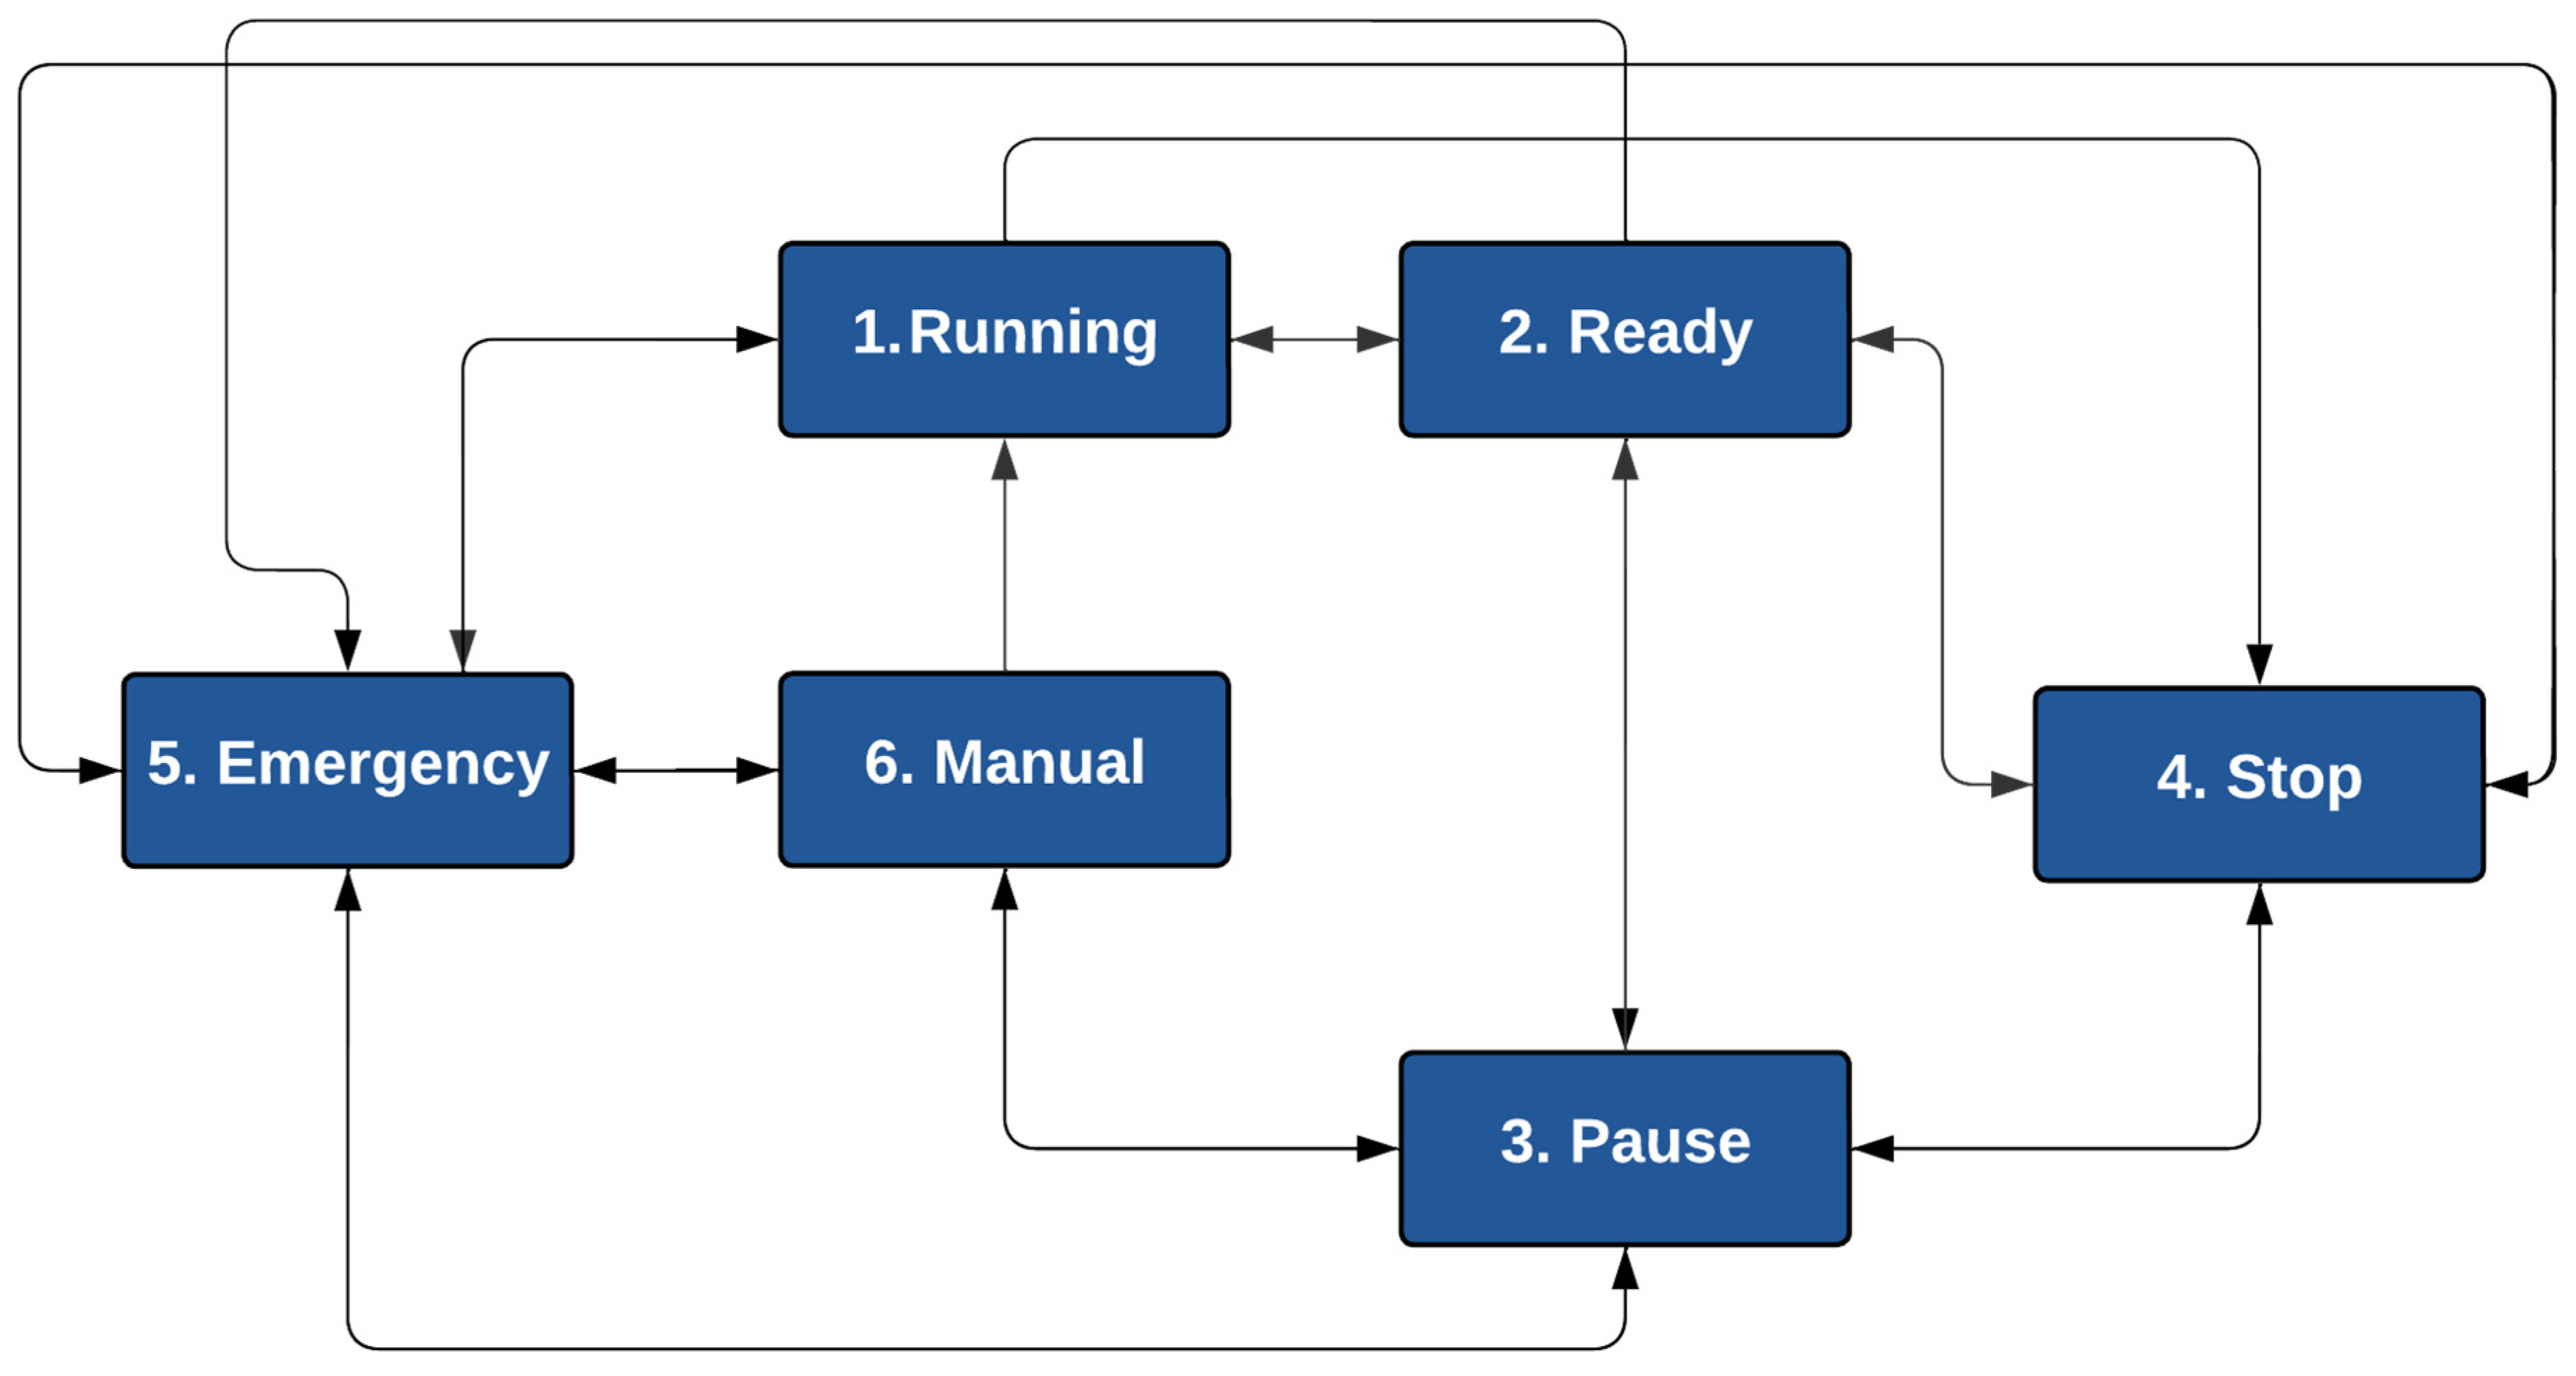
The proposed methodology is robust and has the strength that it can be adapted to any modern wind farm and according to each specific need. In addition, it presents a complete vision where all the aspects to be carried out are explained step-by-step, having a vital importance at the modeling and decision maker level. As an additional differentiating aspect with respect to the previous research, this proposed analysis also incorporates the operating states of the wind turbine according to its transitions (not only the alarms and warnings of the SCADA database). These provide the real downtime that occurred in the wind farm, giving the ability to analyze both the inactive and active states. It should also be noted that it incorporates an innovative graphic tool, which, together with the indicators, provides great value in the search for the critical subsystems that condition the downtime of the period under study. Therefore, this manuscript provides a clear guide with simplifying tools to be able to analyze the failures by subsystem of any type of wind turbine. Finally, to better illustrate the methodological framework, the wind farm analyzed is in Latin America, an area lacking in applied studies of this type, and it is relevant that it can be discussed and analyzed. In summary, the main contributions and highlights of this document are presented as follows:
A generalized methodological process diagram for inactivity analysis;
A methodology with transition state downtime and SCADA alarm activation times;
A graphical tool for analyzing the activation times and quantity of alarms;
The use of transition states to study the inactive behavior of the wind turbine;
The application of the methodology on Southern Cone data for modern wind turbines (Type IIA).
The remaining parts of this paper are organized as follows. In
Section 2, the theoretical aspects are presented; in
Section 3, the proposed methodology with the chosen indicators; in
Section 4, the applied case study, its results, analysis, and discussions; and in
Section 5, the conclusions.
2. Overview of WTGs
2.1. Wind Turbine Generator Components
The wind turbine can be subdivided into three main parts: the rotor, nacelle, and tower.
Figure 1 shows each of the most relevant components:
The rotor contains blades, a hydraulic pitch change system, a hub, spinners, bearings, and a beam transmitter. The pitch system is used to rotate the blades and provide safety in case of an emergency. The covers that protect the hub and bearings are called spinners. In the case of the nacelle, it has a main shaft, a gearbox, a yaw system, a mechanical brake, a hydraulic group, a generator, a transformer, and electrical cabinets. The yaw system allows the nacelle to rotate around the tower axis, according to the information received from the anemometers and wind vanes located at the top of the nacelle. The braking system has a mechanical (safety) brake and a main (aerodynamic) brake, while the hydraulic system operates on the cylinders of the hub pitch change system, the rotor brake, and the braking of the yaw system. Finally, in the case of the tower, it is divided into various sections for logistical reasons and has platforms, stairs or elevators, and emergency lighting.
2.2. Control Systems
The wind turbine functions are controlled by a microprocessor-based real-time regulation and monitoring system. The regulation system is responsible for selecting the appropriate values for the rotational speed, blade pitch angle, and power set point. This ensures safe and reliable operation in all wind conditions, as well as a stable power supply to the grid at all times. The monitoring system continuously checks the status of the various sensors, as well as the internal parameters.
2.3. Wind Turbine Generator Functionality
The wind rotates the blades by directly affecting them through the aerodynamic lift force, thus converting the kinetic energy into mechanical rotational energy, which directly influences the rotor, transmitting the energy to the gearbox through the main shaft. The rotational speed is then amplified up to the generator to convert the mechanical rotational energy into electrical energy, which is finally transferred to the transformer to adapt it to the grid conditions.
The operation of a wind turbine is determined by the wind speed, which is related to different phases: the start-up, coupling, rated, and disconnection speeds. The start-up speed is defined as when it begins to rotate and the alternator generates a voltage; the coupling speed is when the voltage rises, so that it begins to produce energy; the rated speed is the speed at which the wind turbine’s rated power is generated; and, finally, the disconnection speed is the value at which the rotor must stop for safety reasons, both for the environment and for reasons of the design of the machine itself.
It should be added that there are different classes of WTGs, which are determined by the wind speed for which they were designed and by the expected turbulence intensity. The different classes are shown in
Table 1, according to the average reference wind speed for 10 min (min) and the expected turbulence intensity at 15 m per second (m/s):
The wind turbine design should also provide for operation at ambient temperatures mostly ranging from −10 [°C] to +40 [°C] under normal conditions and from −20 [°C] to +50 [°C] under extreme conditions (IEC EN 61400-1) [
21].
2.4. Wind Turbine Generator Configurations
The wind turbine can be designed with different combinations of rotational speed, power control, drive train, and generator configuration. Pinar et al. [
20] presented the main wind turbine configurations. In this research, it was explained that the rotational speed can be constant or variable, the former only being able to operate in a narrow range and the variable able to be adapted at the expense of power electronic converters. On the other hand, the power control can be a passive stall, active stall, or pitch system. The blade angles in a passive stall system are fixed to the hub and are designed to stall in high winds. In contrast, in an active stall system, the blade angle is adjusted to create stall along the blade but not to increase the wind energy captured. In a pitching system, the blades can rotate about their longitudinal axis to optimize the captured wind energy or, in unfavorable weather conditions, to act as a brake on the rotor. Regarding the configuration of the transmission system, it can be either indirect or direct drive. The former uses a gearbox to increase the shaft rotation speed and can have different stages. The indirect system does not use a gearbox but needs different generators and an electrical power converter to adapt the power to the frequency of the grid. Finally, regarding generators, the main ones are squirrel cage induction (SCIGs), wound rotor (WRIGs), doubly fed (DFIGs), permanent magnet (PMSGs), and electrically excited (EESGs). With the increase in capacity, the doubly fed wind induction generator (DFIG) has gradually become the mainstream of the wind turbine generation due to its good performance and stable operation [
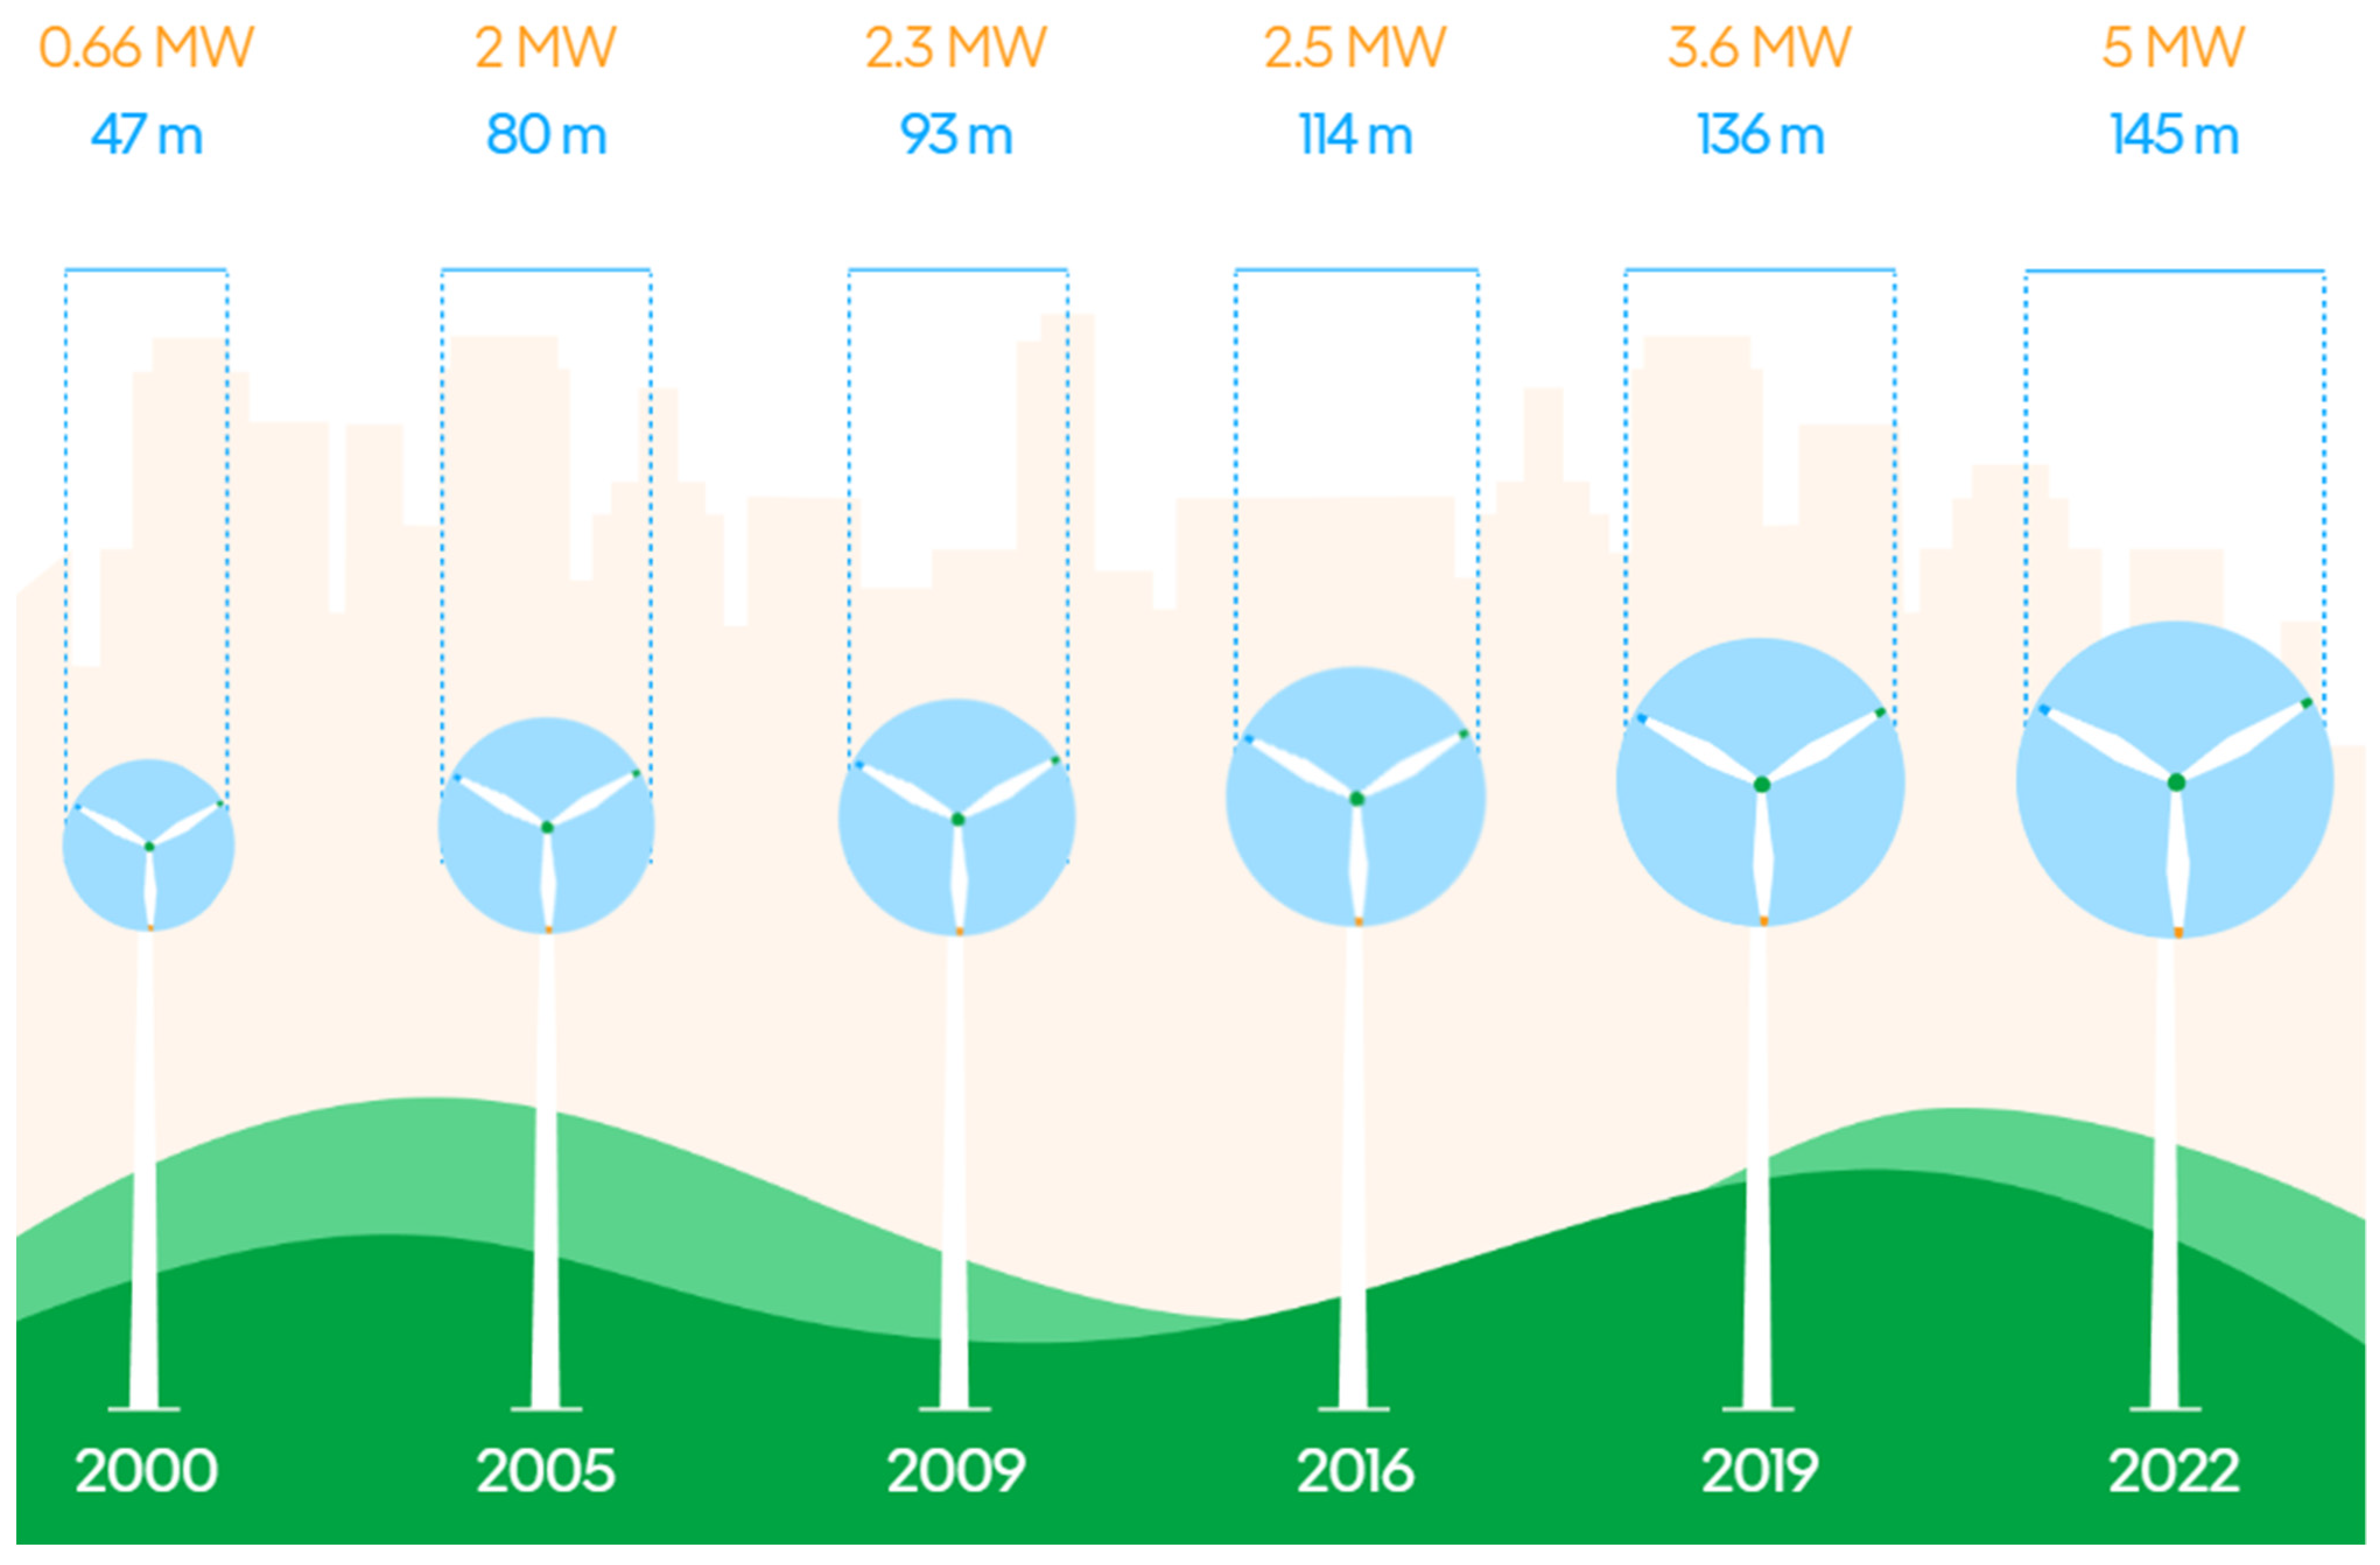
22]. Additionally, another relevant technical parameter is the nominal power, which is directly related to the wind turbine class, hub height, and rotor diameter. In this sense, onshore wind turbines have had a great growth. In the period between 2000 and 2022, they went from 0.66 MW with a rotor diameter of 47 m to 5 MW with a rotor diameter reaching 145 m [
23].
Figure 2 summaries the mentioned evolution. Currently, despite the limitations in land transportation, there are projects with wind turbines with rotor diameters of 170 m and a nominal power greater than 5 MW.
2.5. Wind Turbine Generator Reliability and Availability
The enormous number of subsystems in the wind turbine, which, in turn, carry many components, leads to multiple types of failures. A failure is defined as the inability of a subassembly or component to perform its required function. Once a failure occurs in a wind turbine, the SCADA system produces an alarm, which results in a shutdown, i.e., downtime. Therefore, experiencing high failure rates makes maintenance issues important for the successful operation and power generation capacity [
17]. The control system should ideally act before the safety system does, so that the safety system is activated as little as possible. However, the fact that the SCADA system produces an alarm does not necessarily mean that the wind turbine will stop, but it will always provide the status of the wind turbine.
The expected lifetime of WTGs is estimated to be 20 years and depends on both the quality of the wind turbine and the local climatic conditions, e.g., site turbulence [
24]. Another relevant aspect is related to environmental conditions, since they make the natural aging of the blades (and other components) of wind turbines inevitable, leading to degradations and premature failures [
25]. It is commonly assumed that WTG failures follow a bathtub curve, and the lifetime period depends on the type of subassembly used. For example, the lifetime of mechanical subassemblies is short compared to electronic subassemblies. The distribution commonly used in the statistical analysis of reliability data is the Weibull distribution. In addition to that which has been mentioned, it should be stated that the system availability is known as the percentage of time in which the system performs its required functions, providing all the necessary external resources [
26]. The mix of reliability and availability analysis plays a fundamental role in technical and economic feasibility studies by providing the operating time service of the system, which impacts the operational costs and the optimal maintenance schedule [
27].
Wind turbine reliability and availability can be improved by reducing the downtime rates, optimizing the design of the WTGs, and improving the maintenance program [
28]. All these actions depend on a more complete understanding of the wind turbine, its operations, and, in particular, its failure modes and mechanisms. Preventive and predictive maintenance approaches are currently used in O&M practices for modern WTGs to minimize long downtimes, unnecessary maintenance actions, and high repair costs [
19].
The wind energy industry has developed significant improvements in the field of WTG maintenance and repair strategies, employing condition monitoring (CM) integrated with supervisory control and data acquisition (SCADA) systems. Fault detection and diagnosis (FDD), CM, and fault detection algorithms provide early warning of structural, mechanical, and electrical defects [
20].
2.6. Modeling Level of the System to Be Analyzed
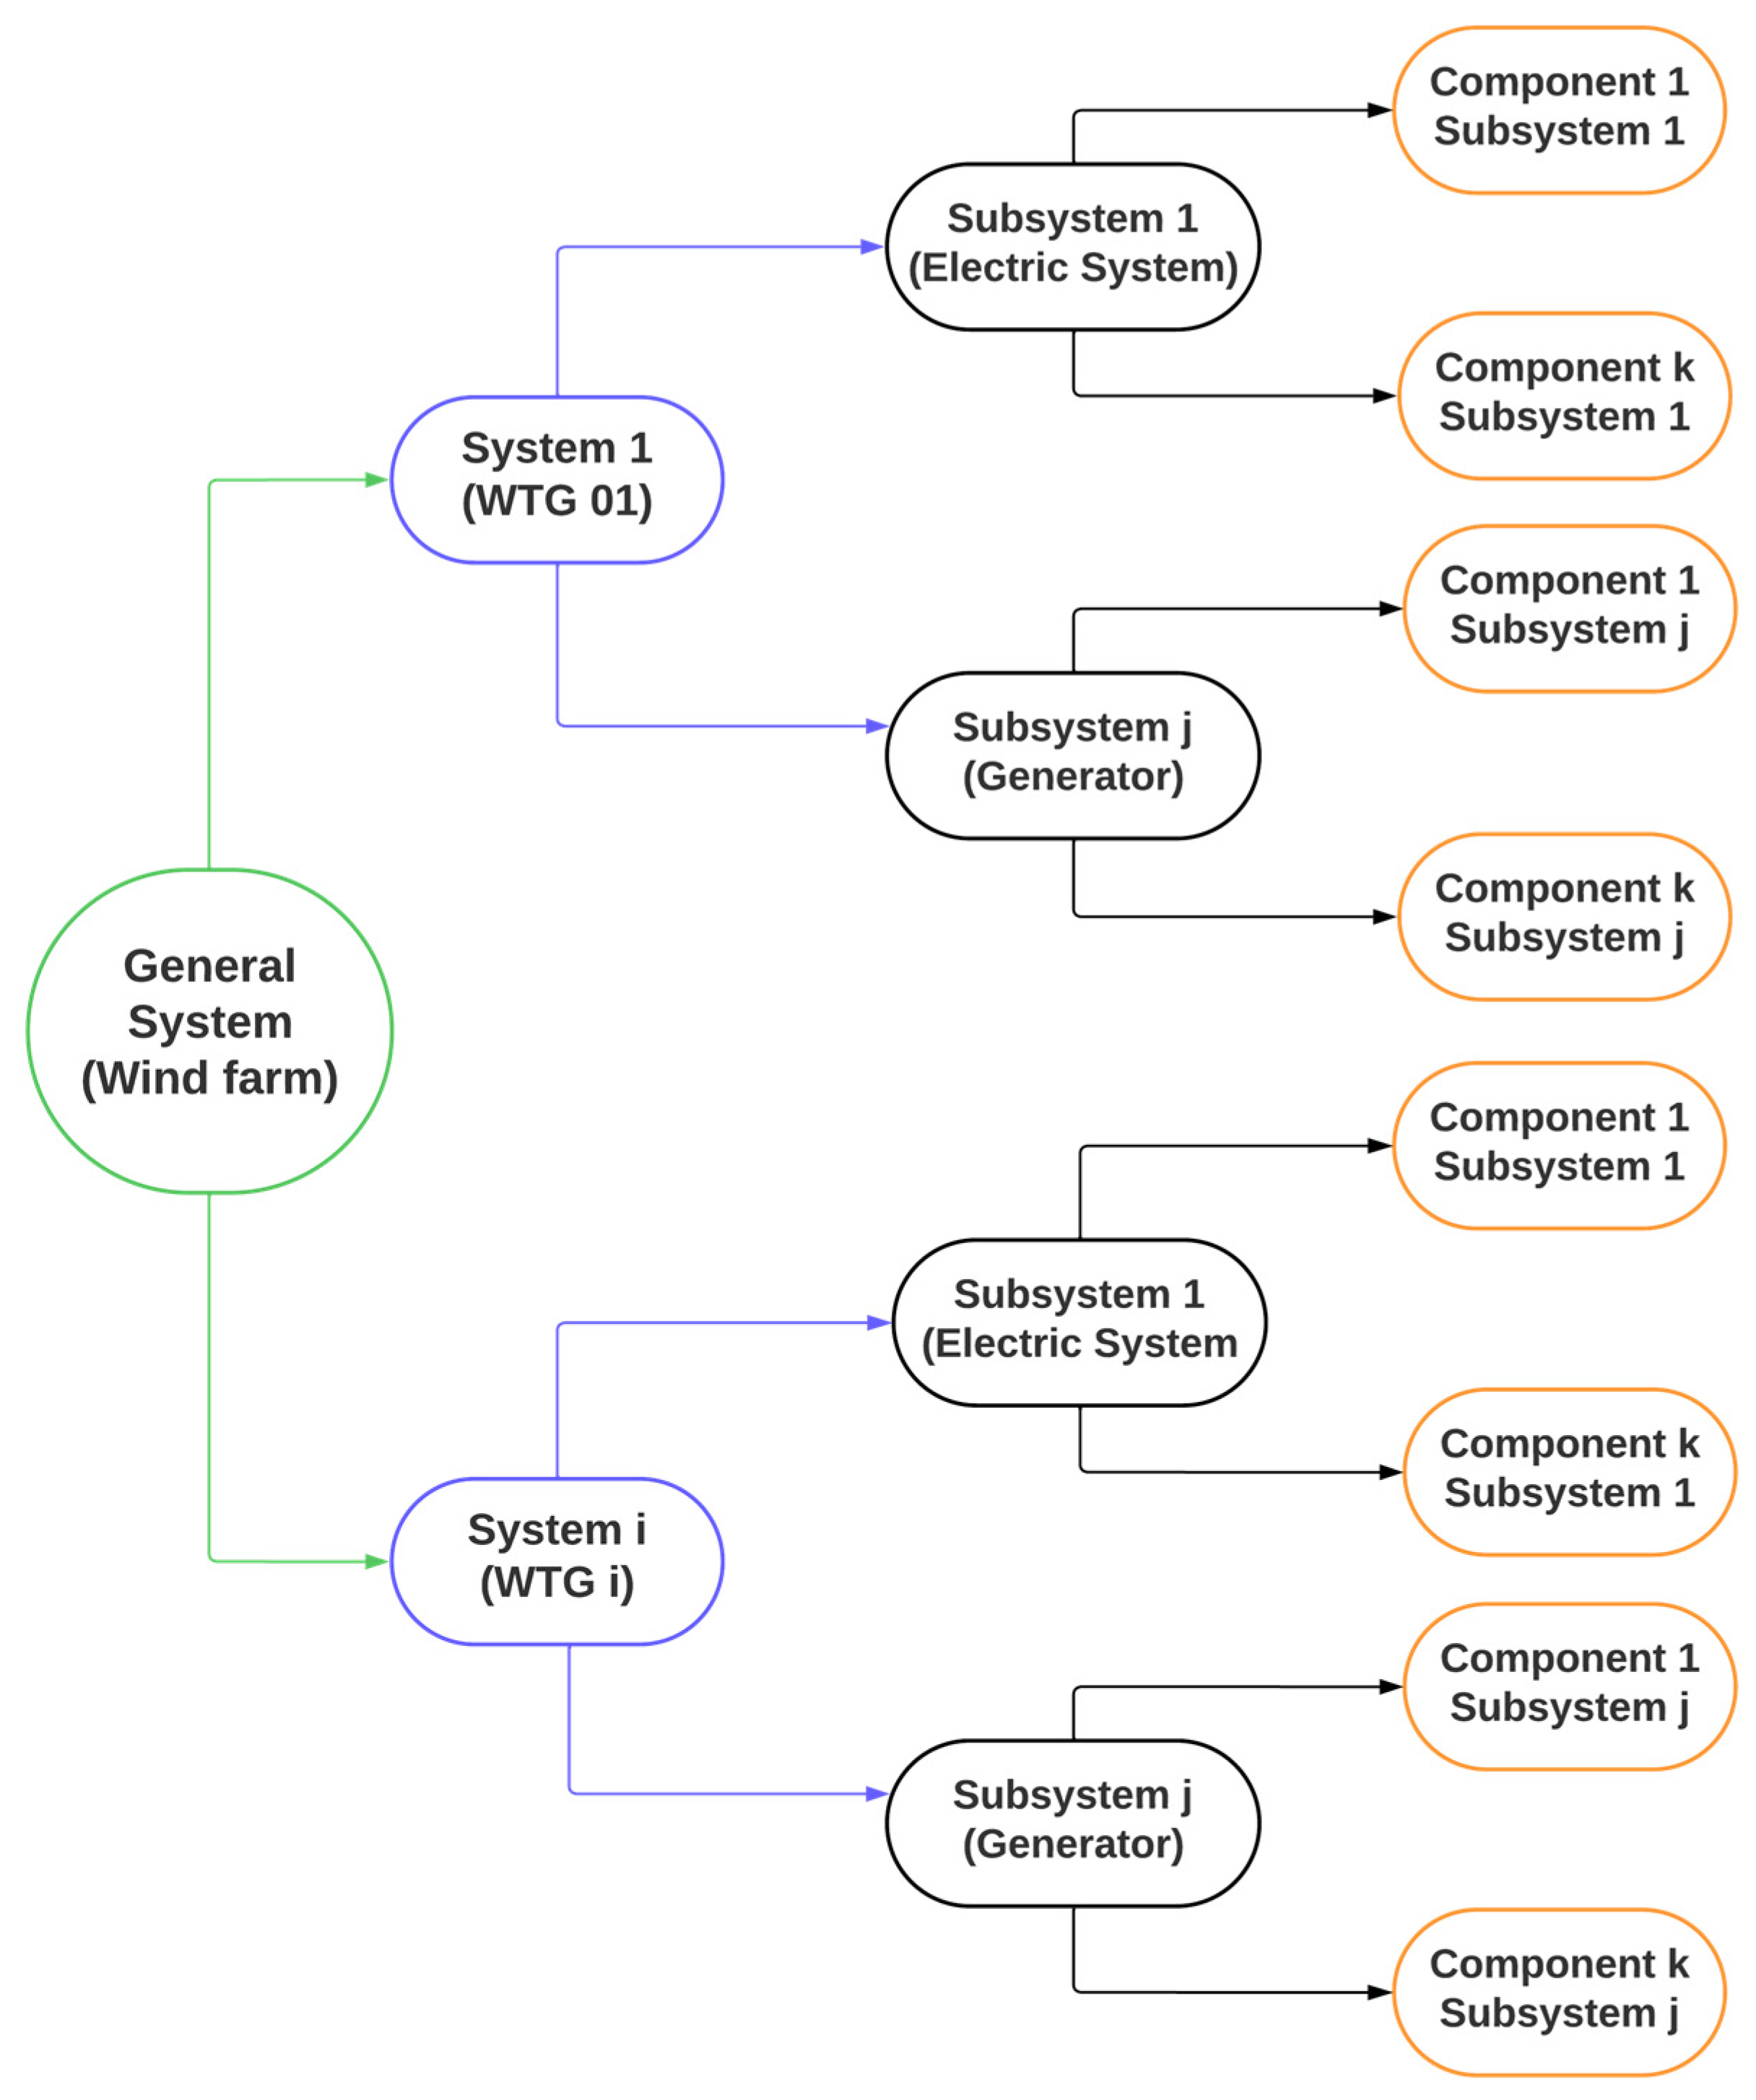
The development of the analysis can be performed at the component, wind turbine, or wind farm level. At the component level, the parts already mentioned in
Section 2.1 are viewed as independent units and the focus is on the optimization of that part, highlighting the importance of the subcomponents. At the wind turbine level, these components are analyzed as part of a system (generally modelled in series), allowing for independence in replacement but dependence in failure. This means that the failure of one of the components can cause the failure of the whole system (Common Cause Failure). Finally, looking at the wind farm level (a group of WTGs) is normally used to optimize maintenance resources given the dependency of failures.
2.7. Decision Makers
Usually, there are three main points of view:
The first point of view can be appreciated under the initial contractual agreement, where the manufacturer is obligated to rectify any system failure caused by design, manufacturing, or quality assurance problems. This service cost generally involves the costs of repairing failures through corrective maintenance (CM) during the first years of operation (depending on the defined time). One possible way to reduce service costs is to make wise decisions about the design of WTGs, known as “Design for Reliability (DFR)”.
The second point of view is that of the wind farm owner and operator who aims to use preventive maintenance to prolong the service life and then reduce the degradation rate.
The last point of view has to do with the independent service providers whose services are determined by the maintenance contract, where availability is offered, so that the system is fixed (with regard to the proportion of time that the system is functional and working). Therefore, the objective commonly seeks to maximize availability and minimize production losses [
6].
It should be noted that the wind farm manufacturer can also offer a contract to operate and maintain the wind farm for a greater number of years, replacing the need for an independent service provider. Alternatively, an independent service option may be offered for a wind farm built by another company.
2.8. Types of SCADA Alarms
Alarms are triggered when key component signals exceed threshold limits, indicating changes in the WTG operating states, component malfunctions, environmental conditions, or design defects. It is important to correctly interpret and understand the SCADA alarms, because they provide pertinent information to the operator about their causes, which can be potentially useful in minimizing their manifestation and, therefore, reducing downtime. The alarms are usually classified as general alarms, system operational alarms, environmental alarms, and communication/software alarms according to their function [
28]. In addition to this classification, it is essential to understand that SCADA events have a subclassification called alarms, warnings, and states. The warnings will also be categorized as alarms since they fulfil a similar function, and the states are those that denote whether the wind turbine is active or inactive.
4. Case Study and Discussion
The database to be analyzed corresponds to a wind farm located in the southern part of Latin America, which contains WTGs regulated by a horizontal axis pitch with a three-blade configuration. It is in a humid region, with a high daily oscillation of ambient temperatures, ranging from −2.1 [°C] to 43.2 [°C] during the study period. It can also be mentioned that it is an area of low rainfall. All WTGs in the wind farm are of the same size and type, i.e., DFIGs for Type IIA wind classes, which combine blades and a multi-stage gearbox (a high-speed ratio gearbox). All the WTGs feature a wound rotor induction machine (WRIM), two frequency converters, pitch, and variable speed control units. This WTG operates in a standard temperature range from −20 [°C] to 30 [°C] and is to the order of modern megawatt-scale WTGs, i.e., with a rotor diameter between 80 and 170 m and a rated power between 2 and 5 MW.
It should be noted that the sample contains all the alarms, warnings, and statuses for one year of operation, studied from May 2022 to 2023, of a certain number of the total number of WTGs (a couple of WTGs were randomly excluded to form the cluster and ensure confidentiality). This wind farm has been commissioned for more than 4 years, so it can be assumed that it is in the process of transition from early failures to intrinsic failures, according to the bathtub curve discussed in previous sections. The exact details of the investigated wind farm are not provided in this document to guarantee the confidentiality of the operator and the WTG manufacturer. For the same reason, the data on the maintenance strategy and the logs of the wind farm will not be shown. To enrich this study, the relationship between the alarms, stops, and ambient temperature will be explored.
The failure rate and downtime analysis presented in this paper uses the SCADA alarm occurrence frequencies, as well as the downtime rates or the period in which the alarm was found to be active (the distinction is made, since an active alarm does not imply that the WTG is inactive). The actual downtime, determined by the WTG’s status, is also considered. All these were obtained by performing an extensive review of the exported SCADA alarms database of the period under study. These data were then used to identify the most critical WTG subsystems in terms of reliability, and the occurrence of their alarms in the operating hours of the WTGs were investigated. To simplify the visualization of these data, a graphical tool is presented that relates both the number and time of the alarms for each subsystem.
All the planned (scheduled) and unplanned (unscheduled) maintenance activities that caused downtime were considered for investigation in this paper. Finally, it is relevant to mention that during this period there were no major component replacements (that is, major correctives).
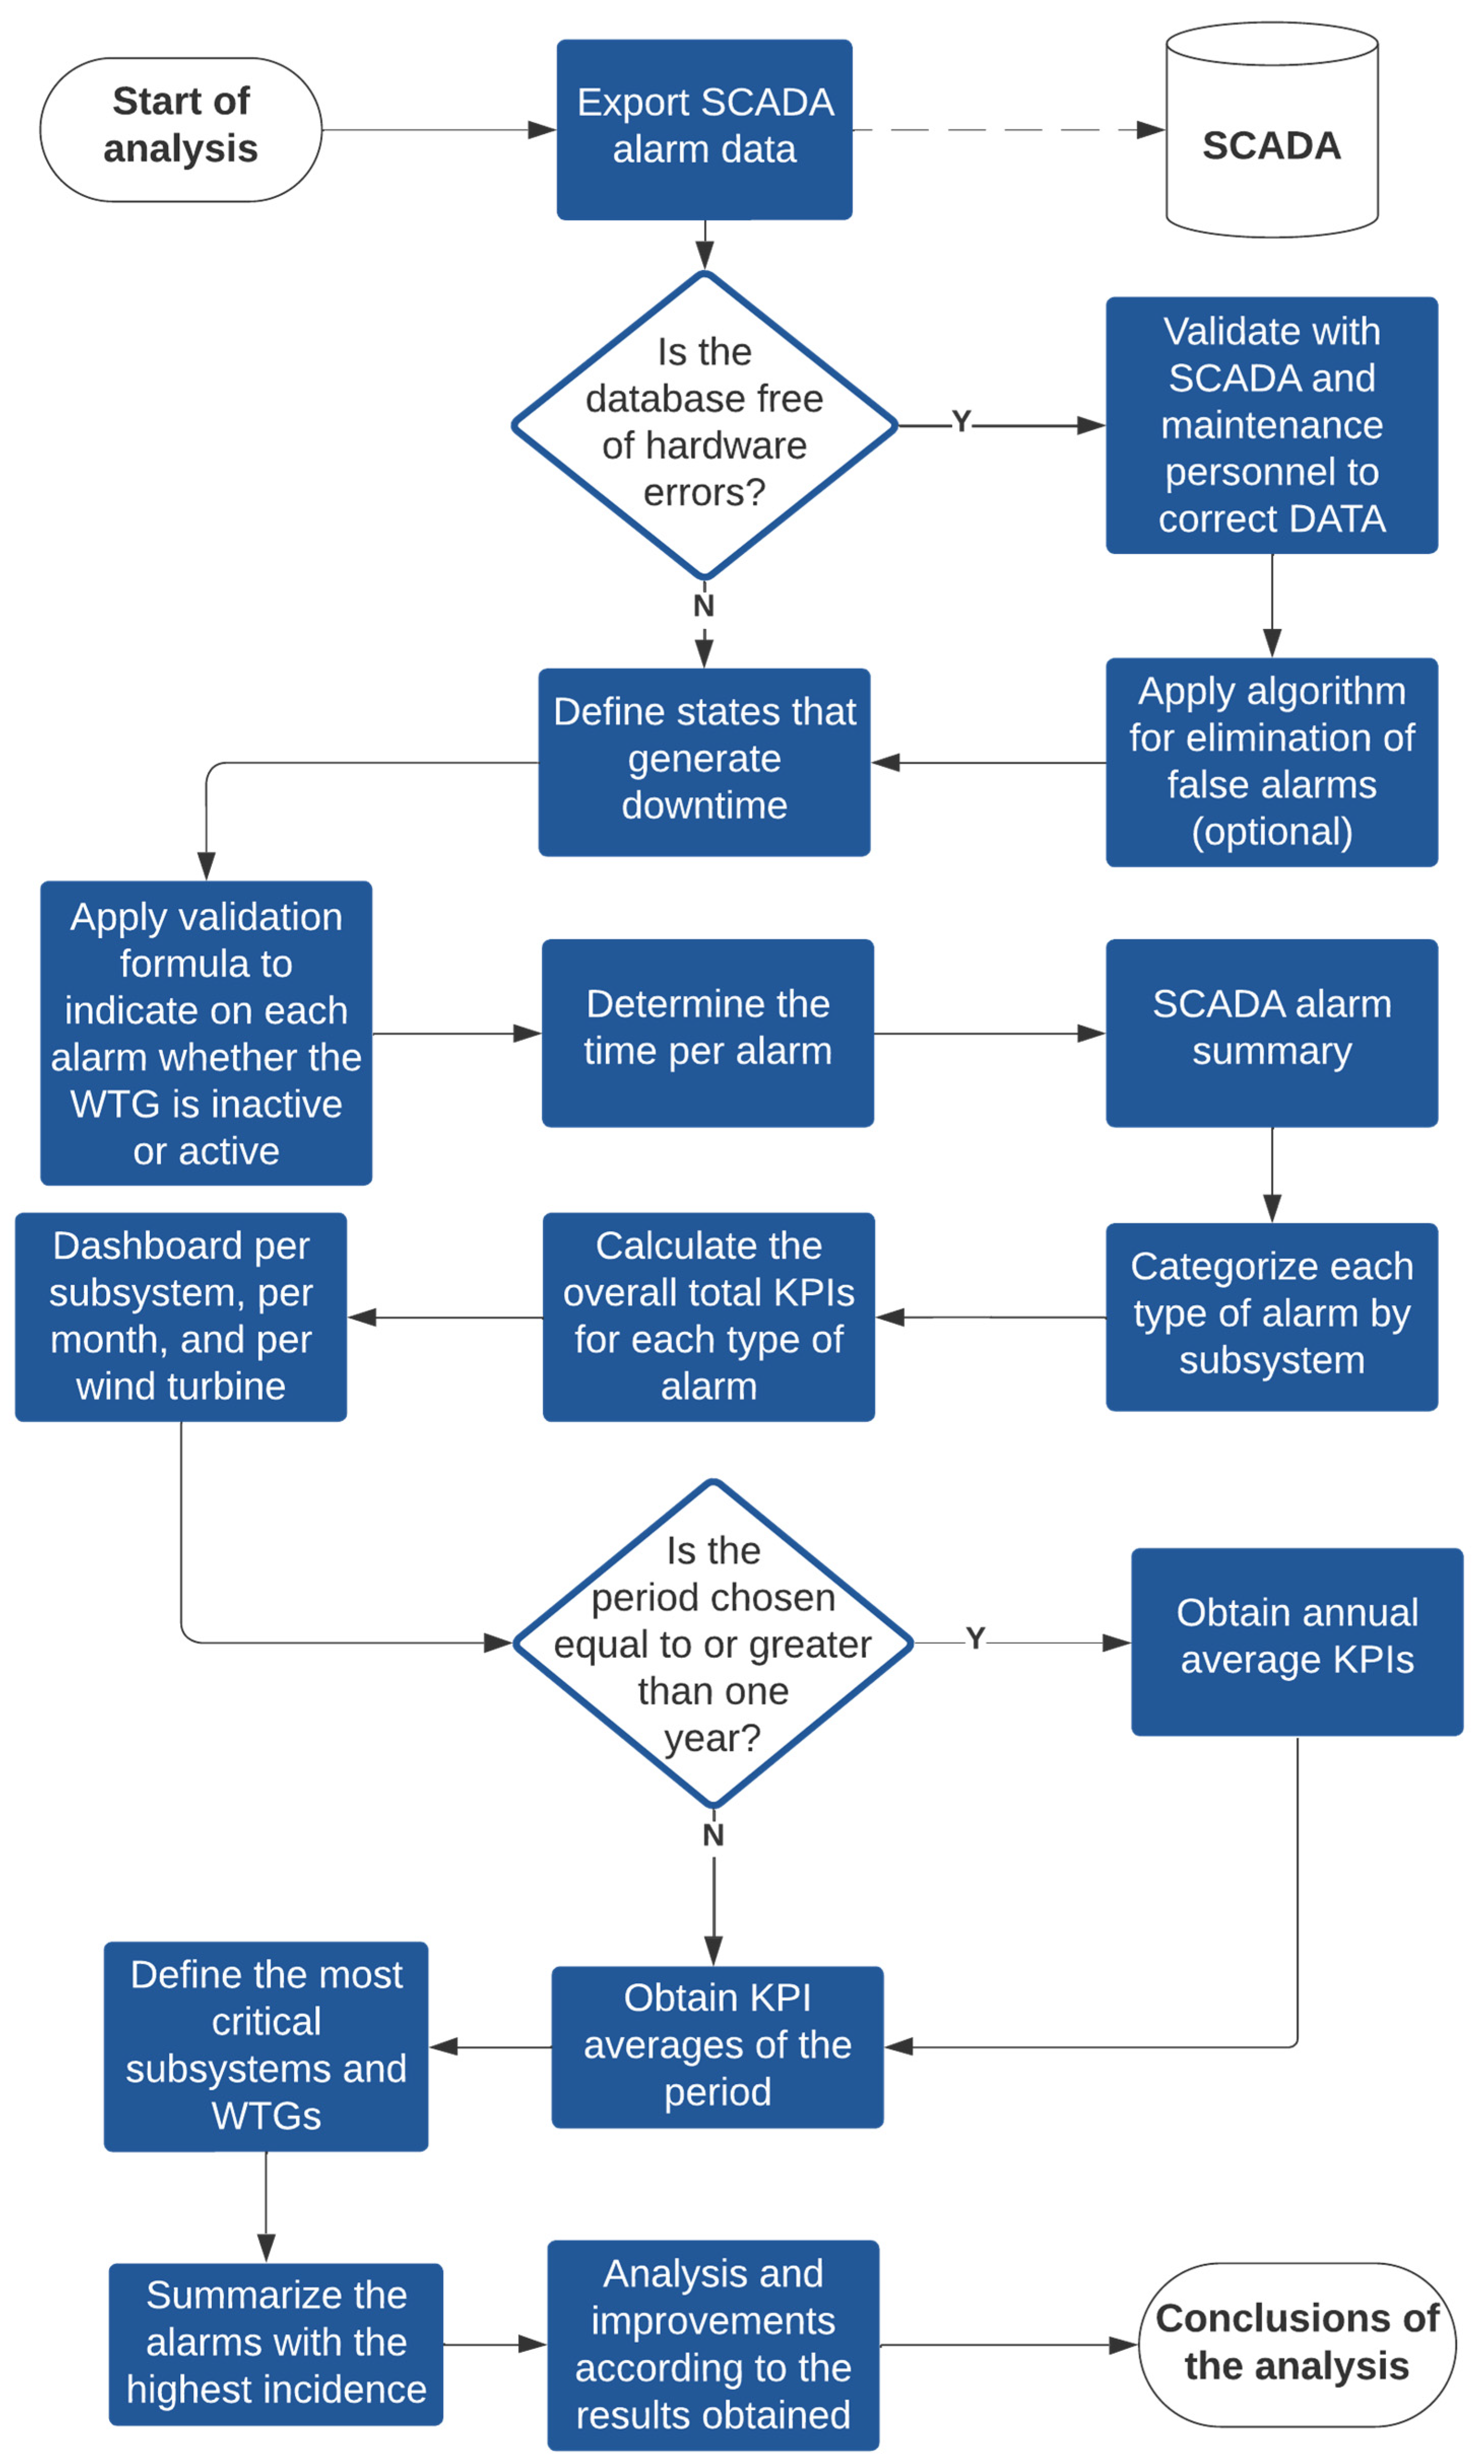
Once the database for the entire period is exported, each alarm is summarized and categorized for each subsystem according to the explained criteria. This can be done by the data management and analysis tool that best suits the needs and extent of the database. Additionally, the number of occurrences and the time the alarms were active can be obtained, either in any state of the wind turbine or only in the inactive states. To confirm that the assumption of keeping the previous state in the “Not Communicating state” does not have great relevance for the results, the number of times the state changed before and after the “Not Communicating state” was calculated. There were two status changes in the “Not Communicating State” per month per wind turbine.
Therefore, the first relevant indicator calculated was the downtime per turbine per year, equivalent to 10.85 days. Then, the rest of the indicators corresponding to the SCADA alarms were obtained, starting with the average total failures and downtime per turbine per month, which are shown in
Table 3.
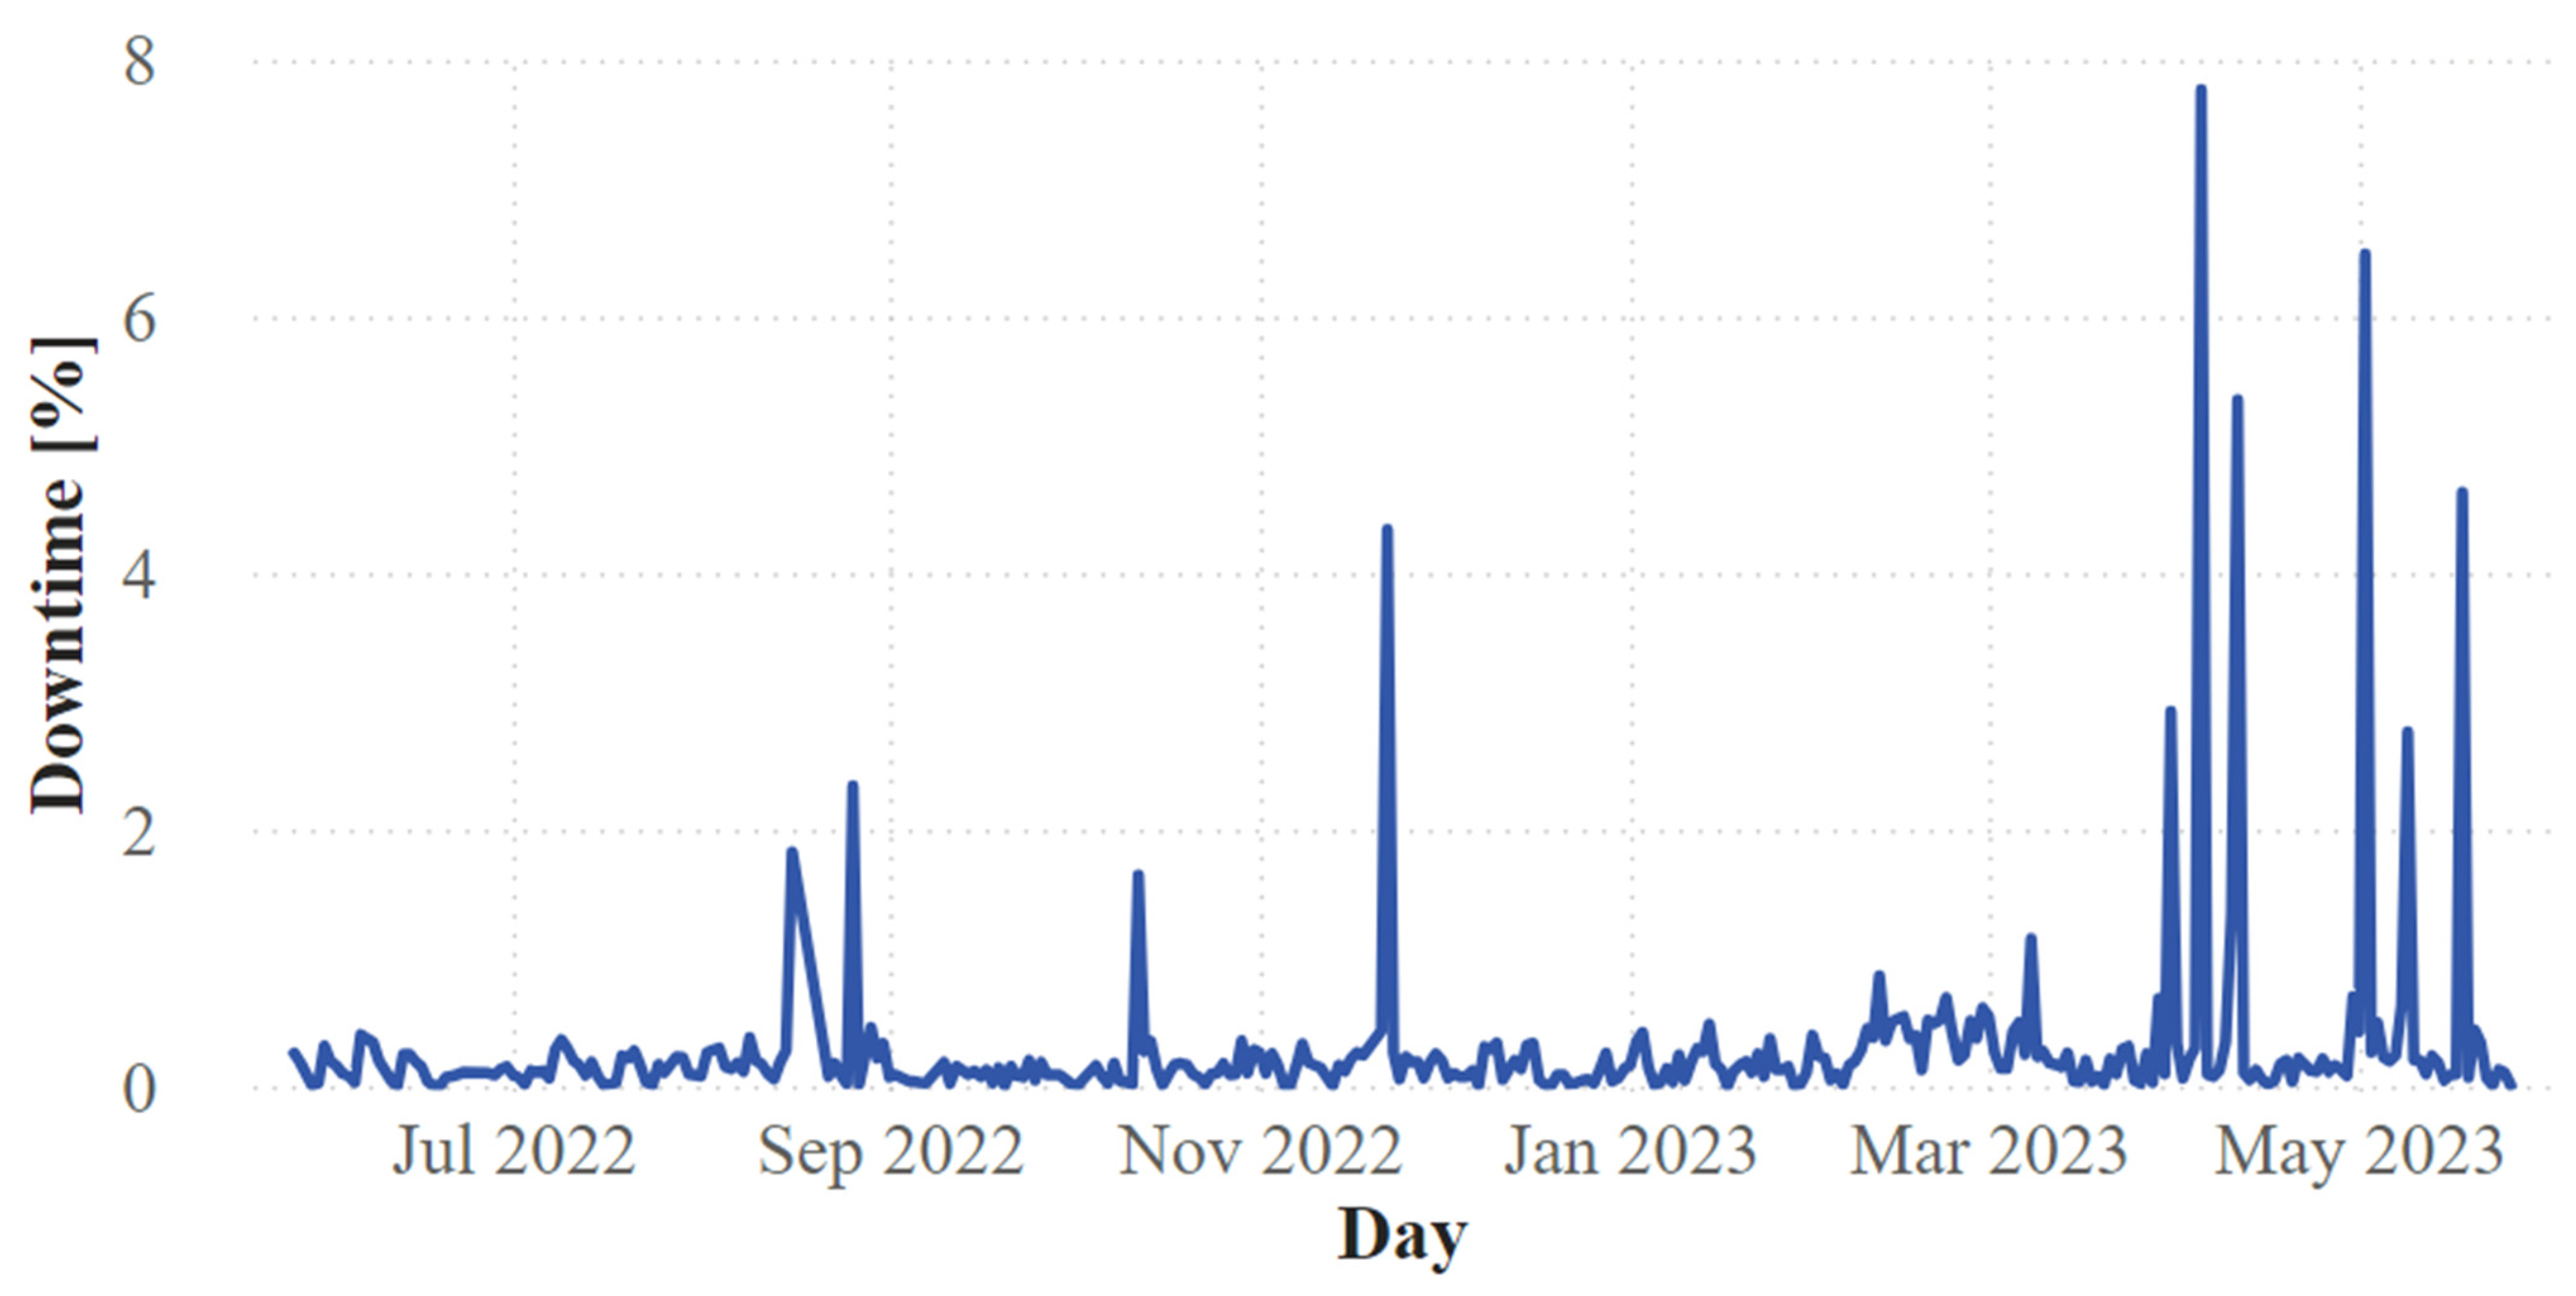
It can be observed that the WTGs studied exhibited a considerable number of alarms, recording an average of approximately 34 events per turbine per month, followed by 20 h of downtime per turbine per month, resulting in an average downtime of 0.59 h per failure event. During this period, 170 possible non-success modes and 202,088 state transitions were identified for the chosen cluster. Out of these, 5823 involved the wind turbine changing its operating state (inactive/active), with its downtime presenting the following distribution as demonstrated in
Figure 6:
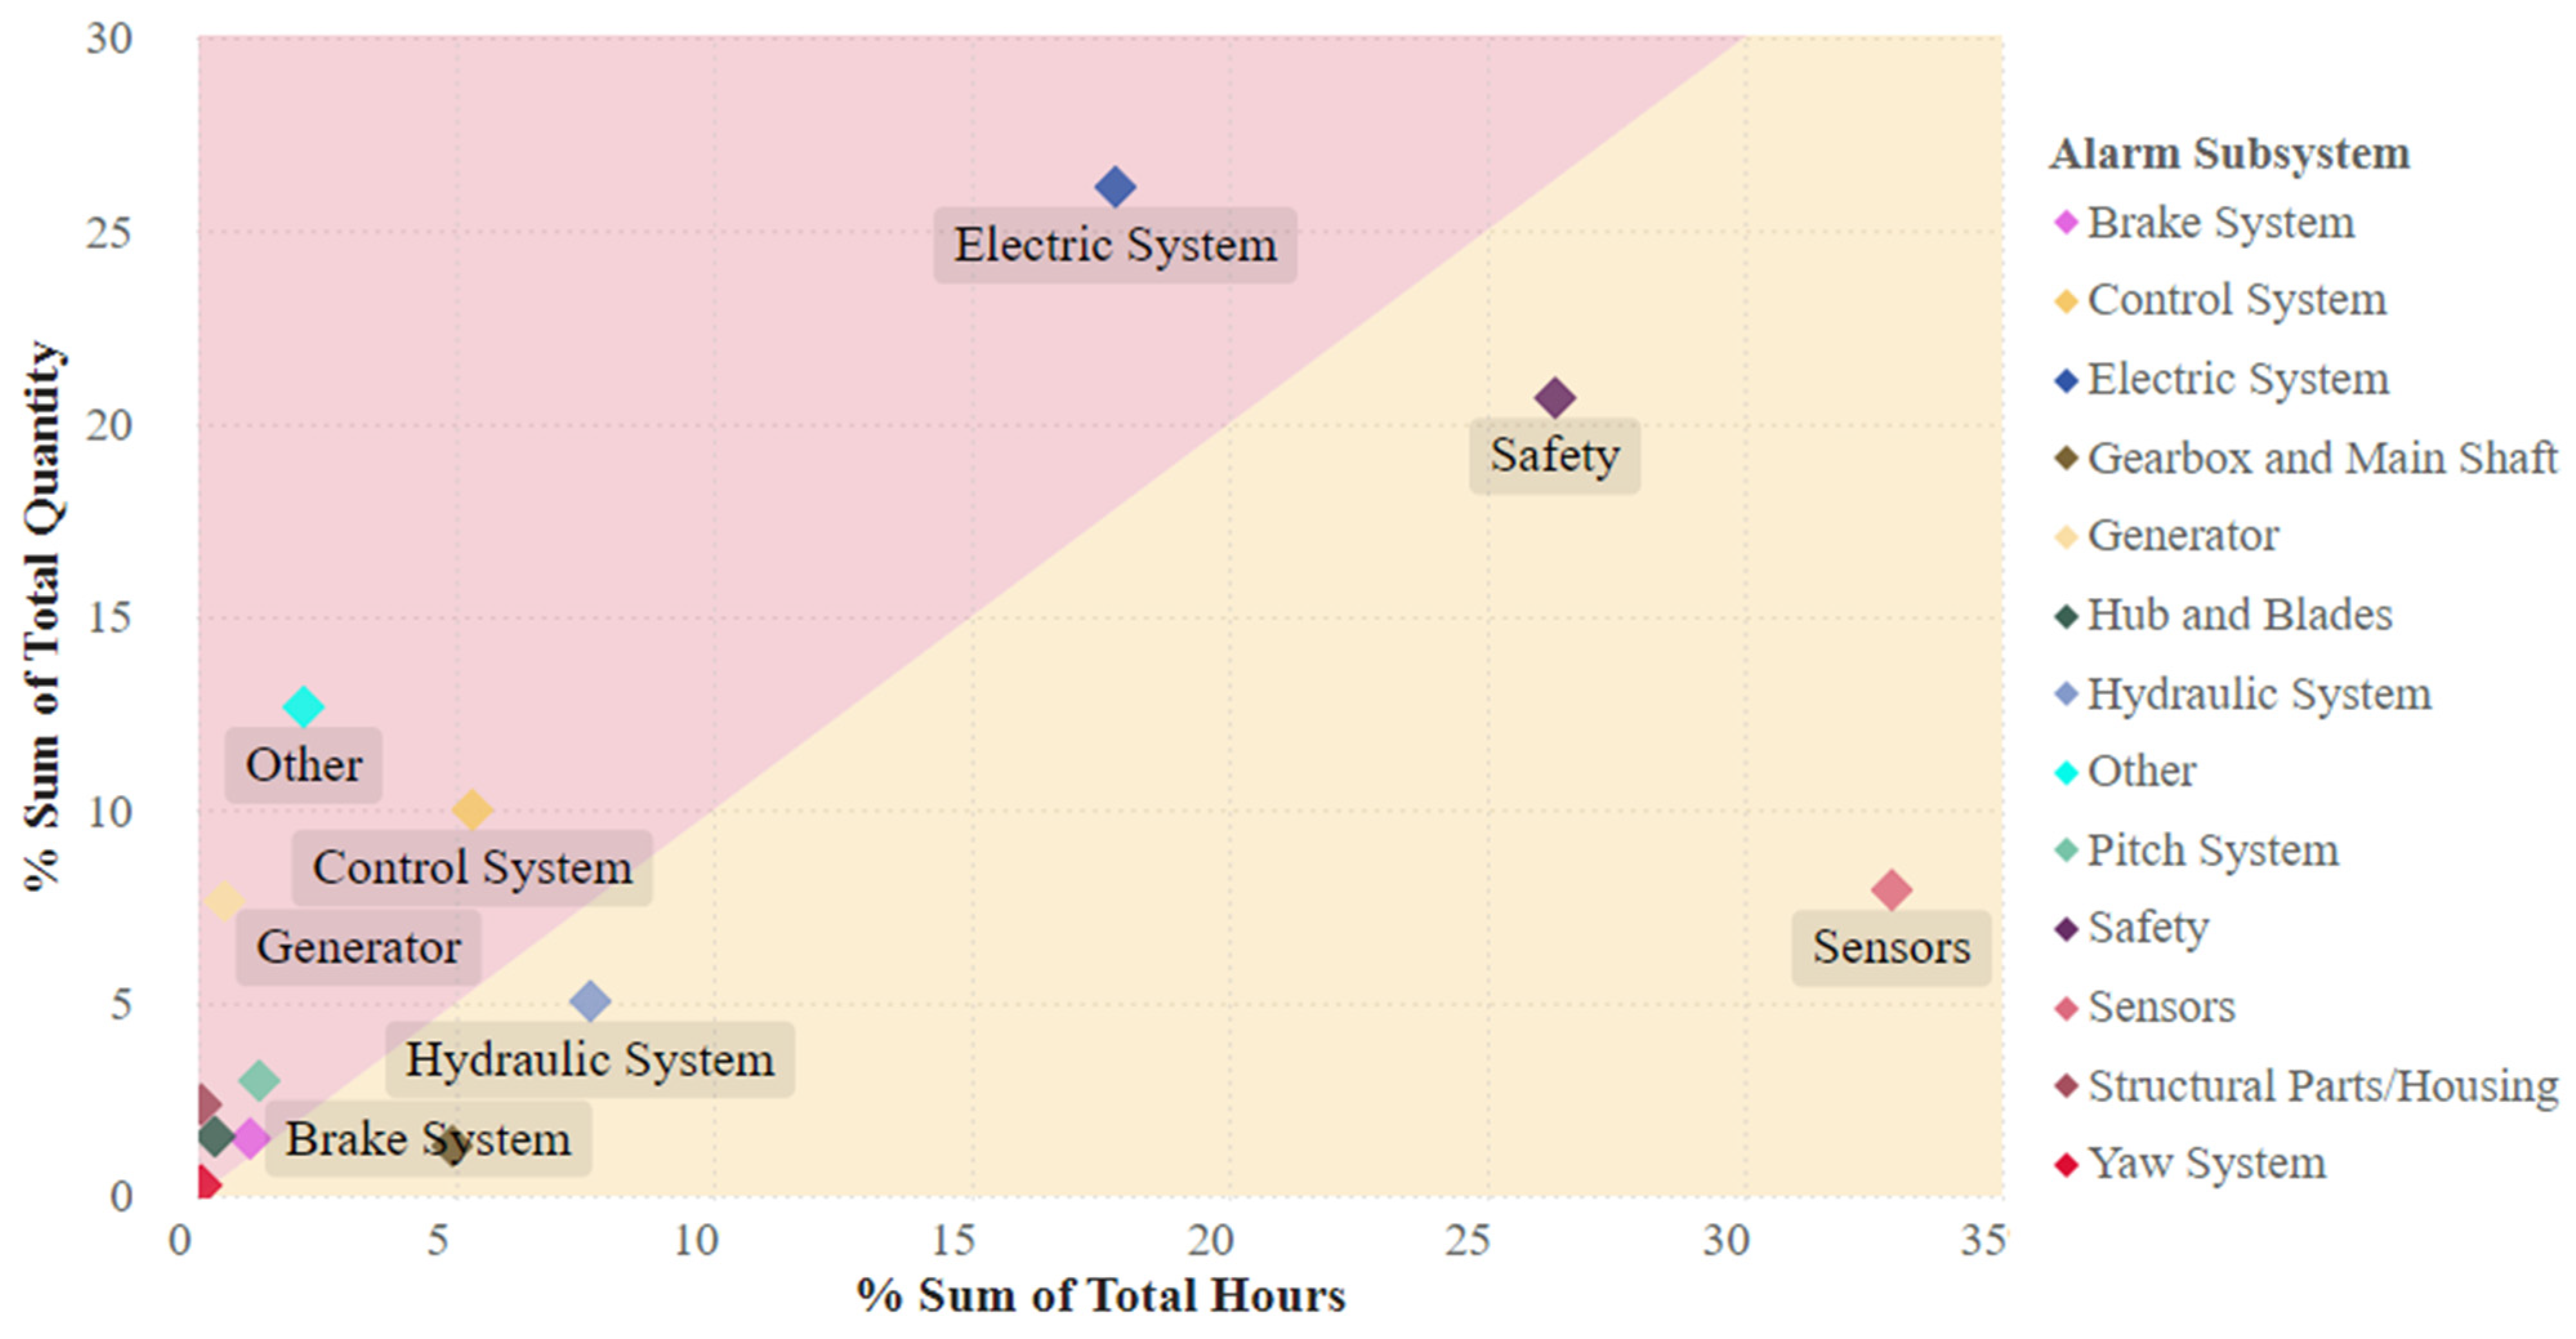
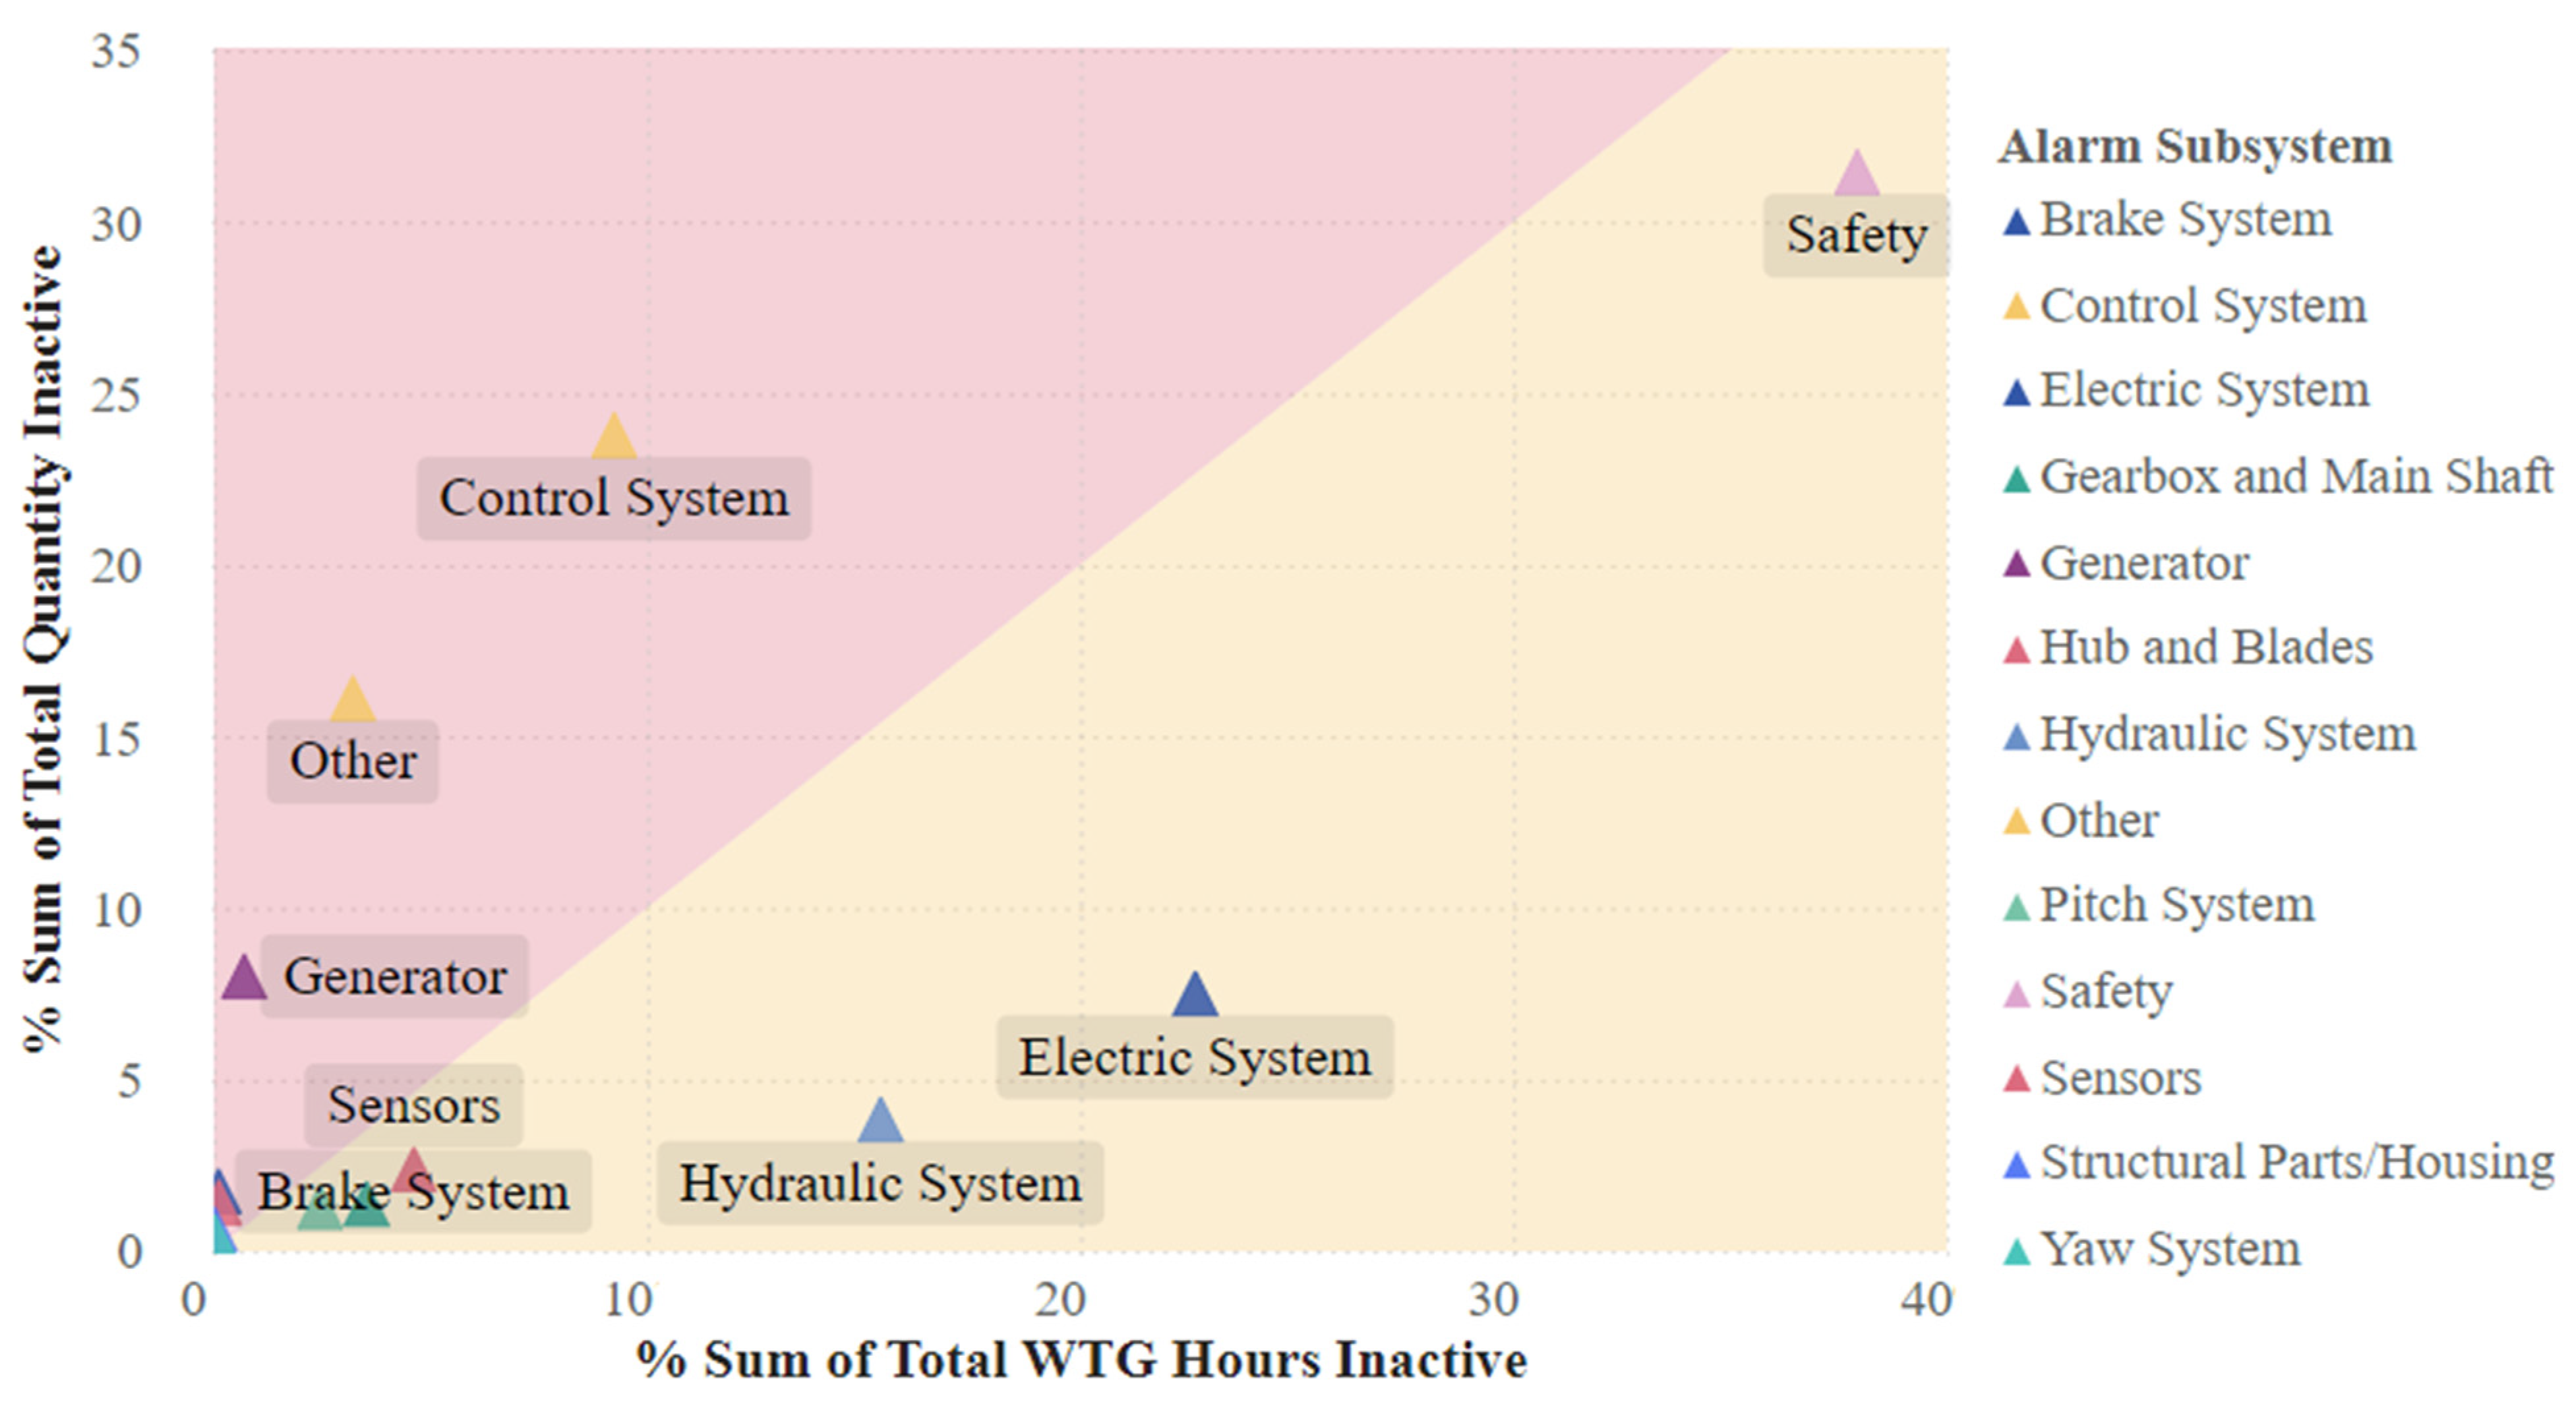
There were considerably longer periods of inactivity on days in November, April, and May, which will later have an impact on the monthly summary. Now, given the categorization of each of the alarms, we proceed to graph the percentages according to the number and time of each subsystem. The fact that an alarm is activated several times does not mean that its activation time is necessarily high. Therefore, both graphs will help to determine which subsystems are the most critical in this period. As a novel graphical identification tool, they are combined into one.
In descending order, the subsystems that produced the most alarms during the period studied were the Electric System, Safety, Other, and Control System; on the other hand, those that were active the longest were the Sensors, Safety, Electric System, and Hydraulic System. By combining both criteria, it is possible to determine that there are three critical subsystems for the chosen wind turbine cluster, these being the Electric System, Safety, and Sensors. These are precisely the ones that are farthest from the origin of the graph shown in
Figure 7 and that are contributing most to the inactivity of the wind farm. This coincides to a certain extent with the results obtained in the study of Type IIIA WTGs in Turkey [
19], since the two most relevant were the Safety and Electrical System subsystems. However, there is a big difference regarding the Sensors subsystem, since in the Turkey study it was one of the least attributed and, in this case, it is one of the critical ones. The alarms with the highest incidence in the Safety subsystem were related to out-of-range speeds and emergency warnings; then, in the Electric System, they were associated with failures in the load system, network, and feeders; and, finally, the Sensors subsystem was mostly marked by alarms associated with the wind vane and accelerometer.
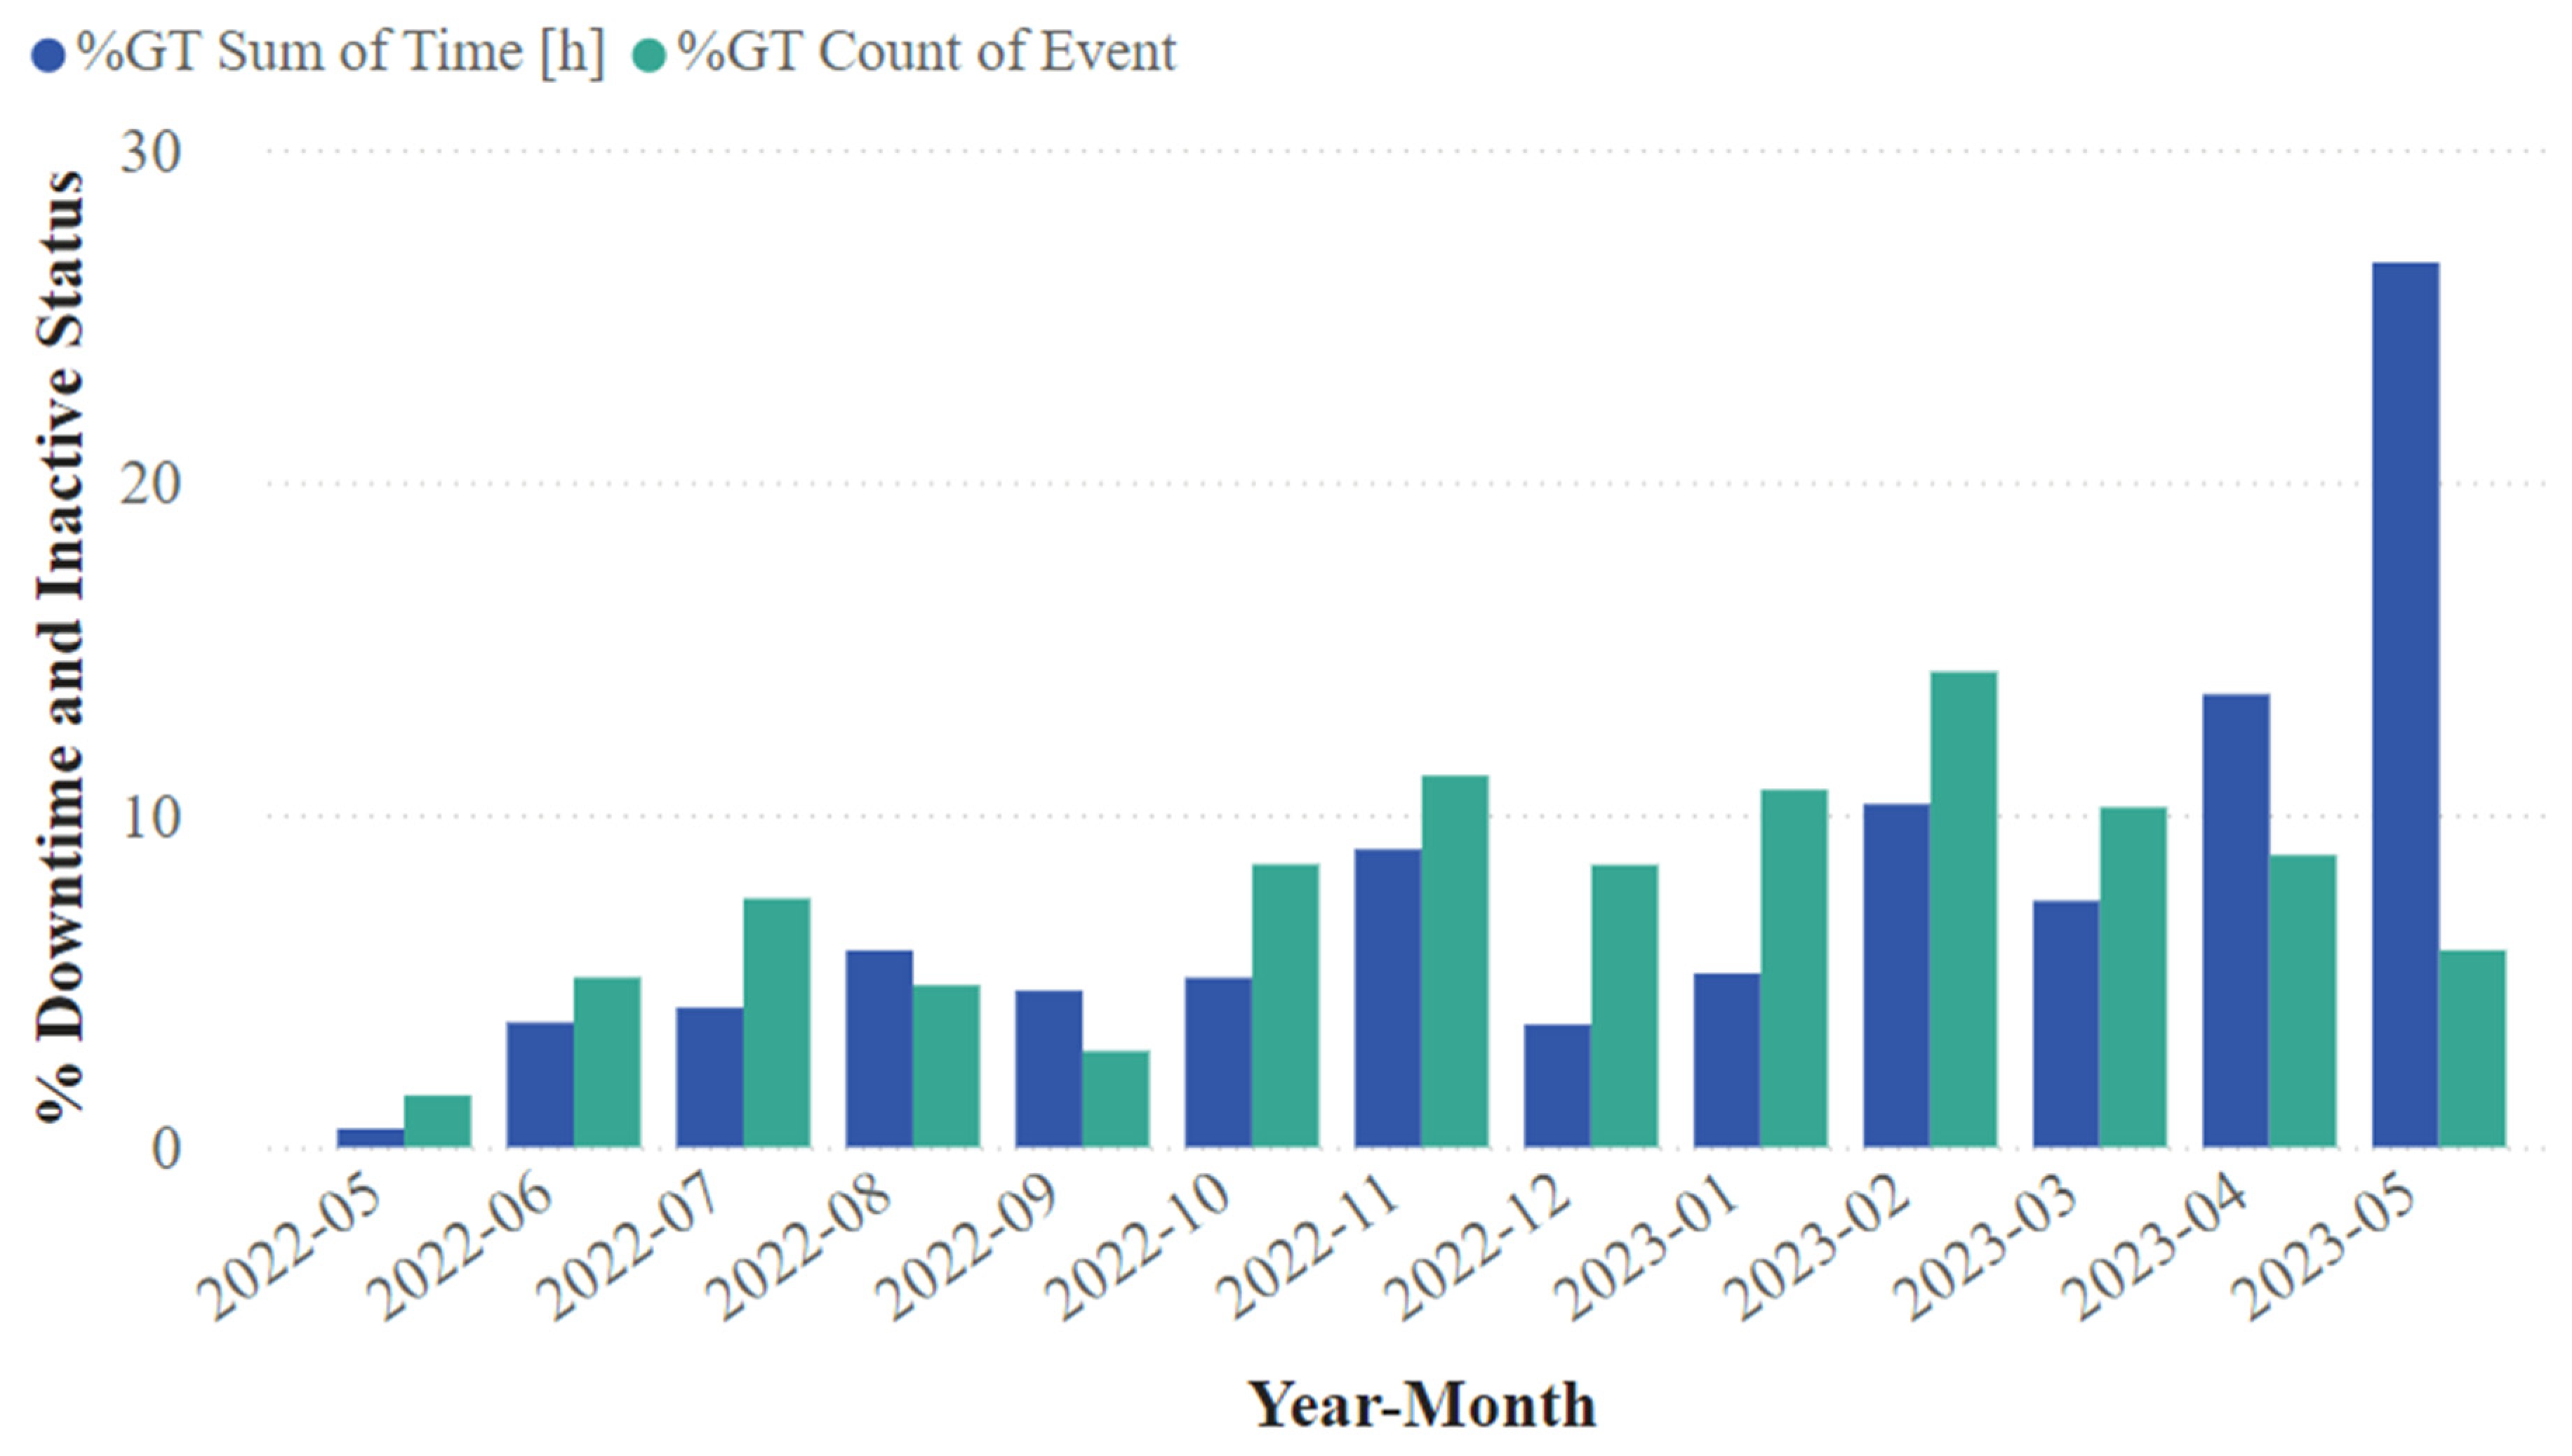
Now, the states and times associated with the inactivity of the wind turbine cluster will be reviewed in detail in
Figure 8, grouped by the operating month of the period under study.
The last two months (April and May 2023), despite not having the highest number of downtime events, were the ones with the longest times. This can be explained by the fact that their individual events probably had longer times, which can be complemented with what has already been shown in
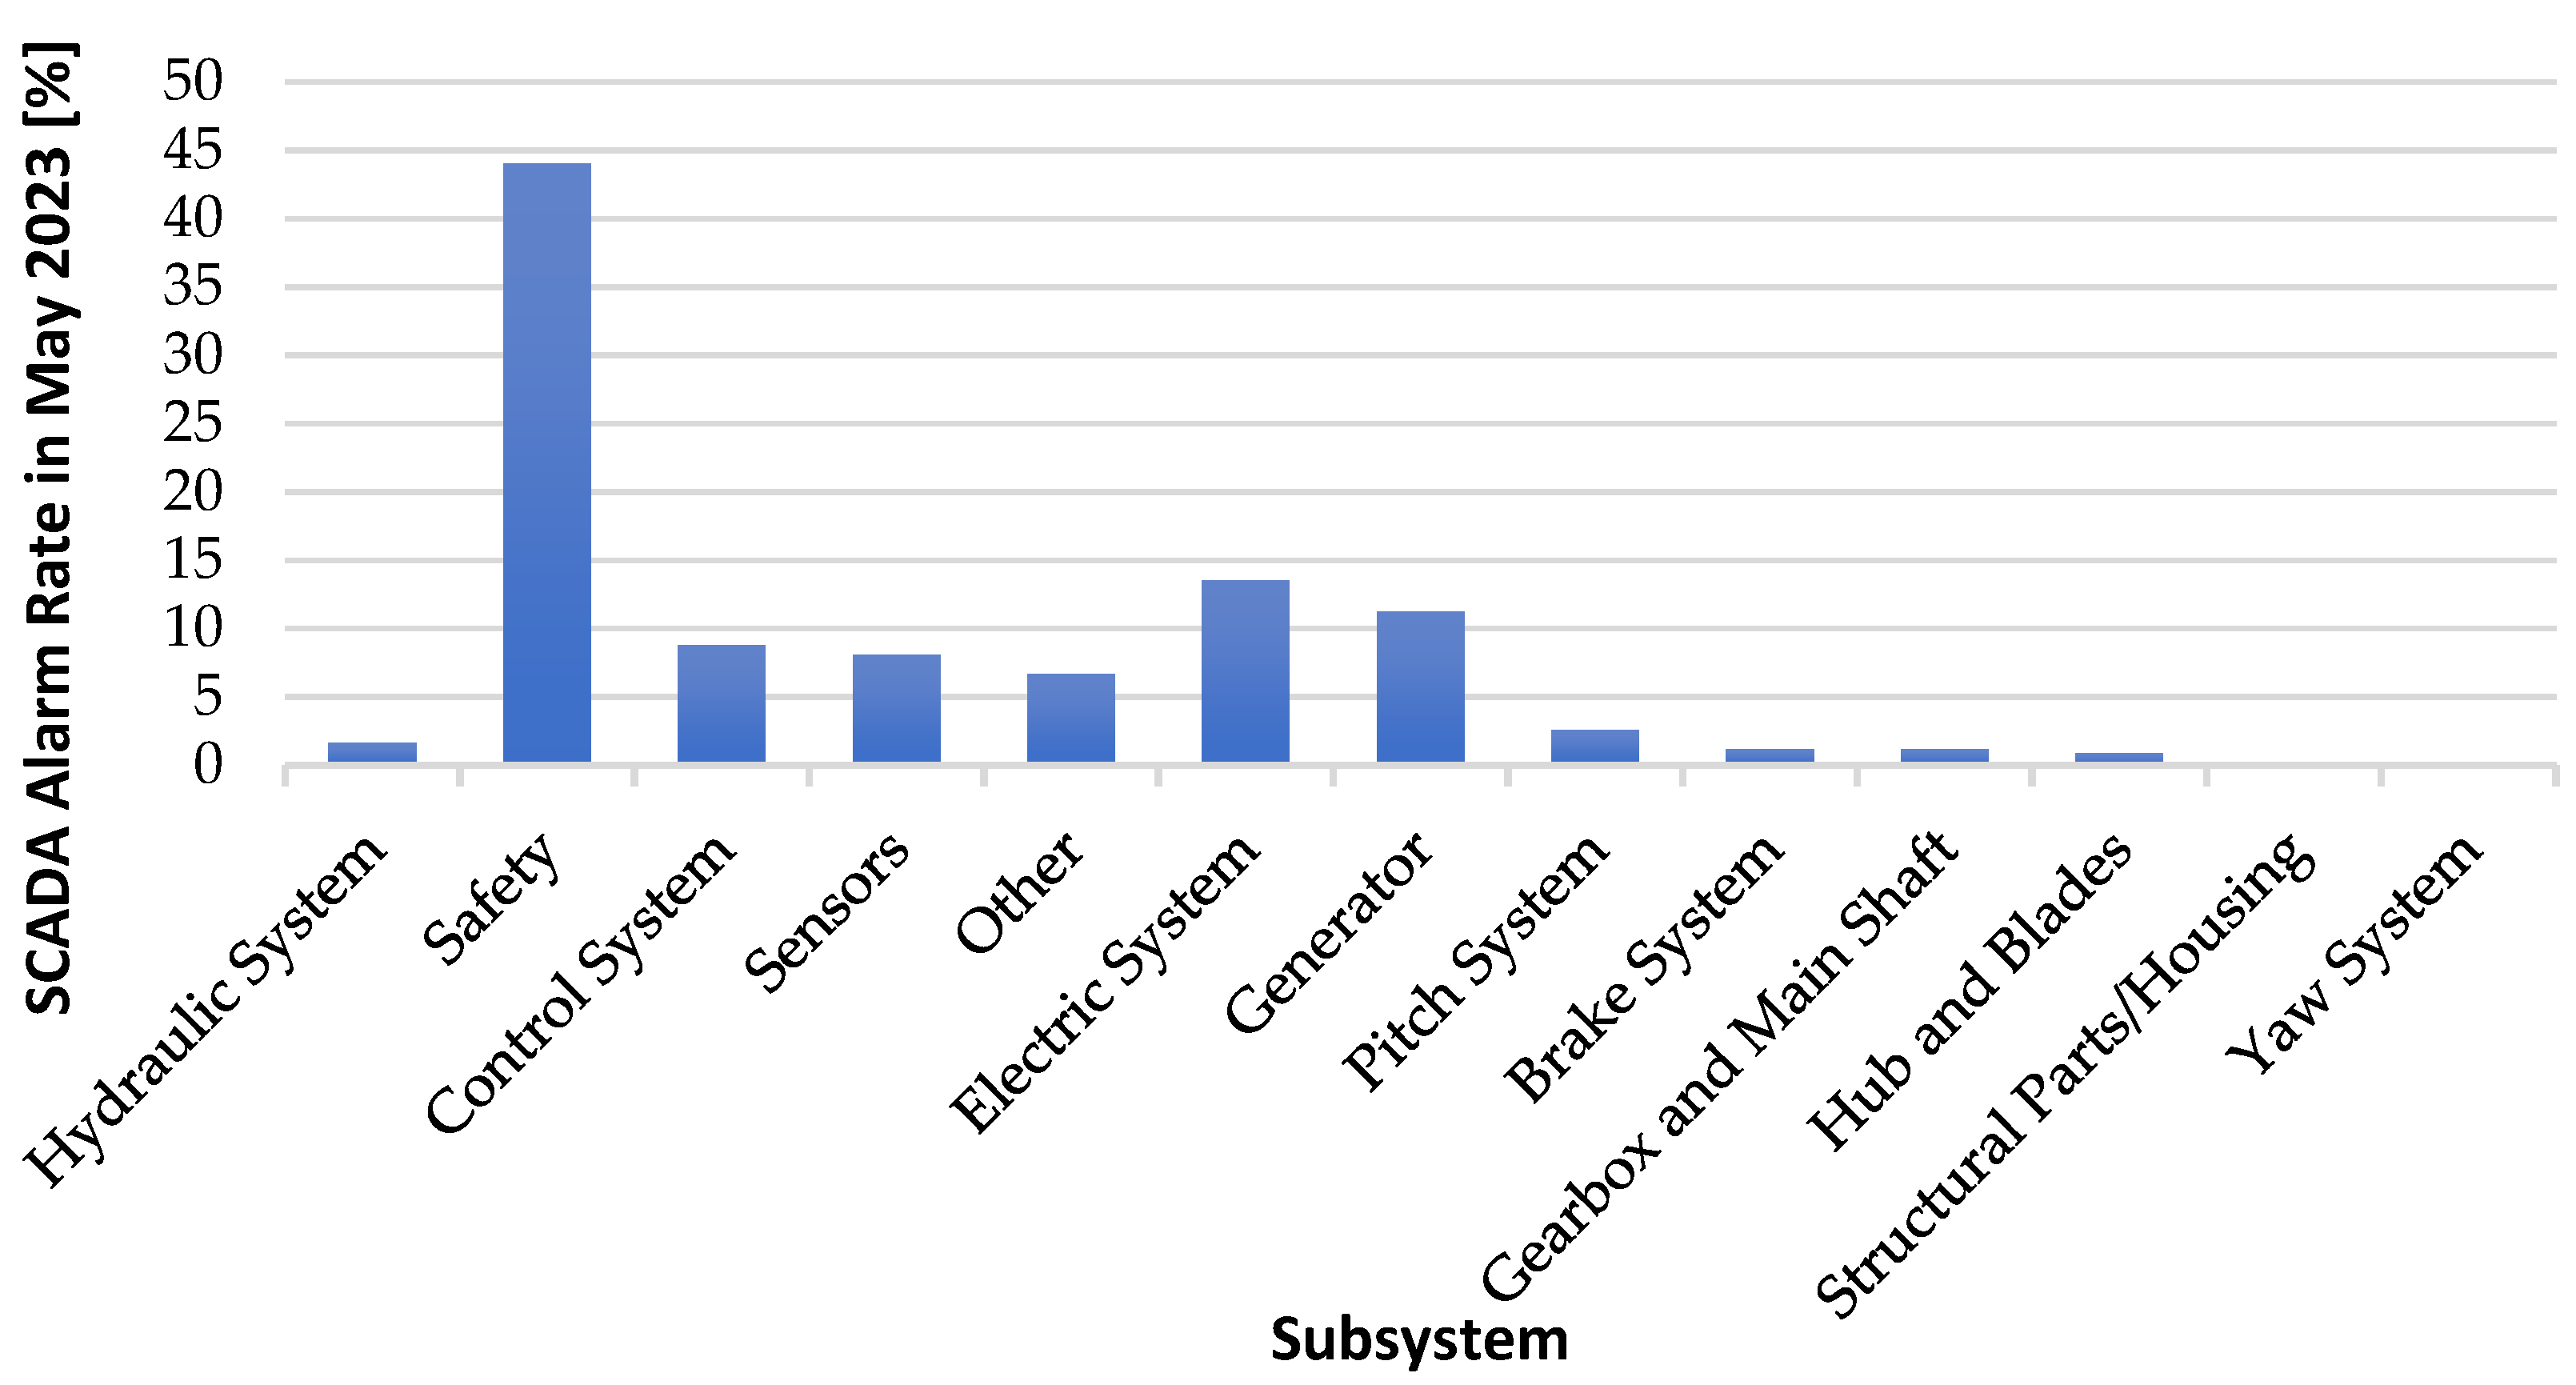
Figure 6. The most critical month was May, where the distribution of the subsystems is shown in
Figure 9.
It should be noted that in this month the subsystems that produced the most alarms were the Safety, Electric System, and Generator subsystems. The latter is followed closely by the Control System and Sensors subsystems. This conclusion is similar to the critical subsystems already found in the whole period, except for the Generator subsystem. Now, the downtimes shown imply that some WTGs were in an inactive state, and the analysis of SCADA alarms is generally done independently of the state of the wind turbine. The fact that a wind turbine is causing alarms does not necessarily imply a stop or inactivity, but it can be a symptom of a failure that is associated with a subsystem. Additionally, the distribution of the number of SCADA alarms and their uptime will be included in this analysis, only filtering when the wind turbine is in an inactive state. Our purpose is to confirm which subsystems could be generating major problems in the operation of WTGs in the period studied and whether this is consistent with what has already been obtained in general (independent of the state).
In this case, the Electrical System subsystem ceases to be one of the most significant subsystems due to the decrease in the number of alarms and is considerably displaced by Security, although it continues to be critical. Now, the Sensors subsystem is the one that represents the most considerable change in this aspect, because it decreases enormously and ceases to be relevant. On the other hand, there is a general increase in the Control System and an increase in time in the Hydraulic System. Therefore, the most critical subsystems when the WTGs were inactive were the Safety, Electric, and Control System subsystems. This may mean that it is these subsystems that, during shutdowns or maintenance, have an important impact on the recovery time. Furthermore, there is the Control System, which is one of the subsystems that had greater relevance when the state was inactive, which is why it was incorporated into the three subsystems that were previously found. Therefore, four critical subsystems will be analyzed, based on those shown in
Figure 7 and
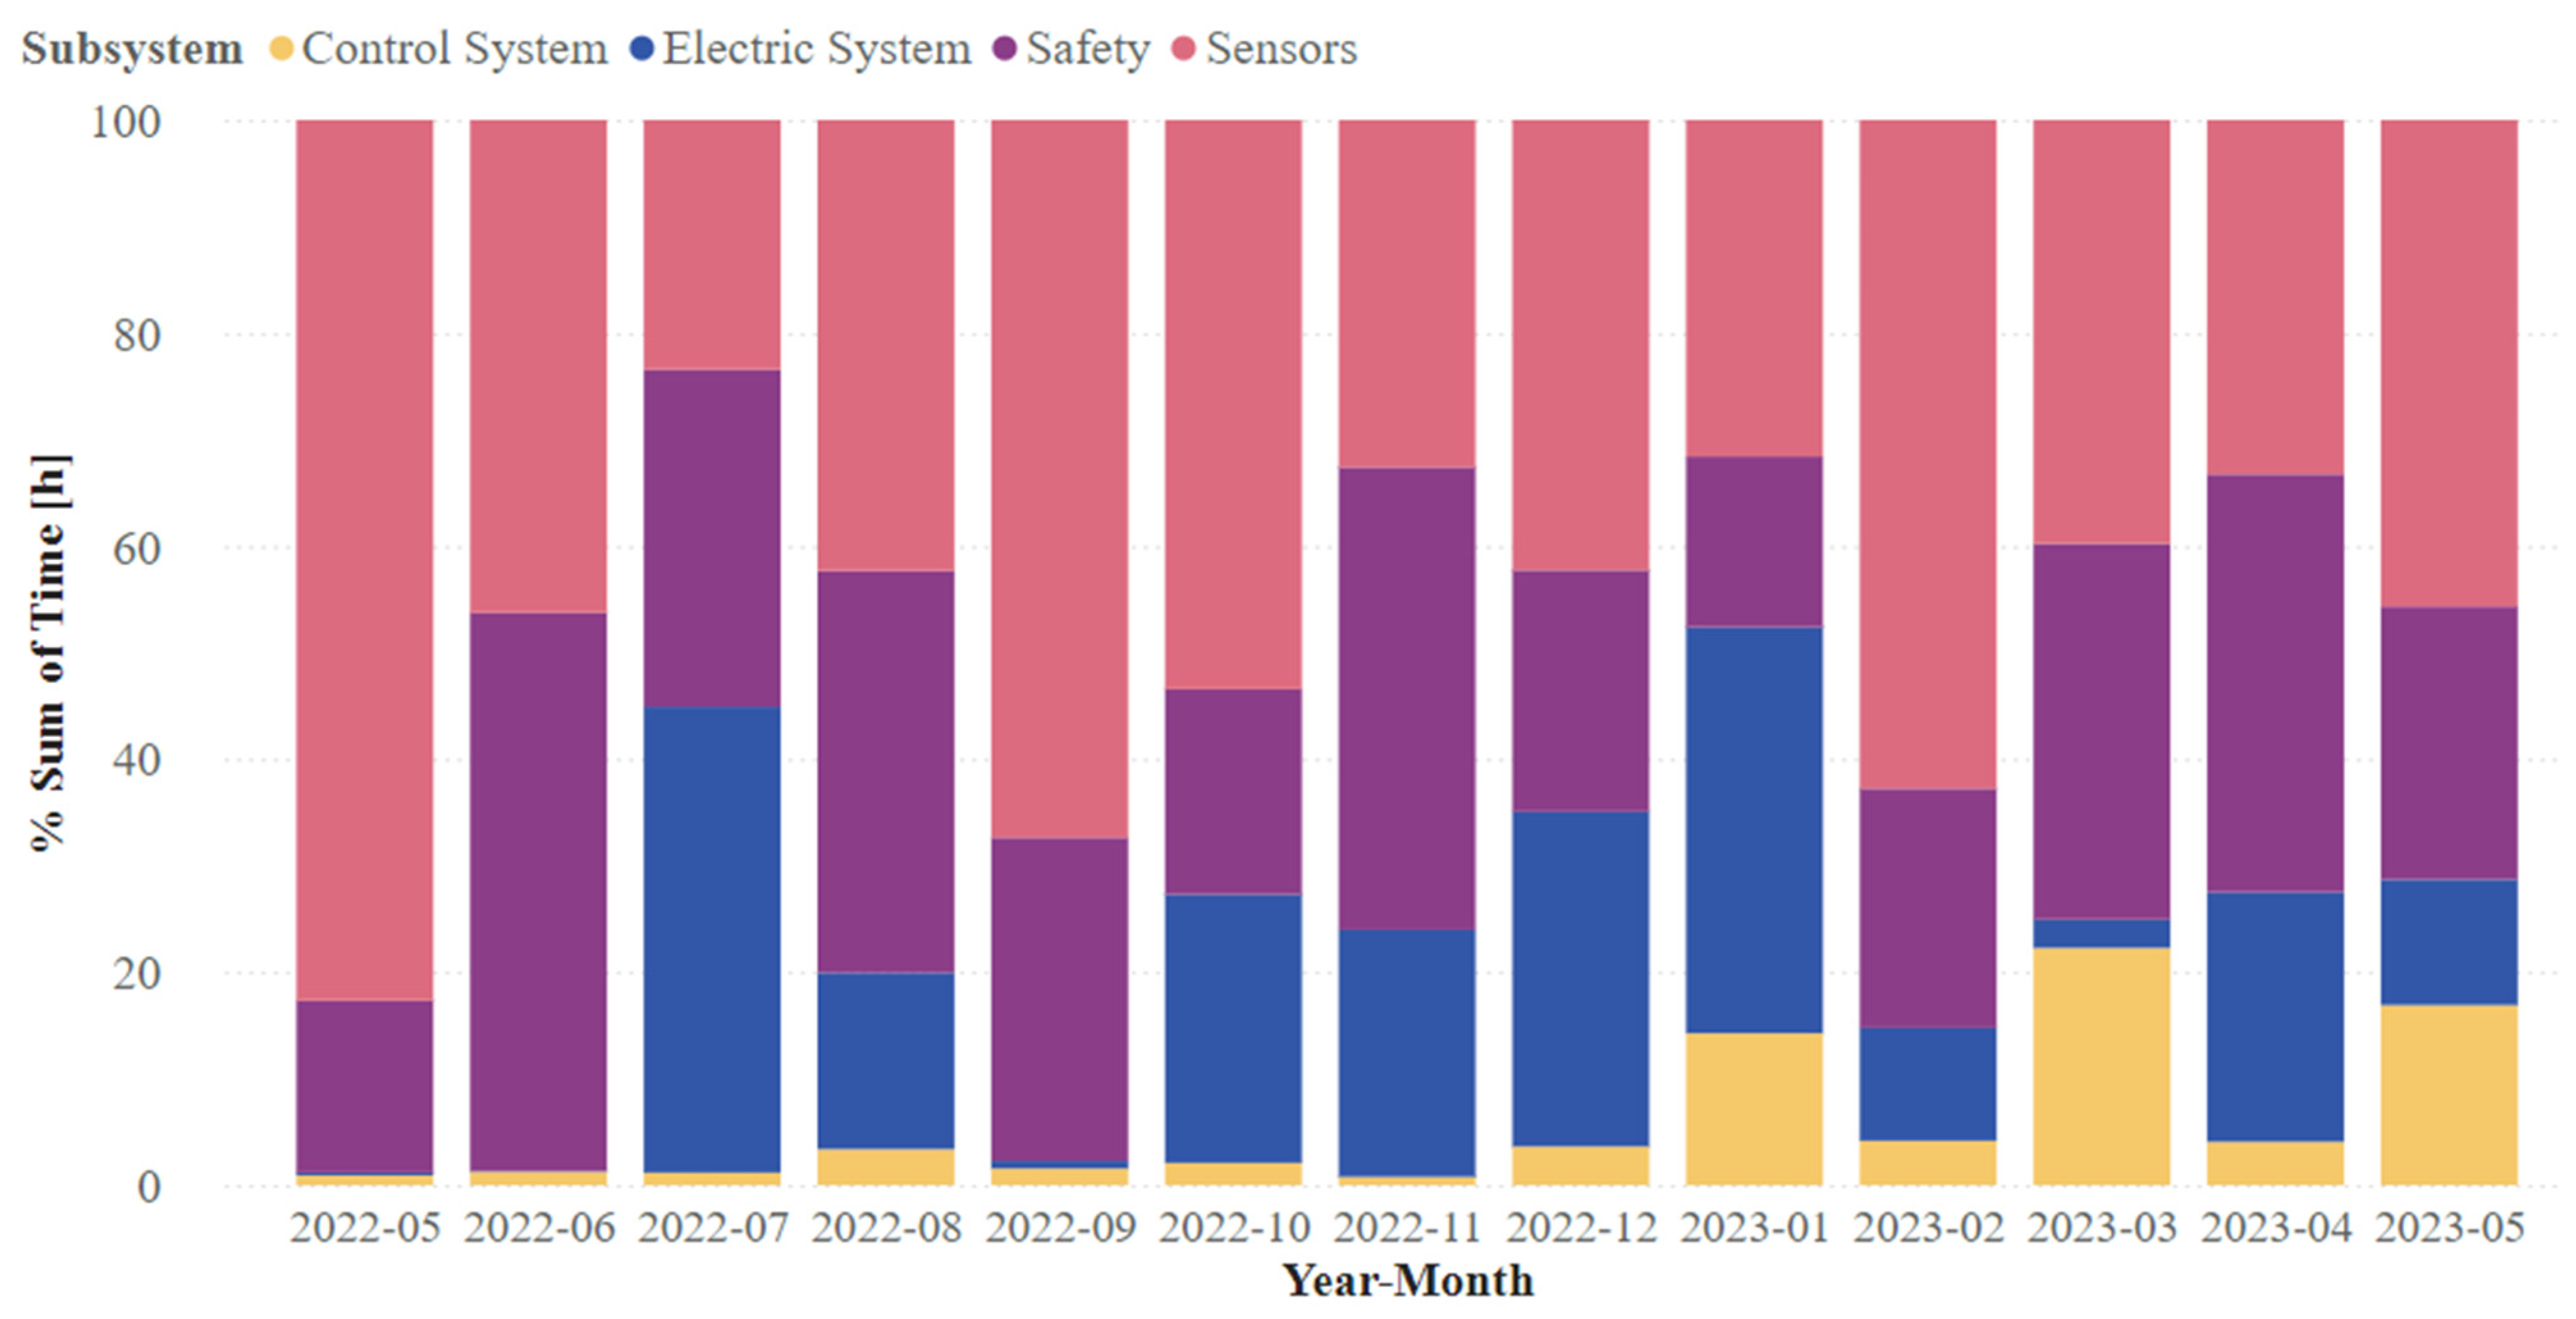
Figure 10, using the total activity rates for each independent month of the wind turbine status, omitting the other subsystems. The analysis is shown in
Figure 11.
The enormous variability that exists in these four subsystems can be appreciated, although the Sensors subsystem generally prevailed, except in June, November, January, and April, where it was surpassed by Safety. It was in July and January that a preponderance of the Electric System subsystem was seen, and, although the Control System did not prevail over the rest of the critical subsystems, it did prevail over the other omitted subsystems. All this depends on the relevance of the time in which the alarms were active, independent of the state of the WTGs. These four subsystems are the ones that should be reviewed more thoroughly in a transversal way with the maintenance team, as well as with the technologists producing the machines, to confirm the root causes and review the most viable solution. For confidentiality reasons, the analysis of the alarms cannot be shown, but it is analogous to that of the subsystems. In fact, it is possible to use the same graphical tool to obtain the most critical alarms, either for each subsystem or for all four critical subsystems simultaneously. If necessary, it can be filtered by critical alarm to confirm which wind turbines were most affected by it. Of the most significant alarms of these critical subsystems, the following can be mentioned: incorrect emergency speed, cup anemometer failure, UPS failure, mains voltage failure warning, and vane failure warning.
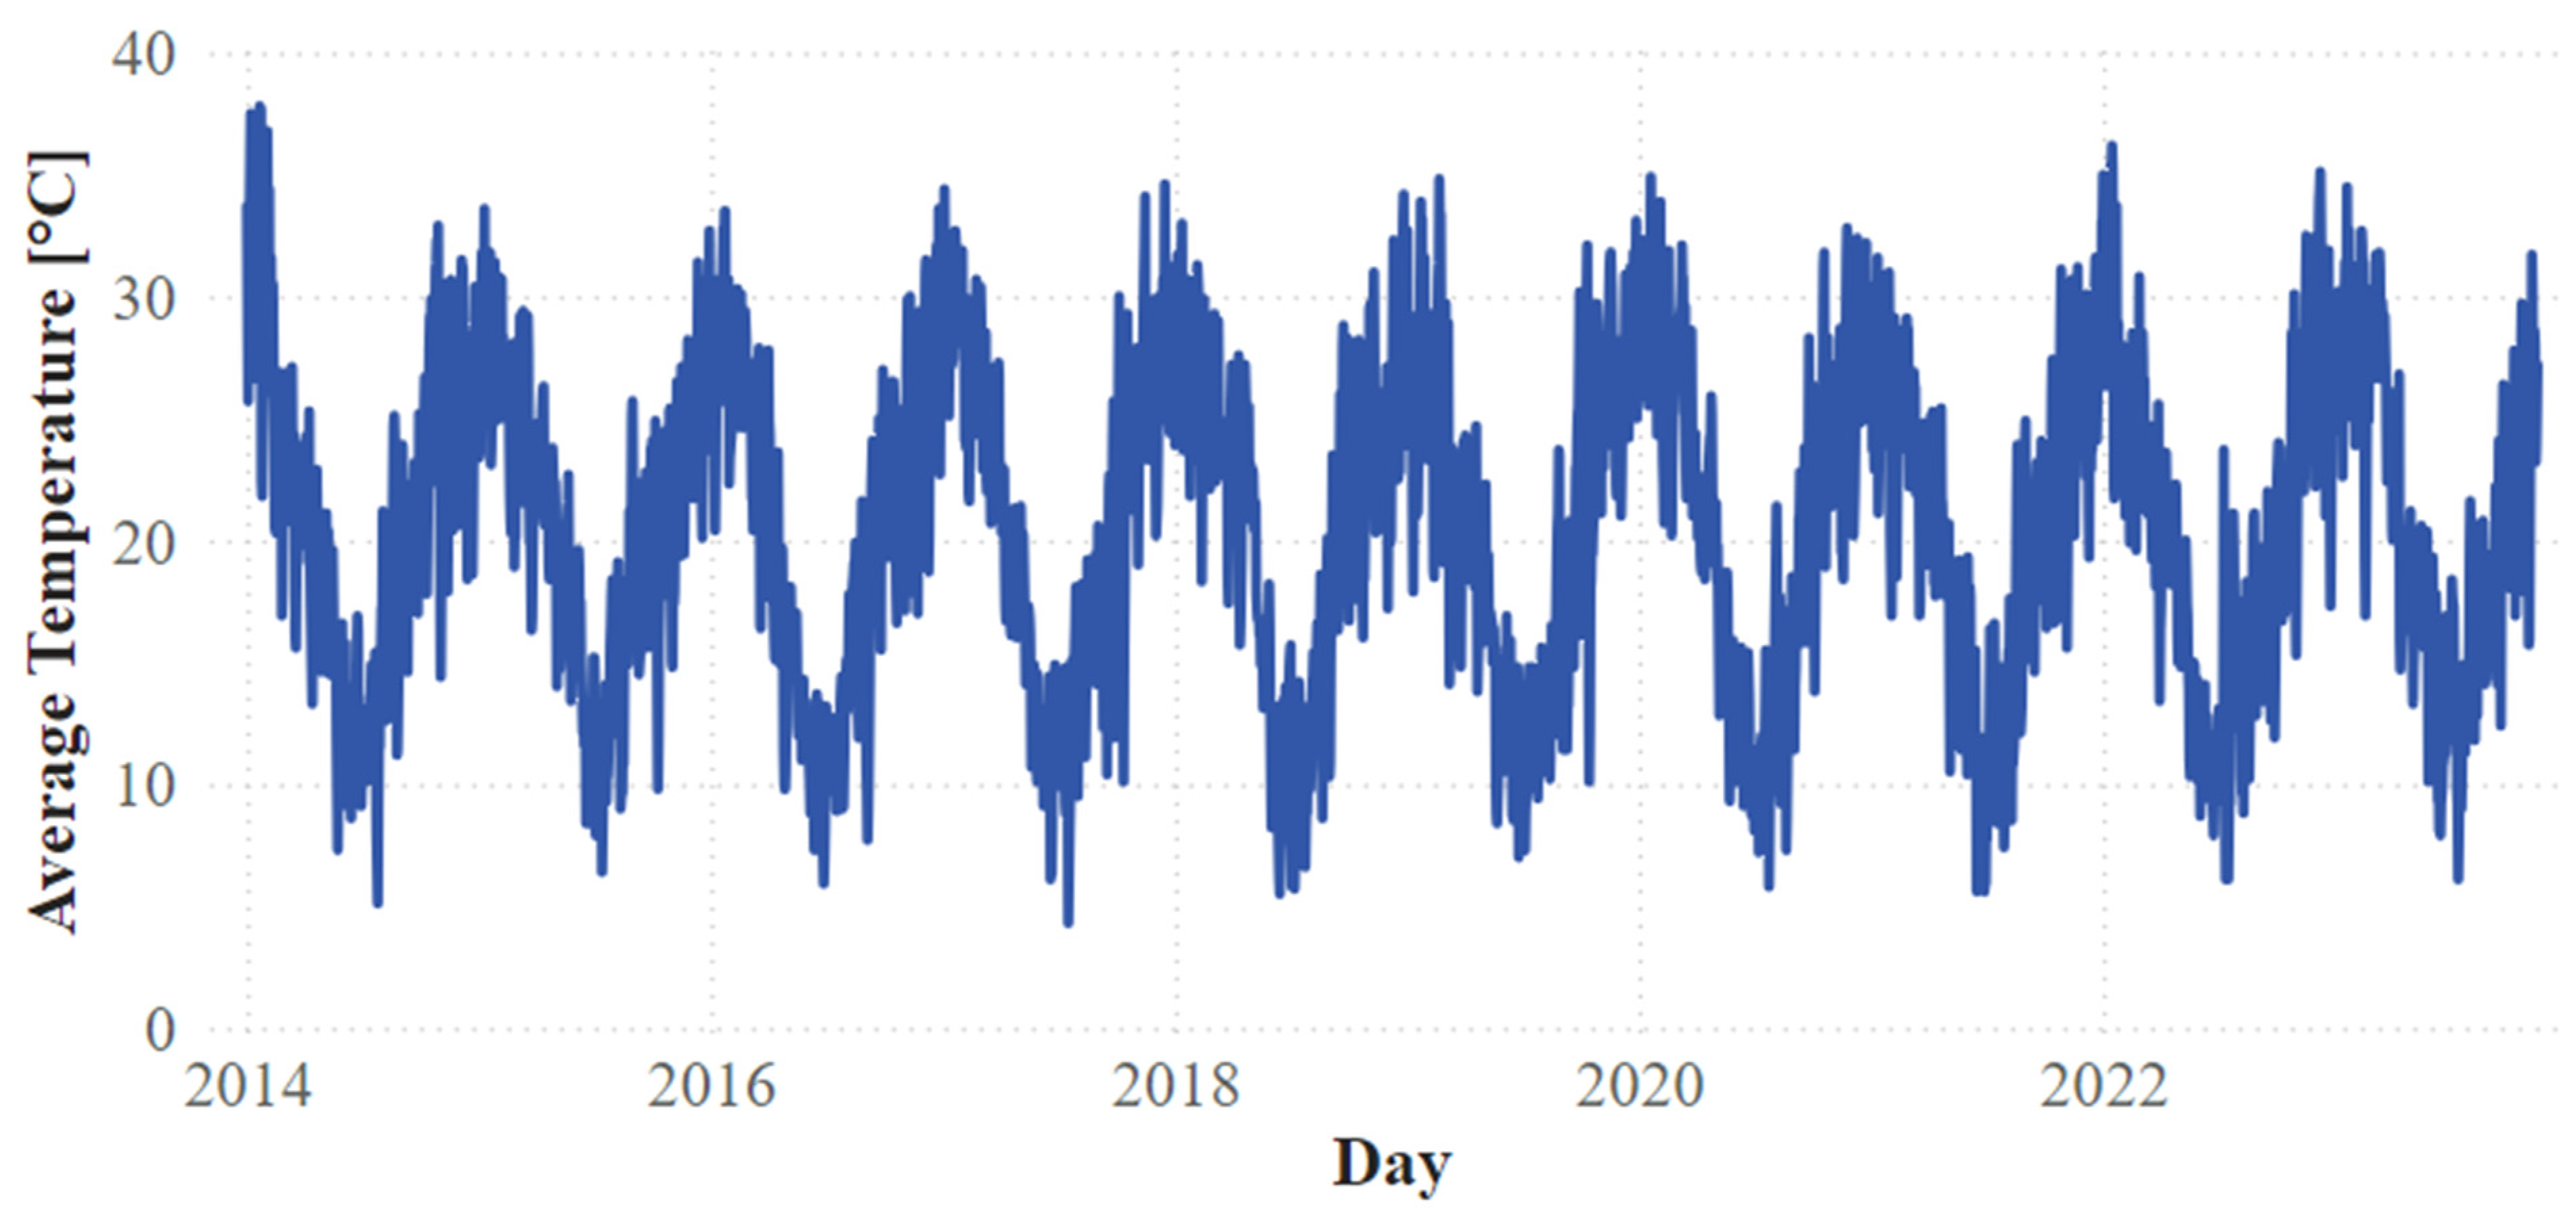
The last aspect of the results also includes an alternative analysis of the environmental aspects where the wind farm is located to show that the process can be adapted to a specific need. This was done using the values of maximum, minimum, and average temperatures, which can be integrated into the SCADA database according to the day of the record. Therefore, the aim is to confirm whether there is a direct relationship between the alarms and the temperature and whether it leads to considerable downtime. For this purpose,
Figure 12 shows the behavior of the average temperatures that have occurred in the history of the last 10 years.
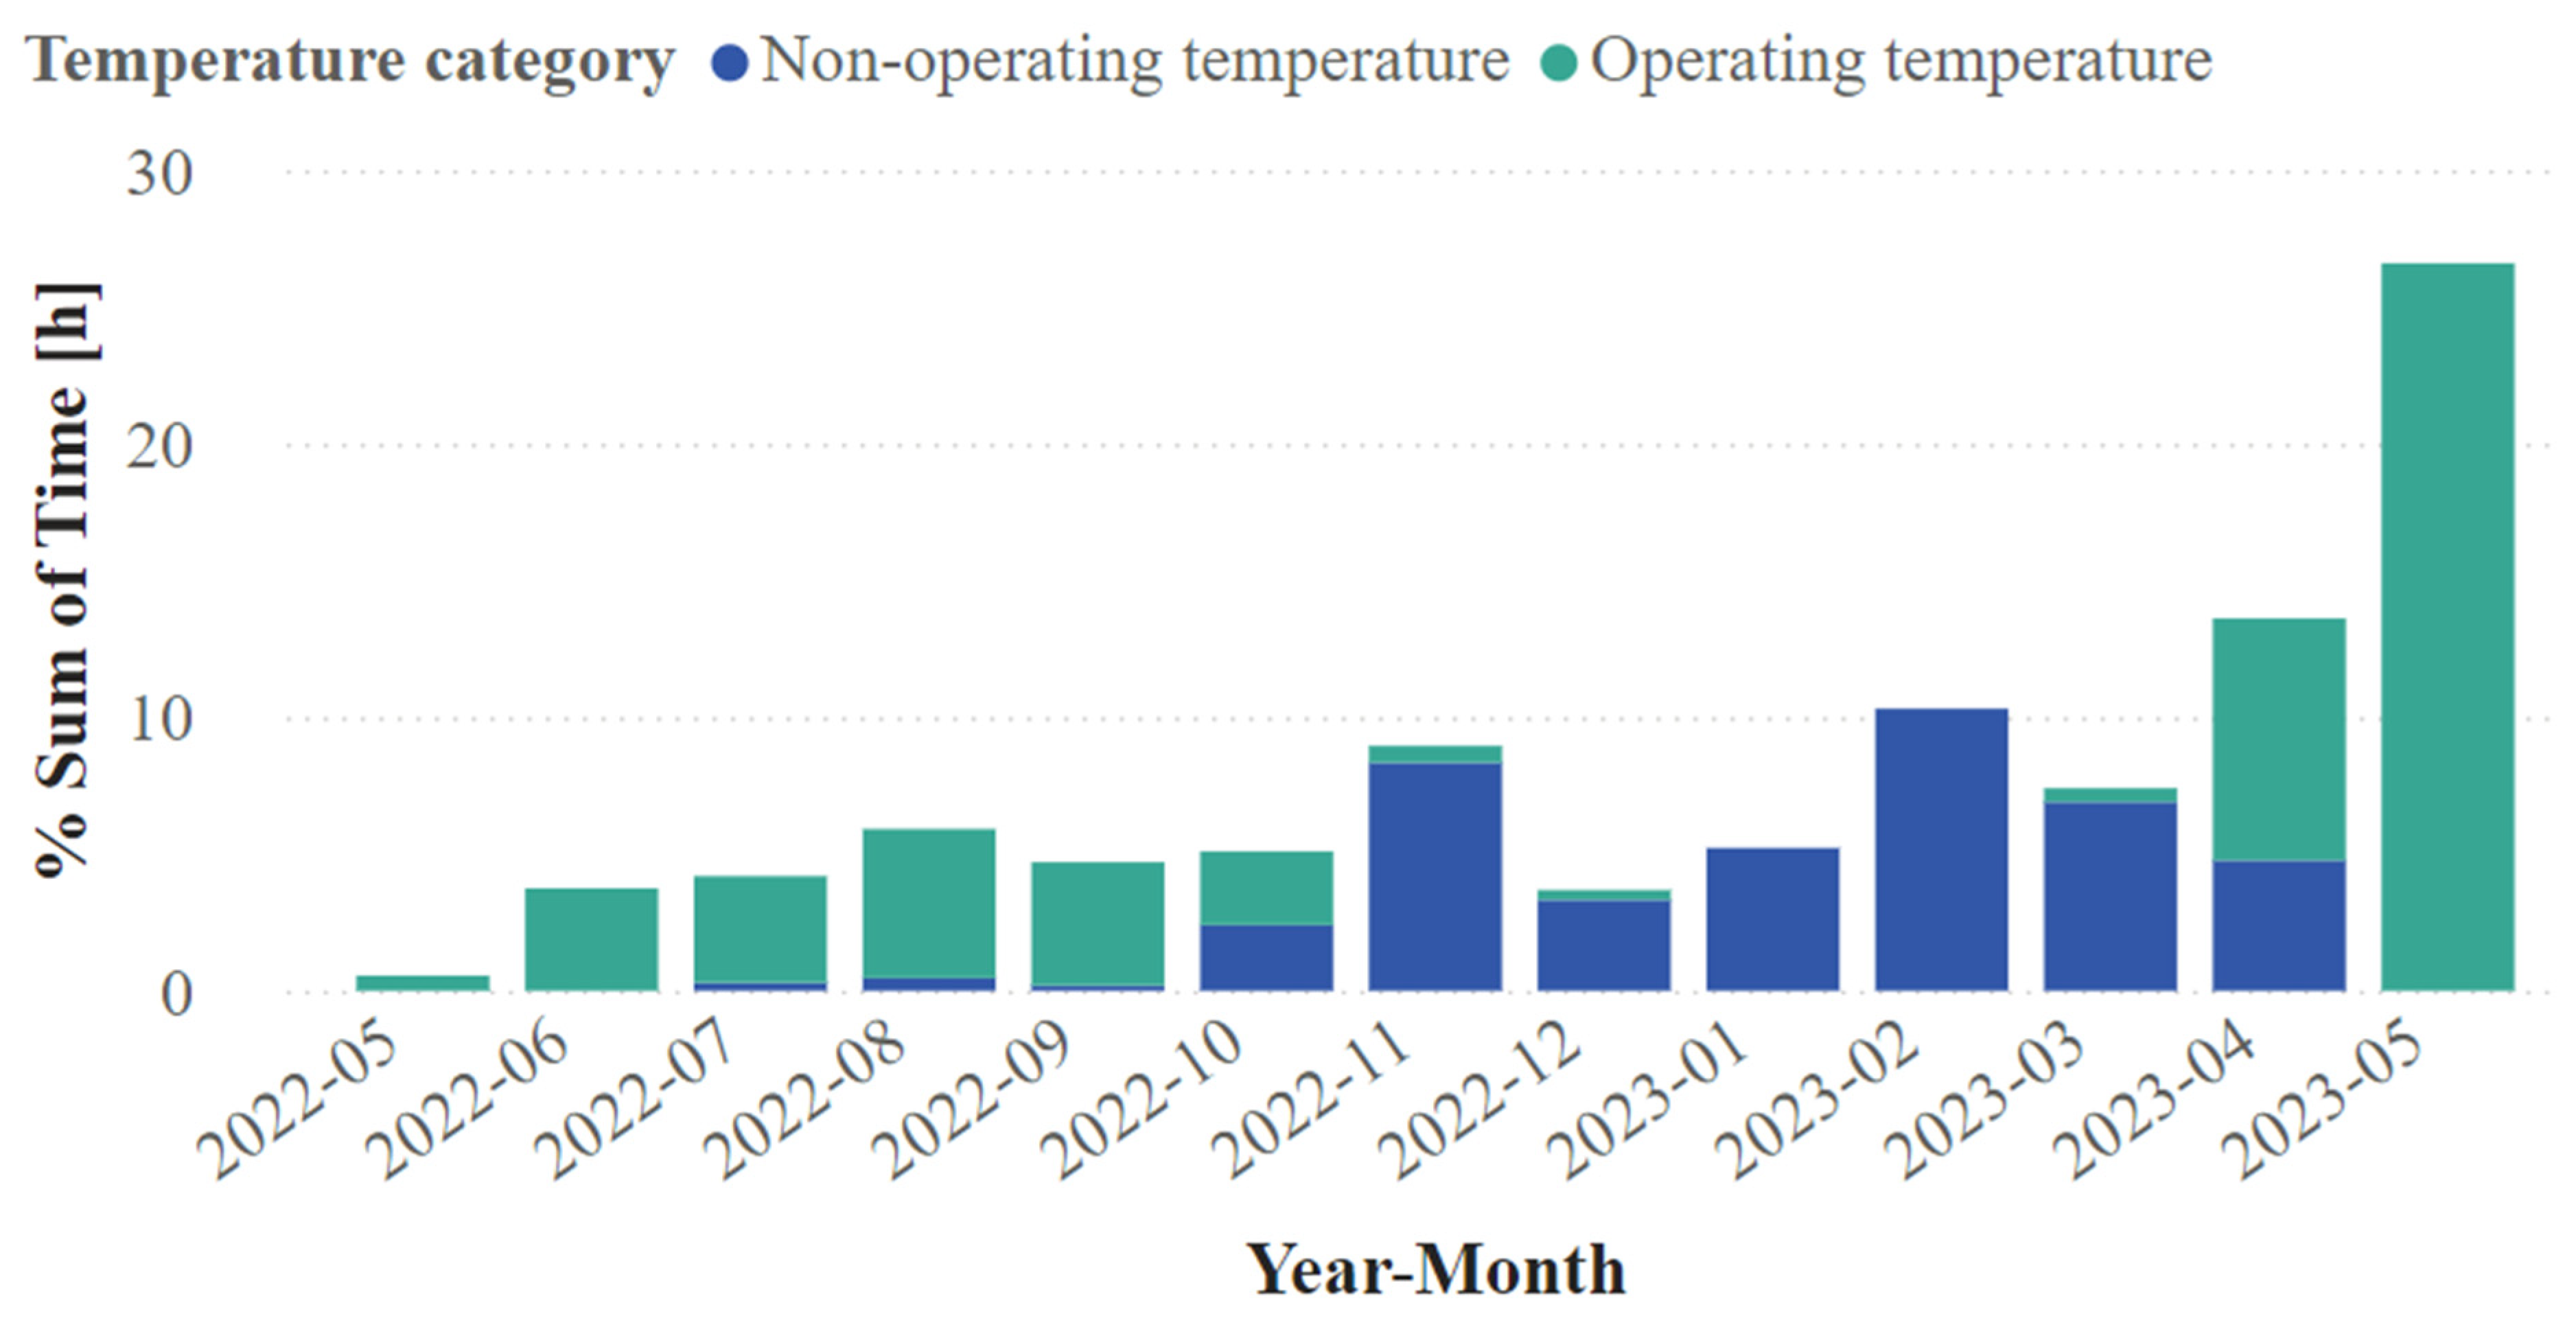
It is possible to visualize how the cycles of the seasons of each year have been followed in the wind farm, and there are no major anomalies. However, extreme values that are outside the normal range in which the WTG operates can be noted. Since it is complicated to combine the look with the chosen cluster, the criteria of the maximum and minimum temperatures of each day of the studied period will be used. If any of them are outside the normal range, the data will be simplified by categorizing the day as a day with a non-operational temperature, assuming it affected the whole day. This effect is shown in
Figure 13.
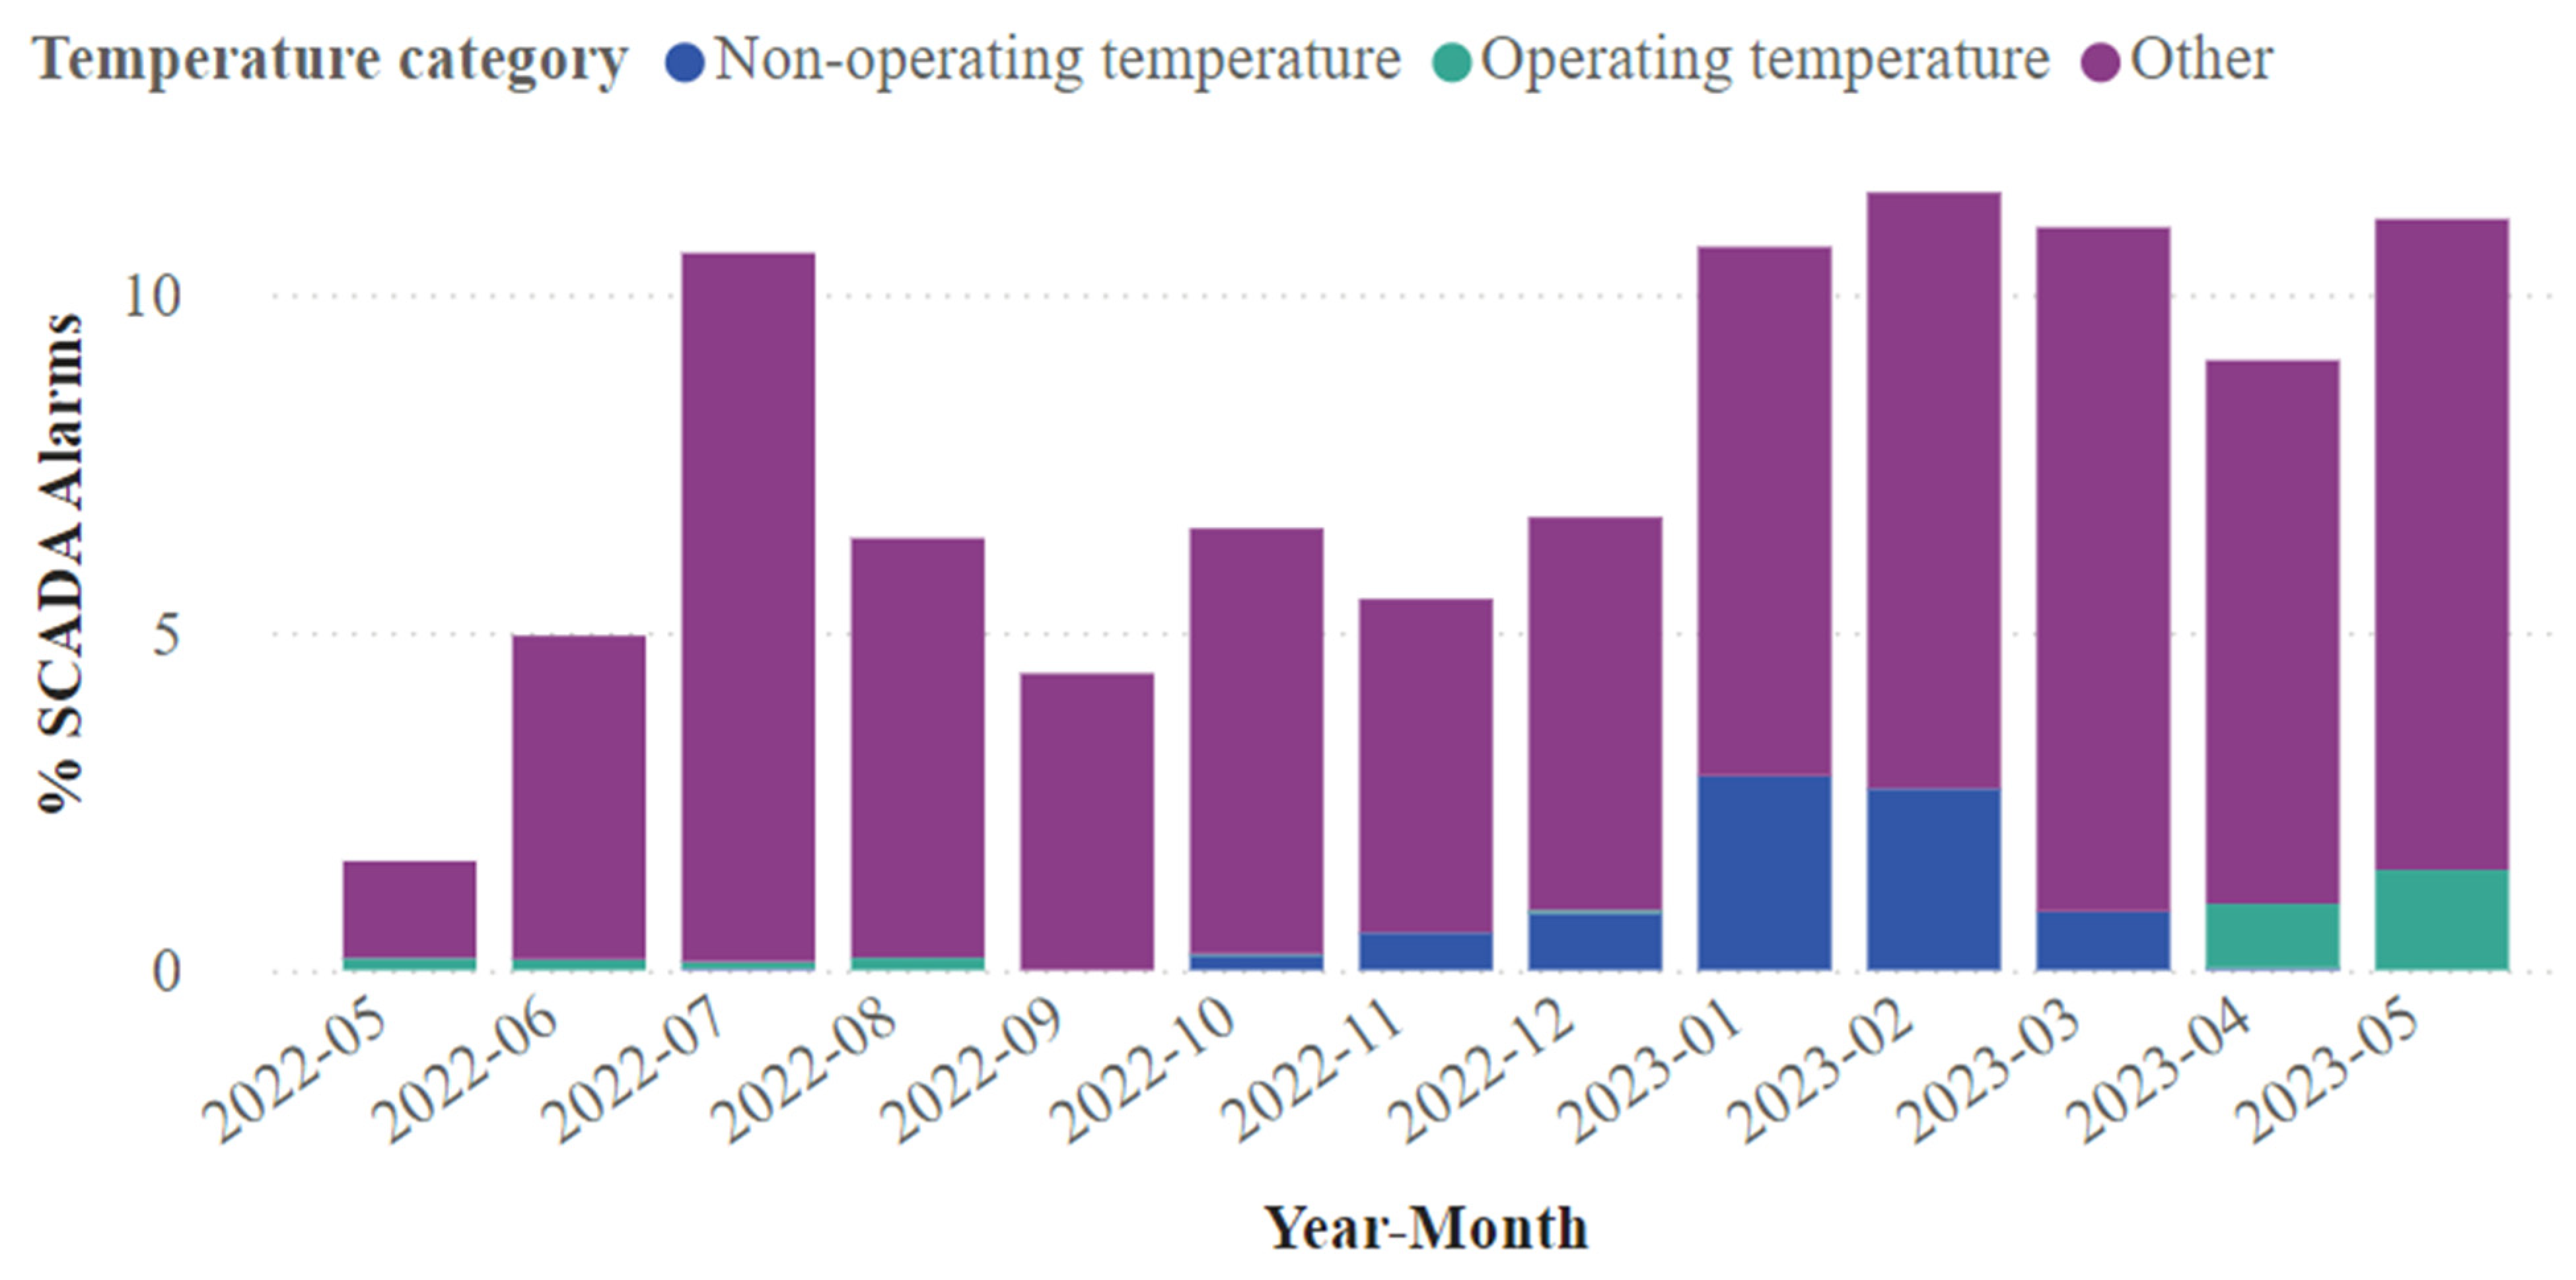
Under this pessimistic premise, temperature can be seen to have a direct impact on the downtime plotted. We can note that some months were practically categorized with downtime only on days when there were extreme temperatures. This is generally the case from October to March and a part of April. However, it should be noted that the alarms reported on those days were not necessarily related to temperature. Therefore, to study this more precisely, in the SCADA alarm rates, the name “Other” was added to this categorization when the alarm was not related to temperature. The results are expressed in
Figure 14.
With this new categorization, it can be noted that non-operational temperatures may have affected the downtime from October to March. However, it is not possible to say for sure since most of the reported alarms were related to other reasons. This could be reviewed in more detail by integrating the temperature records for each SCADA alarm and not just for each day. Consequently, it will be important to first review the critical subsystems in greater depth, confirming, for example, which alarms had the longest activation time and incidence. This should be complemented with the wind farm records and with the technical staff to have more accurate conclusions about the entire process.
It is important to highlight the application of the methodology in obtaining the results and that, for each assumption that was made, the implications are clear in the analysis. In comparison to the literature, it is possible to reconfirm the importance of the definition of the subsystems and that, in this specific case, Sensors is one of the surprises of this study. In fact, one of the most urgent recommendations that can be mentioned is a revised consideration of the wind vanes of all WTGs.

