Article

A High-Speed Train Axle Box Bearing Fault Diagnosis Method Based on Dimension Reduction Fusion and the Optimal Bandpass Filtering Demodulation Spectrum of Multi-Dimensional Signals

1
School of Mechanical Engineering, Dalian Jiaotong University, Dalian 116028, China
2
CRRC Changchun Railway Vehicles Co., Ltd., Changchun 130062, China
3
State Key Laboratory of Rail Transit Vehicle System, Southwest Jiaotong University, Chengdu 610031, China
*
Author to whom correspondence should be addressed.
Machines 2024, 12(8), 571; https://doi.org/10.3390/machines12080571
Submission received: 24 July 2024 / Revised: 12 August 2024 / Accepted: 16 August 2024 / Published: 19 August 2024

Abstract

:
The operating state of axle box bearings is crucial to the safety of high-speed trains, and the vibration acceleration signal is a commonly used bearing-health-state monitoring signal. In order to extract hidden characteristic frequency information from the vibration acceleration signal of axle box bearings for fault diagnosis, a method for extracting the fault characteristic frequency based on principal component analysis (PCA) fusion and the optimal bandpass filtered denoising signal analytic energy operator (AEO) demodulation spectrum is proposed in this paper. PCA is used to measure the dimension reduction and fusion of three-direction vibration acceleration, reducing the interference of irrelevant noise components. A new type of multi-channel bandpass filter bank is constructed to obtain filtering signals in different frequency intervals. A new, improved average kurtosis index is used to select the optimal filtering signals for different channel filters in a bandpass filter bank. A dimensionless characteristic index characteristic frequency energy concentration coefficient (CFECC) is proposed for the first time to describe the energy prominence ability of characteristic frequency in the spectrum and can be used to determine the bearing fault type. The effectiveness and applicability of the proposed method are verified using the simulation signals and experimental signals of four fault bearing test cases. The results demonstrate the effectiveness of the proposed method for fault diagnosis and its advantages over other methods.

1. Introduction

The axle box bearing is one of the important components of high-speed train bogies [1], and its operating state is crucial to the safety of the train. The type of axle box bearing is mostly a rolling bearing. With an increase in operation time, pitting and peeling may form between the contact surfaces of various components inside the bearing. With the relative rotation between components, repetitive pulse impacts are generated. In an ideal situation, these pulse impacts are periodic, but in an actual situation, some additional impacts and disturbances are often pseudo-cyclostationary, such as the vibration impact between train wheels and rails and the randomness of relative sliding between bearing components, which increase the uncertainty of vibration changes, reduce the signal-to-noise ratio (SNR) of the signal [2], and lead the vibration acceleration change in the bearing to be pseudo-cyclostationary. It is often difficult to extract characteristic frequencies directly by Fourier transform [3]. Therefore, it is necessary to carry out research on the signal model and signal processing method of bearings and reduce the interference of irrelevant signals through various methods, improve the proportion of periodic impact components in the signal, and make it easier to extract the fault frequency of bearings.
The signal processing methods of bearings can be divided into time-domain, frequency-domain, and joint time–frequency-domain methods. Some scholars have established time-domain signal characteristic indicators, such as the sparsity impact measure index (SIMI) [4], multiscale symbolic dynamic entropy (MSDE) [5], and some representative statistical metrics in the time domain [6]. In the study of frequency-domain signal processing methods, there are also novel methods, such as the amplitude modulation bispectrum [7] and product envelope spectrum optimization-gram [8]. Some joint time–frequency-domain methods, such as the time–frequency spectral amplitude modulation method [9] and the novel time–frequency modulation bispectrum [10], have also achieved good results in bearing fault diagnosis. Some researchers have also studied signal denoising decomposition algorithms, such as adaptive mode decomposition, the improved morphological filtering algorithm, the blind deconvolution algorithm, etc., which provide novel and effective solutions for the research of the bearing fault diagnosis method, and also lay a solution foundation for the proposed fault diagnosis method in this paper.
With the development of bearing monitoring technology and the improvement of safety monitoring requirements for mechanical systems, the fault diagnosis method based on a single signal has gradually developed into multi-signal fault diagnosis methods and research on bearing fault diagnosis based on multi-signal fusion has also increased. During actual operation, the axle box bearing is subjected to vibration and impact from multiple directions, including lateral, longitudinal, and vertical directions between the wheel and rail, resulting in complex spatial curves for the motion trajectories of the internal components of the bearing. The vibration acceleration of the bearing is not a single-direction signal, which needs to be decomposed in a three-dimensional coordinate system to completely represent the vibration condition of the bearing. Therefore, the bearing signal collected by the triaxial accelerometer is more comprehensive, and how to reasonably use the fusion of three-dimensional vibration acceleration signals and other multivariate signals to improve the accuracy of bearing fault diagnosis has become a research hotspot [11]. Multi-signal data fusion can be divided into data-level, feature-level, and decision-level fusion [12]. The fusion based on the data level focuses more on the physical attributes of the signal itself and the external interference to the signal can be reduced by the weighting, linear combination, the Kalman filter [13] and other methods. The fusion of the feature level pays more attention to the extraction of signal features [14], which can be obtained from different physical data through continuous dimension reduction and fusion. The fusion of the decision level focuses on the role of probability in multi-decision fusion, such as the use of the Dempster–Shafer (DS) information fusion theory [15] and generalized methods [16] in fusion.
In the processing of multi-dimensional signals, such as three-dimensional vibration acceleration [17], various multi-dimensional signal analysis methods have been widely used in bearing fault diagnosis, such as bivariate empirical mode decomposition (BEMD) [18], trivariate empirical mode decomposition (TEMD) [19], multivariate empirical mode decomposition (MEMD) [20], noise assisted multivariate empirical mode decomposition (NA-MEMD) [21], multivariate variational mode decomposition (MVMD) [22], multivariate complex modulation model decomposition (MCMMD) [23], multivariate local characteristic-scale decomposition (MLCD) [24], and other methods. These types of decomposition methods can achieve synchronous correlation analysis of multi-signals, map the signal to the multi-dimensional space hypersphere direction vector, obtain the envelope lines in various directions, and then perform feature extraction. They integrate the fusion of the data level and the feature level and play a role in promoting the research into using multivariate signals for fault diagnosis. However, this type of method often takes a long time in obtaining ideal computational results. Principal component analysis (PCA) is a commonly used method for fast data dimension reduction, and it is also used in signal fusion [25]. Shahdoosti et al. [26] proposed an optimal filter using the PCA fusion method for image fusion, which improved the quality of the image. Mochammad et al. [27] used PCA to fuse the characteristics of bearings in multiple time windows and established a standard for detecting the degradation performance of bearings. Bashir et al. [28] used stationary wavelet transform (SWT) and PCA to fuse image input by multiple sensors, and the results showed that PCA had a better effect on image inputs with different brightness levels.
PCA is mostly used for image fusion and feature dimensionality reduction in neural networks and is rarely used in data-level fusion algorithms. Therefore, PCA is used to fuse multi-dimensional data in the data level in this paper, the filter bank is used to filter the fused signal to highlight the periodic pulse impact component, and the fault frequency of the signal is extracted by demodulation.
The remaining sections are as follows. Section 2 introduces the signal processing methods used in this paper and proposes improved average kurtosis and a dimensionless characteristic index for selecting the optimal signal. Section 3 is the simulation signal analysis of the simulation signal to verify the effectiveness of PCA fusion and the effectiveness of the proposed method process for the simulation signal with the inclusion of prior knowledge. Section 4 is the experimental signal analysis, and the fault diagnosis method is verified by four fault-bearing cases experimental signals collected by an axle box bearing test rig. Section 5 presents the conclusions of this paper.

2. Theoretical Background and the Proposed Method

Bearings often produce vibrations in multiple directions during operation. The vibration data are highly nonlinear and often contain strong noise [29]. In order to comprehensively and accurately evaluate the operating state of bearings, a method for bearing fault diagnosis by comprehensively using a three-directional vibration acceleration signal is proposed in this paper.

2.1. PCA Data Fusion Denoising Method

In statistics, PCA is a technique to simplify data sets by using linear transformations to represent the original high-dimensional data with new coordinate coefficients, arranged in order of data variance size and dimensionality reduction [30]. The purpose of PCA is to find a new set of orthogonal bases that maximize the distance between data after projecting multi-dimensional signals onto the plane formed by the orthogonal bases; the similarity between the multi-dimensional signals is maintained as much as possible, and the components with weak correlation are gradually removed. The maximum amount of original information is preserved with the least number of dimensions.
In signal processing and analysis, the signal containing periodic impulses often has a relatively large variance, while interference noise has a small variance. In order to make the signal obtain a higher SNR and reduce the interference of noise, the PCA dimension reduction method can be used to extract a new signal with a large variance as the optimized signal to achieve the purpose of noise reduction.
The PCA algorithm is illustrated with the example of reducing a two-dimensional array to a one-dimensional array.
The two-dimensional array X is as follows:
X = x 1 , 1 x 1 , 2 x 1 , 3 x 1 , n x 2 , 1 x 2 , 2 x 2 , 3 x 2 , n
To simplify the calculation of variance in subsequent processes, each dimension of X can be removed from the mean value to make the mean of each dimension equal to 0.
It is hard for a two-dimensional array to contain all the data points on a straight line, and the two-dimensional coordinate system always has its own orthonormal basis. The data points can be described as linear combinations of orthonormal bases in the coordinate system. The variance of the projection of matrix X onto the orthogonal basis u1 is as follows:
V a r 1 = 1 n i = 1 n x i   T u 1 2 = u 1   T 1 n i = 1 n x i x i   T u 1 = 1 n u 1   T X X T u 1
where xi is the i-th column vector in matrix X, xi = [x1,i x2,i]T. Since n and XXT are constants, the above equation can be simplified as follows:
V a r 1 = u 1   T Q u 1
According to the concept of PCA, the u1 corresponding to the maximum Var1 needs to be solved. The constrained problem can be solved according to the Lagrange operator [31]:
V a r 1 = u 1   T Q u 1 s . t . u 1   T u 1 = 1
The extremal function is constructed as follows:
F u 1 = u 1   T Q u 1 + λ 1 u 1   T u 1
When F u 1 = 0 , the above equation can be simplified as follows:
Q u 1 = λ u 1
Therefore, the key step in the process of solving PCA dimensionality reduction fusion is to solve the eigenvalues and eigenvectors of Q [32], where Q is the covariance matrix of matrix X. The eigenvalues of the covariance matrix are sorted from large to small, and the corresponding number of eigenvalues can be selected for dimensionality reduction and fusion of the corresponding dimensions, and then the signal with higher SNR is obtained.
PCA, as a powerful data dimensionality reduction method, is able to transform multiple variables in the original data into a few principal components by linear transformations that are able to retain most of the information of the original data while removing noise. PCA achieves dimensionality reduction in the data by finding the directions of maximum variance in the data, using these directions as principal components. Therefore, the benchmark of the maximum variance direction will also be used as the benchmark of the subsequent signal dimension reduction fusion in this paper, so that the most relevant part of the signals can be retained.

2.2. Bandpass Filter Bank Signal Denoising Method

The collected signals are often accompanied by strong random pulse interference. The signal processing method, based on spectral kurtosis [33], is a relatively effective method for filtering and noise reduction, which is the process of signal filtering from different bandpass filters and selecting the signal corresponding to the optimal kurtosis value. In the case of complex signals, due to the sensitivity of kurtosis to single pulse impulses, the optimal bandwidth selected may likely lose information due to the extremely short bandwidth. Consequently, based on the processing method of spectrum kurtosis, an improved kurtosis index is adopted to avoid the interference of the single pulse impact component on the results in this section. In parallel, a more reasonable filter bank is established through the subsection processing of the whole frequency band, and the bandpass filtering of the signal is measured adaptively to extract the characteristic information.

2.2.1. FIR Bandpass Filter Bank

The filters of the filter bank are Finite Impulse Response (FIR) filters [34]. In order to balance the time resolution and frequency resolution of the signal after spectrum segmentation, the number of filters in the filter bank is determined according to the length of the original signal as shown in the following equation:
M = log 2 N 6
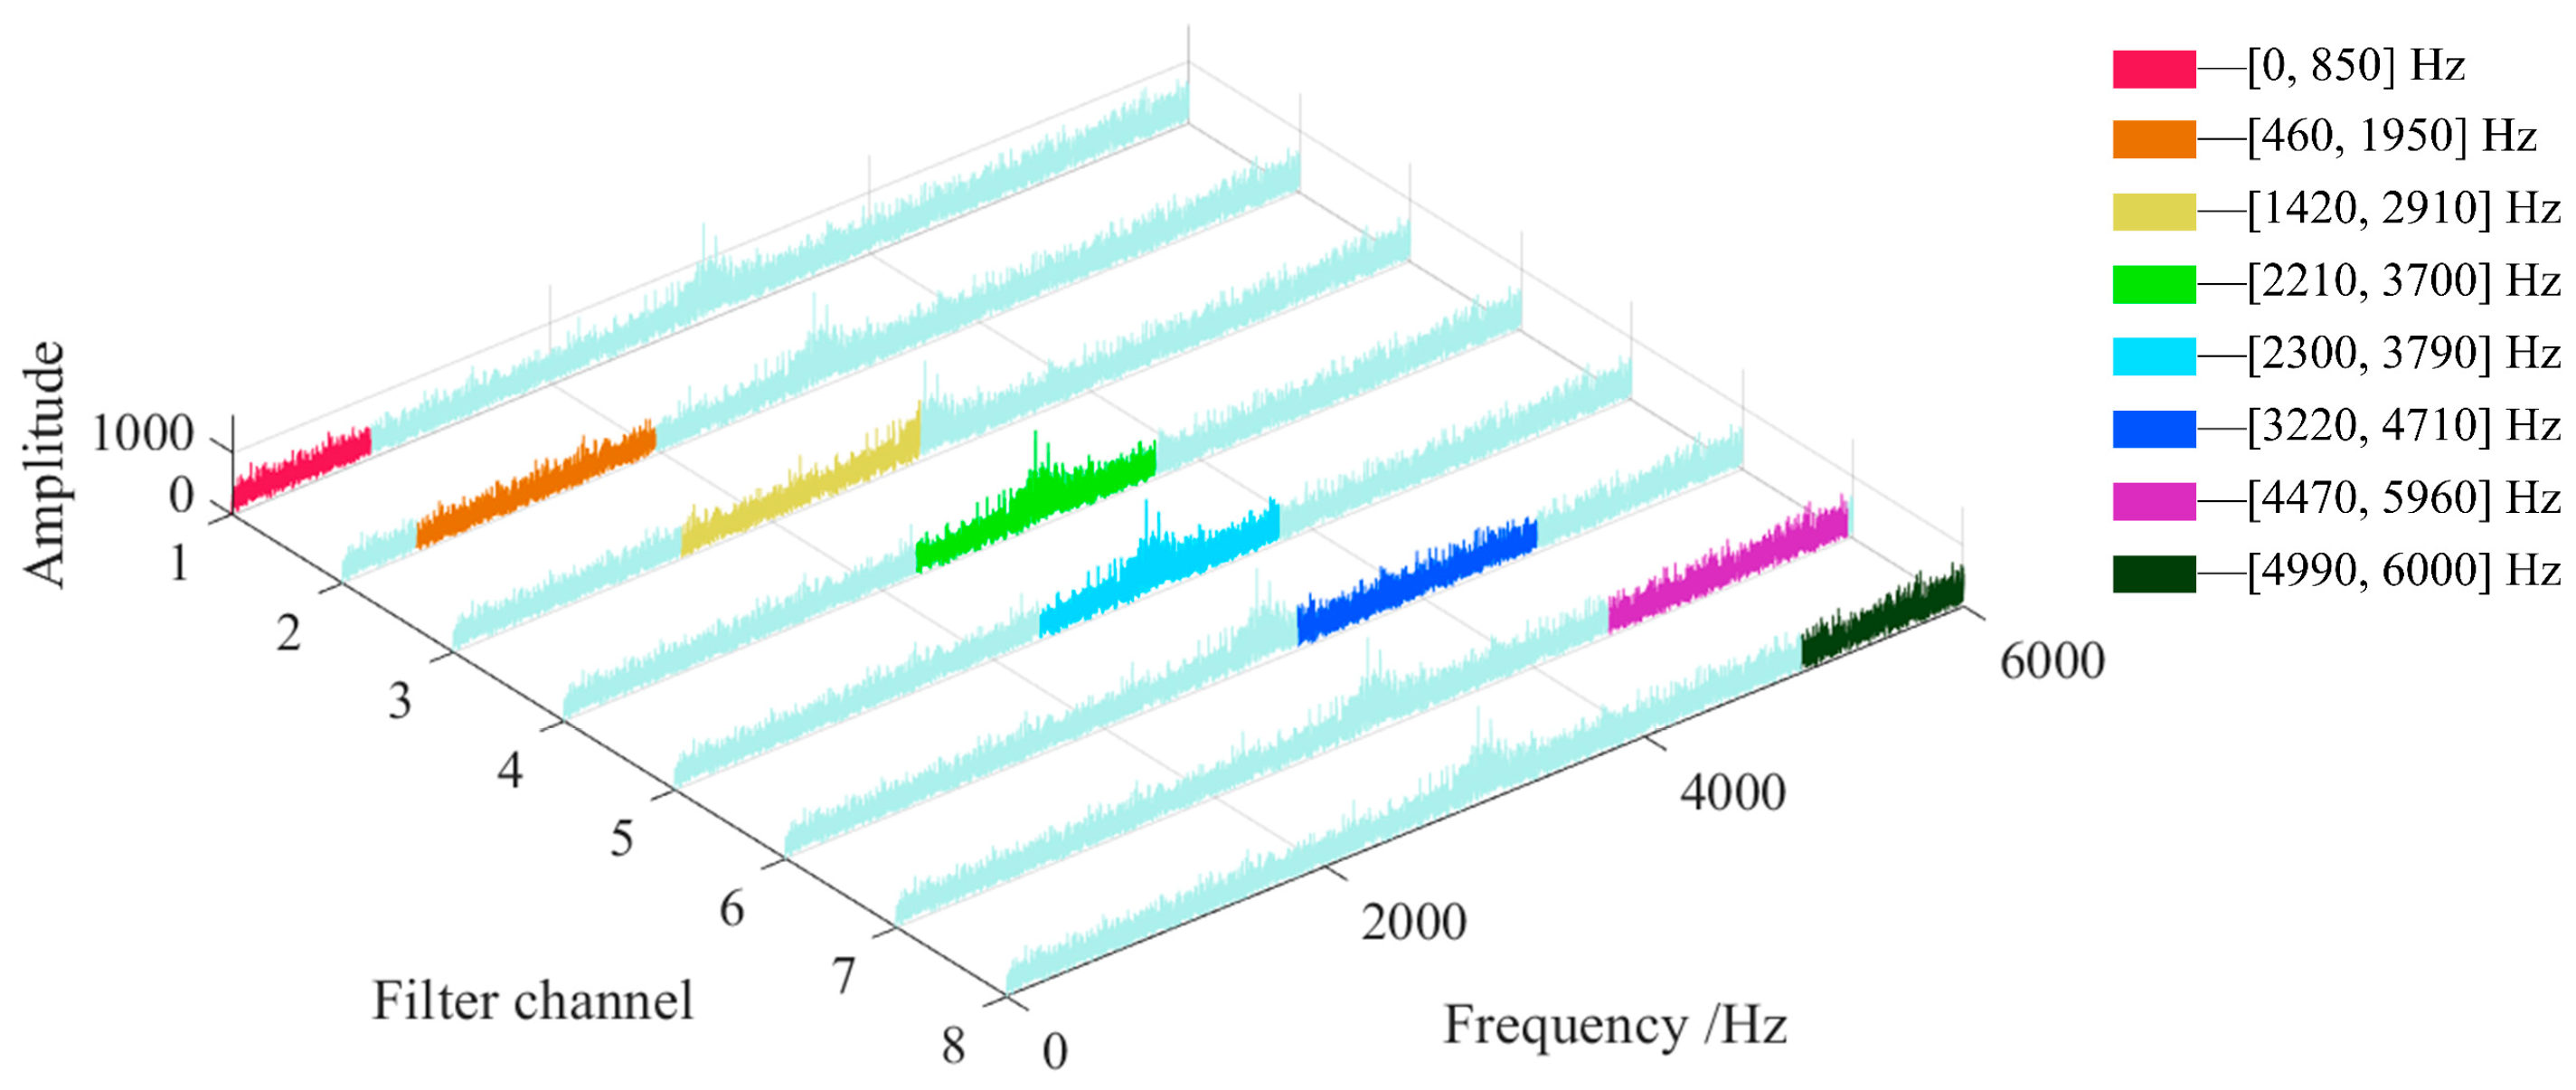
where M is the number of frequency domain segments, N is the number of original discrete signal sample points, and the calculation result is rounded down. If there is a discrete sequence of 18,000 sample points and the data sampling frequency is 12,000 Hz, the signal frequency spectrum can be divided into 8 components within the frequency range of 0–6000 Hz, and the frequency corresponding to the maximum amplitude in each component is taken as the center frequency of the bandpass filter. In order to cover the entire frequency range, the bandwidth length is twice the length of the frequency component, and the filter window function is selected as the Blackman window. The decomposition of the frequency bandwidth occupied by the individual bandpass filters of the signal in the frequency domain is shown in Figure 1.
In Figure 1, it can be seen that the lower-cut-off frequency and upper-cut-off frequency of each filtering channel are different, and the upper-cut-off frequency of the previous channel is larger than the upper-cut-off frequency of the next channel. After determining the center frequency, bandwidth and window function type of each filter, the filtered signal corresponding to different order filter coefficients can be calculated, and the optimal filtered signal under the filter can be selected as the output result. The different bandpass filters are arranged in order of increasing center frequency to form a multi-channel bandpass filter bank of the signal. The amplitude of the filtered signal of each bandpass filter is linearly scaled to the interval of [−1, 1], and the results are combined to form the final output of the FIR bandpass filter bank.

2.2.2. Improved Average Kurtosis

In order to avoid the interference of monopulse impact in the signal, a characteristic index named improved average kurtosis is proposed, as shown in Equation (8):
KT f i n a l = 1 z i = 1 z K i K min / K max
where KTfinal is the improved average kurtosis, K is the vector composed of the kurtosis of each component after dividing the original time-domain signal into z consecutive components, Kmin is the minimum value in K, and Kmax is the maximum value in K.
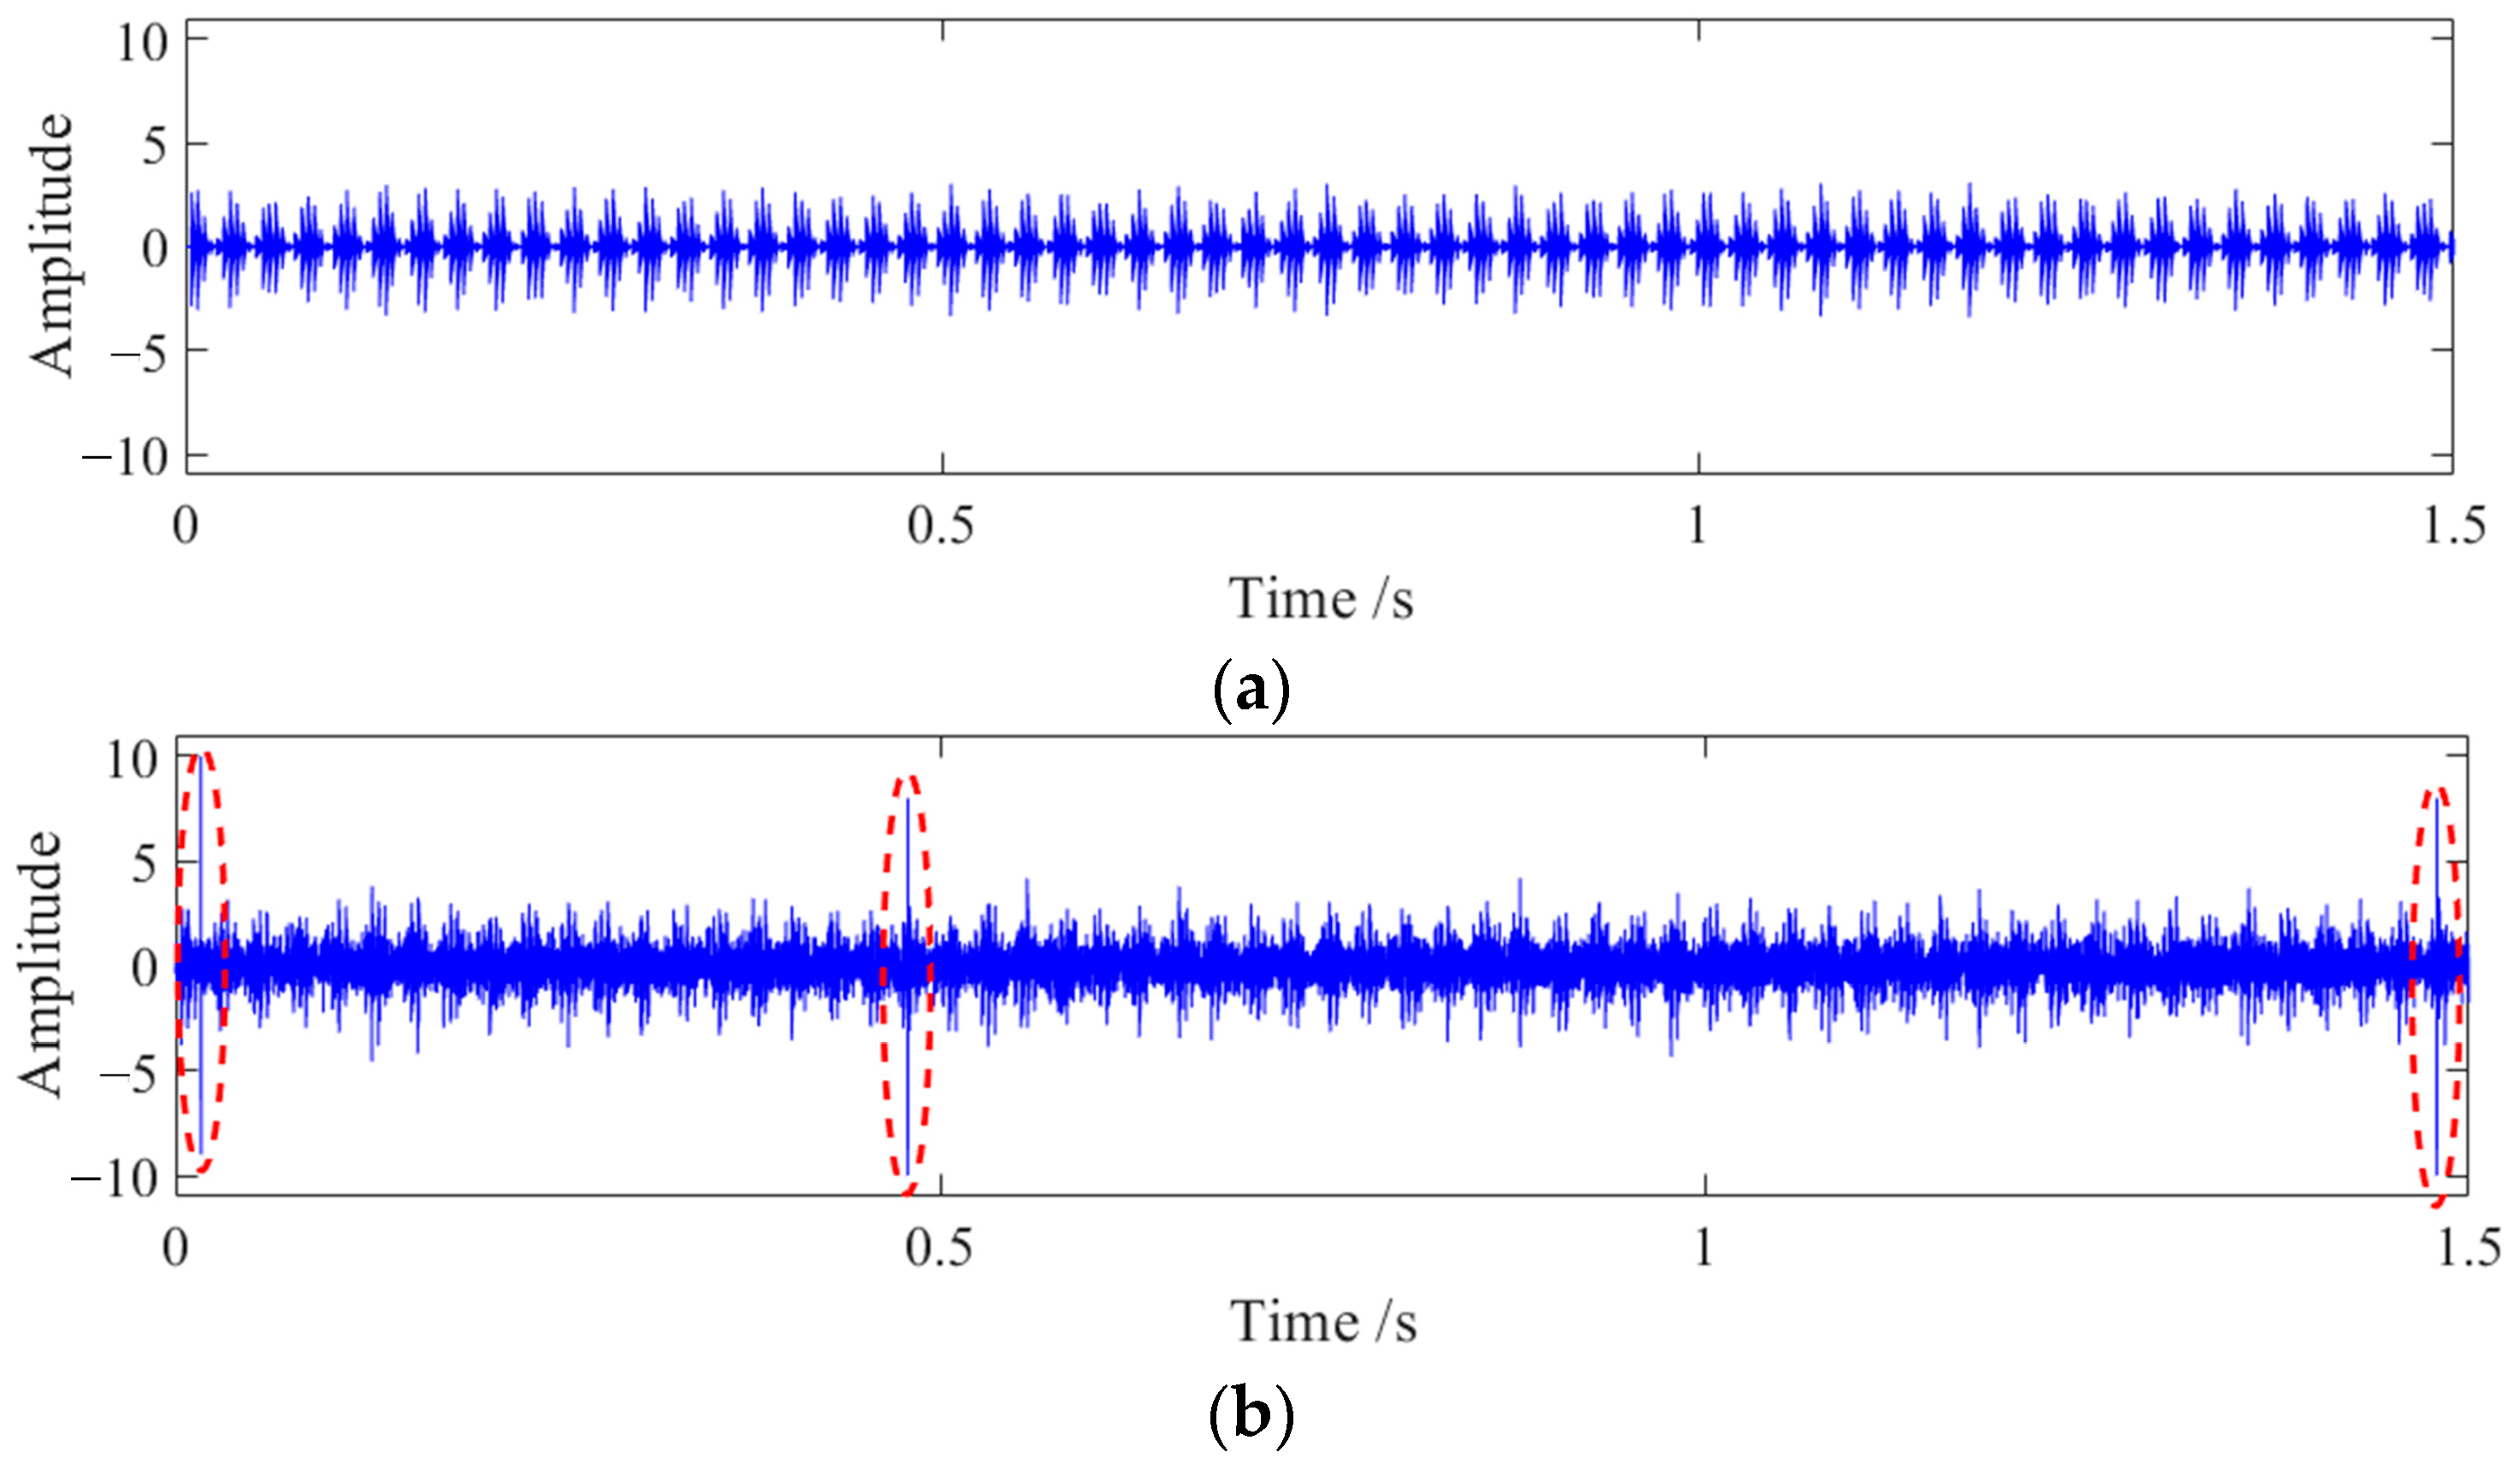
If there are a few single pulse impact components with large amplitude in the signal, these will have a significant impact on the calculation of the signal kurtosis, causing an abnormal increase in the kurtosis and affecting the judgment of the overall change in the signal. During the iterative filtering process of the signal, it is easy to cause an abnormal increase in the amplitude near the endpoint due to the continuous accumulation of endpoint values. If the kurtosis is used to select the optimal filtered signal, it is easy to produce a judgment with large errors. Two sets of signals are shown in Figure 2.
The signal in Figure 2a is a periodic amplitude-modulated signal without noise, while the signal in Figure 2b is a combination of the signal in Figure 2a with −5 dB of white Gaussian noise, and also contains three large amplitude monopulse signals. The kurtosis of the signals in (a) and (b) are calculated, and signals are divided into 10 components to calculate the improved average kurtosis KTfinal. The kurtosis of the signal in (a) is 6.5997, and the KTfinal is 5.2971. The kurtosis of the signal in (b) is 7.6692, and the KTfinal is 1.8780. If the maximum kurtosis selection method is used, it will be judged that the quality of the signal in (b) is better than that in (a), which is inconsistent with the actual situation. Using the characteristic index proposed in this section can exclude the influence of monopulse impact and improve the reliability of judgment results.
By iterating the filters of different orders continuously, the filtered signal with the largest KTfinal among the filtered results of different orders is selected as the optimal filtered result of the bandpass filter, and the final output result of the FIR bandpass filter bank in Section 2.2.1 is obtained.

2.3. Analytic Energy Operator Demodulation Method

When the signal components are complex, there are often resonance frequency bands of the mechanical signal acquisition system with large energy levels in practice; it is difficult to find the characteristic frequency of the signal in the spectrum directly using Fourier transform. Consequently, the signal demodulation method is often used to remove the interference of the system itself and the influence of high-frequency resonance bands, and improve the accuracy of fault frequency extraction [35].
The concept of AEO is developed from the analytic signal, which combines the time domain representation of the signal with the corresponding Hilbert transform representation to form the AEO of the signal [36,37].
For a real-valued modulated signal x t = A t cos ω t , the signal obtained by Hilbert transformation is h t , and they can constitute an analytic signal, as shown in Equation (9):
q t = x t + j h t
The instantaneous amplitude and phase of the analytic signal q t are as follows:
A t = ± x 2 t + h 2 t
ω t = arctan h t / x t
The instantaneous frequency can be obtained by differentiating the instantaneous phase as follows:
ω ˙ t = h ˙ t x t h t x ˙ t / A 2 t
If h ˙ t x t h t x ˙ t is taken as the quantity to be calculated, it can represent the signal amplitude demodulation and frequency demodulation components, and so it is defined as follows:
Λ t = h ˙ t x t h t x ˙ t
where Λ t is the AEO, which can be used as the demodulation form of the original time domain signal to further extract the characteristic components of the signal.

2.4. Optimal Demodulation Component Selection Method

AEO demodulation is performed on the final output result of the FIR bandpass filter bank. The characteristic information in different demodulation spectrums is also different, and it is necessary to find the optimal result from multiple spectrums to extract more obvious fault characteristic frequency components as far as possible. Some characteristic indices can be used to describe the obviousness of the characteristic frequency in the spectrum, such as the characteristic frequency intensity coefficient (CFIC) [38,39]. In order to describe the energy prominence ability of characteristic frequencies in the spectrum within a small local frequency band, a dimensionless characteristic index called the characteristic frequency energy concentration coefficient (CFECC) is proposed for the optimal demodulation spectrum selection in this paper, as shown in Equation (14).
ECC m i d = i = 1 P E max 1 r f c , 1 + r f c L 1 E 1 r f c , 1 + r f c E max 1 r f c , 1 + r f c ECC l e f = i = 1 P E max 1 2 r f c , 1 r f c L 1 E 1 2 r f c , 1 r f c E max 1 2 r f c , 1 r f c ECC r i g = i = 1 P E max 1 + r f c , 1 + 2 r f c L 1 E 1 + r f c , 1 + 2 r f c E max 1 + r f c , 1 + 2 r f c CFECC = 2 ECC m i d P ECC l e f + ECC r i g
where P is the selectable harmonic order of the fault characteristic frequency, E max 1 r f c , 1 + r f c is the maximum amplitude energy in the demodulated spectrum interval 1 r f c , 1 + r f c , E 1 r f c , 1 + r f c is the sum of each frequency amplitude energy in the corresponding interval, L is the number of discretized frequency points of the spectrum in this interval, fc is a fault characteristic frequency, r is the characteristic frequency relative error range, and CFECC is the dimensionless characteristic index. By calculating the CFECC, the ratio of the amplitude energy of the fault characteristic frequency fc and the harmonics at the first P order in the relative error interval to the amplitude energy of the left and right adjacent intervals of the same length can be determined. The larger the CFECC is, the more concentrated the energy is in the error interval containing the characteristic frequency, and the spectrum characteristic frequency has a better representation.

2.5. Calculation of Bearing Fault Characteristic Frequency

When there is local damage in a component of the axle box bearing, the contact of other components at the damage point will produce the corresponding periodic impulse impact excitation. The excitation is different from the vibration of the normal bearing, and its duration is very short, but it has a very wide spectrum range. Different components will produce different impact cycles due to their different motion modes. Therefore, fault defects at different locations will generate different impact frequencies. These frequencies can reflect most of the faults of the bearing, so they can be regarded as the fault characteristic frequencies of the bearing [40]. Considering the geometrical structure and rotational velocity of the bearing, the fault characteristic frequency of each bearing component can be calculated.
When the outer ring is fixed, the fault characteristic frequency of the bearing outer ring f o can be calculated by Equation (15).
f o = r n 120 1 d D cos α
The fault characteristic frequency of the bearing inner ring f i can be calculated by Equation (16).
f i = r n 120 1 + d D cos α
The fault characteristic frequency of the bearing rolling element f b can be calculated by Equation (17).
f b = r D 120 d 1 d D 2 cos 2 α
The fault characteristic frequency of the bearing cage f c can be calculated by Equation (18).
f c = r 120 1 d D cos α
In Equations (15)–(18), r is the rotational velocity of the rolling bearing, n is the number of rolling elements of the bearing; d is the diameter of the rolling element, D is the diameter of the pitch circle of the rolling bearing, and α is the contact angle of the rolling element.
By substituting the geometric parameters of the axle bearing into the fault characteristic frequency calculation equation, the fault frequency of each part of the bearing can be calculated [41].

2.6. The Framework of the Proposed Fault Diagnosis Method

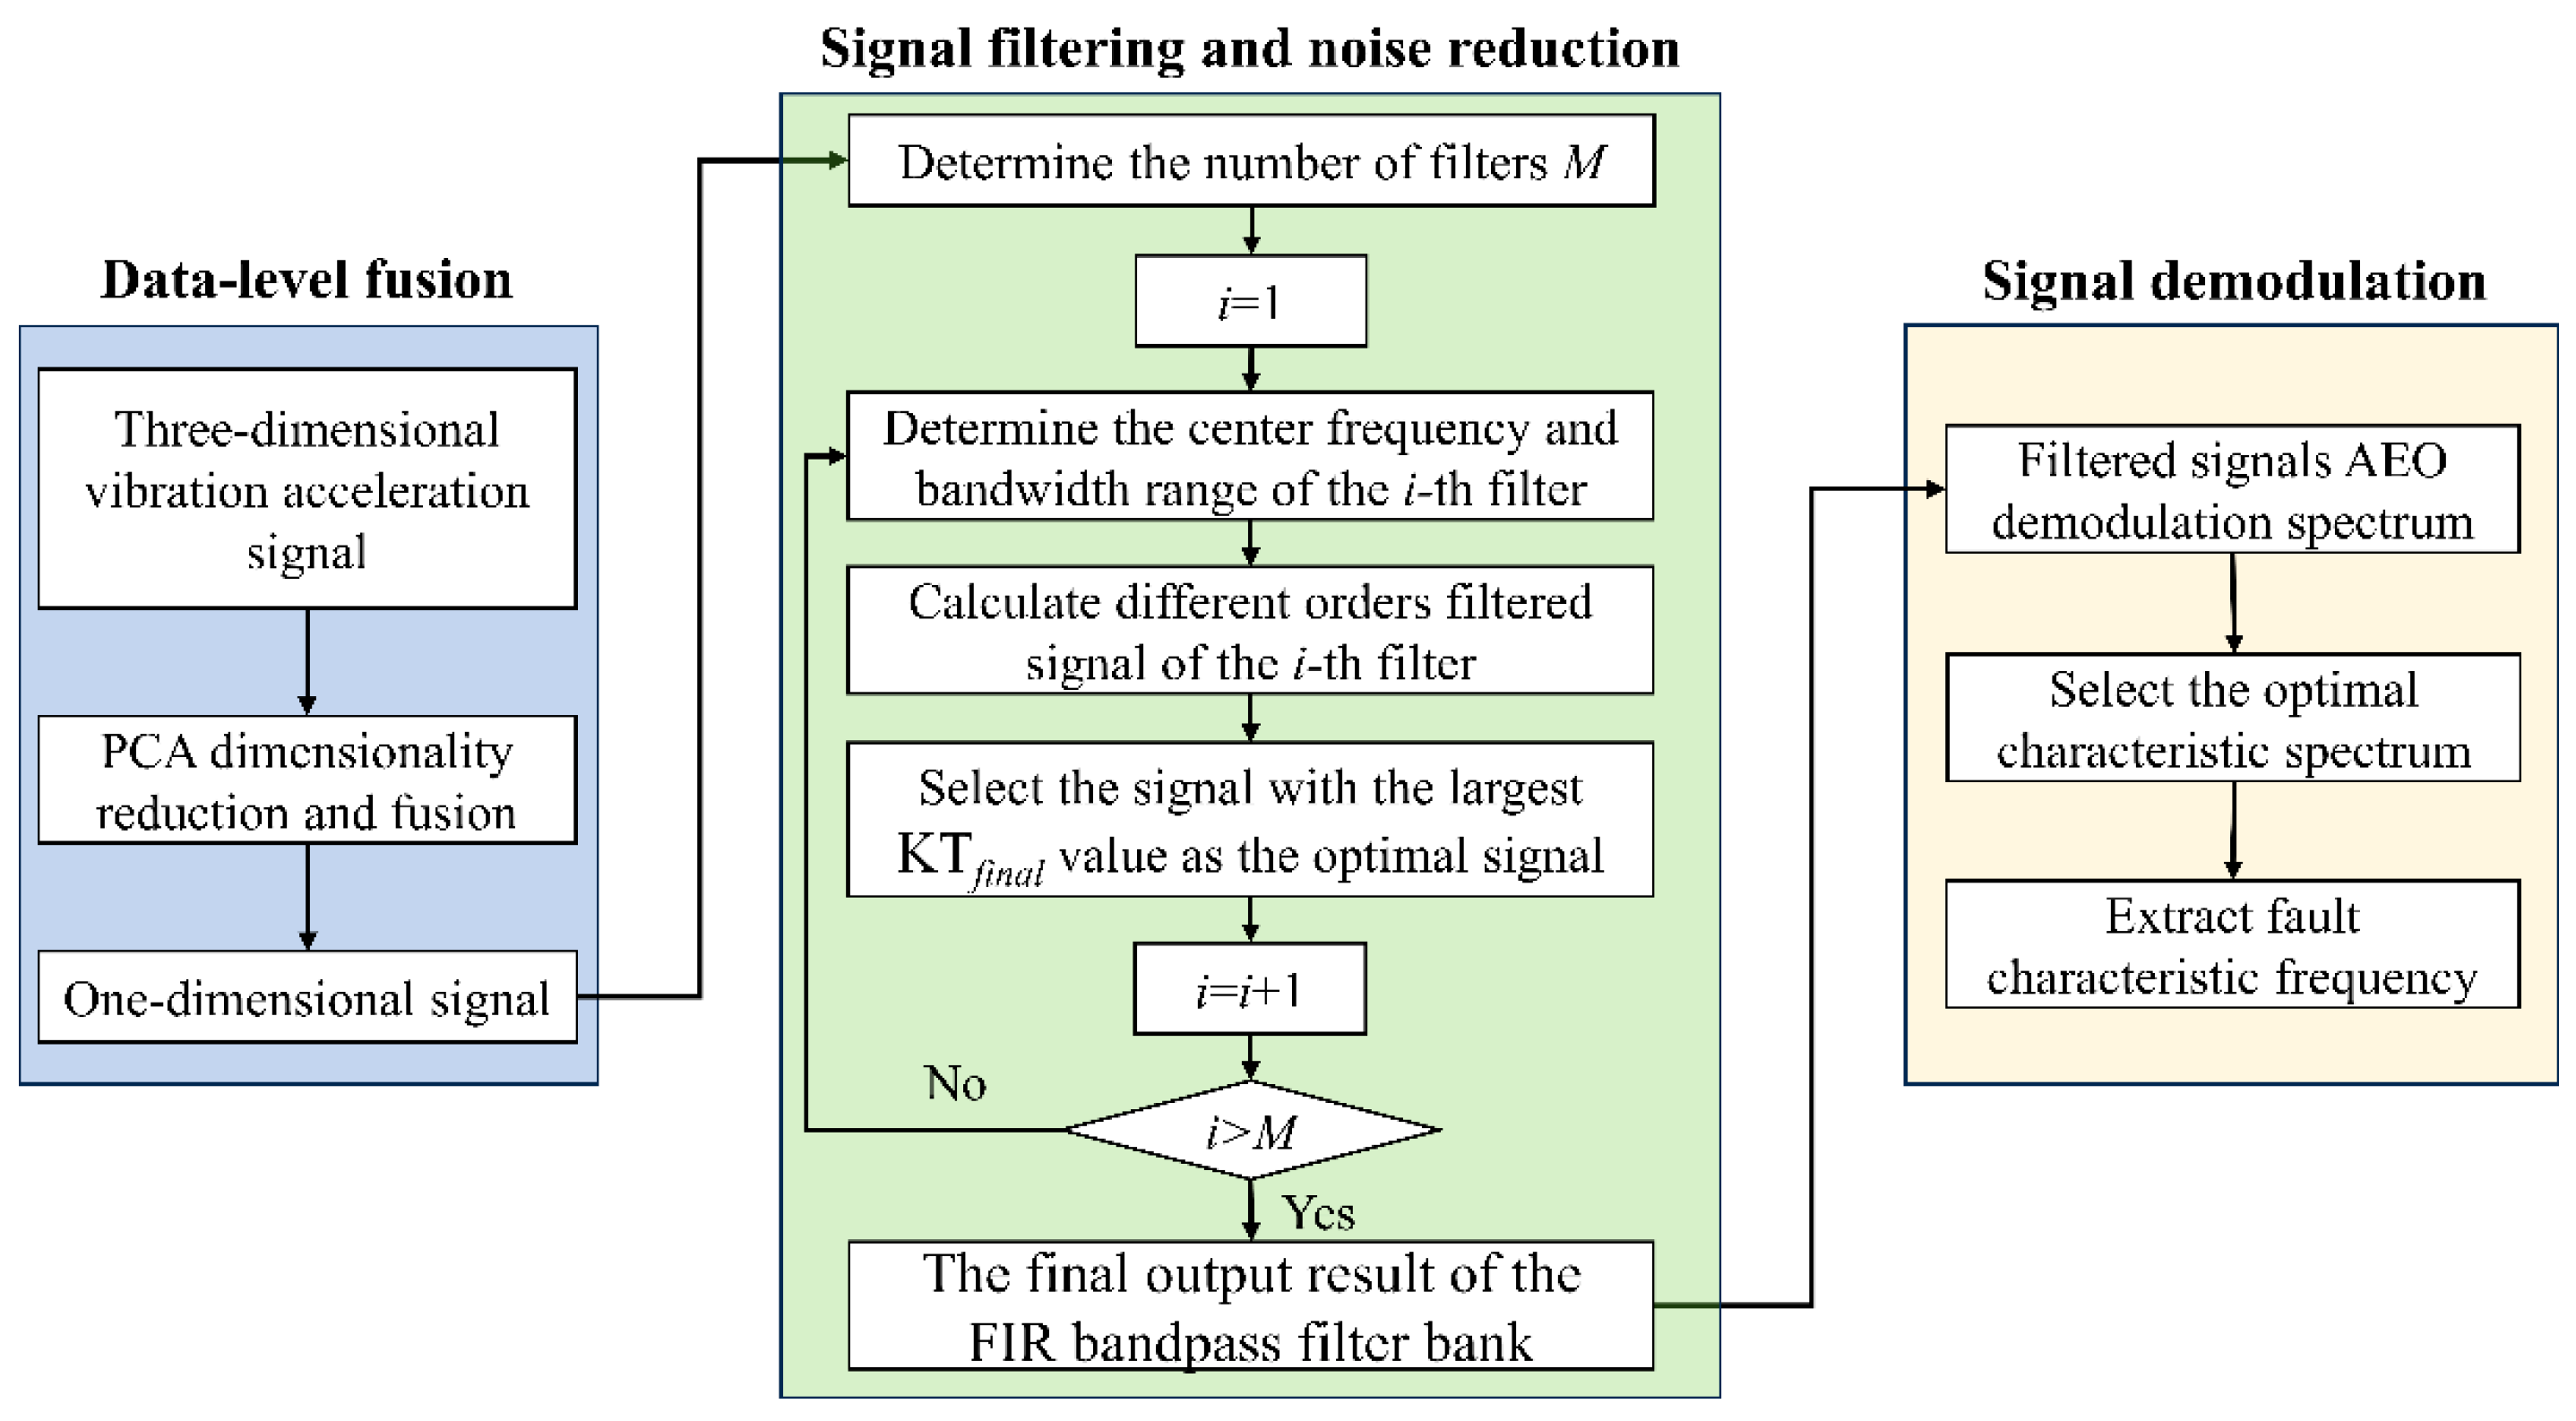
According to the above analysis and introduction, a fault diagnosis method based on PCA data fusion and bandpass filter bank signal decomposition is proposed to extract the fault characteristic frequency from bearing three-dimensional vibration acceleration signals in this paper. The framework of the method is shown in Figure 3.
The specific process of the fault diagnosis method is as follows.
Step 1: Firstly, according to the PCA dimension reduction rule, the three-dimensional vibration acceleration signals of the bearing fuse into a one-dimensional signal.
Step 2: According to the length of the signal, determine the number of filters, the center frequency, and the bandwidth, filter the signal by the multi-channel bandpass filter bank, and solve the optimal filtering result under each filter iteratively.
Step 3: Linearly scale the amplitude of the signal from each bandpass filter to the interval [−1, 1] and form the filter bank final output result.
Step 4: Perform AEO demodulation on each filter component, solve the corresponding demodulated spectrum, calculate the CFECC of different characteristic frequencies in each spectrum, and select the characteristic frequency corresponding to the maximum value as the fault frequency and the corresponding demodulation spectrum as the final optimal demodulation spectrum.

3. Results Simulation Signal Analysis

In order to prove the effectiveness of the fault diagnosis method proposed in this paper, a numerical simulation signal was analyzed and verified.

3.1. Numerical Simulation Signal Model

Ideally, when the rolling bearing is faulty, a series of periodic impacts with cyclostationary characteristics will be generated. The rotating speeds of the rolling elements in the raceway are not always the same. The rotating speeds of the rolling elements in the bearing area are faster than those of the rolling elements in the non-bearing area, so there will be a certain deviation in the periodicity of the fault impact, which leads to the fault signal of the bearing being quasi-cyclostationary. When modeling the bearing fault impact signal, random variables can be introduced to cancel the complete cyclostationary characteristics of the signal. Due to the signal attenuation of the sensor during signal acquisition, the attenuation function can be introduced to simulate the attenuation process in the process of signal acquisition [38]. The final established bearing fault impact signal expression is shown in Equation (19).
y t = i = 1 N 1 + A 0 sin 2 π f r t e C t i T τ i sin 2 π f s t i T τ i + n t
where N is the number of fault impacts; A0 is the initial value of amplitude; fr is the bearing rotation frequency; C is the impact attenuation coefficient; T is the time interval between adjacent impacts; τi is the time error of mutual movement of internal components of bearing; fs is the resonance frequency of the bearing system; and n(t) is the complex strong noise generated by the bearing operating environment.
According to the simulation model parameters in references [38,41], the simulation signal of the bearing was established according to the parameters in Table 1.

3.2. Three-Dimensional Simulation Signals Analysis

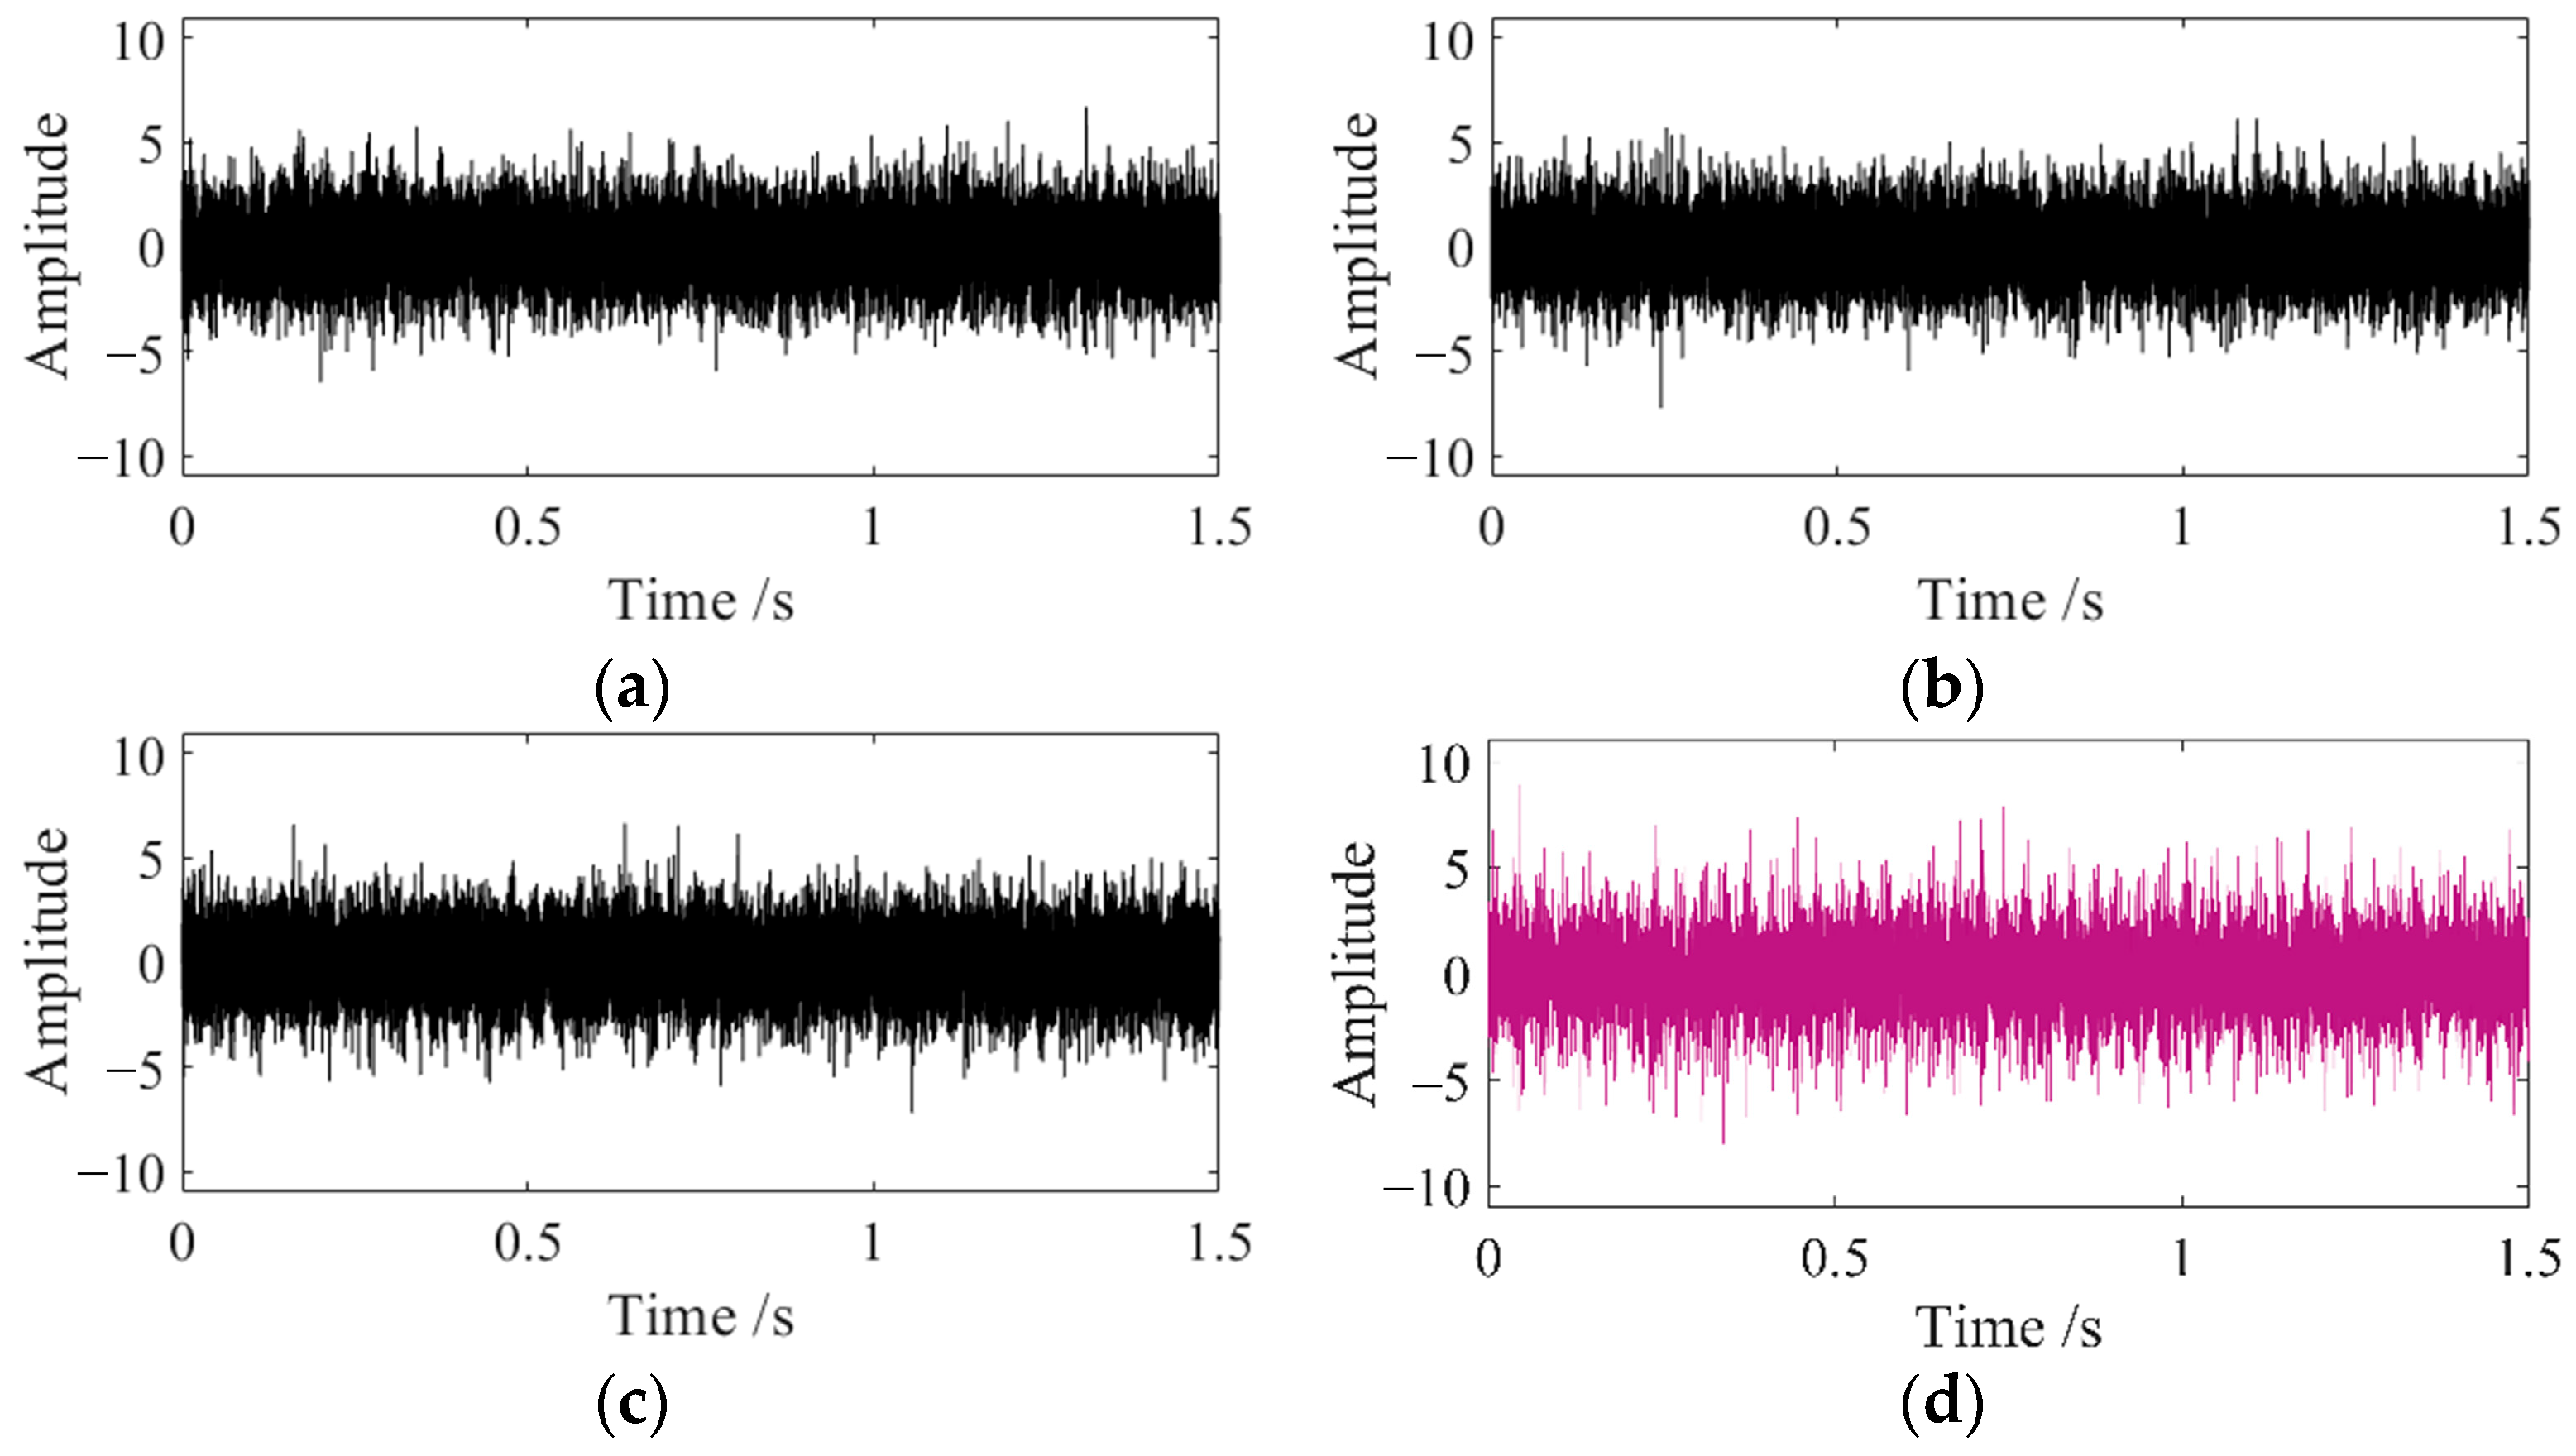
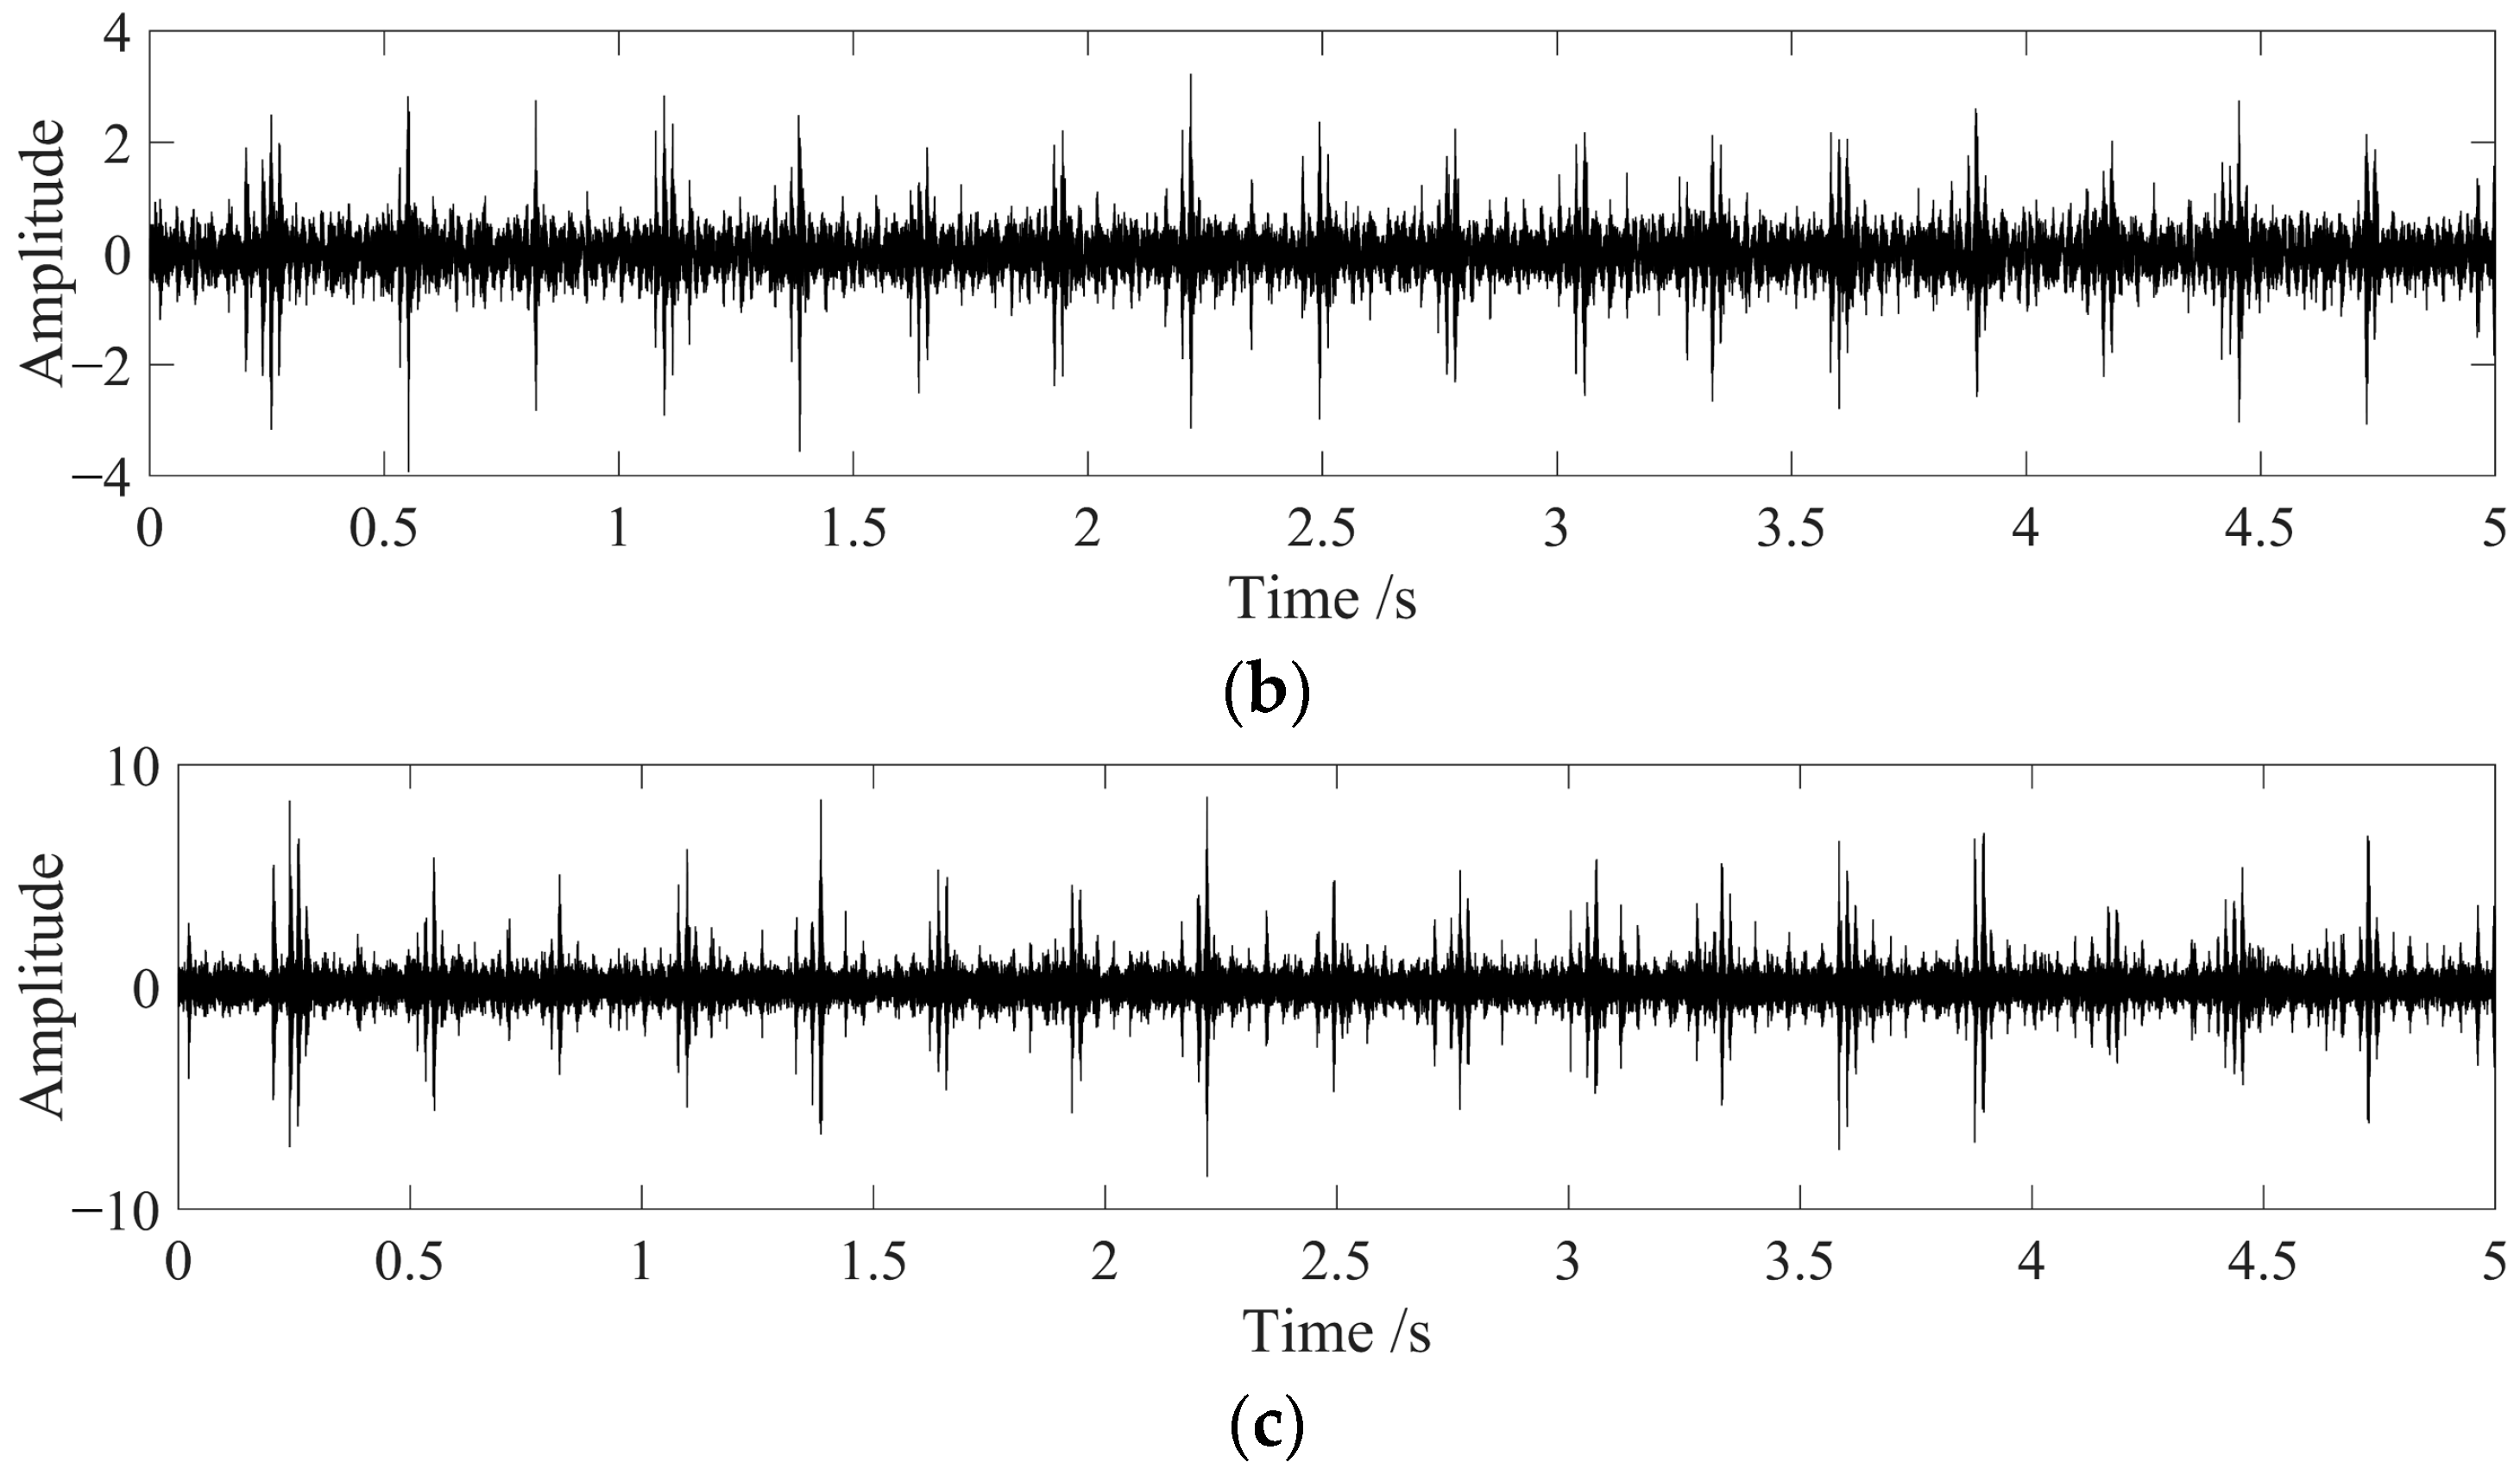
In order to prove the effectiveness of the PCA data-level fusion method for signal denoising, the Hilbert envelope spectrum of the signal was extracted, and the effectiveness of data noise reduction was illustrated by the CFECC. According to the parameters in Table 1, the three-dimensional signals were constructed by using 3.2 dB, 2.9 dB, and 3.1 dB noises. The corresponding time domain diagram and Hilbert demodulation spectrum of each dimension signal and the PCA fusion signal are shown in Figure 4 and Figure 5.
It can be seen from Figure 4 that after adding noise to the simulation signal, the periodic impact component of the signal is masked by noise, but this phenomenon can be weakened by the PCA fusion signal. In Figure 5, the noise content of the PCA fusion signal spectrum is significantly reduced. The CFECC value of each spectrum in Figure 5 is calculated with ff = 159 Hz, P = 4, and r = 0.01, as shown in Table 2. From the calculation results, it can be seen that compared to the original three-dimensional signals, the CFECC of the PCA fusion signal is larger, it is easier to extract the characteristic frequency of the signal, and the characteristic frequency and its harmonic spectrum lines in the spectrum are more prominent.
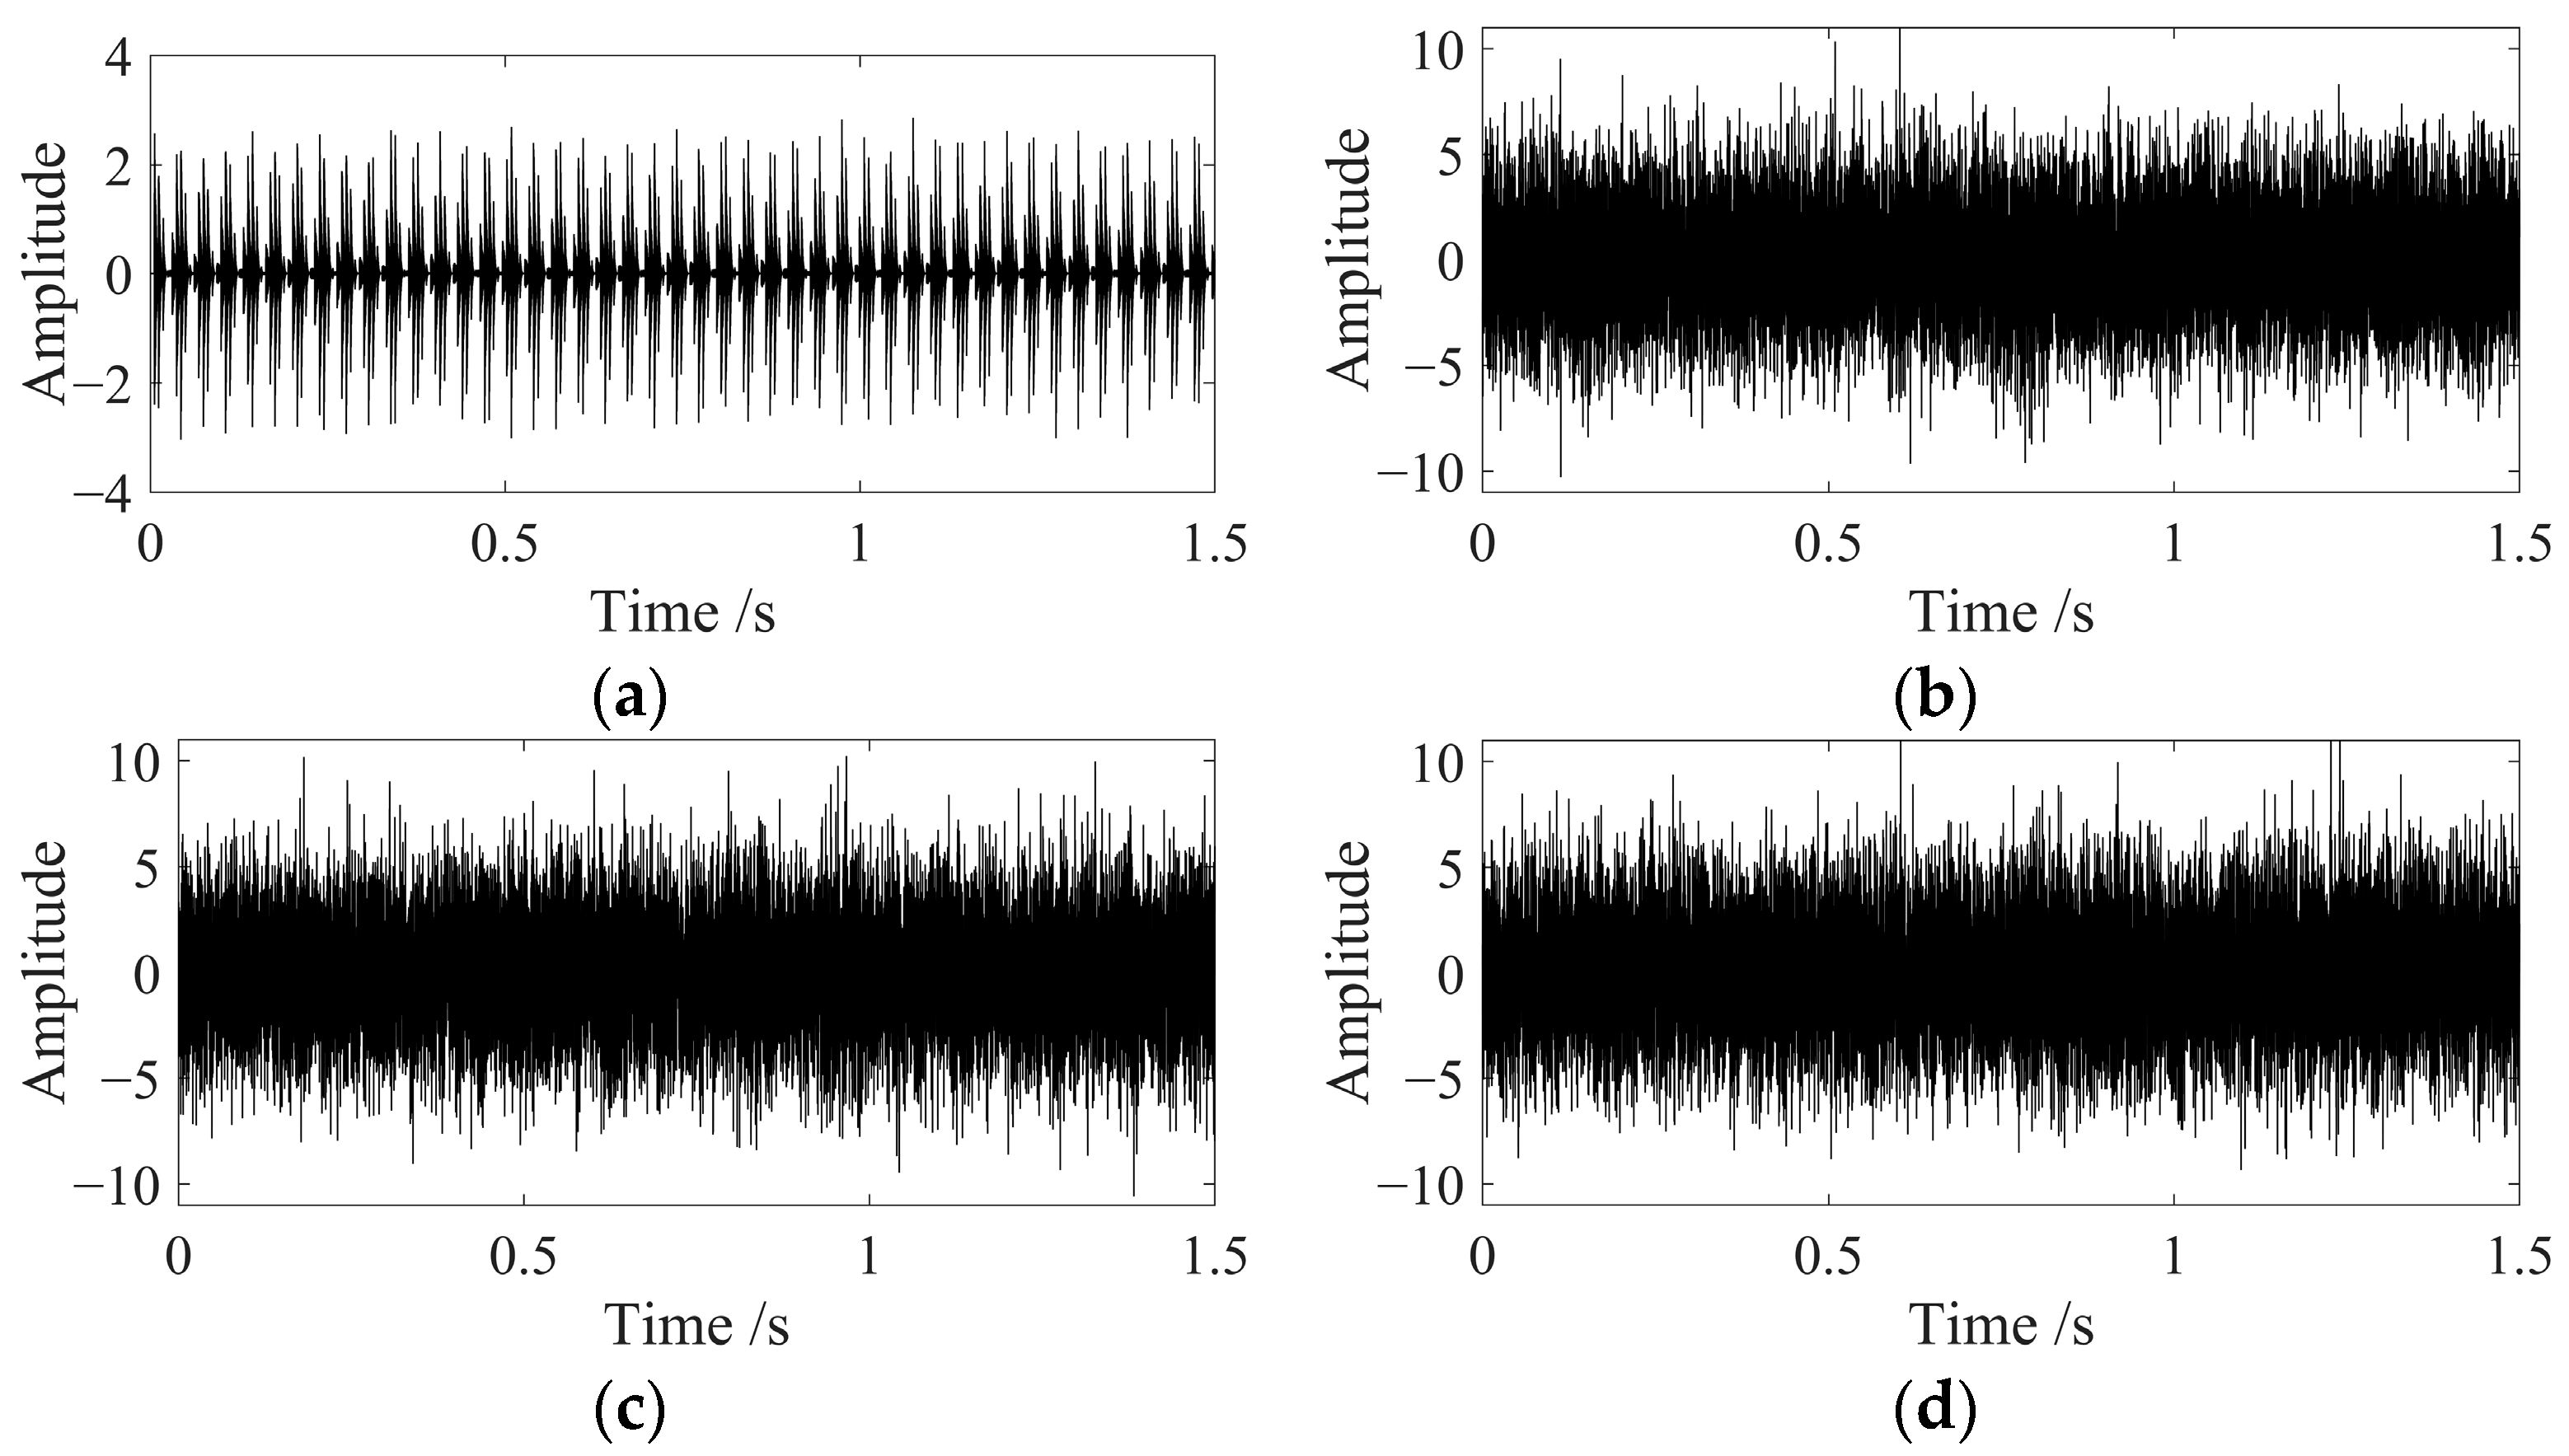
In order to further verify the effectiveness of the proposed fault diagnosis method, the three-dimensional signals were constructed using 7.8 dB, 8 dB, and 8.3 dB noise. The corresponding time domain diagram is shown in Figure 6. The periodic impact component of the signal is masked by noise in Figure 6b–d.
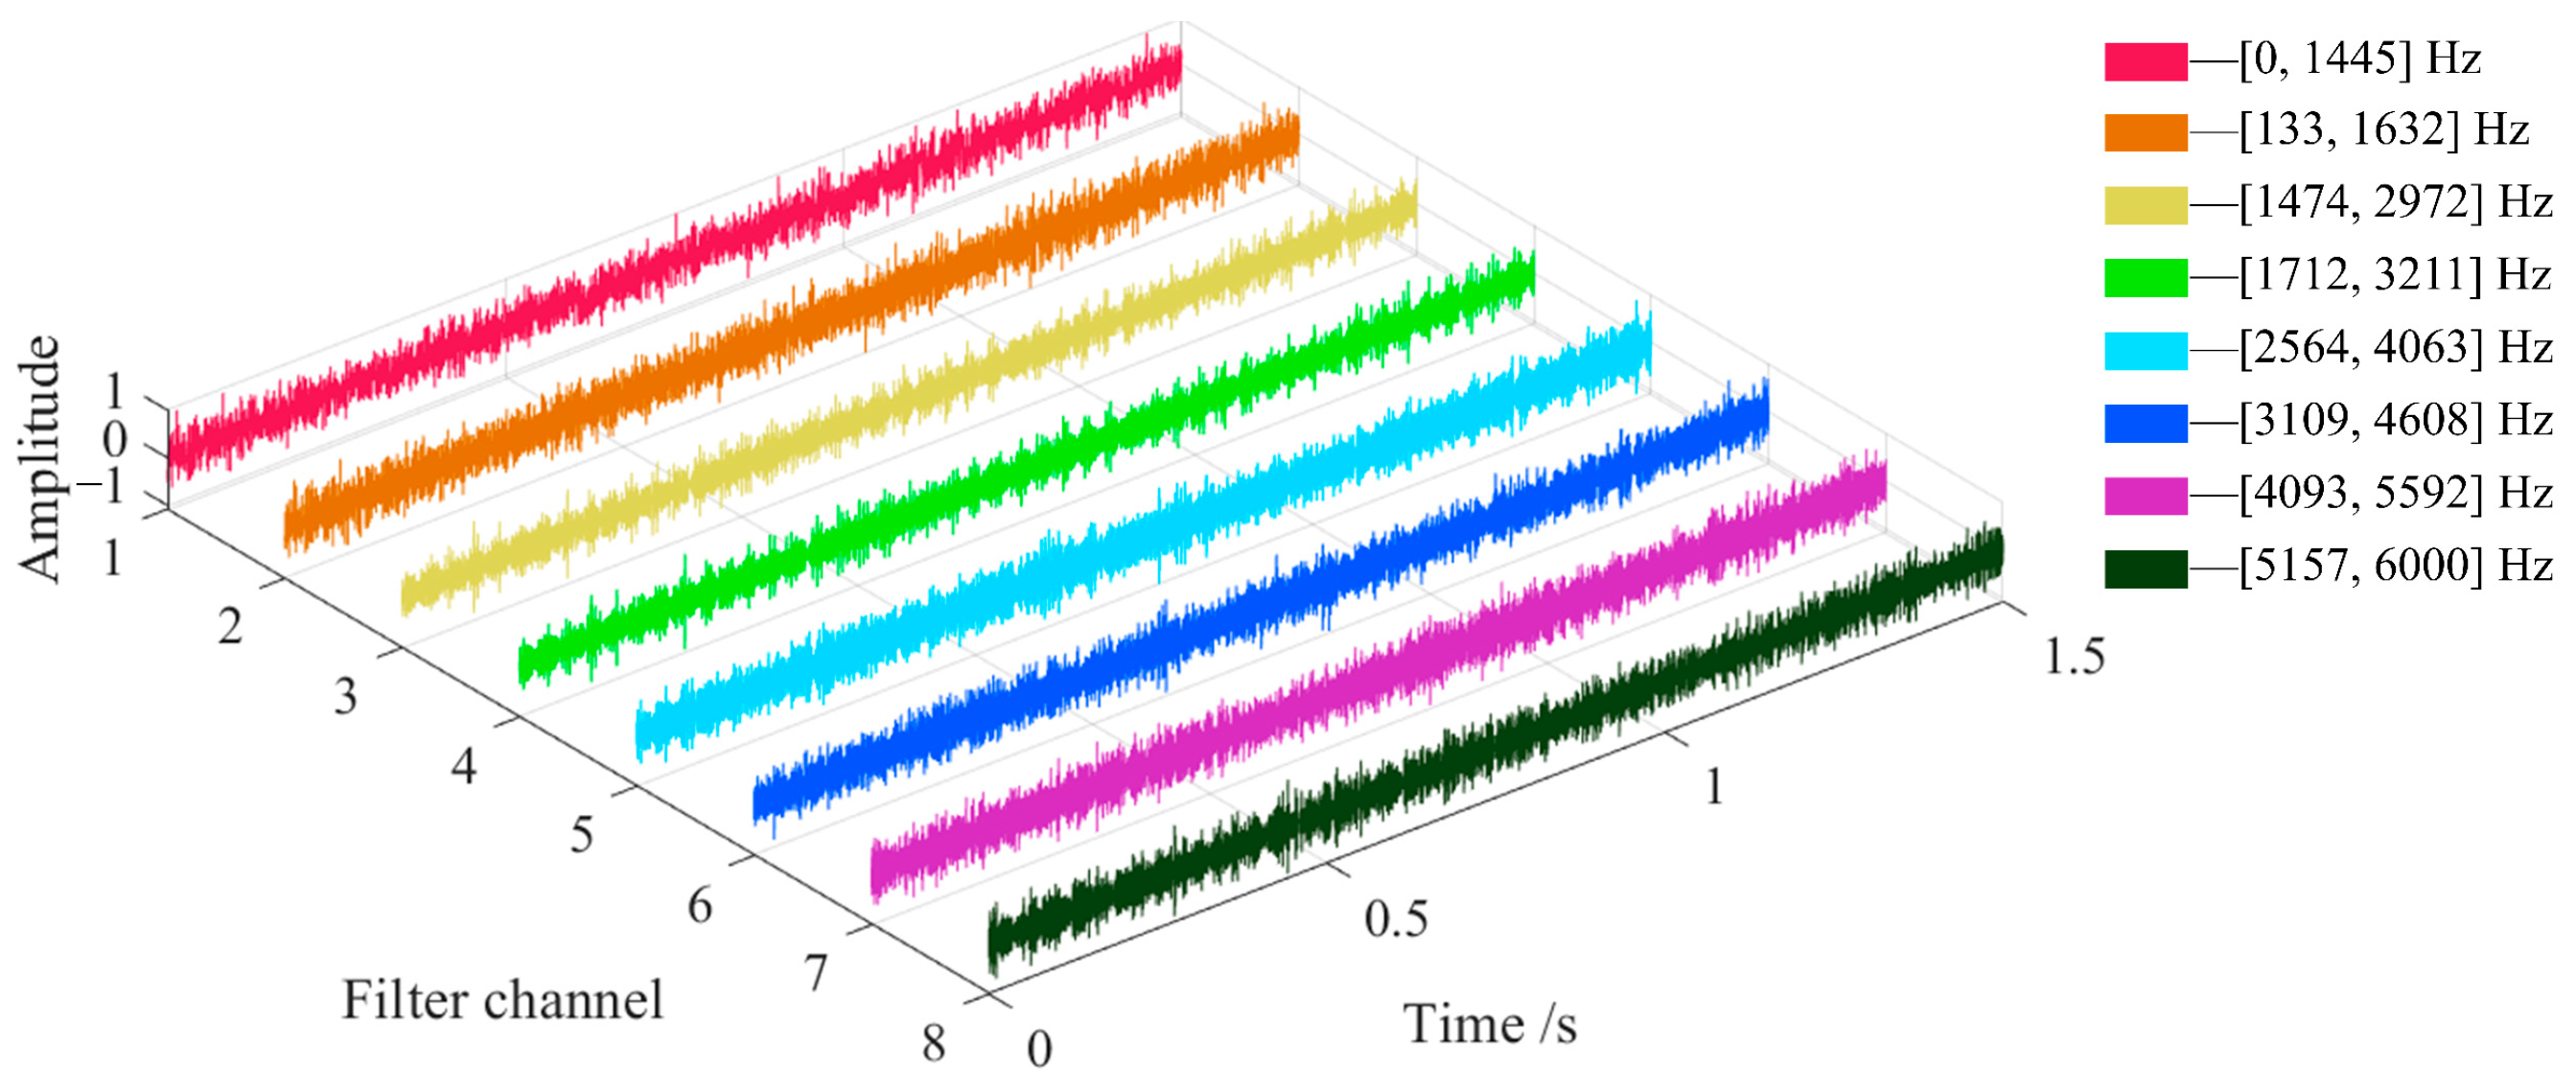
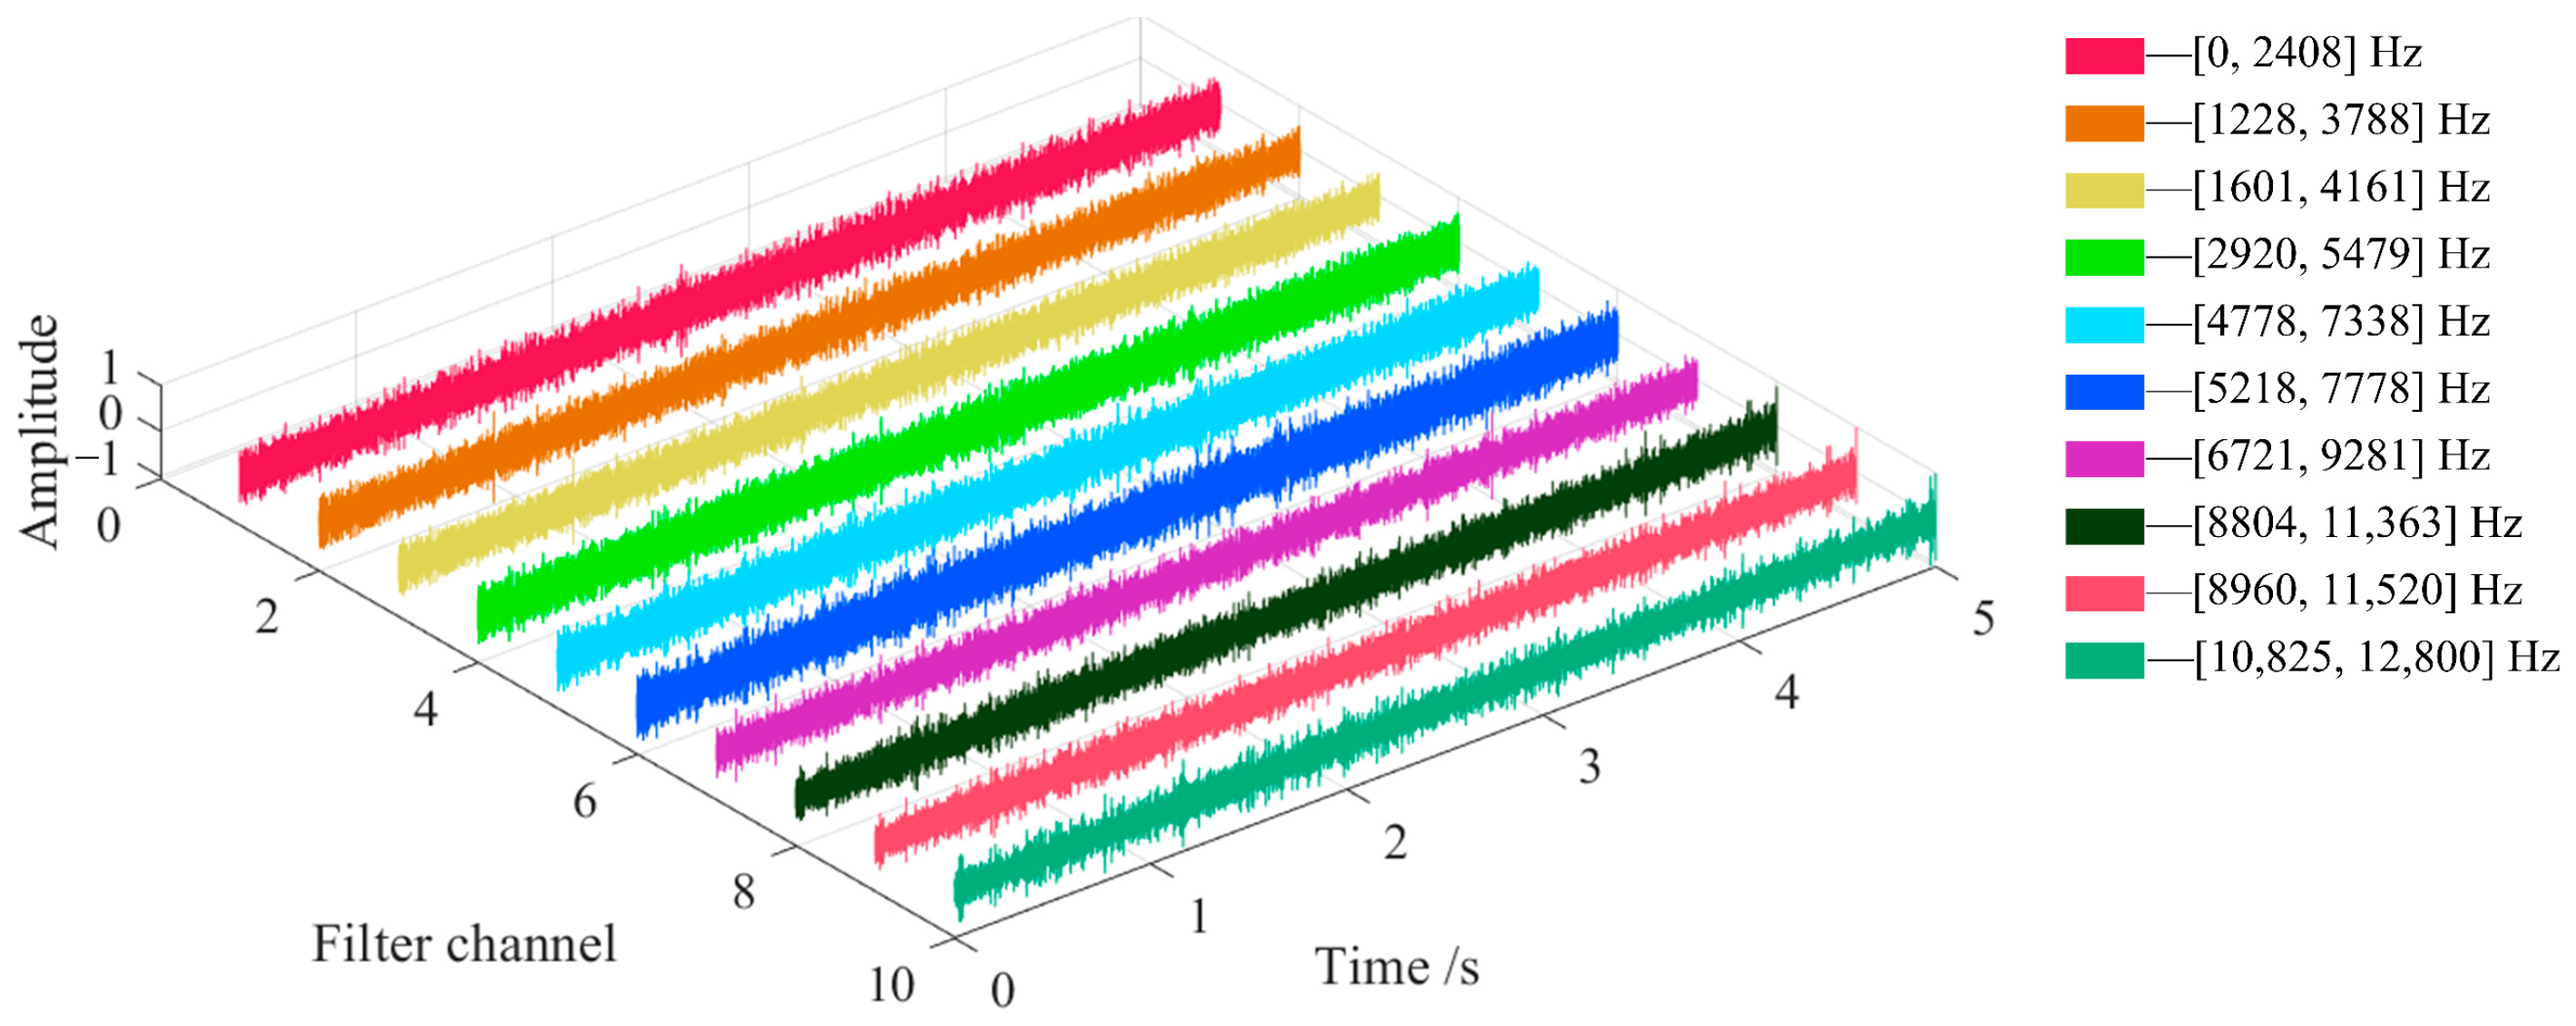
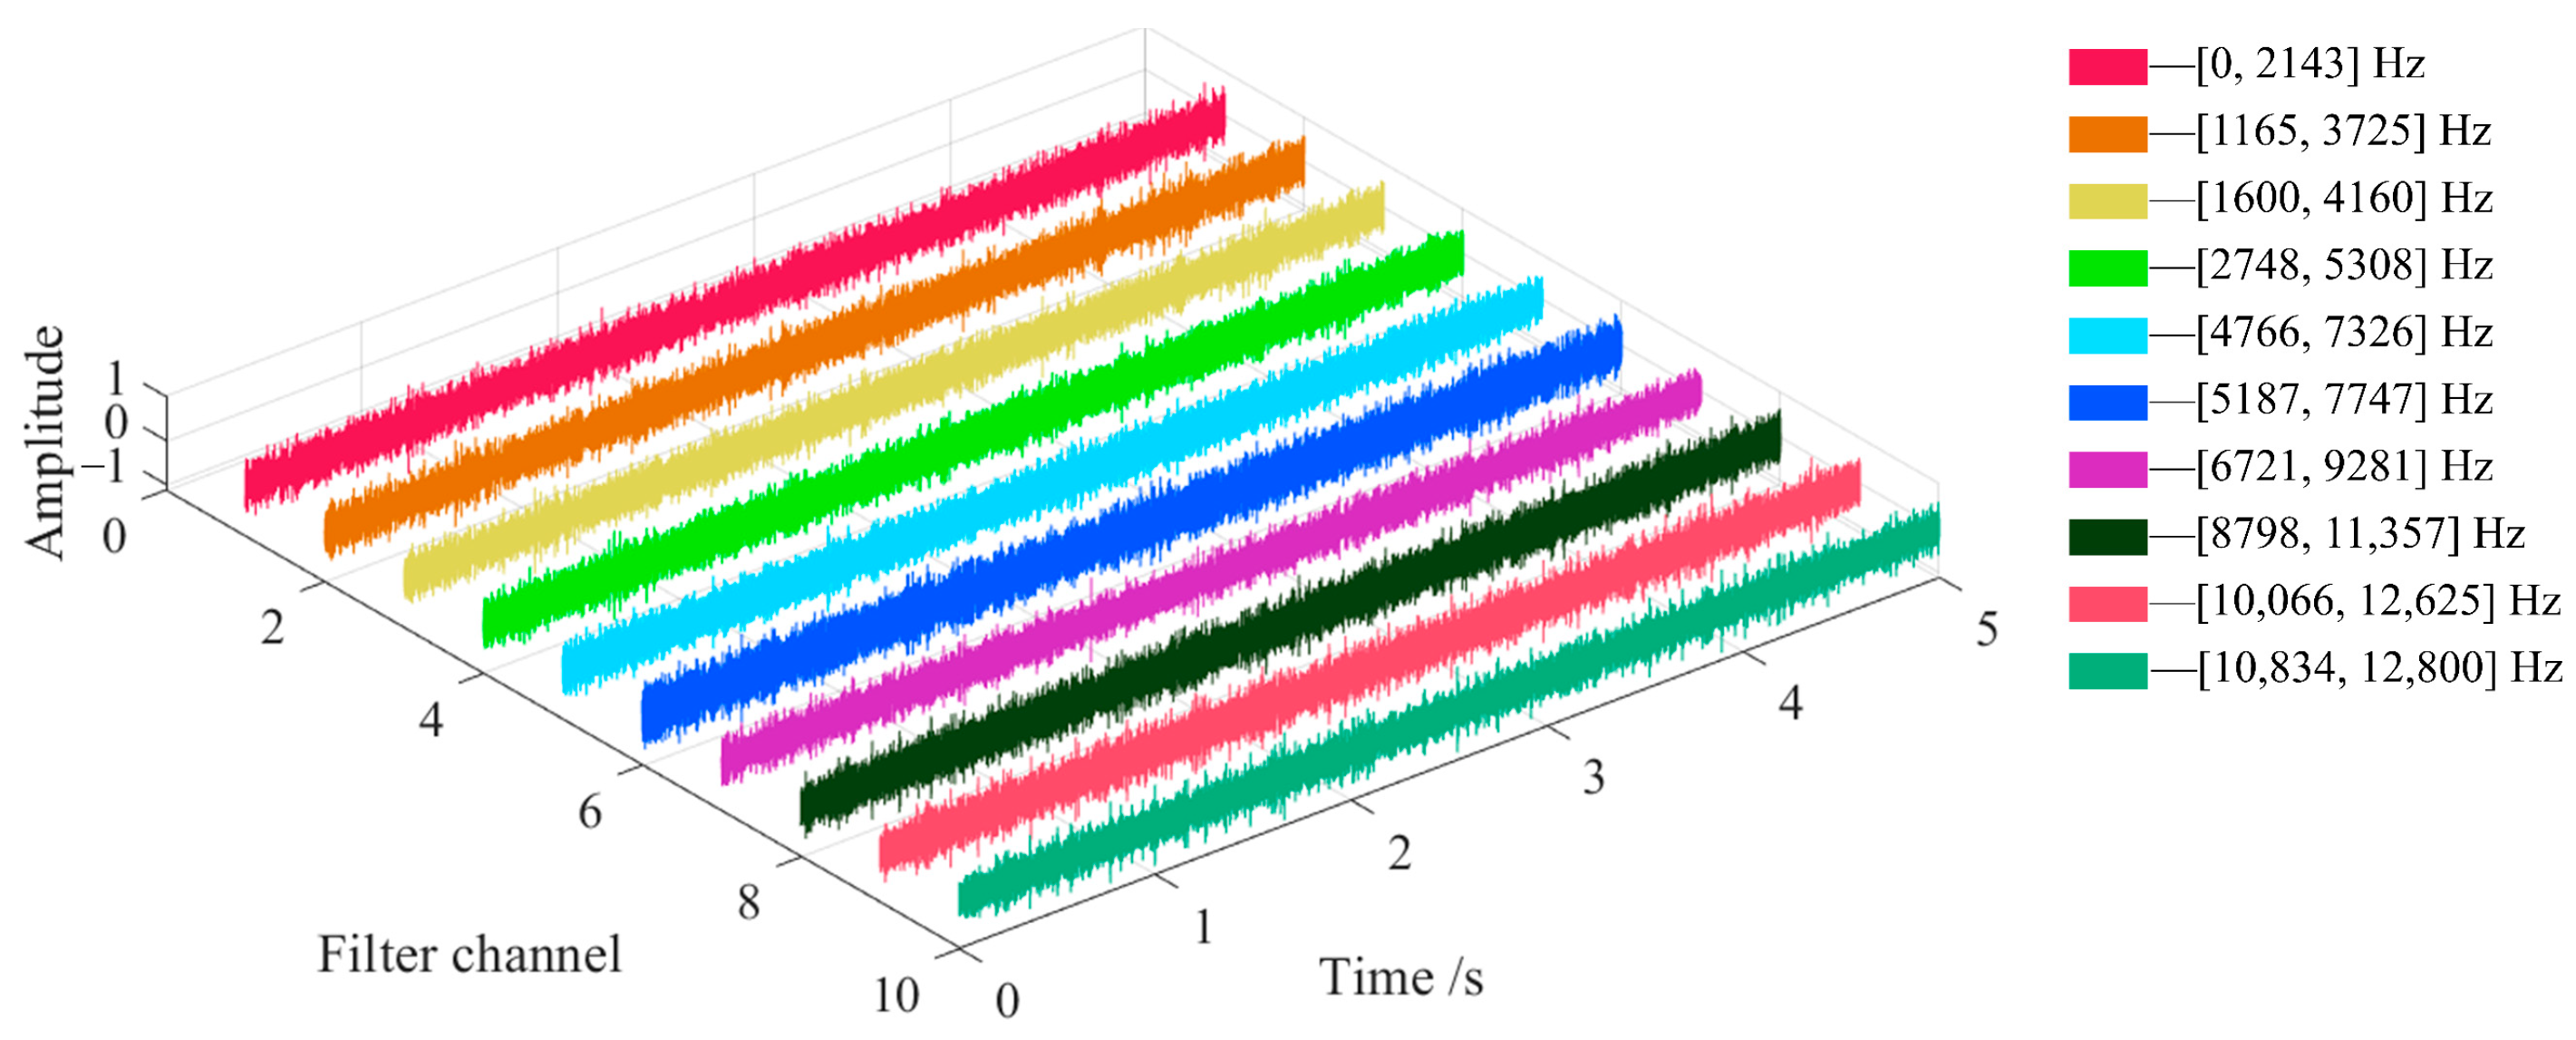
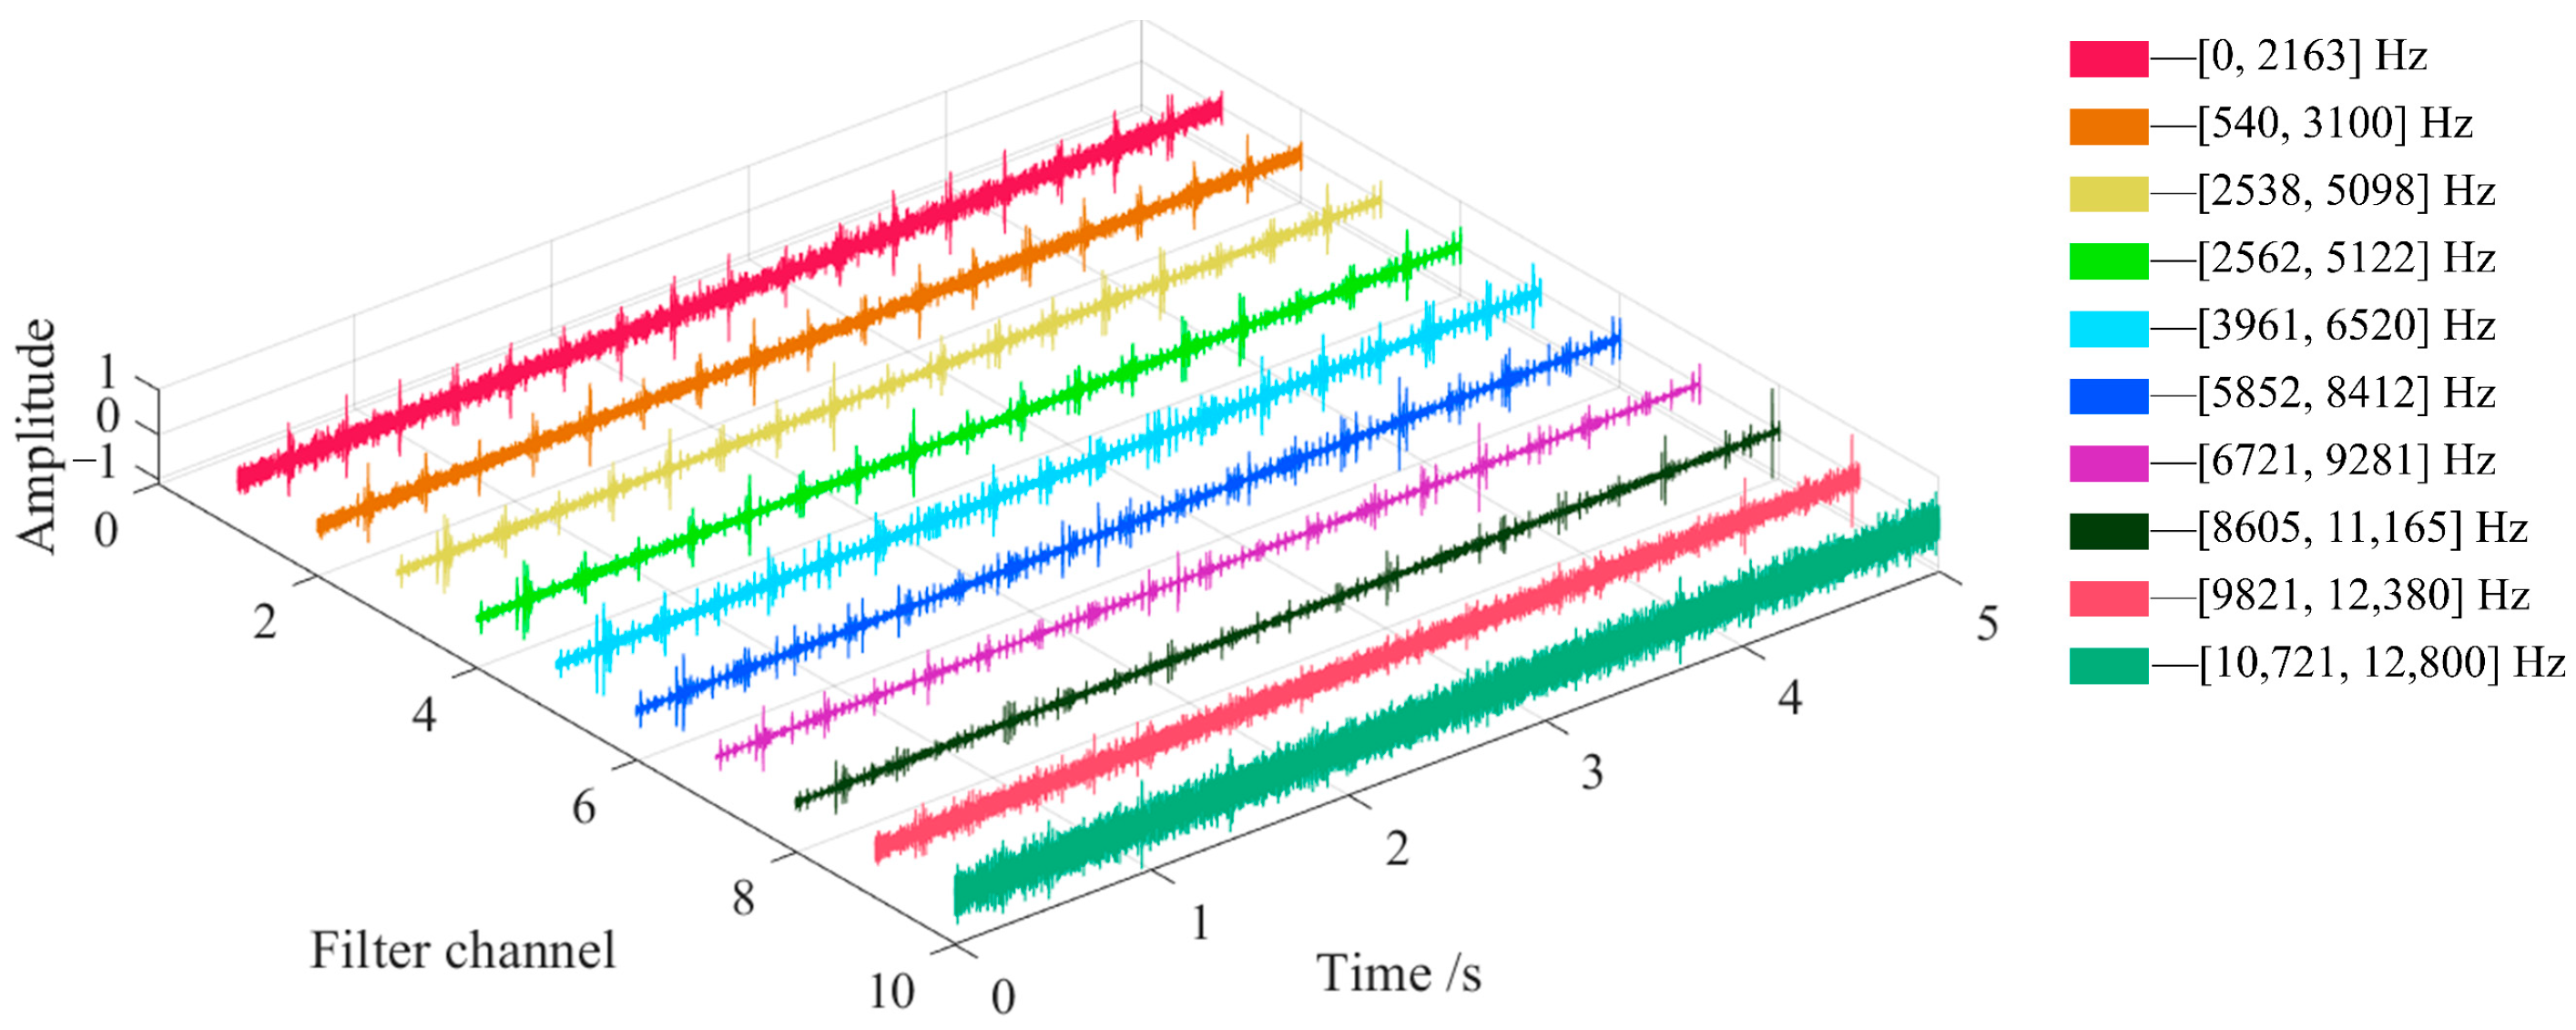
The signals in Figure 6b–d are fused by PCA. The PCA fusion signal was decomposed by a multi-channel bandpass filter bank, and the optimal signal obtained for each filtering channel is shown in Figure 7. The legends in Figure 7 illustrate the lower-cut-off frequency and upper-cut-off frequency of each filtering channel.
The CFECC value of the AEO spectrum corresponding to each channel signal in Figure 7 was calculated with ff = 159 Hz, P = 4, and r = 0.025, as shown in Table 3.
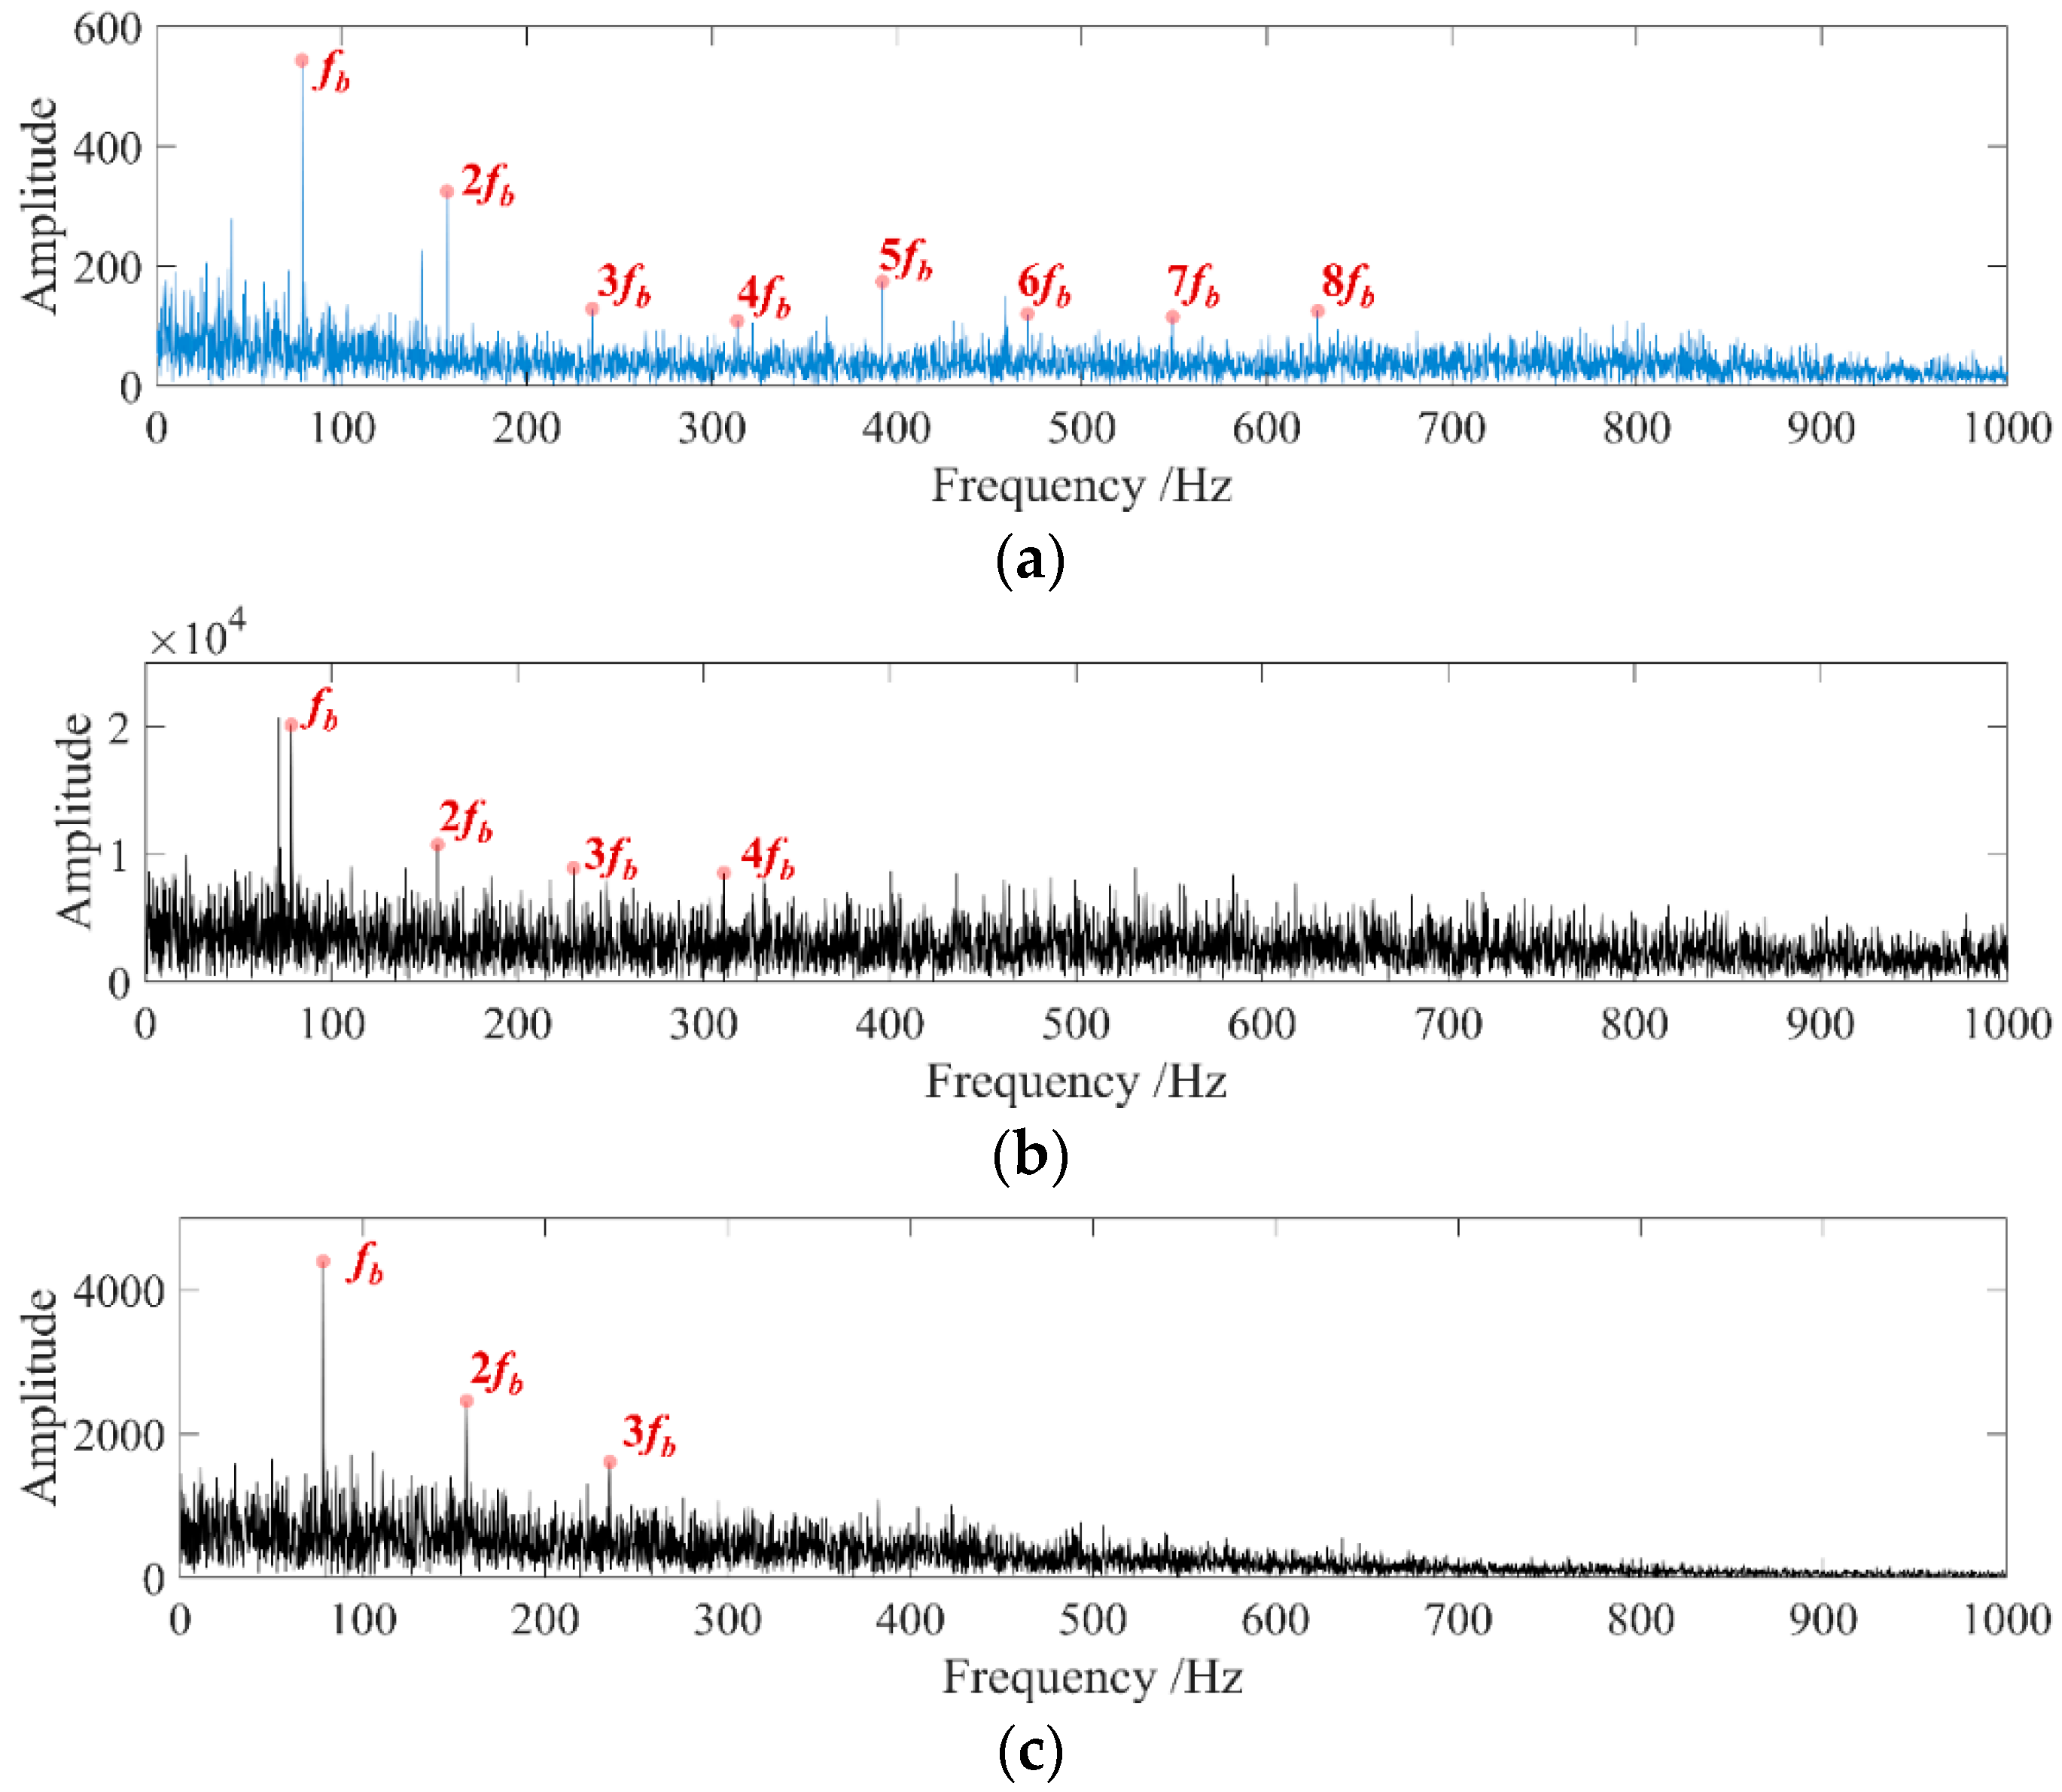
The AEO demodulation spectrum of Channel 4 signal was selected as the optimal demodulation spectrum. To demonstrate the superiority of the proposed method compared to existing fault diagnosis methods, the commonly used multi-dimensional signal fault diagnosis methods NAMEMD–Hilbert envelope and MVMD–Hilbert envelope were adopted to extract the fault characteristics of the above three-dimensional signals. The demodulation spectrums of the Channel 4 signal and the optimal intrinsic mode function (IMF) component of the NAMEMD and MVMD methods are shown in Figure 8.
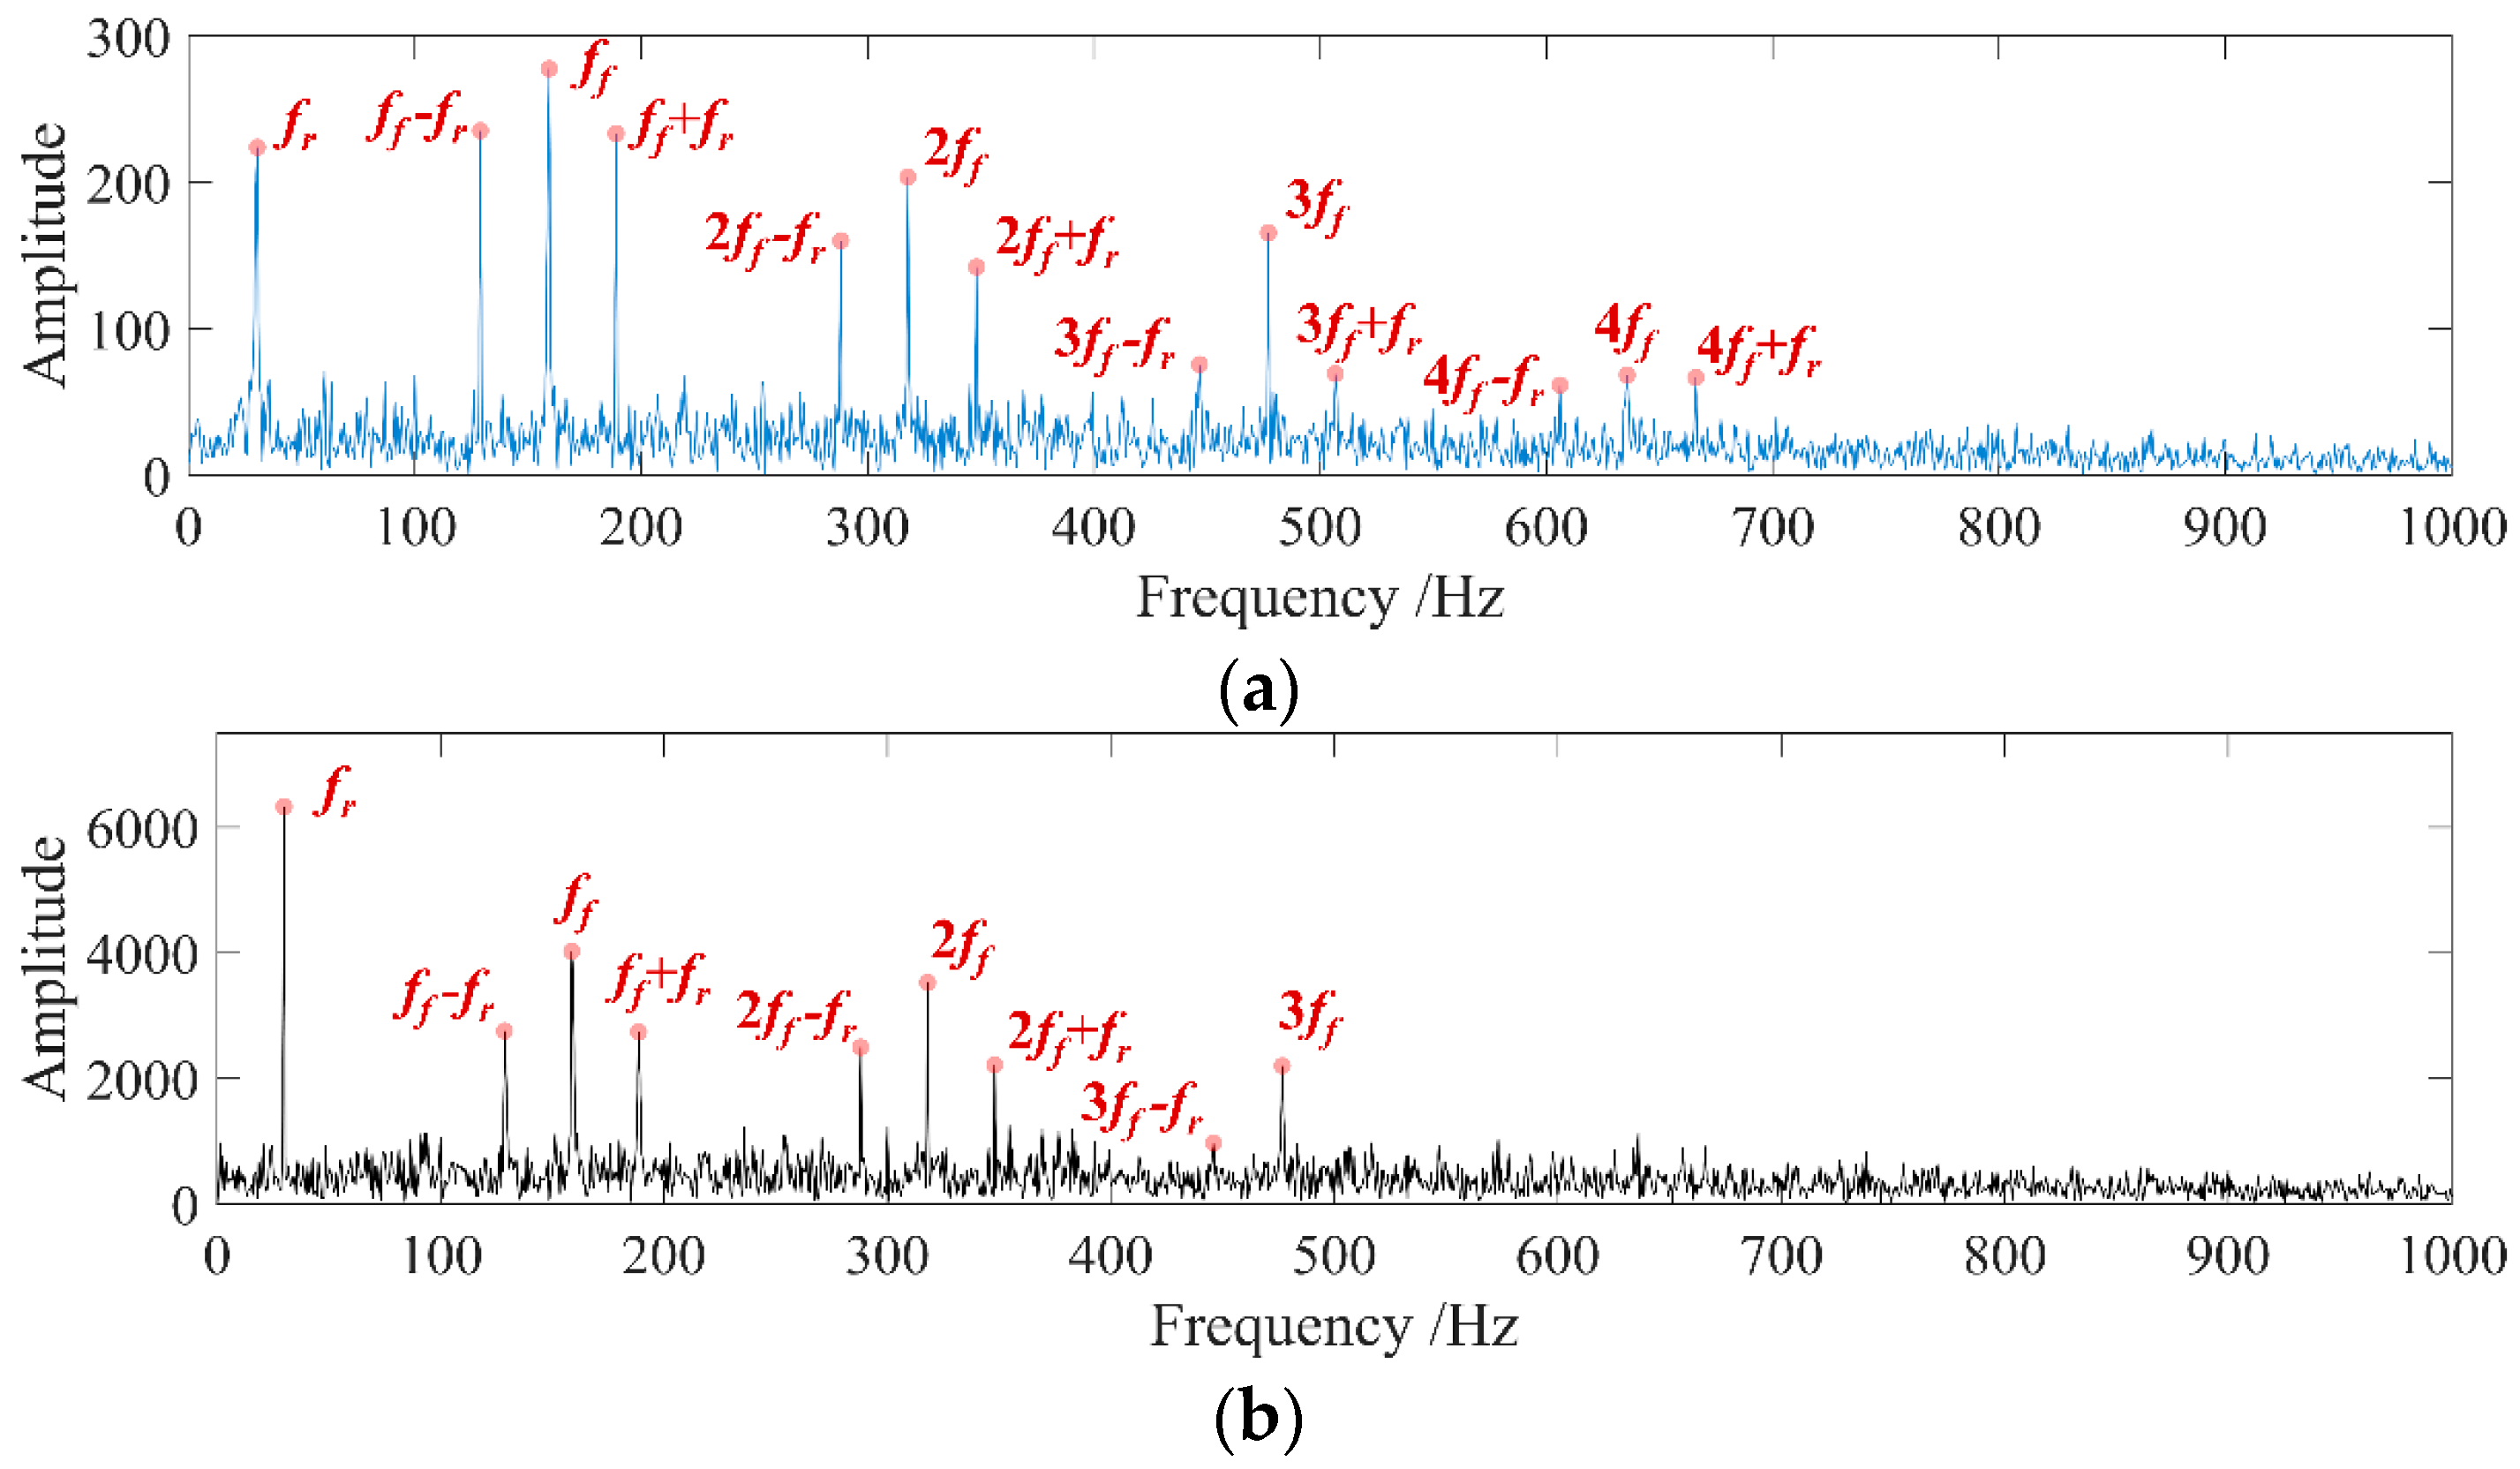
It can be seen from Figure 8a that through the process of the fault diagnosis method proposed in this paper, the bearing rotation frequency fr and fault frequency ff contained in the original signal can be extracted, and the first four order harmonics of the fault frequency can be extracted, which indicates that the proposed method can extract the bearing fault frequency under complex background noise conditions.
In Figure 8b,c, the NAMEMD–Hilbert method and MVMD–Hilbert can also extract the rotation frequency and the preset fault characteristic frequency of the simulation signal, but the numbers of harmonics of the extracted fault characteristic spectrum are both less than the number of harmonics extracted by the proposed method. The CFECC values of the spectrum in Figure 8b,c are 3.1310 and 3.7779, respectively, which are smaller than the CFECC of the spectrum in Figure 8a. Therefore, the relative superiority of the proposed method can be illustrated, and the computation time of the proposed method is far less than that of the NAMEMD–Hilbert method and MVMD–Hilbert method.

4. Experimental Signal Acquisition and Analysis

4.1. Experimental Signals Acquisition

In order to further verify the effectiveness of the method proposed in this paper for fault diagnosis of actual vibration acceleration signals, the three-dimensional vibration acceleration signal of an axle box bearing collected by the rail vehicle bogie axle box bearing test rig of the State Key Laboratory of Rail Transit Vehicle System in Southwest Jiaotong University [39,41] were used for analysis. The test rig is shown in Figure 9.
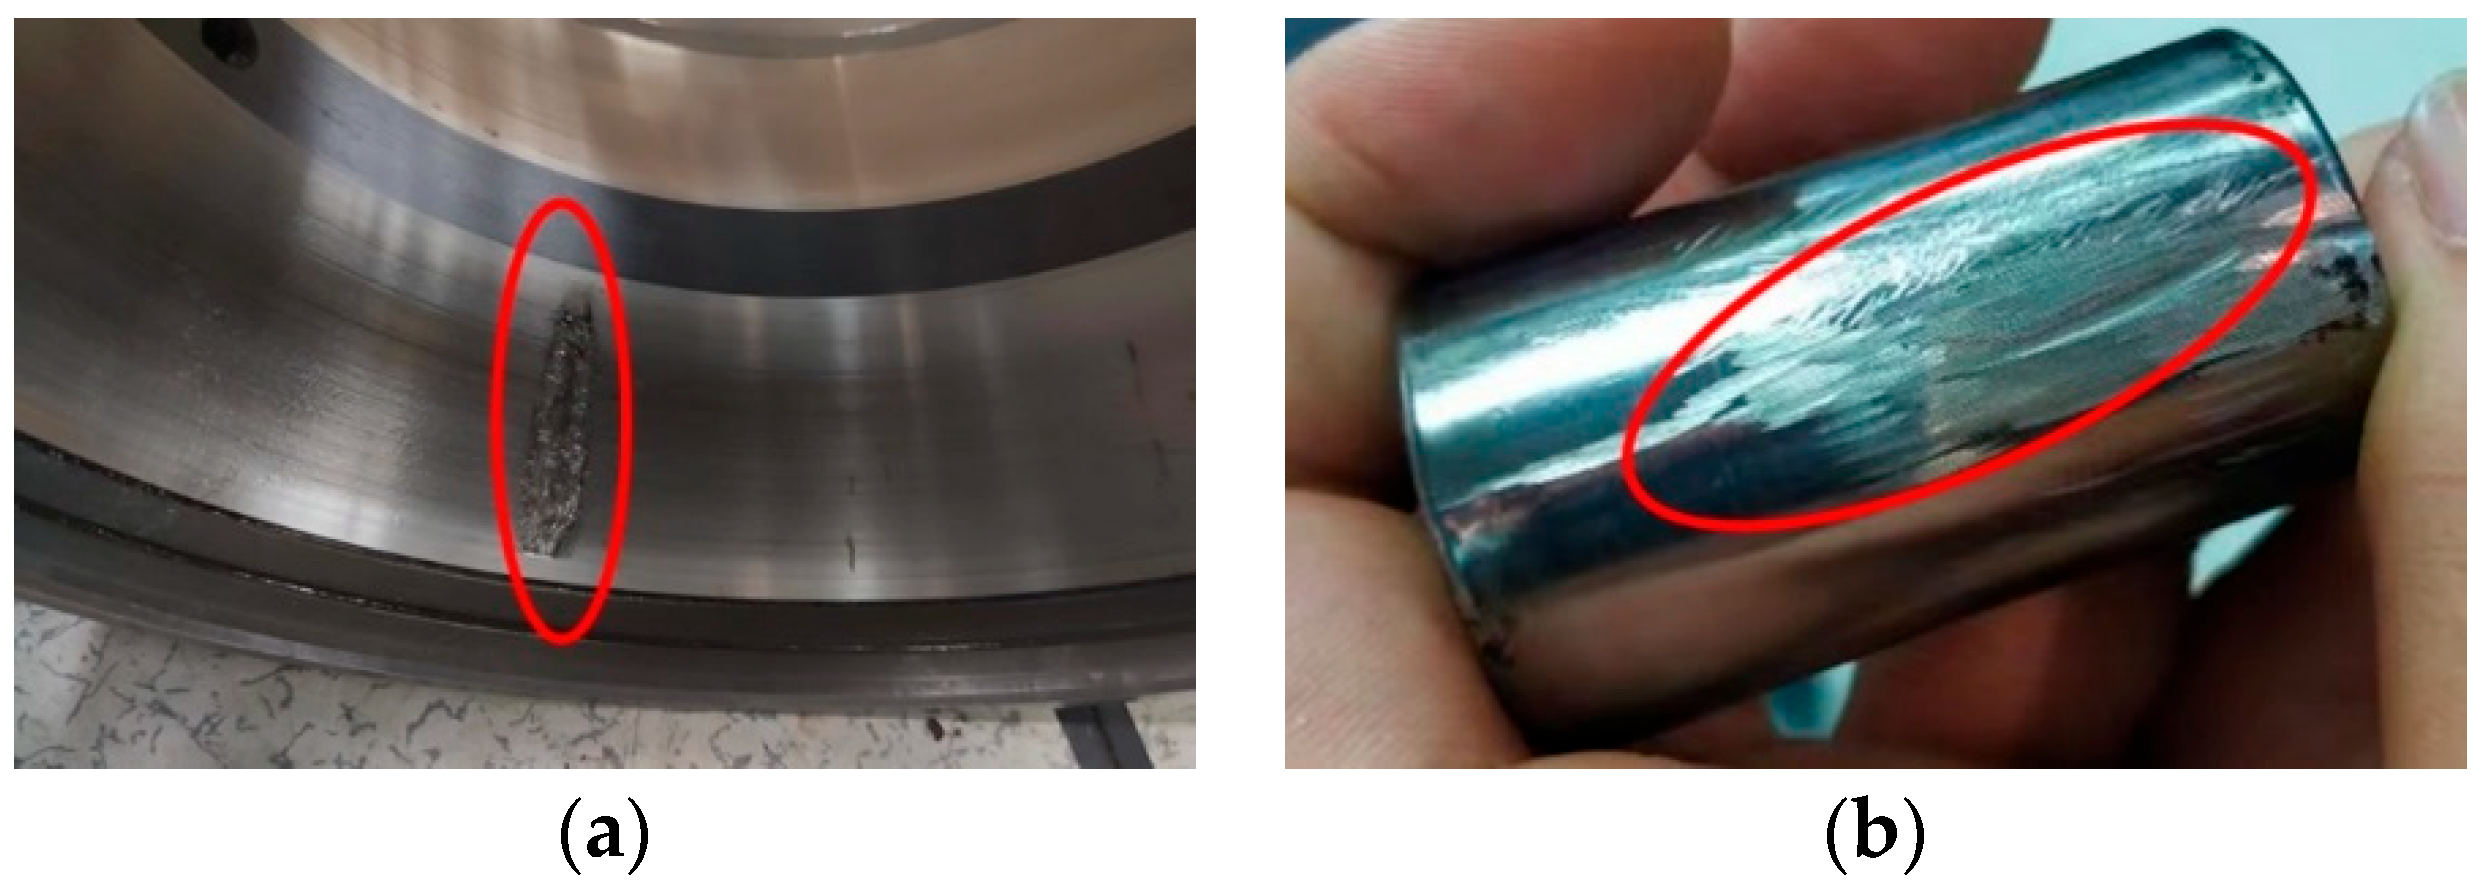
Double-row tapered roller bearings (TRBs) and double-row cylindrical roller bearings (CRBs) commonly used in high-speed train were used in tests, and the three-directional vibration acceleration signals were collected under multi-speed conditions. The fault types of the bearings used in the test are shown in Figure 10.
Four vibration acceleration signals acquisition tests were conducted according to the conditions in Table 4. The sampling frequency was set to 25.6 kHz.

4.2. Experimental Signals Analysis

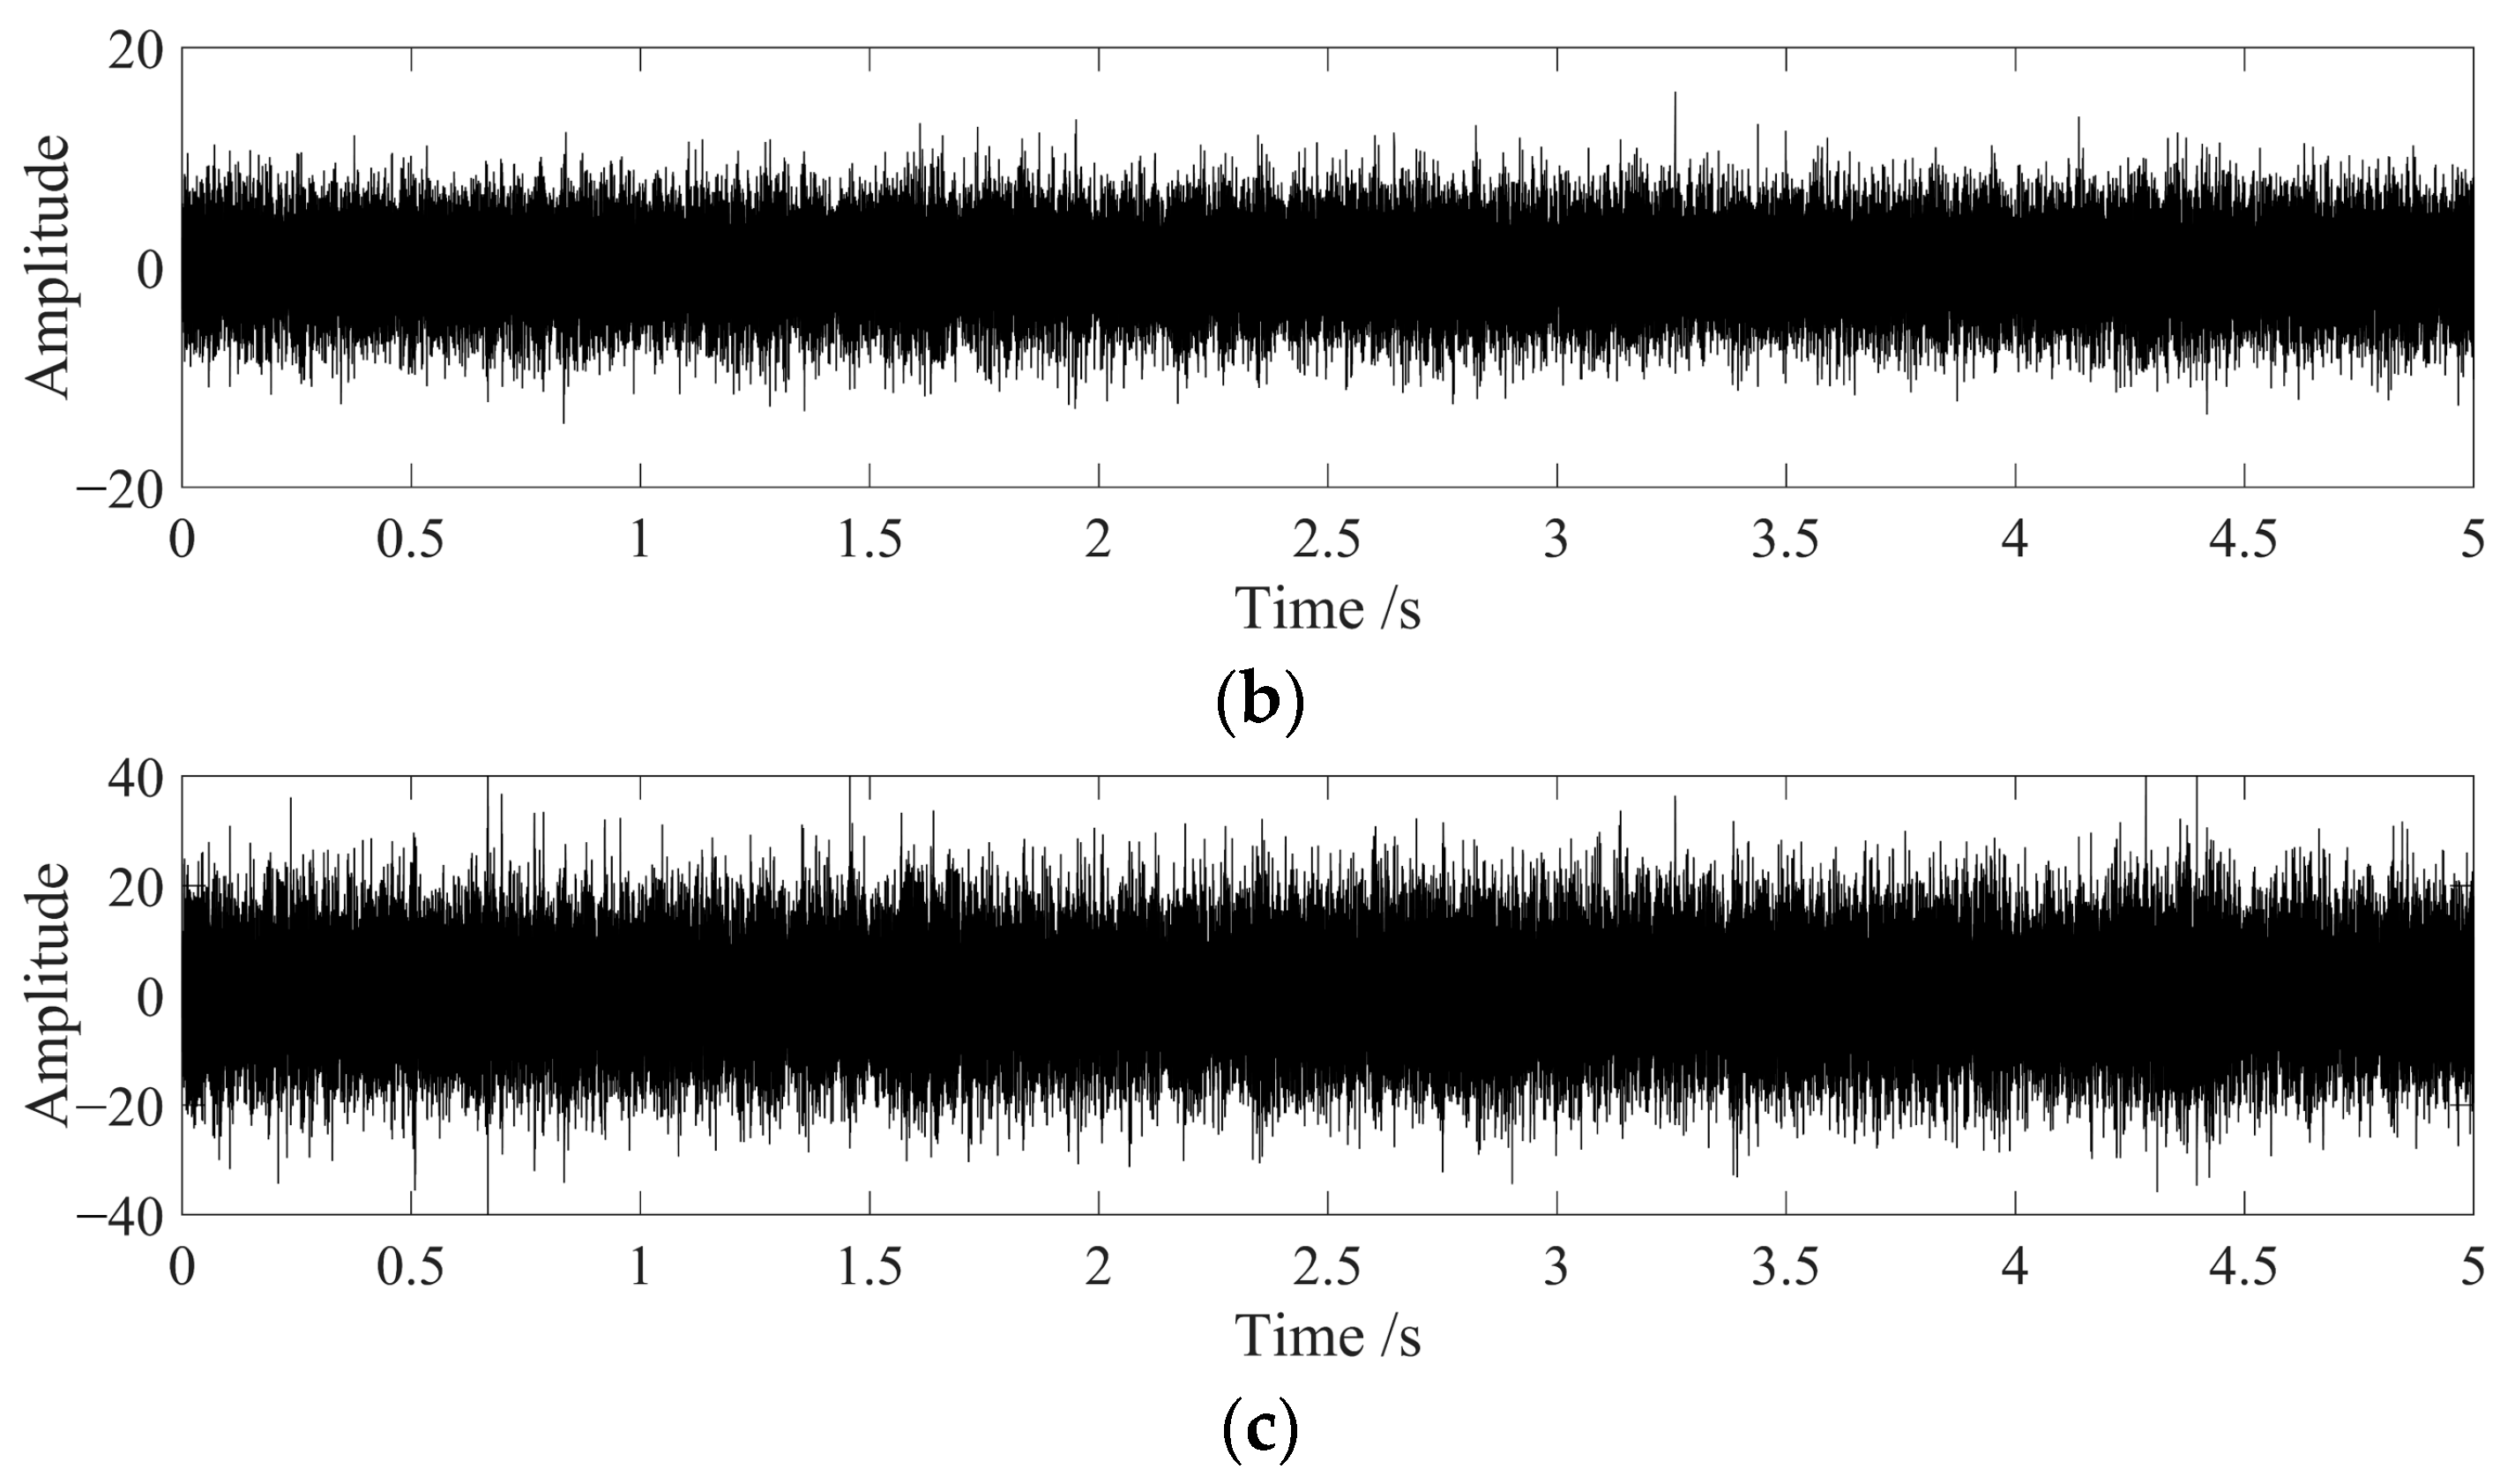
4.2.1. Case 1: TRB with Outer Ring Fault at 1000 r/min

The three-directional vibration acceleration signals of the bearing in Case 1 were collected as shown in Figure 11.
There is no obvious periodic fault impact in the time domain of the three-direction vibration acceleration signals in Figure 11. The proposed fault diagnosis method was applied to extract characteristics from the PCA fusion signal of the three-direction vibration acceleration signals in Figure 11, and the optimal signals obtained after filtering with the filter bank are shown in Figure 12.
The signals of different filtering channels in Figure 12 all have noise signals, and the optimal filtering signal cannot be directly selected. The legends illustrate the lower-cut-off frequency and upper-cut-off frequency of each filtering channel. Therefore, CFECC values were calculated for the AEO demodulation spectrums corresponding to each filter channel signal in Figure 12. If there is no prior knowledge of bearing fault types, it is necessary to calculate the CFECC value corresponding to each type of bearing fault characteristic frequency separately. If the CFECC for a certain frequency in the calculation result is significantly greater than the CFECC for the remaining fault characteristic frequencies, it can be preliminarily determined that this frequency is the fault frequency of the bearing, and the spectrum containing the maximum value is the optimal demodulation spectrum. The CFECC values of the AEO spectrum corresponding to each channel signal in Figure 12 were calculated with an outer ring fault frequency fo = 122.85 Hz, an inner ring fault frequency fi = 160.49 Hz, a rolling element fault frequency fb = 60.26 Hz, P = 5, and r = 0.025, as shown in Figure 13.
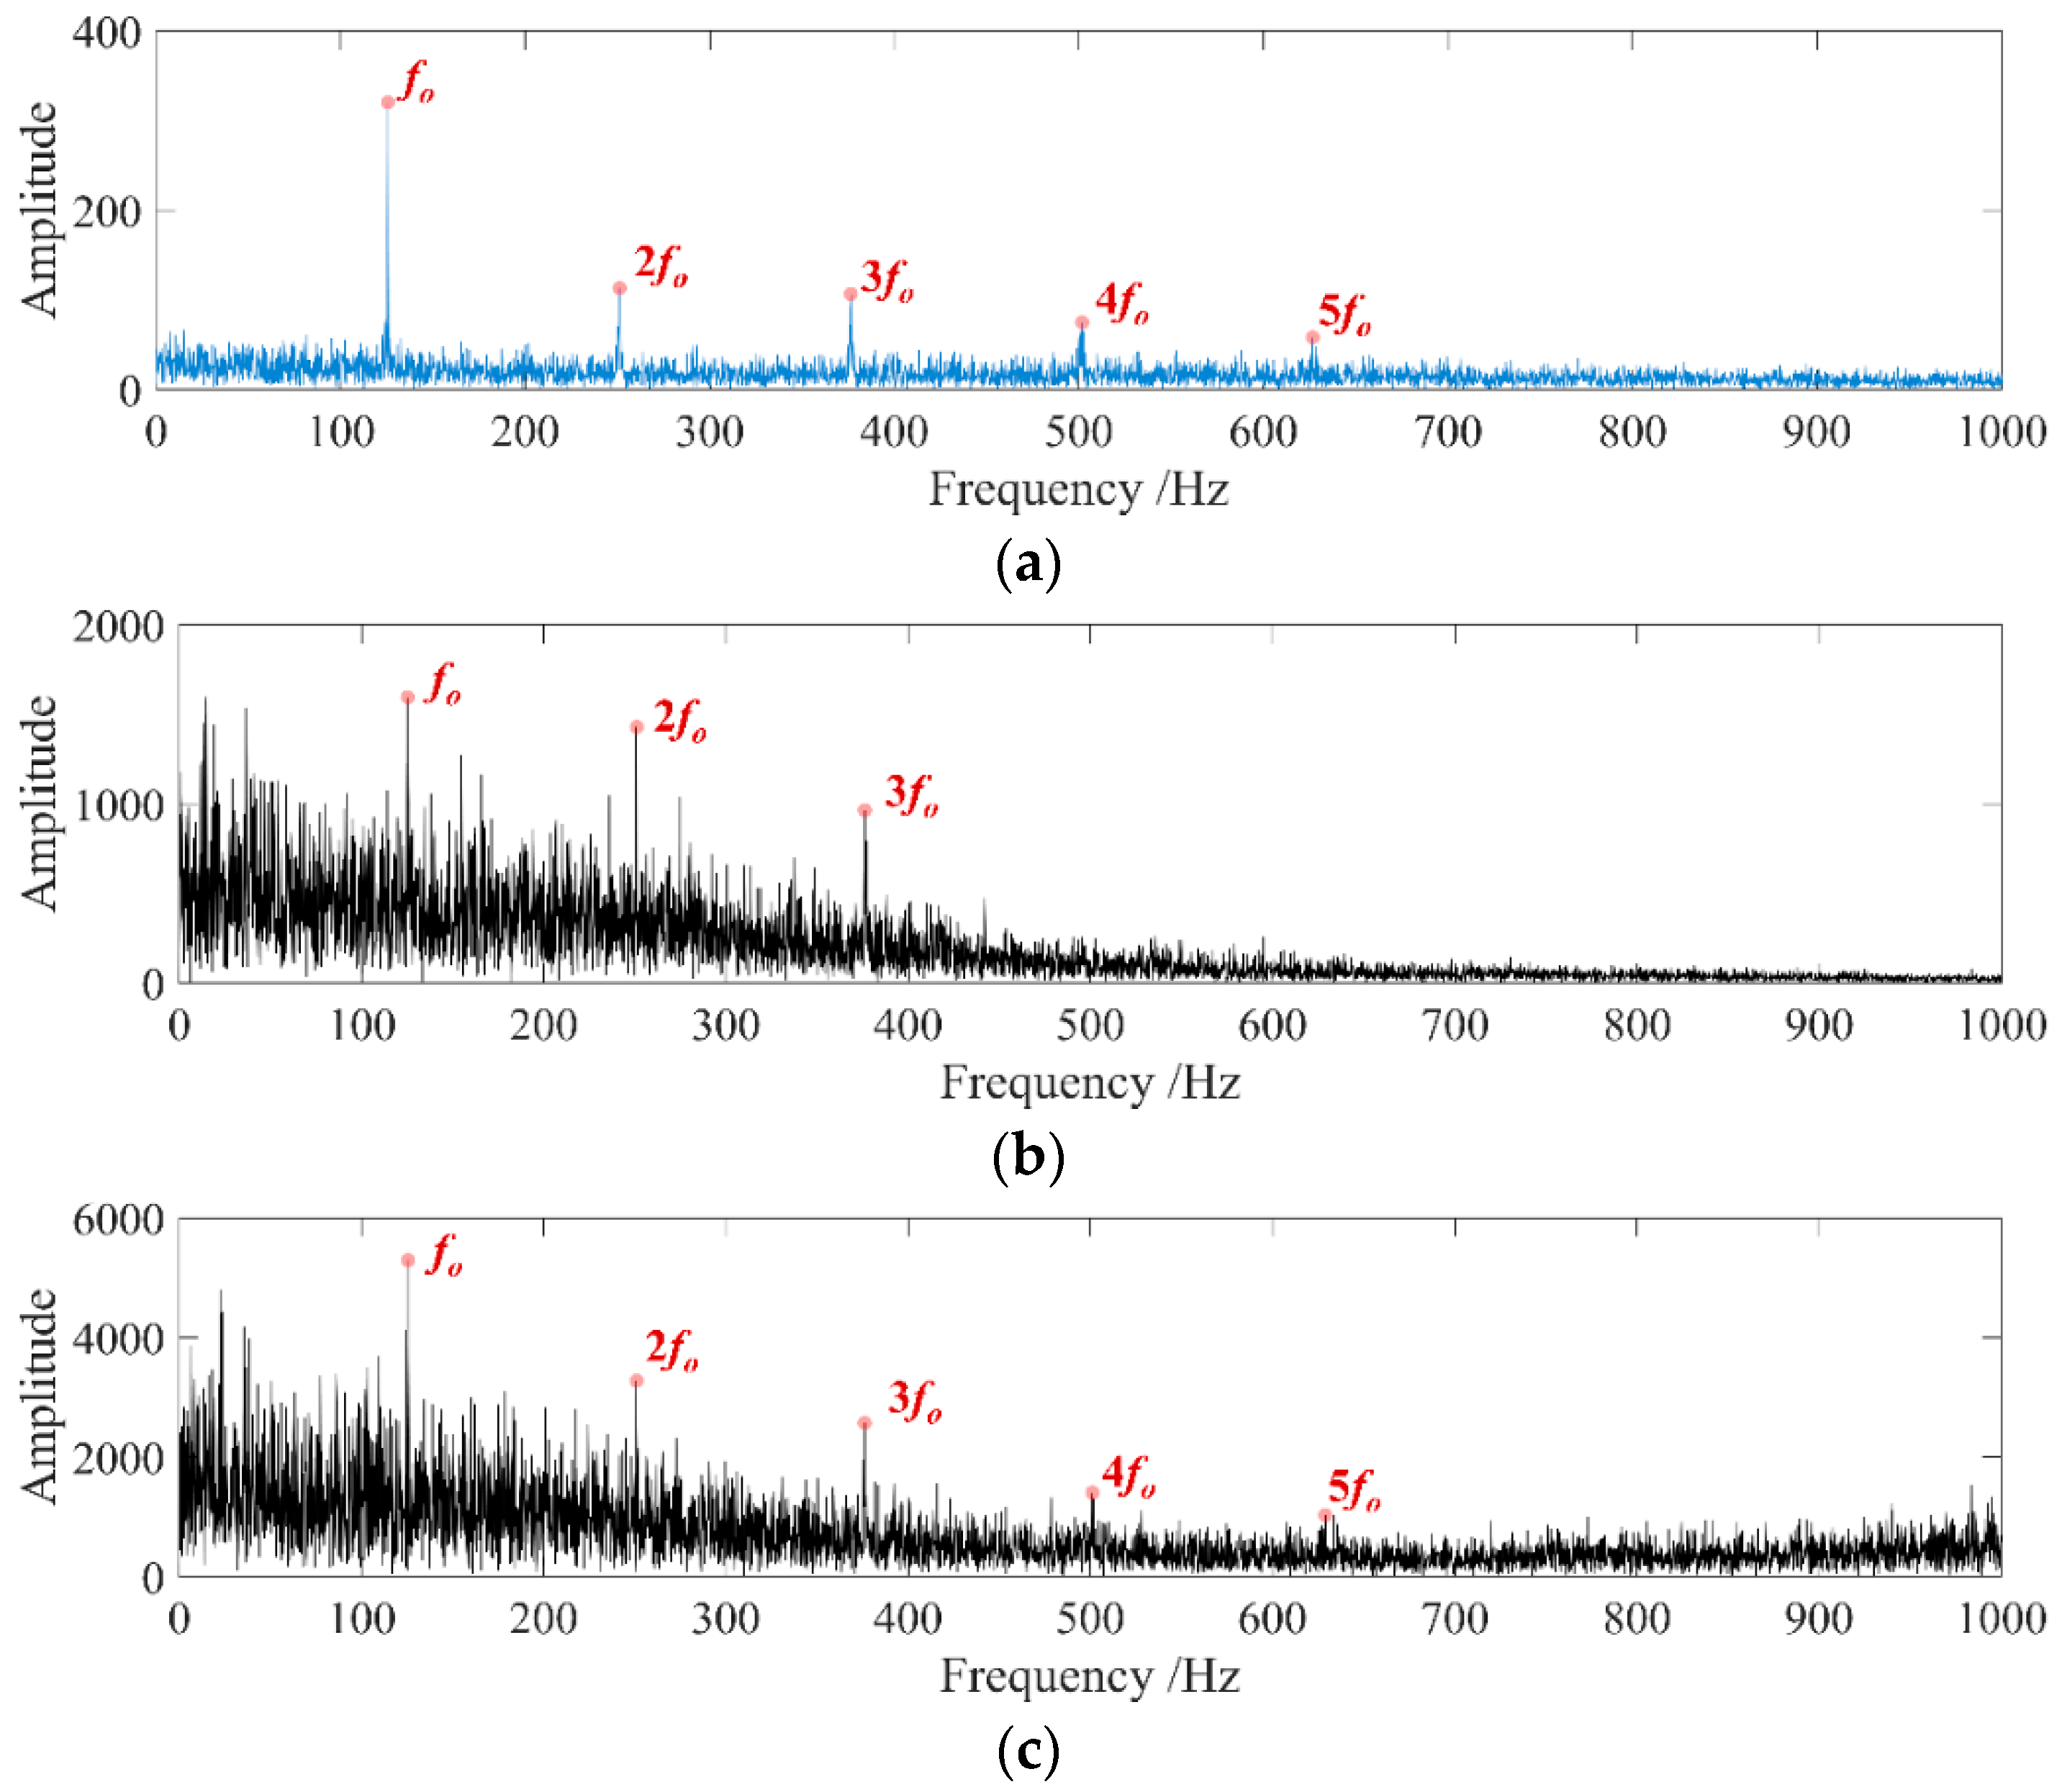
The AEO demodulation spectrum of the signal of Channel 10 was selected as the optimal demodulation spectrum and the fault type was determined to be the outer ring fault, which is consistent with the actual situation. The obtained characteristic spectrum is shown in Figure 14a. The demodulation spectrums of the optimal IMF component of the NAMEMD–Hilbert method and MVMD–Hilbert method are shown in Figure 14b,c.
As can be seen from Figure 14a, after the processing of the proposed method, the final demodulation spectrum shows significant high-amplitude spectral lines at the theoretical outer ring fault frequency and its first five order harmonics, and the characteristic frequency information is prominently distributed in the spectrum. It can be seen that the proposed method extracts the characteristic frequency of the outer ring fault of the bearing well. The CFECC values of bearing outer ring fault signals demodulation spectrums in Figure 14b,c are 1.6043 and 1.8062, respectively, which are smaller than the CFECC value of the demodulation spectrum in Figure 14a.

4.2.2. Case 2: TRB with Outer Ring Fault at 1150 r/min

The three-directional vibration acceleration signals of the bearing in Case 2 were collected as shown in Figure 15.
There is no obvious periodic fault impact in the time domain of the three-directional vibration acceleration signals in Figure 15. The proposed fault diagnosis method was applied to extract characteristics from the PCA fusion signal of the three-directional vibration acceleration signals in Figure 15, and the optimal signals obtained after filtering with the filter bank are shown in Figure 16.
The signals of different filtering channels in Figure 16 all have noise signals, and the optimal filtering signal cannot be directly selected. Therefore, The CFECC values of the AEO spectrum corresponding to each channel signal in Figure 16 were calculated with an outer ring fault frequency fo = 141.27 Hz, an inner ring fault frequency fi = 184.56 Hz, a rolling element fault frequency fb = 69.29 Hz, P = 5, and r = 0.025, as shown in Figure 17.
The AEO demodulation spectrum of the signal of Channel 10 was selected as the optimal demodulation spectrum and the fault type was determined to be the bearing outer ring fault, which is consistent with the actual situation. The final obtained characteristic spectrum is shown in Figure 18a. The demodulation spectrums of the optimal IMF components of the NAMEMD–Hilbert method and MVMD–Hilbert method are shown in Figure 18b,c.
The obvious bearing outer ring fault frequency and its first five order harmonics are extracted in Figure 18a, which has a good characteristic extraction effect. The CFECC values of bearing outer ring fault signals demodulation spectrums in Figure 18b,c are 2.7174 and 2.3736, respectively, which are smaller than the CFECC value of the demodulation spectrum in Figure 18a.

4.2.3. Case 3: CRB with Rolling Element Fault at 500 r/min

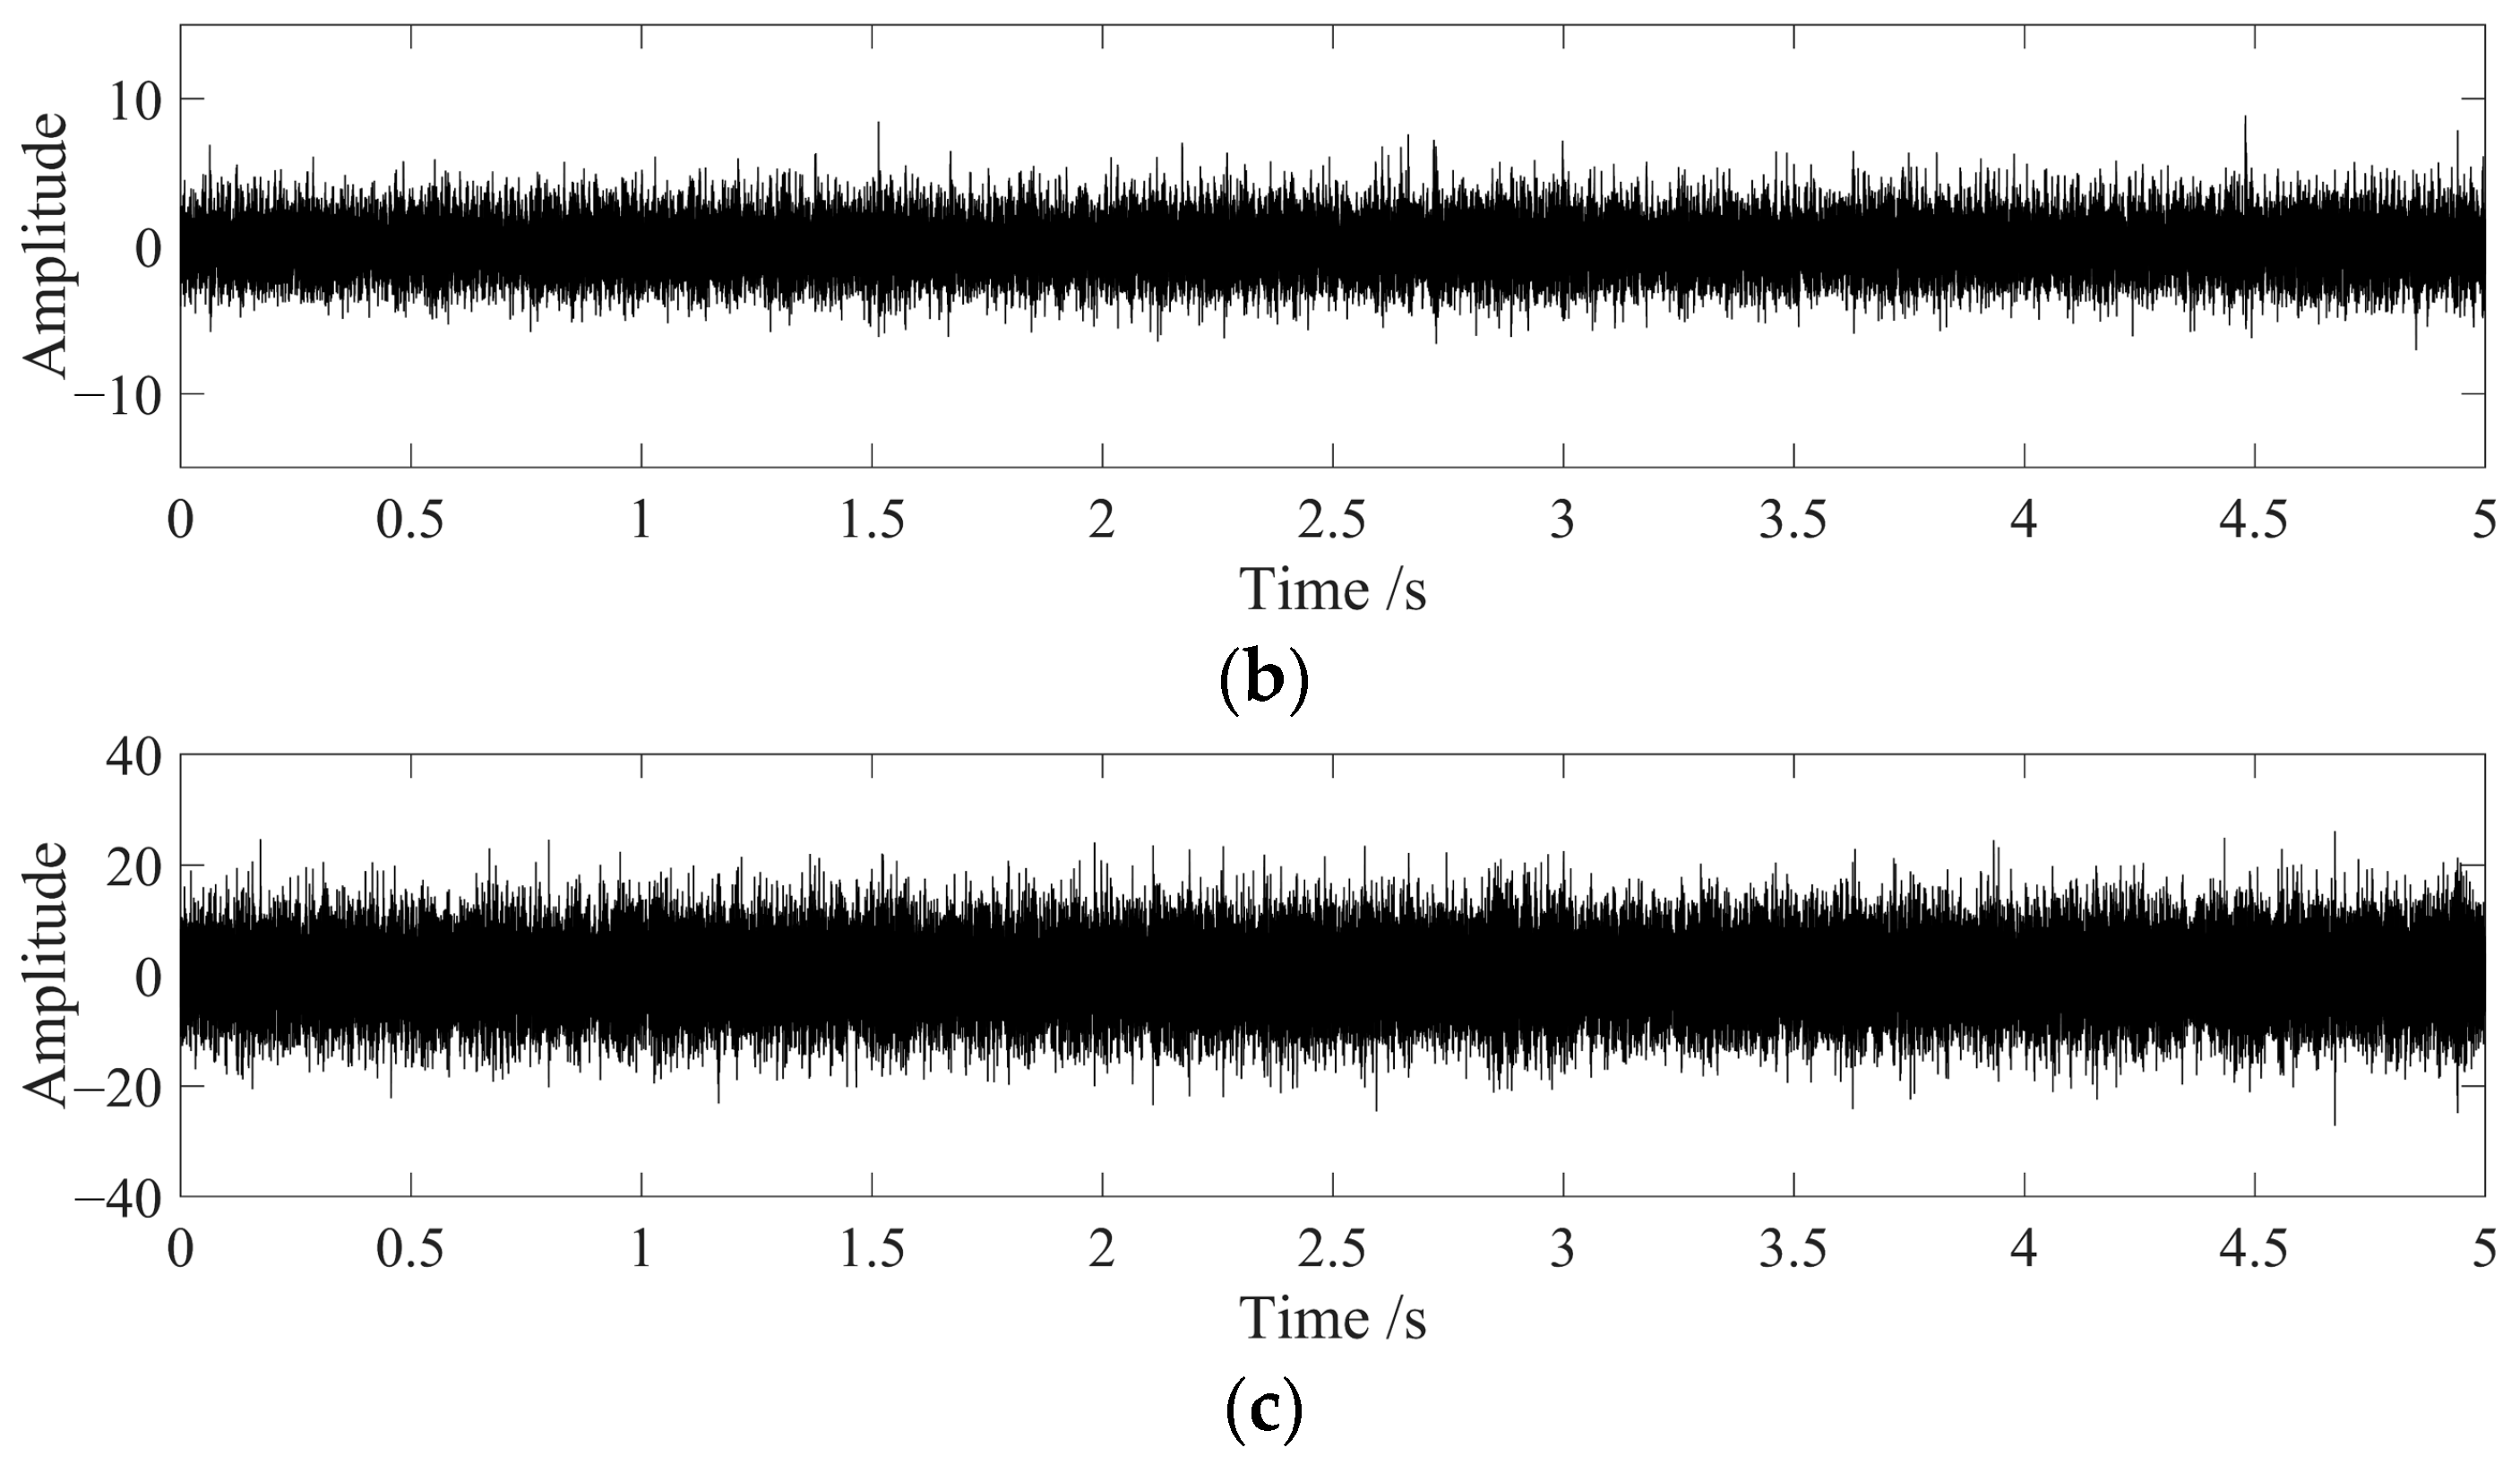
The three-directional vibration acceleration signals of the bearing in Case 3 were collected as shown in Figure 19.
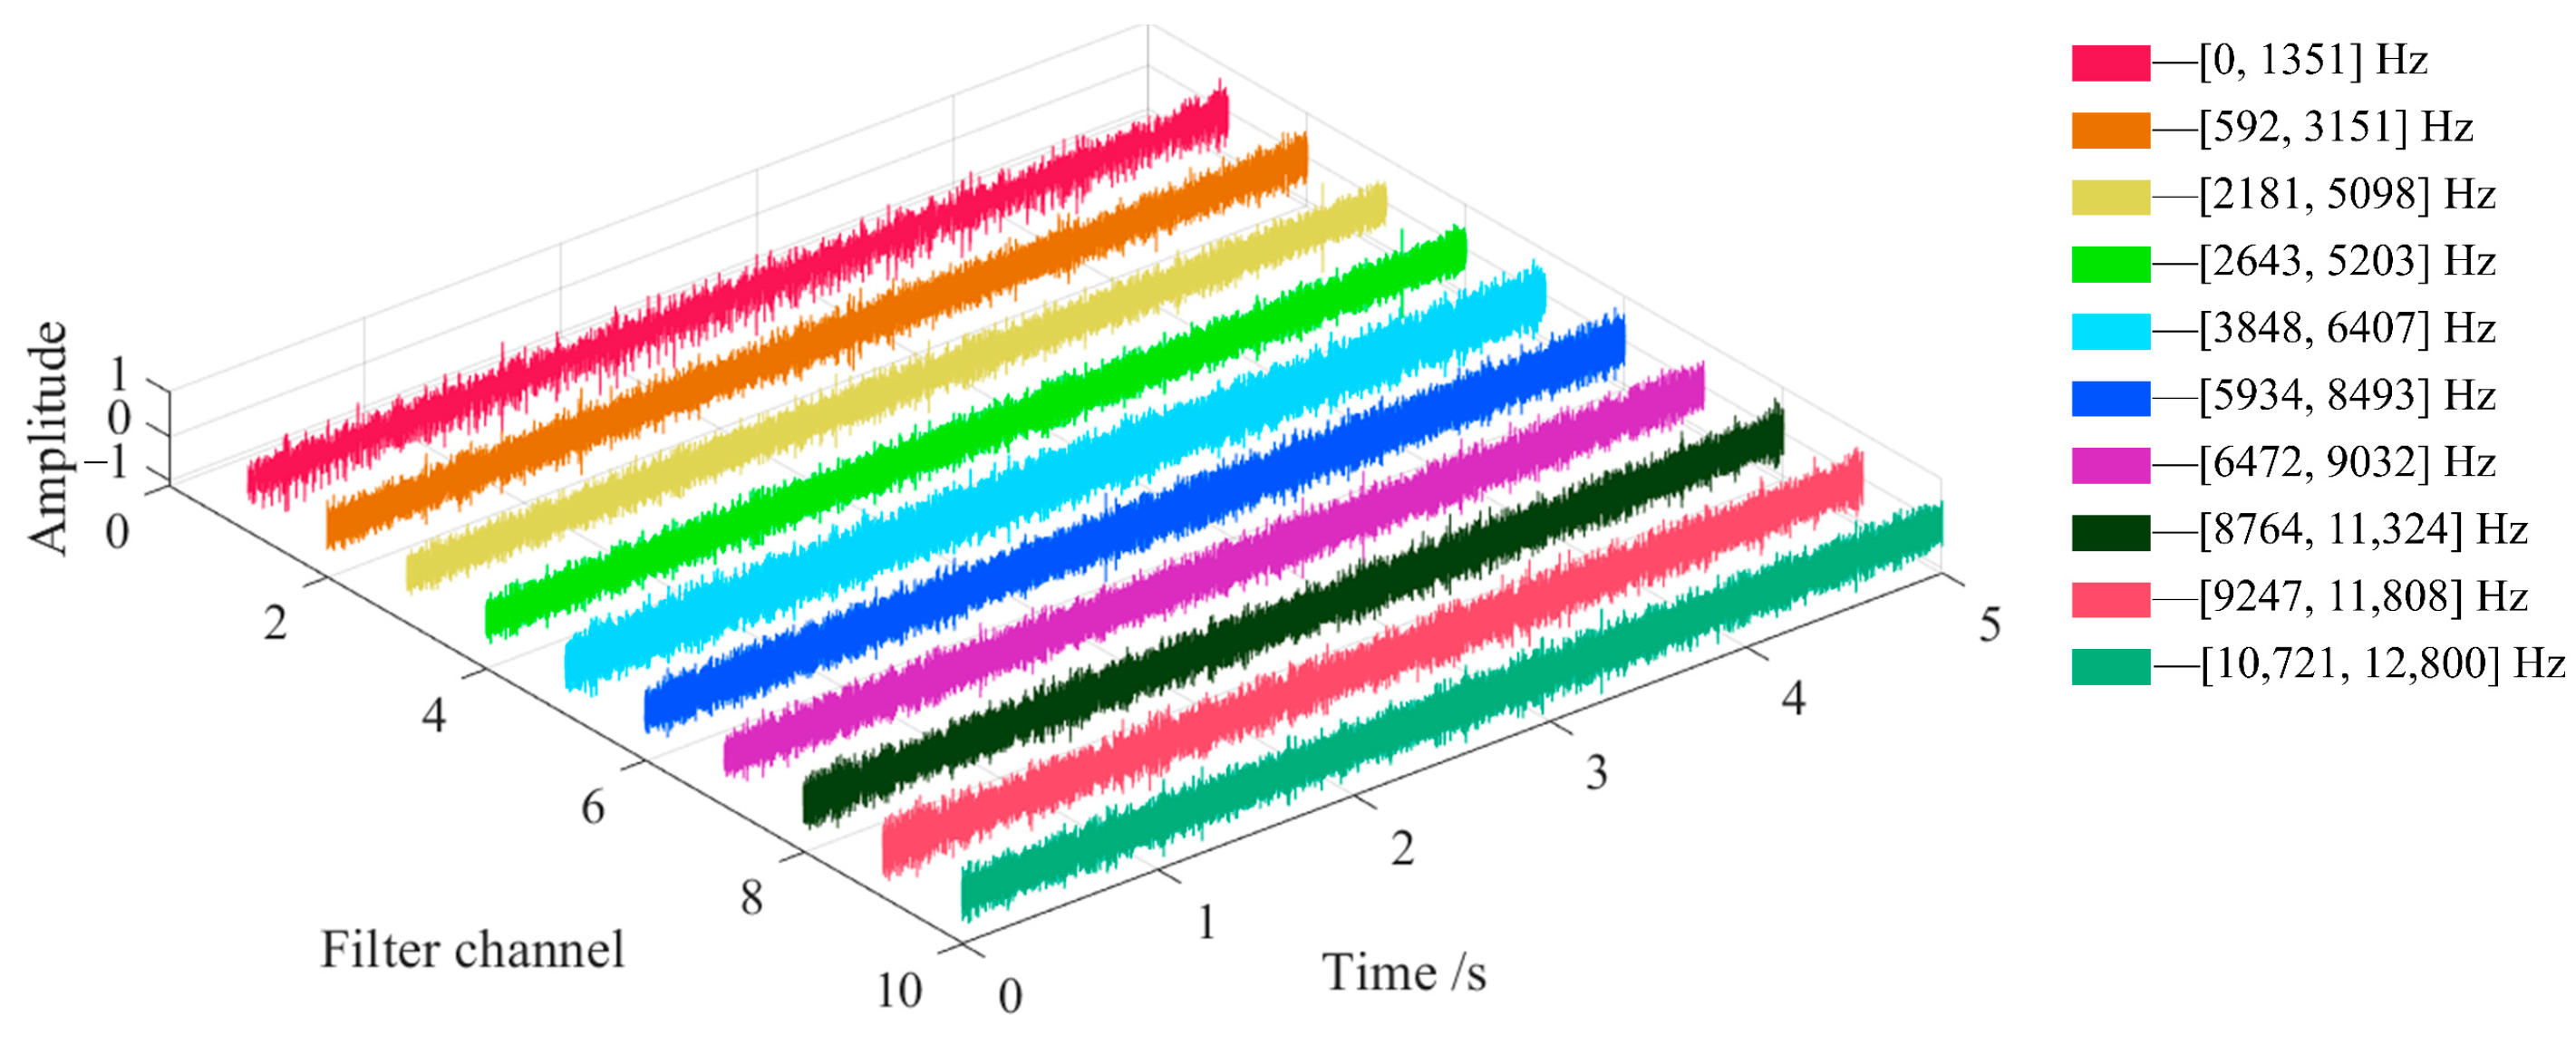
The proposed fault diagnosis method was applied to extract characteristics from the PCA fusion signal of the three-directional vibration acceleration signals in Figure 19, and the optimal signals obtained after filtering with the filter bank are shown in Figure 20.
The CFECC values of the AEO spectrum corresponding to each channel signal in Figure 20 were calculated with a bearing rolling element fault frequency fo = 60.44 Hz, an inner ring fault frequency fi = 81.23 Hz, a rolling element fault frequency fb = 27.78 Hz, P = 5, and r = 0.025, as shown in Figure 21.
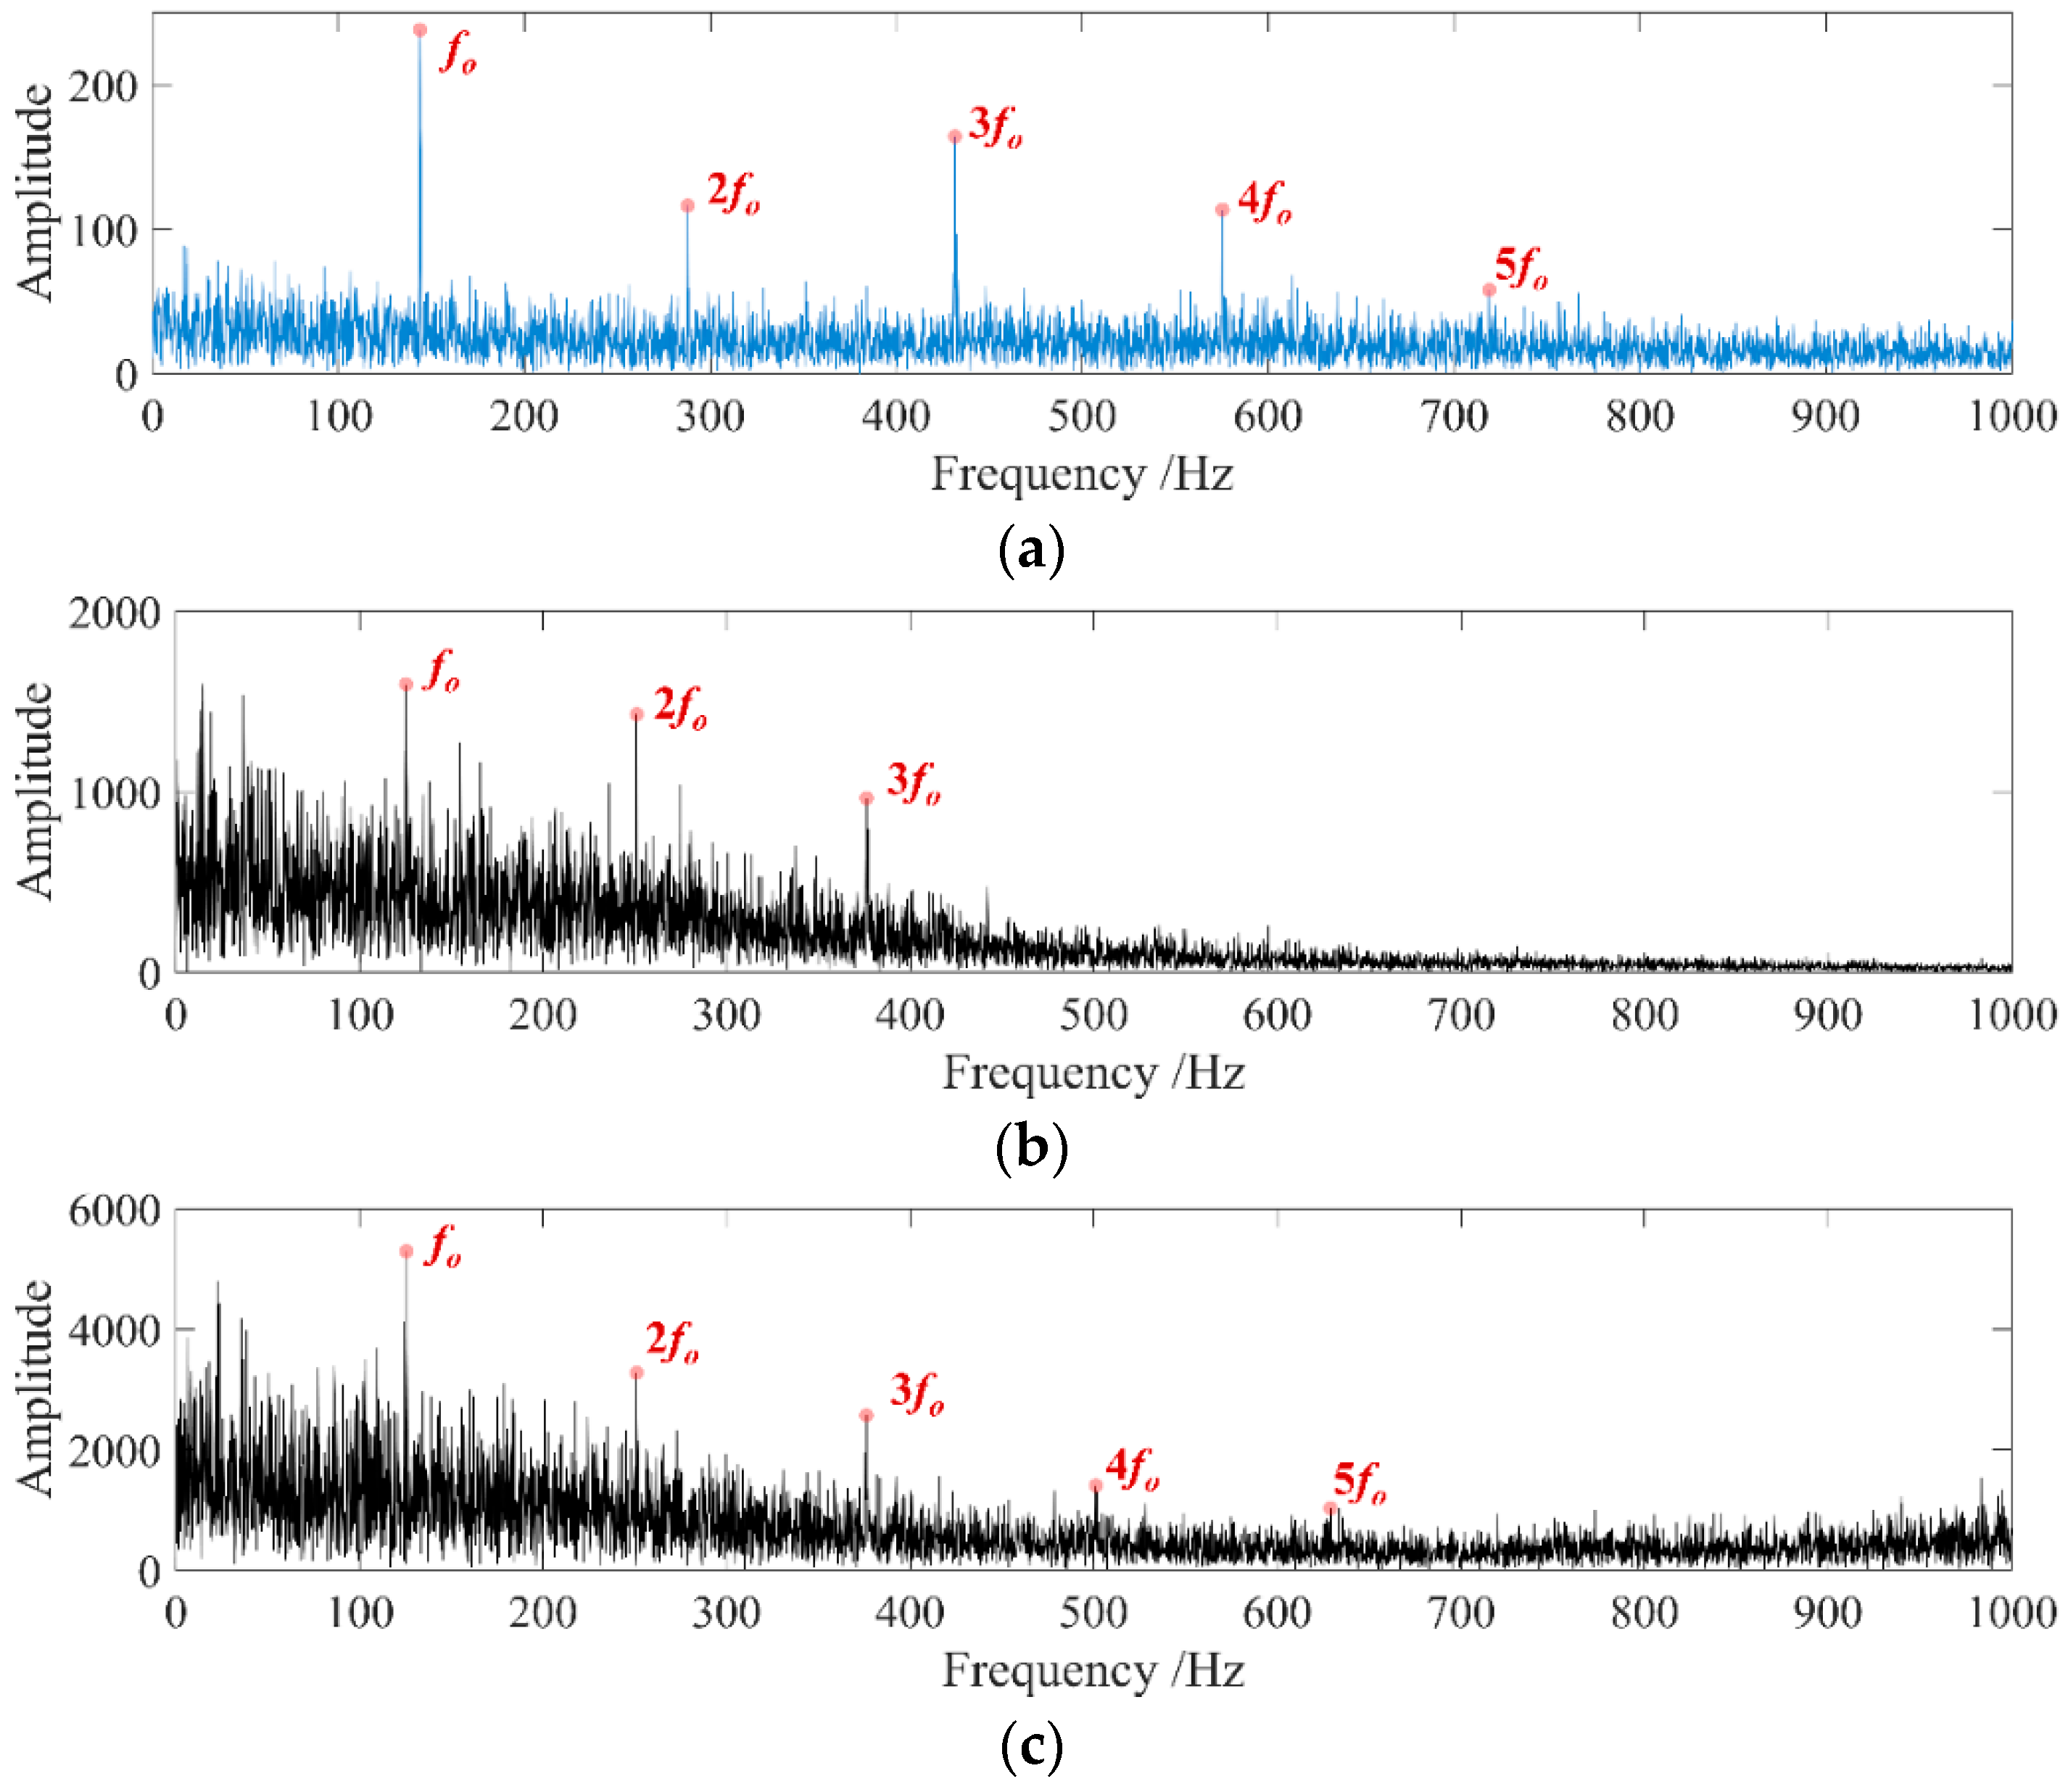
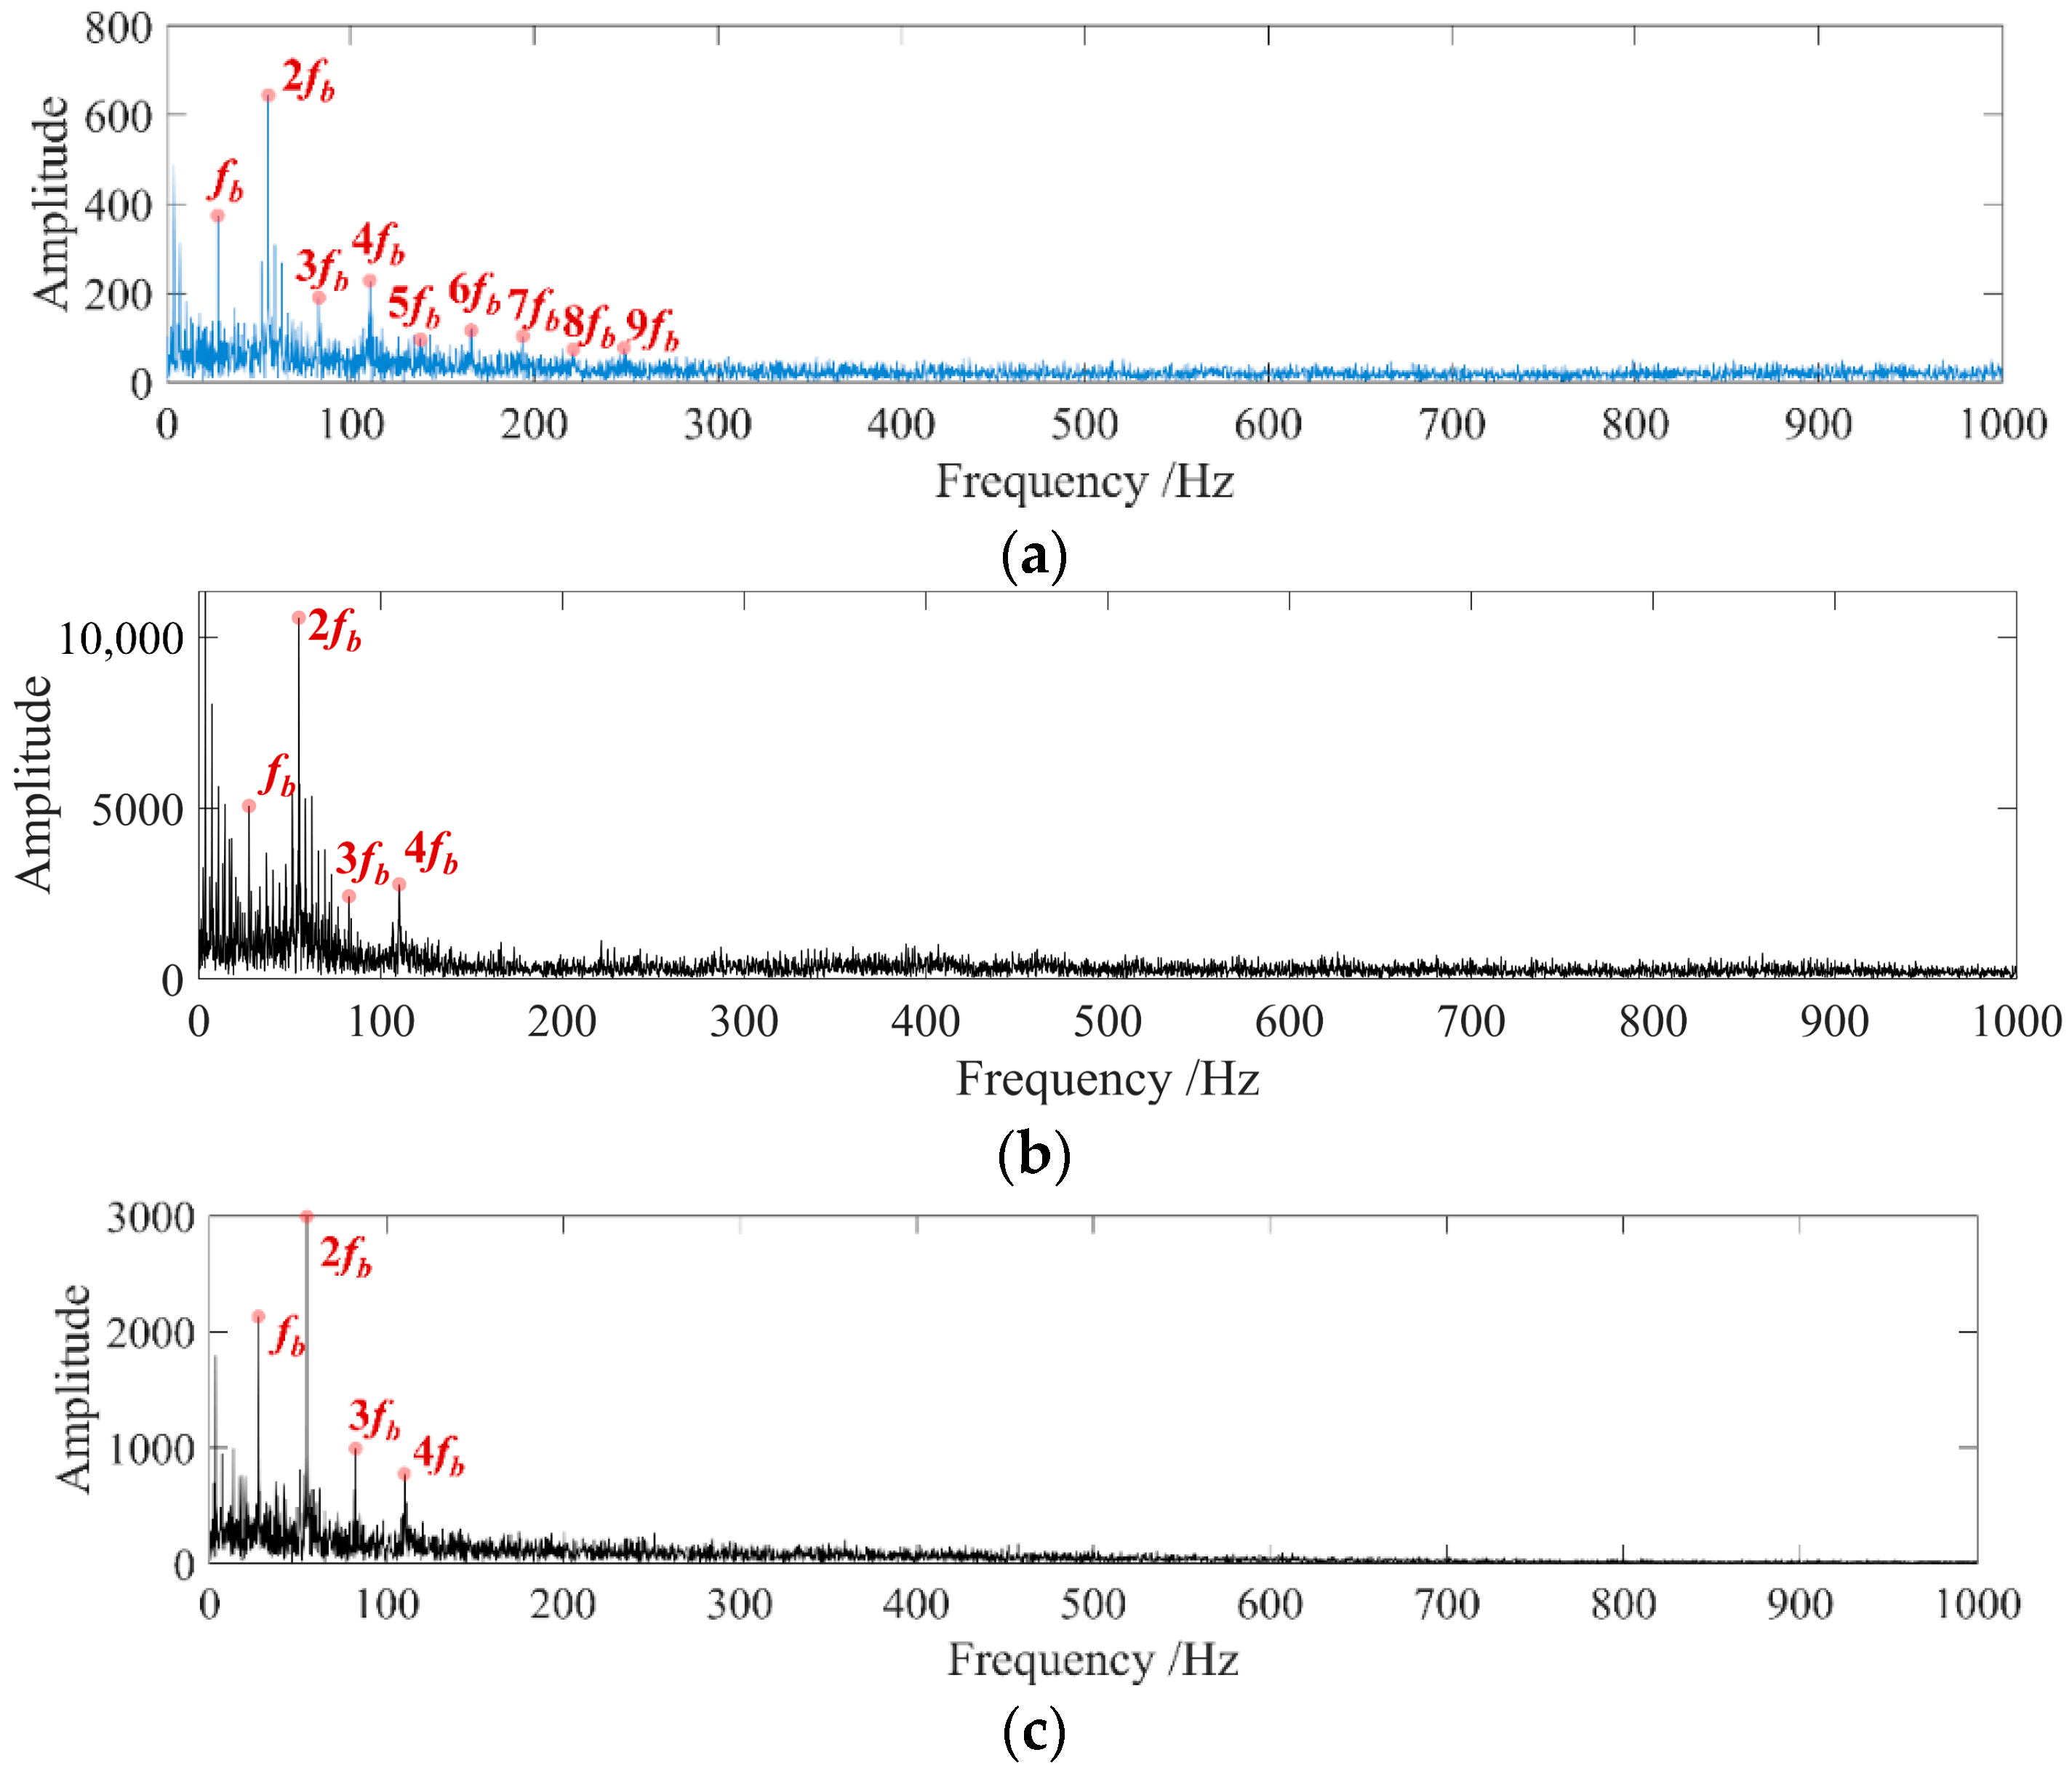
The AEO demodulation spectrum of the signal of Channel 5 was selected as the optimal demodulation spectrum, and the fault type was determined to be the bearing rolling element fault, which is consistent with the actual situation. The final obtained characteristic spectrum is shown in Figure 22a. The demodulation spectrums of the optimal IMF component of the NAMEMD–Hilbert method and MVMD–Hilbert method are shown in Figure 22b,c.
The obvious bearing rolling element fault frequency fb and its first nine order harmonics are extracted in Figure 22a, which has a good characteristic extraction effect. The CFECC values of bearing rolling element fault signal demodulation spectrums in Figure 22b,c are 1.7146 and 3.1951, respectively, which are smaller than the CFECC value of the demodulation spectrum in Figure 22a.

4.2.4. Case 4: CRB with Rolling Element Fault at 1400 r/min

The three-directional vibration acceleration signals of the bearing in Case 4 were collected as shown in Figure 23.
There is no obvious periodic fault impact in the time domain of the three-direction vibration acceleration signals in Figure 23. The proposed fault diagnosis method was applied to extract characteristics from the PCA fusion signal of the three-directional vibration acceleration signals in Figure 23, and the optimal signals obtained after filtering with the filter bank are shown in Figure 24.
There is no obvious periodic fault impact in the time domain of the three-direction vibration acceleration signals in Figure 24. The CFECC values of the AEO spectrum corresponding to each channel signal in Figure 24 were calculated with a bearing rolling element fault frequency fo = 169.23 Hz, an inner ring fault frequency fi = 227.44 Hz, a rolling element fault frequency fb = 77.79 Hz, P = 5, and r = 0.025, as shown in Figure 25.
The AEO demodulation spectrum of the signal of Channel 2 was selected as the optimal demodulation spectrum, and the fault type was determined to be the bearing rolling element fault, which is consistent with the actual situation. The final obtained characteristic spectrum is shown in Figure 26a. The optimal IMF demodulation spectrums extracted by the NAMEMD–Hilbert method and MVMD–Hilbert method for the signals in Case 4 are shown in Figure 26b,c.
The obvious bearing rolling element fault frequency fb and its first five order harmonics are extracted in Figure 26a, which has a good characteristic extraction effect. The CFECC values of bearing rolling element fault signals demodulation spectrums in Figure 26b,c are 2.3486 and 3.0779, respectively, which are smaller than the CFECC value of the demodulation spectrum in Figure 26a.

5. Discussions

The core of the fault diagnosis method proposed in this paper is bandpass filtering, and the optimal filtering signal is determined by the selection of the AEO demodulation spectrum of the filtering signal. In the simulation signal analysis, a periodic impact signal with a definite frequency was established, and the proportion of the periodic impact component in the signal was weakened by adding noise, which could make the simulation signal closer to the actual signal, and also could verify the superiority of the fault diagnosis method. The noise interference could be clearly seen in Figure 6b–d, while the periodic shocks were masked. After using the proposed fault diagnosis method to process the signal step by step, a more obvious characteristic frequency appeared in the spectrum as shown in Figure 8, which was the same as the preset 159 Hz. It could be considered that the proposed method accurately extracted the periodic impact characteristics in the signal. Compared with the spectrum obtained by the NAMEMD–Hilbert and MVMD–Hilbert method, the final spectrum obtained in this paper had more obvious impact spectrum peaks.
The vibration response characteristics after bearing fault impact were considered in the establishment of the simulation signal, and the frequency of 159 Hz was also within the main fault characteristic frequency range in the bearing experiment. If there is strong noise interference in the experimental environment, the characteristic information can still be extracted by the proposed method. The accuracy of the simulation signal analysis results lays a good foundation for subsequent experimental signal analysis. Through the verification of the feasibility of the proposed method, it is proven that the proposed method can be used to identify the bearing fault impact in the actual operation.
In the experimental signal analysis, the bearing signals under different working conditions were also inconsistent, such as the signals under four different working conditions in Case1–Case4. The periodic impact in the fault signal of the bearing rolling element at a low rotational velocity was more obvious, but there was also more interference from the bearing rotational frequency in the spectrum, which may affect the judgment of the bearing health state. Although the method proposed in this paper can extract the fault characteristic frequency of the bearing, the result will also be interfered with by the bearing rotational frequency. In subsequent research, how to avoid the interference of rotational frequency conversion on the diagnosis results must be considered.

6. Conclusions

In this paper, a bearing fault diagnosis method based on PCA data dimension reduction fusion, multi-channel bandpass filter bank filtering, and AEO demodulation is proposed. Through the proposed CFECC value, the fault characteristic frequency of a signal can be determined and the spectrum with the most obvious harmonic performance is selected as the optimal demodulation spectrum. The effectiveness of the proposed method is proved by simulation signals and experimental signals, and it has good extraction effects on the characteristic frequencies of multi-fault type bearings at different speed levels. The main innovations and conclusions of this paper are as follows.
(1) The PCA is used for data dimension reduction and fusion. The effect of PCA on data noise reduction in data dimensionality reduction and fusion is proven by simulation signals, and it is easier to extract the characteristic frequency of the fusion signal.
(2) An improved average kurtosis index KTfinal is proposed, which can effectively avoid the interference of monopulse impact on signal characteristics. Based on the KTfinal, the selection criteria of optimal filtered signals for each channel under a multi-channel bandpass filter bank are determined.
(3) The AEO is used to demodulate the filtered signal to find the fault characteristic frequency, and the spectrum characteristic index CFECC parameter is proposed. The CFECC can be used to calculate the local energy prominence ability of different characteristic frequencies and their harmonics in the spectrum, which is beneficial for determining the type of fault and selecting the demodulation spectrum containing the characteristic frequency and its harmonic component prominence to achieve a better fault diagnosis effect.
The method proposed in this paper provides a new solution for the comprehensive use of bearing three-direction vibration acceleration signals, which can improve the accuracy of bearing fault diagnosis. Meanwhile, it also has good application value for the research of multi-signal fault diagnosis methods for other rotating machinery components. More research is still needed in signal noise reduction.
Author Contributions

Conceptualization, Z.W. and Z.Z.; methodology, Z.W. and Z.Z.; software, Z.W. and Z.Z.; validation, Z.Z. and X.X.; formal analysis, Z.W. and Z.Z.; investigation, Z.W. and X.X.; resources, D.S.; data curation, D.S.; writing—original draft preparation, Z.W.; writing—review and editing, Z.Z.; visualization, Z.W. and Z.Z.; supervision, D.S.; project administration, D.S.; funding acquisition, D.S. and Z.W. All authors have read and agreed to the published version of the manuscript.

Funding

This research was funded by Science and Technology Research and development program of China State Railway Group Co., Ltd., grant number N2023J011.

Data Availability Statement

The data presented in this study are available on request from the corresponding author.

Acknowledgments

The authors want to express their gratitude to Ping He at Southwest Jiaotong University, Jianxiong Dong at Chongqing University, Zhiheng Chen and Cong Deng at CRRC Zhuzhou Locomotive Co., Ltd (Zhuzhou, China) for their support with the rail vehicle bogie axle box bearing test rig.

Conflicts of Interest

Author Zhongyao Wang was employed by the company CRRC Changchun Railway Vehicles Co., Ltd. The remaining authors declare that the research was conducted in the absence of any commercial or financial relationships that could be construed as a potential conflict of interest.

References

  1. Lu, Z.; Wang, X.; Yue, K.; Wei, J.; Yang, Z. Coupling model and vibration simulations of railway vehicles and running gear bearings with multitype defects. Mech. Mach. Theory 2021, 157, 104215. [Google Scholar]
  2. Liu, Y.; Kang, J.; Bai, Y.; Guo, C. Research on the health status evaluation method of rolling bearing based on EMD-GA-BP. Qual. Reliab. Eng. Int. 2023, 39, 2069–2080. [Google Scholar]
  3. Chen, J.; Hua, C.; Dong, D.; Ouyang, H. Adaptive scale decomposition and weighted multikernel correntropy for wheelset axle box bearing diagnosis under impact interference. Mech. Mach. Theory 2023, 181, 105220. [Google Scholar]
  4. Chauhan, S.; Vashishtha, G.; Kumar, R.; Zimroz, R.; Gupta, M.; Kundu, P. An adaptive feature mode decomposition based on a novel health indicator for bearing fault diagnosis. Measurement 2024, 226, 114191. [Google Scholar]
  5. Tan, H.; Xie, S.; Zhou, H.; Ma, W.; Yang, C.; Zhang, J. Sensible multiscale symbol dynamic entropy for fault diagnosis of bearing. Int. J. Mech. Sci. 2023, 256, 108509. [Google Scholar]
  6. Zhou, K.; Tang, J. A wavelet neural network informed by time-domain signal preprocessing for bearing remaining useful life prediction. Appl. Math. Model. 2023, 122, 220–241. [Google Scholar]
  7. Yang, M.; Zhang, K.; Sheng, Z.; Zhang, X.; Xu, Y. The amplitude modulation bispectrum: A weak modulation features extracting method for bearing fault diagnosis. Reliab. Eng. Syst. Saf. 2024, 250, 110241. [Google Scholar]
  8. Chen, B.; Zhang, W.; Gu, J.; Song, D.; Cheng, Y.; Zhou, Z.; Gu, F.; Ball, A. Product envelope spectrum optimization-gram: An enhanced envelope analysis for rolling bearing fault diagnosis. Mech. Syst. Signal Process. 2023, 193, 110270. [Google Scholar]
  9. Jiang, Z.; Zhang, K.; Xiang, L.; Yu, G.; Xu, Y. A time-frequency spectral amplitude modulation method and its applications in rolling bearing fault diagnosis. Mech. Syst. Signal Process. 2023, 185, 109832. [Google Scholar]
  10. Zou, X.; Zhang, H.; Jiang, Z.; Zhang, K.; Xu, Y. Toward accurate extraction of bearing fault modulation characteristics with novel time–frequency modulation bispectrum and modulation Gini index analysis. Mech. Syst. Signal Process. 2024, 219, 111629. [Google Scholar]
  11. Yang, J.; Bai, Y.; Wang, J.; Zhao, Y. Tri-axial vibration information fusion model and its application to gear fault diagnosis in variable working conditions. Meas. Sci. Technol. 2019, 30, 095009. [Google Scholar]
  12. Chahinez, O.; Sadok, B. Data fusion for ITS: A systematic literature review. Inf. Fusion 2023, 89, 267–291. [Google Scholar]
  13. Demirci, M.; Gozde, H.; Taplamacioglu, M. Improvement of power transformer fault diagnosis by using sequential Kalman filter sensor fusion. Int. J. Electr. Power Energy Syst. 2023, 149, 109038. [Google Scholar]
  14. He, D.; Lao, Z.; Jin, Z.; He, C.; Shan, S.; Miao, J. Train bearing fault diagnosis based on multi-sensor data fusion and dual-scale residual network. Nonlinear Dyn. 2023, 111, 14901–14924. [Google Scholar]
  15. Dubois, D.; Prade, H. Upper and lower possibilities induced by a multivalued mapping. IFAC Proc. 1983, 16, 325–339. [Google Scholar]
  16. Tang, X.; Gu, X.; Rao, L.; Lu, J. A single fault detection method of gearbox based on random forest hybrid classifier and improved Dempster-Shafer information fusion. Comput. Electr. Eng. 2021, 92, 107101. [Google Scholar]
  17. Panigrahy, P.; Chattopadhyay, P. Tri-axial vibration based collective feature analysis for decent fault classification of VFD fed induction motor. Measurement 2021, 168, 108460. [Google Scholar]
  18. Rilling, G.; Flandrin, P.; Goncalves, P.; Lilly, J. Bivariate empirical mode decomposition. IEEE Signal Process. Lett. 2007, 14, 936–939. [Google Scholar]
  19. Rehman, N.; Mandic, D. Empirical mode decomposition for trivariate signals. IEEE Trans. Signal Process. 2010, 58, 1059–1068. [Google Scholar]
  20. Lv, Y.; Yuan, R.; Song, G. Multivariate empirical mode decomposition and its application to fault diagnosis of rolling bearing. Mech. Syst. Signal Process. 2016, 81, 219–234. [Google Scholar]
  21. An, X.; Yang, J. A method of eliminating the vibration signal noise of hydropower unit based on NA-MEMD and approximate entropy. Proc. Inst. Mech. Eng. Part E J. Process Mech. Eng. 2014, 231, 317–328. [Google Scholar]
  22. Rehman, N.; Aftab, H. Multivariate variational mode decomposition. IEEE Trans. Signal Process. 2019, 67, 6039–6052. [Google Scholar]
  23. Wu, H.; Cheng, J.; Nie, Y.; Wang, J.; Yang, Y. Multivariate complex modulation model decomposition and its application to gear fault diagnosis. Digit. Signal Process. 2023, 135, 103940. [Google Scholar]
  24. Zhou, J.; Yang, Y.; Li, X.; Shao, H.; Cheng, J. Multivariate local characteristic-scale decomposition and 1.5-dimensional empirical envelope spectrum based gear fault diagnosis. Mech. Mach. Theory 2022, 172, 104772. [Google Scholar]
  25. Wang, H.; Ni, G.; Chen, J.; Qu, J. Research on rolling bearing state health monitoring and life prediction based on PCA and Internet of things with multi-sensor. Measurement 2020, 157, 107657. [Google Scholar]
  26. Shahdoosti, H.; Ghassemian, H. Combining the spectral PCA and spatial PCA fusion methods by an optimal filter. Inf. Fusion 2016, 27, 150–160. [Google Scholar]
  27. Mochammad, S.; Noh, Y.; Kang, Y. Bearing fault degradation modeling based on multitime windows fusion unsupervised health indicator. IEEE Sens. J. 2023, 23, 19623–19634. [Google Scholar]
  28. Bashir, R.; Junejo, R.; Qadri, N.; Fleury, M.; Qadri, M. SWT and PCA image fusion methods for multi-modal imagery. Multimed. Tools Appl. 2019, 78, 1235–1263. [Google Scholar]
  29. Soleimani, M.; Campean, F.; Neagu, D. Diagnostics and prognostics for complex systems: A review of methods and challenges. Qual. Reliab. Eng. Int. 2021, 37, 3746–3778. [Google Scholar]
  30. Fairley, N.; Bargiela, P.; Huang, W.; Baltrusaitis, J. Principal Component Analysis (PCA) unravels spectral components present in XPS spectra of complex oxide films on iron foil. Appl. Surf. Sci. Adv. 2023, 17, 100447. [Google Scholar]
  31. Lei, X.; Yu, J.; Aini, H.; Wu, W. Data-driven alternating current optimal power flow: A Lagrange multiplier based approach. Energy Rep. 2022, 8, 748–755. [Google Scholar]
  32. Ding, H.; Wan, G.; Zhou, Y.; Tang, J.; Zhou, Z. Nonlinearity analysis based algorithm for indentifying machine settings in the tooth flank topography correction for hypoid gears. Mech. Mach. Theory 2017, 113, 1–21. [Google Scholar]
  33. Antoni, J.; Randall, R. The spectral kurtosis: Application to the vibratory surveillance and diagnostics of rotating machines. Mech. Syst. Signal Process. 2006, 20, 308–331. [Google Scholar]
  34. Mintzer, L. Handbook of Digital Signal Processing; Academic Press: Cambridge, MA, USA, 1987; pp. 941–973. [Google Scholar]
  35. Chen, X.; Wang, S.; Qiao, B.; Chen, Q. Basic research on machinery fault diagnostics: Past, present, and future trends. Front. Mech. Eng. 2018, 13, 264–291. [Google Scholar]
  36. Cheng, J.; Xiang, T.; Yang, X.; Yang, Y. Application of analytic energy operator demodulation method to fault diagnosis of rolling bearings. Noise Vib. Control 2017, 37, 151–155. [Google Scholar]
  37. Xu, Y.; Wang, Y.; Wang, L.; Qu, J. Bearing fault detection using an alternative analytic energy operator: A fast and non-filtering method. Meas. Sci. Technol. 2021, 32, 105101. [Google Scholar]
  38. Chen, B.; Song, D.; Zhang, W.; Cheng, Y.; Wang, Z. A performance enhanced time-varying morphological filtering method for bearing fault diagnosis. Measurement 2021, 176, 109163. [Google Scholar]
  39. Li, Q.; Chen, B.; Zhang, W.; Song, D. Research on mathematical morphological operators for fault diagnosis of rolling element bearings. Measurement 2022, 203, 111964. [Google Scholar]
  40. Liu, J.; Zhao, Z.; Ren, G. An Intelligent Fault Diagnosis Method for Bogie Bearings of Train Based on Wavelet Paceket Decomposition and EEMD. J. China Railw. Soc. 2015, 37, 40–45. [Google Scholar]
  41. Zheng, Z.; Song, D.; Xu, X.; Lei, L. A fault diagnosis method of bogie axle box bearing based on spectrum whitening demodulation. Sensors 2020, 20, 7155. [Google Scholar] [CrossRef]
Figure 1. Decomposition of the frequency bandwidth.
Machines 12 00571 g001
Figure 2. Decomposition of the frequency bandwidth. (a) Periodic amplitude modulated signal without noise; (b) periodic amplitude modulated signal with −5 dB noise and a large amplitude monopulse.
Machines 12 00571 g002
Figure 3. The framework of the fault diagnosis method.
Machines 12 00571 g003
Figure 4. A time domain diagram of simulation signals. (a) The first-dimensional simulation signal with 3.2 dB noise; (b) the second-dimensional simulation signal with 2.9 dB noise; (c) the third-dimensional simulation signal with 3.1 dB noise; and (d) the PCA fusion signal.
Machines 12 00571 g004
Figure 5. The Hilbert demodulation spectrum of simulation signals. (a) The first-dimensional simulation signal with 3.2 dB noise; (b) the second-dimensional simulation signal with 2.9 dB noise; (c) the third-dimensional simulation signal with 3.1 dB noise; and (d) the PCA fusion signal.
Machines 12 00571 g005aMachines 12 00571 g005b
Figure 6. Time domain diagram. (a) Simulation signal without noise; (b) simulation signal with 7.8 dB noise; (c) simulation signal with 8 dB noise; and (d) simulation signal with 8.3 dB noise.
Machines 12 00571 g006
Figure 7. Time domain diagram of multi-filter channel signals.
Machines 12 00571 g007
Figure 8. The demodulation spectrums. (a) The AEO spectrum of the optimal filtered signal. (b) The NAMEMD–Hilbert demodulation spectrum (the number of NAMEMD IMFs is 8); (c) the MVMD–Hilbert demodulation spectrum (the number of MVMD IMFs is 8).
Machines 12 00571 g008aMachines 12 00571 g008b
Figure 9. The rail vehicle bogie axle box bearing test rig.
Machines 12 00571 g009
Figure 10. Physical diagram of axle box bearing fault. (a) Outer ring fault of TRB; (b) rolling element fault of CRB.
Machines 12 00571 g010
Figure 11. Three-directional vibration acceleration signals in Case 1. (a) Vibration acceleration signal in x direction; (b) vibration acceleration signal in y direction; and (c) vibration acceleration signal in z direction.
Machines 12 00571 g011aMachines 12 00571 g011b
Figure 12. A time domain diagram of the multi-filter channel signals in Case 1.
Machines 12 00571 g012
Figure 13. CFECC values of multiple fault characteristic frequencies in Case 1.
Machines 12 00571 g013
Figure 14. The demodulation spectrums in Case 1. (a) The optimal demodulation spectrum of the PCA fusion signal. (b) The NAMEMD–Hilbert demodulation spectrum; (c) the MVMD–Hilbert demodulation spectrum.
Machines 12 00571 g014
Figure 15. Three-directional vibration acceleration signals in Case 2. (a) Vibration acceleration signal in x direction; (b) vibration acceleration signal in y direction; (c) vibration acceleration signal in z direction.
Machines 12 00571 g015aMachines 12 00571 g015b
Figure 16. A time domain diagram of the multi-filter channel signals in Case 2.
Machines 12 00571 g016
Figure 17. CFECC values of multiple fault characteristic frequencies in Case 2.
Machines 12 00571 g017
Figure 18. The demodulation spectrums in Case 2. (a) The optimal demodulation spectrum of the PCA fusion signal. (b) The NAMEMD–Hilbert demodulation spectrum; (c) the MVMD–Hilbert demodulation spectrum.
Machines 12 00571 g018
Figure 19. Three-directional vibration acceleration signals in Case 3. (a) Vibration acceleration signal in x direction; (b) vibration acceleration signal in y direction; (c) vibration acceleration signal in z direction.
Machines 12 00571 g019aMachines 12 00571 g019b
Figure 20. Time domain diagram of the multi-filter channel signals in Case 3.
Machines 12 00571 g020
Figure 21. CFECC values of multiple fault characteristic frequencies in Case 3.
Machines 12 00571 g021
Figure 22. The demodulation spectrums in Case 3. (a) The optimal demodulation spectrum of the PCA fusion signal. (b) The NAMEMD–Hilbert demodulation spectrum; (c) the MVMD–Hilbert demodulation spectrum.
Machines 12 00571 g022
Figure 23. Three-directional vibration acceleration signals in Case 4. (a) Vibration acceleration signal in x direction; (b) vibration acceleration signal in y direction; (c) vibration acceleration signal in z direction.
Machines 12 00571 g023aMachines 12 00571 g023b
Figure 24. Time domain diagram of the multi-filter channel signals in Case 4.
Machines 12 00571 g024
Figure 25. A time domain diagram of the multi-filter channel signals in Case 4.
Machines 12 00571 g025
Figure 26. The demodulation spectrums in Case 4. (a) The optimal demodulation spectrum of the PCA fusion signal. (b) The NAMEMD–Hilbert demodulation spectrum; (c) the MVMD–Hilbert demodulation spectrum.
Machines 12 00571 g026
Table 1. Simulation parameters of bearing simulation signal.
Simulation VariablesParameter Value
N435
A00.95
fr30 Hz
C450
T6.289 × 10−3 s
τi(1~2%) T
fs2500 Hz
Table 2. The CFECC values table.
Characteristic ParameterThe First-Dimensional Simulation SignalThe Second-Dimensional Simulation SignalThe Third-Dimensional Simulation SignalPCA Fusion Signal
CFECC2.98464.82083.009217.5054
Table 3. The CFECC values table.
Characteristic ParameterChannel 1Channel 2Channel 3Channel 4Channel 5Channel 6Channel 7Channel 8
CFECC0.87161.04354.76485.231782.628781.307381.087151.58524
Table 4. Test conditions table.
Tested BearingType of Bearing FailureBearing Rotation SpeedSampling Frequency
Case 1Double-row tapered roller bearingOuter ring fault1000 r/min25.6 kHz
Case 2Double-row tapered roller bearingOuter ring fault1150 r/min25.6 kHz
Case 3Double-row cylindrical roller bearingRolling element fault500 r/min25.6 kHz
Case 4Double-row cylindrical roller bearingRolling element fault1400 r/min25.6 kHz
Disclaimer/Publisher’s Note: The statements, opinions and data contained in all publications are solely those of the individual author(s) and contributor(s) and not of MDPI and/or the editor(s). MDPI and/or the editor(s) disclaim responsibility for any injury to people or property resulting from any ideas, methods, instructions or products referred to in the content.