Article

Investigation of the Electrical Impedance Signal Behavior in Rolling Element Bearings as a New Approach for Damage Detection

by
Florian Michael Becker-Dombrowsky
*,
Johanna Schink
,
Julian Frischmuth
and
Eckhard Kirchner
Department for Mechanical Engineering, Institute for Product Development and Machine Elements, Technical University of Darmstadt, 64287 Darmstadt, Germany
*
Author to whom correspondence should be addressed.
Machines 2024, 12(7), 487; https://doi.org/10.3390/machines12070487
Submission received: 1 June 2024 / Revised: 14 July 2024 / Accepted: 18 July 2024 / Published: 19 July 2024
(This article belongs to the Special Issue Intelligent Machinery Fault Diagnosis and Maintenance)

Abstract

:
The opportunities of impedance-based condition monitoring for rolling bearings have been shown earlier by the authors: Changes in the impedance signal and the derived features enable the detection of pitting damages. Localizing and measuring the pitting length in the raceway direction is possible. Furthermore, the changes in features behavior are physically explainable. These investigations were focused on a single bearing type and only one load condition. Different bearing types and load angles were not considered yet. Thus, the impedance signals and their features of different bearing types under different load angles are investigated and compared. The signals are generated in fatigue tests on a rolling bearing test rig with conventional integrated vibration analysis based on structural borne sound. The rolling bearing impedance is gauged using an alternating current measurement bridge. Significant changes in the vibration signals mark the end of the fatigue tests. Therefore, comparing the response time of the impedance can be compared to the vibration signal response time. It can be shown that the rolling bearing impedance is an instrument for condition monitoring, independently from the bearing type. In case of pure radial loads, explicit changes in the impedance signal are detectable, which indicate a pitting damage. Under combined loads, the signal changes are detectable as well, but not as significant as under radial load. Damage-indicating signal changes occur later compared to pure radial loads, but nevertheless enable an early detection. Therefore, the rolling bearing impedance is an instrument for pitting damage detection, independently from bearing type and load angle.

1. Introduction

Observing machine elements in critical processes is of increasing importance [1]. An early detection of damage can reduce unplanned downtimes and can increase the reliability of the system [1]. Obtaining information about the remaining useful lifetime of the observed machine elements will help planning maintenance measures to reduce maintenance costs as well [2,3].
Rolling element bearings are widely used in technical systems. They have a limited operating time, which leads to a high importance of the early detection of damage [4,5]. Due to their central role in the rotating machinery, rolling bearing damages can cause critical system failures [6]. Therefore, rolling bearings are in the scope of most condition monitoring approaches.
Different techniques for condition monitoring of rolling bearings are already in use. The commonly used approach is vibration measurement [1,2,3,4,6,7]. It is based on the impact excitation of the machine structure, e.g., when a rolling element is running through a pitting damage [6]. An acceleration sensor located at the machine structure measures the resulting vibration. It is possible to analyze the vibration signal using different specific frequencies like the Ball Passing Frequency Inner Ring (BPFI) or Ball Passing Frequency Outer Ring (BPFO) [6] or using different machine learning approaches like classification algorithms or algorithms for a remaining useful life prediction, e.g., convolutional neuronal networks [8,9,10,11,12,13].
Other condition monitoring techniques are motor current analysis, thermography, shaft speed analysis, and lubricant analysis [1,2,3,6,14,15]. All these approaches have the same disadvantages. They are located outside the point of interest or obtain the needed information indirectly and, therefore, the information can be affected by different uncertainties, which decreases the meaningfulness of the generated condition data [16].
Sensory utilizable machine elements enable in situ measurements to avoid uncertainties. They use the electrical properties of machine elements to gauge the desired measurand. Rolling elements are one of these sensory utilizable machine elements. Due to their position in the flux of forces, detailed information about the system’s condition can be provided by the utilized bearings. Sensory utilizable machine elements (SuME) are a subcategory of the sensing machine elements. Besides SuME, sensor integrating elements (SiME) and sensor carrying elements (ScME) can be differentiated.
Figure 1 gives an overview of the sensing machine elements.
To use rolling bearings as sensors, their electrical properties have to be known. Therefore, the electrical behavior of rolling bearings is explained in the next section.

1.1. Electrical Properties of Rolling Element Bearings

In general, the electric behavior of machine elements in electric circuits can be described using analogous models based on different connections of resistances, inductances, and capacitances [18,19]. Figure 2 summarizes some machine elements and their electric analogous models.
Machine elements like housings and shafts can be understood as a serial connection of an inductance and ohmic resistance [18,21]. The detailed behavior depends on the geometry of the elements. For example, every shoulder of a shaft has its own serial connection of inductance and ohmic resistance.
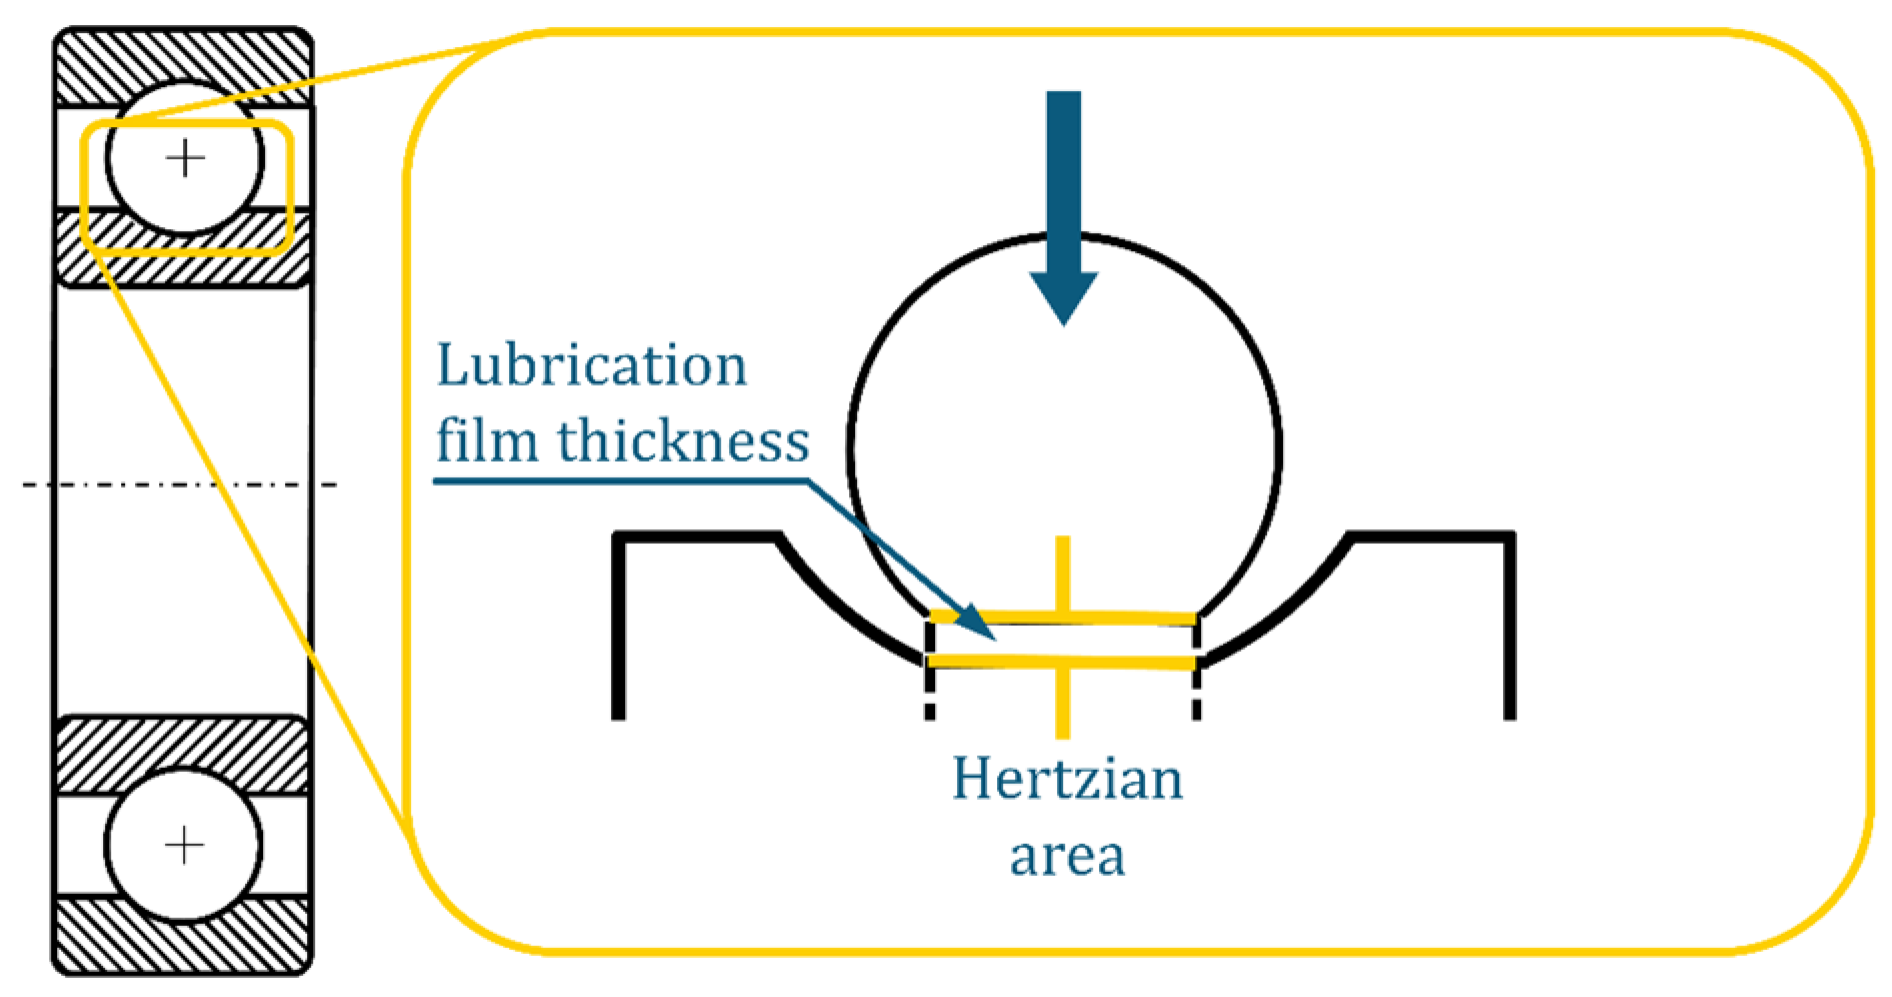
Elasto-hydrodynamic lubricated (EHL) contact building machine elements like spur gears and rolling element bearings can be modelled as a parallel connection of ohmic resistance and capacitor in case of full lubrication under alternating current [22,23]. If the lubrication film is not thick enough, harmful electrical discharge (EDM) currents can occur and damage the bearing [24]. This has to be avoided for a sensory utilization of the bearing. To estimate whether the current and load combination is harmful or not, the current density can be calculated [25]. In case of dry friction, the bearing shows only resistive behavior. Figure 3 displays the different electric analogous models of the rolling element contact under different lubrication conditions.
As mentioned before, the rolling bearing contact can be understood as a parallel connection of ohmic resistance and capacitance, where the capacitance has the more dominant influence on the electric impedance of the bearing. The basis for any calculation is the formula for the capacitance of a plate capacitor [23]:
C H z = ε r ε 0 A H z h 0 ,
where A H z is the Hertzian contact area, h 0 the central lubrication film thickness in the EHL contact, and ε r ε 0 the permittivity of the lubricant.
Due to the fact that the rolling contact does not build a perfect capacitor, the border zone influence has to be considered. In early approaches, a correction factor was multiplied with the capacitance. Current research modelled the influence as a formula depending on different contact parameters. Also, the influence of unloaded rolling elements for the electrical analogous model is further investigated and considered [27].
Due to the fact that every EHL contact in the bearing can be modelled as a capacitance, the contact of the rolling element to the inner and the outer ring can be understood as a serial connection of these two capacitances [21]. The whole bearing impedance is built as a parallel connection of these rolling elements to raceway systems.
Figure 4 illustrates the electric equivalent model of the rolling contact.
The electric impedance Z of a rolling bearing builds from the resistance   R as real part and the reactance 1 j ω C as imaginary part [23]:
Z = R + 1 j ω C .  
The reactance depends on the reciprocal value of the product of current frequency   ω and capacitance C . That means that the rolling contact impedance decreases with increasing frequency or capacitance. These correlations enable the usage of impedance measurement for load detection by calculating the Hertzian area from the capacitance.

1.2. Impedance-Based Condition Monitoring of Rolling Element Bearings

In early research, the correlation between surface mutations in the rolling bearing raceways and the electrical behavior has been shown [28,29,30]. This leads to the opportunity of using the electrical bearing impedance as a tool for condition monitoring.
Using the electrical impedance, two main approaches for condition monitoring can be identified. The most common application field is lubrication condition monitoring, which can be divided into lubricant condition detection and film thickness measurement. In case of lubricant condition detection, the lubricant itself is monitored to detect impurities [31,32,33]. Film thickness measurement verifies which lubrication regime the bearing is running. This helps to identify and avoid improper tribological conditions to extend bearings operating life [30,33,34,35,36,37,38,39,40].
The second condition monitoring approach is observing the whole bearing condition by analyzing the electrical impedance. The first idea is measuring the capacitances using the models presented in Section 1.1 and calculating the Hertzian contact area from them [29,33,41]. Knowing the Hertzian area makes it possible to calculate the operating life consumption to estimate the remaining useful lifetime. This method is based on a detailed knowledge about the EHL contact zone including the border zone and the influence of unloaded rolling elements, which is part of the current research. The second idea analyzes the signal itself to identify significant changes during the bearings’ operating life [29,33,42,43,44,45]. It could be shown that pitting damages cause changes in the imaginary part of the impedance signal, which makes it possible to detect the damage location and measure its length in the rolling direction [44]. It is also possible to differentiate three main phases in the operating life. Analyzing statistical features in time and frequency domain allows for detecting damages before vibration monitoring devices discover the occurrence of a damage. A physically based explanation of the features behavior is also possible [42].
Looking at the research regarding impedance-based condition monitoring, the investigations do not consider the influence of combined axial and radial forces. In addition, a comparison between different rolling bearing types is missing. The signal investigation is focused on the calculation of classic features in the time and frequency domain. Other approaches like analyzing logarithmic transformed features or order analysis are missing. Therefore, this article investigates the following three research questions:
  • How can impedance signals and their features be modified to optimize the impedance-based early damage detection for rolling element bearings?
  • How does the impedance signal feature change under combined axial and radial load?
  • How do impedance signal features behave for different bearing types in case of point contact?
In the next section, the materials and methods to answer the presented research questions will be presented. Section 3 summarizes the results, which are discussed in Section 4. In the end, a conclusion will be drawn in Section 5.

2. Materials and Methods

To investigate the research questions in Section 1.2, fatigue tests with two different rolling bearing types are conducted. Thirteen fatigue tests with deep groove ball bearings of type 6205 C C3 from FAG under stationary conditions and constant radial loads build the basis for the research presented here. The signals are analyzed in time and frequency domain. Different statistical features according to Becker-Dombrowsky et al. 2023 are calculated to identify signal changes that indicate a pitting damage [42]. After the feature detection, fatigue tests with the same bearing type are run under stationary conditions, but with an additional axial load. To accomplish a comparability of both test series, the ratio between dynamic load rating C and equivalent dynamic bearing load P is constant over all tests, as well as speed and lubricant temperature at the bearings. Therefore, all tests have the same estimated operating lifetime in hours L 10 h [46,47]:
L 10 h = 10 6 n   · 60 m i n h · C P p = 13.65   h .  
In case of combined loads, load angle β is varied in two stages. After analyzing the feature behavior in case of the same bearing type, 7205 C C3 angular contact ball bearings from FAG are investigated. The load-inducing bearings are NUP 205. Table 1 summarizes the test parameters for the investigated bearing. The tests are stopped when the internal vibration observation of the test rig detects a bearing damage or after the tenfold estimated bearing operating life.
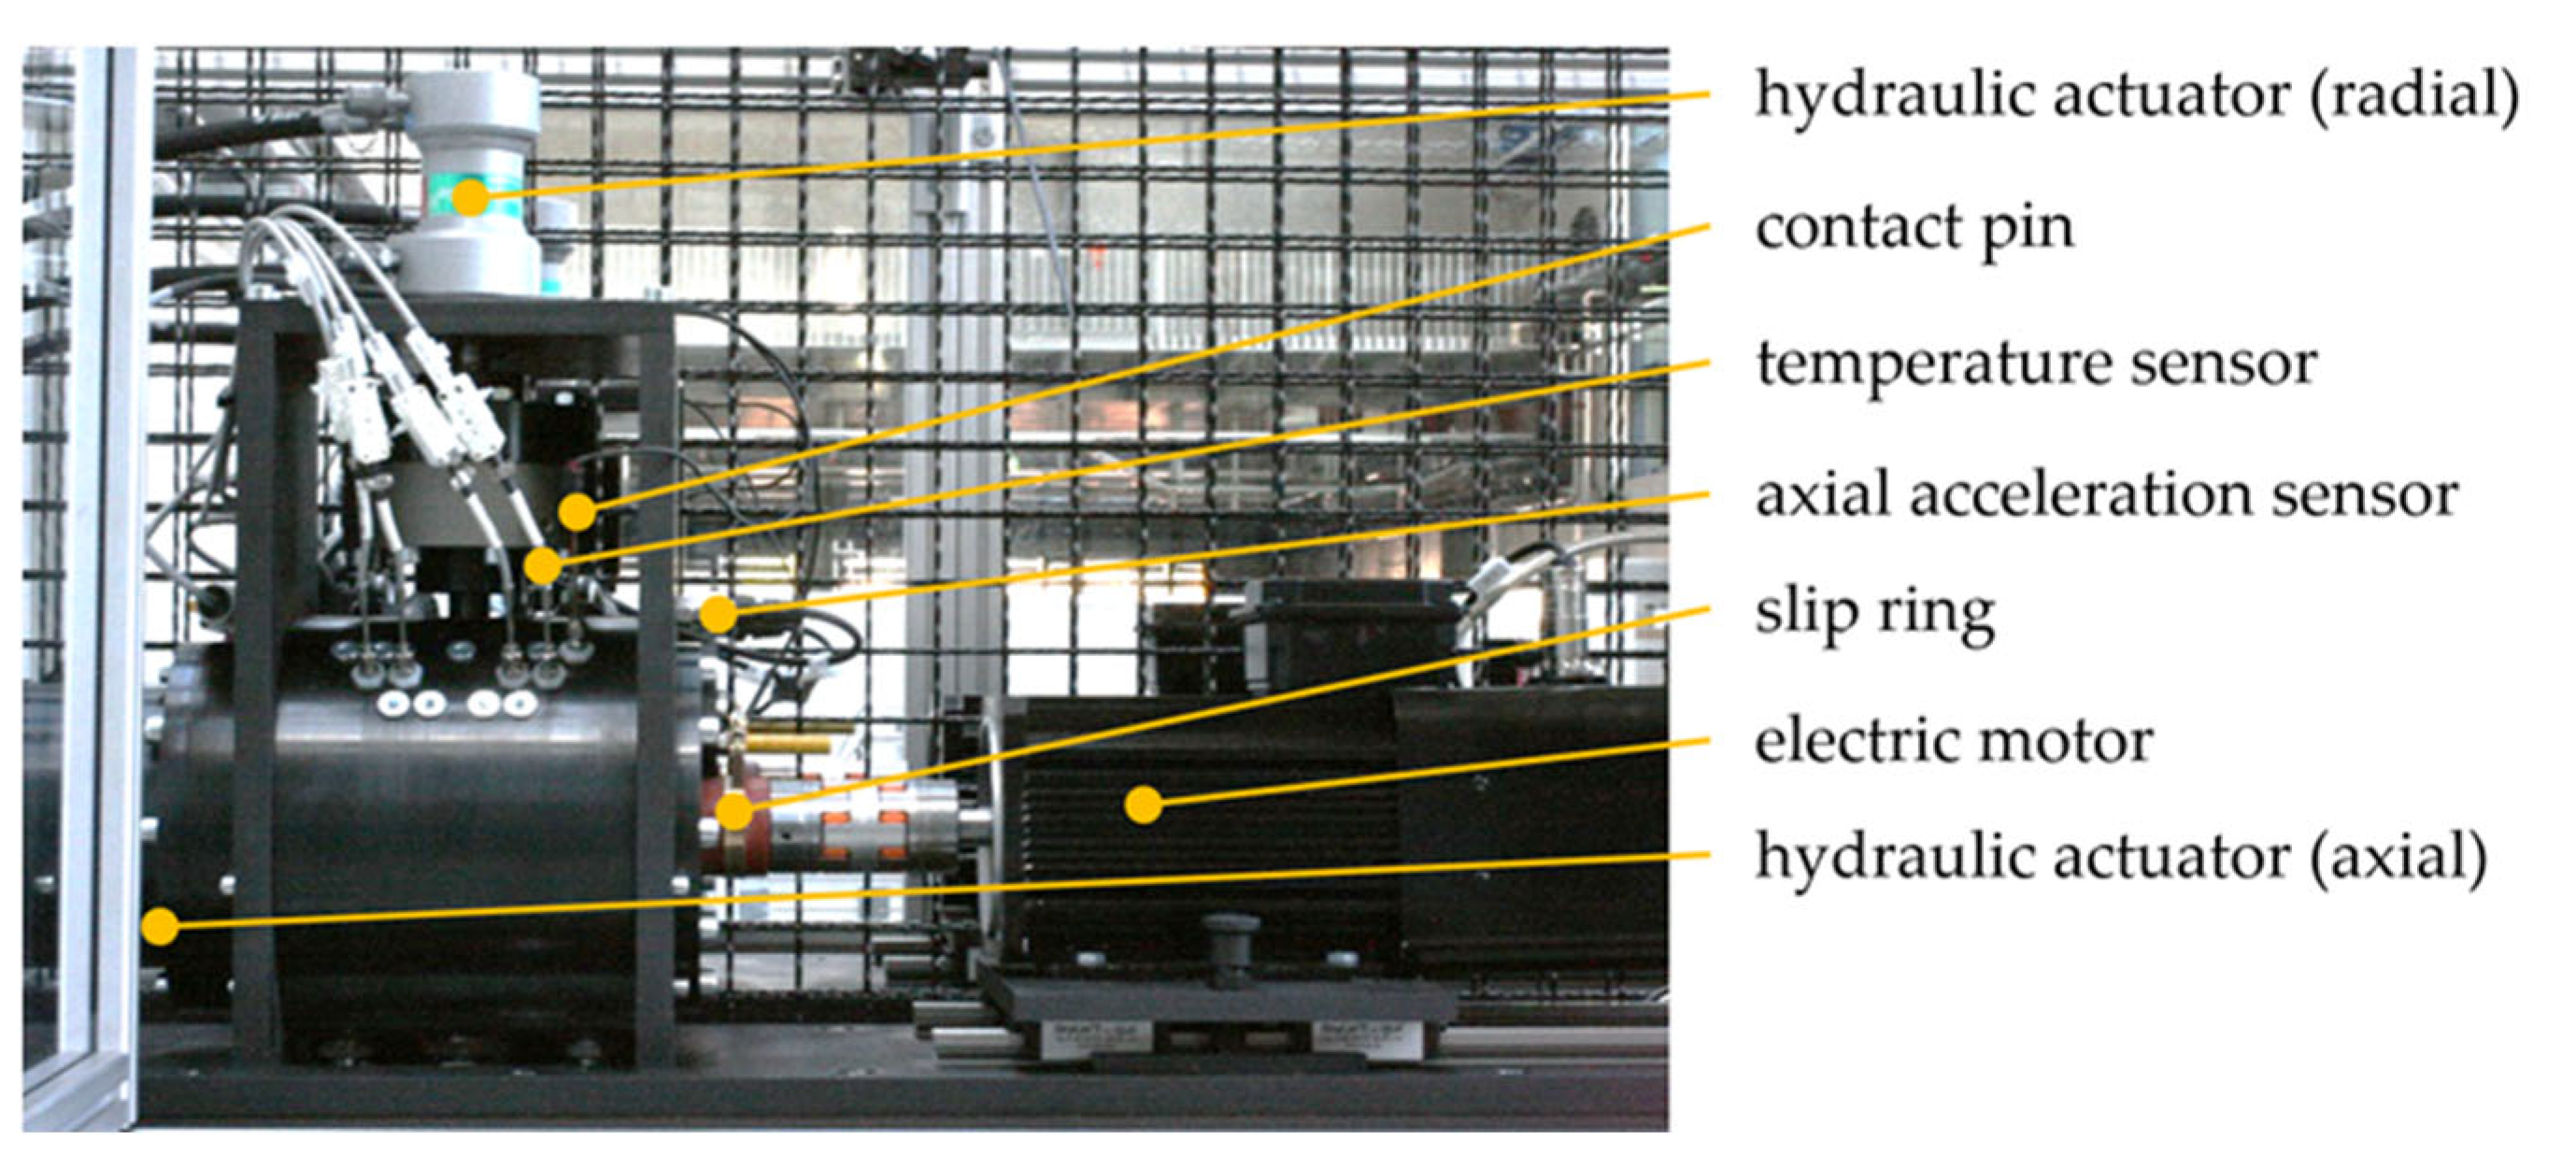
All tests are run at the rolling element bearing test rig chamber in Figure 5. It has four test chambers, which can be run independently from the others.
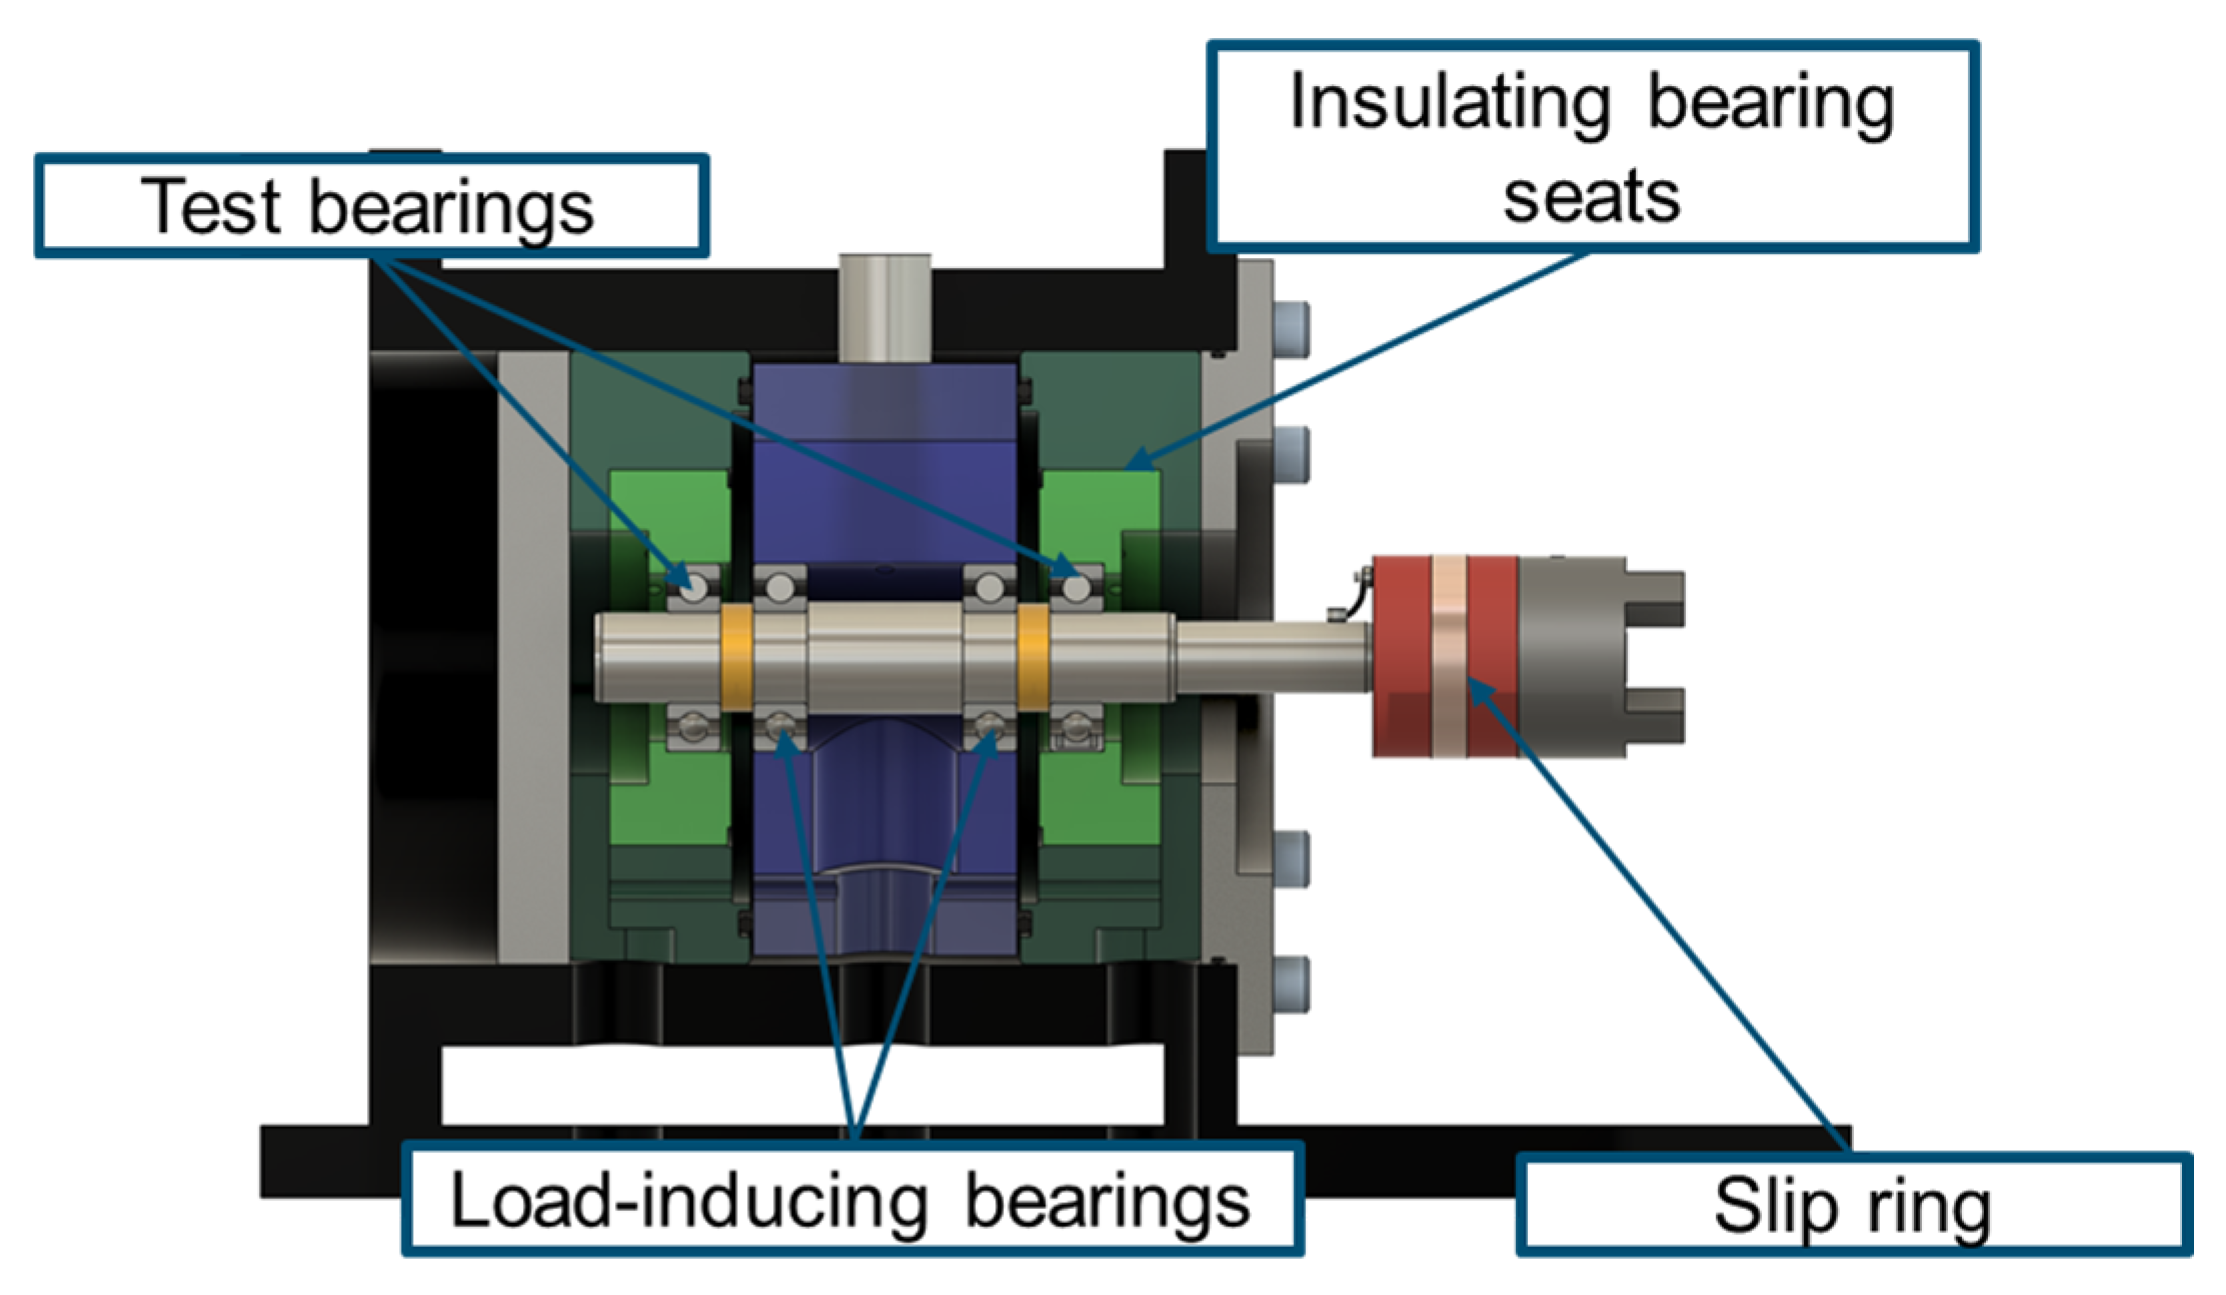
In each chamber, four rolling bearings are located. Figure 6 shows a sectioning of a chamber.
The two outer bearings are the test bearings, because radial and axial forces can load them. The inner bearings are the load-inducing bearings, which can be loaded by radial forces only. The test rig enables bearing loads in radial and axial directions up to 40 kN and revolution speeds up to 8000 rpm. It has a recirculating oil lubrication system for each test chamber, but grease lubricated tests are also possible. The internal sensor system gauges the loads, the revolution speed, the bearing temperature at the outer ring, the oil temperature, and axial and radial vibrations. All tests are observed by the sensor system to detect bearing damages and stop the tests if necessary. The bearing seats are made from an insulating material to avoid undefined current paths.
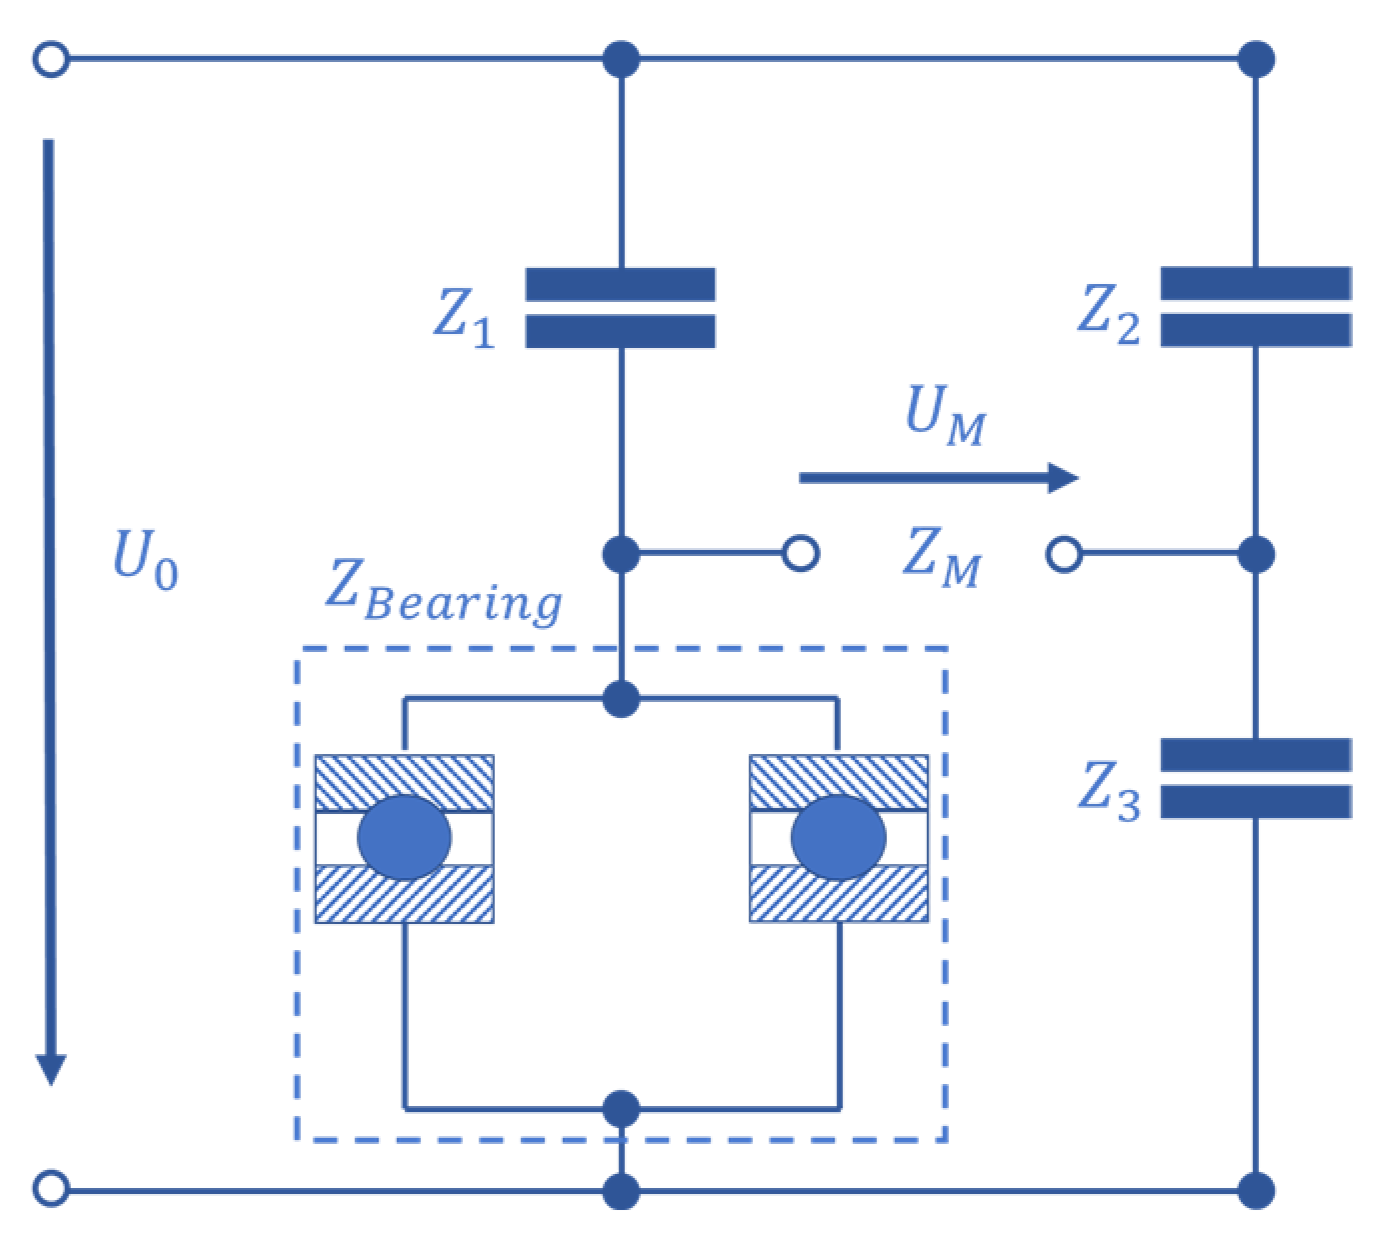
An alternating current measurement bridge is used to gauge the bearings’ impedance. Figure 7 shows the electric circuit.
The test bearings are in parallel connection and build a varying impedance Z B e a r i n g , which depends on the bearings’ condition. An oscilloscope measures the generator voltage U 0 and the bridge voltage U M . The carrier signal lead through the bearings has a frequency of 20 Hz and a voltage amplitude of U 0 = 5   V peak to peak. Every 90 s, the impedance is measured for 1.5 s with a sampling rate of 1 MHz. The bearings’ impedance is calculated using both voltages and three known reference impedances, namely Z 1 ,   Z 2 , and Z 3 .
Z B e a r i n g = Z 1 Z 3 Z M + Z 2 + Z 3 Z M + Z 2 Z 3 U M U 0   Z 2 Z M Z 2 + Z 3 Z M + Z 1 + 1 U M U 0 .
The complex impedance signal is transformed and analyzed in different ways. At first, the voltage signals are filtered using a first-order low pass filter that filters frequencies twice as high as the carrier signal frequency of 20 kHz and a Hampl filter for outlier removal. After calculating the impedance from the measured voltages and known impedance, changes in the signal of the resulting four basis feature real part, imaginary part, absolute value, and phase angle, which are investigated. From each of these base features, features in time and frequency domain are calculated according to Becker-Dombrowsky et al. 2023 [42]. For the frequency domain transformation using a Fast Fourier Transformation, while the measurements with a length of 1.5 s are operated by the NumPy FFT algorithm. From these transformed data, features are calculated without using machine learning or feature engineering algorithms. The features are common for investigating vibration signals [10,12,48]. Due to the fact that these features are state of research in feature engineering for condition monitoring approaches, they are chosen to ensure a comparability to commonly used bearing observation techniques. The content of the features can be found in [10]. Table 2 shows these features.
The time series with i = 1 , 2 , 3 , , N is x i while s ( k ) is a frequency spectrum with k = 1 , 2 , 3 , , K . K is the total number of spectral lines in the spectrum and f ( k ) the frequency value of the k -th spectral line [42].
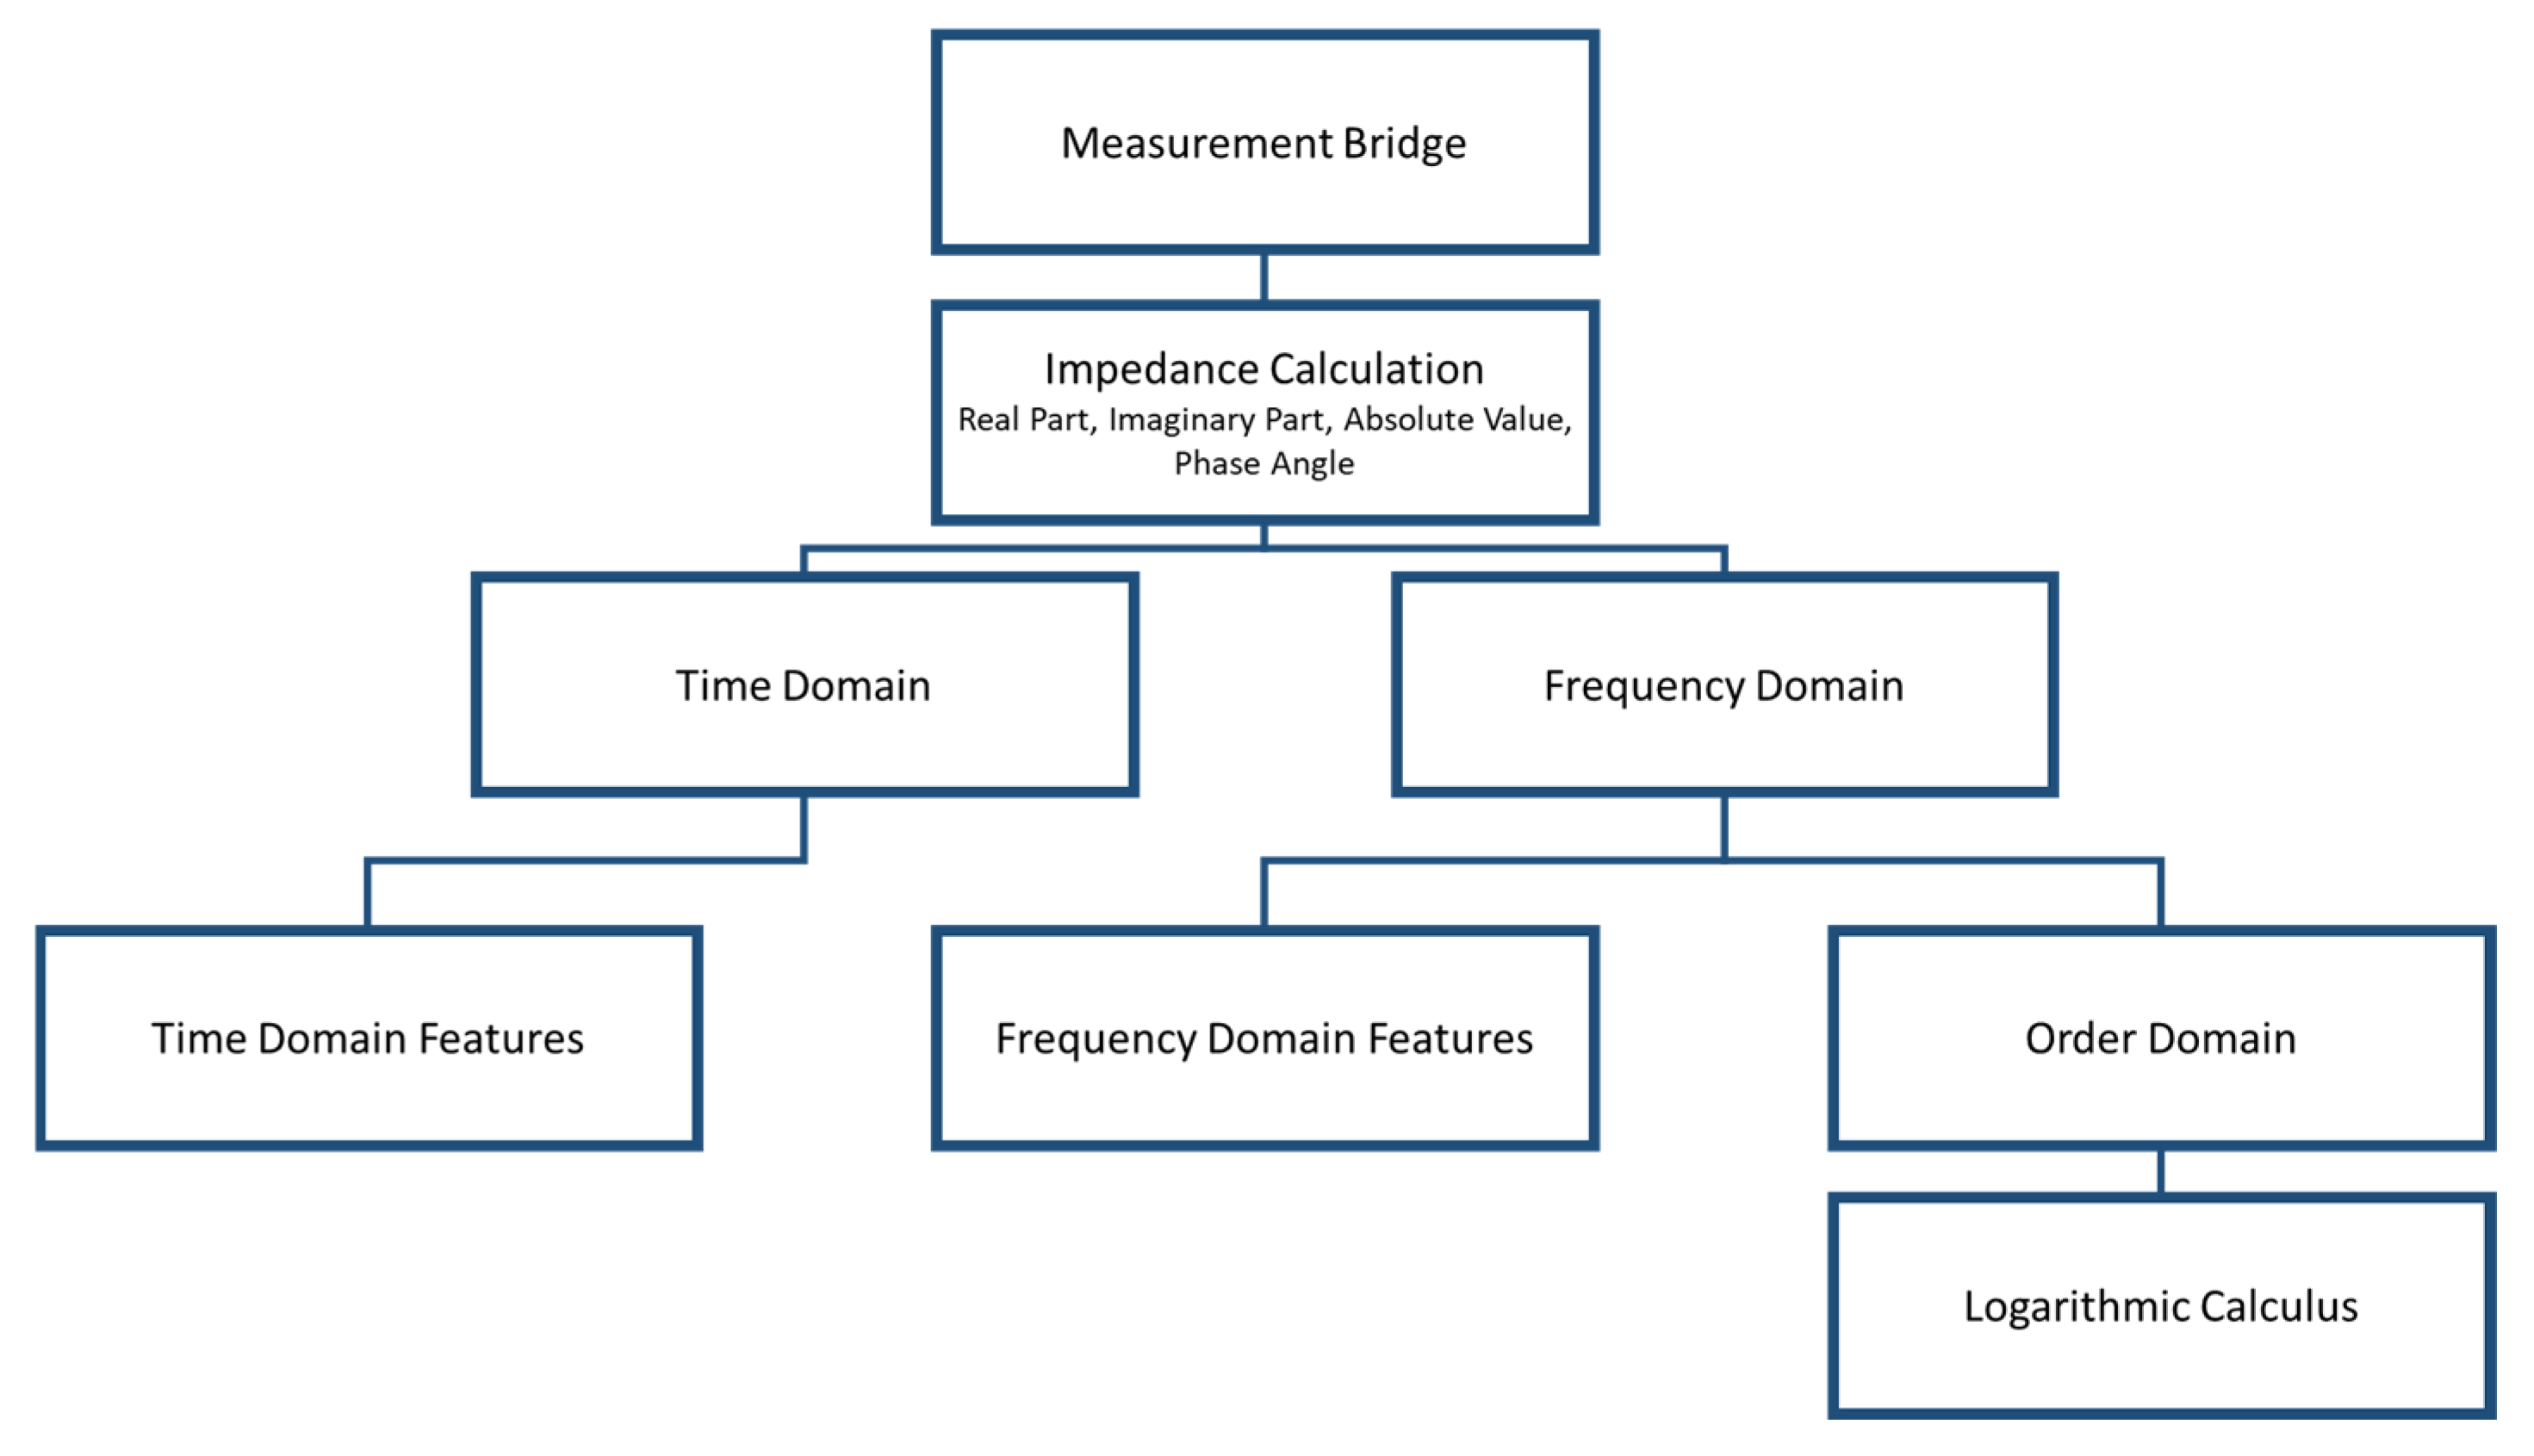
Additionally, the estimated frequency spectrum is transformed into the order domain by dividing the frequency values through the BPFI and BPFO. The order domain data are logarithmized to improve the visibility of signal changes. The data handling is visualized in Figure 8. The overall aim is localizing pitting damages in combination with a damage early detection in comparison to the test rig internal vibration observation.

3. Results

In this section, the results of the fatigue tests and the data analyzation are presented. Fatigue tests with a longer operating life than the tenfold estimated bearing operating lifetime are not included.
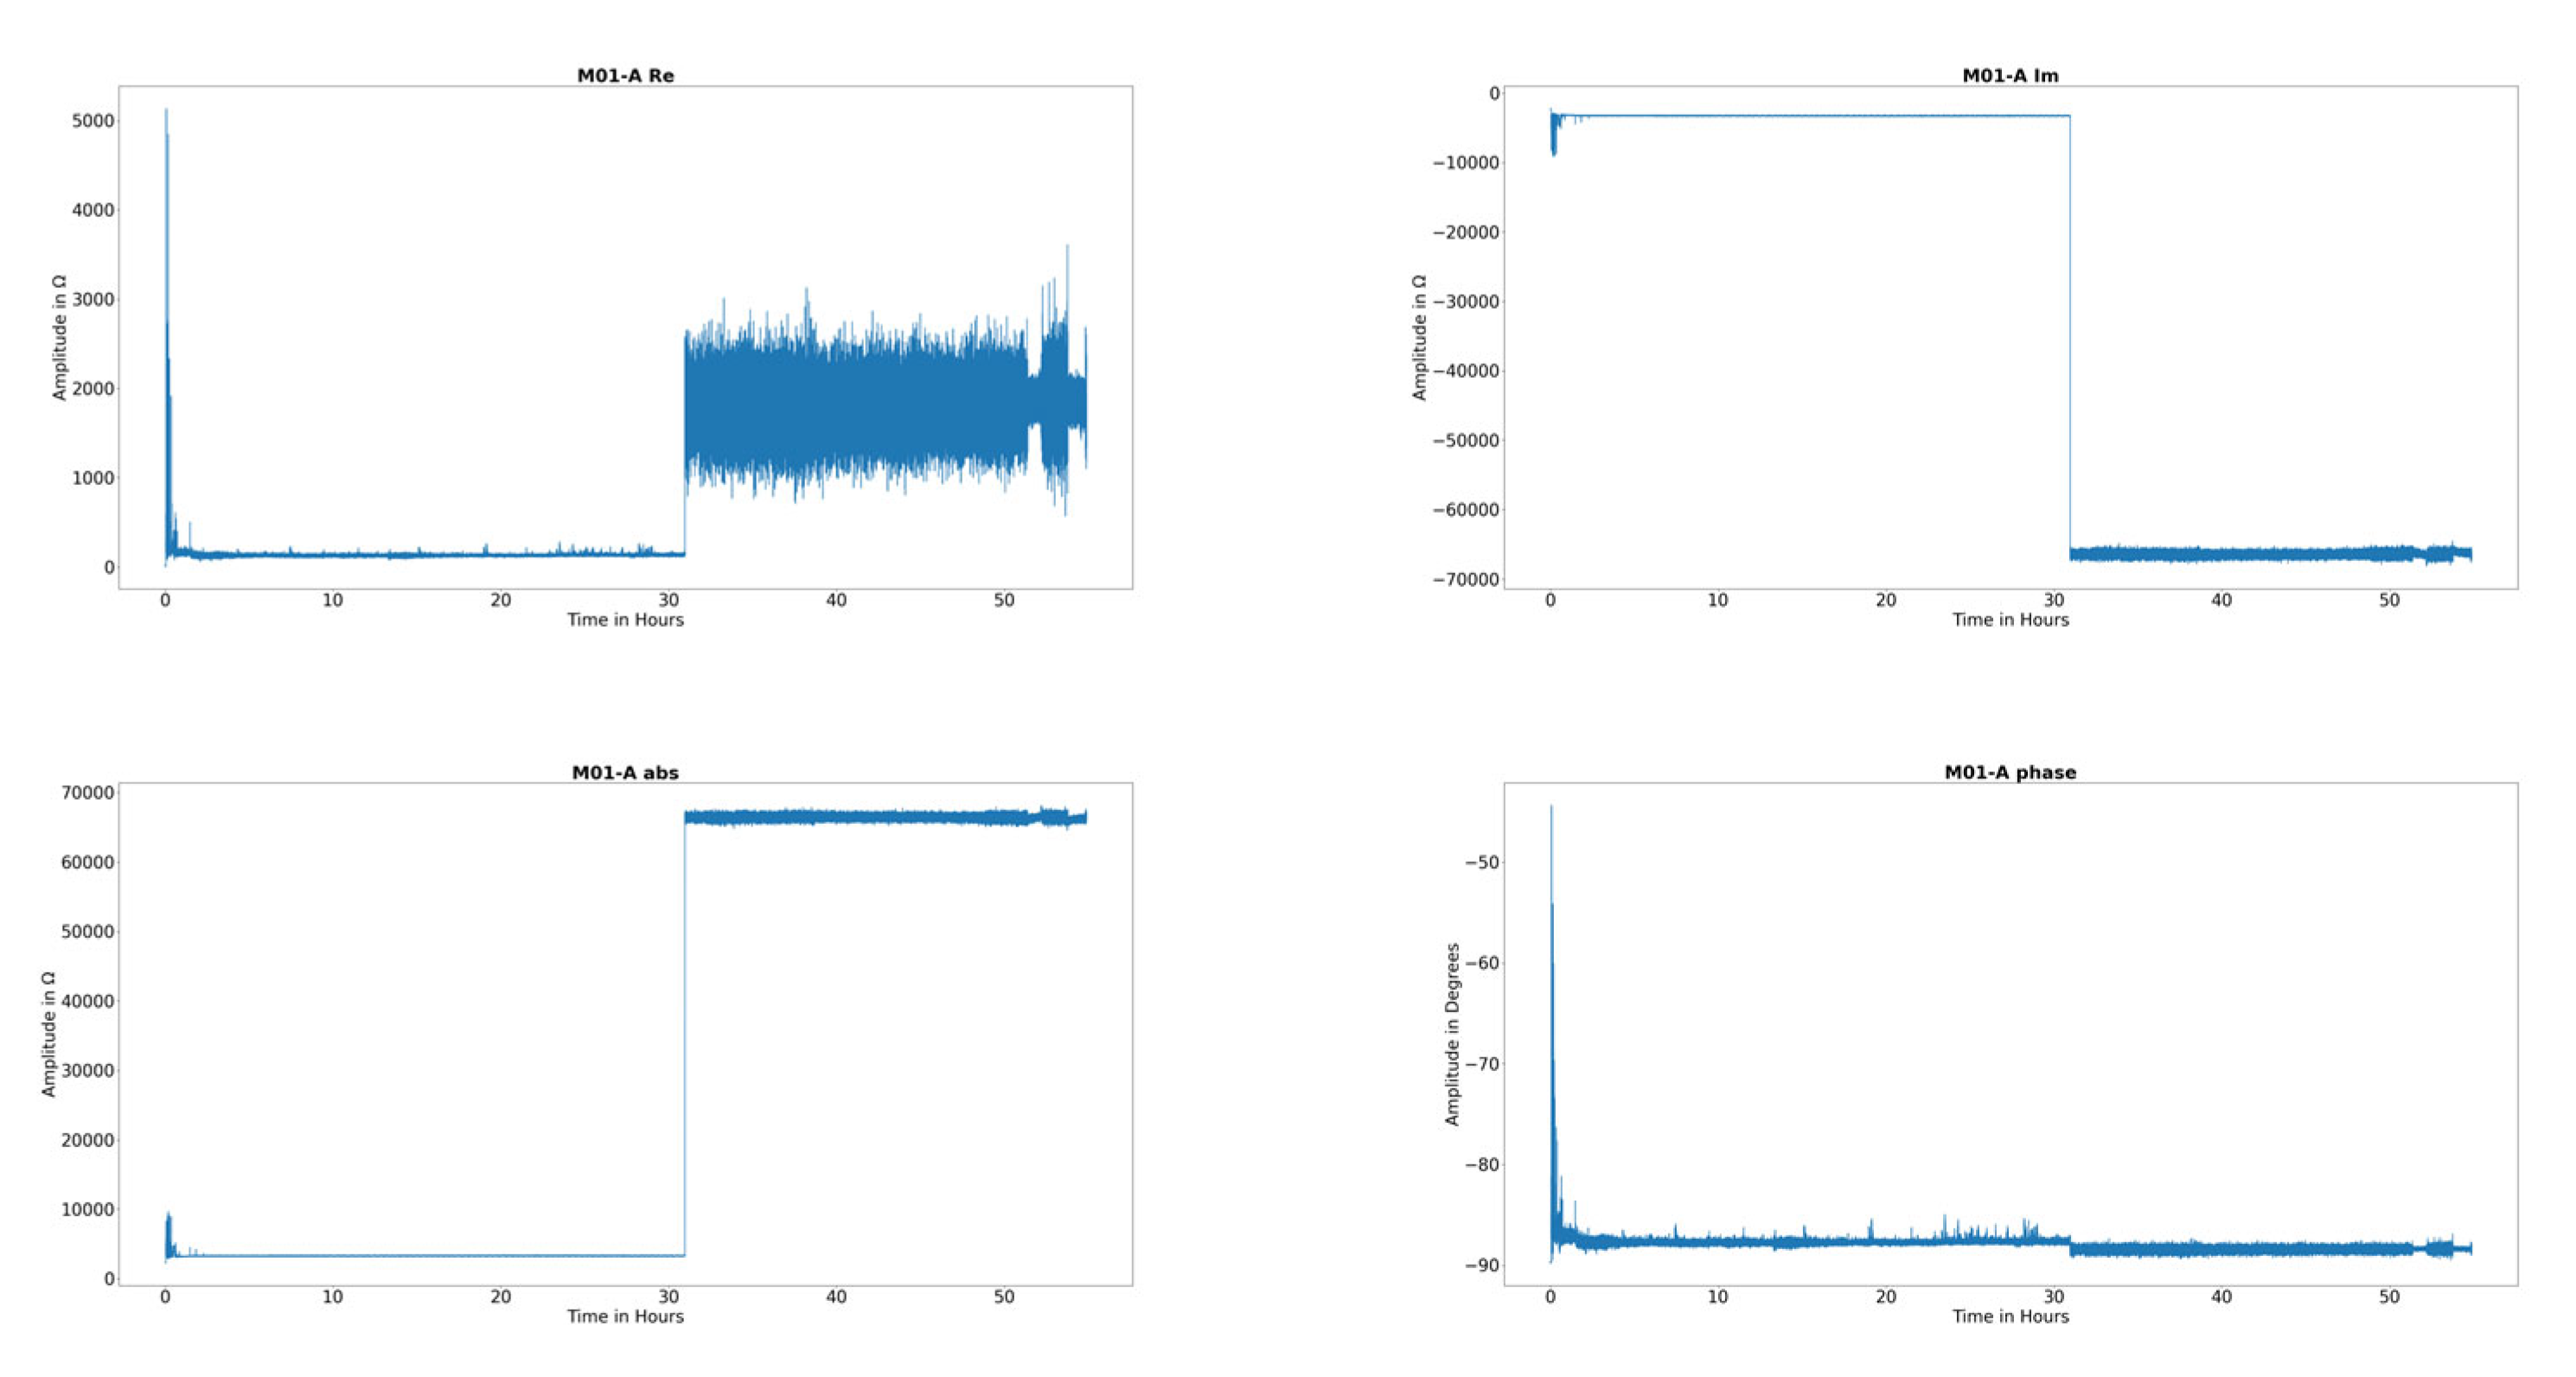
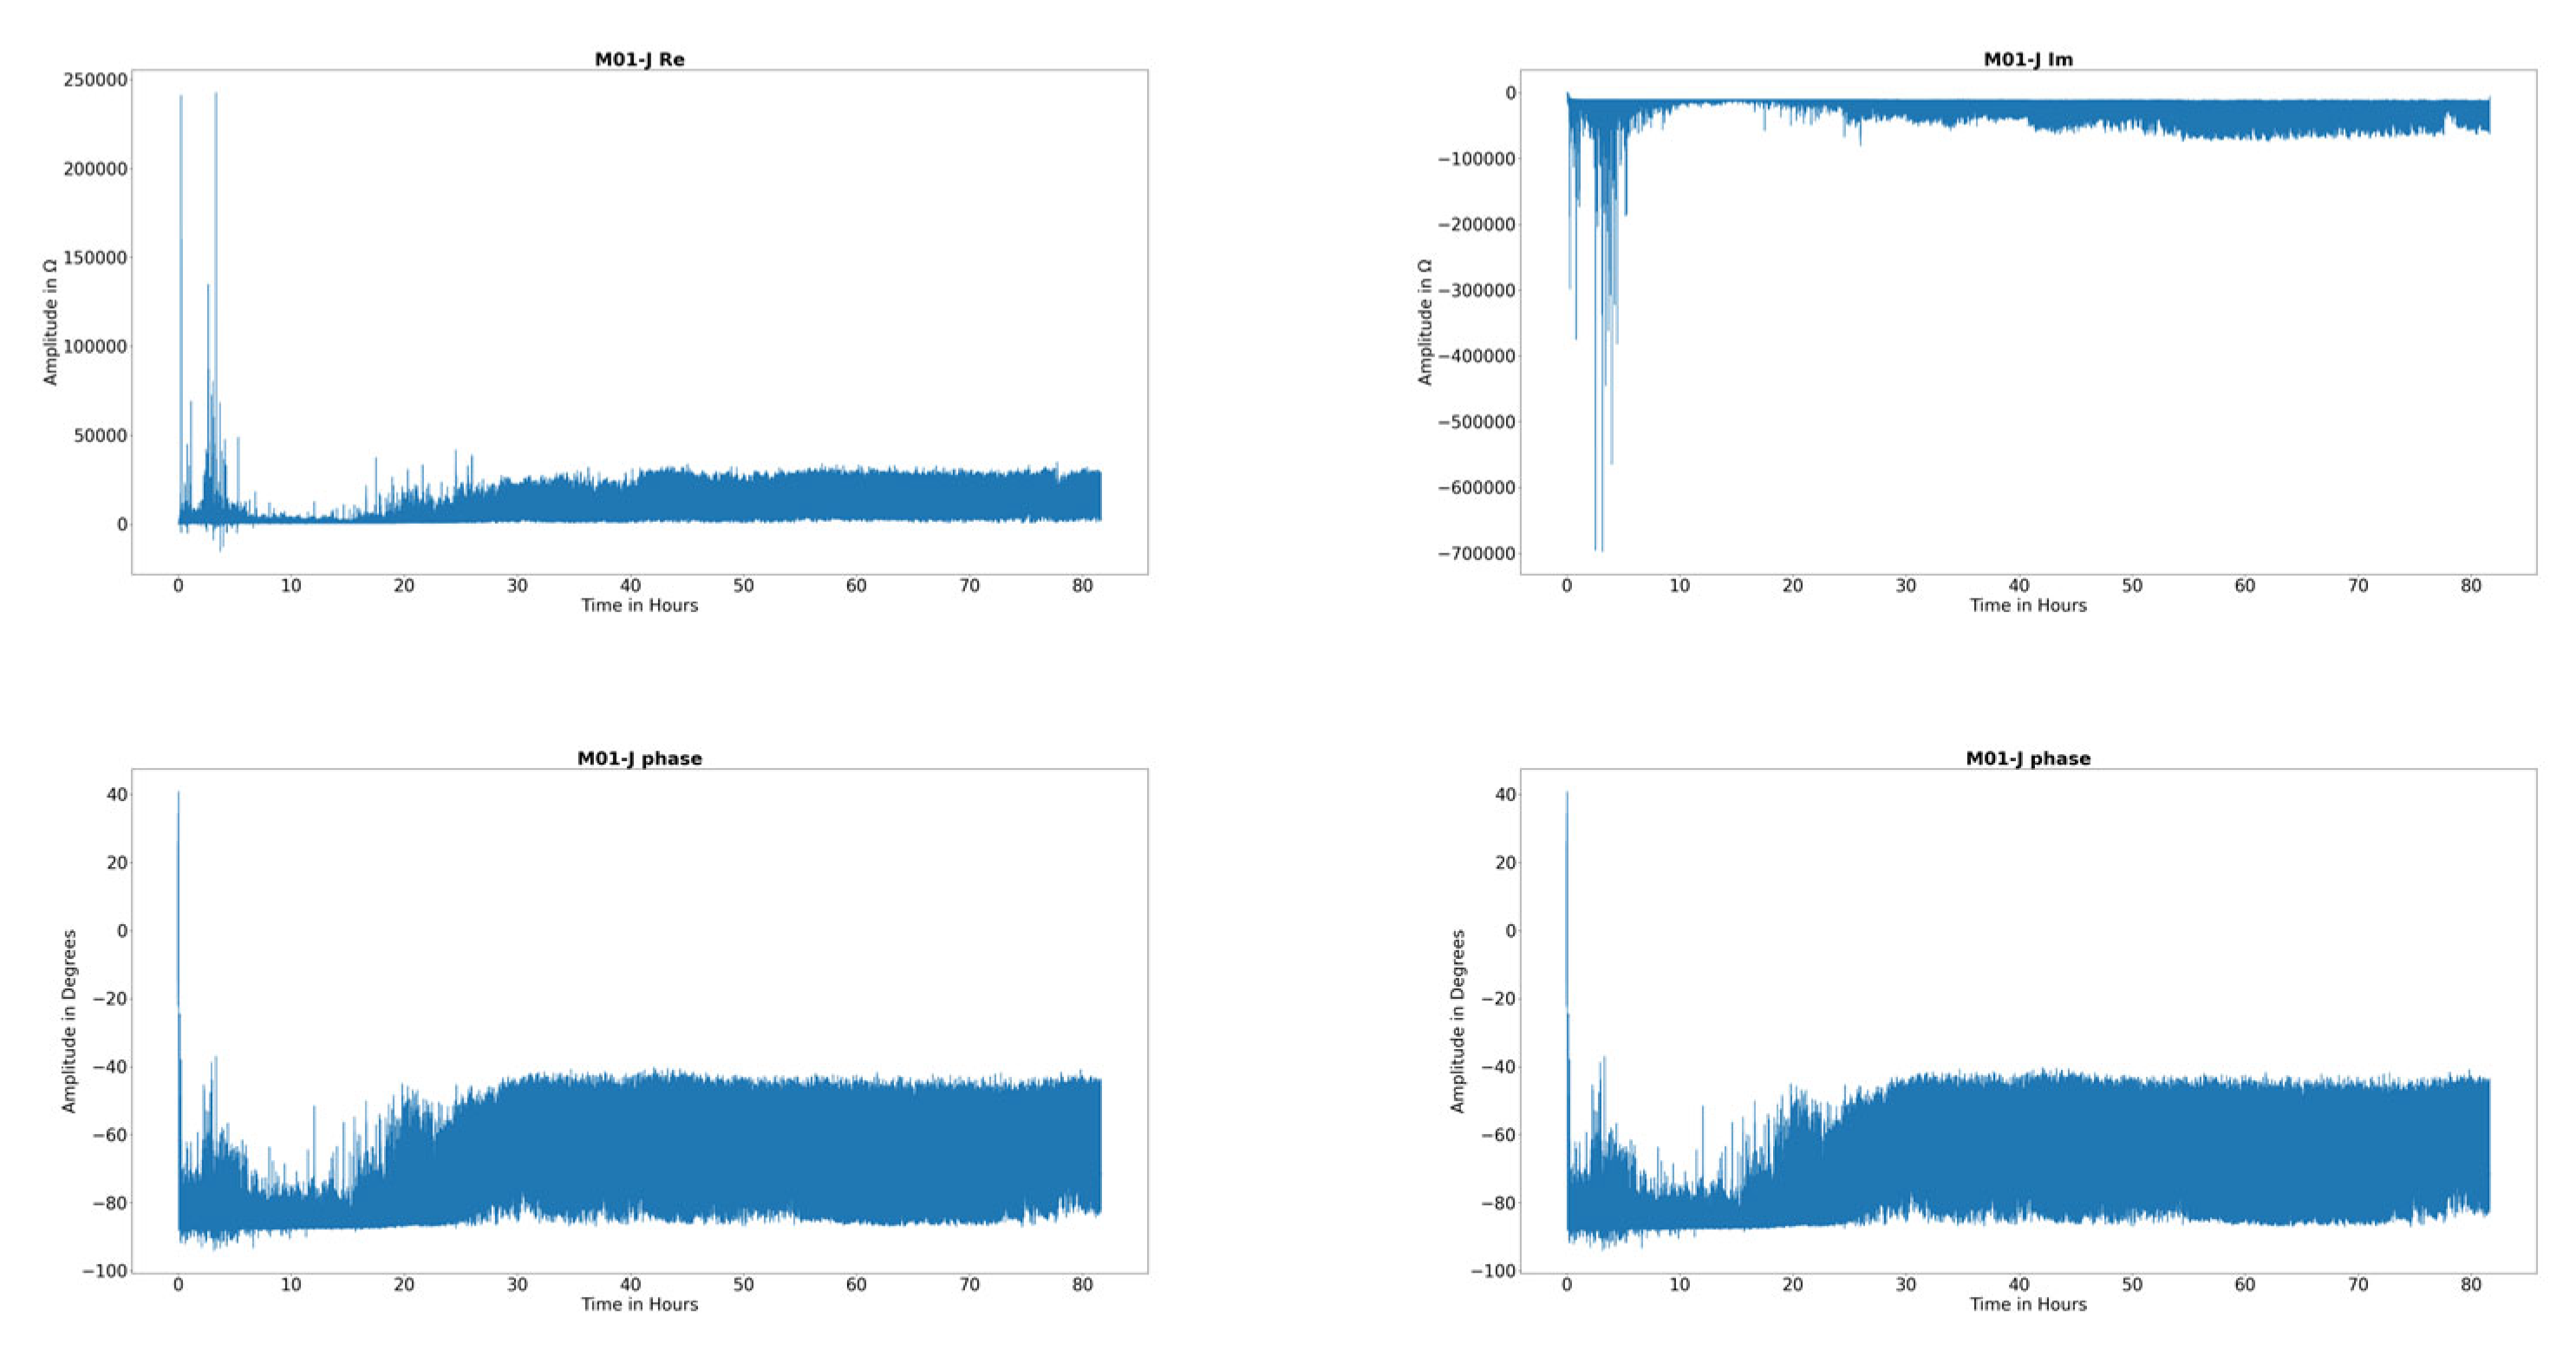
Looking at the raw impedance signal, changes can be seen over the bearings’ operational life. For pure radial loads, the impedance changes in an initial point which indicates an initial damage, as shown in Figure 9 and Figure 10. The phase angle is of about −90°, which means that the bearings are run in EHL regime.
For combined radial and axial loads, the pure impedance signal does not show changes, which can be understood as a damage indicator. For the combined loaded deep grove ball bearings, the run-in phase dominates the impedance signal, which can be seen in Figure 11 and Figure 12. Therefore, using the raw impedance signal for damage detection does not make sense. Therefore, the impedance features are further investigated.
The angular contact ball bearing in Figure 13 shows the initial damages more clearly compared to the other bearings. The differentiation between the run-in and damage phase is possible using the raw signal.
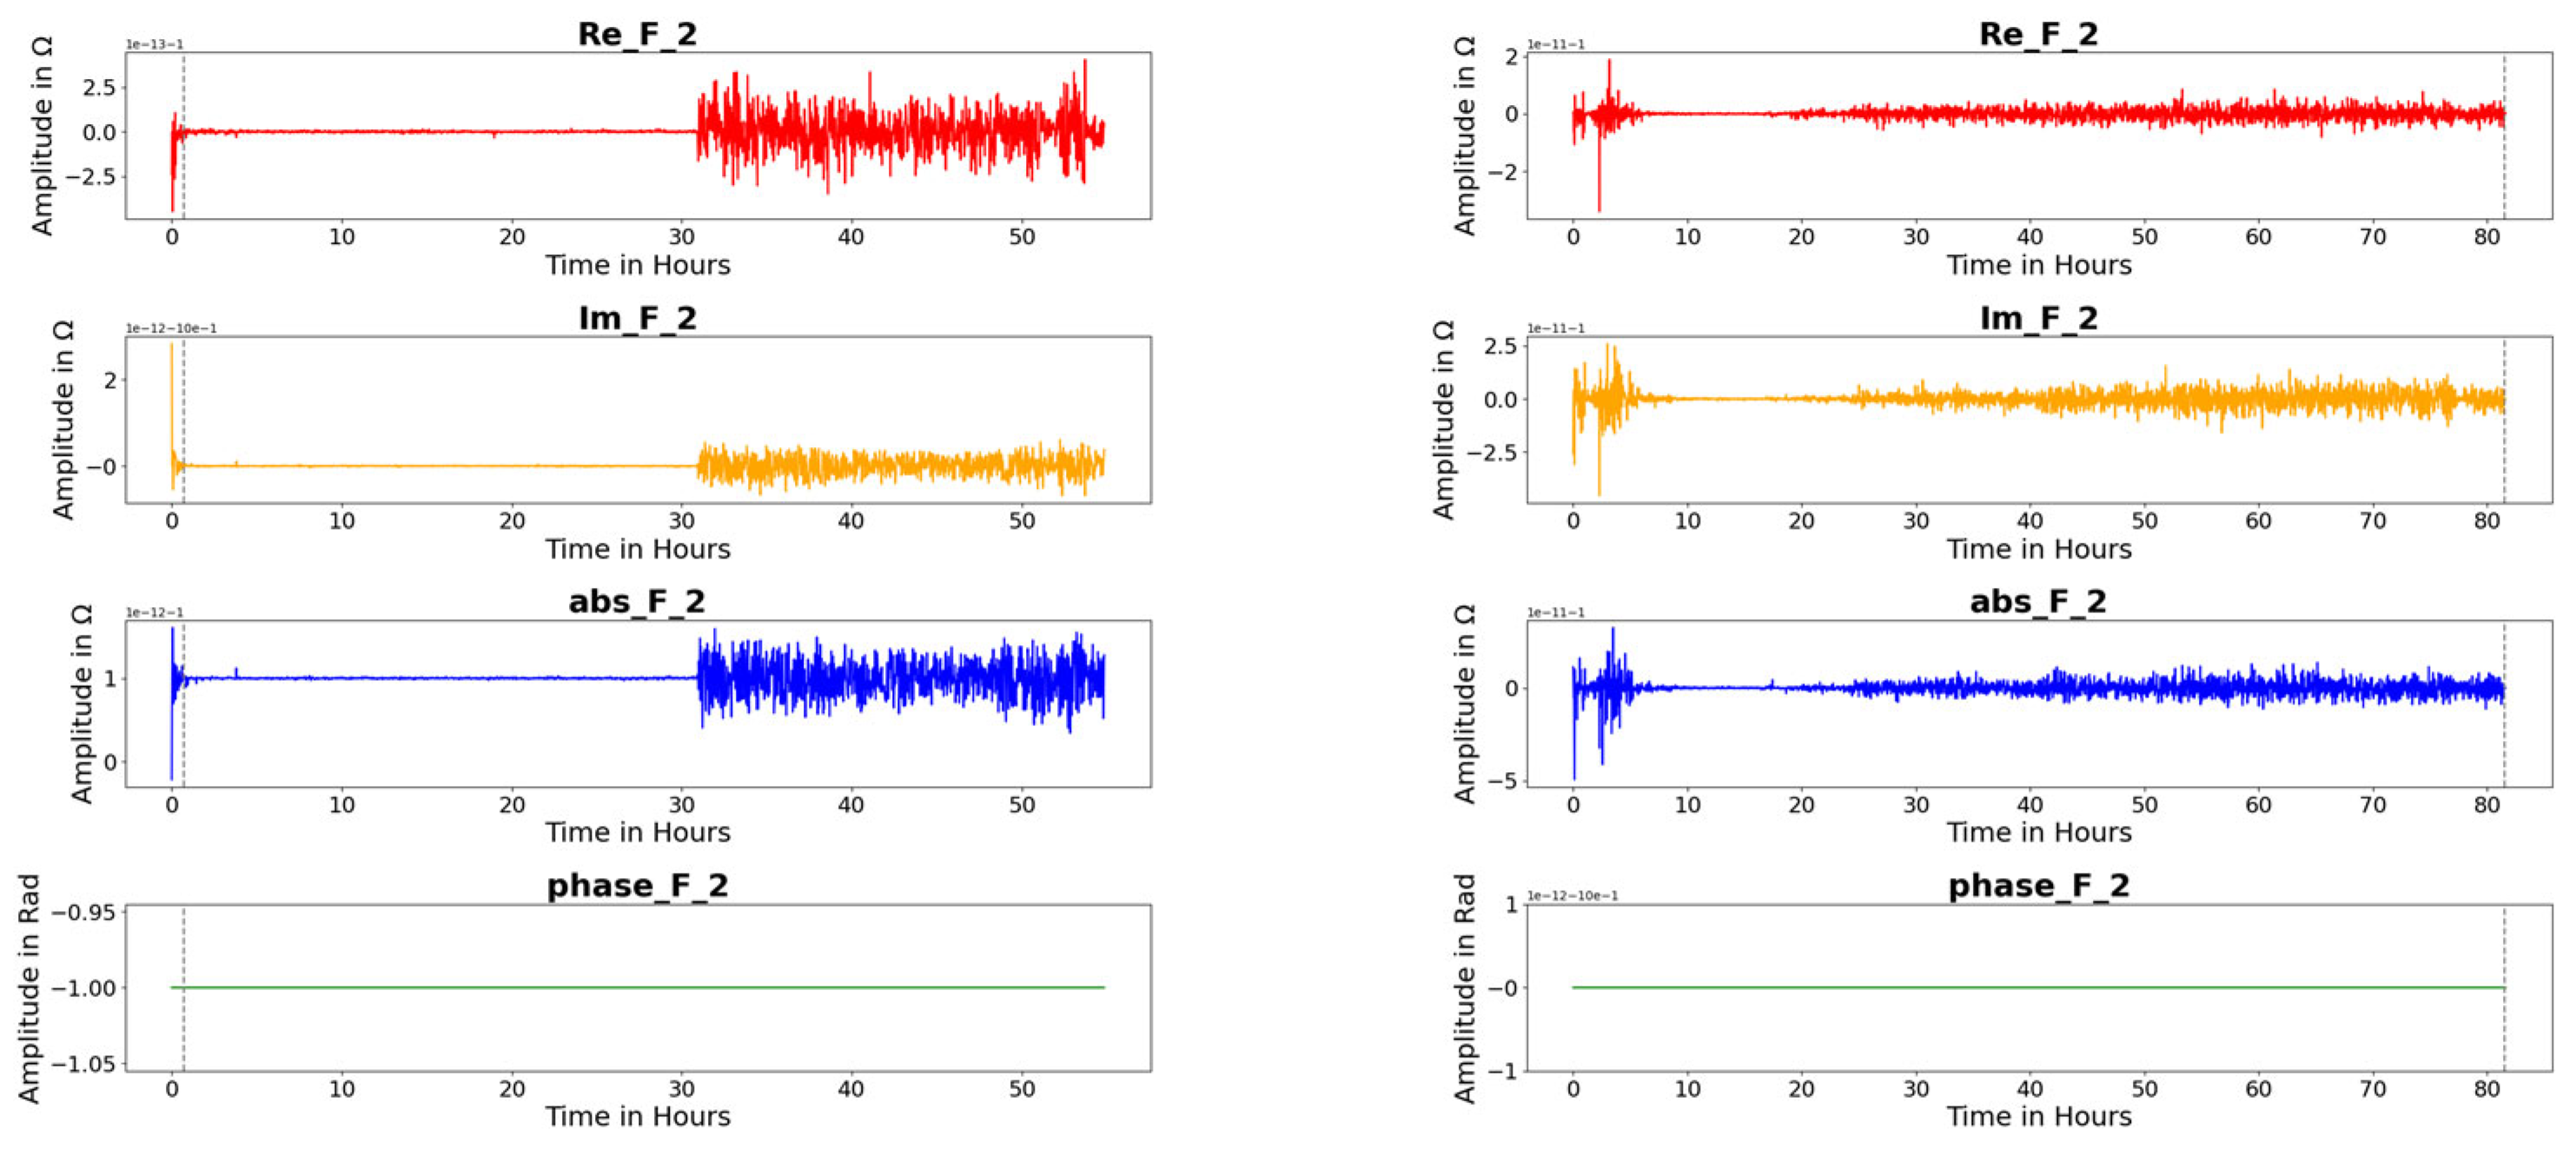
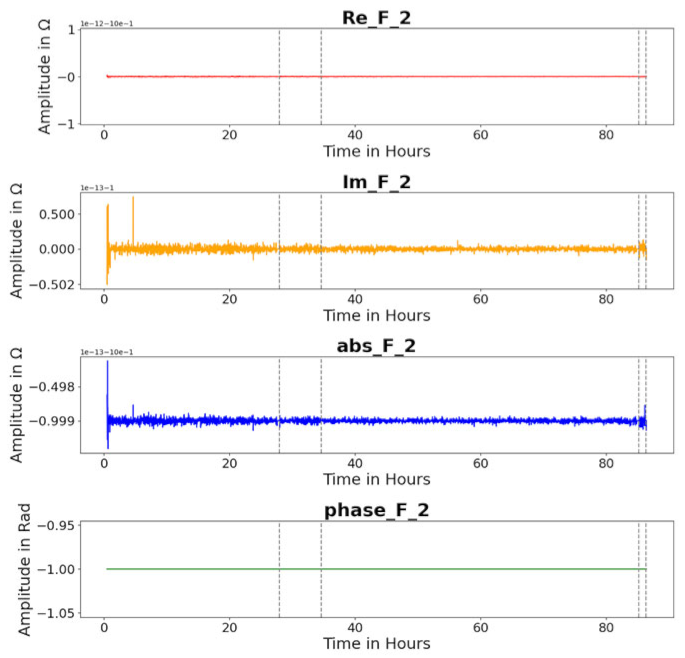
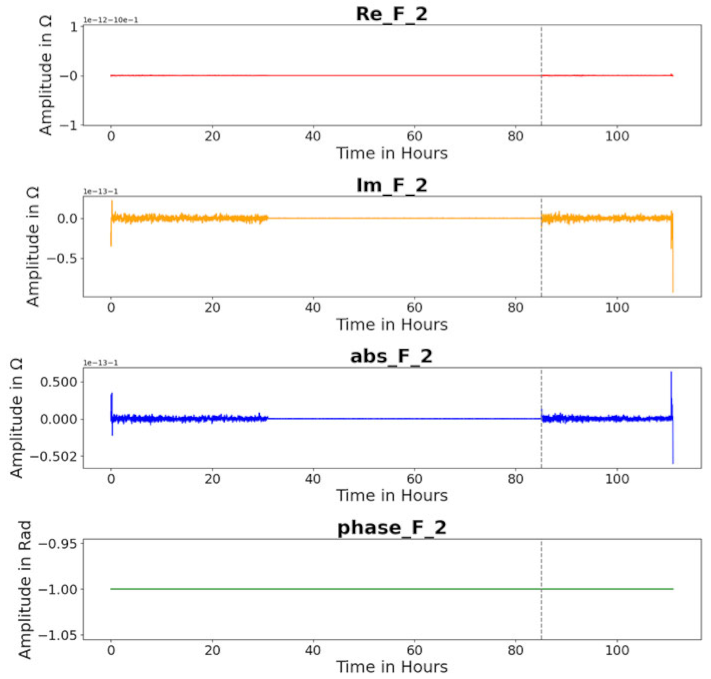
In general, time domain features could not show significant changes in the signal to detect bearing damages accurately. Looking at the frequency domain, different features can be identified, which enables a differentiation between run-in phase, normal condition state, and breakdown phase. Figure 14 shows the feature F2 over the measurements for only radially loaded bearings of type FAG 6205 C C3. The three different phases can be identified according to Martin et al. 2022 and Becker-Dombrowsky et al. 2023 [42,44]. The breakdown phase at the bearings’ life end begins in an early stage, which indicates an early initial damage before the final breakdown. Real part, imaginary part, and absolute value show signal changes, the phase angle not.
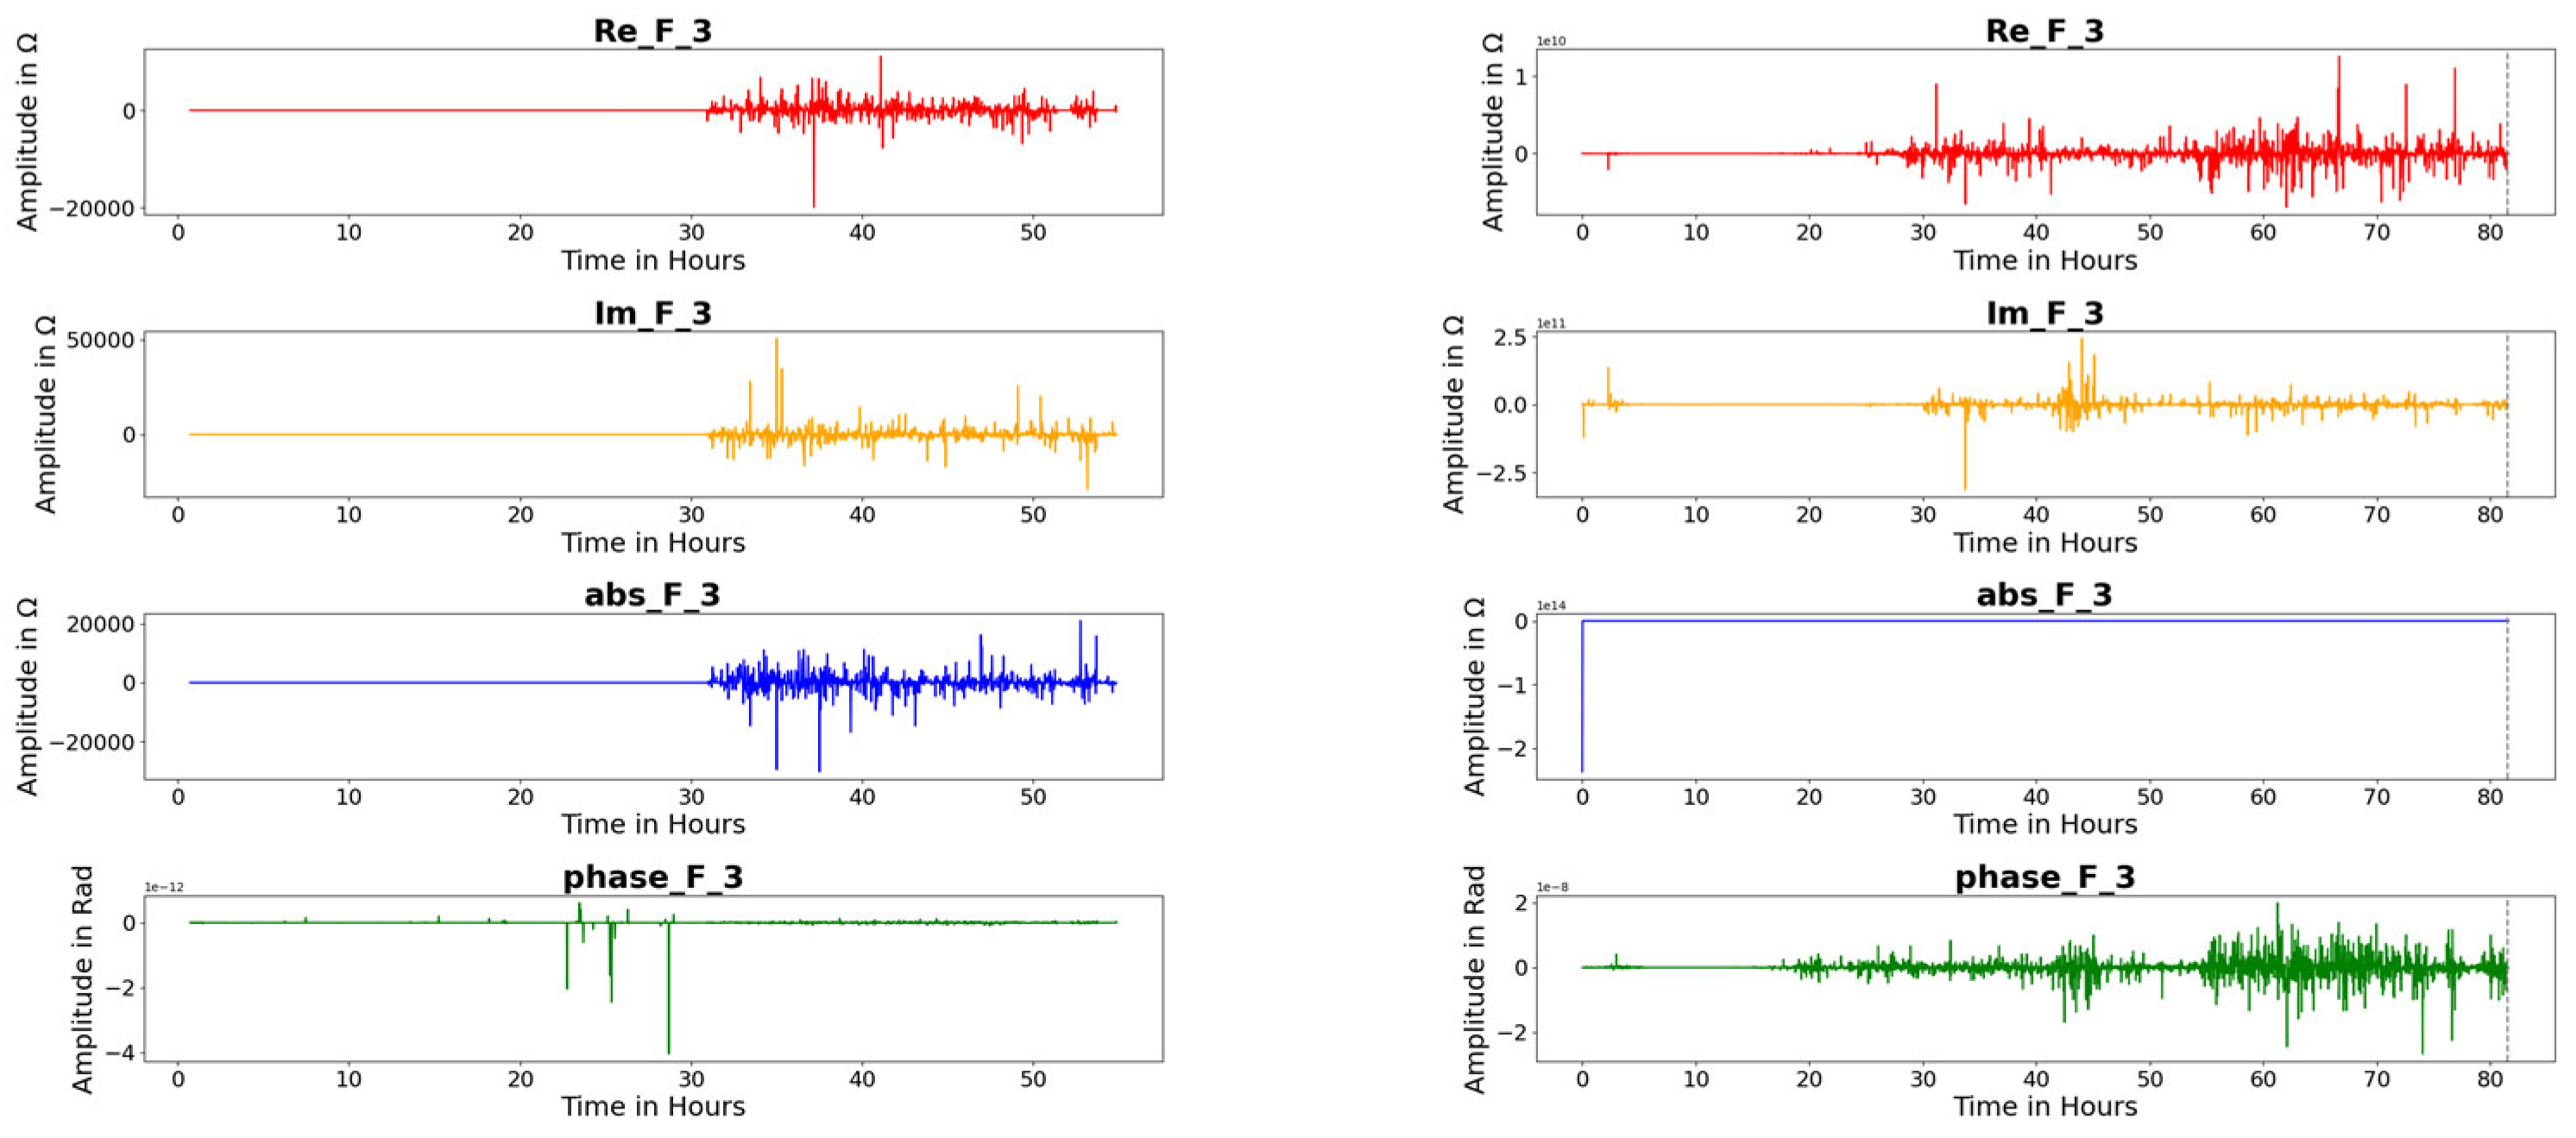
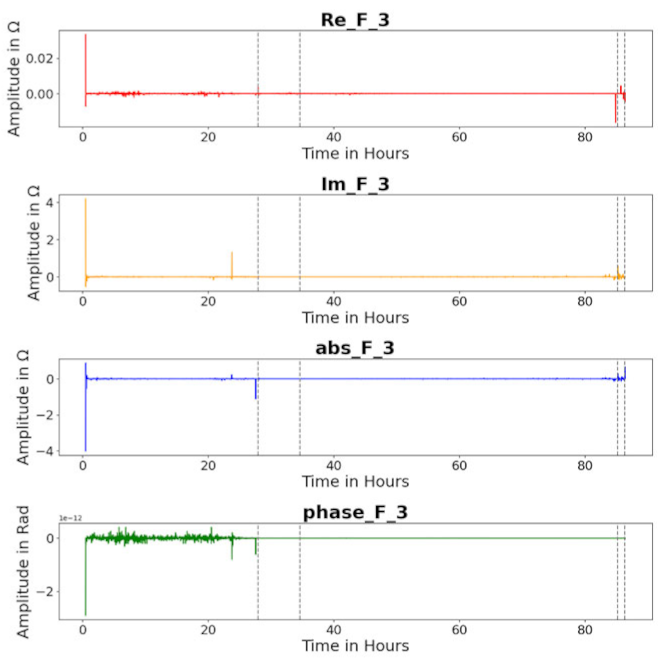
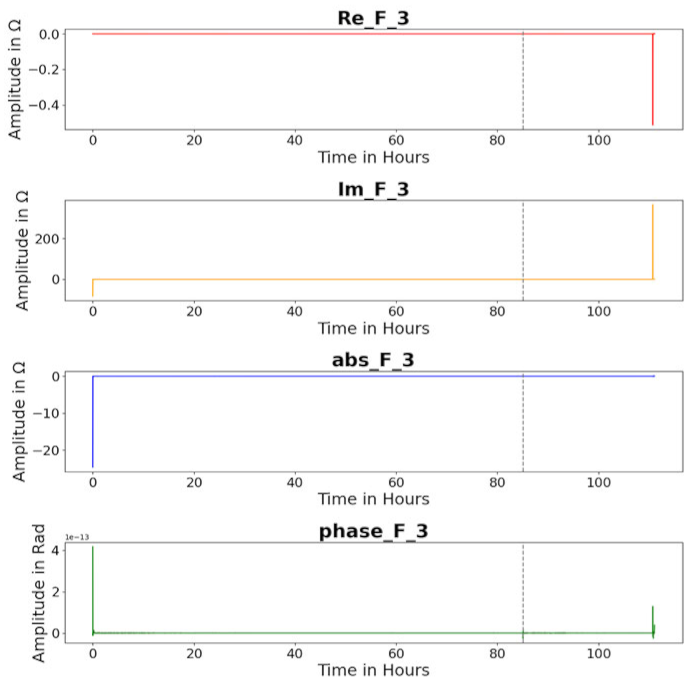
Feature F 3 enables for radially loaded bearings of type FAG 6205 C C3 to detect damage. As shown in Figure 15, real part and imaginary part indicate a damage without signal changes at the beginning of the bearings’ operating life. The phase angle changes as well, but earlier than the real and imaginary parts.
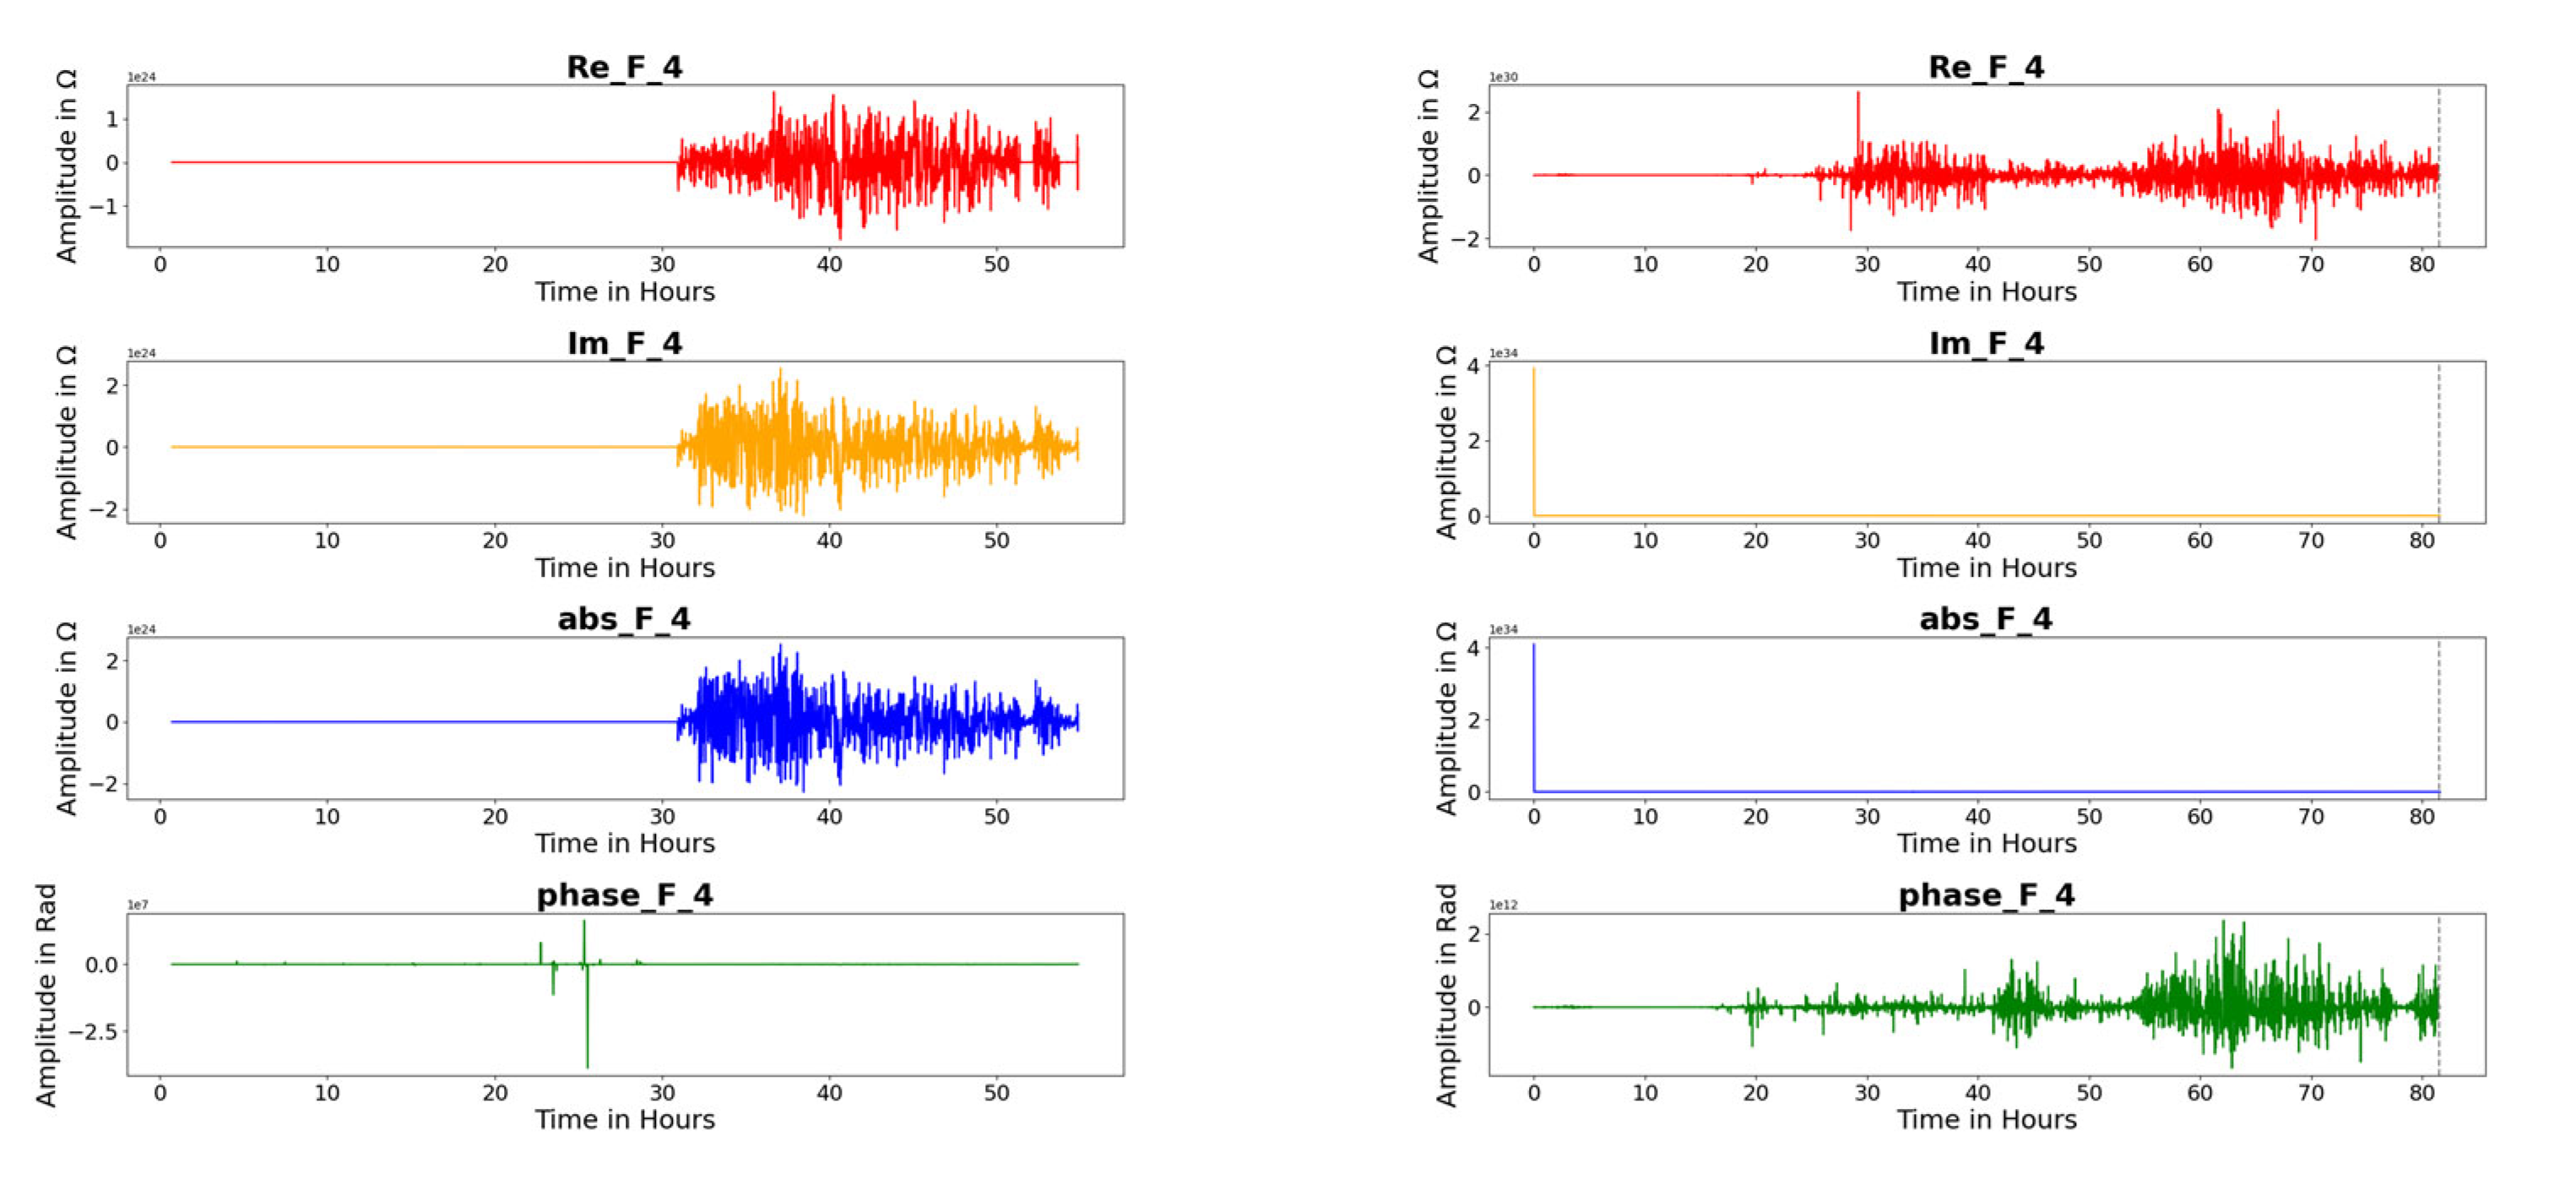
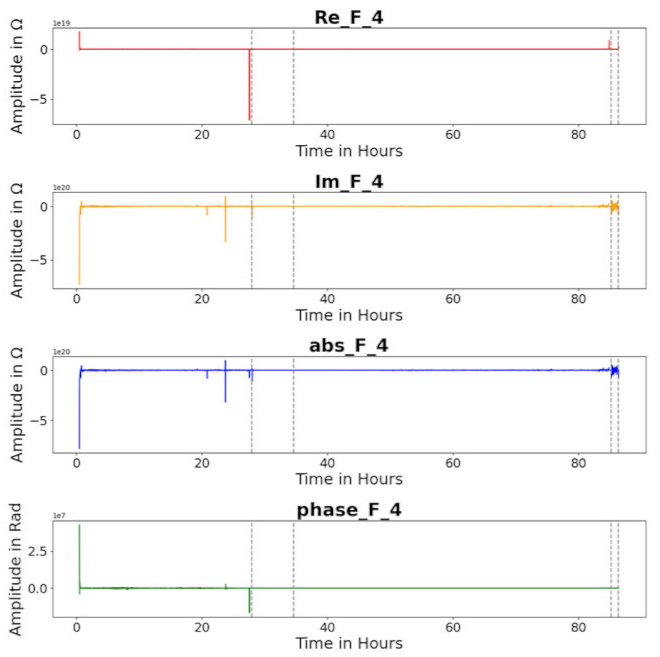
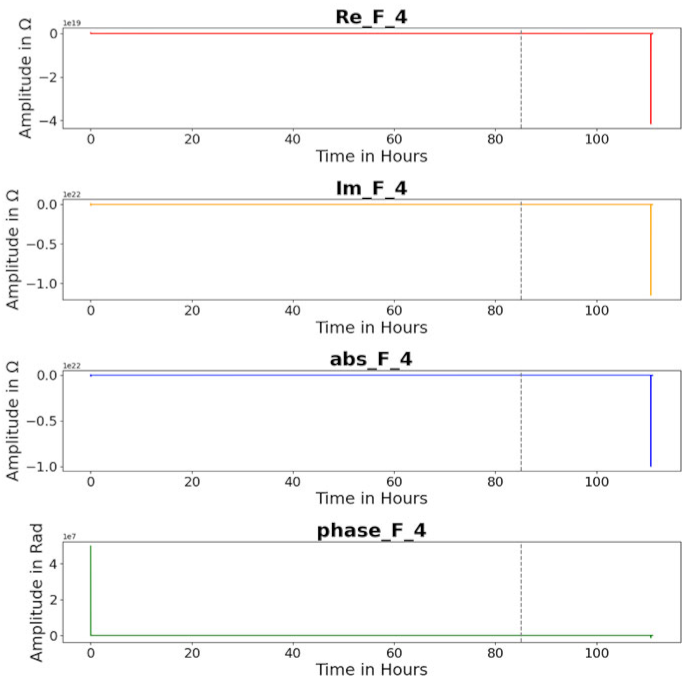
The feature F 4 behaves in the same way, but only the real part and phase angle change significantly over all tests. Figure 16 displays the data.
In case of combined load, the feature still shows changes, as described before. The phases for run-in and breakdown do not have the endurance compared to only radially loaded bearings. In Table 3, the features F 2, F 3, and F 4 of the impedance of the deep groove ball bearings FAG 6205 C C3 for load angles β = 15° and β = 30° are compared.
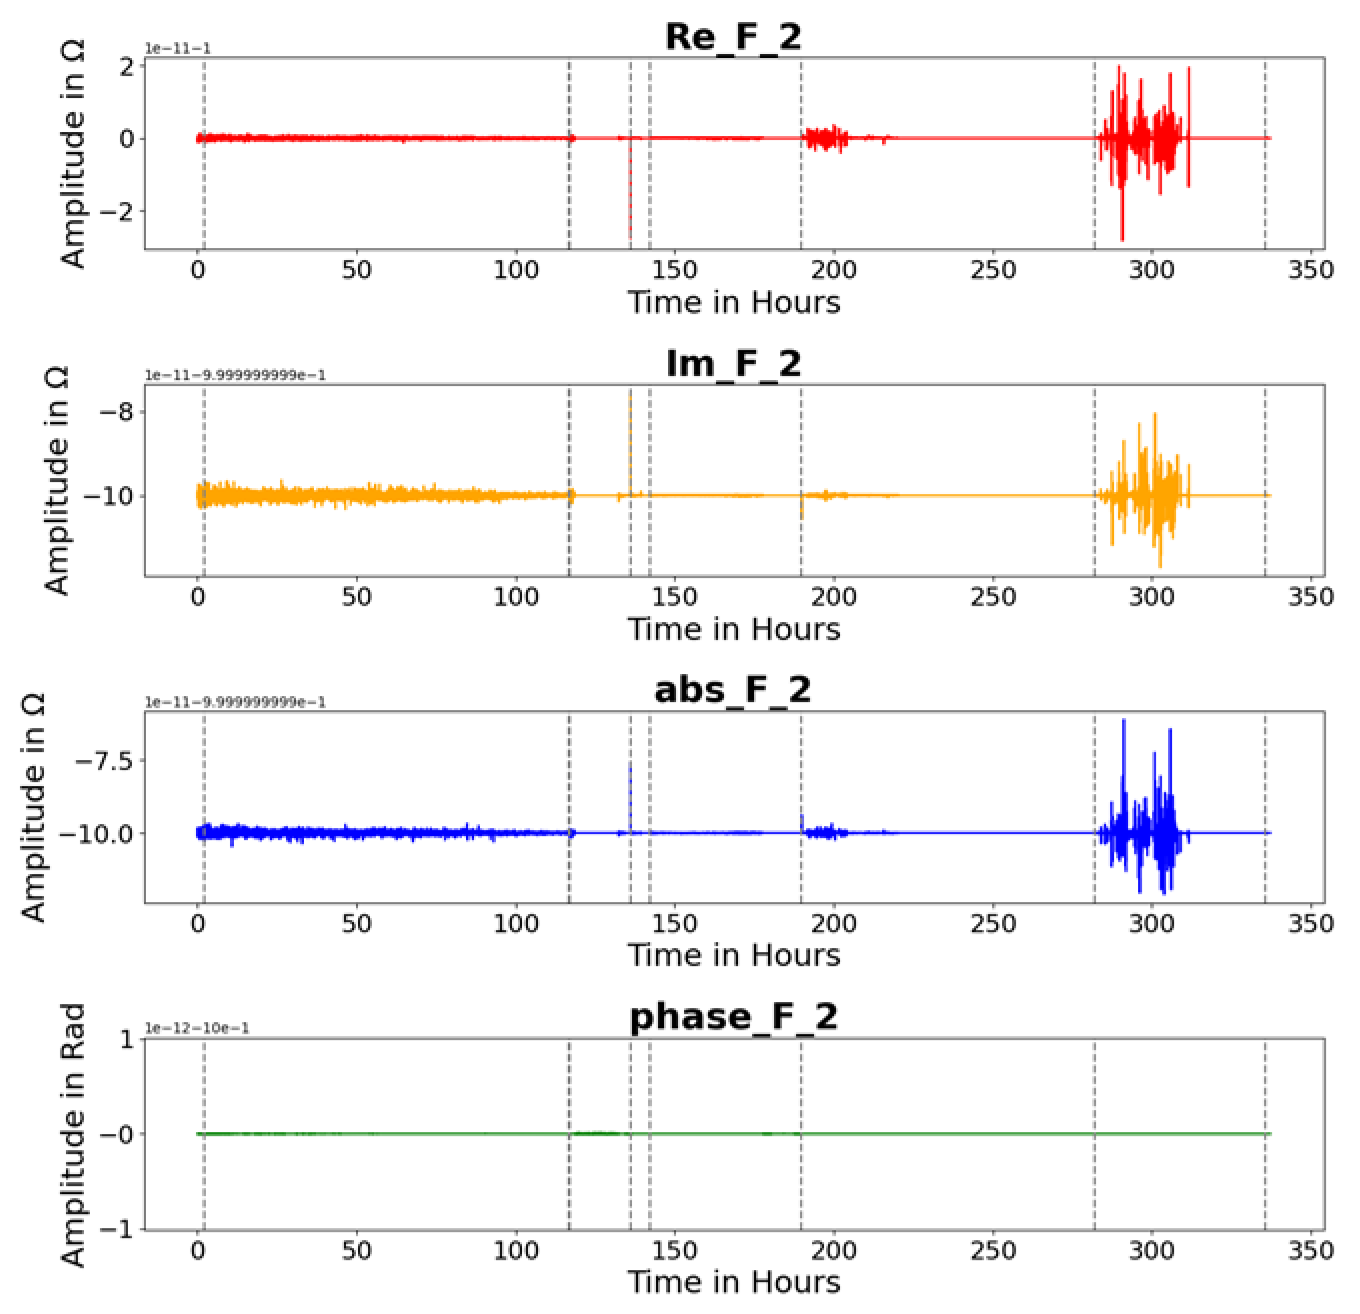
For the bearing type FAG 7205 B XL, Figure 17 shows the behavior of Feature F 2. Like shown before, the damage phase can be identified and differentiated from the run-in phase. The features F 3 and F 4 behave similarly to the cases mentioned before. The signal changes occur in a shorter timespan before the test stops for this bearing type. All bearings under a load angle of 55° had a breakdown in their run-in phase, so signal changes are not visible.
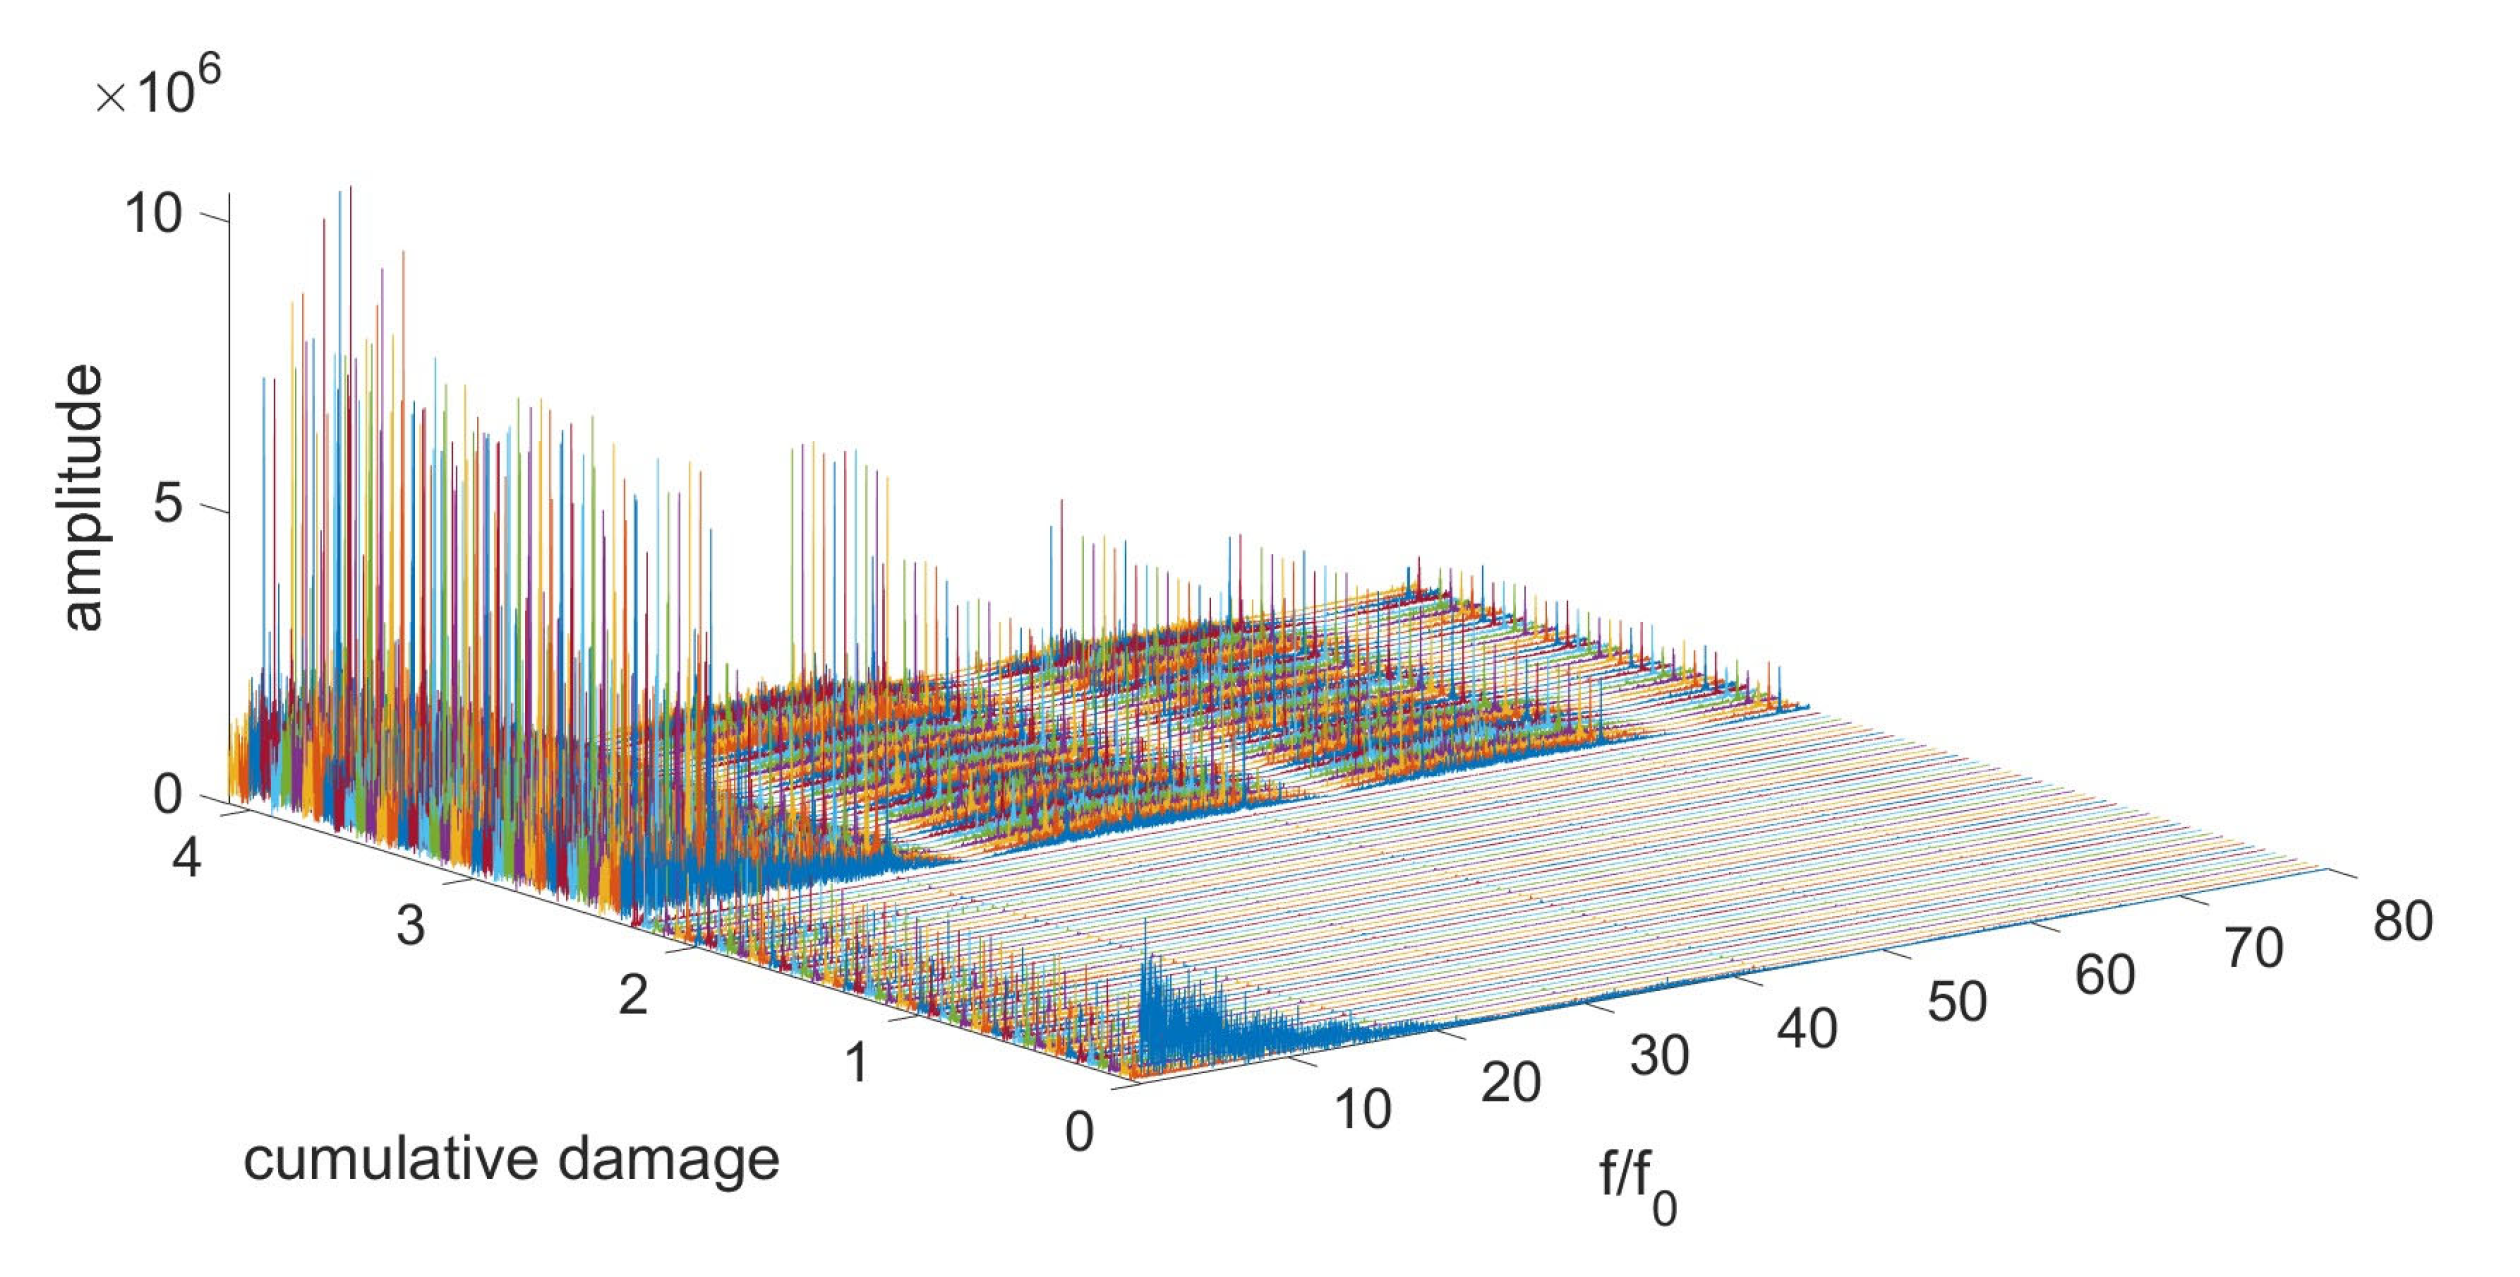
By plotting the amplitudes and their corresponding order on the cumulative damage in a 3D plot, it was possible to recognize some patterns with regard to the damage, as displayed in Figure 18.
Examining the entire spectrum is very computationally intensive due to the large amount of data involved. It was recommended to minimize the entire spectrum to bearing-specific frequencies, such as the frequency of the shaft, the BPFI, and the BPFO. Here, not only the exact frequency of the calculated specific frequencies was taken from the FFT, but also an interval so that the desired frequency can be found in the interval despite measurement inaccuracies, etc. The maximum value of the restricted FFT vector per measurement point was then used to display it in a 2D plot. The following Figure 19 shows the maximum value of the interval of order 5.43, which corresponds to the BPFI of bearing type 6205 at a contact angle of 0°. In this figure, a step at a cumulative damage of ~2.3 can be seen, which indicates a damage.
In case of the bearing shown in Figure 20, a damage can be read at ~13.5, but with a much smaller deflection.
Therefore, there was the problem that bearings, although of the same design, have different orders of magnitude in amplitude as a sign of damage. For a more standardized representation, the natural logarithm was used to represent changes in different bearings of similar magnitude. In addition, the gradient was formed from the logarithmic progression, as damage is usually accompanied by a step and the gradient indicates the slope, i.e., in the change from one measuring point to the next, the gradient also appeared to be a logical tool for detecting damage.
Figure 21 shows the natural logarithm of the maximum value and the real value of the gradient.
It can be seen that, by logarithmizing, the amplitude changes more significantly. The gradient in particular proves to be helpful, as in most cases it also has a significant peak at other bearings in the measurement series which indicates damage, as shown in Figure 22. By using the logarithm, impedance changes that indicate bearing damage can be recognized more clearly and declared as such.

4. Discussion

In this section, the results of the previous section will be discussed and interpreted. As mentioned before, features in time domain do not help to identify pitting damages in a sufficient way. The frequency domain enables damage detection and a condition observation, as can be seen in the results. Three features; namely F 2, F 3, and F 4, allow for an early damage detection over the real part, imaginary part, and phase angle of the impedance signal, as seen in Figure 14, Figure 15, and Figure 16.
The changes in the phase angle features are according to the research of Becker-Dombrowsky et al. 2023 and Harder et al. 2022 [28,42]. In EHL regime, the phase angle is of nearly–90°. Surface damages cause a higher amount of metallic contacts, which leads to an increase in the phase angle to 0°. This causes the phase angle feature changes.
For the radially loaded bearings, the features change significantly early compared to the time the tests are stopped. When the vibration observation of the test rig stops the tests, the impedance measurement was finished as well. Looking at the timespan between test stop and first impedance signal changes, it can be seen that the impedance-based observation allows for an early damage detection for the test rig environment. Changes up to 60 h before the vibration observation stopped the tests from being detected, as Figure 14, Figure 15 and Figure 16 display. A reason could be that small surface mutations can lead to changes in the electric behavior of the EHL contact, but the mutations are not big enough to trigger vibration excitations. This cannot be answered yet and has to be researched further.
An initial damage detection based on the frequency domain is possible, but not sufficient enough. According to research question 1, it is interesting how impedance signals and their features can be modified to optimize the impedance-based early damage detection for rolling element bearings. For a more sufficient initial damage detection, the signals are transferred to the order domain. The impedance shows changes for the specific bearing frequencies BPFI and BPFO, which enables a direct localization of the damage. Using the frequency domain features listed in Table 2 in the order domain does not increase the information density. Therefore, the order domain data have to be modified using different mathematical methods. Logarithmizing the order domain features allows for a comparable detection of an initial damage. The significance of the signal change is increased, which enables the usage of this method for e.g., a threshold-based observation approach. In general, transferring impedance signals into order domain and frequency domain enables and optimizes an impedance-based damage early detection, which answers the first research question.
As described in Section 1.2, early research just considered radial loaded bearings. According to research question 2, it is interesting how the impedance signal features change under combined axial and radial load. Comparing the impedance features under radially load to the impedance features under combined load, it can be seen that the same features show significant changes. In case of combined loads, the changes occur later, but more significantly. The impedance signal changes occur up to six hours earlier than the vibration changes, which is shown in Table 3. The reason is the changed bearing load contribution due to the additional axial load. Due to the axial load, the load zone of the bearing under combined load is bigger than under radial load [5,46]. The load zone is the area of the rolling bearing where the rolling elements transfer loads. It depends on the kinematic contact angle, which is linked to the load angle β. Hence, an additional axial load or an increasing axial load increases the size of the load zone and the number of loaded rolling elements [5,46]. Therefore, more capacitances in parallel connection occur with higher capacitance due to bigger Hertzian contact areas based on Equation (1). This decreases the significance of the single contact capacitance in the load zone, where the pitting damage appears and attenuates the signal occurring when the rolling element runs through the pitting damage. Additionally, the impedance decreases with the increasing load due to Equation (2), which corresponds with the current state of research [49]. This causes a delay in the feature changes and answers the second research question.
The results found by investigating research question 2 indicate the possibility of a different impedance signal behavior for different bearing types due to the load contributions. Therefore, it has been investigated how the impedance signal features behave for different bearing types in case of point contact, which is the third and last research question. Looking at the impedance signal of another rolling bearing type, the same features described at the beginning of this section display a pitting damage. The explanation is the same for the behavior. In case of angular contact ball bearings, the impedance signal behavior has already been addressed by answering research question 2. The changes in the signal occur about 50 h before the vibration observation stops the test, which is shown in Figure 17. In summary, the impedance analysis can be seen as a bearing-type independent condition monitoring approach for point contact bearings, which answers the third research question.
As described in Section 3, damages in the run-in phase cannot be identified. This is based on the high number of metallic contacts in the run-in phase [50,51]. For an impedance-based condition monitoring approach, this has to be considered in further research.

5. Conclusions

In this work, the impedance signals of different rolling bearing types and different load contributions and their features in time, frequency, and order domain have been investigated. The impedance signals and the features have been generated in fatigue tests under vibration observation. The impedance was measured using an alternating current measurement bridge. Deep grove ball bearings and angular groove ball bearings have been investigated under constant speed and temperature. It can be shown that the rolling bearing impedance is an instrument for condition monitoring, independently from the bearing type in case of point contact. For both bearing types, impedance signal features can be identified which indicate damages in the bearing’s runways. For radial loads, explicit changes in the impedance signal are detectable. To investigate the influence of combined loads on the impedance signal, for both bearing types, different load angles were applied. Under combined loads, the signal changes are detectable as well, but not as significant as under radial load. The feature changes occur later compared to the radial loading, which can be explained by the load contribution in the rolling bearing and the connected changes in the electric behavior due to there being more EHL contacts in parallel connection. In general, the rolling bearing impedance can be seen as an instrument for pitting damage detection. In the run-in phase, pitting damages cannot be detected yet. Further research is necessary, e.g., in the mixed lubrication regime to understand the impedance behavior in the run-in phase. Similarly, instationary operating conditions have to be investigated further to enable a usage of impedance-based condition monitoring approaches in a broader application field.

Author Contributions

Conceptualization, F.M.B.-D. and E.K.; methodology, F.M.B.-D.; software, F.M.B.-D., J.S. and J.F.; validation, F.M.B.-D., J.S. and J.F.; formal analysis, F.M.B.-D., J.S. and J.F.; investigation, F.M.B.-D., J.S. and J.F.; resources, E.K.; data curation, F.M.B.-D.; writing—original draft preparation, F.M.B.-D.; writing—review and editing, E.K.; visualization, J.S. and J.F.; supervision, E.K.; project administration, F.M.B.-D. and E.K.; funding acquisition, E.K. All authors have read and agreed to the published version of the manuscript.

Funding

Funded by the Deutsche Forschungsgemeinschaft (DFG, German Research Foundation), project number 463357020.

Data Availability Statement

The data will be published at the end of the funding project with all connected data and further research material. The authors can be contacted to provide special data and information.

Conflicts of Interest

The authors declare no conflicts of interest. The funders had no role in the design of the study; in the collection, analyses, or interpretation of data; in the writing of the manuscript; or in the decision to publish the results.

References

  1. Davies, A. Handbook of Condition Monitoring; Chapman & Hall: London, UK, 1998. [Google Scholar] [CrossRef]
  2. Cameron, J.R.; Thomson, W.T.; Dow, A.B. Vibration and current monitoring for detecting airgap eccentricity in large induction motors. IEE Proc. B Electr. Power Appl. 1986, 133, 155–163. [Google Scholar] [CrossRef]
  3. Jardine, A.K.; Lin, D.; Banjevic, D. A review on machinery diagnostics and prognostics implementing condition-based maintenance. Mech. Syst. Signal Process. 2006, 20, 1483–1510. [Google Scholar] [CrossRef]
  4. Schaeffler Monitoring Services GmbH. Condition Monitoring Praxis: Handbuch zur Schwingungs-Zustandsüberwachung von Maschinen und Anlagen; 1. Auflage; Vereinigte Fachverlage GmbH: Mainz, Germany, 2019; ISBN 978-3-7830-0419-9. [Google Scholar]
  5. Harris, T.A. Rolling Bearing Analysis, 4th ed.; Wiley: New York, NY, USA, 2001; ISBN 0-471-35457-0. [Google Scholar]
  6. Randall, R.B. Vibration-Based Condition Monitoring: Industrial, Aerospace and Automotive Applications; Wiley: Chichester, UK, 2011; ISBN 978-0-470-97765-1. [Google Scholar]
  7. Schenk, M. (Ed.) Instandhaltung technischer Systeme: Methoden und Werkzeuge zur Gewährleistung eines sicheren und wirtschaftlichen Anlagenbetriebs; Springer: Berlin, Germany, 2010; ISBN 978-3-642-03948-5. [Google Scholar]
  8. Łuczak, D. Machine Fault Diagnosis through Vibration Analysis: Time Series Conversion to Grayscale and RGB Images for Recognition via Convolutional Neural Networks. Energies 2024, 17, 1998. [Google Scholar] [CrossRef]
  9. Bienefeld, C.; Becker-Dombrowsky, F.M.; Shatri, E.; Kirchner, E. Investigation of Feature Engineering Methods for Domain-Knowledge-Assisted Bearing Fault Diagnosis. Entropy 2023, 25, 1278. [Google Scholar] [CrossRef] [PubMed]
  10. Lei, Y. Intelligent Fault Diagnosis and Remaining Useful Life Prediction of Rotating Machinery; Elsevier: Oxford, UK, 2016; ISBN 978-0-12-811534-3. [Google Scholar]
  11. Lei, Y.; He, Z.; Zi, Y. A new approach to intelligent fault diagnosis of rotating machinery. Expert Syst. Appl. 2008, 35, 1593–1600. [Google Scholar] [CrossRef]
  12. Akpudo, U.E.; Hur, J.-W. A feature fusion-based prognostics approach for rolling element bearings. J. Mech. Sci. Technol. 2020, 34, 4025–4035. [Google Scholar] [CrossRef]
  13. Bienefeld, C.; Vogt, A.; Kacmar, M.; Kirchner, E. Feature-Engineering für die Zustandsüberwachung von Wälzlagern mittels maschinellen Lernens. TuS 2021, 68, 5–11. [Google Scholar] [CrossRef]
  14. Miller, J.L.; Kitaljevich, D. In-line oil debris monitor for aircraft engine condition assessment. In Proceedings of the 2000 IEEE Aerospace Conference. Proceedings (Cat. No.00TH8484), Big Sky, MT, USA, 25 March 2000; pp. 49–56. [Google Scholar] [CrossRef]
  15. Thomson, W.T.; Barbour, A. On-line current monitoring and application of a finite element method to predict the level of static airgap eccentricity in three-phase induction motors. IEEE Trans. Energy Convers. 1998, 13, 347–357. [Google Scholar] [CrossRef]
  16. Engelhardt, R.A. Uncertainty Mode and Effects Analysis—Heuristische Methodik zur Analyse und Beurteilung von Unsicherheiten in technischen Systemen des Maschinenbaus. Ph.D. Dissertation, Technische Universität Darmstadt, Darmstadt, Germany, 2012. [Google Scholar]
  17. Vorwerk-Handing, G. Erfassung systemspezifischer Zustandsgrößen—Physikalische Effektkataloge zur systematischen Identifikation potentieller Messgrößen. Ph.D. Dissertation, Technische Universität Darmstadt, Darmstadt, Germany, 2020. [Google Scholar]
  18. Furtmann, A.; Tischmacher, H.; Poll, G. Extended HF equivalent model of a drive train. In International Conference on Electrical Machines (ICEM): SwissTech Convention Center, Lausanne, Switzerland, 4–7 September 2016; IEEE: Piscataway, NJ, USA, 2016; pp. 2244–2250. ISBN 978-1-5090-2538-1. [Google Scholar]
  19. Furtmann, A.; Poll, G. Evaluation of Oil-Film Thickness Along the Path of Contact in a Gear Mesh by Capacitance Measurement. Tribol. Online 2016, 11, 189–194. [Google Scholar] [CrossRef]
  20. Becker-Dombrowsky, F.M.; Hausmann, M.; Welzbacher, P.; Harder, A.; Kirchner, E. Systematic identification of disturbance factors on electric characteristics of mechanical gearboxes. Forsch. Ingenieurwes 2023, 87, 399–410. [Google Scholar] [CrossRef]
  21. Furtmann, A. Elektrisches Verhalten von Maschinenelementen im Antriebsstrang. Ph.D. Dissertation, Gottfried Wilhelm Leibniz Universität Hannover, Hannover, Germany, 2017. [Google Scholar]
  22. Prashad, H. Tribology in Electrical Environments; Elsevier: Amsterdam, The Netherlands; London, UK, 2006; ISBN 978-0-444-51880-4. [Google Scholar]
  23. Prashad, H. Theoretical evaluation of impedance, capacitance and charge accumulation on roller bearings operated under electrical fields. Wear 1988, 125, 223–239. [Google Scholar] [CrossRef]
  24. Muetze, A. Bearing Currents in Inverter-Fed AC-Motors. Ph.D. Dissertation, Technische Universität Darmstadt, Darmstadt, Germany, 2003. [Google Scholar]
  25. Gemeinder, Y. Lagerimpedanz und Lagerschädigung bei Stromdurchgang in umrichtergespeisten elektrischen Maschinen. Ph.D. Dissertation, Technische Universität Darmstadt, Darmstadt, Germany, 2016. [Google Scholar]
  26. Martin, G. Die Wälzlagerimpedanz als Werkzeug zur Untersuchung von Oberflächenabweichungen in Wälzlagern. Ph.D. Dissertation, Technische Universität Darmstadt, Darmstadt, Germany, 2021. [Google Scholar]
  27. Schirra, T. Phänomenologische Betrachtung der sensorisch nutzbaren Effekte am Wälzlager: Einfluss unbelasteter Wälzkörper auf die elektrische Impedanz. Ph.D. Dissertation, Technische Universität Darmstadt, Darmstadt, Germany, 2020. [Google Scholar]
  28. Harder, A.; Zaiat, A.; Becker-Dombrowsky, F.M.; Puchtler, S.; Kirchner, E. Investigation of the Voltage-Induced Damage Progression on the Raceway Surfaces of Thrust Ball Bearings. Machines 2022, 10, 832. [Google Scholar] [CrossRef]
  29. Schirra, T.; Martin, G.; Vogel, S.; Kirchner, E. Ball bearings as sensors for systematical combination of load and failure monitoring. In Design 2018: Proceedings of the 15th International Design Conference, May 2018, Dubrovnik, Croatia; Marjanović, D., Štorga, M., Škec, S., Bojčetić, N., Pavković, N., Eds.; Faculty of Mechanical Engineering and Naval Architecture, University of Zagreb: Zagreb, Croatia, 2018; pp. 3011–3022. ISBN 978-953-7738-59-4. [Google Scholar]
  30. Tuomas, R.; Isaksson, O. Measurement of lubrication conditions in a rolling element bearing in a refrigerant environment. Ind. Lubr. Tribol. 2009, 61, 91–99. [Google Scholar] [CrossRef]
  31. Shi, H.; Zhang, H.; Huo, D.; Yu, S.; Su, J.; Xie, Y.; Li, W.; Ma, L.; Chen, H.; Sun, Y. An Ultrasensitive Microsensor Based on Impedance Analysis for Oil Condition Monitoring. IEEE Trans. Ind. Electron. 2022, 69, 7441–7450. [Google Scholar] [CrossRef]
  32. Zeng, L.; Wang, W.; Rogers, F.; Zhang, H.; Zhang, X.; Yang, D. A High Sensitivity Micro Impedance Sensor Based on Magnetic Focusing for Oil Condition Monitoring. IEEE Sens. J. 2020, 20, 3813–3821. [Google Scholar] [CrossRef]
  33. Becker-Dombrowsky, F.M.; Kirchner, E. Electrical impedance based condition monitoring of machine elements—A systematic review. Front. Mech. Eng. 2024, 10, 1412137. [Google Scholar] [CrossRef]
  34. Cen, H.; Bai, D.; Chao, Y.; Li, Y.; Li, R. EHL film thickness in rolling element bearings evaluated by electrical capacitance method: A review. Tribol.—Mater. Surf. Interfaces 2021, 15, 55–77. [Google Scholar] [CrossRef]
  35. Clarke, A.; Weeks, I.; Evans, H.P.; Snidle, R.W. An investigation into mixed lubrication conditions using electrical contact resistance techniques. Tribol. Int. 2016, 93, 709–716. [Google Scholar] [CrossRef]
  36. Dyson, A. Investigation of the Discharge-Voltage Method of Measuring the Thickness of Oil Films Formed in a Disc Machine under Conditions of Elastohydrodynamic Lubrication. Proc. Inst. Mech. Eng. 1966, 181, 633–652. [Google Scholar] [CrossRef]
  37. Jablonka, K.; Glovnea, R.; Bongaerts, J. Evaluation of EHD films by electrical capacitance. J. Phys. D Appl. Phys. 2012, 45, 385301. [Google Scholar] [CrossRef]
  38. Maruyama, T.; Maeda, M.; Nakano, K. Lubrication Condition Monitoring of Practical Ball Bearings by Electrical Impedance Method. Tribol. Online 2019, 14, 327–338. [Google Scholar] [CrossRef]
  39. Maruyama, T.; Radzi, F.; Sato, T.; Iwase, S.; Maeda, M.; Nakano, K. Lubrication Condition Monitoring in EHD Line Contacts of Thrust Needle Roller Bearing Using the Electrical Impedance Method. Lubricants 2023, 11, 223. [Google Scholar] [CrossRef]
  40. Maruyama, T.; Nakano, K. In Situ Quantification of Oil Film Formation and Breakdown in EHD Contacts. Tribol. Trans. 2018, 61, 1057–1066. [Google Scholar] [CrossRef]
  41. Schirra, T.; Martin, G.; Puchtler, S.; Kirchner, E. Electric impedance of rolling bearings—Consideration of unloaded rolling elements. Tribol. Int. 2021, 158, 106927. [Google Scholar] [CrossRef]
  42. Becker-Dombrowsky, F.M.; Koplin, Q.S.; Kirchner, E. Individual Feature Selection of Rolling Bearing Impedance Signals for Early Failure Detection. Lubricants 2023, 11, 304. [Google Scholar] [CrossRef]
  43. Chevallier, E.; Boudimbou, J.C.; Bouzerar, R.; Garcia, T.; Bolaers, F.; Chiementin, X. Monitoring of roller bearings: Electrical vs vibrational analysis. preprint 2023. [Google Scholar] [CrossRef]
  44. Martin, G.; Becker, F.M.; Kirchner, E. A novel method for diagnosing rolling bearing surface damage by electric impedance analysis. Tribol. Int. 2022, 170, 107503. [Google Scholar] [CrossRef]
  45. Schnabel, S.; Marklund, P.; Minami, I.; Larsson, R. Monitoring of Running-in of an EHL Contact Using Contact Impedance. Tribol. Lett. 2016, 63, 35. [Google Scholar] [CrossRef]
  46. Dahlke, H. Handbuch Wälzlager-Technik: Bauarten, Gestaltung, Betrieb; Springer Fachmedien: Wiesbaden, Germany, 1994; ISBN 978-3-663-01973-2. [Google Scholar]
  47. Deutsches Institut für Normung e.V. Wälzlager: Dynamische Tragzahlen und Nominelle Lebensdauer; 21.100.20 (281); Deutsches Institut für Normung e.V.: Berlin, Germany, 2021. [Google Scholar]
  48. Soviany, S.; Soviany, C. Feature Engineering. In Principles of Data Science, 1st ed.; Arabnia, H.R., Daimi, K., Stahlbock, R., Soviany, C., Heilig, L., Brüssau, K., Eds.; Springer International Publishing, Imprint Springer: Cham, Swizerland, 2020; pp. 79–103. ISBN 978-3-030-43981-1. [Google Scholar]
  49. Puchtler, S.; van der Kuip, J.; Kirchner, E. Analyzing Ball Bearing Capacitance Using Single Steel Ball Bearings. Tribol. Lett. 2023, 71. [Google Scholar] [CrossRef]
  50. Heemskerk, R.S.; Vermeiren, K.N.; Dolfsma, H. Measurement of Lubrication Condition in Rolling Element Bearings. ASLE Trans. 1982, 25, 519–527. [Google Scholar] [CrossRef]
  51. Jablonka, K.; Glovnea, R.; Bongaerts, J. Quantitative measurements of film thickness in a radially loaded deep-groove ball bearing. Tribol. Int. 2018, 119, 239–249. [Google Scholar] [CrossRef]
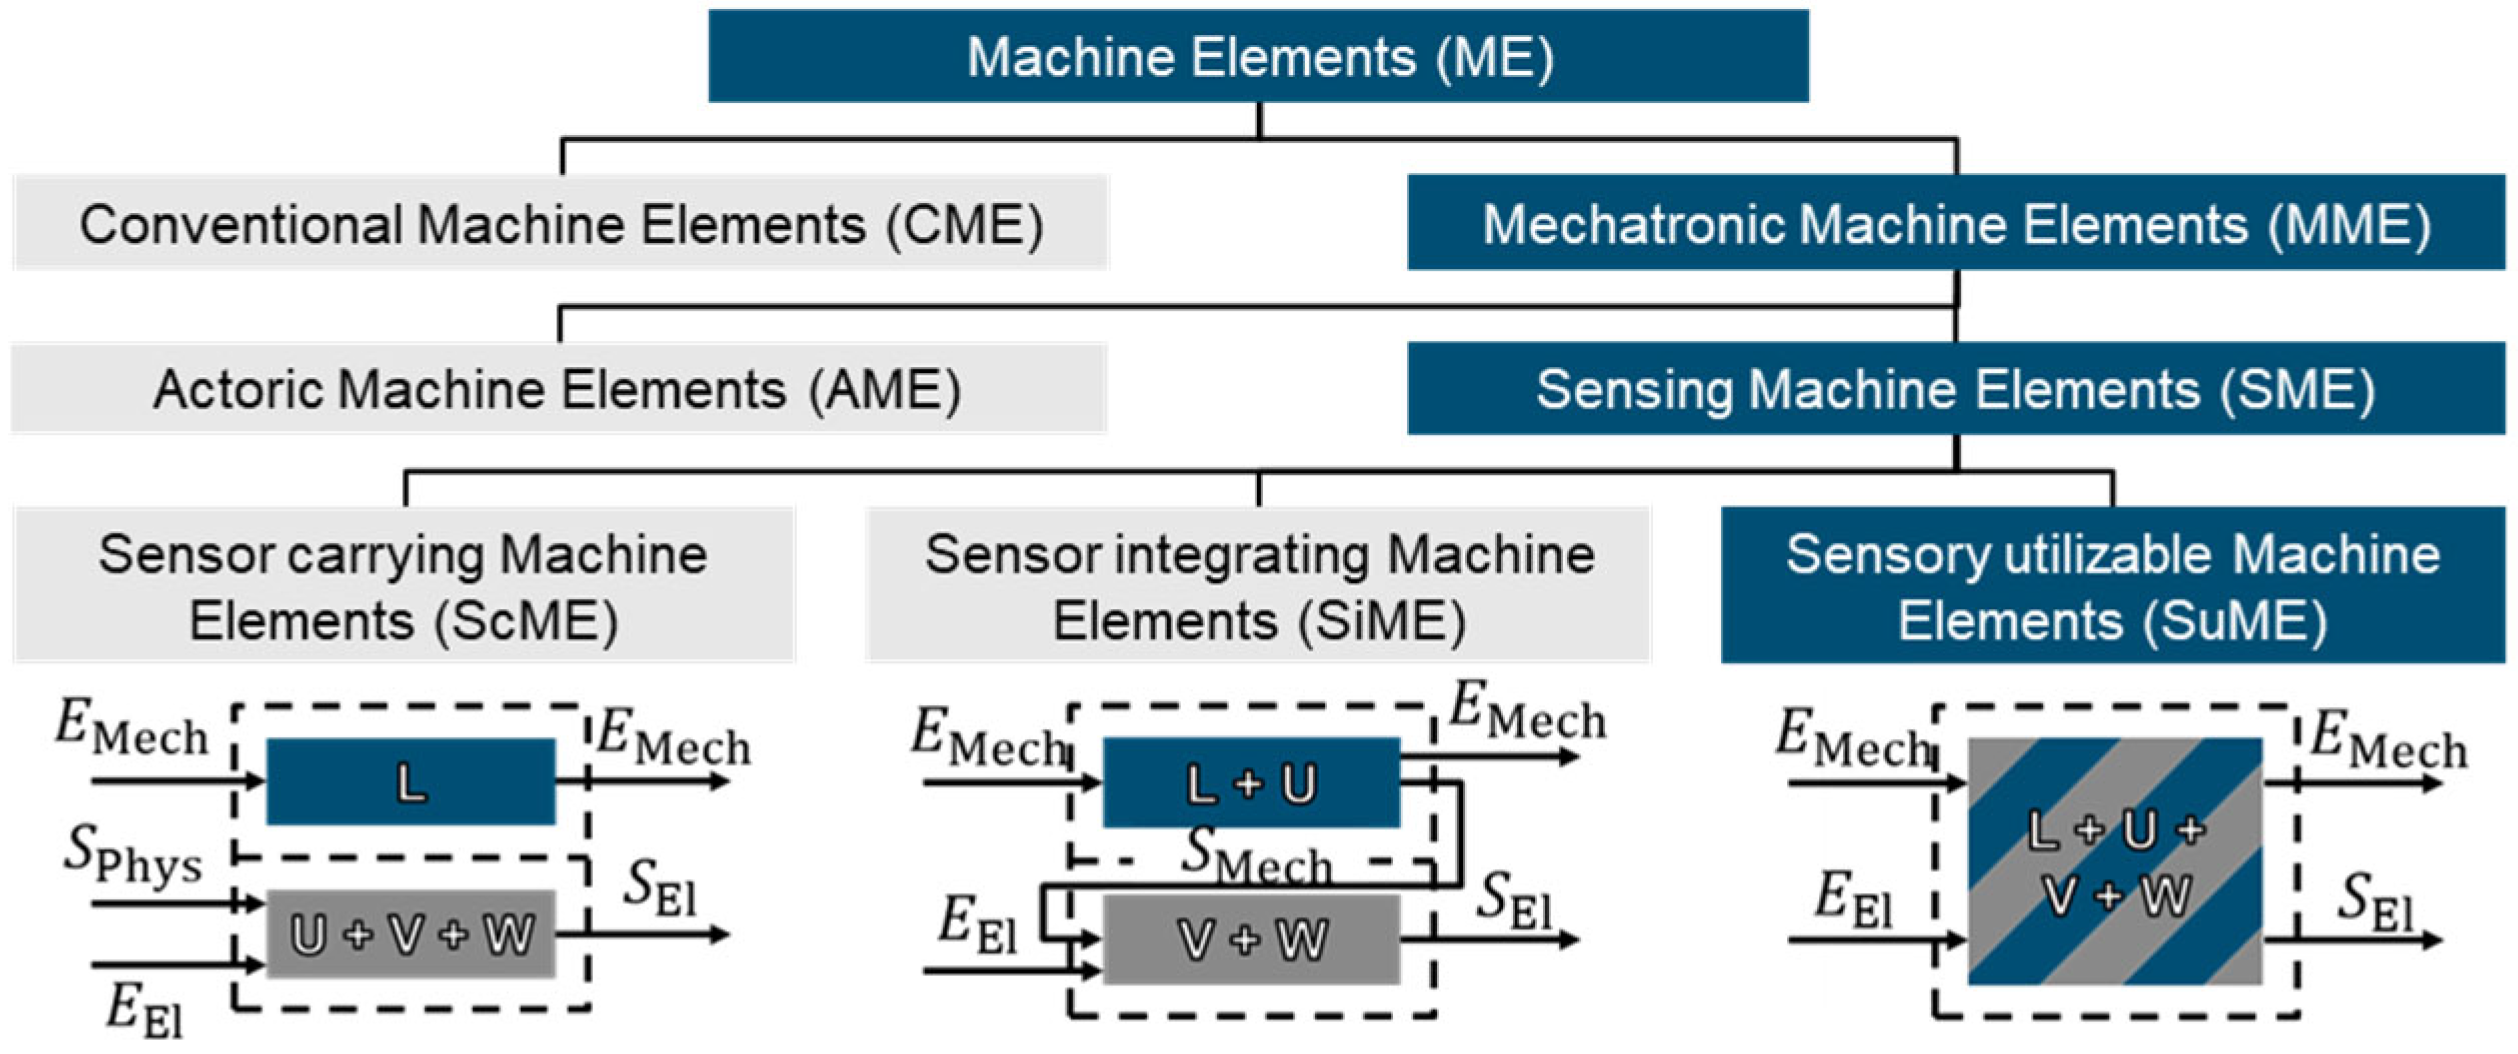
Figure 1. Overview of sensing machine elements [17].
Machines 12 00487 g001
Figure 2. Common machine elements and their equivalent electrical components [20].
Machines 12 00487 g002
Figure 3. Electric model of the EHL contact as a function of the lubrication film thickness [26].
Machines 12 00487 g003
Figure 4. Electric model of the EHL contact in a ball bearing [27].
Machines 12 00487 g004
Figure 5. Test chamber of the bearing test rig.
Machines 12 00487 g005
Figure 6. Sectioning of a test rig chamber.
Machines 12 00487 g006
Figure 7. Equivalent circuit of the alternating current measurement bridge for impedance measurement [42].
Machines 12 00487 g007
Figure 8. Data handling.
Machines 12 00487 g008
Figure 9. Real part, imaginary part, absolute value, and the phase angle over the operational time in hours for bearing A; bearing type FAG 6205 C C3; C/P = 1.6, n = 5000 rpm, F r a d = 9375   N , F a x = 0   N , β = 0°.
Machines 12 00487 g009
Figure 10. Real part, imaginary part, absolute value, and the phase angle over the operational time in hours for bearing J; bearing type FAG 6205 C C3; C/P = 1.6, n = 5000 rpm, F r a d = 9375   N , F a x = 0   N , β = 0°.
Machines 12 00487 g010
Figure 11. Real part and imaginary part over the operational time in hours for bearing D; bearing type FAG 6205 C C3; C/P = 1.6, n = 5000 rpm, β = 15°.
Machines 12 00487 g011
Figure 12. Real part and imaginary part over the operational time in hours for bearing A; bearing type FAG 6205 C C3; C/P = 1.6, n = 5000 rpm, β = 30°.
Machines 12 00487 g012
Figure 13. Real part and imaginary part over the operational time in hours for bearing D; bearing type FAG 7205 B XL; C/P = 1.6, n = 5000 rpm, β = 40°.
Machines 12 00487 g013
Figure 14. Feature F2 of real part Re_F_2, imaginary part Im_F_2, absolute value abs_F_2, and the phase angle phase_F_2 over the measurements for bearing A (left) and bearing J (right); bearing type FAG 6205 C C3; C/P = 1.6, n = 5000 rpm, F r a d = 9375   N , F a x = 0   N , β = 0°.
Machines 12 00487 g014
Figure 15. Feature F3 of real part Re_F_3, imaginary part Im_F_3, absolute value abs_F_3, and the phase angle phase_F_3 over the measurements for bearing A (left) and bearing J (right); bearing type FAG 6205 C C3; C/P = 1.6, n = 5000 rpm, F r a d = 9375   N , F a x = 0   N , β = 0°.
Machines 12 00487 g015
Figure 16. Feature F4 of real part Re_F_4, imaginary part Im_F_4, absolute value abs_F_4, and the phase angle phase_F_4 over the measurements for bearing A (left) and bearing J (right); bearing type FAG 6205 C C3; C/P = 1.6, n = 5000 rpm, F r a d = 9375   N , F a x = 0   N , β = 0°.
Machines 12 00487 g016
Figure 17. Feature F2 of real part Re_F_2, imaginary part Im_F_2, absolute value abs_F_2, and the phase angle phase_F_2 over the measurements; bearing type FAG 7205 B XL; C/P = 1.6, n = 5000 rpm, F r a d = 4410   N , F a x = 3700   N , β = 40°.
Machines 12 00487 g017
Figure 18. Amplitudes and their corresponding order on the cumulative damage for bearing A; bearing type FAG 6205 C C3; C/P = 1.6, n = 5000 rpm, F r a d = 9375   N , F a x = 0   N , β = 0°.
Machines 12 00487 g018
Figure 19. Maximum value of the interval of order 5.43 for bearing A; bearing type FAG 6205 C C3; C/P = 1.6, n = 5000 rpm, F r a d = 9375   N , F a x = 0   N , β = 0°.
Machines 12 00487 g019
Figure 20. Maximum value of the interval of order 5.43 for bearing C; bearing type FAG 6205 C C3; C/P = 1.6, n = 5000 rpm, F r a d = 9375   N , F a x = 0   N , β = 0°.
Machines 12 00487 g020
Figure 21. Natural logarithm of the maximum value of the interval of order 5.43 for bearing A; bearing type FAG 6205 C C3; C/P = 1.6, n = 5000 rpm, F r a d = 9375   N , F a x = 0   N , β = 0°.
Machines 12 00487 g021
Figure 22. Real gradient of the natural logarithm of the maximum value of the interval of order 5.43 for bearing A; bearing type FAG 6205 C C3; C/P = 1.6, n = 5000 rpm, F r a d = 9375   N , F a x = 0   N , β = 0°.
Machines 12 00487 g022
Table 1. Test parameters.
Bearing TypeAmount of Fatigue TestsSpeedC/PLoad angle β Radial   Load   F r a d Axial   Load   F a x Oil Temperature
FAG 6205 C C3135000 rpm1.69375 N0 N60°
FAG 6205 C C355000 rpm1.615°9375 N2512 N60°
FAG 6205 C C355000 rpm1.630°9076 N5240 N60°
FAG 7205 B XL55000 rpm1.640°4410 N3700 N60°
FAG 7205 B XL55000 rpm1.655°3515 N5020 N60°
Table 2. Features derived from the time and frequency domains [10,42].
NumberFormulaNumberFormula
T1 T m = i = 1 N x i N F1 W 1 = W m f = k = 1 K s k K
T2 T r o o t = i = 1 N x i N 2 F2 W 2 = k = 1 K s k W 1 2 K 1
T3 T r m s = i = 1 N x i 2 N F3 W 3 = k = 1 K s k W 1 3 K · W 2 3
T4 T m a x = m a x x ( i ) F4 W 4 = k = 1 K s k W 1 4 K · W 2 2
T5 T s d = i = 1 N x i T m 2 N 1 F5 W 5 = W f c = k = 1 K f ( k ) · s k k = 1 K s ( k )
T6 T s k e w n e s s = i = 1 N x i T m 3 ( N 1 ) · T s d 3 F6 W 6 = k = 1 K f k W 5 2 · s k K
T7 T k u r t o s i s = i = 1 N x i T m 4 ( N 1 ) · T s d 4 F7 W 7 = W r m s f = k = 1 K f k 2 · s k k = 1 K s ( k )
T8 T c r e s t = T m a x T r m s F8 W 8 = k = 1 K f k 4 · s k k = 1 K f k 2 · s k
T9 T c l e a r a n c e = T m a x T r o o t F9 W 9 = k = 1 K f k 2 · s k k = 1 K s k · k = 1 K f k 4 · s k
T10 T s h a p e = T r m s 1 N · i = 1 N x ( i ) F10 W 10 = W 6 W 5
T11 T i m p u l s e = T m a x 1 N · i = 1 N x ( i ) F11 W 11 = k = 1 K f ( k ) W 5 3 · s k K · W 6 3
T12 T p p = max x i min x i F12 W 12 = k = 1 K f ( k ) W 5 4 · s k K · W 6 4
T13 T v a r = 1 N · i = 1 N x i T m 2 F13 W 13 = k = 1 K f ( k ) W 5 1 2 · s k K · W 6
T14 T m i n = min x i F14 W 14 = k = 1 K f ( k ) W 5 2 · s k k = 1 K s ( k )
T15 T w a v e = 1 N · i = 1 N x i 2 1 N · i = 1 N x ( i ) F15 W 15 = m a x s k
T16 T p e a k = T m a x 1 N · i = 1 N x i 2
T17 T L I = i = 1 N x t i + Δ t s x t i 2 + Δ t s 2 i = 1 N x t i + Δ t s x t i
with sampling period Δ t s
Table 3. Impedance features for damage detection for FAG 6205 C C3 bearings under different load angles; C/P = 1.6, n = 5000 rpm.
FeatureFAG 6205 C C3, β = 15°FAG 6205 C C3, β = 30°
Feature F 2Machines 12 00487 i001Machines 12 00487 i002
Feature F 3Machines 12 00487 i003Machines 12 00487 i004
Feature F 4Machines 12 00487 i005Machines 12 00487 i006
Disclaimer/Publisher’s Note: The statements, opinions and data contained in all publications are solely those of the individual author(s) and contributor(s) and not of MDPI and/or the editor(s). MDPI and/or the editor(s) disclaim responsibility for any injury to people or property resulting from any ideas, methods, instructions or products referred to in the content.