Article

Multi-Objective Optimization Study on the Coupling Mechanism of Underwater Wireless Power Transfer Systems

1
School of Mechanical and Electrical Engineering, Central South University, Changsha 410083, China
2
State Key Laboratory of Deep Sea Mineral Resources Development and Utilization Technology, Changsha 410012, China
*
Author to whom correspondence should be addressed.
Machines 2024, 12(7), 445; https://doi.org/10.3390/machines12070445
Submission received: 30 May 2024 / Revised: 20 June 2024 / Accepted: 26 June 2024 / Published: 27 June 2024
(This article belongs to the Section Electromechanical Energy Conversion Systems)

Abstract

:
Magnetically coupled resonant wireless power transfer (MCR-WPT) technology offers longer effective transmission distances and higher efficiency compared to traditional charging methods, making it better suited to the prolonged and efficient operation of autonomous underwater vehicles. This paper first establishes a traditional mathematical model and then refines it while analyzing the variations in the self-inductance and mutual inductance of underwater coils. To further enhance the system’s performance, a multi-objective optimization of the coupling mechanism is conducted. An orthogonal experiment is employed to determine the effects of various influencing factors on the coils’ self-inductance and mutual inductance. Subsequently, an RBF neural network is used to create a regression prediction model based on the results of the orthogonal experiment. The NSGA-II algorithm is then applied for the multi-objective optimization of the coupling mechanism, resulting in a Pareto front solution set. The optimized efficiency is 93.35%, representing an approximately 6% improvement over the original system, with the power density increasing from 1.267 × 10 6   W / m 3 before optimization to 4.782 × 10 6   W / m 3 after optimization. Significant enhancement in system performance is achieved.

1. Introduction

Currently, underwater wireless power transmission holds significant potential for both civilian and military applications. However, the majority of marine exploration reaches depths exceeding one kilometer, presenting substantial challenges for exploring marine resources. Consequently, there is an urgent need to develop advanced technologies for deep-sea detection and transportation equipment [1,2]. Autonomous underwater vehicles (AUVs) are common detection and transportation equipment. They achieve underwater power transmission by docking with seabed stations [3]. However, traditional wet-plugging charging methods fail to meet the long-term and efficient operational requirements of underwater autonomous vehicles and pose significant safety hazards [4].
Underwater contactless power transmission systems achieve energy transmission through the coupling of primary and secondary coils, maintaining electrical isolation. Circuits installed on both sides have no mutual influence, effectively eliminating the two major safety hazards of wear and leakage. This design also provides an ideal waterproof and pressure-resistant effect [5,6]. Magnetically coupled resonant wireless power transfer technology, initially proposed in 2007, achieves energy transmission through electromagnetic coupling between the transmitting and receiving coils. This coupling forms a low-resistance channel between the coils, which is essential for efficient energy transport [7]. Systems using this technology can efficiently transmit energy over distances generally reaching meters when the system resonance frequency is in the MHz range, and can also achieve one-to-many energy transmissions, making the simultaneous charging of multiple electrical devices possible [8,9].
Currently, many universities and research institutions are conducting theoretical and technical research on MCR-WPT technology. In 2007, Marin Soljacic, a professor in the Physics Department at MIT, proposed a novel wireless charging technology and conducted related experiments, achieving an overall transmission efficiency of about 40% [10]. In 2011, a research team at Stanford University found that the receiver could capture nearly 97% of the transmitted energy from the transmitter when the distance between the two coils was 1.98 m [11]. In 2014, the Korea Advanced Institute of Science and Technology designed and developed a wireless charging system with a relay coil, with a resonant frequency of 100 kHz, achieving a transmission efficiency of 95.57% when the distance between the two coils was 200 mm and an output power of up to 6.6 kW [12]. In the same year, Zhejiang University in China optimized the power loss of the Inductive Coupling Power Transfer (ICPT) system and the system’s transmission efficiency. When the output power reached 500 W, the efficiency was expected to exceed 0.94 [13]. In 2018, researchers at Newcastle University in the UK developed a four-coil wireless charging system, achieving a transmission efficiency of 97.08% when the transmission distance between the transmitting and receiving coils was 200 mm, with a significant decrease in the output power to 3.7 kW [14].
This article aims to study the characteristics of underwater MCR-WPT systems. Traditional circuit models are based on the mutual inductance theory. After analyzing the characteristics of underwater coils, the model is modified to accommodate underwater conditions. The transmission characteristics of the system are then analyzed, considering various influencing factors. Additionally, the multi-objective optimization of the coupling mechanism within the system is conducted.

2. Modeling of Magnetically Coupled Resonant Wireless Power Transfer System

2.1. Equivalent Circuit Model of MCR-WPT System

The equivalent circuit model of a Magnetically Coupled Resonant Wireless Power Transfer (MCR-WPT) system typically consists of two coils, which are coupled by the high-frequency electromagnetic field generated at the transmitting end. As the resonant frequencies of the circuits at both ends are designed to be identical, the receiving coil gradually reaches a resonant state upon coupling with the high-frequency electromagnetic field. In this resonant state, the reactance and capacitance present in the circuit are significantly attenuated, and the impedance becomes almost purely resistive. Consequently, the energy loss in the inductance and capacitance can be almost neglected [15].
When establishing the mathematical model, the circuit before the transmitting coil is often equated to a high-frequency AC power source. In the medium space, the transmitting coil excites a high-frequency alternating magnetic field under the action of the current, thereby coupling with the receiving coil to receive energy. Due to the similarity in the impact of resistive, capacitive, or inductive loads on the system, this paper focuses on an in-depth study of resistive loads only. In the actual operation of the system, resonant compensation circuits are typically added to both ends of the coils. The equivalent circuit model of MCR-WPT is shown in Figure 1 below [16,17].
In this model, the subscript S represents the transmitting end, and the subscript D represents the receiving end. Let ω be the angular frequency of the system. The equivalent impedances at the transmitting and receiving ends can be expressed as follows: Z S = R S + j ω L S + 1 j ω C S , Z D = R D + R L + j ω L D + 1 j ω C D .
According to Kirchhoff’s Voltage Law, the currents can be determined as
i S = Z D U S Z S Z D + ( ω M ) 2 i D = j ω M U S Z S Z D + ( ω M ) 2
The input power P S and the output power P O are given by
P O P S = Z D U S 2 Z S Z D + ( ω M ) 2
= ( ω M ) 2 U S 2 R L Z S Z D + ( ω M ) 2 2
The transmission efficiency of the entire system is given by
η = P O P S = ( ω M ) 2 R L Z D Z S Z D + ( ω M ) 2 × 100 %
The parameters of the two coils are generally consistent, and the mutual inductance and internal resistance values should be equal, that is L S = L D = L and R S = R D = R . When the system operates in a resonant state, the circuit exhibits a resistive state, that is Z S = R S and Z D = R D + R L . At this time, the circuit impedance is minimized, so the transmission efficiency is as follows:
η = ( ω M ) 2 R L R D + R L R S ( R D + R L ) + ( ω M ) 2 × 100 %

2.2. Variations in Self-Inductance and Mutual Inductance of Underwater Coils

In underwater environments, the coupling characteristics of the system undergo changes, necessitating an analysis of the applicability of the typical self-inductance and mutual inductance models used in air.

2.2.1. Variations in Self-Inductance of Underwater Coils

The system uses planar spiral coils as the coupling structure of the system; the self-inductance can be derived from the following empirical formula. However, this formula is only applicable for frequencies below 30 MHz and for coils where W > 2 r [18].
L [ u H ] = N 2 25.4 R 2 ( 8 R + 11 W )
where N is the number of turns of the coil, R is the average radius of the coil, and W is the value of the coil’s maximum outer diameter minus its minimum inner diameter.
The reactance per turn of the coil is given by [19]
X s e a = ω μ a N 2 K ( k ) 2 π 3 ( β a ) 3 + 4 15 ( β a ) 4
where a is the radius of the coil and K k is the complete elliptic integral of the first kind.
K k = 0 π 2 d ϕ 1 k 2 s i n 2 ϕ 1 / 2
The reactance of a single-turn coil in air can be expressed as
X a i r = ω μ a N 2 [ K ( k ) 2 ]
The relationship between the impedance of a single-turn coil in air and the impedance of a single-turn coil underwater can be derived as follows:
X s e a = X a i r ω μ a N 2 π 3 ( β a ) 3 4 15 ( β a ) 4
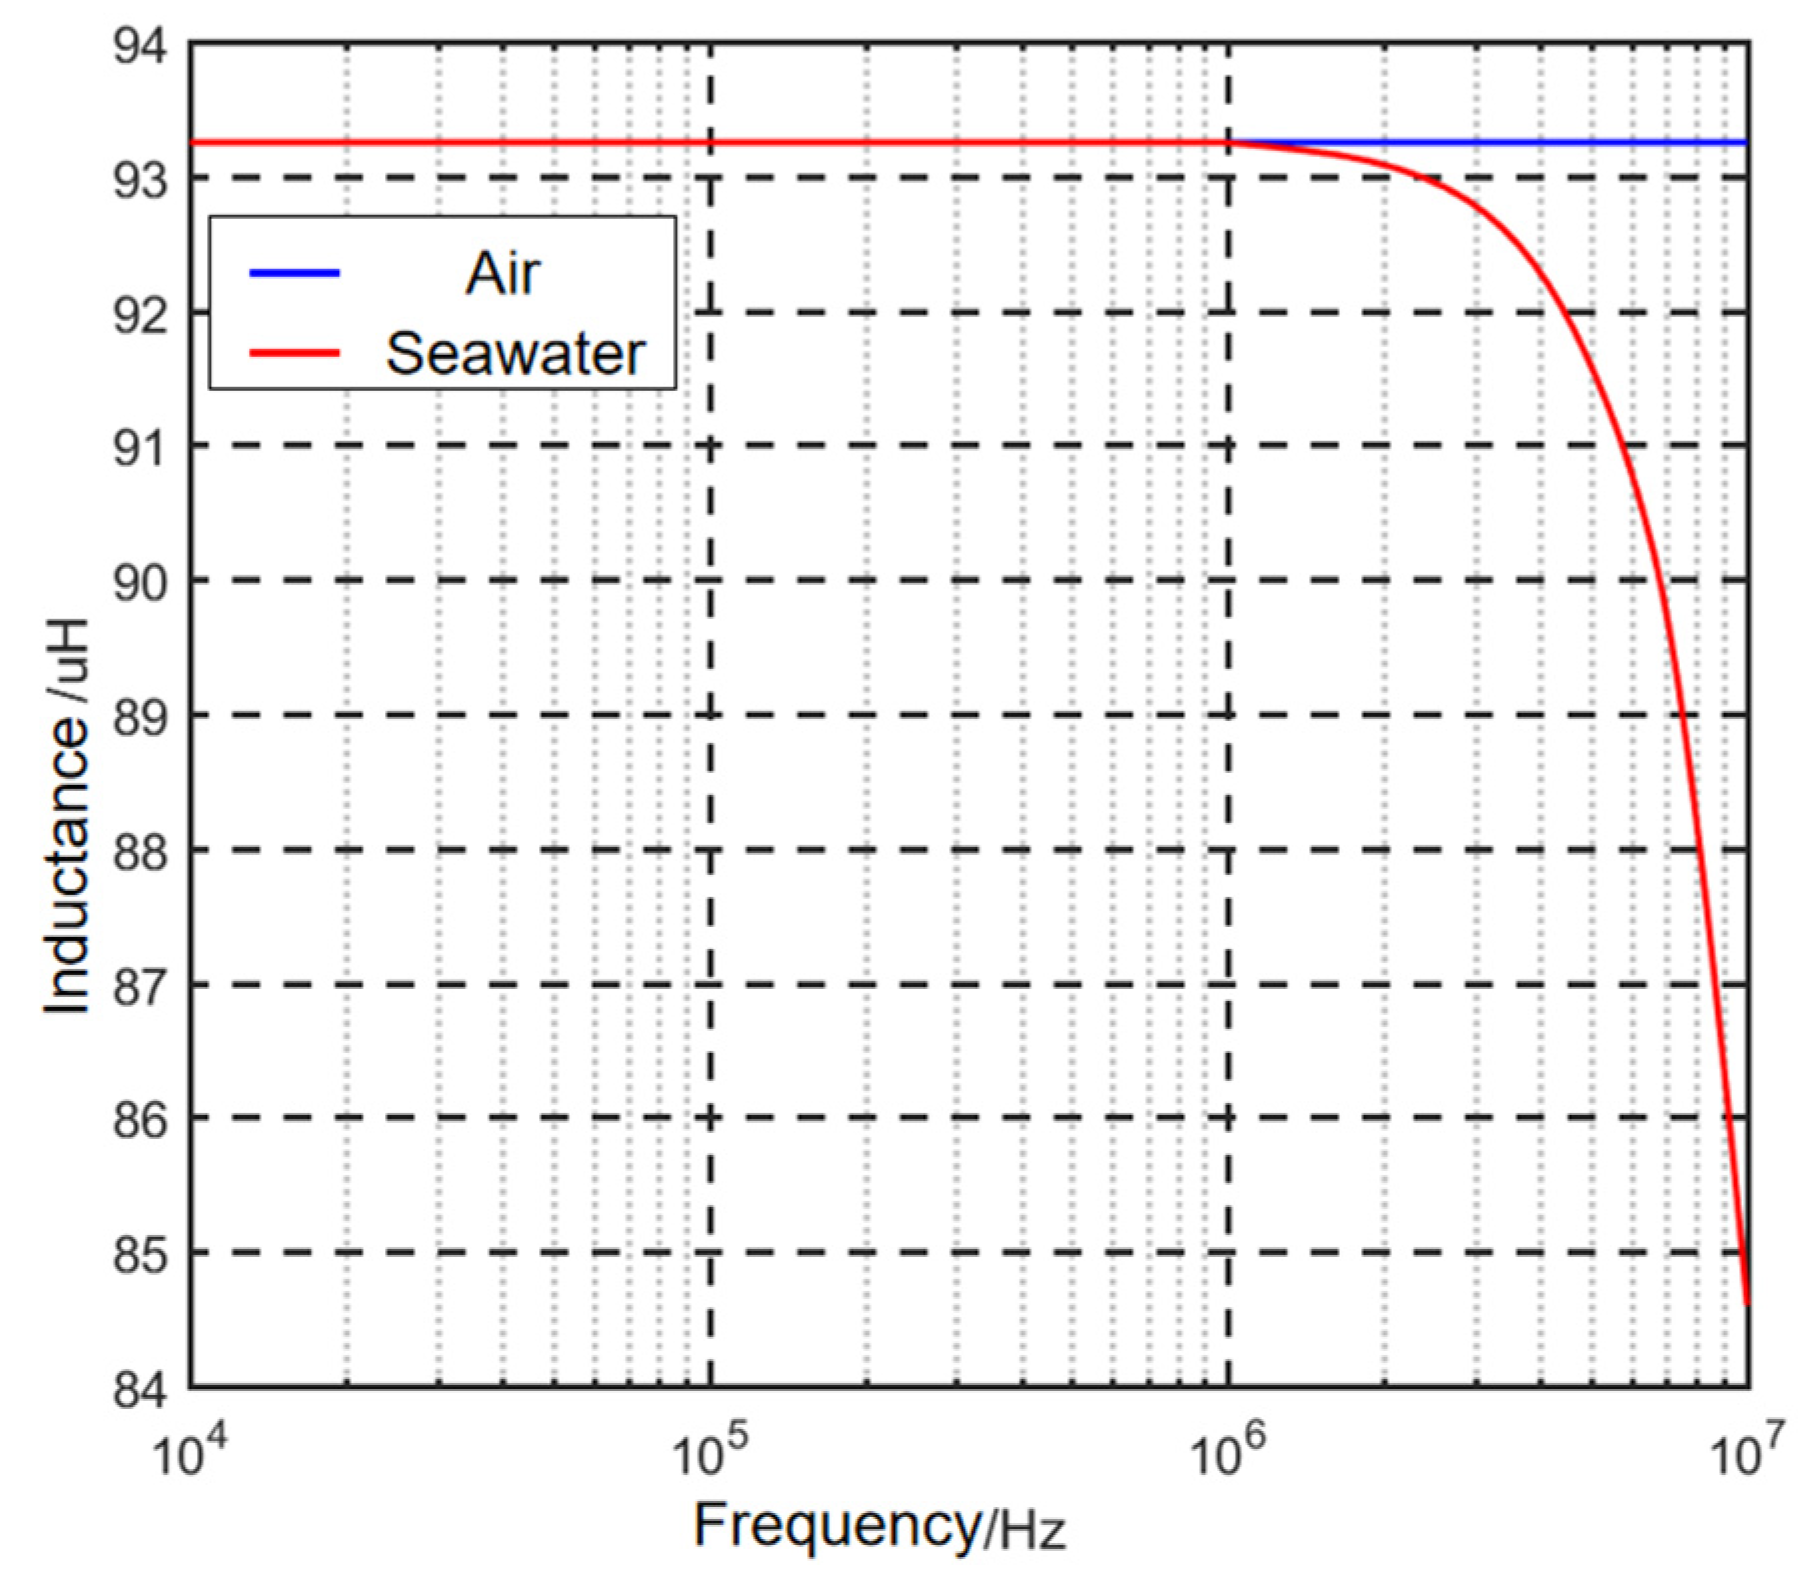
In the equation, β = ω μ σ , where σ is the conductivity of the conductive medium. The term on the right side of the equation, excluding X a i r , represents the change in reactance due to the conductive medium of seawater. Using MATLAB2020a software, we can plot the variation of inductance in air and seawater over the frequency range from 10 kHz to 10 MHz, as shown in Figure 2. The variation of self-inductance in seawater and air demonstrates that, as the frequency increases, the inductance in air remains constant, while the inductance in seawater decreases. However, within the frequency range between 10 kHz and 1 MHz, this difference is negligible.

2.2.2. Variations in Mutual Inductance of Underwater Coils

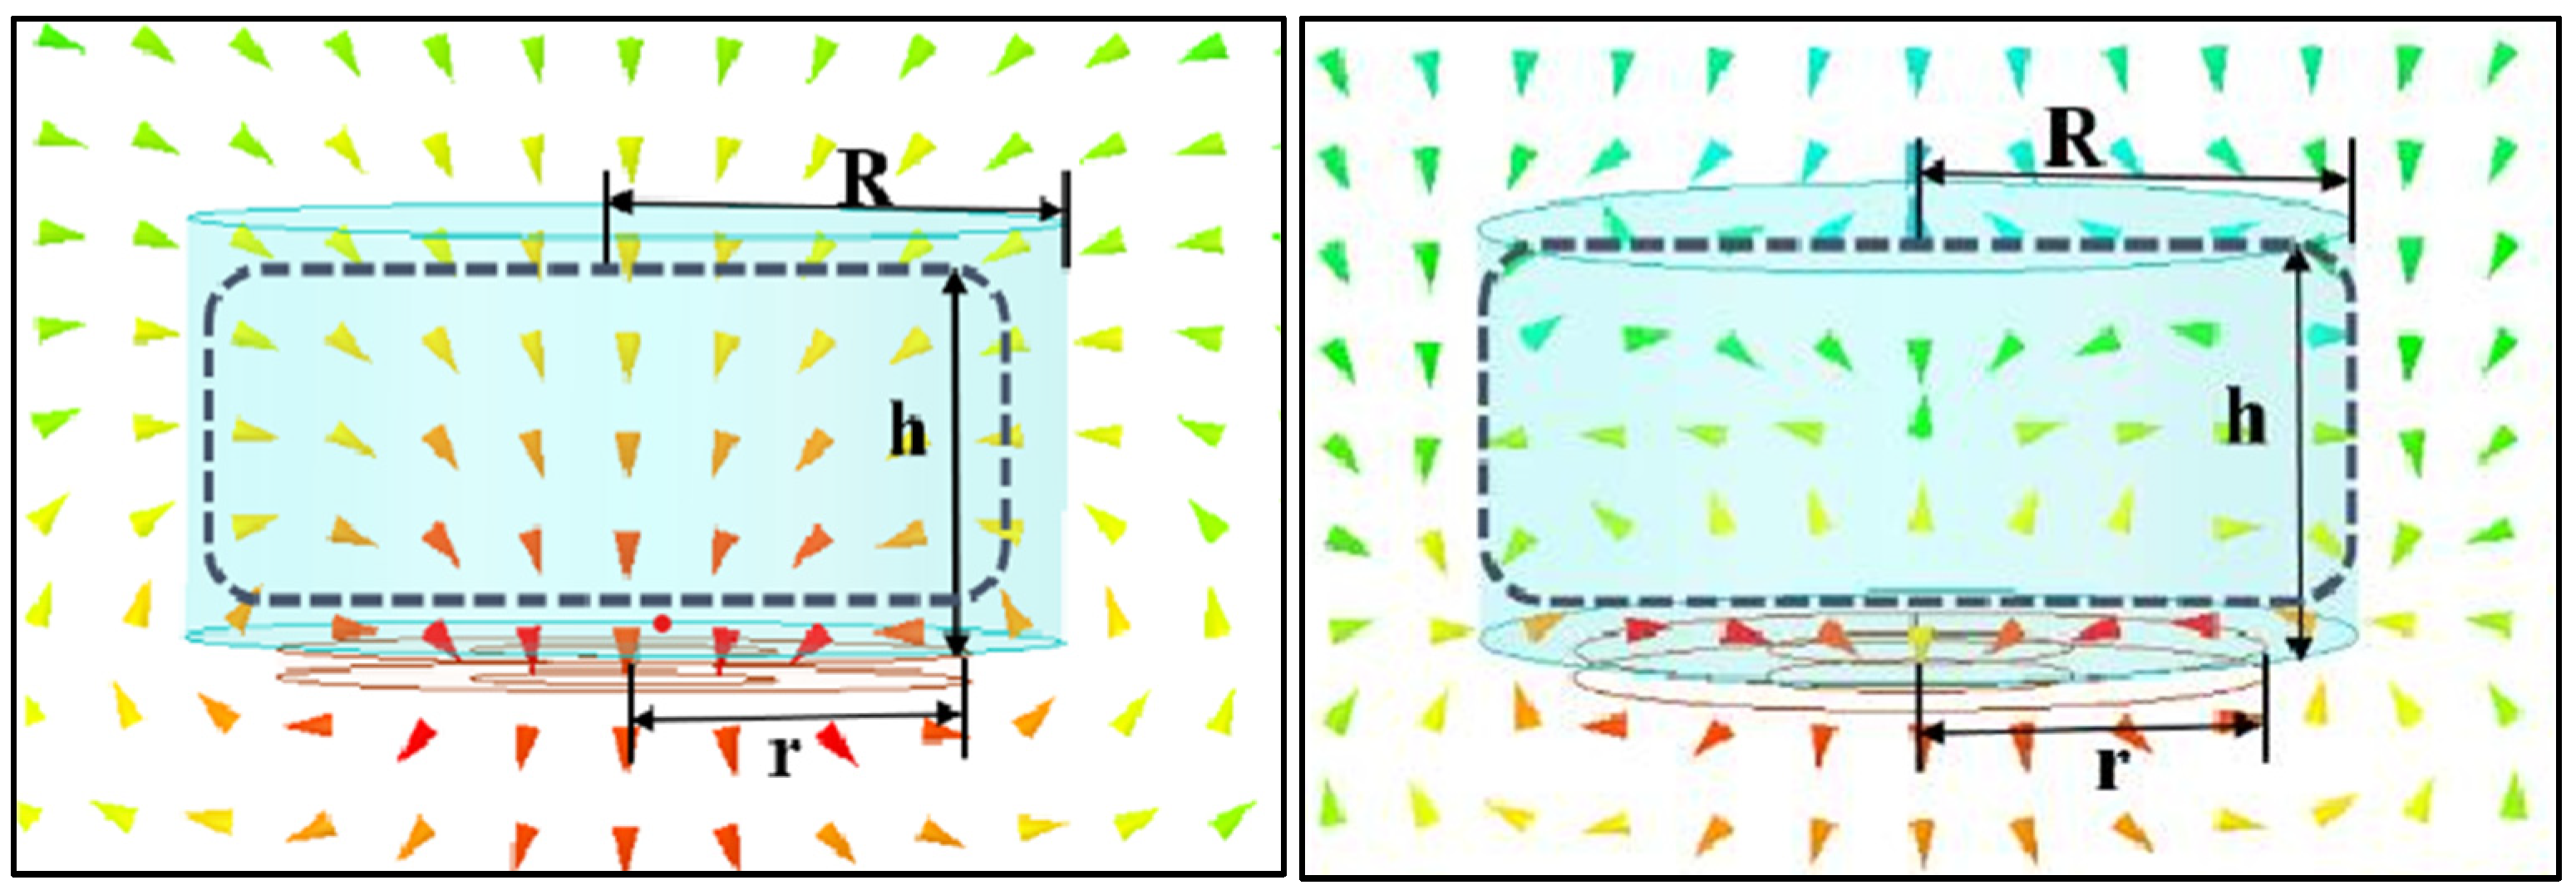
When the transmission medium is conductive, eddy currents are generated in the medium due to the presence of a time-varying magnetic field at high frequencies. These eddy currents weaken the induced electromagnetic field, thereby reducing the degree of coupling between the two coils. Similarly, the conductive medium also interferes with the transmitting coil, affecting the phase of the magnetic field at the receiving coil. A finite element analysis is performed on the system, consisting of the transmitting coil and the receiving coil. Assume the medium has a height h and a radius R, is coaxial, and is symmetrically placed between the two coils. The radii of the two coils are r. The material of the conductive medium is set as air and seawater. The magnetic field distributions are plotted in Figure 3. By observing the variation of the magnetic field vectors in the dashed black box, it can be seen that when there is no conductive medium, when the conductivity is zero, the magnetic field is linearly polarized. When the conductivity is non-zero, eddy current fields are generated in seawater, and the magnetic field becomes elliptically polarized after superposition. This means that the normal magnetic field is weakened and that the coupling performance between the two coils is reduced.
Observing the variation of the magnetic field vectors in the dashed black box, it is evident that, in the absence of a conductive medium, i.e., when the conductivity is 0, the magnetic field is linearly polarized. However, when the conductivity is not 0, eddy current fields are generated in seawater, causing the magnetic field to become elliptically polarized after superposition. This phenomenon weakens the normal magnetic field, thereby reducing the coupling performance between the two coils.
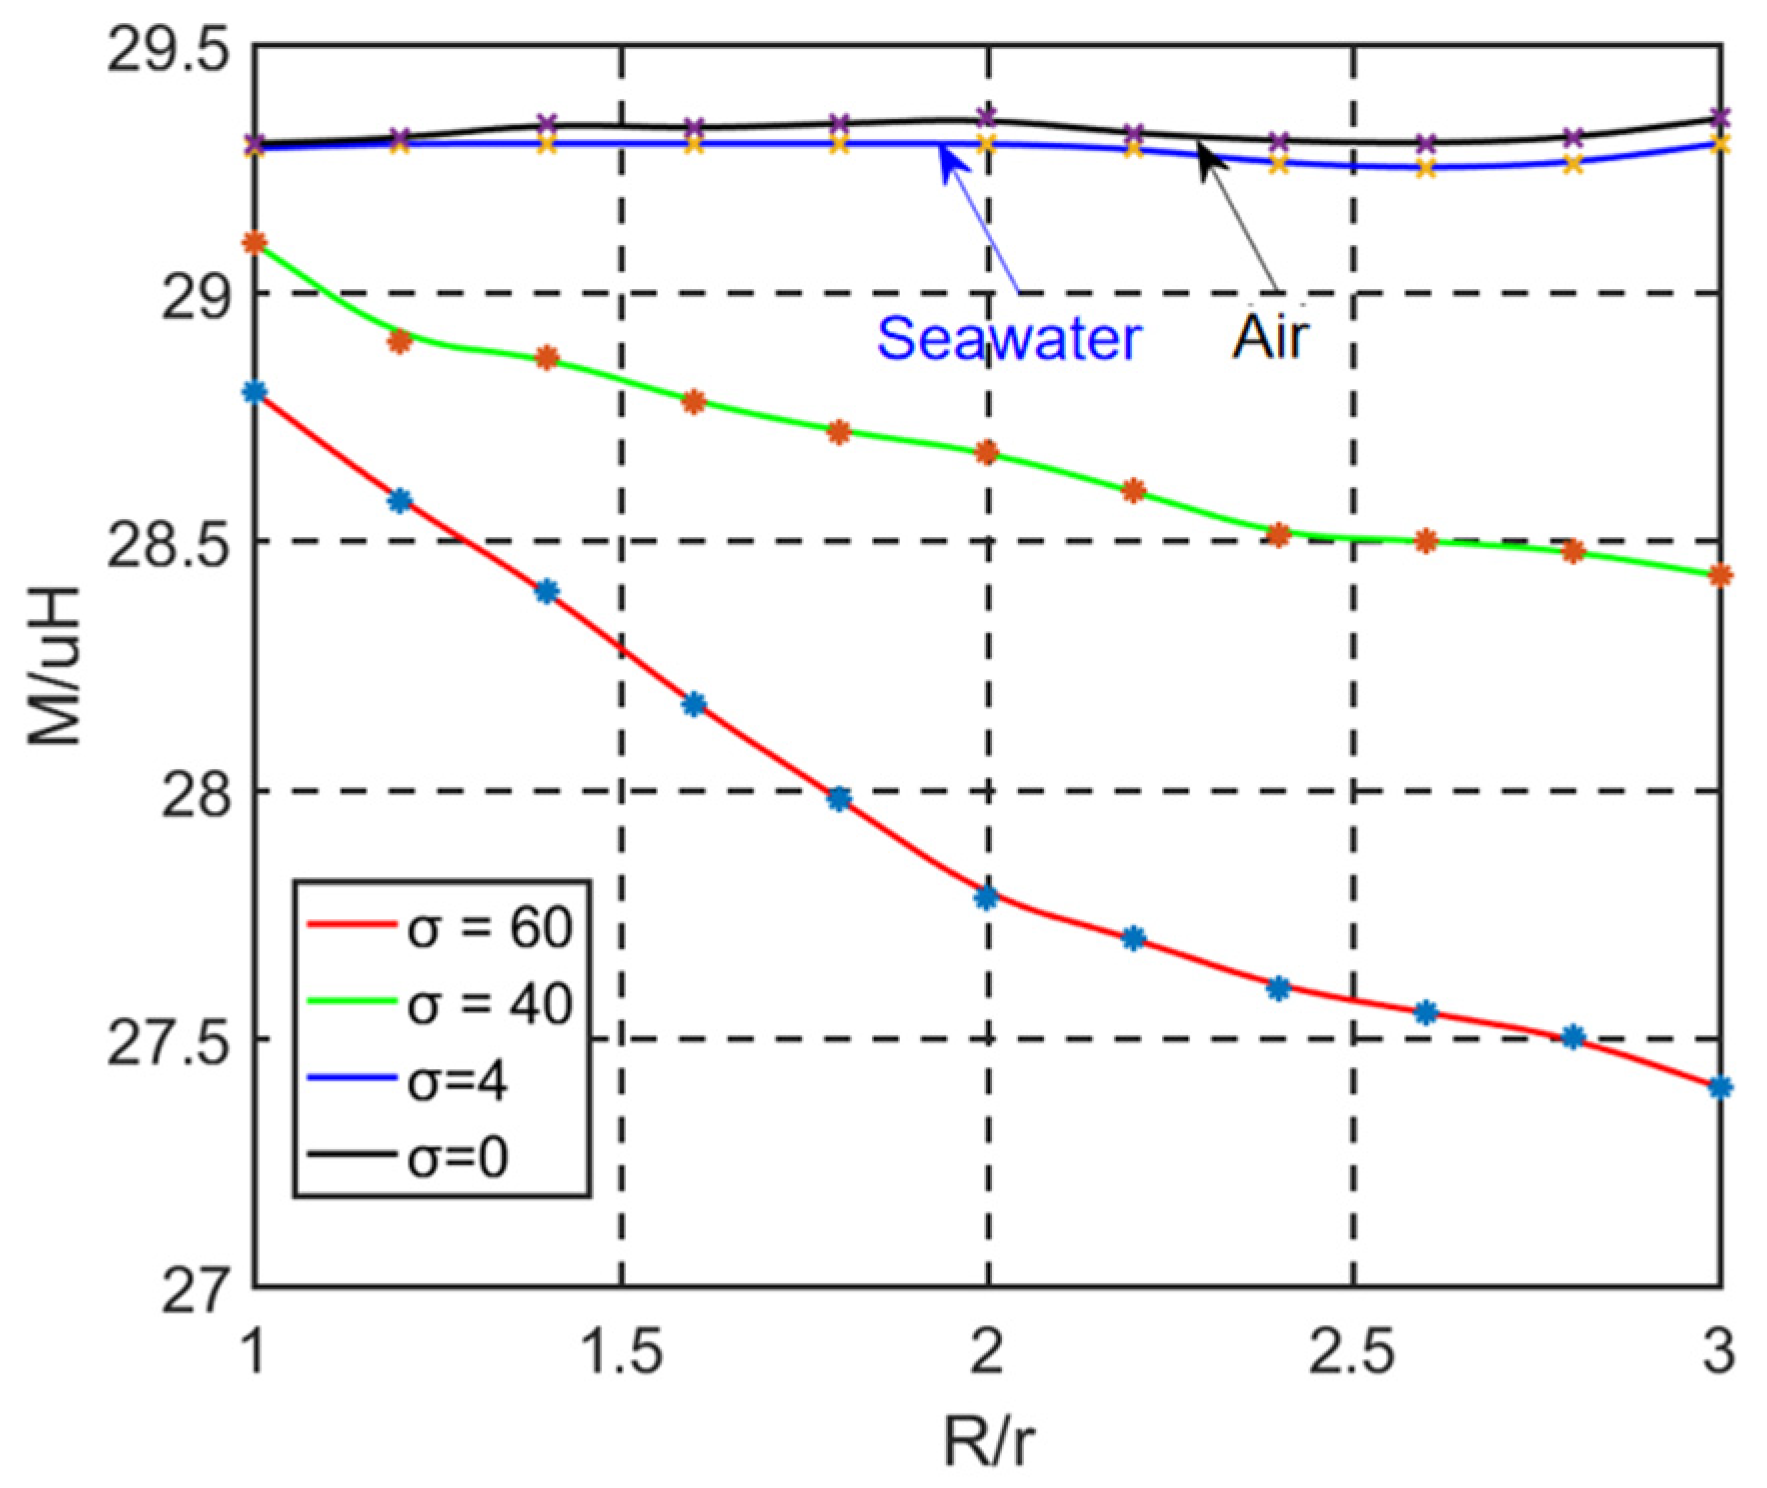
Assuming that the ratio of the transmission medium’s radius to the coil radius is R/r, plot the variation of mutual inductance with R/r for different conductivity values, as shown in Figure 4. The curve for a conductivity of 0 represents air as the transmission medium, while the curves for a conductivity of 4 represent seawater. As the value of R/r increases, the two curves show minimal fluctuations and are nearly identical. The mutual inductance value in seawater does not significantly differ from that in air due to its conductivity. However, when the conductivity of the medium reaches a certain level, such as conductivity values of 40 and 60, the decreasing trend in the two curves becomes apparent.
Based on the above analysis, it can be concluded that, within the frequency range from 10 kHz to 10 MHz, both the self-inductance and mutual inductance values in seawater are very close to those in air.

2.3. Radio Energy Transmission Underwater Correction Model

Seawater contains a large number of charged ions, which will weaken the energy of high-frequency electromagnetic fields [20]. Therefore, when compared to the equivalent circuit model in air, the eddy current loss characteristics of seawater need to be considered.
By analyzing the sine wave propagating along the positive Z-axis and using Maxwell’s equations for the solution, the electric field solution of the sine wave can be obtained, and the expression for the average power density in seawater can be derived as follows:
S ¯ = 1 2 R e e x E x m e a z e j β z e y E x m η c e a z e j ( β + ϕ ) = 1 2 E x m 2 η c e z e 2 a z c o s ϕ ( x )
where r represents the propagation constant of the medium, where a represents the attenuation constant of the medium; β represents the phase constant of the medium; Exm represents the initial electric field intensity of the electromagnetic field propagated in the medium; η c represents the intrinsic impedance of the medium; and ϕ represents the phase angle.
The attenuation coefficient of seawater is a 0 , which indicates that there is energy loss when plane waves propagate through seawater. The conductivity of seawater at a normal temperature is more than a thousand times that of fresh water, with a value of σ = 4   s / m . When the system operates at a frequency of 100 kHz, the attenuation constant of seawater is approximately a 1.26   N p / m , the phase constant is β 1.26   r a d / m , and the intrinsic impedance of seawater is η c 0.44 e j 45 ° Ω .
By substituting these values into the previous formula, we obtain [21]:
S ¯ = 1 2 E x m 2 η c e z e 2 a z c o s ϕ = 0.8 E x m 2 e z e 2.52   W / m 2
Equation (13) shows that, when Δ is the ratio of the remaining power density S d to the initial power density S 0 and when the electromagnetic wave transmission distance is d,
Δ = S d S 0 = 0.8 E x m 2 e 2.52 d 0.8 E x m 2 = e 2.52 d
Following the correction of the transmission characteristics indicators for systems in seawater, it is evident from the analysis that, when the system operates in seawater, the energy exhibits an exponential decay with an increasing transmission distance. This decay becomes pronounced with increasing transmission distances, to the extent that the energy reaching the receiver may become negligible. Consequently, this results in a significantly diminished transmission performance for the system. The input power of the system P i n and the output power P o u t are as follows:
P i n = U S 2 Z D Z S Z D + ω 2 M 2
P o u t = U S 2 ω 2 M 2 R L Z S Z D + ω 2 M 2 2 e 2.52 d
The transmission efficiency of the system is
η = P o u t P i n = ω 2 M 2 R L Z S Z D + ω 2 M 2 Z D e 2.52 d
When the system is in resonance, the reactance and capacitance at both ends cancel each other out, and both ends of the circuit exhibit resistance. The quality factor of the transmission end loop is Q D = ω L D / Z D = ω L D / ( R D + R L ) , and the quality factor of the receiving end loop is k = M / L S L D . Substituting the quality factor and the coupling coefficient, we obtain the following:
P o u t = U S 2 k 2 Q S Q D R L ( k 2 Q S Q D + 1 ) 2 e 2.52 d
η = k 2 Q S Q D R L k 2 Q S Q D + 1 Z D e 2.52 d
When the effective transmission distance between the two coils changes, the coupling coefficient between them also changes. The relationship between the transmission distance and the parameters of the two coils is given by [22]
d = μ 0 π N S N D r S 2 r D 2 2 k L S L D 1 / 3
When the distance is less than or equal to μ 0 π N S N D r S 2 r D 2 2 k L S L D 1 3 and k = 1, the values of the system’s output power and transmission efficiency are given by Equations (17) and (18), respectively. When the distance is greater than μ 0 π N S N D r S 2 r D 2 2 k L S L D 1 3 and 0 ≤ k ≤ 1, the output power and transmission efficiency are given by the following two equations:
P O = U S 2 μ 0 π N S N D r S 2 r D 2 2 d 3 L S L D 2 Q S Q D R L μ 0 π N S N D r S 2 r D 2 2 d 3 L S L D 2 Q S Q D + 1 2 e 2.52 d
η = μ 0 π N S N D r S 2 r D 2 2 d 3 L S L D 2 Q S Q D R L μ 0 π N S N D r S 2 r D 2 2 d 3 L S L D 2 Q S Q D + 1 Z D e 2.52 d

3. Orthogonal Experimental Design

Orthogonal designs can be implemented within the SPSS statistical software 29.0.10, facilitating a streamlined analysis process and aiding in the selection of a comprehensive set of level combinations for experimentation.
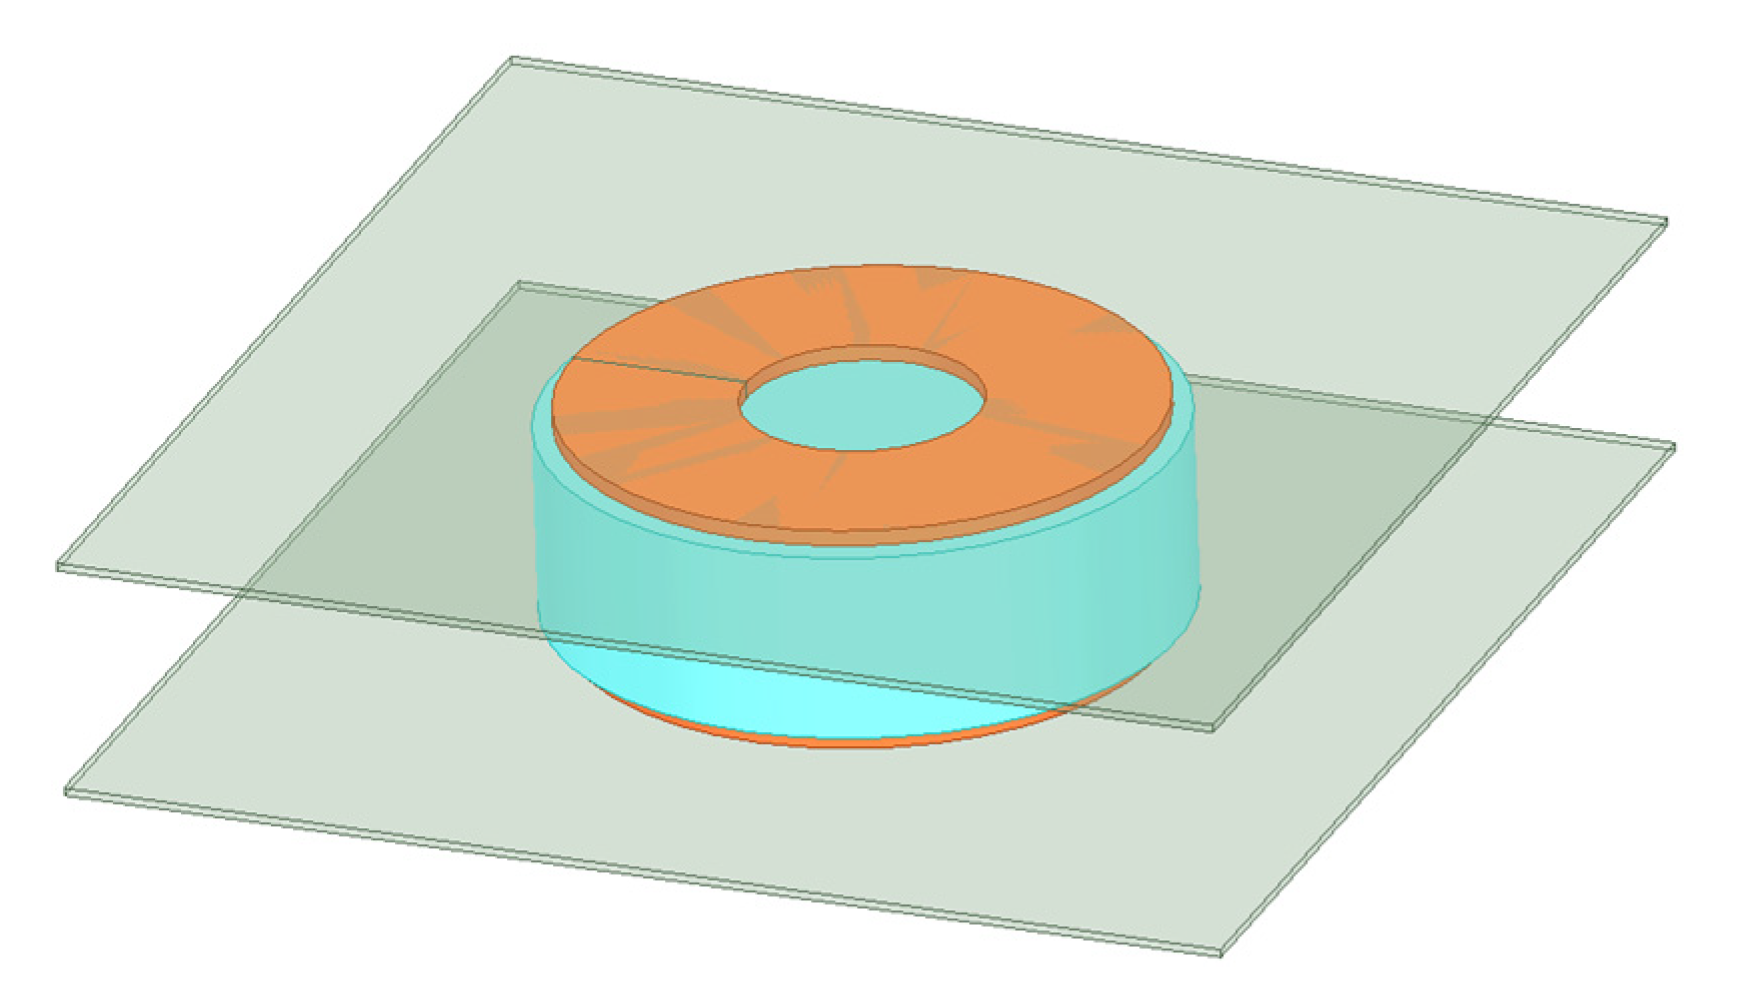
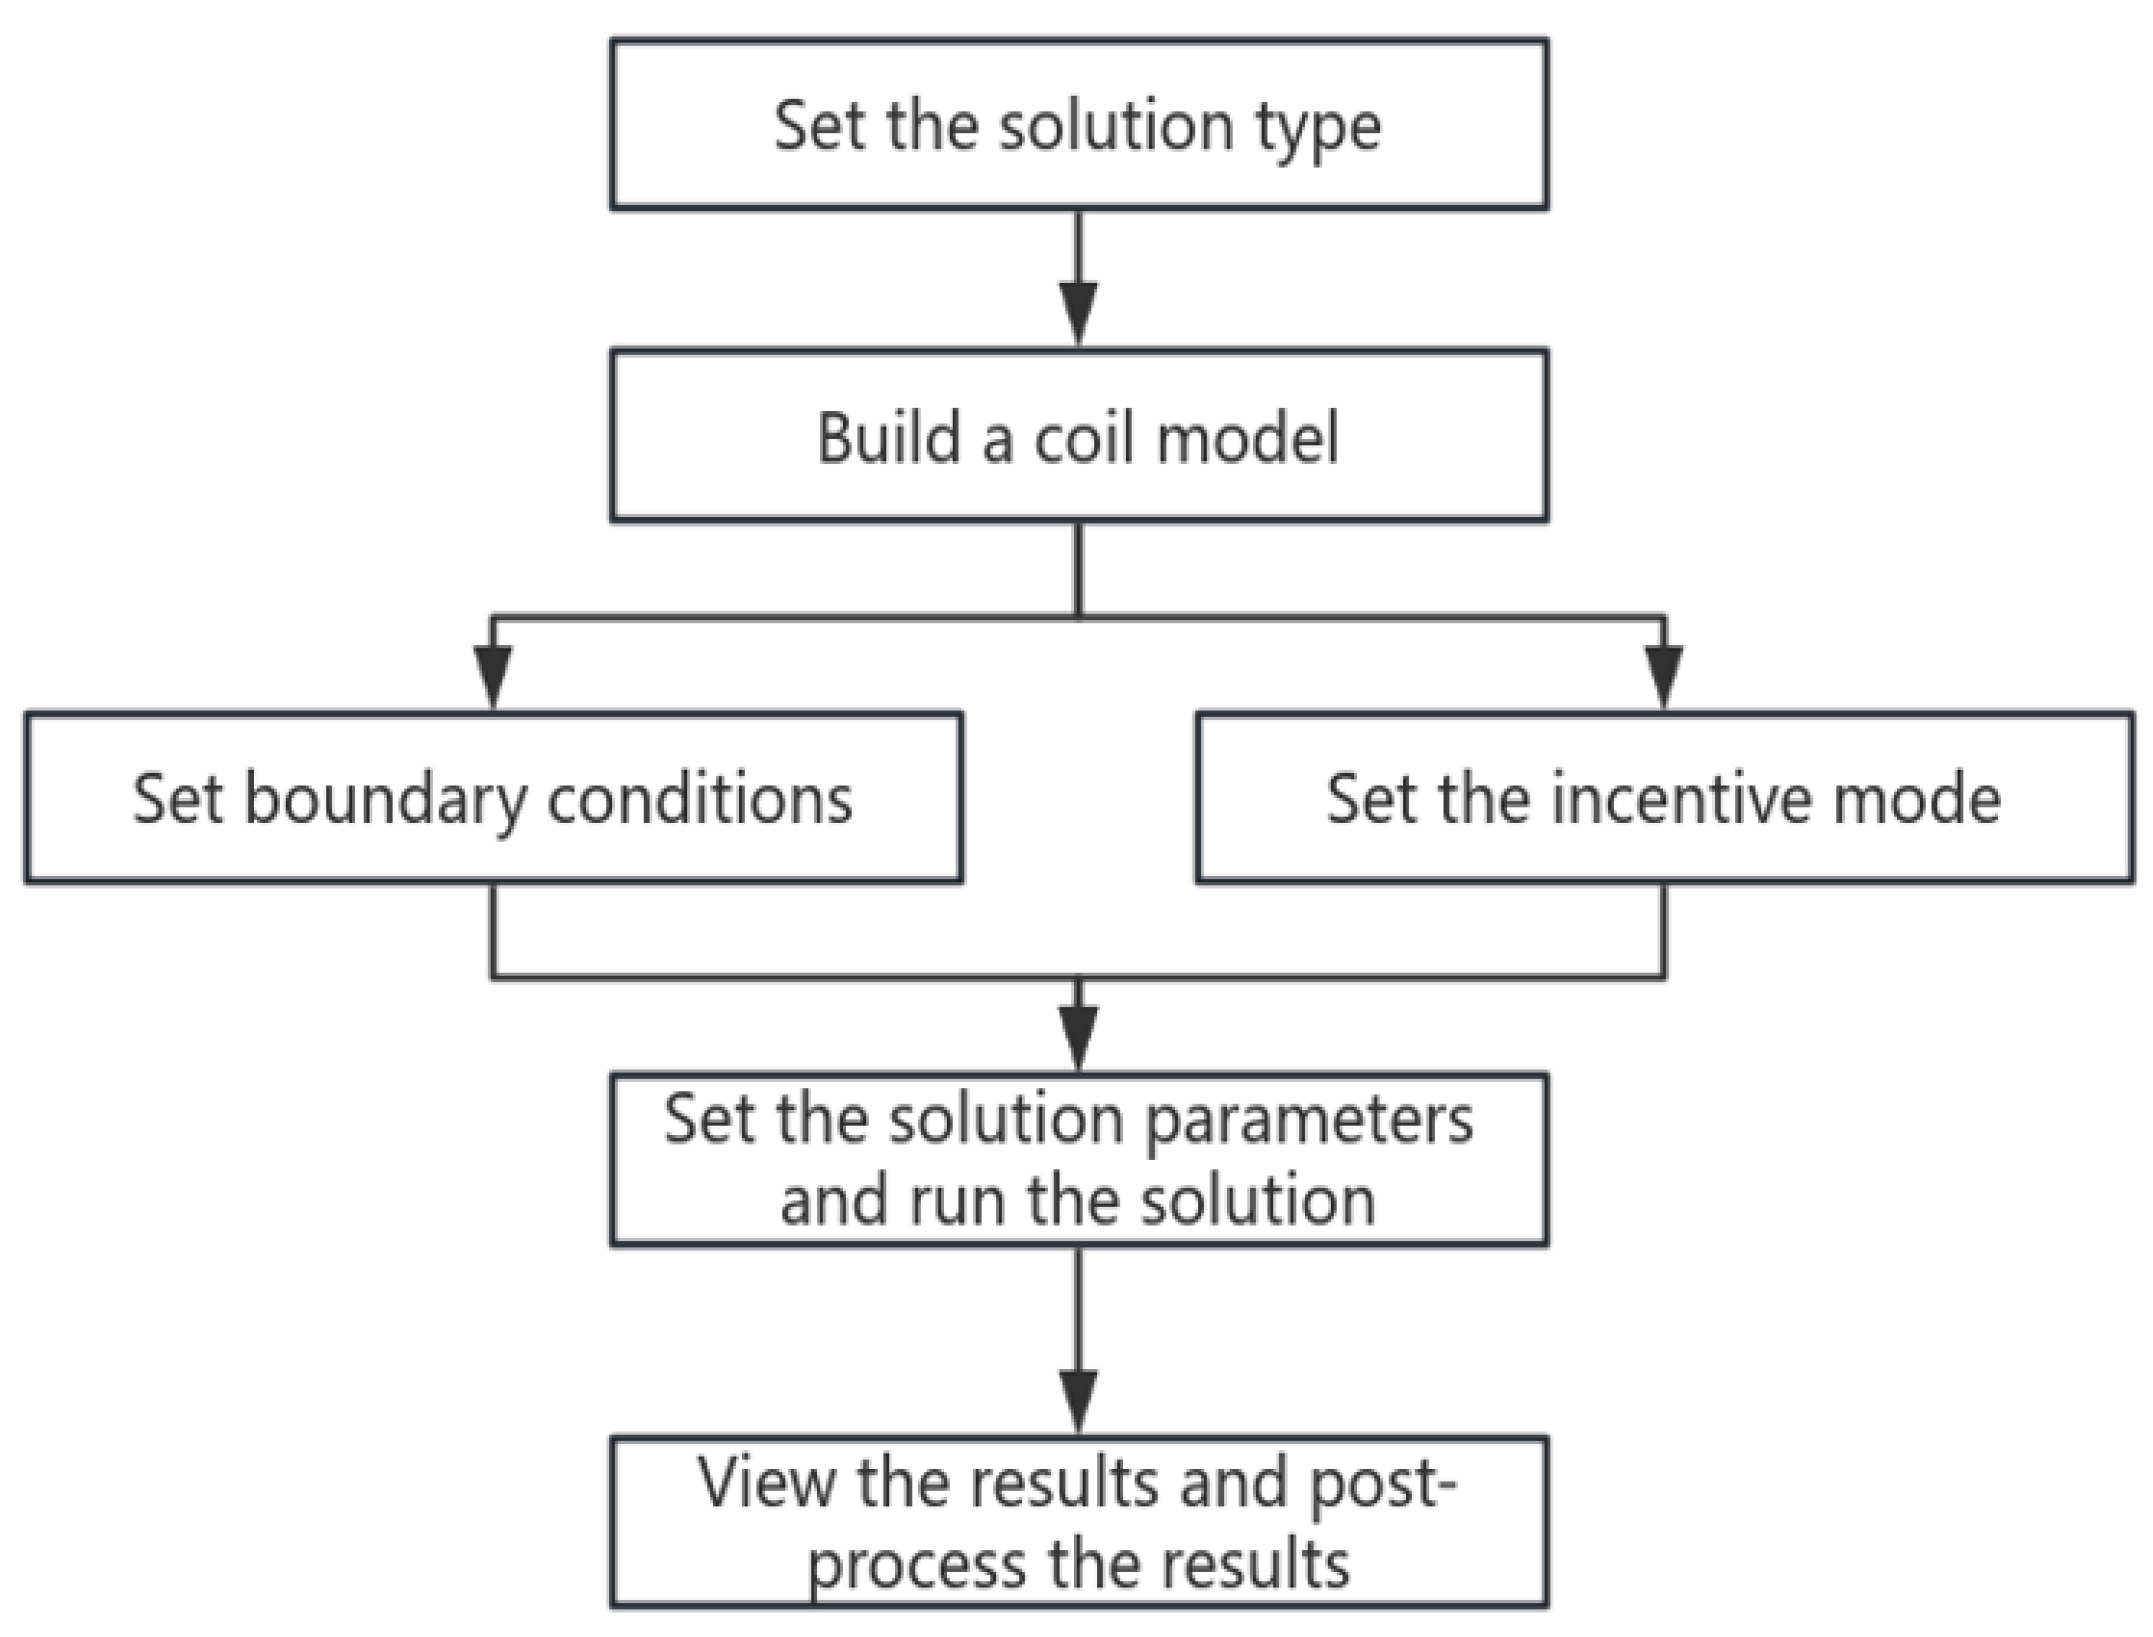
Maxwell2019R3 software enables the calculation of self-inductance and mutual inductance of coils across various parameters, as depicted in Table 1. To augment the coupling efficiency of the mechanism, ferrite plates are commonly employed at both the transmitter and receiver ends, as illustrated in Figure 5. The detailed procedure is elucidated in Figure 6.

3.1. Self-Inductance Orthogonal Test

The main factors affecting self-inductance include the coil outer diameter (A), number of turns (B), spacing between turns (C), and wire radius (D). Among these factors, the most significant are the coil outer diameter and the number of turns. An orthogonal experiment will be conducted on these four factors. The outer diameter will be set to 60, 70, 80, 90, 100, and 110 mm; the number of turns to 7, 8, 9, 10, 11, and 12; the turn spacing to 4, 4.5, 5, and 5.5 mm; and the wire radius to 0.5, 1, 1.5, and 2 mm. The two most important parameters, the outer diameter and number of turns, will be tested at six levels, while the other factors will be tested at four levels.
Based on the above parameter values, a 49-test experimental design table can be established with the first two columns at six levels and the last two columns at four levels. After sorting each factor in ascending order, the results are shown in Table 2.

3.2. Mutual Inductance Orthogonal Experiment

In the MCR-WPT system mutual inductance orthogonal experiment table, the parameters of the two coils are set to be consistent. In addition to the factors affecting self-inductance, which include the coil outer diameter (A), number of turns (B), spacing between turns (C), and wire radius (D), there is also the axial distance between the two coils (E). The most significant factor is the distance between the coils. An orthogonal experiment will be conducted on these five factors. The levels and values of factors A, B, C, and D are consistent with the self-inductance orthogonal experiment. The axial distance will be set to 30, 50, 70, and 90 mm.
Based on the above table, a 49-test experimental design table can be established with the first two columns at six levels and the last three columns at four levels. After sorting each factor affecting mutual inductance in ascending order, the results are shown in Table 3.

4. Regression Prediction Based on RBF Neural Network

The radial basis function (RBF) neural network is a commonly used feedforward neural network. Unlike earlier network structures that have only two layers (input and output), the RBF network includes a hidden layer between these two layers, making it a three-layer network. The transfer function in the hidden layer is not a global response function, but a local response function, typically a Gaussian function. When compared to other feedforward networks, the RBF network can approximate with any desired precision and the approximation result is optimal [23,24].

4.1. Integrated Simulation Platform

Using MATLAB for RBF neural network algorithms and NSGA algorithms requires a large amount of comprehensive data. SPSS23 software (version 23) is used for the orthogonal experimental design of coil parameters, while Maxwell is used for calculating mutual and self-inductance under the relevant coil parameter conditions. This paper employs Maxwell and MATLAB for integrated simulation, as shown in Figure 7. SPSS is utilized for the orthogonal experimental design of multiple sets of coil parameters, and Maxwell simulation software (version 2019R3) is used to calculate the mutual and self-inductance in the context of coil coupling. The exported CSV files are then imported into MATLAB for the regression prediction of mutual and self-inductance using neural networks. The resulting regression prediction data are subsequently input into the NSGA-II genetic algorithm for the multi-objective optimization of system transmission efficiency and power density.

4.2. Neural Network Model

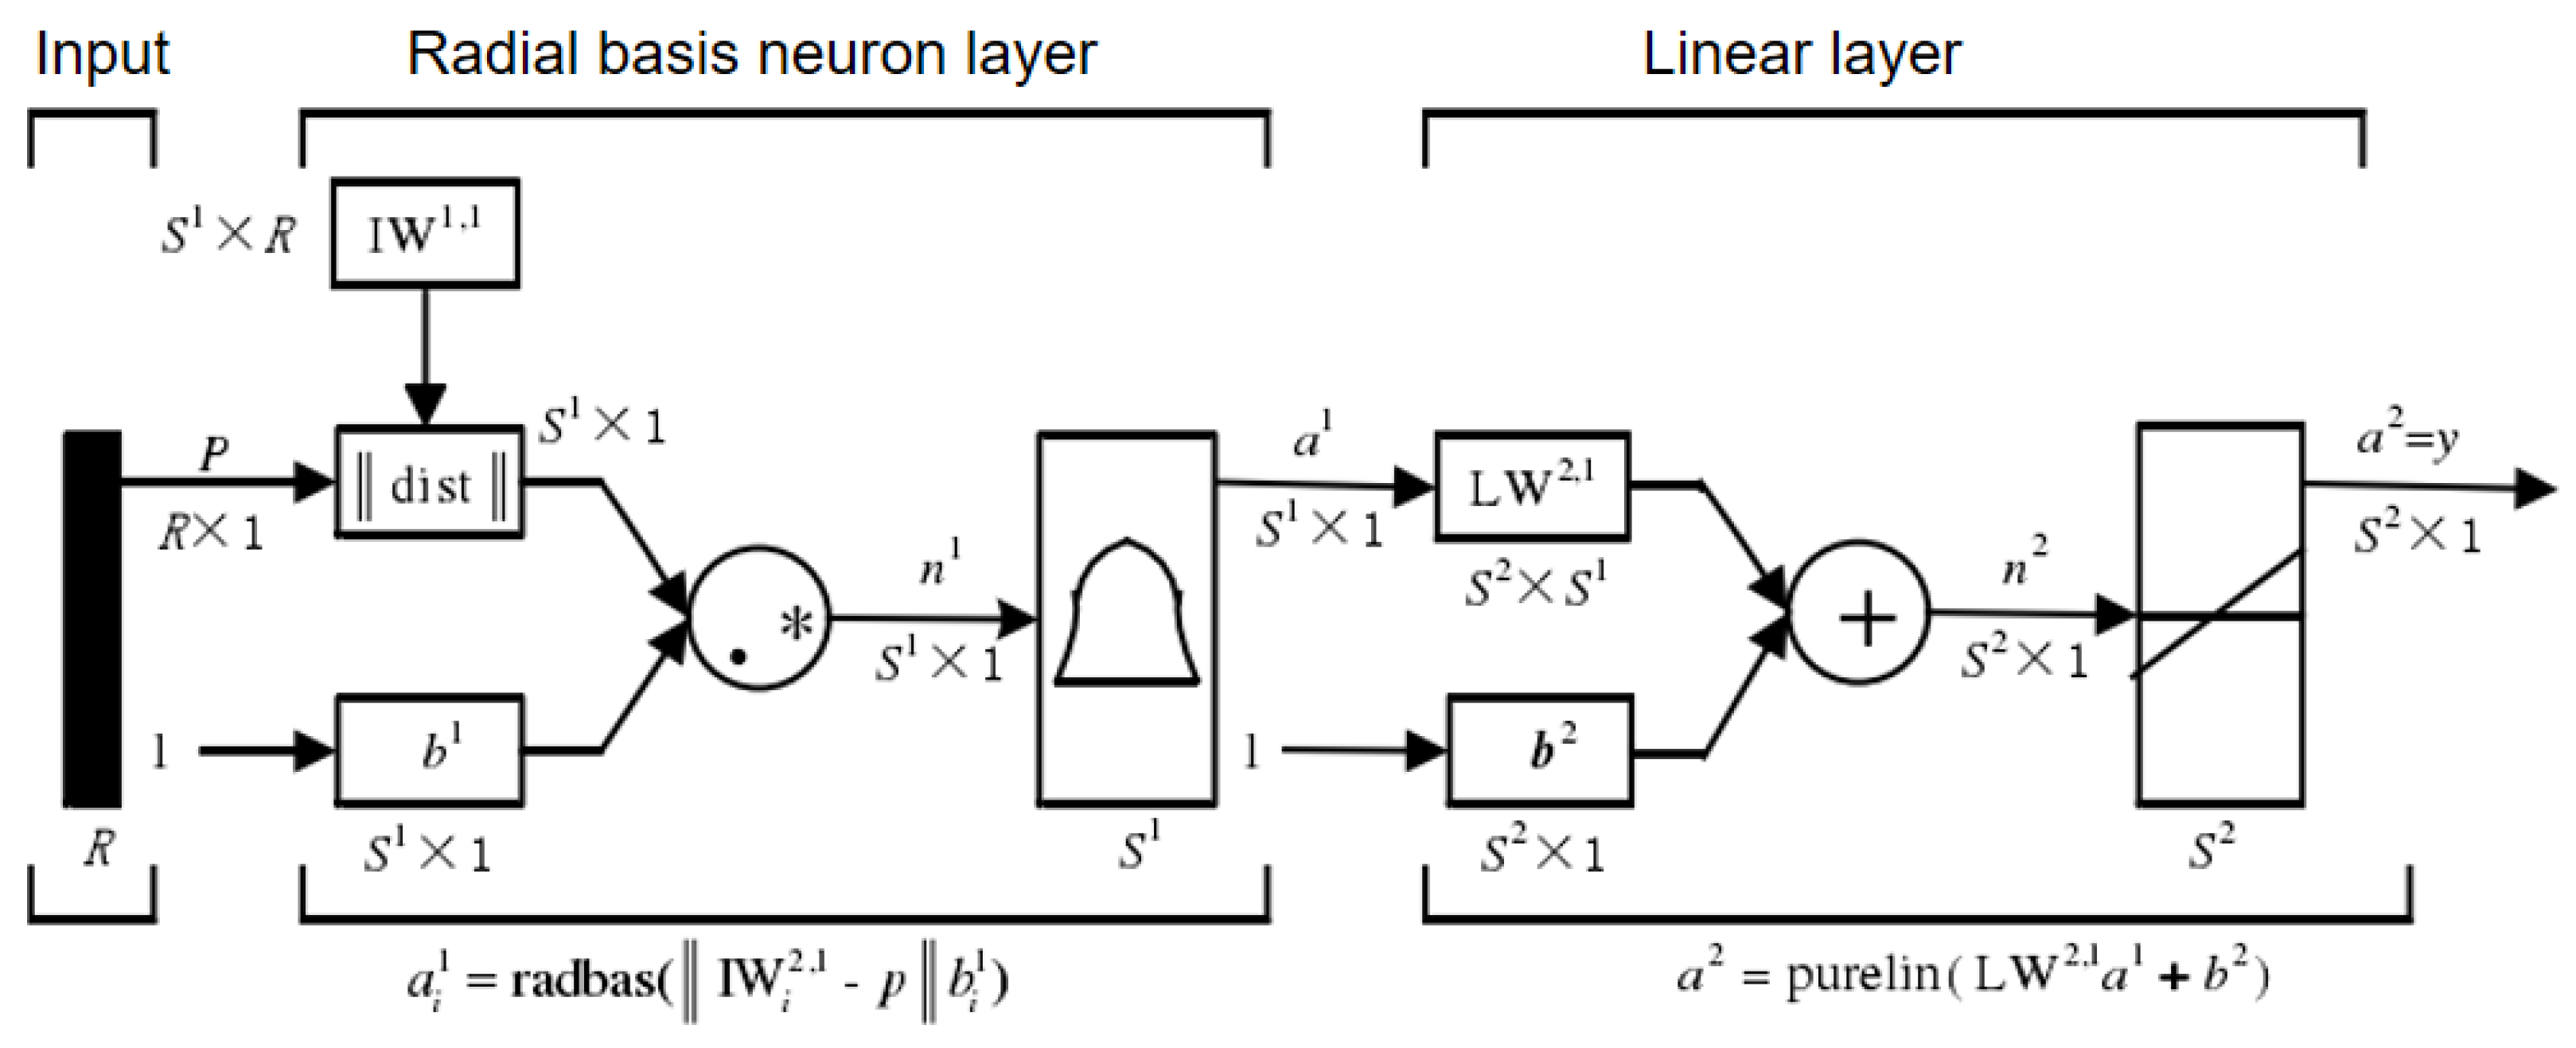
The structure of the radial basis function (RBF) network is shown in Figure 8. The RBF network has two layers as follows: the hidden layer, or radial basis layer, and the output layer, also known as the linear output layer due to its linear outputs.
The network’s output is as follows:
a 2 = p u r e l i n L W 2 a 1 + b 2
a 1 = r a d b a s n 1
n 1 = I W P b 1 = diag I W ones S 1 , 1 P I W ones S 1 , 1 P 0.5 b 1
In Equation (23), a 1 represents the output of the radbas neuron function, where r a d b a s n = e n 2 . In Equation (24), I W denotes the input weight matrix of the network layer, P is the input vector, and b 1 is the bias vector. In Equation (22), L W 2 represents the input weight matrix of the linear layer and b is the bias vector. In the entire RBF neural network system, the input is P and the output is a 2 .
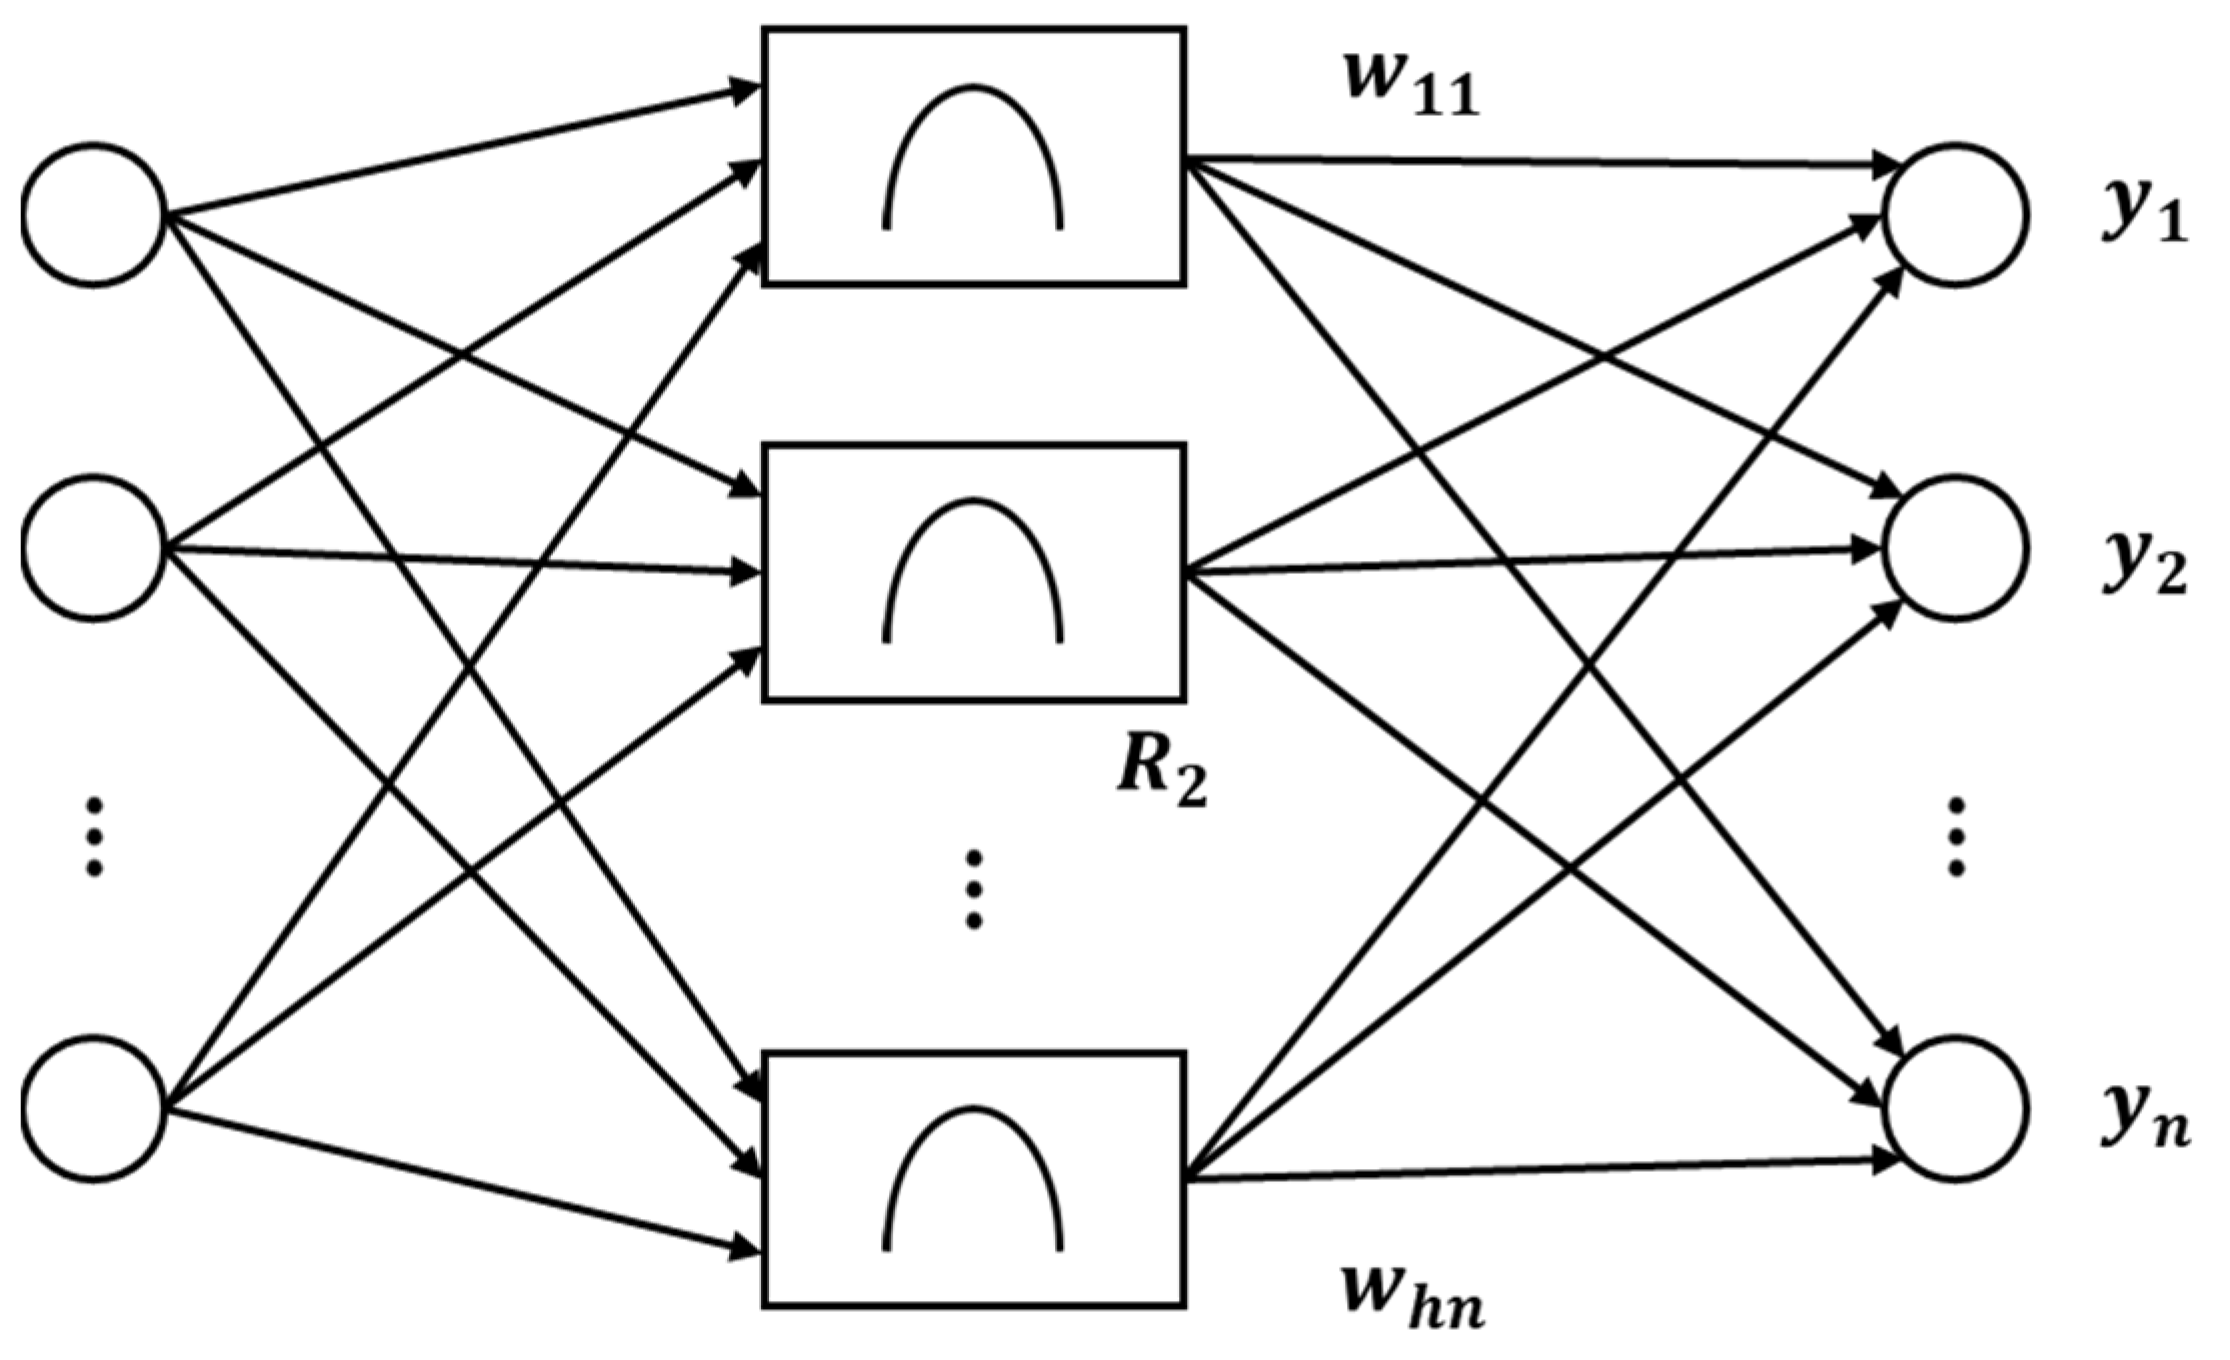
The general structure of an RBF neural network is shown in Figure 9. It consists of three layers as follows: the input layer, the hidden layer, and the output layer. The input layer is very simple, merely transmitting signals, and can be viewed as having a connection weight of 1 between the input and hidden layers. The hidden and output layers perform more complex tasks, each requiring different learning strategies. The output layer aims to adjust the linear weights using targeted linear optimization strategies. The hidden layer adjusts the parameters for the activation functions, mainly Gaussian functions, using nonlinear optimization strategies. These nonlinear strategies typically result in slower learning speeds when compared to the adjustments made in the input layer.

4.3. Regression Result Prediction

Data from the unsorted orthogonal test table generated by SPSS are imported into the RBF neural network for training, with 80% of the data being used as the training set and 20% as the validation set. For the regression prediction model, the maximum number of neurons matches the number of training samples, and the training method used is gradient descent.

4.3.1. Self-Inductance Regression Prediction

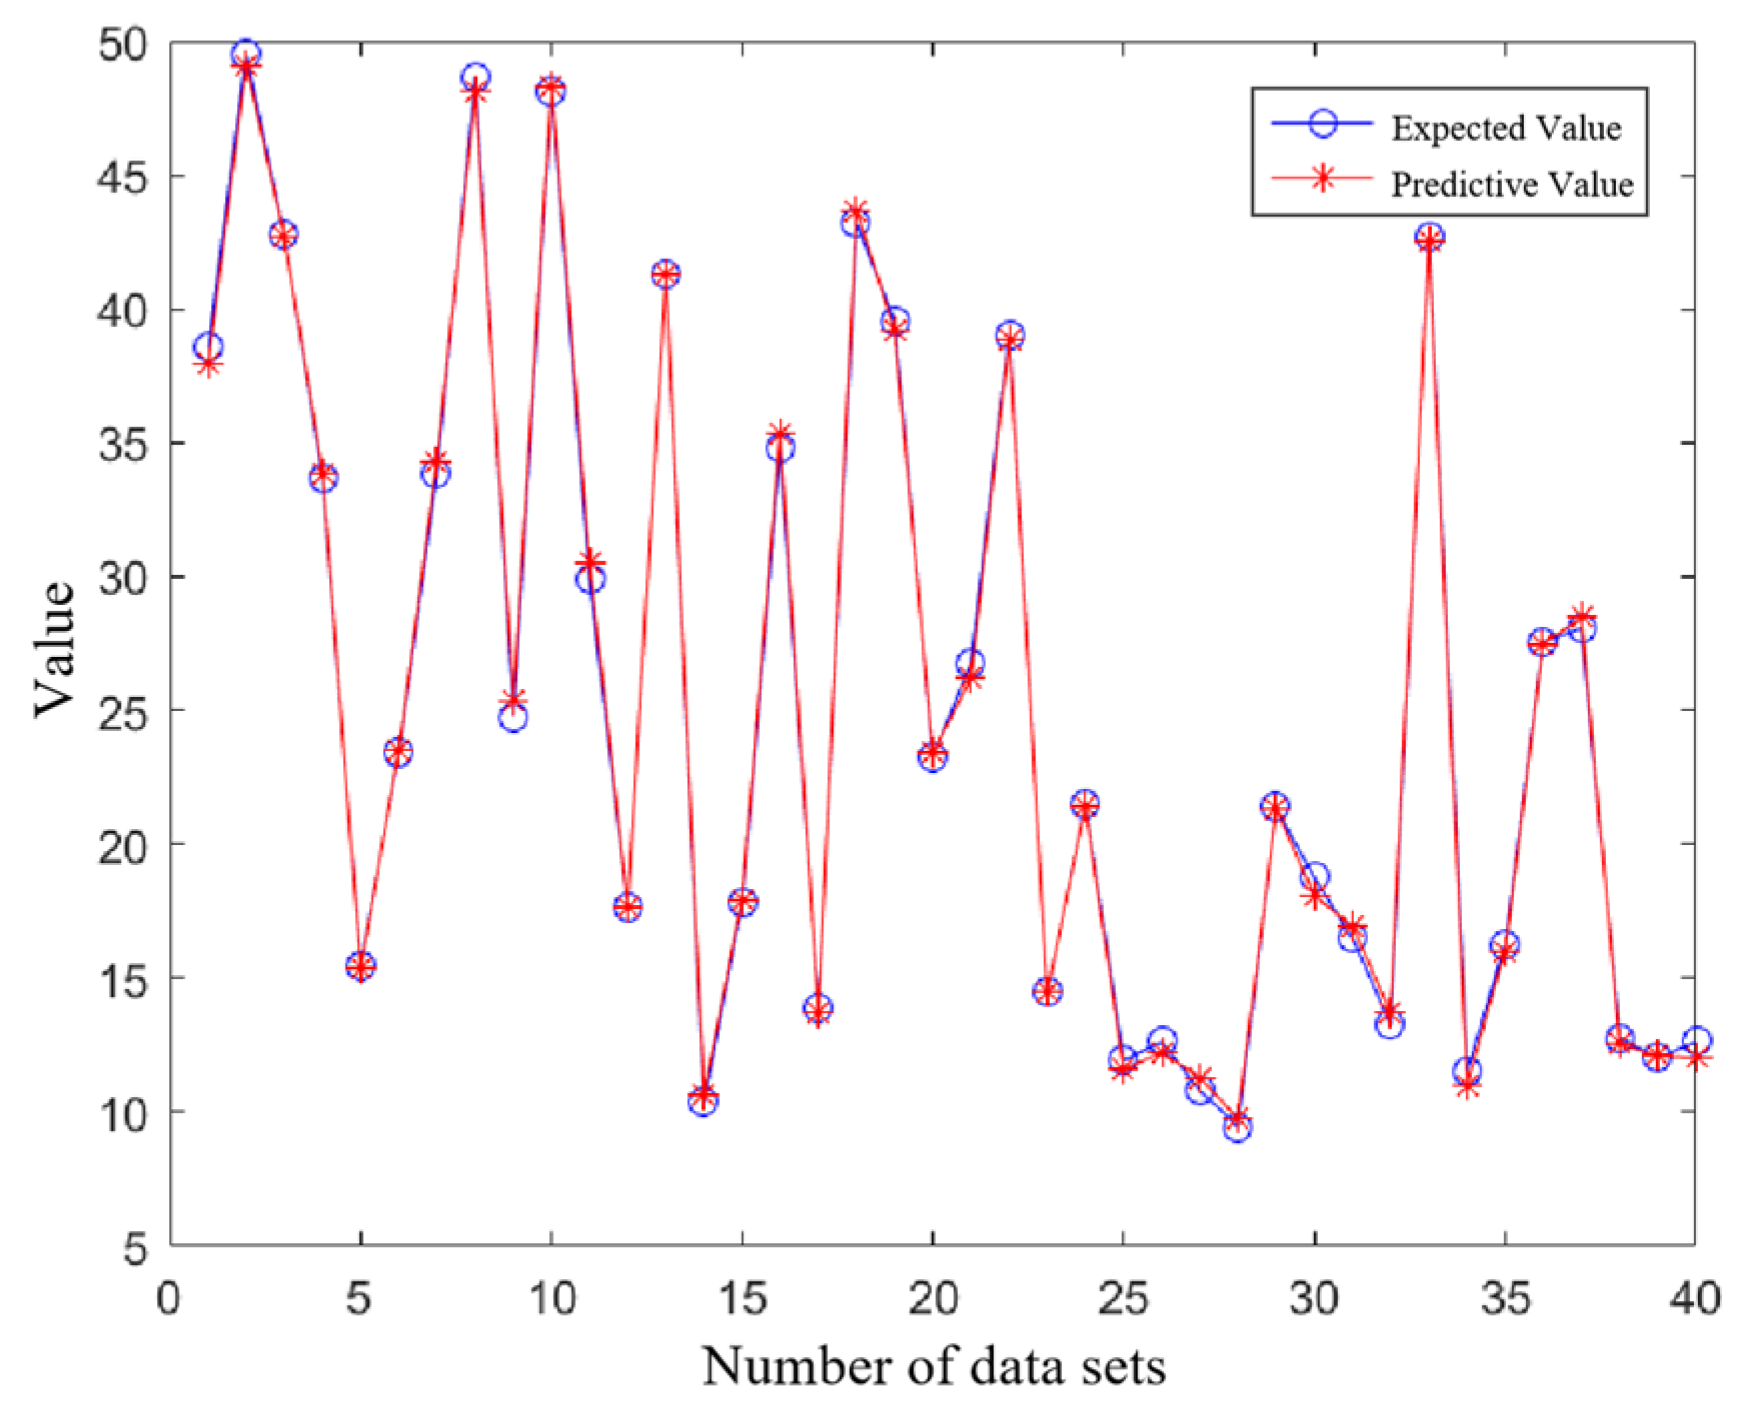
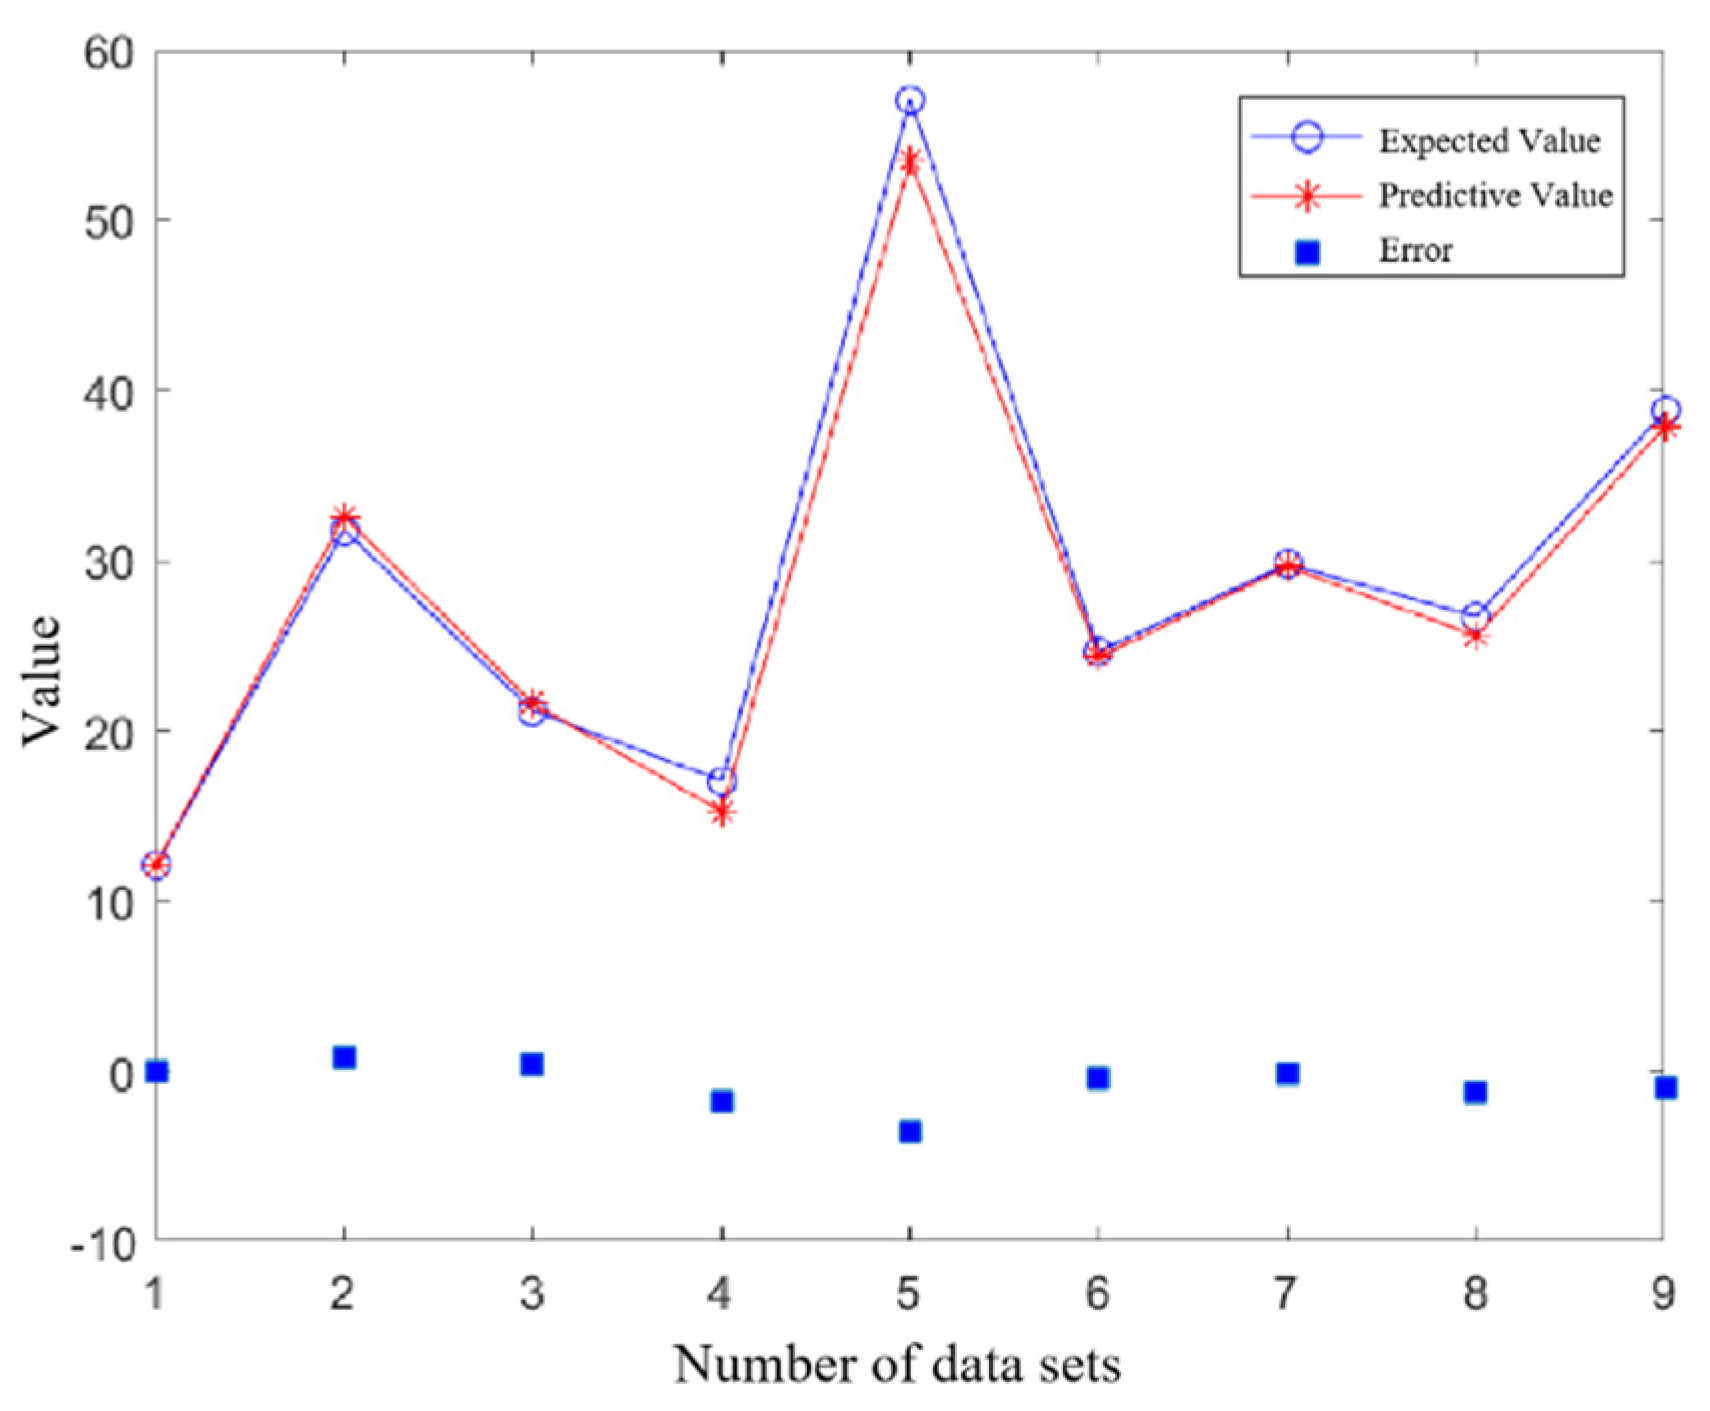
The final training model yields a mean absolute error (MAE) of 1.0228, a mean squared error (MSE) of 2.1341, and a root mean squared error (RMSE) of 1.4608 compared to the actual simulation values. The results are shown in Figure 10 and Figure 11.

4.3.2. Mutual Inductance Regression Prediction

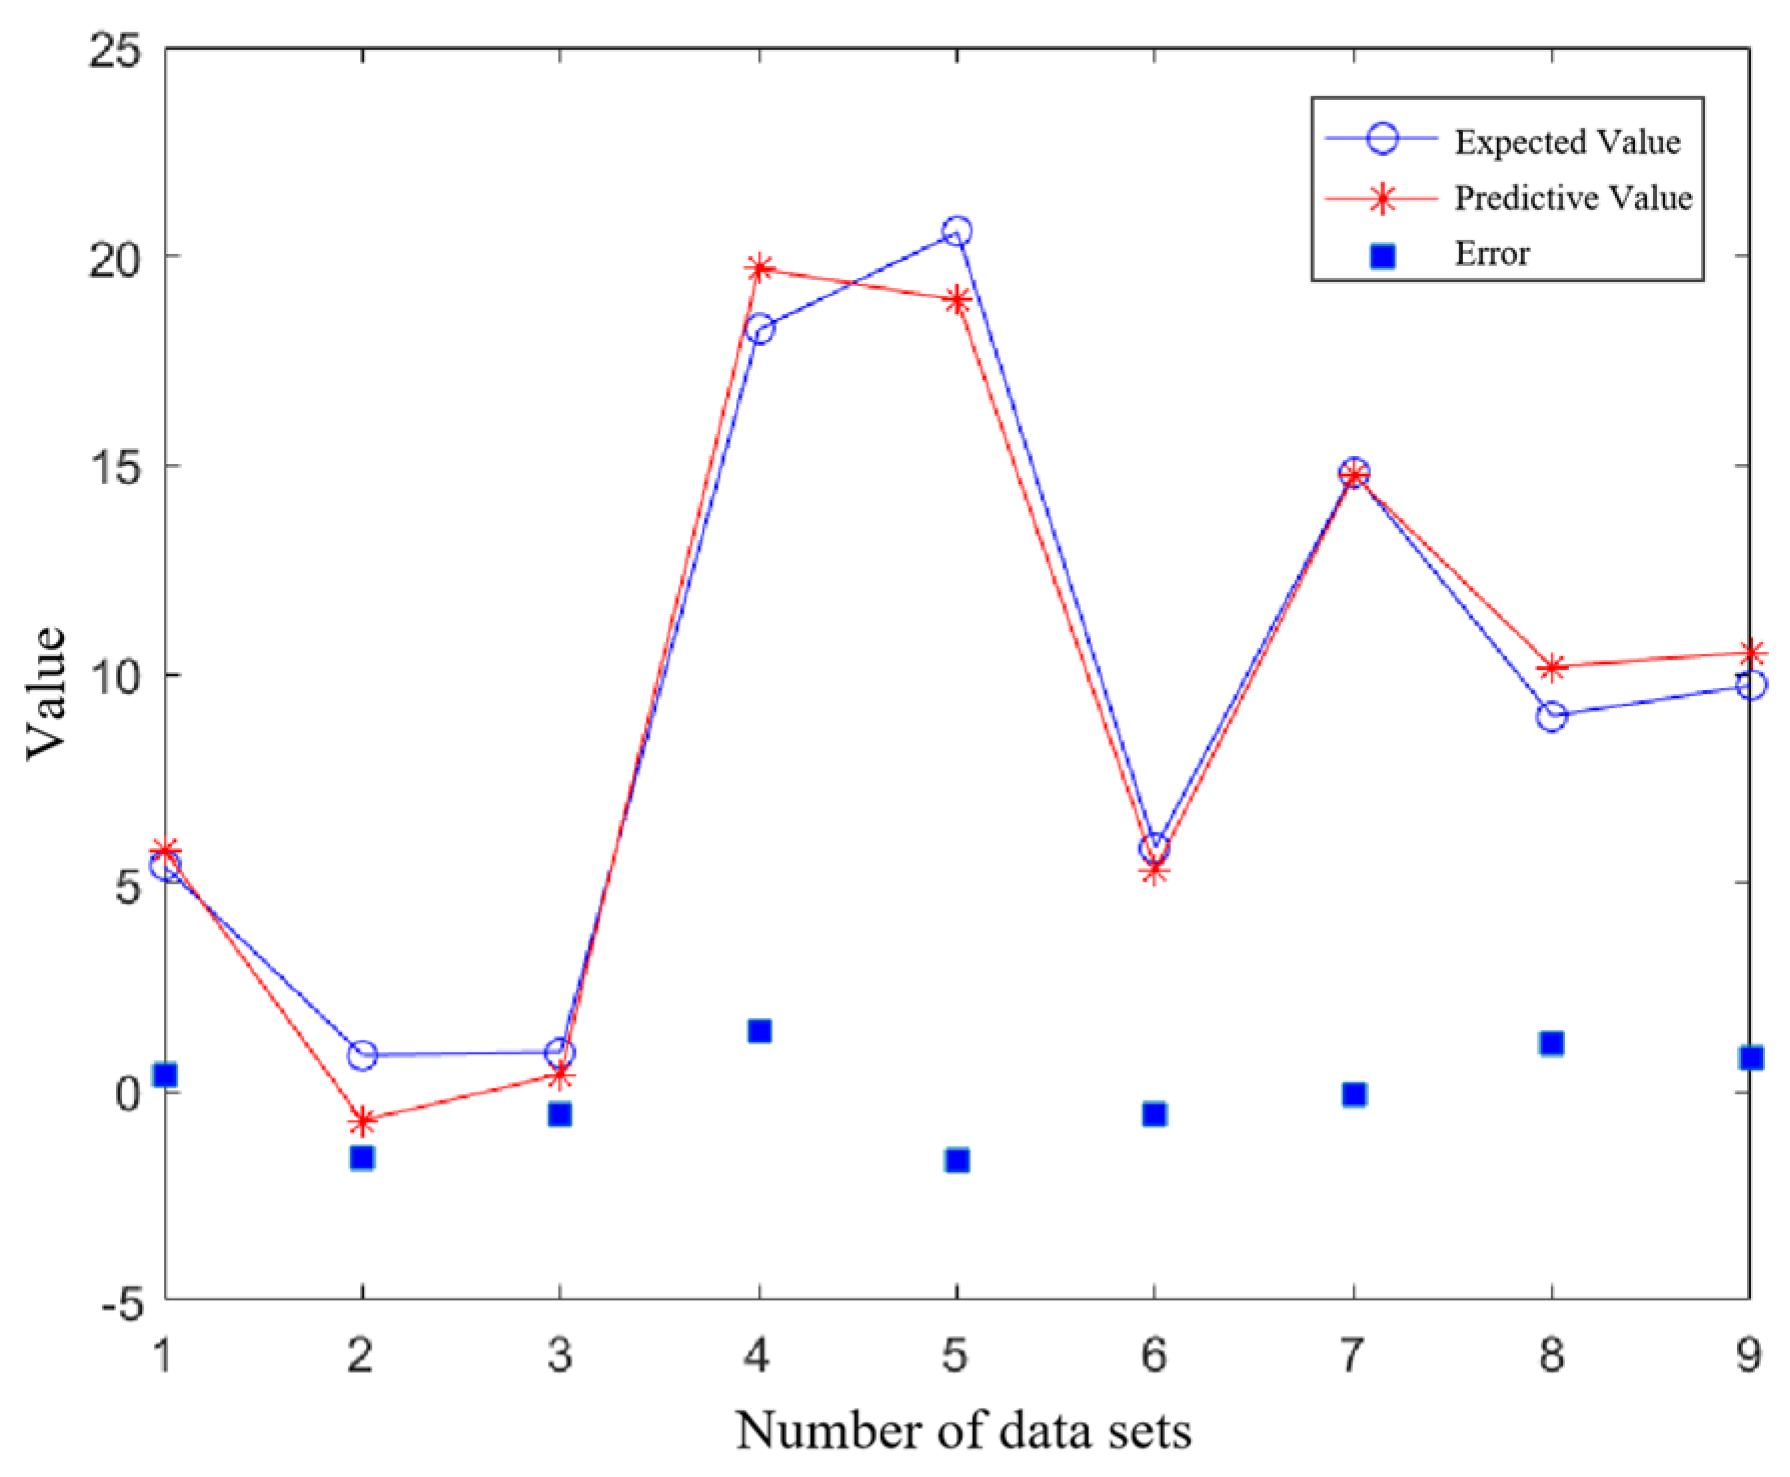
The final training model yields a mean absolute error (MAE) of 0.9016, a mean squared error (MSE) of 1.1035, and a root mean squared error (RMSE) of 1.0505 compared to the actual simulation values. The results are shown in Figure 12 and Figure 13.

5. Multi-Objective Optimization of Coupling Mechanisms

5.1. NSGA-II Non-Dominated Sorting Genetic Algorithm

In the early 21st century, Indian mathematician Deb proposed the second-generation algorithm of NSGA, called NSGA-II, based on the original NSGA algorithm. This new version addresses the three main shortcomings of NSGA. First, it employs a fast non-dominated sorting algorithm, reducing the time complexity and significantly improving the efficiency with the same amount of data. Second, it introduces an elite strategy, which expands the sampling space and enhances the accuracy of optimization results. Lastly, it incorporates the crowding distance and comparison operators. The crowding distance helps compare the individuals within the generated population, allowing candidate individuals to spread across the entire domain, ensuring great diversity within the population [25,26].

5.2. Coupling Mechanism Multi-Objective Optimization Model

The inductance of the coupling mechanism is influenced by several design parameters, each of which affects the electrical characteristics of the coupling mechanism differently. These variations result in changes to the system parameters, such as the compensation capacitance, which in turn impact system performance. Often, these performance parameters cannot be optimized simultaneously due to the inherent conflicts between them. Consequently, optimizing the MCR-WPT system becomes a multi-objective optimization problem. The following steps outline the process of establishing the multi-objective optimization model.

5.2.1. Defining the Optimization Objectives

The coupling mechanism is primarily affected by the following factors: the maximum outer diameter of the coil, the number of turns, the spacing between turns, and the wire diameter. In the MCR-WPT system, two important indicators of transmission characteristics are the output power and transmission efficiency. The optimization objectives are set to maximize the transmission power and power density.
When the coupling mechanism operates in resonance, the theoretical maximum transmission efficiency of the MCR-WPT system can be expressed as follows:
η = k 2 Q S Q D ( 1 + k 2 Q S Q D + 1 ) 2
where k represents the coupling coefficient between the two coils, and Q S and Q D are the quality factors of the primary and secondary circuits.
To characterize the lightweight degree of the coupling mechanism, power density α is introduced, defined as the transmission power per unit volume of the receiving coil.
α = P O V D
where V D represents the energy receiving volume of the receiving coil.

5.2.2. Selection of Design Variables

From Equations (25) and (26), and the definitions of the coupling coefficient and the quality factor, it can be inferred that many parameters of the coil in the coupling mechanism will affect two optimization objectives, such as the coil’s self-inductance, mutual inductance, and internal resistance.
The empirical formula for the resistance of the Litz wire when the alternating current is applied is as follows:
R = K c 4 ρ l π N a D a × 1 + 2 N a D a 1.155 D a N a + 0.0508 2 D a f 0.262 4
In the equation, D a represents the diameter of each wire strand wound to form the Litz wire; N a represents the number of wire strands wound to form the Litz wire; K c represents the length correction factor; ρ represents the resistivity of the wire used to wind the coil; f is the frequency of the current passing through the coil; and l represents the length of the Litz wire wound to form the coil. Assuming the coil’s maximum outer diameter is R c o i l , the number of turns is N , and the distance between every two turns of wire is p , the length of the Litz wire is as follows:
l = 2 π ( N R c o i l N ( N 1 ) 2 p )
Substituting Equation (27) into the above equation allows for the calculation of the coil’s internal resistance.

5.2.3. Constraint Analysis

Firstly, the system must meet a certain output power. If the power output to the receiving end is too small, it will not be sufficient to support the efficient charging of the charging equipment by the system.
P O = ( ω M ) 2 U S 2 R L [ Z S Z D + ( ω M ) 2 ] 2 P r e q
In the equation, P r e q represents the minimum required transfer power for MCR-WPT. Since the equivalent internal resistance of the coil is much smaller than the load resistance, Equation (1) can be simplified to the following form:
P O ω M I 1 I 2 P r e q
Next, it is necessary to consider the current rating of the two coils in the coupling mechanism and the voltage rating of the capacitors used in the compensation structure. Once the wire model of the coil is determined, the current passing through the two coils should satisfy the following:
I S I S m a x I D I D m a x
In the equation, I S m a x and I D m a x represent the maximum current that the transmitter and receiver coils can withstand, respectively. Once the compensation capacitance is obtained based on the system’s resonance frequency, the voltage across the compensation capacitors in both circuits should satisfy the following equation:
V S V S m a x V D V D m a x
In the equation, V S and V D represent the voltage across the compensation capacitors in the actual operation of the system at both ends, while V S m a x   a n d   V D m a x   represent the maximum voltage that the compensation capacitors used in the system can withstand. If the input frequency of the system is the same as the resonant frequency, Equation (31) can be simplified into the following form:
ω L S I S V S m a x ω L D I D V D m a x
Finally, it is necessary to consider the feasibility of winding the planar spiral coils. Generally, the two coils in the coupling mechanism are wound with the same type of wire, and the radius of the wire for both coils is r. Assuming the maximum outer diameters of the two coils are R S   a n d   R D , the number of turns are N S and N D , and the turn spacing are p S   a n d   p D , the parameters of the coils should satisfy the following:
p S 2 r p D 2 r N S p S R S N D p D R D

5.2.4. Establishment of Optimization Model

Therefore, the multi-objective optimization problem of the coupling mechanism is to obtain the optimal solution set that simultaneously achieves the maximum transmission efficiency and power density under various constraints. This is used to determine the relevant parameters of the two coils, mainly including the maximum outer diameter of the coil, the number of turns, and the distance between every two turns of wire. The objective functions in NSGA-II are generally minimized, so when optimizing the coupling mechanism, the objective function can be set as the reciprocal of the two optimization objectives. In this study, the two coils are of the planar spiral type, with the maximum outer diameter of the transmitter coil being set to R S _ c o i l and the maximum outer diameter of the receiver coil being set to R D _ c o i l . The multi-objective optimization model of the coupling mechanism is as follows:
m i n F = 1 η m a x ( R c o i l , N , p , r ) , 1 α ( R c o i l , N , p , r )
s . t . g 1 = P r e q ω M I S I D 0 g 2 = I S I S m a x 0 g 3 = I D I D m a x 0 g 4 = ω L S I S V S m a x 0 g 5 = ω L D I D V D m a x 0 g 6 = 2 r p S 0 g 7 = 2 r p D 0 g 8 = 2 N S p S R S c o i l 0 g 9 = 2 N S p D R D c o i l 0

5.3. Multi-Objective Optimization Results

After determining the specific types of all design variables, it is necessary to restrict the range of values for these variables. In this paper, Litz wire is used for all coils. According to the system design requirements, the ranges of design variables are shown in Table 4.
The constraints’ relevant values can be found in Table 5.
When setting the parameters for the NSGA-II algorithm, the optimal individual coefficient is chosen to be 0.3, and the population size is set to 200. By repeatedly changing the number of iterations, the iteration count is set to 400. This ensures a smooth and uniform Pareto front, while maintaining the computational speed. Figure 14 shows the convergence process when using the NSGA-II algorithm.
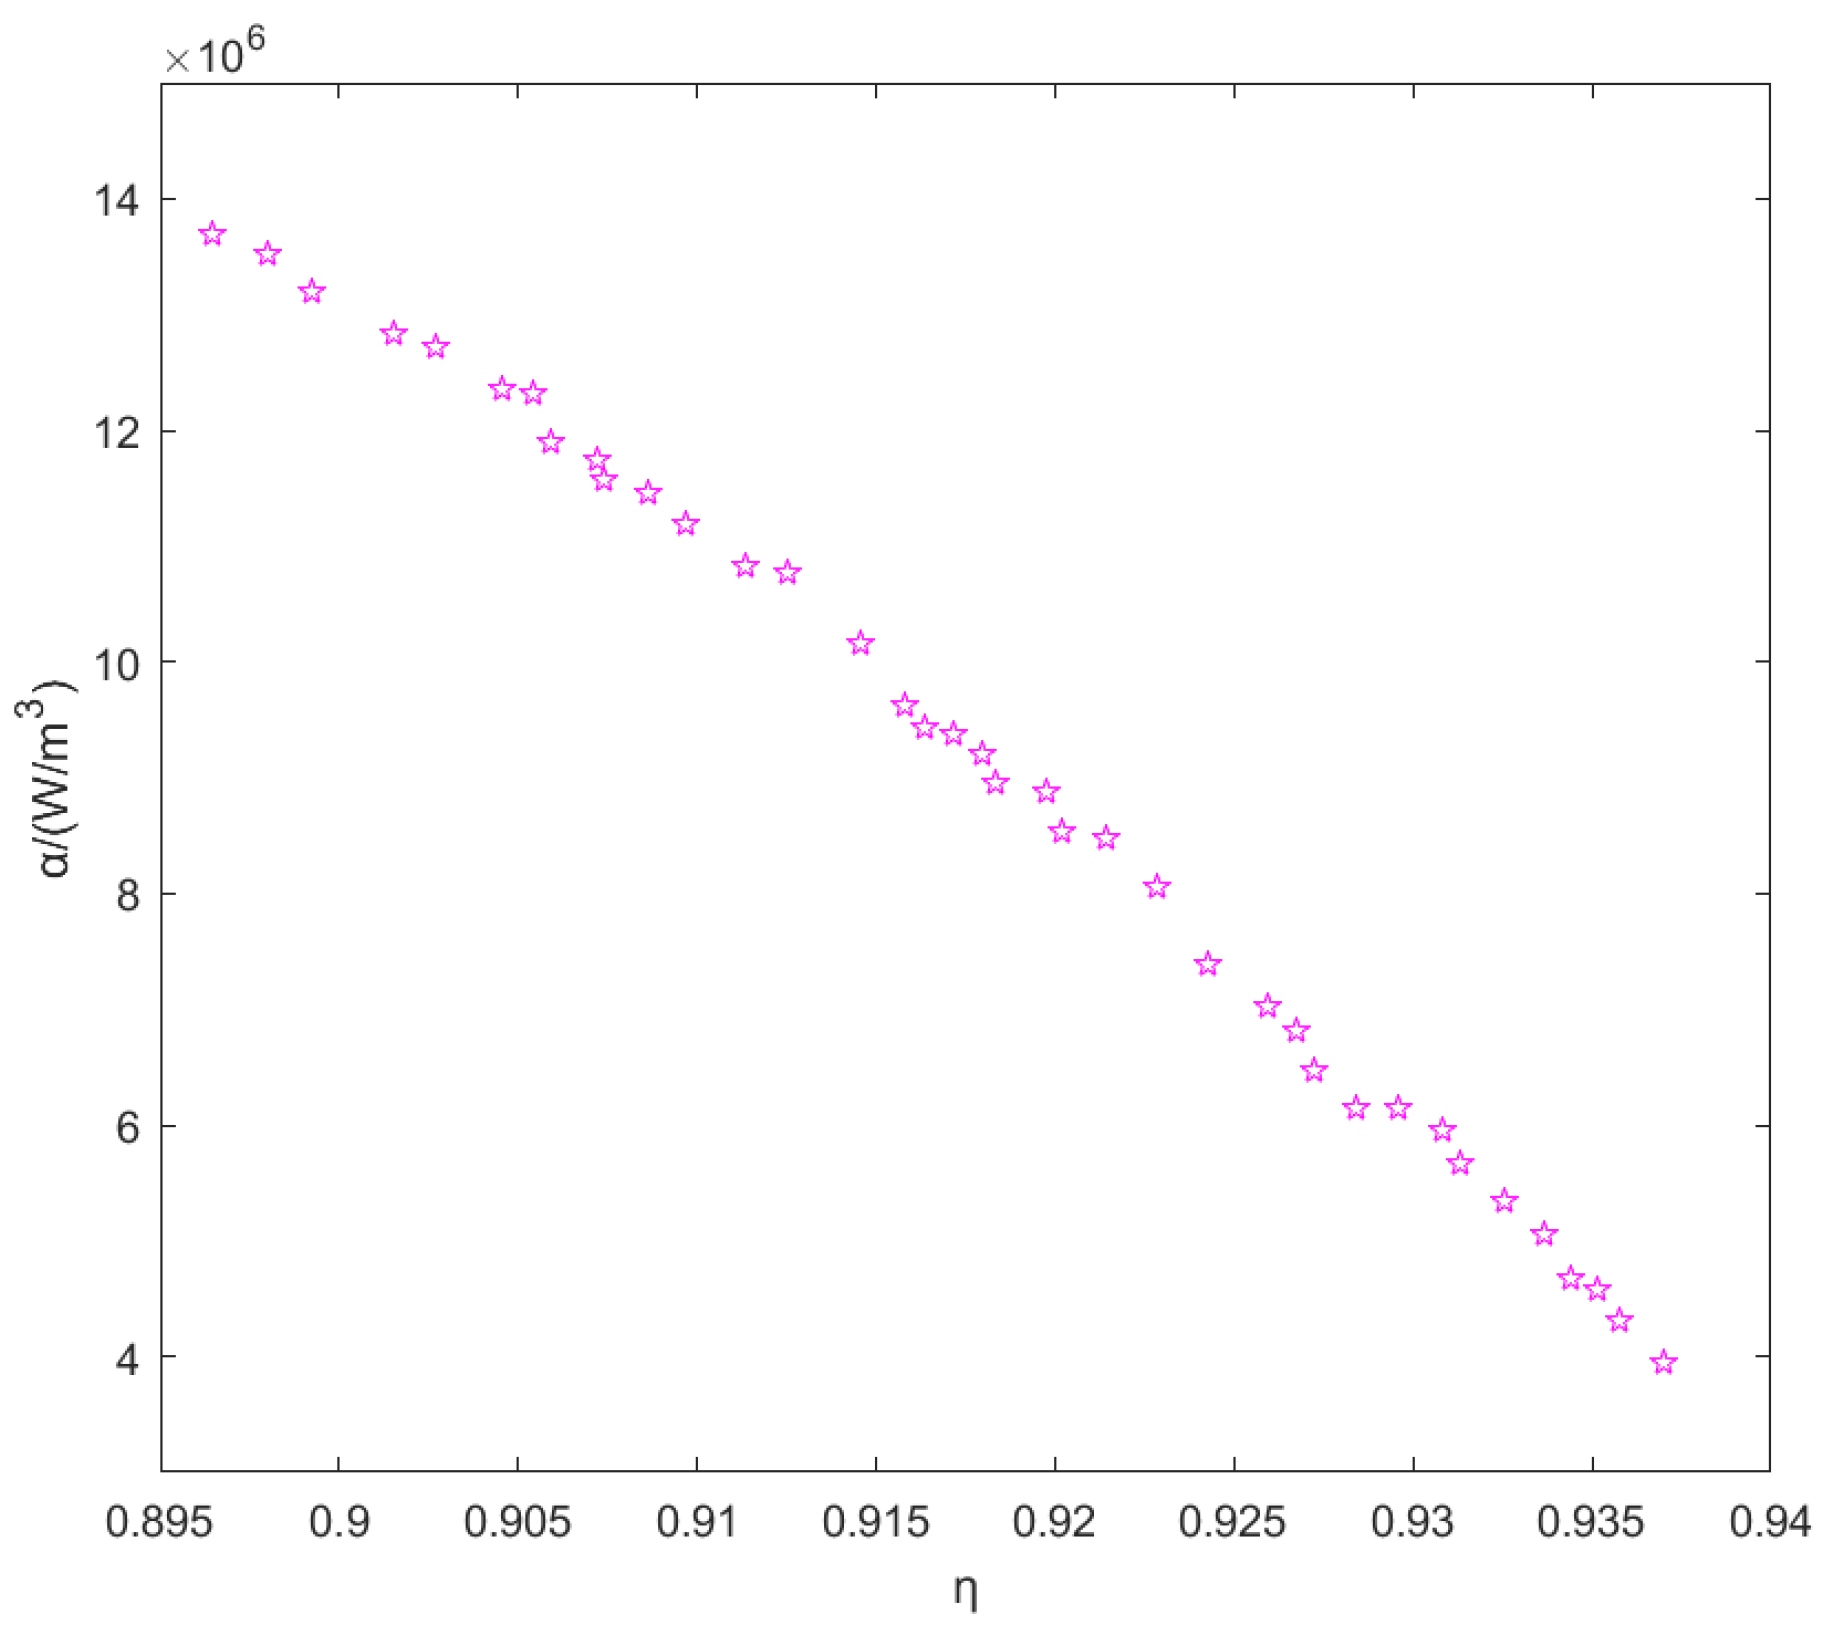
Figure 15 shows the transmission efficiency and power density in the final Pareto front solutions. As can be seen from the figure, the two cannot achieve their maximum values simultaneously and exhibit a negative correlation. In practice, a set of parameters from the Pareto front can be selected based on specific requirements for the system design.
Table 4 lists some of the optimized cutting-edge solutions. In practical engineering applications, the determination of many parameters needs to be gradually determined according to the priority order of the performance indicators. The weights of various indicators can be determined by preference, and mathematical methods can be used for normalization to obtain the optimized parameters that meet the usage scenarios.
Using a joint simulation model, we can compare the transmission efficiency and power density before and after optimization. The parameters before optimization are as follows: outer diameter of 150 mm, 14 turns, a turn spacing of 4 mm, and single-layer coated Litz wire with a wire diameter of 1.25 mm. Based on the actual selection, the optimized parameters are as follows: outer diameter of 108 mm, 11 turns, a turn spacing of 3 mm, and single-layer coated Litz wire with a wire diameter of 1.322 mm. Partial cutting-edge solutions are shown in Table 6.
The efficiency before optimization is 87.2%, and the efficiency after optimization is 93.35%. It increased by approximately 6%. The power density before optimization is 1.267 × 10 6   W / m 3 . The power density after optimization is 4.782 × 10 6   W / m 3 .

6. Summary

(1) First, the working principle of the MCR-WPT system was analyzed. After identifying a compensation structure suitable for underwater systems, a traditional mathematical model was established, and the variations in the self-inductance and mutual inductance of the underwater coils were analyzed.
(2) Through orthogonal experiments, the factors influencing the mutual inductance and self-inductance of planar spiral coils were analyzed. The self-inductance and mutual inductance values for each set of influencing factors were obtained. Based on the results of the orthogonal experiments, the self-inductance and mutual inductance were regressed and predicted using an RBF neural network, resulting in regression prediction models for self-inductance and mutual inductance.
(3) Two optimization objectives for the coupling mechanism were determined as follows: the system transmission efficiency and power density of the coupling mechanism. Under the constraints of meeting the minimum output power requirement, ensuring the electrical stress on the devices is less than the rated value, and the feasibility of winding, multiple sets of design parameters for the two coils were obtained through the NSGA-II algorithm. The optimized scheme achieved an efficiency of 93.4%, which is around a 6% improvement over the original scheme, and a power density that is approximately twice that of the original scheme.

Author Contributions

Conceptualization, Q.H. and M.Z.; methodology, M.Z.; software, Z.L. and Y.Q.; validation, Q.H., J.H. and Y.Q.; formal analysis, M.Z.; investigation, M.Z., Z.L. and J.H.; resources, Q.H.; data curation, M.Z.; writing—original draft preparation, M.Z.; writing—review and editing, M.Z., Z.L. and Q.H.; visualization, Y.O.; supervision, Q.H.; project administration, Q.H.; funding acquisition, Q.H. All authors have read and agreed to the published version of the manuscript.

Funding

This research was funded by the Natural Science Foundation of Hunan Province (2021JC0010), and National Key Research and Development Project of China (2021YFC2801701, 2023YFC2811300).

Data Availability Statement

The original contributions presented in the study are included in the article, further inquiries can be directed to the corresponding authors.

Acknowledgments

The authors would like to thank the anonymous reviewers for their constructive suggestions, which comprehensively improved the quality of the paper. All individuals have consented to the acknowledgement.

Conflicts of Interest

The authors declare no conflict of interest.

References

  1. Mohsan, S.A.H.; Islam, A.; Khan, M.A.; Mahmood, A.; Rokia, L.S.; Mazinani, A.; Amjad, H. A Review on Research Challenges, Limitations and Practical Solutions for Underwater Wireless Power Transfer. Int. J. Adv. Comput. Sci. Appl. 2020, 11, 554–562. [Google Scholar] [CrossRef]
  2. Yu, L.; Sun, H.; Su, S.; Tang, H.; Sun, H.; Zhang, X. Review of Crucial Problems of Underwater Wireless Power Transmission. Electronics 2023, 12, 163. [Google Scholar] [CrossRef]
  3. Lyu, F.; Cai, T.; Huang, F. A universal wireless charging platform with novel bulged-structure transmitter design for multiple heterogeneous autonomous underwater vehicles (AUVs). IET Power Electron. 2023, 16, 2162–2177. [Google Scholar] [CrossRef]
  4. Feng, H.; Tavakoli, R.; Onar, O.C.; Pantic, Z. Advances in High-Power Wireless Charging Systems: Overview and Design Considerations. IEEE Trans. Transp. Electrif. 2020, 6, 886–919. [Google Scholar] [CrossRef]
  5. Teeneti, C.R.; Truscott, T.T.; Beal, D.N.; Pantic, Z. Review of Wireless Charging Systems for Autonomous Underwater Vehicles. IEEE J. Ocean. Eng. 2021, 46, 68–87. [Google Scholar] [CrossRef]
  6. Mukherjee, S.; Galigekere, V.P.; Onar, O.; Ozpineci, B.; Su, G.J. Control of Output Power in Primary Side LCC and Secondary Series Tuned Wireless Power Transfer System without Secondary Side Sensors. In Proceedings of the 2020 IEEE Energy Conversion Congress and Exposition (ECCE), Detroit, MI, USA, 11–15 October 2020. [Google Scholar]
  7. McGinnis, T.; Henze, C.P.; Conroy, K. Inductive power system for autonomous underwater vehicles. In Proceedings of the OCEANS 2007, Aberdeen, Scotland, 18–21 June 2007; pp. 1–5. [Google Scholar]
  8. Pyle, D.; Granger, R.; Geoghegan, B.; Lindman, R.; Smith, J. Leveraging a large UUV platform with a docking station to enable forward basing and persistence for light weight AUVs. In Proceedings of the 2012 OCEANS, Rhodes, Greece, 17–23 June 2012; pp. 1–8. [Google Scholar]
  9. Granger, R.P.; Baer, C.M.; Gabriel, N.H.; Labosky, J.J.; Galford, T.C. Non-contact wet mateable connectors for power and data transmission. In Proceedings of the 2013 OCEANS, San Diego, CA, USA, 23–26 September 2013; pp. 1–4. [Google Scholar]
  10. Kurs, A.; Karalis, A.; Moffatt, R.; Joannopoulos, J.D.; Fisher, P.; Soljacic, M. Wireless power transfer via strongly coupled magnetic resonances. Science 2007, 317, 83–86. [Google Scholar] [CrossRef] [PubMed]
  11. Yu, X.; Sandhu, S.; Beiker, S.; Sassoon, R.; Fan, S. Wireless energy transfer with the presence of metallic planes. Appl. Phys. Lett. 2011, 99, 214102. [Google Scholar] [CrossRef]
  12. Moon, S.; Kim, B.-C.; Cho, S.-Y.; Ahn, C.-H.; Moon, G.-W. Analysis and design of a wireless power transfer system with an intermediate coil for high efficiency. IEEE Trans. Ind. Electron. 2014, 61, 5861–5870. [Google Scholar] [CrossRef]
  13. Shi, J.-g.; Li, D.-j.; Yang, C.-j. Design and analysis of an underwater inductive coupling power transfer system for autonomous underwater vehicle docking applications. J. Zhejiang Univ. Sci. C 2014, 15, 51–62. [Google Scholar] [CrossRef]
  14. Tran, D.H.; Choi, W. Design of a high-efficiency wireless power transfer system with intermediate coils for the on-board chargers of electric vehicles. IEEE Trans. Power Electron. 2017, 33, 175–187. [Google Scholar] [CrossRef]
  15. Wang, Z.; Li, G.; Jin, X.; Li, H. Modeling and Application of Magnetic Induction Wireless Power Transmission in Sea Water. In Proceedings of the 2021 International Conference on Power System Technology (POWERCON), Haikou, China, 10–11 November 2021; pp. 2172–2177. [Google Scholar]
  16. Zhang, K.-H.; Zhu, Z.-B.; Song, B.-W.; Xu, D.-M. A power distribution model of magnetic resonance WPT system in seawater. In Proceedings of the 2016 IEEE 2nd Annual Southern Power Electronics Conference (SPEC), Auckland, New Zealand, 5–8 December 2016; pp. 1–4. [Google Scholar]
  17. Yeo, T.-D.; Kwon, D.; Khang, S.-T.; Yu, J.-W. Design of maximum efficiency tracking control scheme for closed-loop wireless power charging system employing series resonant tank. IEEE Trans. Power Electron. 2016, 32, 471–478. [Google Scholar] [CrossRef]
  18. Wheeler, H.A. Simple Inductance Formulas for Radio Coils. Proc. Inst. Radio Eng. 1928, 16, 1398–1400. [Google Scholar] [CrossRef]
  19. Kraichman, M.B. Impedance of a circular loop in an infinite conducting medium. J. Res. Nat. Bur. Stand. D. Radio Propag. 1962, 66, 499–503. [Google Scholar] [CrossRef]
  20. Guan, Y.; Sun, X.; Jiang, X.; Sa, R.; Zhou, L.; Huang, Y.; Liu, Y.; Li, X.; Lu, R.; Wang, C. The effect of Fe-Mn minerals and seawater interface and enrichment mechanism of ore-forming elements of polymetallic crusts and nodules from the South China Sea. Acta Oceanol. Sin. 2017, 36, 34–46. [Google Scholar] [CrossRef]
  21. Tippmann, J.; Sarkar, J.; Verlinden, C.; Hodgkiss, W.; Kuperman, W. Toward ocean attenuation tomography: Determining acoustic volume attenuation coefficients in seawater using eigenray amplitudes. J. Acoust. Soc. Am. 2016, 140, EL247–EL250. [Google Scholar] [CrossRef] [PubMed]
  22. Mazlouman, S.J.; Mahanfar, A.; Kaminska, B. Mid-range wireless energy transfer using inductive resonance for wireless sensors. In Proceedings of the 2009 IEEE International Conference on Computer Design, Lake Tahoe, CA, USA, 4–7 October 2009; pp. 517–522. [Google Scholar]
  23. Montazer, G.A.; Giveki, D.; Karami, M.; Rastegar, H. Radial basis function neural networks: A review. Comput. Rev. J. 2018, 1, 52–74. [Google Scholar]
  24. Tian, W.; Bao, Y.; Liu, W. Wind power forecasting by the BP neural network with the support of machine learning. Math. Probl. Eng. 2022, 2022, 7952860. [Google Scholar] [CrossRef]
  25. Srinivas, N.; Deb, K. Muiltiobjective optimization using nondominated sorting in genetic algorithms. Evol. Comput. 1994, 2, 221–248. [Google Scholar] [CrossRef]
  26. Deb, K.; Pratap, A.; Agarwal, S.; Meyarivan, T. A fast and elitist multiobjective genetic algorithm: NSGA-II. IEEE Trans. Evol. Comput. 2002, 6, 182–197. [Google Scholar] [CrossRef]
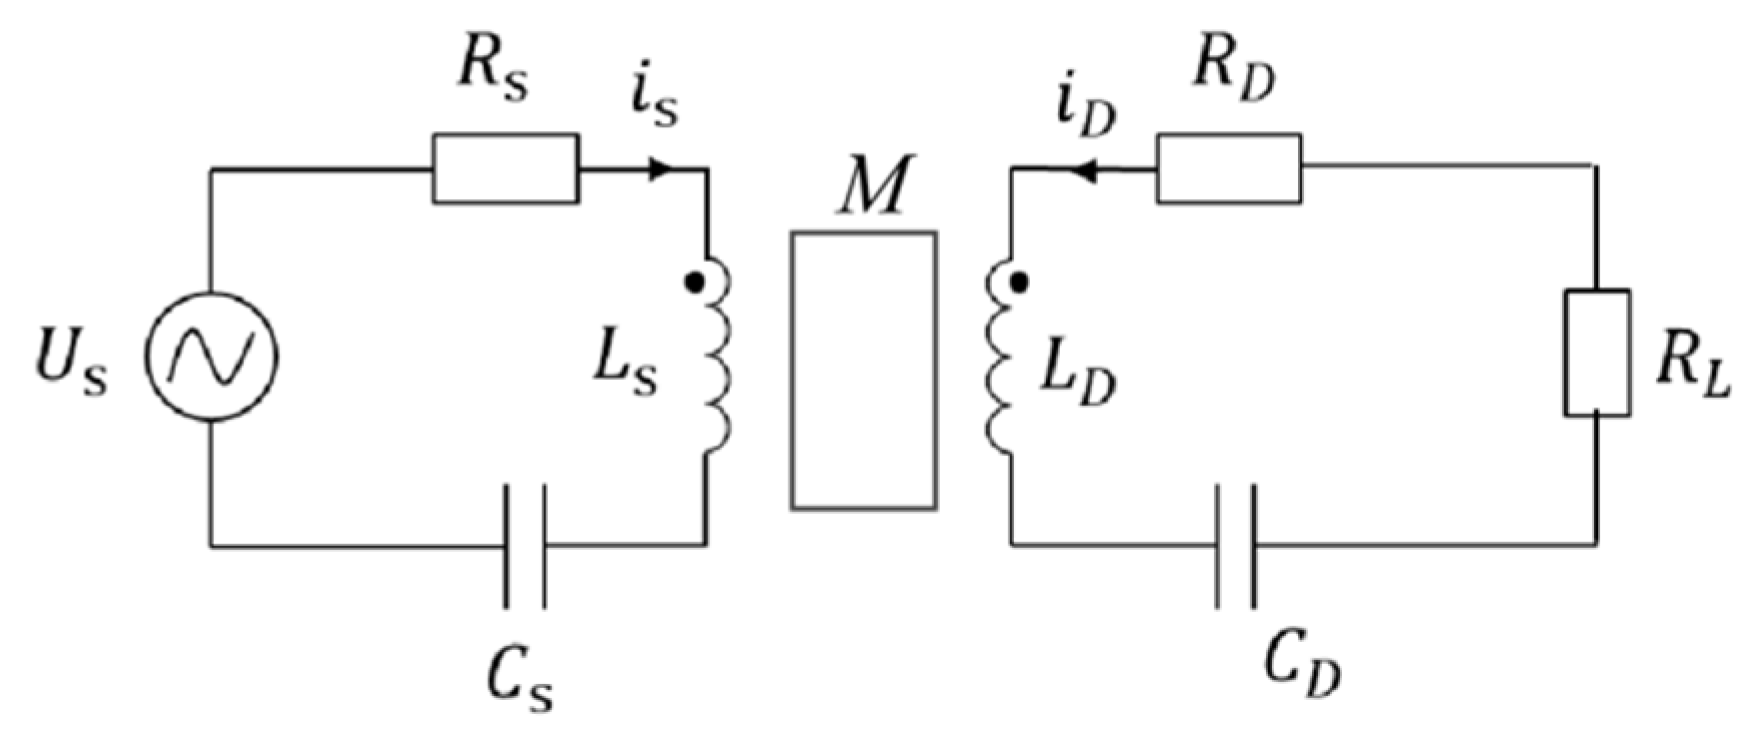
Figure 1. Equivalent circuit model.
Machines 12 00445 g001
Figure 2. Variation of self-inductance in seawater and air.
Machines 12 00445 g002
Figure 3. Magnetic field distribution in air (left) and seawater (right).
Machines 12 00445 g003
Figure 4. Variation of mutual inductance with R/r for different conductivity values.
Machines 12 00445 g004
Figure 5. Mutual inductance calculation model.
Machines 12 00445 g005
Figure 6. Simulation process in Maxwell software.
Machines 12 00445 g006
Figure 7. Maxwell-MATLAB integrated simulation platform.
Machines 12 00445 g007
Figure 8. Structure of the radial basis function network.
Machines 12 00445 g008
Figure 9. Structure of the RBF neural network.
Machines 12 00445 g009
Figure 10. Relationship between predicted and expected self−inductance values for training set parameters.
Machines 12 00445 g010
Figure 11. Relationship between predicted and expected self−inductance values for vali–dation set parameters.
Machines 12 00445 g011
Figure 12. Relationship between predicted and expected mutual inductance values for training set parameters.
Machines 12 00445 g012
Figure 13. Relationship between predicted and expected mutual inductance values for val–idation set parameters.
Machines 12 00445 g013
Figure 14. The convergence process of the algorithm.
Machines 12 00445 g014
Figure 15. The relationship diagram between the two optimization objectives.
Machines 12 00445 g015
Table 1. Coil simulation parameters.
ParameterSeawater
Number of turns11
Number of layers1
Coil inner diameter (mm)35
Coil outer diameter (mm)75
Wire radius (mm)2
Transmission distance (mm)30
Table 2. Self-inductance orthogonal experimental table.
Experiment NumberFactor AFactor BFactor CFactor DSelf-Inductance (μH)
160740.513.263
26074112.066
360741.512.632
46074.51.510.814
560841.513.884
66085.51.59.426
760950.512.623
42100125148.635
4311074.5127.564
4411074.51.526.796
4511084233.686
4611094143.175
47110105.50.542.651
481101151.548.116
491101250.557.101
Table 3. Mutual inductance orthogonal experimental table.
Experiment NumberFactor AFactor B Factor C Factor DFactor EMutual Inductance (μH)
160740.5306.686
26074.50.5900.892
36074.51701.459
46075.51.5304.161
56084.51503.056
660851.5502.511
760940.5702.201
42100124.51.5908.109
43110741.53015.223
44110751509.500
4511084.50.5708.478
4611095.52905.846
47110104.51.53028.005
4811011415021.865
491101250.5709.030
Table 4. Range of variable values.
ParameterRange of Values
Outer Diameter/mm[60, 110]
Number of Turns N[7, 15]
Pitch (mm)/mm[2, 10]
Wire Radius (mm)/mm[0.5, 2.5]
Table 5. The relevant values for the constraints.
ParameterValues
P r e q / W 300
I S m a x / A 15
I D m a x / A 15
V S m a x / V 50
V D m a x / V 50
Table 6. Partial cutting-edge solutions.
Design VariablesObjective Function Values
Outer Diameter/mmNumber of TurnsTurn-to-Turn
Spacing/mm
Wire
Diameter/(mm)
η α / ( 10 6   W / m 3 )
105.8411.42.431.1893.0%5.94
106.3311.42.621.2993.2%5.33
107.7911.52.961.3593.4%4.66
108.4311.73.051.4393.6%4.30
109.6511.83.121.5593.7%3.94
Disclaimer/Publisher’s Note: The statements, opinions and data contained in all publications are solely those of the individual author(s) and contributor(s) and not of MDPI and/or the editor(s). MDPI and/or the editor(s) disclaim responsibility for any injury to people or property resulting from any ideas, methods, instructions or products referred to in the content.