Abstract
Controlling the distribution of the abrasive grains on the surface of the grinding tools in an appropriate way is important for improving the quality of grinding processing and meeting the workpiece precision requirements. In the present study, a novel method for the orderly arrangement of abrasive particles is proposed by using the liquid film flow on the surface of the rotating disk as the driving and controlling means for the uniform dispersion and position arrangement of abrasive particles. Computational fluid dynamics (CFD) simulations have been performed to clearly illustrate the trajectories of abrasive particles under the strong influence of liquid film flow on the rotating disk and reveal the effects of fluid flow, disk rotational motion, and the mixture viscosity on the particle distribution. A new abrasive grain arrangement device is designed and fabricated using this novel method. The operating parameters such as liquid volume flow rate, disk rotational speed, and liquid viscosity are adjusted to control the placement of abrasive grains on the surface of the grinding tool. An image processing tool is used to examine and analyze the arrangement results. The experimental results indicated that the application of the liquid film flow on a rotating disk to the abrasive grain arrangement can improve the arrangement of abrasive grains and get rid of the dependence on the template.
1. Introduction
As one of the key technologies in the field of precision machining, grinding has been considered as an indispensable surface processing method [1,2,3], which has been widely applied to difficult-to-machine materials, such as titanium alloys [4], superalloys [5], and 300M steel [6]. During the grinding process, the processing quality of the workpiece is determined by the combined action of the abrasive grains in different positions. The traditional consolidated abrasive tools exhibit randomness in the distribution of abrasive particle positions, leading to segregation and aggregation phenomena, and only a portion of the abrasive particles on the working surface of the tool contributes to the grinding process, while the rest generate heat through friction, which can result in severe adverse effects, such as abrasive wear, residual stress, and grinding burns [7]. The suitable control of the position of abrasive particles on the grinding tool surface can make the abrasive particles bear uniform force and wear, increase the chip tolerance space on the abrasive surface, and improve the grinding performance and service life of the abrasive tool comprehensively [8,9,10]. Therefore, it is very important to control the placement of the abrasive grains on the surface of the grinding tool.
It has been revealed that the abrasives prepared according to the specific pattern can produce workpieces of better quality. Denkena et al. investigated that patterned grinding wheels can result in a reduction of up to 30% in process force [11]. Fang et al. compared a radial structure polishing pad with a conventional polishing pad and found that a radial structure polishing pad could remove materials more evenly through trajectory calculation and corresponding experimental study [12]. Wen et al. reported that the grinding tool manufactured in a spiral pattern could process better surface quality of the workpiece, while the surface quality of the workpiece would be worse when processed by the grinding tool manufactured in a concentric circle pattern, by simulating the trajectory of the abrasive grains on the surface of the grinding tool [13]. Chen et al. experimentally measured that a bionic vein-like structured grinding wheel can significantly decrease normal and tangential force than an unstructured grinding wheel [14].
Currently, a number of methods have been applied to the manufacturing of grinding wheels with orderly grain arrangement. Sung used the template method to achieve a uniform and orderly arrangement of diamond abrasive grains by pressing diamond grains with a particle size of 238–358 μm into a thin layer of brazing powder mixed with an appropriate organic binder using a perforated metal template, layer by layer [15]. Zhu et al. positioned abrasive grains linearly by constructing a topological matrix, in which the abrasive grains are arranged in rows at a certain distance and angle. By changing the properties of the patterned grinding wheel, the surface roughness and subsurface damage were effectively changed [16]. Wu et al. arranged diamond grains on the surface of a grinding wheel, followed by brazing, and then utilized laser ablation to achieve a novel brazed grinding wheel with diamond grains uniformly distributed and featuring a microstructure on the surface [17]. Yin et al. prepared the grinding wheel by controlling the orientation of diamond grains by manipulating the magnetic field. The achieved surface roughness by grinding non-spherical parts made of YG8 hard alloy was 13 nm [18]. Considering that additive manufacturing (AM) technology makes it attainable to facilitate the production of parts with complex geometries [19], Li et al. employed 3D printing technology to fabricate porous metal-bonded grinding wheels with three structures, experimentally evaluating the grinding force and specific grinding energy of the fabricated grinding wheels, which were found to be significantly lower than those of electroplated grinding wheel [20]. Based on the principle of AM technology, Qiu designed and fabricated a three-dimensional controllable arrangement of abrasive grains, which combines abrasive grains with light-curing resin, and the arrangement of abrasive grains in the two-dimensional plane is controlled by a pre-designed template [21]. A kind of compliance grinding tool with a crystal structure using multi-jet fusion was proposed by Li et al., which can achieve effective machining with less material. The designed star-structured tool can achieve 89.27–94.72% of the material removal rate of a solid-structured tool [22].
It seems that either the external force field and the pre-designed template or the combination of both is inevitable to achieve the orderly arrangement of the abrasive grains. However, the above-mentioned methods are usually for cases with very few abrasive grains, which leads to a low grinding efficiency that is unfavorable to industrial applications. In this paper, the authors proposed a new method for the orderly arrangement of abrasive particles without using a template. Inspired by the flow field created by the classic spinning disk reactor [23,24,25], the proposed new method uses the liquid film flow on a rotating disk as the driving motion of the abrasive particles. Firstly, a computational method based on computational fluid dynamics (CFD) is used to carry out the simulation research. Then, a particle orderly arrangement device is designed and fabricated based on the results of simulations. In addition, a disk-shaped grinding tool has been manufactured with multiple layers of abrasive particles by using the new device. Finally, the parameters that affect the placement of abrasive particles in the grinding tools have been comprehensively studied in the present work, providing a deep insight into the mechanism of formation of arrangement patterns under the strong influence of liquid film flow.
2. Numerical Simulation
2.1. Computational Domain and Meshing
Figure 1a shows a three-dimensional computational domain. Since the liquid-phase resin is injected into the disk surface from the nozzle, the formation of the liquid film is affected by the flow conditions of the jet flow. Therefore, the nozzle is considered as the inlet, and the space between the nozzle and the disk is included in the computational domain for capturing the jet flow characteristics. A nozzle with a diameter of 4 mm is located symmetrically directly above the center of the disk. The solution enters the computational domain from this nozzle at a certain velocity and then flows over the surface of the stainless steel disk with a diameter of 100 mm. The computational domain with a height of 70 mm comprises only a limited portion of the air above the rotating disk to acquire a lower computational cost.
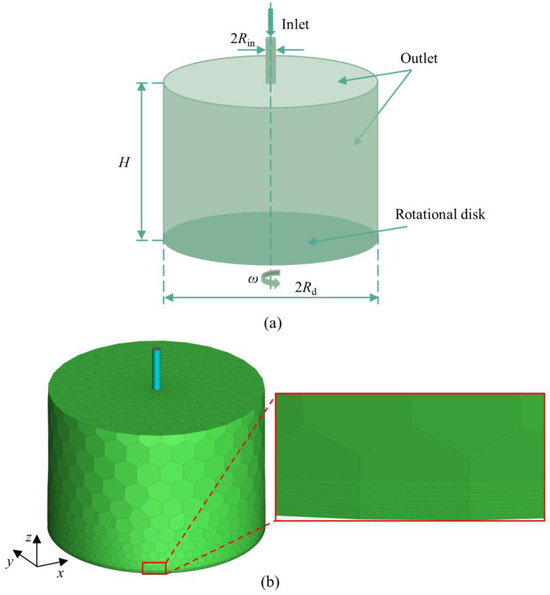
Figure 1.
Schematic diagrams of (a) the computational domain and (b) the computational mesh.
Considering the high computational accuracy and better convergence of polyhedral meshing, a polyhedral grid meshed by the meshing module in ANSYS Fluent 2020 R2 was used for the present simulations. Figure 1b presents a global view of the three-dimensional computational grid and a partial view of the boundary layer grid near the wall surface. Since the surrounding air is not the main concern of the jet and the liquid film flow, the mesh cells applied to this region can be relatively coarser. In contrast, in order to capture more details of the liquid-film flow on the disk, 10 layers of mesh refinement are used right above the disk with a height of 0.1 mm for the first layer and a growth rate of 1.1. By using empirical correlation () [26], the thickness of the liquid film on the rotating disk is calculated at about 100 μm. In this case, the thickness of 0.1 mm for the first layer of the mesh is roughly the same as the thickness of the liquid film.
A grid-dependency test wherein the number of grid cells varied from 26,965 to 6898 was performed to measure the impact of grid density on the accuracy of simulation results. Under identical conditions, calculations were conducted to compare and analyze the velocity fields at specific locations (x = 0 mm, −50 mm ≤ y ≤ 50 mm, z = 0.1 mm) with different grid densities. Figure 2 shows that with the increase in grid density, the distribution of the velocity field gradually changes, and the theoretically calculated tangential velocity distribution for the rotating disk at different radial positions has been provided as a comparison. The disk rotational velocity refers to the disk surface (z = 0 mm), while the liquid-phase tangential velocities are taken at z = 0.1 mm. It can be seen that there is a small difference between the theoretical calculation and the simulation results. Although increasing grid density helps enhance the accuracy of simulations, it also leads to an increase in computational workload. Taking both the accuracy of simulation results and computational cost into account, 12,754 grids were selected for subsequent simulation work.
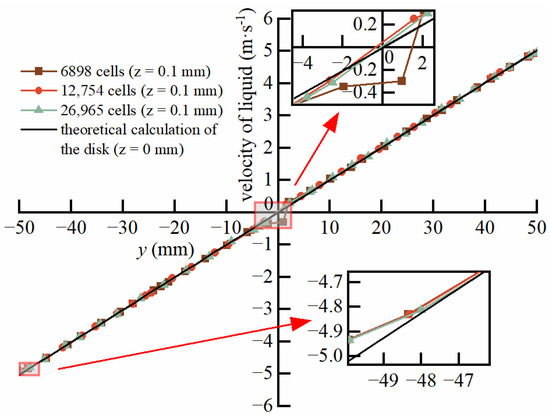
Figure 2.
Velocity distribution of liquid under different grid numbers at monitoring position.
2.2. Mathematical Model
There are three phases present in the computational domain: gas, liquid, and solid. It is difficult to get rid of the gas phase in real operating conditions, even though it plays a less significant role than the liquid phase and solid particles. More importantly, the gas–liquid interaction especially the interphase drag force may affect the flow behaviors of the jet flow that comes from the nozzle. This cannot be ignored as the diameter/range of the jet decides the initial contact area on the rotating disk and hence the diameter of the hydraulic jump if any. These belong to the so-called non-machining area discussed in Section 4.1, which is also an important parameter of the disk when it is used as a grinding tool. Therefore, the simulation is carried out by coupling the multiphase flow model with the discrete phase model. It is assumed that the fluid under study is adiabatic and the energy equation is not included in the simulation. The following section provides a detailed introduction to the basic principles of these models and their corresponding equations.
2.2.1. Multiphase Flow Model
In the present work, an Euler–Euler–Lagrange approach [27] is employed to model the three-dimensional, transient, multiphase flow. The liquid film flow on the rotating disk is considered as the primary Eulerian phase and the surrounding air in the computation domain is considered as the secondary phase. The motion of the abrasive particles is tracked under a one-way coupled Lagrange framework. The mass and momentum conservations are given by Equations (1) and (2), respectively:
where u is the velocity vector of the fluid phase, ρ is the fluid density, g is the gravitational acceleration, and τ is the stress tensor. The volume fraction αk represents the kth phase (k = 1, 2), and the sum of the phase must be satisfied:
The interphase forces F encompass various effects of forces, including but not limited to drag and lift forces [28]. The liquid-phase flow is considered as the continuous phase, which forms a jet flow when it comes out from the nozzle. At this stage, the gas–liquid interaction mainly occurs at the boundary layer of the jet as not many gas bubbles are blended into the liquid phase. This may lead to changes in the boundaries of the jet while the core is mainly affected by the drag force. As the liquid jet contacts with the rotating disk, the liquid film is quickly formed and the flow behaviors are much affected by the motion of the disk. Therefore, only the drag force was considered by making simplifications. The drag force can be described by the following Schiller–Naumann:
where CD is the drag force coefficient, which can be calculated as follows:
and Rer is the relative Reynolds number for the primary phase and secondary phase, which is obtained as follows:
where up is the velocity of the primary phase, us is the velocity of the secondary phase, db is the droplet diameter, ρs is the density of the secondary phase, and μs is the viscosity of the secondary phase.
2.2.2. Discrete Phase Model
The motion of abrasive particles is predicted by the discrete phase model (DPM) method [29], which is calculated in a Lagrange reference frame. According to Newton’s second law, the motion of particles is controlled as follows:
where up is the velocity vector of the particle, m is the quality of the particle, ρp is the density of the particle, dp is the diameter of the particle, and Vp is the volume of the particle. FG, FF, and Fd are the gravity, buoyancy, and drag force acting on the abrasive particle, respectively. Faf refers to the additional forces, with typical forces including the pressure gradient force, the virtual mass force, the Basset force, the Saffman force, and others. Throughout the entire motion process, the abrasive particles are treated as spherical rigid bodies. In this study, emphasis was placed on analyzing the influences of gravity, buoyancy, drag force, and the centrifugal force generated by rotational motion on the abrasive particles.
Fd is the drag force acting on the abrasive particles, which can be calculated using the following equation:
where is the velocity of the liquid, and is the drag force coefficient, which can be calculated as follows:
where δ1, δ2, and δ3 are constants. Morsi and Alexander [30] provide values for these constants within different Reynolds number ranges.
2.2.3. Viscous Model
When numerically simulating the distribution of diamonds driven by the liquid film on the surface of a rotating disk, the flow state of the liquid film on the rotating disk surface often depends on the rotational Reynolds number. Under normal circumstances, the rotational Reynolds number for laminar flow typically does not exceed 150,000 [31], which was calculated as follows:
where represents the rotational Reynolds number, ω is the angular velocity of the rotating disk, R is the radial distance from the measured point to the center of the disk, and and μ are the density and viscosity of the liquid.
By substituting relevant physical parameters into Equation (12), the calculated Reynolds number ranges from 50 to 49,074, and the flow was assumed to be laminar throughout the simulation. However, this determination is not absolute because variations in the height of the liquid film may affect the flow characteristics. To accurately determine the flow state, the best approach is through experimental validation. Assuming that the liquid film flow remains in an approximately steady state, there is no significant fluctuation or only minor fluctuations at the edge of the disk. Therefore, the laminar model is used. Also considering the incompressible nature of the liquid-phase fluid, the viscous term in the Navier–Stokes equation can be simplified as follows:
2.3. Boundary Conditions and Simulation Details
The liquid inlet is positioned 90 mm above the disk. Since the liquid is incompressible, velocity inlet boundary conditions are applied. The abrasive phase is solved using DPM. The running time for the particles is set to 500 s. This duration is sufficiently long compared to the entire simulation process, making it continuous to replenish the particle quantity, thereby ensuring that the volume fraction of particles carried by the liquid remains constant upon entry. In this study, a surface injection source is set at the inlet, with the abrasive type being inert particles. Based on the properties of diamond, the particle density is set to 3520 kg/m3, and the particle diameter is 28 μm.
The disk is set to have a no-slip boundary condition and is assigned an absolute rotational velocity to simulate the actual rotation effect. The boundary in contact with the atmosphere is defined as an open boundary, employing a pressure outlet condition to allow the free outflow of liquid and particles. Due to the presence of a pressure outlet, the operating pressure is set to atmospheric pressure, i.e., 101,325 Pa. Table 1 lists the specific simulated conditions.

Table 1.
Specifications of the simulated conditions.
For all simulated cases, the SIMPLE scheme was used for pressure–velocity coupling, the Least Squares Cell-Based method was selected for the discretization of the gradient term, the pressure was discretized using a second-order scheme, and the first-order upwind method was used for the convective transport of volume fraction and velocity. The solution of all equations employed a first-order upwind implicit method. The convergence criterion was set as 10−5, with a time step of 0.001 s chosen, and 1000 iterations were performed. The calculations were performed on a workstation equipped with 48 physical cores, 31.7 GB of memory, and a clock speed of 2.30 GHz.
3. Experimental Setup and Procedure
Figure 3 shows a schematic of the experimental apparatus. The experimental media were a diamond-resin solution with a 10% mass fraction, and the physical parameters were the same as the simulation as listed in Table 1. The selected light-curing resin is transparent in color and is compatible with a wavelength of 405 nm. Single crystal diamond micro-powder with a particle size of W28 was selected as the abrasive. The solution as the working fluid was mixed in the storage tank by the stirrer and then transported to the nozzle through hoses via a peristaltic pump. The solution entered the disk surface vertically from the central position of the disk through the nozzle. The nozzle with an inner diameter of 4 mm was 70 mm away from the surface of the disk. The disk was made of 304 stainless steel with a diameter of 200 mm and a thickness of 1 mm. The disk was secured by a bracket to the rotating shaft and was driven by a motor through a gear mechanism. As the disk rotated, the solution spread as a film over the disk surface and then reached the edge of the disk. With the continuous rotation of the disk, the solution then left the edge of the disk at a certain velocity, traveled until it impacted the inner wall of the collecting housing, and finally fell to the bottom of the collecting housing. It flowed along the inclined bottom of the collecting housing and was discharged at the outlet into recovering vessels. The UV curing lamp was positioned directly above the rotating disk. After the solution ceased to enter the disk surface, the UV curing lamp started operating to cure the liquid film on the surface of the rotating disk, forming a single layer of cured diamond resin. By repeating the above operation, layer by layer, grinding tools of different thicknesses can be prepared. This study focuses on the research and analysis of grinding tools with only one layer of diamond resin. A high-speed camera (Phantom V2511, AMETEK, Berwyn, PA, USA) with a shooting speed of 1000 pps and a resolution of 1280 × 800 was placed above the rotating disk to observe the flow state of the liquid film on the disk surface. Figure 4 shows the photograph of the experiment setup. As shown in Figure 4, the experimental platform mainly consists of supporting aluminum materials, a rotating disk, a peristaltic pump, a nozzle, an elevating screw mechanism, a guide rail mechanism, and a high-speed camera. The dimensions of the aluminum frame are 540 × 540 × 800 mm.
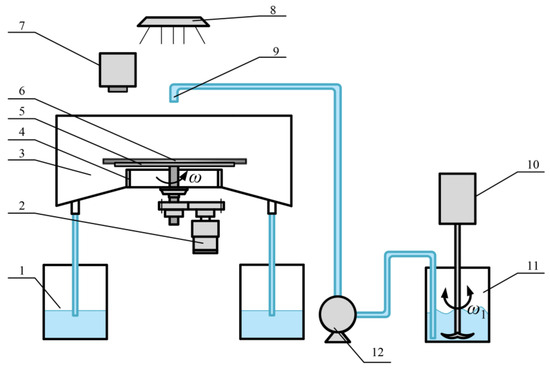
Figure 3.
Schematic diagram of the experimental setup: (1) recovering vessel, (2) motor, (3) collecting housing, (4) shaft case, (5) mounting bracket, (6) rotating disk, (7) high-speed camera, (8) curing light, (9) nozzle, (10) stirrer, (11) storage tank, and (12) peristaltic pump.
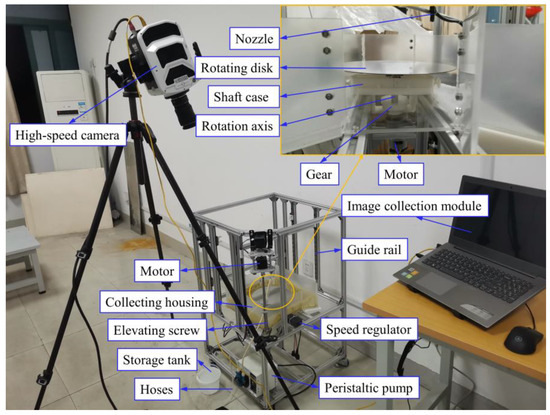
Figure 4.
Photograph of the experimental setup.
4. Analysis Method and Simulation Validation
4.1. Uniformity Evaluation
A grid counting method initially proposed by Christiansen [32] was quoted to assess the distribution characteristics of abrasive particles on the disk surface. This method was used to assess the distribution characteristics of sprinkler water. It is also being applied to describe the distribution characteristics of diamonds, as Chen et al. [33] also used the same formula to evaluate the pattern of distribution. In contrast with the liquid droplet distribution due to the sprinkling spray, the present study focuses on the particle distribution, which comes together with the liquid resin from the nozzle and is driven by the liquid film. In terms of the pattern of distribution, both the droplet distribution due to irrigation by sprinkling and the particle distribution due to jet flow impinging on a disk are considered as dispersed fluid particles, even though the flow types are indeed different. In addition, the purpose of the above two flows is similar, which is to make the pattern of distribution as uniform as possible.
This method quantifies the uniformity of particle distribution by calculating the deviation between the number of particles in each grid region and the average number of particles in the entire observation area, comparing the sum of these deviations to the total number of particles, thus characterizing the distribution characteristics of particles across the entire observation area. The calculation formula is as follows:
In this equation, N is the number of grids, pi is the number of particles in the i-th grid, and is the average number of particles. The expression in Equation (14) is similar to the mathematical formula of the standard deviation . In this case, can be equivalently understood as 1-σ, thus being defined as uniformity. However, rather than the number of particles that deviated from the averaged value, Equation (14) considered a percentage difference by dividing the average particle number, which yields .
A systematic grid partitioning strategy was adopted in this paper. Firstly, along the circumference of the disk, its surface is divided into eight equally spaced concentric circular regions. The width of each concentric circular region is equal, ensuring uniformity in the circumferential partitioning. Next, along the radial direction of the disk, eight line segments are drawn outward from the center point, with the length of each line segment equal to the radius of the disk. By employing both circumferential and radial partitioning, a total of 64 grid cells were obtained, with each grid cell representing a specific region on the surface of the disk, as illustrated in Figure 5a,b.
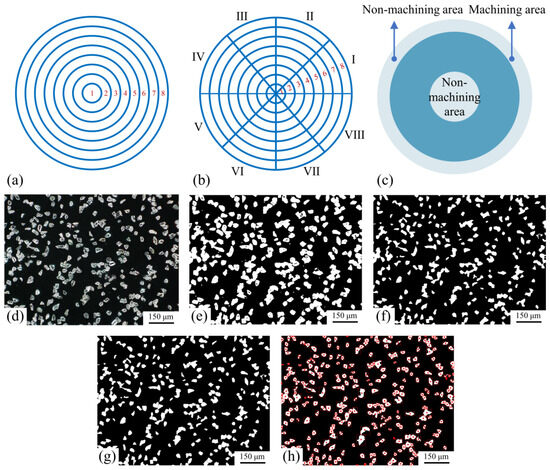
Figure 5.
(a) Circumferential grid division; (b) radial grid division; (c) the division of machining area and non-machining area; (d–h) image processing including original image, binary image, image noise removal, image segmentation, and particle counting.
Considering the actual machining conditions, the surface of the disk was divided into machining and non-machining areas, as shown in Figure 5c. The diameter of the regions measured is within 100 mm, corresponding to the diameters of the eight concentric circular regions divided along the circumference: 12.5 mm, 25 mm, 37.5 mm, 50 mm, 62.5 mm, 75 mm, 87.5 mm, and 100 mm. Combining with Figure 5a,b, it can be observed that the diameter range of the machining area’s concentric circles is from 37.5 mm to 75 mm, corresponding to regions 3 to 6 in the figures.
In the simulation, the coordinates of the abrasive particles are exported to determine whether they are on the disk. Subsequently, the number of particles on the disk or within each region of the disk is further counted. To ensure comparability with simulation data, the selected measurement area during experiments remains consistent with the corresponding area in the simulation model. During the experimental process, three points randomly selected within a single grid cell in the machining area were observed using a three-dimensional video microscope, calculating the total number of abrasive particles at the selected three points. Since the single measurement range of the three-dimensional video microscope is limited, the total number of abrasive particles at three points within a grid cell cannot represent the total number of abrasive particles within the entire grid cell. Therefore, an appropriate adjustment was made to Equation (14) when calculating uniformity, as follows:
where Si represents the area of the i-th grid cell, and denotes the average grid cell area. The formula for calculating the area of a single grid cell is as follows:
where T represents the distance between two concentric circles. Considering the particles fall into different zones and sections with different areas, only taking into account the percentage difference of particles may still not be adequate, e.g., a larger area might have a higher possibility for the particles to be located. Therefore, it is reasonable that we introduced a concept of a number of particles per unit area in Equation (15), to eliminate the influence of different zone areas.
Image processing technologies, which have been widely applied in feature detection [34], were used to count the number of abrasive particles in this case. Figure 5d–h illustrate the image process of binarization, noise removal, image segmentation, and particle counting. Figure 5d shows the original image measured by the KH-8700 three-dimensional video microscope (HIROX, Tokyo, Japan). The original image was globally adaptively binarized using the Otsu algorithm, as shown in Figure 5e. The noise in the image is removed using morphological opening operations to further enhance the image quality, as shown in Figure 5f. After image preprocessing and noise removal, the watershed transformation algorithm was utilized to segment each diamond particle in the image. The segmented image is shown in Figure 5g. Finally, the number of diamond particles in the image is counted, as shown in Figure 5h, with diamond particles marked with red dots.
4.2. Simulation Validation
Figure 6a shows the axial view of the overall model after convergence of the computation under the operating parameters of liquid volume flow rate of 100 mL/min, disk speed of 960 rpm, and liquid viscosity of 250 mPa·s. It displays the 3D trajectories of abrasive particles throughout the entire computational domain. It can be observed that the abrasive particles enter vertically from the nozzle onto the disk surface, with the highest concentration in the central region of the disk, then dispersing in a spiral shape from the center towards the edge of the disk. The direction of rotation of the disk is counterclockwise. Visibly, the spiral direction of the abrasive particles’ movement on the disk surface is opposite to the direction of disk rotation.
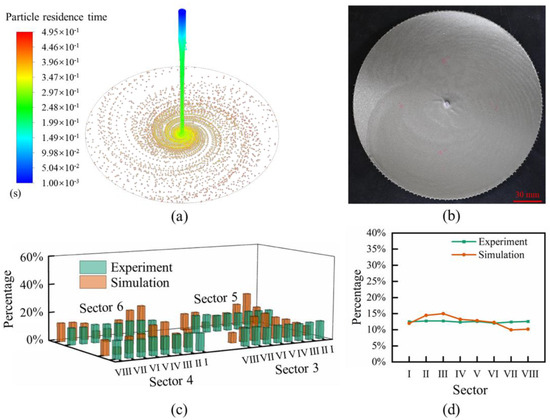
Figure 6.
(a) Simulation analysis of abrasive particle distribution on the disk surface; (b) the abrasive tool with a single cured layer; (c) comparison of simulation and experiment in the radial direction; (d) comparison of simulation and experiment in the circumferential direction.
An abrasive tool with a single cured layer was prepared under the experimental conditions of a liquid volume flow rate of 100 mL/min, disk rotational speed of 960 rpm, and resin viscosity of 250 mPa·s, as shown in Figure 6b. It can be observed that the liquid film on the disk surface spreads in a spiral pattern, opposite to the direction of disk rotation, which is consistent with the simulation results under the same operating conditions.
Comparative analysis of the uniformity of abrasive particle distribution on the disk surface between the simulated model is shown in Figure 6a, and the experimental data obtained from the detection of the abrasive tool with a single cured layer are shown in Figure 6b. The uniform distribution of abrasive particles calculated by the simulation model is 63.66%, and the uniform distribution of abrasive grains measured experimentally is 70.9%. The ratios of the number of abrasives within circumferential sections I~VIII to the total number of abrasives within radial section 3 were calculated for both the simulation and the experiment. The same was achieved for sections 4~6, resulting in the ratio chart shown in Figure 6c. Although the ratio in each zone still varies under the current evaluation frame, the excessive fluctuations in the simulation result are due to the insufficient number of released particles, resulting in an inadequate sample size. If enough particles are released, which requires much more computational resources, it is believed that these fluctuations can be gradually eliminated. However, a coarser comparison can still be made to assess the sensitivity of the simulation result, which is to compare the ratio of particle number in each circumferential section to the total number of particles, as shown in Figure 6d.
5. Results and Discussion
5.1. Influence of Flow Rate
Figure 7a–d depict the distribution of abrasive particles colored by particle residence time under the conditions of a disk rotation speed of 960 rpm and a liquid kinematic viscosity of 250 mPa·s, with liquid volumetric flow rates of 100 mL/min, 200 mL/min, 300 mL/min, and 400 mL/min, respectively. It can be observed from Figure 7a–c that the particle tracks exhibit a spiral distribution on the surface of the disk, with a rotation direction opposite to the rotation direction of the disk. As the flow rate increases, the diffusion speed of abrasive particles on the disk surface accelerates. Notably, in Figure 7d, when the liquid propels the abrasive particles to impact the disk surface, a distinct ejection occurs from the center towards the periphery. The abrasive particles are densely distributed at the center of the disk, forming a unique “fireworks-like” pattern. The reason for the above-mentioned distribution of abrasive particles is that the liquid jet impacts the disk surface, and a liquid film is formed on the surface of the disk. Under the driving force of the liquid film and the centrifugal force and Coriolis force generated by the rotation of the disk, the abrasive particles form a spiral distribution on the disk surface. At a certain rotational speed, the centrifugal force remains constant, while the inertial force acting on the liquid film increases with the increase in flow rate, and the viscous resistance does as well. Under the influence of these forces, especially at higher liquid flow rates, a “fireworks-like” pattern distribution of abrasive particles is formed. Figure 7e shows the variation in the number of abrasive particles on the disk surface over time at different liquid volumetric flow rates. It can be observed that with increasing time, the number of abrasive particles on the disk surface continuously increases. At flow rates of 200 mL/min, 300 mL/min, and 400 mL/min, the number of abrasive particles stabilizes after 0.55 s, 0.45 s, and 0.35 s, respectively. The larger the flow rate, the smoother the increase in the number of abrasive particles on the disk surface, and the fewer abrasive particles in the stable state. At a flow rate of 100 mL/min, the number of abrasive particles shows an increasing trend before 0.5 s, followed by about a 5% decrease (from 7600 to 7200). The decrease can be attributed to the mismatch of the liquid flow rate and the disk rotating speed (e.g., the flow rate is too small while the disk rotates too fast), which leads to fluctuations in the number of diamond particles. As time proceeds, the number of particles may not reach a stable state, but the amplitude of fluctuations can be quite small.
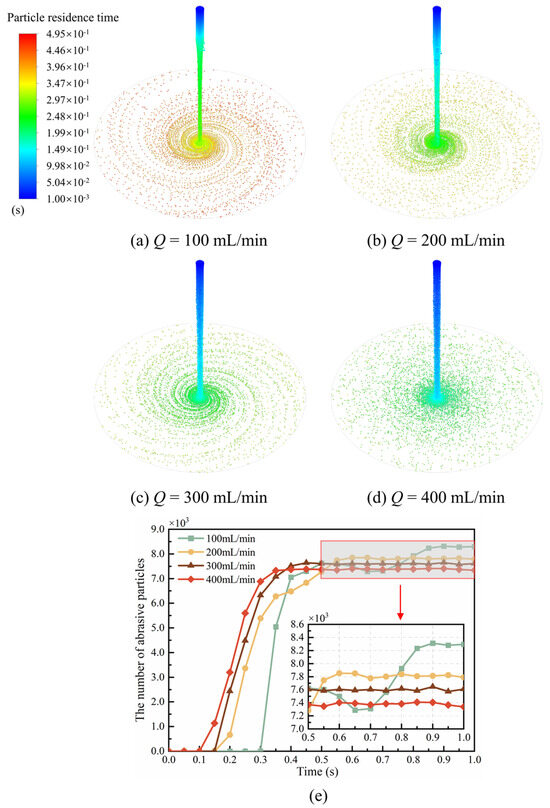
Figure 7.
The distribution (a–d) and the number (e) of abrasive particles on the disk surface under different volume flow rates.
5.2. Influence of Rotational Speed
In Figure 8a–d, a comparison of the distribution of abrasive particles on the disk surface can be made by maintaining a liquid volumetric flow rate of 300 mL/min and a liquid viscosity of 250 mPa·s, with disk rotation speeds of 760 rpm, 860 rpm, 960 rpm, and 1060 rpm, respectively. The observed trajectories of the abrasive particles exhibited a spiral pattern, distributing outward from the center of the disk. As the rotational speed increases, the diffusion speed of abrasive particles on the disk surface accelerates. Near the center of the disk, the dominant influence on the liquid film is the inertial force, leading to a relatively high concentration of abrasive particles in the central region of the disk. With the same operating time, as the rotational speed of the disk increases, the degree of aggregation of abrasive particles in the central region of the disk decreases, showing a decreasing trend in the overall distribution of abrasive particles on the disk surface. As the rotational speed of the disk increases, the velocity of the liquid film enhances correspondingly. Consequently, the number of abrasive particles carried out of the disk by the liquid film increases within the same time frame. Thus, the quantity of abrasive particle distribution on the disk surface decreases. Figure 8e provides a clearer observation that with the increase in rotational speed, the quantity of abrasive particles distributed on the disk surface decreases. Under different disk rotational speeds, the growth trend of abrasive particle quantity on the disk surface remains consistent. A higher disk rotational speed results in a shorter time for the abrasive particle quantity to stabilize. It can be observed that at rotational speeds of 760 rpm, 860 rpm, 960 rpm, and 1060 rpm, the number of abrasive particles stabilizes after 0.5 s, 0.45 s, 0.45 s, and 0.4 s, respectively.
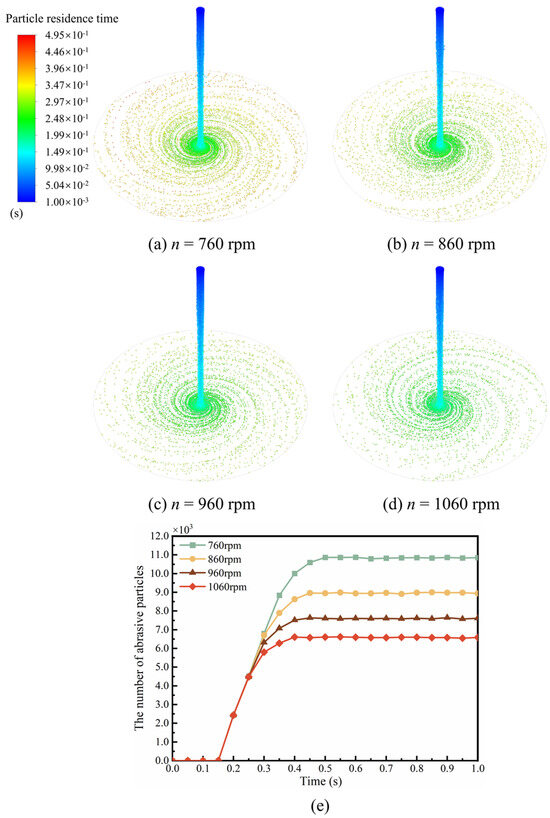
Figure 8.
The distribution (a–d) and the number (e) of abrasive particles on the disk surface under different rotational speeds.
5.3. Influence of Viscosity
As shown in Figure 9a–d, the distribution of abrasive particles on the disk surface was analyzed with a constant liquid volume flow rate of 300 mL/min and a rotational speed of 960 rpm, while the liquid viscosities varied from 50 mPa·s to 350 mPa·s. It can be observed that when the liquid viscosity is low, the abrasive particles exhibit significant ejection in the central region of the disk, forming a “fireworks-like” distribution from the center to the edge of the disk surface, as shown in Figure 9a,b. Increasing the liquid viscosity leads to a transition of abrasive particle distribution on the disk surface from a “fireworks-like” pattern to a spiral shape, as shown in Figure 9c,d. When the viscosity is low, the diffusion rate of abrasive particles on the disc surface is slow. As the viscosity increases, the diffusion rate also increases. Figure 9e shows the number of abrasive particles on the disk surface under different liquid viscosities. It can be observed that viscosity has a minor impact on the distribution of the number of abrasive particles on the disk surface. The number of abrasive particles stabilizes after 0.4 s for all four viscosity conditions, followed by minor fluctuations. The fluctuations are greater with lower viscosities.
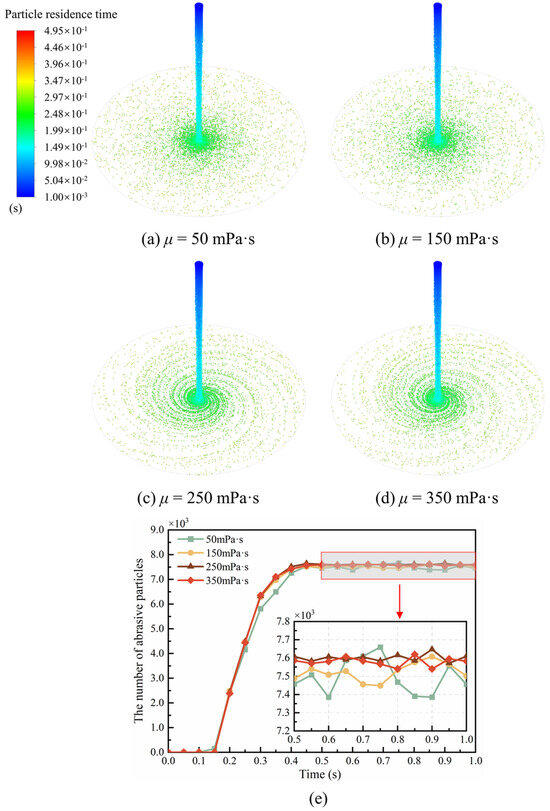
Figure 9.
The distribution (a–d) and the number (e) of abrasive particles on the disk surface under different liquid viscosities.
5.4. Uniformity under Different Operating Parameters
Comparison and analysis of the uniformity of diamond abrasive particle distribution in the processing area under different liquid volume flow rates, different disk rotational speeds, and different liquid viscosities are shown in Figure 10. It can be observed that as the liquid flow rate changes from 100 mL/min to 400 mL/min, the total number of diamond particles in the statistical area remains relatively constant, while the uniformity of particle distribution gradually increases, as shown in Figure 10a. During the process of the disk speed changing from 760 rpm to 1060 rpm, the total number of diamond particles in the statistical area gradually decreases, while the uniformity of particle distribution remains relatively consistent, as shown in Figure 10b. During the process of liquid viscosity changing from 50 mPa·s to 350 mPa·s, the total number of diamond particles in the statistical area initially increases and then decreases, while the uniformity of particle distribution gradually decreases, as shown in Figure 10c. The analysis results indicate that under conditions of higher flow rates, the distribution of abrasive particles on the disk surface can achieve a relatively uniform state. The rotational speed of the disk has a minor impact on the uniformity of abrasive particle distribution on the disk surface, but it does affect the density of abrasive particle distribution. Reducing the viscosity of the liquid facilitates the formation of a more uniform distribution of abrasive particles on the disk. Conversely, increasing the viscosity appropriately helps to enhance the density of abrasive particle distribution on the disk.
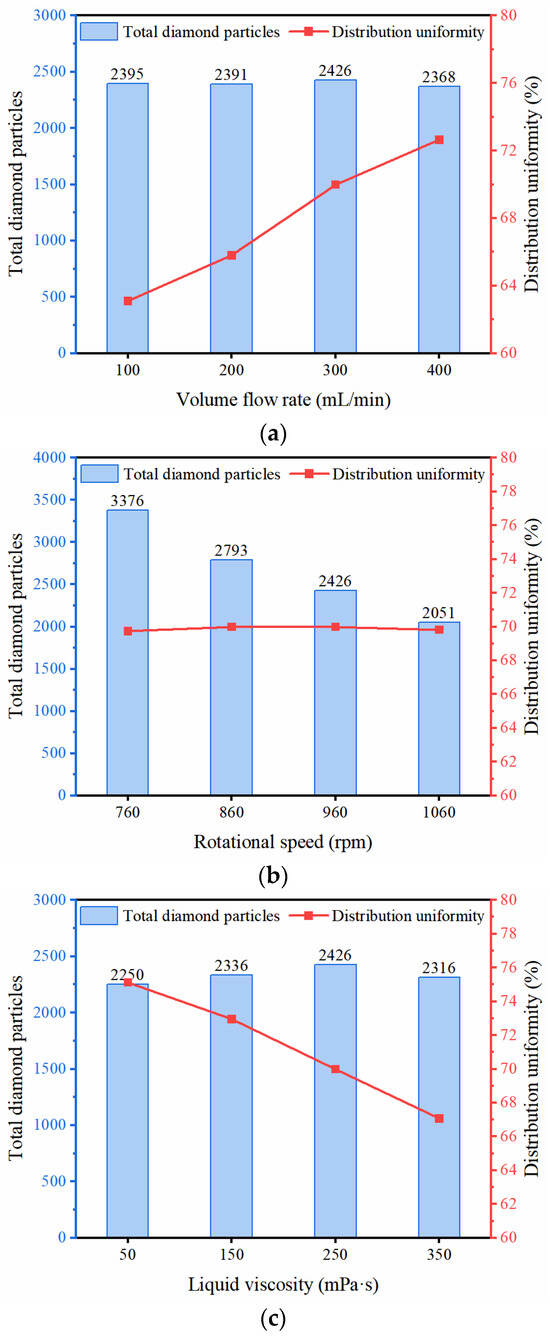
Figure 10.
Distribution uniformity and total number of diamond particles under different (a) liquid volume flow rates, (b) different disk rotational speeds, and (c) different liquid viscosities.
5.5. Orthogonal Simulation to Optimize Operating Parameters
From the above analysis, it is evident that the liquid volume flow rate, the speed of the rotating disk, and the liquid viscosity all have varying degrees of influence on the distribution of abrasive particles on the disk surface. The effects produced by these three factors were examined by means of an orthogonal test, where three different values were taken for each factor, with the factor levels shown in Table 2. The three test factors, liquid volume flow rate, disk speed, and liquid viscosity, are denoted as A, B, and C, respectively.

Table 2.
Orthogonal factor levels.
In the orthogonal test, the factors 100 mL/min, 760 rpm, and 50 mPa·s are excluded. For the liquid volume flow rate 100 mL/min, there are two reasons. Firstly, as shown in Figure 7e, the number of particles remained on the disk surface for 100 mL/min is quite fluctuating. It is believed that this can be attributed to the mismatch of the liquid flow rate and the disk rotating speed. Additionally, as shown in Figure 10a, the distribution uniformity calculated from 100 mL/min is the lowest with the same group of tests, which suggests that it may not be necessary to include this set of tests in the orthogonal test and significantly increase the test scale. For the disk rotational speed of 760 rpm, it seems that the result of the number of total diamond particles is the highest within the same group of tests, as shown in Figure 10b. However, once taking a close look at Figure 8a, the distribution of these particles is much more concentrated at the central region of the disk. Once the diamond particles are light-cured and the disk is used as a grinding tool, the grinding efficiency and effective machining area will also be concentrated in the central region. Therefore, ensuring the surface roughness of the workpiece after grinding is more difficult. For dynamic viscosity of 50 mPa·s, it should be noticed that the viscosity values are actually the viscosities of the liquid–solid mixture phase, which suggests that the amount of solid particles affects the mixture’s viscosity. Compared with the other parameters within this group of tests, the mass fraction that corresponds to 50 mPa·s is the lowest, and the total number of particles that remained on the disk is the lowest, as shown in Figure 10c. Considering the disk with arranged particles is to be used as a grinding or polishing tool, the number of abrasive particles cannot be too little, or the machining efficiency and service life could be significantly affected. Therefore, this set of data has been removed from the orthogonal test.
Parameter settings and simulation analysis were conducted based on the orthogonal test table, and the two-dimensional distribution of abrasives on the disk surface was extracted as shown in Figure 11. It can be observed that, as mentioned above, there is a certain regularity in the distribution of abrasives. Abrasives are more concentrated in the central area of the disk and then spread out in a spiral or “fireworks-like” pattern on the disk surface. The uniformity of distribution under each parameter is statistically recorded, and the results are listed in Table 3.
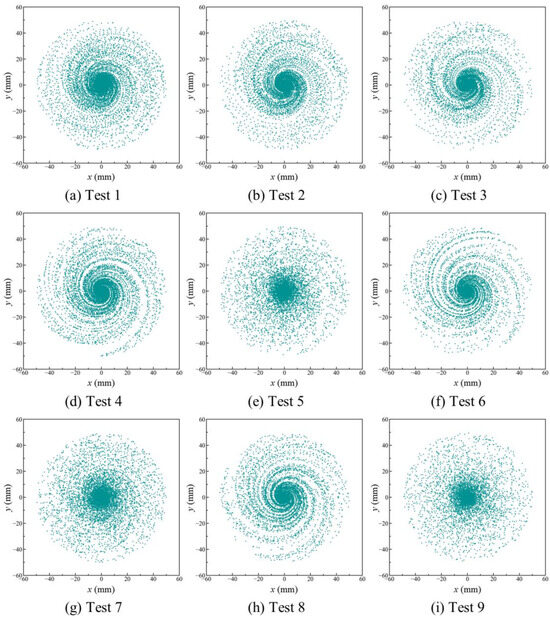
Figure 11.
Orthogonal simulation of abrasive particles’ distribution on the disk surface (top view extracted from 3D simulations).

Table 3.
Orthogonal test results.
The analysis started with factor A, which represents the effect of liquid volume flow rate on the test indicators. Here, A1 denotes the 1 level of factor A and so forth for the subsequent levels. As can be seen from Table 3, tests numbered 1, 2, and 3 reflect the influence of A1, tests numbered 4, 5, and 6 reflect the influence of A2, and tests numbered 7, 8, and 9 reflect the influence of A3, where y denotes the uniformity of abrasive distribution in the machining area on the disk surface. Columns without factors or interactions are referred to as blank columns. The fluctuations in the test results of blank columns can be regarded as test errors. If the range of the blank column is greater than the ranges of all other factors, it suggests that there may be significant interactions between the factors or that other important factors affecting the test results have been omitted. It should be noted that blank columns do not affect the test design.
The analysis of the effects of A, B, and C on the test indicators is presented in Table 4, where Kj (j = 1, 2, or 3) is the sum of the corresponding test results at a certain level. kj represents the arithmetic mean of Kj. R represents the range, which can be calculated in any column by Equation (17):

Table 4.
Influence analysis of indicators.
The sum of the experimental results corresponding to A1 is denoted by K1 and is calculated as 69.69 + 65.81 + 63.89 = 199.39, then k1 is 66.46. The sum corresponding to A2, denoted as K2, is calculated as 70.53 + 72.95 + 69.82 = 213.30, then k2 is 71.10. The sum corresponding to A3, denoted as K3, is calculated as 71.06 + 70.20 + 73.37 = 214.63, then k3 is 71.54. Range RA is calculated as 71.54 − 66.46 = 5.08. Similarly, corresponding calculations and analyses are conducted for factors B and C.
It can be observed from Table 4 that the ranges are unequal, with RA > RC > RB, indicating that the variations in the levels of each factor have different degrees of impact on the test results. The larger the range, the greater the variation in the test indicators in the numerical values, which is caused by the change in the values of the factors in that column within the test scope. So that the column with the largest range is also the factor with the greatest impact on the test results. Therefore, the liquid volume flow rate corresponding to factor A is the primary influencing factor, and the range of the blank column is smaller than the ranges of all other factors, indicating that there are no significant interactions between the factors and that the three factors considered are relatively comprehensive.
According to the characteristics of orthogonal tests, for factors A, B, and C, the influence of each factor on the test results at different level settings can be evaluated independently. If factor A has no effect on the results of the test, then the values of K1, K2, and K3 obtained at different levels, namely conditions A1, A2, and A3, should be equal. However, the actual calculation results show that the values of K1, K2, and K3 are not equal, indicating that the variation in the levels of factor A has an impact on the test results. By comparing the specific values of K1, K2, and K3, the degree of influence of factor A on the test indicators can be assessed. This test indicator refers to the uniformity of abrasive particles in the machining area on the surface of the disk. The greater the uniformity, the more favorable the result of the test. Thus, based on the order K3 > K2 > K1, it can be determined that A3 is the optimal level of factor A.
Similarly, the optimal levels for factors B and C are B1 and C1, respectively. The optimal combination of the three factors in this test is A3B1C1, indicating that the liquid volume flow rate is 400 mL/min, the disk rotational speed is 860 rpm, and the liquid viscosity is 150 mPa·s, resulting in the best uniformity of abrasive distribution on the disk surface in the machining area. A simulation was conducted using the optimal level combination, as shown in Figure 12a. The calculated uniformity of abrasive distribution in the machining area was 75.36%. This compared to a uniformity of 63.89% for Test 3 as shown in Figure 12b, indicating an increase in uniformity of 11.47%. This may not seem to be a significant number for the uniformity improvement. However, the pattern of particle distribution has obviously changed. The abrasive particle distribution pattern at the optimal level resembles a “firework” shape, while the distribution pattern with poorer uniformity appears spiral. These phenomena suggest that the statistical method of using only one parameter to evaluate the uniformity may not be able to reflect the detailed changes of the particle distributions, especially under the driving media of the liquid film flow. In this case, a more comprehensive method to evaluate the abrasive particle distribution is required in future studies.
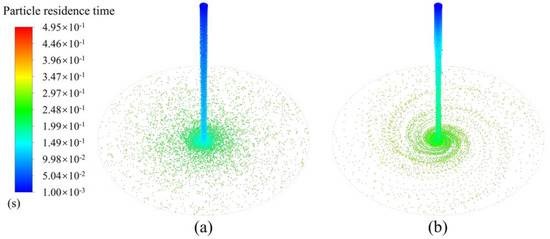
Figure 12.
Simulation analysis of (a) the optimal level combination of A3B3C1 and (b) Test 3 combination of A1B3C3.
6. Conclusions
An Euler–Euler–Lagrange model was applied to simulate the distribution of abrasive particles driven by the liquid film on the rotating disk surface. A device based on the rotating disk system was designed and constructed, and comparative validation of simulation and experimental results was performed using image processing techniques. Based on the current study, the main conclusions are as follows:
(1) The grinding tools with uniformly distributed abrasives can be obtained based on the liquid film generated by the rotating disk system. The distribution patterns of abrasive particles on the disk surface are mainly spiral and fireworks-shaped.
(2) In general, the abrasive particles are more concentrated in the vicinity of the disk center and move against the direction of disk rotation. As time proceeds, the abrasive particles gradually spread to the entire disk surface, and the number of abrasive grains on the disk surface initially increases and then stabilizes.
(3) Establishing a three-factor, three-level orthogonal test table, the changes in distribution uniformity under nine test conditions were compared. It was found that the liquid volume flow rate had the greatest influence on the uniformity of abrasive particle distribution, followed by liquid viscosity, while the rotational speed of the disk had the least impact. At the same time, the optimal combination of the three factors was found to be a liquid volume flow rate of 400 mL/min, disk rotational speed of 860 rpm, and liquid viscosity of 150 mPa·s. Compared with the statically calculated result at the liquid volume flow rate of 200 mL/min, disk rotational speed of 1060 rpm, and liquid viscosity of 350 mPa·s, the optimized uniformity has increased by 11.47%. Although the improvement of uniformity is not a significant number, it is worth noticing that the pattern of particle distribution has been altered obviously.
Author Contributions
Conceptualization, Q.F., W.S. and N.D.; methodology, Q.F. and W.S.; software, Q.F.; validation, Q.F.; formal analysis, Q.F. and W.S.; investigation, Q.F.; resources, W.S., N.D. and H.H.; data curation, Q.F.; writing—original draft preparation, Q.F.; writing—review and editing, W.S., N.D., H.H. and Y.Z.; visualization, N.D.; supervision, W.S.; project administration, W.S.; funding acquisition, W.S. All authors have read and agreed to the published version of the manuscript.
Funding
This research was funded by the Natural Science Foundation of Fujian Province (2021J01296, 2022J01111551) and the Promotion Program for Yong and Middle-aged Teacher in Science and Technology Research of Huaqiao University (ZQN-1105).
Data Availability Statement
The data that support the findings of this study are available from the corresponding author, W.B.S. (Weibin Shi), upon reasonable request.
Conflicts of Interest
The authors declare no conflicts of interest.
References
- Lin, B.; Zhou, K.; Guo, J.; Liu, Q.Y.; Wang, W.J. Influence of Grinding Parameters on Surface Temperature and Burn Behaviors of Grinding Rail. Tribol. Int. 2018, 122, 151–162. [Google Scholar] [CrossRef]
- Zhao, B.; Wang, X.; Ding, W.; Wang, Y.; Fu, Y.; Zhao, Y.; Zhu, J. Grain Erosion Wear Properties and Grinding Performance of Porous Aggregated Cubic Boron Nitride Abrasive Wheels. Chin. J. Aeronaut. 2023, 36, 446–459. [Google Scholar] [CrossRef]
- He, Y.; Xiao, G.; Zhu, S.; Liu, G.; Liu, Z.; Deng, Z. Surface Formation in Laser-Assisted Grinding High-Strength Alloys. Int. J. Mach. Tools Manuf. 2023, 186, 104002. [Google Scholar] [CrossRef]
- Xiao, G.; Zhang, Y.; Zhu, B.; Gao, H.; Huang, Y.; Zhou, K. Wear Behavior of Alumina Abrasive Belt and Its Effect on Surface Integrity of Titanium Alloy during Conventional and Creep-Feed Grinding. Wear 2023, 514–515, 204581. [Google Scholar] [CrossRef]
- Zhao, Z.; Qian, N.; Ding, W.; Wang, Y.; Fu, Y. Profile Grinding of DZ125 Nickel-Based Superalloy: Grinding Heat, Temperature Field, and Surface Quality. J. Manuf. Process. 2020, 57, 10–22. [Google Scholar] [CrossRef]
- Dang, J.; Zang, H.; An, Q.; Ming, W.; Chen, M. Feasibility Study of Creep Feed Grinding of 300M Steel with Zirconium Corundum Wheel. Chin. J. Aeronaut. 2022, 35, 565–578. [Google Scholar] [CrossRef]
- Yin, Y.; Chen, M. Analysis of Grindability and Surface Integrity in Creep−Feed Grinding of High−Strength Steels. Materials 2024, 17, 1784. [Google Scholar] [CrossRef] [PubMed]
- Peng, R.; Liu, K.; Tong, J.; Tang, X. Performance of the Internal-Cooling Grooved Grinding Wheel with Patterned Abrasives. Int. J. Adv. Manuf. Technol. 2020, 106, 1633–1644. [Google Scholar] [CrossRef]
- Herzenstiel, P.; Aurich, J.C. CBN-Grinding Wheel with a Defined Grain Pattern—Extensive Numerical and Experimental Studies. Mach. Sci. Technol. 2010, 14, 301–322. [Google Scholar] [CrossRef]
- Ding, W.; Dai, C.; Yu, T.; Xu, J.; Fu, Y. Grinding Performance of Textured Monolayer CBN Wheels: Undeformed Chip Thickness Nonuniformity Modeling and Ground Surface Topography Prediction. Int. J. Mach. Tools Manuf. 2017, 122, 66–80. [Google Scholar] [CrossRef]
- Denkena, B.; Grove, T.; Göttsching, T. Grinding with Patterned Grinding Wheels. CIRP J. Manuf. Sci. Technol. 2015, 8, 12–21. [Google Scholar] [CrossRef]
- Fang, C.; Zhao, Z.; Lu, L.; Lin, Y. Influence of Fixed Abrasive Configuration on the Polishing Process of Silicon Wafers. Int. J. Adv. Manuf. Technol. 2017, 88, 575–584. [Google Scholar] [CrossRef]
- Wen, D.; Qi, H.; Ma, L.; Lu, C.; Li, G. Kinematics and Trajectory Analysis of the Fixed Abrasive Lapping Process in Machining of Interdigitated Micro-Channels on Bipolar Plates. Precis. Eng. 2016, 44, 192–202. [Google Scholar] [CrossRef]
- Chen, Z.; Zhang, X.; Wen, D.; Li, S.; Wang, X.; Gan, L.; Rong, X. Improved Grinding Performance of SiC Using an Innovative Bionic Vein-like Structured Grinding Wheel Optimized by Hydrodynamics. J. Manuf. Process. 2023, 101, 195–207. [Google Scholar] [CrossRef]
- Sung, C.M. Brazed Diamond Tools by Infiltration 2000. U.S. Patent US006039641A, 21 March 2000. [Google Scholar]
- Zhu, Y.; Hou, Z.; Huang, Z.; Li, B.; Zhang, Z.; Xu, J.; Ding, W. Study on Morphology Reconstruction of SiC Ceramics Ground by Monolayer-Patterned Grinding Wheel Considering Strain Rate Effect. Int. J. Adv. Manuf. Technol. 2024, 130, 2675–2686. [Google Scholar] [CrossRef]
- Wu, S.; Zhang, F.; Ni, Y.; Chen, F.; Yan, Z. Grinding of Alumina Ceramic with Microtextured Brazed Diamond End Grinding Wheels. Ceram. Int. 2020, 46, 19767–19784. [Google Scholar] [CrossRef] [PubMed]
- Yin, S.H.; Chen, F.J.; Yu, J.W.; Wang, M. A Novel Orderly Arrangement Method Controlled by Magnetic Field for Diamond Abrasives of Grinding Wheel. Adv. Mater. Res. 2012, 497, 6–9. [Google Scholar] [CrossRef]
- González, M.; Rodríguez, A.; Pereira, O.; de Lacalle, L.N.L. Surface Roughness Evaluation When Brushing Heat-Resistant Alloy Components. Int. J. Adv. Manuf. Technol. 2024. [Google Scholar] [CrossRef]
- Li, X.; Wang, C.; Tian, C.; Fu, S.; Rong, Y.; Wang, L. Digital Design and Performance Evaluation of Porous Metal-Bonded Grinding Wheels Based on Minimal Surface and 3D Printing. Mater. Des. 2021, 203, 109556. [Google Scholar] [CrossRef]
- Qiu, Y.; Huang, H. Research on the Fabrication and Grinding Performance of 3-Dimensional Controllable Abrasive Arrangement Wheels. Int. J. Adv. Manuf. Technol. 2019, 104, 1839–1853. [Google Scholar] [CrossRef]
- Li, M.; Huang, Y.; Wang, W.; Yan, S.; Liu, Y.; Zou, L. A Novel 3D Printed Compliant Ball-End Grinding Tool with Crystal Structure: Feasibility and Performance Analysis. Mater. Des. 2024, 237, 112591. [Google Scholar] [CrossRef]
- Aoune, A.; Ramshaw, C. Process Intensification: Heat and Mass Transfer Characteristics of Liquid Films on Rotating Discs. Int. J. Heat Mass Transf. 1999, 42, 2543–2556. [Google Scholar] [CrossRef]
- Wang, D.; Jin, H.; Ling, X.; Peng, H.; Yu, J.; Cui, Z. Regulation of Velocity Zoning Behaviour and Hydraulic Jump of Impinging Jet Flow on a Spinning Disk Reactor. Chem. Eng. J. 2020, 390, 124392. [Google Scholar] [CrossRef]
- Sharma, K.; Vijay, N.; Mabood, F.; Badruddin, I.A. Numerical Simulation of Heat and Mass Transfer in Magnetic Nanofluid Flow by a Rotating Disk with Variable Fluid Properties. Int. Commun. Heat Mass Transf. 2022, 133, 105977. [Google Scholar] [CrossRef]
- Leshev, I.; Peev, G. Film Flow on a Horizontal Rotating Disk. Chem. Eng. Process. Process Intensif. 2003, 42, 925–929. [Google Scholar] [CrossRef]
- Fluent, A.N. Eulerian Model Theory. In ANSYS Fluent Theory Guide; ANSYS Inc.: Canonsburg, PA, USA, 2020. [Google Scholar]
- Naeeni, S.K.; Pakzad, L. Droplet Size Distribution and Mixing Hydrodynamics in a Liquid–Liquid Stirred Tank by CFD Modeling. Int. J. Multiph. Flow 2019, 120, 103100. [Google Scholar] [CrossRef]
- Cundall, P.A.; Strack, O.D.L. A Discrete Numerical Model for Granular Assemblies. Geotechnique 1979, 29, 47–65. [Google Scholar] [CrossRef]
- Morsi, S.A.; Alexander, A.J. An Investigation of Particle Trajectories in Two-Phase Flow Systems. J. Fluid Mech. 1972, 55, 193. [Google Scholar] [CrossRef]
- Soma, T.; Katayama, T.; Tanimoto, J.; Saito, Y.; Matsushita, Y.; Aoki, H.; Nakai, D.; Kitamura, G.; Miura, M.; Asakawa, T.; et al. Liquid Film Flow on a High Speed Rotary Bell-Cup Atomizer. Int. J. Multiph. Flow 2015, 70, 96–103. [Google Scholar] [CrossRef]
- Christiansen, J.E. Irrigation by Sprinkling; University of California, Agricultural Experiment Station: Berkeley, CA, USA, 1942. [Google Scholar]
- Chen, F.; Zhang, L.; Yin, S.; Huang, S.; Tang, Q. Study on Distribution Characteristics of Diamond Particles under High-Voltage Electrostatic Field. Int. J. Adv. Manuf. Technol. 2018, 96, 1393–1401. [Google Scholar] [CrossRef]
- González, M.; Rodríguez, A.; López-Saratxaga, U.; Pereira, O.; López De Lacalle, L.N. Adaptive Edge Finishing Process on Distorted Features through Robot-Assisted Computer Vision. J. Manuf. Syst. 2024, 74, 41–54. [Google Scholar] [CrossRef]
Disclaimer/Publisher’s Note: The statements, opinions and data contained in all publications are solely those of the individual author(s) and contributor(s) and not of MDPI and/or the editor(s). MDPI and/or the editor(s) disclaim responsibility for any injury to people or property resulting from any ideas, methods, instructions or products referred to in the content. |
© 2024 by the authors. Licensee MDPI, Basel, Switzerland. This article is an open access article distributed under the terms and conditions of the Creative Commons Attribution (CC BY) license (https://creativecommons.org/licenses/by/4.0/).