Abstract
In soft robotics, the most used actuators are soft pneumatic actuators because of their simplicity, cost-effectiveness, and safety. However, pneumatic actuation is also disadvantageous because of the strong non-linearities associated with using a compressible fluid. The identification of analytical models is often complex, and finite element analyses are preferred to evaluate deformation and tension states, which are computationally onerous. Alternatively, artificial intelligence algorithms can be used to follow model-free and data-driven approaches to avoid modeling complexity. In this work, however, the response surface methodology was adopted to identify a predictive model of the bending angle for soft pneumatic joints through geometric and functional parameters. The factorial plan was scheduled based on the design of the experiment, minimizing the number of tests needed and saving materials and time. Finally, a bio-inspired application of the identified model is proposed by designing the soft joints and making an actuator that replicates the movements of the scorpion’s tail in the attack position. The model was validated with two external reinforcements to achieve the same final deformation at different feeding pressures. The average absolute errors between predicted and experimental bending angles for I and II reinforcement allowed the identified model to be verified.
1. Introduction
Collaborative [1] and soft robotics [2] are some of the new frontiers of robotics. The first one expects a shared workspace in the human–robot interaction using appropriately sense-directed collaborative robots (cobots) to limit damage in case of collisions with human operators. To improve and make human–robot interaction safer, cobots are often integrated with path planning and collision avoidance algorithms [3,4]. Moreover, it is possible to change the robot’s trajectory according to the operator’s movements or at levels of attention [5] without stopping the robot and avoiding unnecessary downtime. Soft robotics has attracted considerable interest in the robotics community due to the versatility and adaptability of soft actuators, even in unstructured environments [6]. The use of soft and easily deformable materials [7] allows the realization of actuators [8] and bio-inspired epithelial tissues [9]. The first ones can be adopted as gripping devices for delicate objects [10] and as bio-inspired sustaining limbs [11,12]. Soft actuators have also been adopted as end-effectors of cobots [13] to improve their safety.
Pneumatic actuation is the most used, as evidenced by the widespread use of deformable soft pneumatic actuators (SPAs). Specifically, compressed air ensures simplicity, cost-effectiveness, and safety. The deformation of these actuators can be guided by geometric asymmetries [14,15] or external reinforcement [16,17,18]. They are often employed in gripping systems inspired by single human fingers [19] or whole anthropomorphic hands [20]. However, using a compressible fluid also involves non-linearities that complicate the identification of analytical models [21]. These difficulties are also due to slippage between reinforcement and silicone tubing, friction, or the visco-elastic behavior of the rubbers themselves.
The solution is to employ software for finite element analyses (FEAs) to simulate their behavior and evaluate deformation and tension states. It is possible to run static structural simulations [22], with constant and uniform application of pressure to the surfaces, or transient simulations with fluid–structure interaction that are more accurate but also computationally more onerous [23]. Regardless of the type of approach, a calculator is required, and the time is consistent.
An alternative is machine learning algorithms [24] that allow a model-free approach by creating correlations between given stimuli (input) and observed effects (output) [25]. According to this data-driven strategy, predicting the output based on new inputs not employed in the training phase will be possible. Despite the potential of these techniques, there is still a need for performance calculators and appropriately constructed datasets.
Another possible strategy is the response surface methodology (RSM) [26]. It expects a design of experiment (DOE) for tests to be performed, the so-called factorial plan. A predictive model is identified by testing, measuring, and analyzing the responses (output of interest). It is possible to choose the number and type of tests to set the order of the model, whether multi-linear or higher. RSM enables not only the identification of a model but also the quantification of the effects of the chosen factors and their hidden interactions. It also makes it possible to reduce the number of factors by considering only the significant ones and neglecting the less important ones. All is done with a targeted testing campaign to limit the use of material and time resources.
This work presents the design methodology based on RSM, the achievement of a design-predictive model, and the prototyping and characterization of a novel externally underactuated reinforced SPA with the model validation. The actuator is made of an inner tube in silicone rubber and an external reinforcement in thermoplastic polyurethane (TPU), whose joints are obtained by 3D-printed cuts. In detail, the work presents the identification of a predictive model of the bending angle of soft pneumatic joints using RSM. Initially, the planning of tests to be performed with DOE is described, and then how to analyze its response. Finally, a bio-inspired application is reported for the validation of the model. Specifically, a tail of the scorpion species Heterometrus laoticus, known as the Giant Forest Scorpion, is analyzed and reproduced. The model was used to identify the functional and geometric parameters to design the joints of two external reinforcements to replicate its kinematic in the attack position. Although the proposed device is underactuated, the choice of this tail is due to its anatomy and the high number of degrees of freedom, which make it interesting to realize a multi-joint soft prototype.
The following items represent the originality of the work:
- the conceptualization of a novel multi-joint underactuated SPA made of a 3D-printed external reinforcement in TPU;
- the use of the RSM and its description to identify a predictive model of the joint bending angle, according to the chosen functional and geometric factors, to minimize materials and time employed;
- quantification of the effects of each of the chosen factors and their interactions on the bending angle;
- a bio-inspired application to design the soft joints of two different reinforcements to replicate the same configuration of the scorpion’s tail in the attack position, using the identified predictive model.
2. Materials and Methods
The conceived SPA was made of a silicone rubber inner tube, an external TPU reinforcement, a PLA connector, an M5 pneumatic fitting, and a plastic clamp. The reinforcement has a hollow cylindrical geometry with one or more joints realized by cuts. A joint is made by one or more cuts that guide the deformation of the inner tube when it is pressurized. Between two consecutive cuts, there is a full ring of reinforcement. As shown in Figure 1a, the first cut is necessary to apply the plastic clamp to grip the silicone tube on the connector and the gauze itself on the tube. Instead, the hole circled in green only facilitates mounting the reinforcement on the tube.
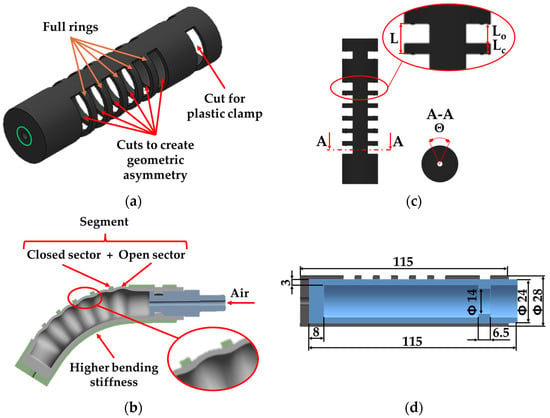
Figure 1.
Details about SPA: (a) external reinforcement with the cuts to create asymmetric geometry (red arrows), full rings (orange arrows), and the hole (green circle); (b) cross-section of an example of bending when the inner tube is pressurized and the deformation along an open sector; (c) most influential factors on bending angle; (d) cross-section of the SPA with its constructive dimensions.
The cut with the following ring of material creates a segment, and more cuts introduce geometric asymmetry of the reinforcement since they are characterized by a length and an angular development, as shown in Figure 1b. Such an asymmetry causes the bending of the SPA. Indeed, the lower side of the reinforcement, indicated in the same figure, shows higher stiffness and thus prevents longitudinal elongation, while the diametrically opposite side of the cuts elongates more.
The most influential factors of the SPA are the feeding pressure (P), the length of the segment (L), the ratio (R) between the open sector length (Lo) and the total length of the segment (L), and the angular closure of the cut (Θ), just as is demonstrated in previous work [10]. In Figure 1c, the main geometric factors of the reinforcement are shown; Figure 1d reports the construction dimensions of the SPA.
Each combination of these factors results in different SPA bending angle behaviors. The latter, in addition to the previously presented non-linearities, make the mechanical design of the actuator difficult. An RSM was used to identify a predictive model and minimize the material and time required. Therefore, a single inner tube with different outer reinforcements was made to evaluate the influence of various parameters on the bending angle. In the following, a description of how the SPA components were made is reported.
The external reinforcement in Figure 2a was prototyped in TPU by a Qidi i-fast 3D printer. The geometry was created in Solid Edge 2024 and then exported to Qidi print slicing software to set the printing parameters. A low printing speed of 40 mm/s and an inner and outer wall speed of 20 mm/s were used with an extruder temperature of 220 °C to avoid warping. The filling percentage was set at 100% according to a concentric configuration. The outer diameter, inner diameter, and reinforcement thickness were set to 28, 24, and 2 mm, respectively. These dimensions ensure strength and assembly with slight interference with the inner tube. The reinforcement has six segments in the central part. Each reinforcement sector has a length, L, equal to the sum of the lengths of the open (Lo) and closed (LC) sectors.
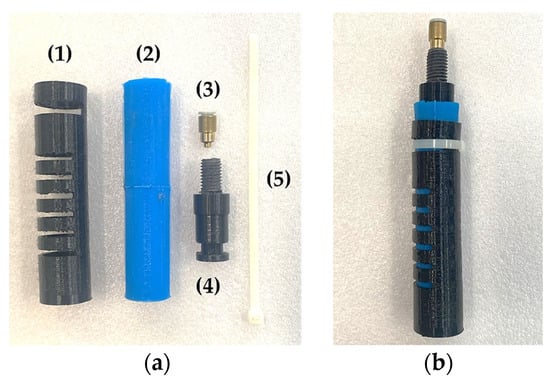
Figure 2.
SPA prototype: (a) overall set of the components (1) external reinforcement; (2) inner tube; (3) pneumatic fitting M5; (4) connector; (5) plastic clamp; (b) assembled configuration.
Thus, it results in:
The open sector to total segment length ratio is defined as segment ratio, R.
Once L and R are fixed, it then results in
Specifically, each cut part of the sector is characterized by a closure angle, Θ. The latter represents the angular development of the TPU closure part of the sector. Indeed, to limit stresses during deformation of the SPA, radii of 0.5 mm were provided at each bottom of the cuts.
The silicone rubber inner tube was injected into a 3D-printed PLA mold. The silicone rubber, after carefully mixing parts A (base) and B (catalyst) of R PRO20 silicone rubber in a 1:1 ratio, was cooled to delay solidification and placed under a vacuum pump (MILLIPORE XF54 230 5, Merck Millipore, Darmstadt, Germany) for air bubble removal; then, it was poured out into the rear chamber of a FESTO DNU63-80PPV-A double-acting cylinder. A lead-screw system mounted in correspondence with the front chamber of the cylinder pushed the piston. It ensures the dosage of the silicone rubber and corresponding flow regularization inside the molds to limit air inclusions. After 3 h at 20 °C, the silicone rubber solidified, removing the prototype from the mold. The operation concluded with the extraction of the core and removal of the silicone burrs. One end of the inner tube was closed; the other was opened to assemble the connector with the air fitting. The inner tube had an external diameter, a length, and a wall thickness equal to 24, 115, and 3 mm, respectively.
The connector for the air inlet/outlet was printed by a 1.75 mm wire diameter of PLA with a layer height of 0.2 mm, a 100% infill, a printing speed of 100 mm/s, an extruder temperature of 210 °C, and the printing plate temperature constant at 60 °C. After inserting the connector, a plastic clamp must be externally applied in correspondence with the undercut to engage in the prominence inside the silicone finger. Finally, an M12 male thread was used for mounting the SPA on a support, and an M5 female thread was used for pneumatic fitting.
An example of the assembled SPA prototype is shown in Figure 2b.
3. Response Surface Methodology
The RSM is a scientific and statistical method for planning, conducting, and analyzing a campaign of experiments [26]. The main advantages of such a methodology are efficiency, minimizing the number of experiments to be performed; reliability, ensuring concrete and reproducible results; optimization, allowing the response under study to be maximized or minimized; quantification of hidden effects and interactions between factors on the response; and finally, identification of a predictive model of dependent variables by manipulating the independent variables.
In this work, the RSM was employed to study the bending angle response of the joint of the designed SPA. The chosen functional and geometric factors and their low and high values are shown in Table 1. Specifically, the following were identified as the most significant parameters: Feeding Pressure (P), Sector Length (L), Ratio Open-Total (R), and Closing Angle (Θ). However, this methodology allows additional factors not initially considered (such as payload) to be considered by integrating with further tests, as explained below.

Table 1.
Functional and geometrical factors with their low and high values.
The SPA works only with positive pressure values. Indeed, under negative pressure values, the inner tube retracts and loses contact with the reinforcement. Still, the tube must expand, and only then can the external reinforcement drive its deformation toward the direction of higher bending stiffness.
At this point, the design of the testing campaign, i.e., the factorial plan, is necessary. DOE is particularly useful when it is desired to examine the behavior of a system concerning independent variables in a specific range [26]. Concerning Equation (5), the number of tests to be performed is equal to the number of factor levels (generally two: low and high) raised by the number of chosen factors :
The designed plan, made of 16 tests relating to four factors with two levels, is shown in Table 2. Both coded (CVs) and uncoded (UVs) values are reported. Regardless of effect values, CVs set the low value at −1 and the high value at +1. Conversely, the UVs are relative to the values of nominal factors, e.g., the effective pressure or the effective segment length. The advantage of switching to CVs is due to the possibility of identifying the relative impact of factors by comparing the factor effects. Indeed, the equation in terms of CVs can be used to predict the response for given levels of each factor. It is possible to move from CV to UV for a generic factor by the following expression:

Table 2.
CVs and UVs of the adopted factorial plan.
On the other hand, it is possible to make the reverse shift, from UV to CV, by Equation (7):
where for the factor x, is the CV, is the average UV, the low UV, and the UV.
In Table 2, the midpoint, namely, test number 17, was added, which is used to validate the identified model. As mentioned, this work aims to evaluate the influence of each factor on the bending angle of the joint of the proposed SPA. DOE makes it possible to minimize the number of tests to be performed and, consequently, the number of TPU reinforcement geometries to be designed and printed. This saves material and time compared to conducting a complete factorial plan. In addition, a predictive model of the bending angle can be directly identified, evaluating the effects of both factors and their interactions. This directly quantifies not only the influences of factors on response but also any interactions that would remain hidden.
The simplest factorial plan that can be used is one that tries to fit the system response with a multi-linear model. In this application, a model is sought that can predict the joint bending angles with linear trends concerning each of the chosen factors. The test mode was set for each planned trial by making the correct external TPU reinforcement or setting the pressure value. For each test, an SPA image in the deformed configuration was captured with a 12-Mpixel camera. The latter was placed 1 m from the SPA to limit perspective effects. Each image was analyzed using MATLAB R2023b software to evaluate the bending angle of the joint. Each of the latter consists of six segments, identified by the same values of P, L, R, and Θ. The bending angle chosen as the actual response of each test is the average of the six values obtained, one for each segment. The 16 tests were re-run three times to give statistical validity to the methodology. A total of 48 tests were performed. Test number 17 is the midpoint used as a checkpoint to verify the error between the angle predicted by the model and the experimental bending angle. Figure 3 shows the results of the SPA deformations for each of the tests conducted.
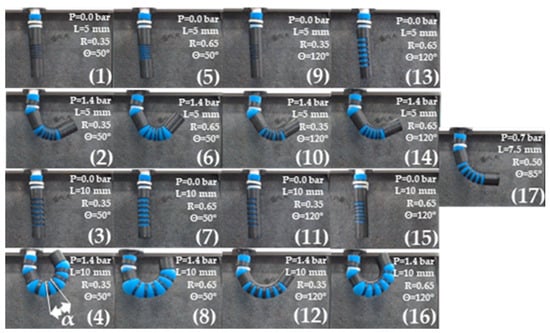
Figure 3.
Deformation states of the tests performed with the UVs in Table 2.
The achieved predictive multi-linear model has the following formulation in CVs:
Specifically, is the predicted bending angle, is the average bending angle (10.5°) of the sixteen performed tests, and E indicates the effects of a factor or an interaction between them. The quantifications of the effects are reported in Figure 4a for the CVs of the factors. The Pareto chart shows that factors P, L, and R have positive effects on the bending angle: an increase in them increases in response. Similarly, Θ has a negative effect: increasing it decreases the sector bending angle. Interactions between the factors P, L, and R have positive effects, while those involving Θ in PΘ, LΘ, and PLΘ have a negative effect. However, some interactions with Θ, such as RΘ, PLΘ, and PLRΘ, have a positive effect on the response. These positive–negative effects for the factor Θ interactions are due to the regression methods that allow the predictive model coefficients (effects) to be calculated. This method minimizes the error made between predicted and experimentally measured angles in the factorial plane tests (tests from 1 to 16). P, L, and their interactions show the highest positive effect, followed by Θ with the highest negative effect. In contrast, among the interactions, it is LR and PLR that show the lowest effect on the bending angle.
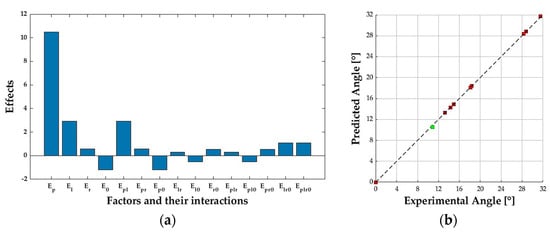
Figure 4.
DOE. (a) Pareto chart about the effects of factors and their interactions; (b) predicted angles vs. experimental angles for the sixteen tests of the factorial plan (red) and the midpoint for the validation (green).
The predicted values and the experimentally measured values of the bending angles of each test are compared in Figure 4b to evaluate the goodness of the model. The closer the points with the predicted values as abscissa and the experimental values as ordinate are to the bisector of the I quadrant, the better the fitting quality. In the same figure, the result from test number 17, in green, validates the identified model. The latter refers to an average value of all factors and is a new combination of the factors levels that was not previously employed for the model identification. Tests were repeated three times: the average value of the bending angle resulted in 10.85°, while the model predicted a value of 10.50°. The absolute error of 0.35° and the relative error of 3.22% were considered acceptable.
The predictive model identified and validated with the midpoint test allows the open and closed sectors to be designed according to the desired bending angle. Figure 5 shows the predictive model results as a function of the P and L factors that mainly influence the bending angle for each combination of the low, medium, and high levels of R and Θ.
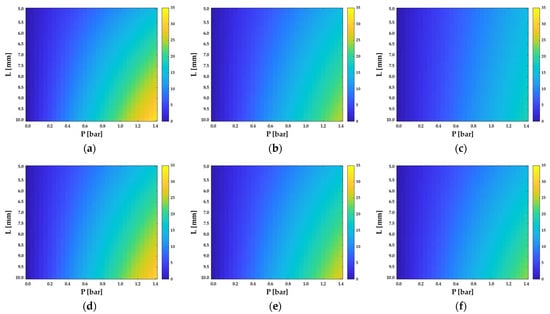

Figure 5.
Bending angle response as a function of P and L, with (a) R and Θ low; (b) R low and Θ medium; (c) R low and Θ high; (d) R medium and Θ low; (e) R and Θ medium; (f) R medium and Θ high; (g) R high and Θ low; (h) R high and Θ medium; (i) R and Θ high.
More open segments make it possible to estimate the total bending angle predicted for a soft joint with Equation (9).
where is the total predicted angle of the SPA, is the predicted angle previously described for the i-segment, and N is the number of segments.
4. Application to a Bio-Inspired Scorpion-Tail-Actuator
The identified model can be used in several contexts where the design of an externally reinforced multi-joint SPA is required to achieve specific bending angles. The identified model was applied to replicate the scorpion tail’s kinematic in the attack position. In detail, the model was used to set the functional and geometric factors to design the joints of two different external reinforcements. The goal was to reach the same final configuration at different feeding pressures.
In the beginning, the physiological dimensions of the segments and the bending angles between them of the tail of the Giant Forest Scorpion were identified. The individuated dimensions were magnified to facilitate prototyping, assembly, and the possibility of designing different reinforcements. Indeed, two different external reinforcements were applied to the inner tube to achieve the same final deformation. Being an under-actuated system, a comparison can only be made on the last position reached between the two prototypes. Moreover, the absolute errors between predicted and experimental angles for each joint at various pressures were evaluated to assess the goodness of the model in a bio-inspired application context.
4.1. Characteristic Dimensions of the Giant Forest Scorpion
Heterometrus laoticus, known as the Giant Forest Scorpion, is one of the two thousand species of scorpion in the world. This arachnid has the head and abdomen condensed in the prosoma, and the mesosome represents the body [27]. From the latter, four pairs of legs are used for locomotion start, while from the prosoma, two limbs are used for defense and grasping objects (Figure 6a). The tail is used both for defensive purposes and to distribute the weight of the body, managing the position of the center of gravity [28,29]. The tail reported in Figure 6b shows how it is made up of five segments of different lengths (from the body to the aculeus: MS1, MS2, MS3, MS4, MS5) with several angles between them (α1, α2, α3, α4, α5). The corresponding kinematic chain is shown in Figure 6c and illustrates that the tail consists of six components (the five tail segments and the scorpion mesosome) interconnected by five hinges.

Figure 6.
Scorpion anatomy: (a) body parts; (b) detail of the dimensions and angles of the tail segments; (c) corresponding kinematic chain of the tail.
The magnified dimensions of a factor equal to 3 used for its reproduction are shown in Table 3 and refer to the average dimensions for an adult male [30]. The latter were scaled up to facilitate the realization of the TPU reinforcement and the silicone tube, testing the effectiveness of the predictive model also for different gauze dimensions.

Table 3.
Adopted kinematic chain values for the scorpion tail in the attack position.
4.2. Comparison between I and II Reinforcement
Two external reinforcements were designed, and 3D printed to show the model’s ability to predict the joint’s bending angle. The dimensions of the latter are to reach the same angles among the segments of the scorpion’s tail in the attack position and have the lengths identified in the previous paragraph. Segment lengths are between the midpoints of the soft joints. In detail, the values of the functional and geometric factors of the joints are reported in Table 4 for the I reinforcement and Table 5 for the II reinforcement. The values of the factors of the five soft joints were identified to achieve the desired angles with a feeding pressure of 1.4 bar by the I reinforcement.

Table 4.
UVs and CVs for the factors of the five soft joints about the I reinforcement.

Table 5.
UVs and CVs for the factors of the five soft joints about the II reinforcement.
Figure 7 shows the kinematic configurations at different pressures until reaching the maximum pressure of 1.4 bar. As the pressure increases, an increase in the bending angles is observed until the last deformation state.
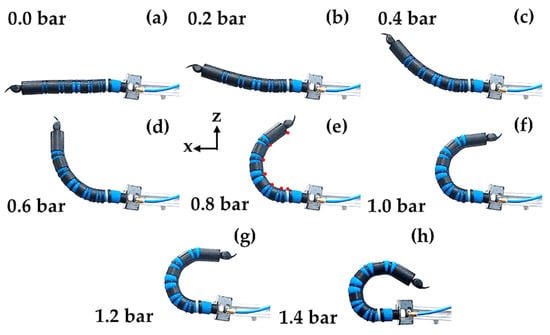
Figure 7.
Kinematic configurations of the tail with I reinforcement at (a) 0.0 bar; (b) 0.2 bar; (c) 0.4 bar; (d) 0.6 bar; (e) 0.8 bar with a detail about the markers’ position (red circle) and the reference system; (f) 1.0 bar; (g) 1.2 bar; (h) 1.4 bar.
For the II reinforcement, however, it was chosen to work with a feeding pressure of 1.2 bar. The factor values are given in Table 5 to arrive at the angle values for the scorpion’s tail. Figure 8 shows the actuator’s kinematic configurations as a pressure function.
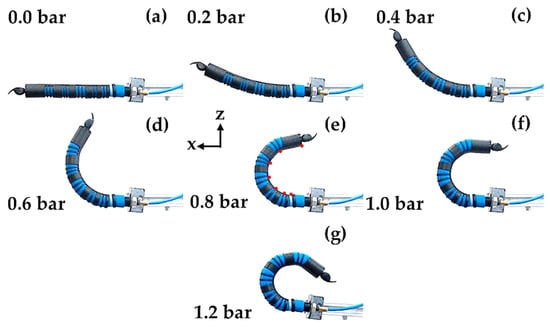
Figure 8.
Kinematic configurations of the tail with II reinforcement at (a) 0.0 bar; (b) 0.2 bar; (c) 0.4 bar; (d) 0.6 bar; (e) 0.8 bar with a detail about the markers’ position (red circle) and the reference system; (f) 1.0 bar; (g) 1.2 bar.
In Figure 9a, there is a comparison between the configurations of the two actuators as a function of pressure. The positions of I reinforcement are shown in a solid line, while those of II reinforcement are shown with a dotted line. Furthermore, the same markers are used to ease reading under the same pressure. As expected, the II reinforcement at the same pressure allows greater bending angles than the I reinforcement. The absolute error, Δα, is evaluated according to the following Equation (10):
where αpre is the predicted angle, and αexp is the experimental angle.
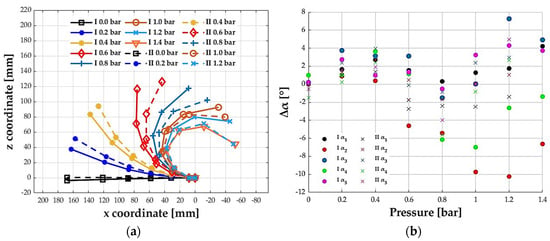
Figure 9.
Kinematic behavior of the actuator: (a) comparison of markers’ position along the x and z axes at different feeding pressures for I and II reinforcement; (b) absolute error between predictive model and experimental results of soft joint bending angles for I reinforcement (circular markers) and II reinforcement (cross markers).
Table 6 summarizes the predicted and experimental bending angles for the five joints with their absolute errors incurred for I and II reinforcement at the pressures of 1.4 bar and 1.2 bar, respectively. Hence, the errors in the final configuration achieved with both reinforcements were evaluated.

Table 6.
Comparison between predicted and experimental bending angles for the five joints with their absolute errors in the final configuration for both reinforcements.
The goodness of prediction of the model is shown, reporting the absolute error in Figure 9b as a function of the pressure for each of the five joints of the actuator for both reinforcements. Circular markers indicate the errors relating to the I reinforcement, and cross markers indicate those relating to the II reinforcement. The maximum absolute error was −10.24° for the second soft joint at 1.2 bar for the I reinforcement and 4.96° for the fifth joint at 1.2 bar for the II reinforcement. These maximum errors are consistent but acceptable if we consider that they were obtained in an open chain, i.e., without a controller and with the identification of a model using RSM with only 16 tests.
The quality of the model can be better understood by evaluating the average absolute error committed at all angles and all test pressures. The latter was 2.92° for I reinforcement and 1.75° for II reinforcement. These errors can be attributed to manual assembly, sliding between reinforcement and inner tube, friction, errors introduced by image analysis, and the higher weight of the two prototypes tested than the previous one used to identify the model.
5. Conclusions
In this work, the RSM was used to identify a predictive model of the bending angle of the designed SPA. The DOE was employed to organize a factorial plan for the tests to be carried out to evaluate the effects of the factors. Each test refers to a specific combination of the functional and geometric factors chosen for the SPA, which characterize a unique reinforcement to be created. It was necessary to validate the predictive model, comparing the predicted angles with the experimental ones for the 16 tests and for a midpoint not used in the previous identification. The model made it possible to quantify the effects of the factors and their interactions, evaluating the impact on the bending angle of each of them. In particular, the pressure and length of the TPU reinforcement segment are the factors that most influence the response.
Finally, the model was used for a bio-inspired application, namely, the reproduction of the tail of the Giant Forest Scorpion. The underactuated SPA can achieve the real configuration for two different external reinforcements designed according to the identified model and allows for the design of the geometry of the reinforcement cuts, managing the feeding pressure. The maximum absolute errors were −10.24° and 4.96° for the I and II reinforcement, respectively, while the average absolute errors on all angles at all test pressures were only 2.92° and 1.75°.
Then, the predictive model was validated, allowing the design of soft multi-joint actuators. The errors can be attributed to manual assembly, sliding between reinforcement and inner tube, friction, errors introduced by image analysis, and the higher weight of the two prototypes tested than the previous one used to identify the model.
The RSM may be employed to identify other predictive models of several kinds of soft actuators, pneumatically or not powered with or without an external reinforcement, with different geometries or characteristics. Improvements to the current RSM can be achieved by including other factors in the model to evaluate, for example, the effects of a payload on the bending angle. In addition, RSM could be used to design factorial plans to run a limited number of FEAs involving high computational cost with an acceptable increase in the error [31]. Alternatively, the identified model may be used to design external reinforcements for SPAs that can replicate the deformation states of other bio-inspired structures, for fingers to grasp and move objects, for limbs to sustain robots, and so on. Finally, the possibility of deformation states in the case of multi-directional bending, such as S-shape or helical, will also be investigated, evaluating the accuracy of the predictive model in these contexts.
Author Contributions
Conceptualization, M.G.A. and N.S.; methodology, M.G.A. and N.S.; software, N.S.; validation, M.G.A., P.B.Z., and N.S.; formal analysis, N.S.; investigation, N.S.; data curation, N.S.; writing—original draft preparation, M.G.A. and N.S.; writing—review and editing, M.G.A., P.B.Z. and N.S.; visualization, P.B.Z. and N.S.; supervision, M.G.A.; project administration, M.G.A. All authors have read and agreed to the published version of the manuscript.
Funding
This research received no external funding.
Data Availability Statement
Data are contained within the article.
Conflicts of Interest
The authors declare no conflicts of interest.
References
- Dzedzickis, A.; Subačiūtė-Žemaitienė, J.; Šutinys, E.; Samukaitė-Bubnienė, U.; Bučinskas, V. Advanced Applications of Industrial Robotics: New Trends and Possibilities. Appl. Sci. 2022, 12, 135. [Google Scholar] [CrossRef]
- Hammond, M.; Cichella, V.; Lamuta, C. Bioinspired Soft Robotics: State of the Art, Challenges, and Future Directions. Curr. Robot. Rep. 2023, 4, 65–80. [Google Scholar] [CrossRef]
- Neri, F.; Forlini, M.; Scoccia, C.; Palmieri, G.; Callegari, M. Experimental Evaluation of Collision Avoidance Techniques for Collaborative Robots. Appl. Sci. 2023, 13, 2944. [Google Scholar] [CrossRef]
- Forlini, M.; Neri, F.; Scoccia, C.; Carbonari, L.; Palmieri, G. Collision Avoidance in Collaborative Robotics Based on Real-Time Skeleton Tracking. In Advances in Service and Industrial Robotics; Petrič, T., Ude, A., Žlajpah, L., Eds.; RAAD; Mechanisms and Machine Science; Springer: Cham, Switzerland, 2023; Volume 135. [Google Scholar]
- Antonelli, M.G.; Beomonte Zobel, P.; Manes, C.; Mattei, E.; Stampone, N. Emotional Intelligence for the Decision-Making Process of Trajectories in Collaborative Robotics. Machines 2024, 12, 113. [Google Scholar] [CrossRef]
- Nazeer, M.S.; Bianchi, D.; Campinoti, G.; Laschi, C.; Falotico, E. Policy Adaptation using an Online Regressing Network in a Soft Robotic Arm. In Proceedings of the 2023 IEEE International Conference on Soft Robotics (RoboSoft), Singapore, 3–7 April 2023; pp. 1–7. [Google Scholar]
- Marechal, L.; Balland, P.; Lindenroth, L.; Petrou, F.; Kontovounisios, C.; Bello, F. Toward a Common Framework and Database of Materials for Soft Robotics. Soft Robot. 2021, 8, 284–297. [Google Scholar] [CrossRef]
- Paterna, M.; De Benedictis, C.; Ferraresi, C. The Research on Soft Pneumatic Actuators in Italy: Design Solutions and Applications. Actuators 2022, 11, 328. [Google Scholar] [CrossRef]
- Pena-Francesch, A.; Jung, H.; Demirel, M.C.; Sitti, M. Biosynthetic self-healing materials for soft machines. Nat. Mater. 2020, 19, 1230–1235. [Google Scholar] [CrossRef]
- Antonelli, M.G.; Beomonte Zobel, P.; D’Ambrogio, W.; Durante, F. Design Methodology for a Novel Bending Pneumatic Soft Actuator for Kinematically Mirroring the Shape of Objects. Actuators 2020, 9, 113. [Google Scholar] [CrossRef]
- Antonelli, M.G.; Beomonte Zobel, P.; Sarwar, M.A.; Stampone, N. Seahorse-Tail-Inspired Soft Pneumatic Actuator: Development and Experimental Characterization. Biomimetics 2024, 9, 264. [Google Scholar] [CrossRef] [PubMed]
- Li, Y.; Li, Y.; Ren, T.; Xia, J.; Liu, H.; Wu, C.; Lin, S.; Chen, Y. An Untethered Soft Robotic Dog Standing and Fast Trotting with Jointless and Resilient Soft Legs. Biomimetics 2023, 8, 596. [Google Scholar] [CrossRef] [PubMed]
- Glick, P.; Suresh, S.A.; Ruffatto, D.; Cutkosky, M.; Tolley, M.T.; Parness, A. A Soft Robotic Gripper with Gecko-Inspired Adhesive. IEEE Robot. Autom. Lett. 2018, 3, 903–910. [Google Scholar] [CrossRef]
- Zou, S.; Picella, S.; de Vries, J.; Kortman, V.G.; Sakes, A.; Overvelde, J.T.B. A retrofit sensing strategy for soft fluidic robots. Nat. Commun. 2024, 15, 539. [Google Scholar] [CrossRef] [PubMed]
- Ko, U.H.; Kumar, V.; Rosen, B.; Varghese, S. Characterization of bending balloon actuators. Front. Robot. AI 2022, 9, 991748. [Google Scholar] [CrossRef] [PubMed]
- Mendoza, N.; Haghshenas-Jaryani, M. Combined Soft Grasping and Crawling Locomotor Robot for Exterior Navigation of Tubular Structures. Machines 2024, 12, 157. [Google Scholar] [CrossRef]
- Fras, J.; Althoefer, K. Soft Fiber-Reinforced Pneumatic Actuator Design and Fabrication: Towards Robust, Soft Robotic Systems. In Proceedings of the Towards Autonomous Robotic Systems, London, UK, 3–5 July 2019. [Google Scholar]
- Shintake, J.; Cacucciolo, V.; Floreano, D.; Shea, H. Soft Robotic Grippers. Adv. Mater. 2018, 30, 1707035. [Google Scholar]
- Antonelli, M.G.; D’Ambrogio, W.; Durante, F. Development of a pneumatic soft actuator as a hand finger for a collaborative robot. In Proceedings of the 2nd International Conference on Mechatronics Systems and Control Engineering, Amsterdam, The Netherlands, 21–23 February 2018; pp. 67–71. [Google Scholar]
- Curkovic, P.; Cubric, G. Fused Deposition Modelling for 3D Printing of Soft Anthropomorphic Actuators. Int. J. Simul. Model. 2021, 20, 303–314. [Google Scholar] [CrossRef]
- Antonelli, M.G.; Beomonte Zobel, P.; D’Ambrogio, W.; Durante, F.; Raparelli, T. An Analytical Formula for Designing Mckibben Pneumatic Muscles. Int. J. Mech. Eng. Technol. 2018, 9, 320–337. [Google Scholar]
- Martinez-Sanchez, D.E.; Sandoval-Castro, X.Y.; Cruz-Santos, N.; Castillo-Castaneda, E.; Ruiz-Torres, M.F.; Laribi, M.A. Soft Robot for Inspection Tasks Inspired on Annelids to Obtain Peristaltic Locomotion. Machines 2023, 11, 779. [Google Scholar] [CrossRef]
- Lv, Z.; Wu, K.; Zhang, Z.; He, Y. Two-way FSI simulation and experiments for finger-like soft pneumatic actuator under high-speed pressurization. IEEE Robot. Autom. Lett. 2024. [Google Scholar] [CrossRef]
- García-Samartín, J.F.; Molina-Gómez, R.; Barrientos, A. Model-Free Control of a Soft Pneumatic Segment. Biomimetics 2024, 9, 127. [Google Scholar] [CrossRef]
- Nazeer, M.S.; Laschi, C.; Falotico, E. RL-Based Adaptive Controller for High Precision Reaching in a Soft Robot Arm. IEEE Trans. Robot. 2024, 40, 2498–2512. [Google Scholar] [CrossRef]
- Montgomery, D.; Cahyono, S. Design and Analysis of Experiments, 9th ed.; Wiley: Hoboken, NJ, USA, 2022. [Google Scholar]
- Günther, A.; Monod, L.; Wirkner, C.S. Comparative morphology of scorpion metasomata: Muscles and cuticle. Arthropod Struct. Dev. 2021, 60, 101003. [Google Scholar] [CrossRef]
- Telheiro, A.; Coelho, P.; Van der Meijden, A. The effect of change in mass distribution due to defensive posture on gait in fat-tailed scorpions. J. Comp. Physiol. A 2021, 207, 117–125. [Google Scholar] [CrossRef]
- Günther, A.; Drack, M.; Monod, L.; Wirkner, C.S. A unique yet technically simple type of joint allows for the high mobility of scorpion tails. J. R. Soc. Interface 2021, 18, 20210388. [Google Scholar] [CrossRef]
- Booncham, U.; Sitthicharoenchai, D.; Pradatsundarasar, A.; Prasarnpun, S.; Thirakhupt, K. Sexual Dimorphism in the Asian Giant Forest Scorpion, Heterometrus laoticus Couzijn, 1981. NU Int. J. Sci. 2007, 4, 42–52. [Google Scholar]
- Stampone, N.; Antonelli, M.G. Identification of DOE-based Predictive Model for the Bending Behavior of a Soft Pneumatic Actuator. In Advances in Italian Mechanism Science. IFToMM Italy; Mechanism and Machine Science; Springer: Cham, Switzerland, 2024; Volume 164. [Google Scholar]
Disclaimer/Publisher’s Note: The statements, opinions and data contained in all publications are solely those of the individual author(s) and contributor(s) and not of MDPI and/or the editor(s). MDPI and/or the editor(s) disclaim responsibility for any injury to people or property resulting from any ideas, methods, instructions or products referred to in the content. |
© 2024 by the authors. Licensee MDPI, Basel, Switzerland. This article is an open access article distributed under the terms and conditions of the Creative Commons Attribution (CC BY) license (https://creativecommons.org/licenses/by/4.0/).