Article

Fault Diagnosis Method for Railway Signal Equipment Based on Data Enhancement and an Improved Attention Mechanism

by
Ni Yang
,
Youpeng Zhang
*,
Jing Zuo
and
Bin Zhao
School of Automation and Electrical Engineering, Lanzhou Jiaotong University, Lanzhou 730070, China
*
Author to whom correspondence should be addressed.
Machines 2024, 12(5), 334; https://doi.org/10.3390/machines12050334
Submission received: 17 April 2024 / Revised: 9 May 2024 / Accepted: 9 May 2024 / Published: 13 May 2024

Abstract

:
Railway signals’ fault text data contain a substantial amount of expert maintenance experience. Extracting valuable information from these fault text data can enhance the efficiency of fault diagnosis for signal equipment, thereby contributing to the advancement of intelligent railway operations and maintenance technology. Considering that the characteristics of different signal equipment in actual operation can easily lead to a lack of fault data, a fault diagnosis method for railway signal equipment based on data augmentation and an improved attention mechanism (DEIAM) is proposed in this paper. Firstly, the original fault dataset is preprocessed based on data augmentation technology and retained noun and verb operations. Then, the neural network is constructed by integrating a bidirectional long short-term memory (BiLSTM) model with an attention mechanism and a convolutional neural network (CNN) model enhanced with a channel attention mechanism. The DEIAM method can more effectively capture the important text features and sequence features in fault text data, thereby facilitating the diagnosis and classification of such data. Consequently, it enhances onsite fault maintenance experience by providing more precise insights. An empirical study was conducted on a 10-year fault dataset of signal equipment produced by a railway bureau. The experimental results demonstrate that in comparison with the benchmark model, the DEIAM model exhibits enhanced performance in terms of accuracy, precision, recall, and F1.

1. Introduction

1.1. Background

Railway signal equipment is an important part of the infrastructure used to ensure the safe operation of trains. In the daily operation of trains, railway signal equipment generates operation fault maintenance data. These data are mainly recorded text collected by onsite maintenance personnel according to their own language habits and experience/knowledge, including the fault symptoms, fault diagnosis process, and fault classification results of all signal devices. The number of fault data are determined by the number of device faults, and the data content is recorded according to the fault diagnosis process and can be written in perfect detail without specific rules. These railway signal fault text data undergo a series of checks by signal experts from the initial processing records to the final archiving, and they contain rich knowledge from fault handling experts [1,2]. However, due to the unstructured characteristics of their storage, they are not conducive to computer analysis or processing, resulting in accumulation and wasted resources; thus, they are not properly utilized. At present, the task of fault classification for signal equipment is still completed by equipment maintenance personnel, and the classification results may be inaccurate and arbitrary. Driven by the current development direction of railway big data and intelligent operations and maintenance, research on fault diagnosis models based on text data can mine the pattern relationships between fault records and corresponding fault equipment categories, achieve automatic classification and processing of fault data, and provide efficient theoretical reference for maintenance personnel to quickly locate and address faults according to fault phenomena when equipment fails [3,4,5].
In recent years, the continuous advancement in deep learning technology has led to its increasingly profound application in the field of natural language processing. Scholars have been endeavoring to employ word vector technology and deep learning techniques to further enhance the precision of intelligent analysis for railway signal fault text. In the field of natural language processing, recurrent neural networks (RNNs) and convolutional neural networks (CNNs) are commonly employed deep learning methods. RNNs and CNNs leverage their respective strengths to extract sequential information and local features from text data; however, they also possess certain limitations. Specifically, CNNs tend to lose textual sequence information during the learning process, while RNNs lack the ability to capture local context effectively. With the successful application of attention mechanisms in deep learning, it has been realized that neural networks can efficiently and accurately extract key task-related information from a vast amount of text data while marginalizing non-key information. This effectively enhances the performance of neural networks [6,7,8] and has emerged as a prominent research area within the field of deep learning. The diverse range of railway signal equipment, complex fault mechanisms, varying amounts of maintenance text data for different equipment types, imbalanced class distributions, and short data lengths pose significant challenges to fault diagnosis algorithms during the learning process.
Based on the aforementioned issues, this paper proposes a fault diagnosis method (DEIAM) for railway signal equipment utilizing data augmentation and an enhanced attention mechanism. Specifically, it employs easy data augmentation (EDA) and back-translation techniques to augment the training dataset size and address sample imbalance. Additionally, it leverages Word2Vec for word vectorization and utilizes a CNN to capture local text features across different convolutional kernel sizes. Furthermore, an improved channel-wise attention (ICWA) mechanism is employed to focus on text features that contribute significantly to the classification results, resulting in the generation of CNN+ICWA text feature vectors. Moreover, BiLSTM is utilized to learn contextual information from the text features, followed by an attention mechanism for weighting important features within the text. These weighted learning results are then incorporated into the BiLSTM-generated text feature vector, leading to the generation of internal semantic BiLSTM+attention feature vectors. Finally, fusion of these two types of feature vectors enhances their overall quality and improves the model’s accuracy for fault diagnosis.

1.2. Literature Review

The fault diagnosis model, driven primarily by text data, classifies fault text through the extraction of its data features and subsequently accomplishes fault diagnosis via text classification [9]. The accuracy of fault diagnosis is directly influenced by factors such as dataset characteristics, feature extraction algorithms, and classification algorithms.
The railway signal fault data are the maintenance data generated by equipment during its actual operation. Due to variations in the frequency of faults among different equipment, there exists an imbalance in the volume of fault data across various categories. The methods for addressing dataset imbalance primarily encompass techniques to enhance the original samples, such as EDA [10] and back-translation; approaches to augment text representation data, including oversampling or undersampling [11,12]; and algorithmic strategies, such as ensemble learning and cost-sensitive functions [13,14]. Li [9] employed the ADASYN (adaptive synthetic sampling) method to address the imbalance in fault data from high-speed rail signal equipment by synthesizing samples from underrepresented categories in the training dataset, aiming to enhance the data distribution ratio and ultimately improve the overall performance of fault diagnosis models. Yang [15] utilized the SVM-SMOTE algorithm to randomly generate additional samples for the small and medium-sized categories within the text vector representing railway signal equipment faults, thereby addressing the problem of imbalanced sample data.
The feature extraction algorithms commonly employed in the literature include the bag-of-words model, TF-IDF, probabilistic topic models, and feature representation based on deep learning [16,17,18]. Shang [19] utilized a labeled-LDA probabilistic topic model to extract the fault text data characteristics of vehicle equipment within the train control system. Wei [20] incorporated prior knowledge in the railways field to calibrate label information, employed a cost-sensitive support vector machine to address class imbalances in fault data, and subsequently applied the latent Dirichlet allocation method with local and global double-layer topic labels for feature extraction in fault text classification. Song [3] utilized the Word2Vec model for processing fault terms and generating word vectors, which were then used to extract the fault text features of train control vehicles through a CNN. Finally, Zhou [21] applied CNNs for extracting vehicle fault text data features and adopted a classifier that combines a random forest algorithm with cost-sensitive learning techniques for diagnosing faults in vehicle equipment.
Classification models can be categorized into two forms: single and integrated. Single classification models based on deep learning include Bayesian, KNN, and RNN models. In the realm of continuous optimization for natural language classification models, researchers have been assimilating the merits of individual models and endeavoring to effectively amalgamate them into an integrated framework, thereby attaining enhanced classification outcomes. Similarly, in the field of railway signal equipment fault diagnosis, researchers have also conducted relevant research and exploration. Wei [5] employed word frequency weighting to enhance the word vectors generated by the BERT model for extracting text feature vectors. Subsequently, a combination of BiLSTM and an improved attention mechanism was utilized to classify the fault text of train control vehicle equipment and enable fault diagnosis. Shang [22] introduced long short-term memory (LSTM) and a BP neural network into a vehicle equipment fault diagnosis model, where LSTM learned the temporal characteristic information from the vehicle equipment fault text data while a Bayesian regularization (BR) algorithm optimized the generalization ability of the BP neural network model for completing the learning process with fault data samples and achieving unknown sample-based fault type diagnosis. Drawing upon bidirectional long short-term memory’s (BiLSTM) advantages in extracting temporal features from fault text, Lin [23] constructed a railway switch fault diagnosis model by combining BiLSTM with a model based on correlation (MLCBA), thereby enabling intelligent diagnosis of switch faults.
Drawing on the expertise of scholars and experts in text classification and considering the data characteristics specific to railway signal equipment fault text, this paper incorporates data augmentation and attention mechanisms into the fault diagnosis method for railway signal equipment. Firstly, an enhanced channel attention mechanism was employed to focus on local features captured by CNNs that contributed significantly to the classification results. Secondly, an attention mechanism was utilized to emphasize the contextual sequence features of text learned by BiLSTM. The combination of these two approaches enables comprehensive feature learning for fault text and further improves the fault diagnosis performance for railway signal equipment.
The rest of this paper is structured as follows. Section 2 briefly reviews the fundamental methods and theories relevant to this research. Section 3 presents the theoretical background and research framework of the DEIAM model proposed in this paper. Section 4 details the comparison experiment and discusses the results. Section 5 concludes the paper and explores future work.
2. Materials and Methods

2.1. EDA Technology

EDA is a widely used technique for implementing text data augmentation [10]. EDA encompasses four primary methods: random swap (RS), random deletion (RD), random insertion (RI), and synonym replacement (SR). Suppose that C = { C 1 , C 2 , , C N } represents the dataset, N is the number of categories contained in dataset C , and C j is the j-th category in the dataset. Similarly, C j = { d 1 , d 2 , , d n } , where n is the number of samples contained in C j , and d i is the i-th sample in C j . After word segmentation preprocessing, d i is expressed as d i = { w 1 , w 2 , , w m } , where m is the number of words included in d i , w t represents a word in sample d i , and w t represents a non-stop word in sample d i . The principles underlying these four EDA methods are as follows:
(1)
RS operation: Word w t in sample d i swaps position with word w j after it is judged with a probability of p r s , and a new sample variant d r s is created. This operation is denoted O r s .
(2)
RD operation: For word w t in sample d i , the deletion operation is judged with a probability of p r d , and a new sample variant d r d is created. This operation is denoted O r d .
(3)
RI operation: For non-stop word w t in sample d i , the insertion of its synonym after word w t in sample d i is judged with a probability of p r i , and a new sample variant d r i is created. This operation is denoted O r i .
(4)
SR operation: For non-stop word w t in sample d i , the replacement of its synonym with probability p s r is judged, and a new sample variant d s r is created. This operation is denoted O s r .

2.2. Back-Translation

The back-translation method employs translation tools and foreign languages as intermediates to randomly translate samples into a specific form of intermediate language, resulting in some changes in the language structure of the samples. Subsequently, the intermediate language is translated back into Chinese, leading to further modifications in the language structure while preserving the intended meaning of the samples. This approach effectively enriches the training library by incorporating new samples.

2.3. Attention Mechanism

The concept of an attention mechanism is inspired by human visual perception. When humans visually explore an object, they possess the innate ability to automatically and continuously direct their focus towards areas of interest while disregarding irrelevant regions. This cognitive capability enables humans to efficiently extract pertinent information from a vast amount of superfluous data.
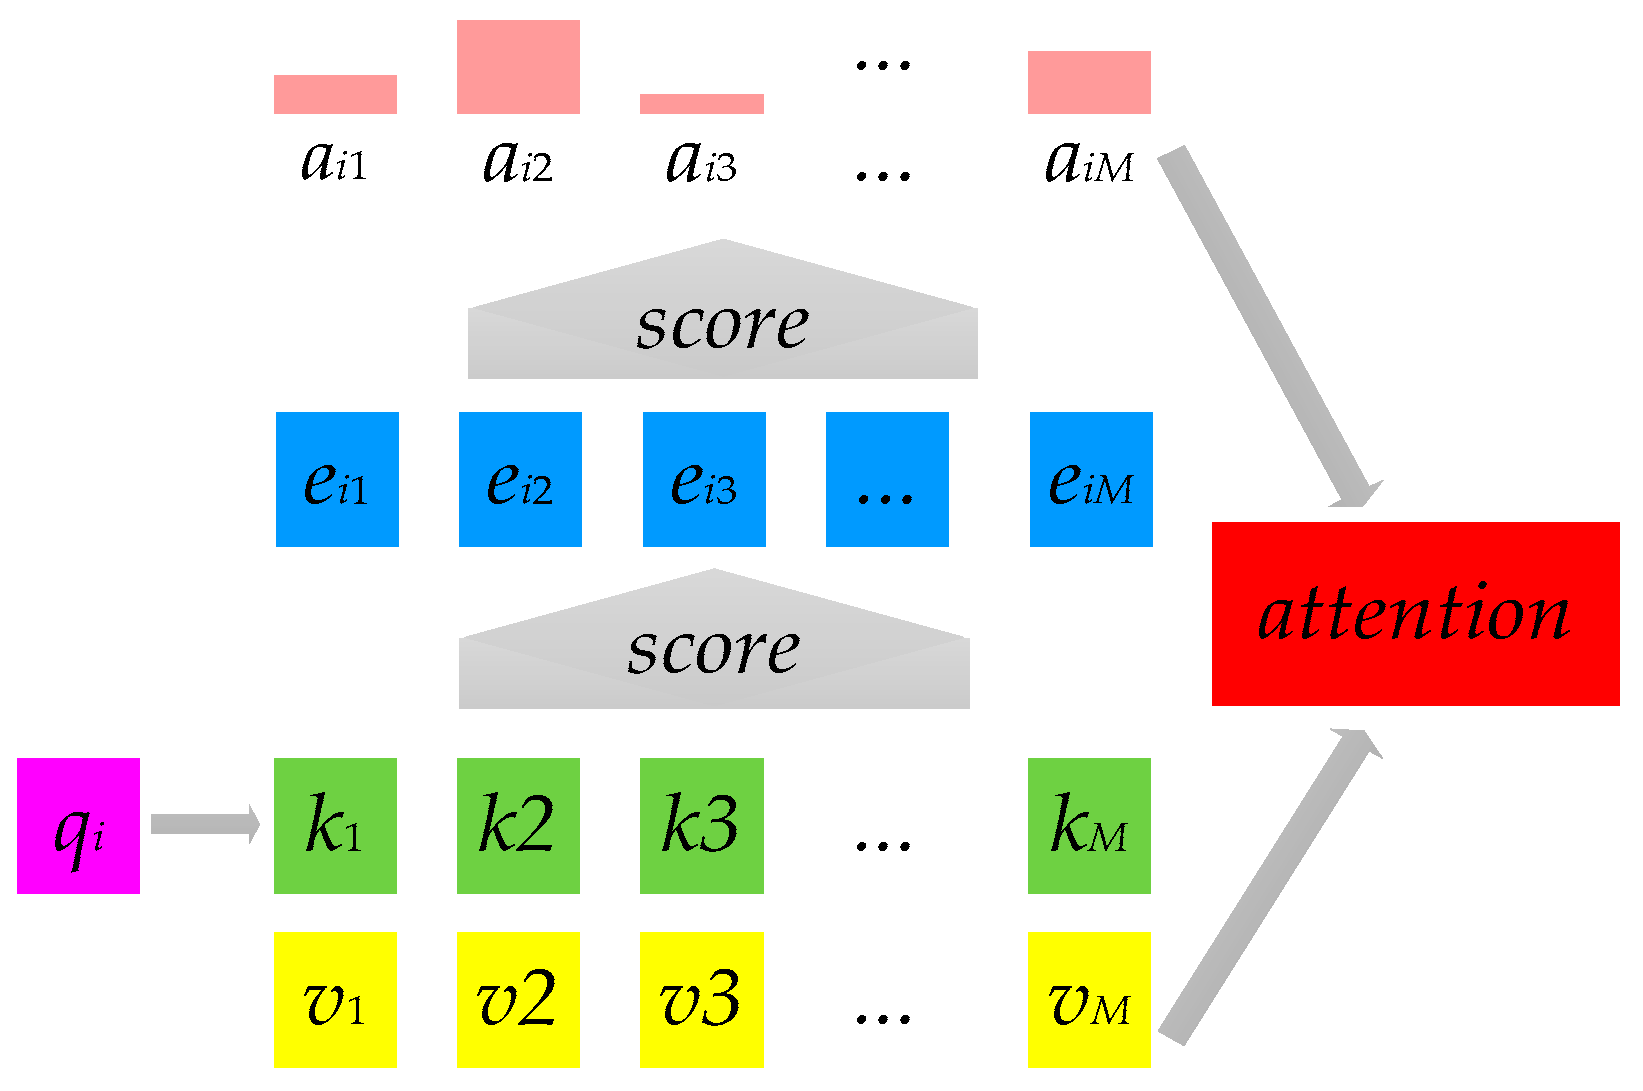
In recent years, attention mechanisms have gained significant prominence in natural language processing research. In the context of text classification tasks, if we abstract the downstream task as a query, the text can be viewed as a sequence of key–value pairs. In the usual case, K = V , considering the query Q = { q 1 , q 2 , , q N } , key K = { k 1 , k 2 , , k M } , and value V = { v 1 , v 2 , , v M } , where q i is the i-th value of the query sequence, and k j and v j are vector forms of the j-th constituent elements of the source text, which can be characters, words, phrases, etc. The output of the attention model is based on the different weight distributions of the source text sequence generated by different queries q i . The general form of the attention mechanism can be summarized as follows [24]:
e i j = s c o r e ( q i , k j )
α i j = softmax ( e i j ) = exp ( e i j ) j exp ( e i j )
A t t e n t i o n ( q i , K , V ) = j α i j v j
The attention mechanism’s calculation process is illustrated in Figure 1. Firstly, the attention score e i j for each query q i and key k j is computed based on Equation (1). Subsequently, the attention score e i j is normalized using softmax and other functions as shown in Equation (2) to obtain the attention weight score α i j for each query q i and key k j . Finally, Equation (3) is employed to multiply the weight score α i j by its corresponding value v j , thereby assigning appropriate weights to key characteristics influencing downstream tasks.
In 2017, Chen et al. proposed the channel-wise attention (CWA) mechanism [25], which achieved remarkable results in computer vision. The CWA attention formula is calculated as follows:
b = tanh ( ( W c v ) W h c h t - 1 )
β = softmax ( W i b + b i )
where v = { v 1 , v 2 , , v c } C is the channel feature vector of each channel after average pooling; W c , W i , and W h c are transformation matrices, where W c and W i K while W h c K × d ; K denotes the dimension of the common mapping space; represents the product operation of matrices; represents the addition operation of matrices and vectors; and W c v is a K × C matrix. Additionally, h t 1 d , where h t 1 signifies the output of the last sentence’s context coding, with d representing the LSTM’s hidden-state dimension. Furthermore, b c K and b i 1 are bias terms, b is a K × C matrix, W i b is a 1 × C vector, and β is also a 1 × C vector that assigns weights to individual channel feature maps.

2.4. BiLSTM

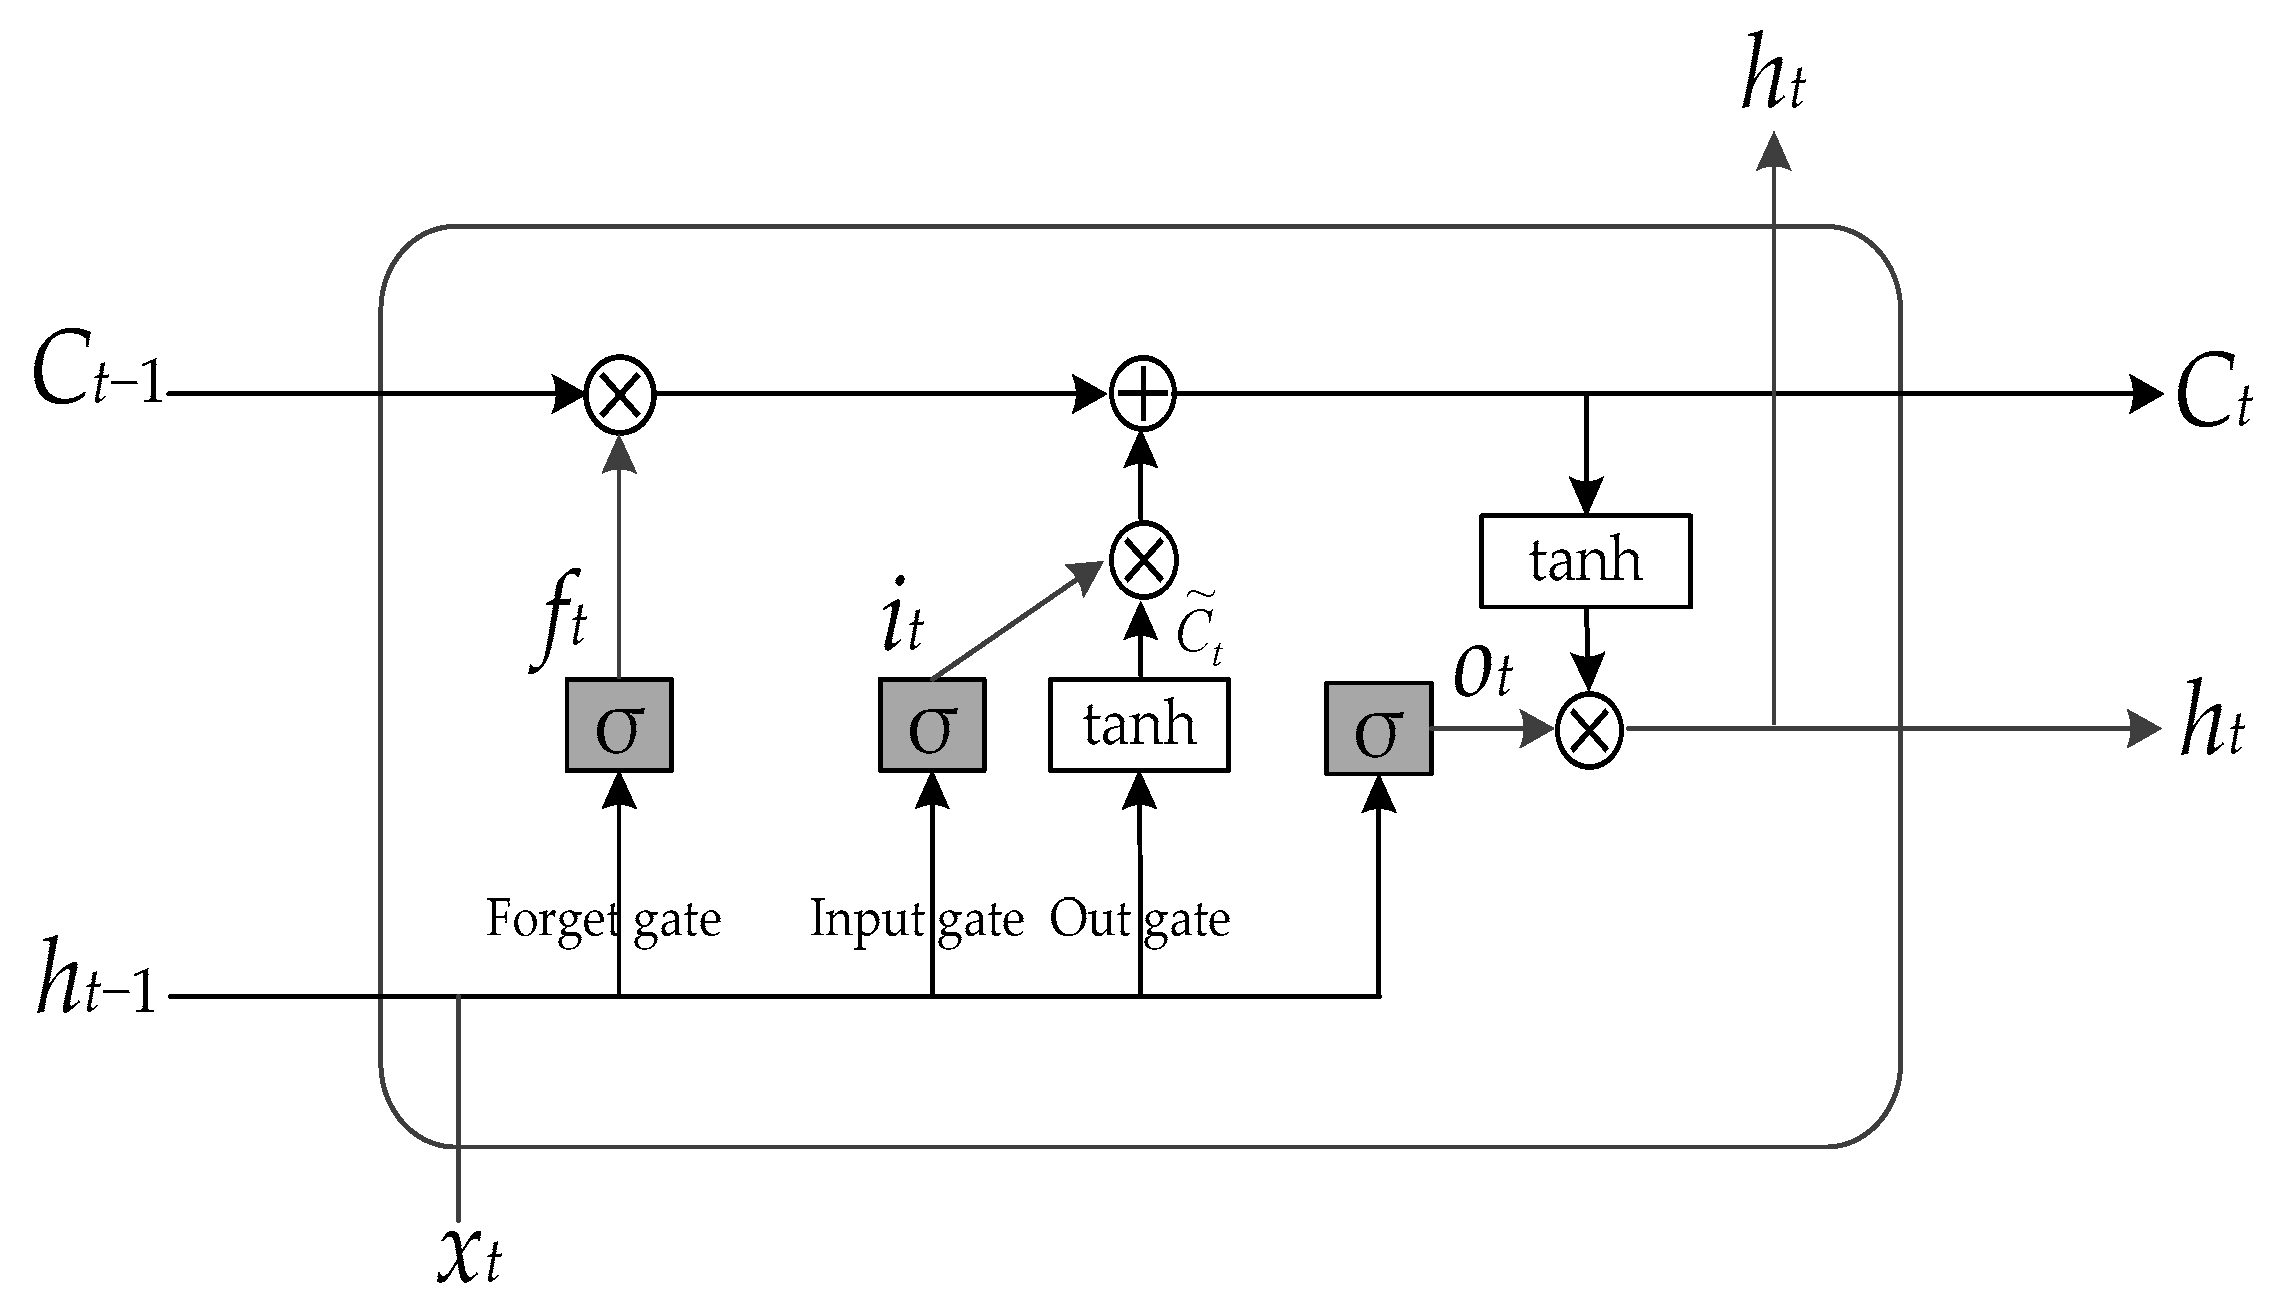
The LSTM model incorporates adaptive gating control based on an RNN [26] to determine the extent to which the LSTM unit retains the previous state and updates the current input unit state. The gating control in LSTM comprises three components—an input gate ( i t ), a forgetting gate ( f t ), and an output gate ( o t )—as illustrated in Figure 2.
The training procedure based on the LSTM model can be formulated as follows:
i t = σ ( W i x t + U i h t 1 + b i )
f t = σ ( W f x t + U f h t 1 + b f )
o t = σ ( W o x t + U o h t 1 + b o )
C ˜ t = tanh ( W c x t + U c h t 1 )
C t = f t C t 1 + i t C ˜ t
h t = o t tanh ( C t )
where W i , W f , W o , and W c represent the input weight matrices; U i , U f , U o , and U c denote the cyclic weight matrices; b i , b f , b o , and b c refer to the bias weights; x t signifies the word vector of the current input network; and h t 1 represents the hidden-layer output of the LSTM network at time t 1 .
BiLSTM is composed of forward and reverse LSTM networks, and the output h i = [ h i , h i ] is obtained by combining the outputs of the forward h i and reverse hidden layers h i .

3. DEIAM

The proposed fault diagnosis model (DEIAM) for railway signal equipment incorporates two main components: data preprocessing and the fault diagnosis model.

3.1. Data Preprocessing

3.1.1. Data Analysis

The railway signal fault data are derived from textual records documenting the faults occurring in each component of the railway signaling system during its actual operation, including information such as the time, location, and specific fault manifestations. Due to variations in equipment structure and usage frequency, the number of faults experienced by different equipment types within a given time period may differ significantly, resulting in an imbalanced distribution across fault categories within the dataset used for training purposes. This imbalance can lead to biased classification outcomes favoring overrepresented samples, ultimately compromising diagnostic accuracy—an issue that cannot be overlooked.

3.1.2. Data Enhancement

Considering that the fault diagnosis accuracy of the model is largely determined by the size and quality of training data, in practical railway signal equipment operations, the fault data consist solely of actual onsite fault records, which are limited in quantity and unbalanced across classes. To address this issue, we employed the easy data augmentation (EDA) and back-translation techniques to augment the original dataset, thereby effectively increasing its size and diversity. This approach mitigates the model’s problem of low diagnostic accuracy caused by insufficient training data at the data level.
The introduction of text length in EDA technology necessitates the adjustment of the number of words per EDA operation based on sentence length. Consequently, long sentences allow for a greater degree of word modification while preserving the original class label compared to shorter sentences. Additionally, we employed English, French, Japanese, Korean, and Spanish as intermediate languages within the back-translation method. During this process, samples are randomly translated into an intermediate form using one of these languages before being translated back into Chinese in order to generate new samples with identical labels to their originals.
Revised sentence: Assuming that the original fault corpus data collected from the site are represented as D s = { ( d a t a s , l a b e l s ) } , we set n e d a as the multiplier for sample enhancement in the EDA technology and n t as the multiplier for sample enhancement in the back-translation method. The specific implementation algorithm for text data enhancement is presented in Algorithm 1.

3.1.3. Data Cleaning

The enhanced railway signal fault dataset was processed and organized, primarily involving the utilization of the Jieba 0.42.1 word segmentation tool to segment the text based on a self-constructed professional dictionary specific to railway signal faults. This process included eliminating stop words, retaining verbs and nouns, and ultimately establishing an index relationship between the text and words in the dataset.
Algorithm 1: Text enhancement algorithm based on EDA and back-translation technology.
Input: original dataset D s = { ( d a t a s , l a b e l s ) }
Output: enhanced sample dataset D z = { ( d a t a z , l a b e l z ) }
(1)Statistics of the number of samples in the original dataset n ;
(2)Initialization of enhancement parameters: p r d , p r i , p r s , p s r , n e d a , n t ;
(3)For s = 1 to n :
(4)  For k = 1 to n e d a :
(5)     O r d ( p r d ) , O r i ( p r i ) , O r s ( p r s ) , O s r ( p s r ) are performed on each sample in D s in turn;
(6)  End for
(7)End for
(8)The sample data with EDA enhancement are obtained as D e d a = { ( d a t a e d a , l a b e l e d a ) } .
(9)For t = 1 to n :
(10)  For r = 1 to n t :
(11)    Perform back-translation operation on each sample in D s in turn;
(12)  End for
(13)End for
(14)Obtain the sample data D t r a = { ( d a t a t r a , l a b e l t r a ) } enhanced by the back-translation method.
(15)Shuffle and mix the original sample dataset D s with the enhanced sample datasets D e d a and D t r a to create the enhanced dataset D z = { ( d a t a z , l a b e l z ) } , where d a t a z is composed of d a t a e d a , d a t a t r a , and d a t a s , while l a b e l z is the corresponding label of each sample.

3.2. Signal Equipment Fault Diagnosis Model

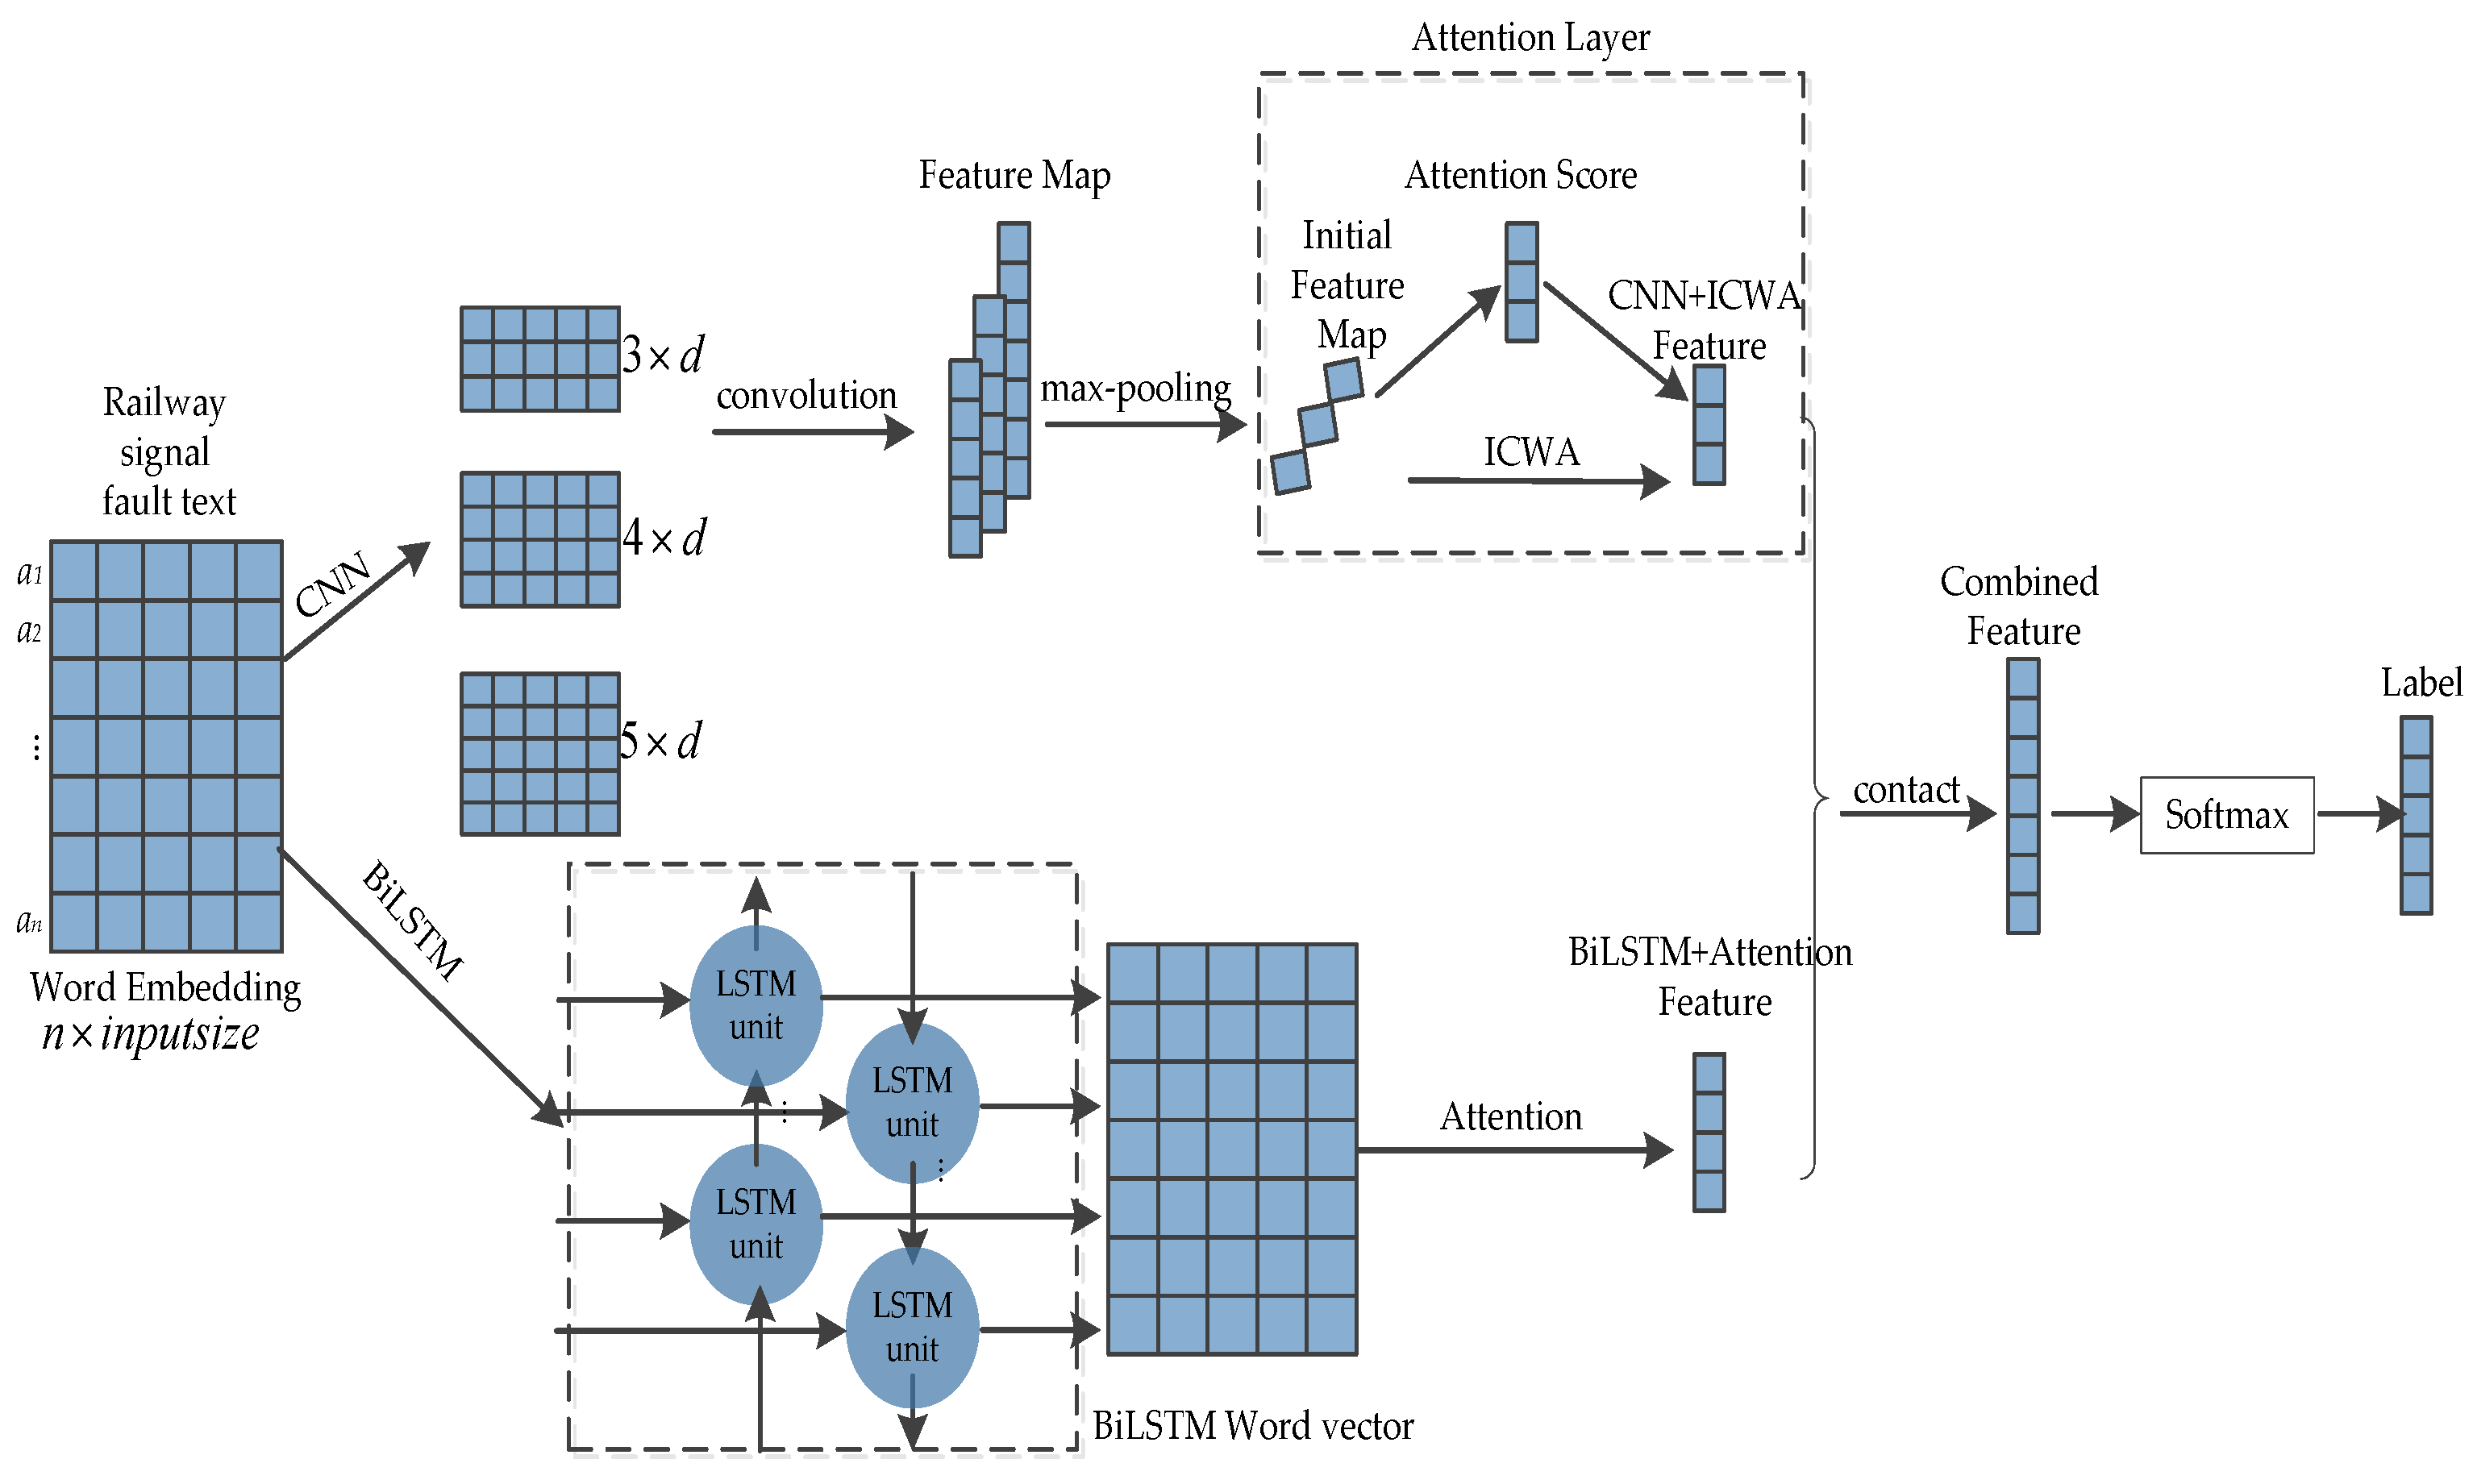
The signal equipment fault diagnosis model primarily relies on deep learning (BiLSTM), a convolutional neural network (CNN), and an attention mechanism module for its structure, as depicted in Figure 3. Regarding text feature extraction, CNNs excel at capturing local text features; however, they have limitations in extracting sequential features and obtaining long-distance semantic information from the text. On the other hand, BiLSTM is a cyclic recursive network model that effectively captures sequence feature information and facilitates long-term memory retention. By combining a CNN and BiLSTM for text feature extraction, we can leverage their respective strengths to compensate for each other’s weaknesses. Additionally, we introduced the attention mechanism into the process of extracting text features using the CNN and BiLSTM. This incorporation allows us to provide more detailed attention to those specific textual characteristics that positively impact fault diagnosis results while enhancing diagnostic accuracy.

3.2.1. Word Vectorization of Text

Word vectorization of text in the dataset is performed using the Word2Vec algorithm after data preprocessing. Word2Vec includes two models: CBOW and Skip-gram. In this study, we adopted the CBOW model to generate word vectors for signal fault texts. Let a signal fault text d contain n-many words, i.e., d = { a 1 , , a j , a n } . After word vectorization, each word a j in text d is converted into a word vector with dimensions w j i n p u t s i z e , where i n p u t s i z e represents the dimensionality of the Word2Vec word vectors. Consequently, text d can be represented by a matrix D with dimensions n × i n p u t s i z e .
Figure 3. Structural diagram of the fault diagnosis model.
Machines 12 00334 g003

3.2.2. CNN-ICWA Text Feature Extraction

CNN-ICWA text feature extraction, as illustrated in Figure 3, primarily aims to extract local textual features using a convolutional neural network (CNN) and subsequently employs the enhanced attention mechanism ICWA (improved CWA) to emphasize the feature vectors of each channel that contribute significantly to classification. The CNN-ICWA text feature extraction process encompasses four steps:
1.
CNN text feature extraction involves adopting a multiscale convolution kernel approach to comprehensively extract semantic features at different word count levels from the text word vector matrix D , considering the varying lengths of each text. To achieve optimal classification results, it is recommended that convolution kernels with sizes of 3, 4, and 5 be chosen [27]. The dimension of each row vector in the text matrix D corresponds to the dimension of each word vector w j in the text. Therefore, we set the size of each group of convolution kernels as 3 × i n p u t s i z e , 4 × i n p u t s i z e , and 5 × i n p u t s i z e , respectively. Subsequently, CNN convolution operations are performed on each group, as shown in Equation (12):
D m = C m × i n p u t s i z e · D [ i : i + m 1 ]
where m represents various convolution kernels ( m = 3 , 4 , 5 ), C represents the convolution operation matrix, and i represents the row subscript of the text matrix D ( i = 1 , 2 , , n ). The symbol · denotes the dot product of the matrices, with D m ( n m + 1 ) .
Considering the training speed of neural networks and the enhancement in model performance, D m is batch-normalized and activated after the convolution operation using Equation (13) to obtain D ¯ m :
D ¯ m = Relu ( Norm ( D m ) )
2.
Pooling operation: Perform pooling on the outputs D ¯ m obtained from each convolution kernel operation, and select the maximum value Tm as the corresponding text feature:
T m = max ( D ¯ m )
Here, T m 1 ; when the number of each convolution kernel is K , the text features extracted by each convolution kernel according to Equations (13) and (14) are:
T m = ( T 1 m , T 2 m , , T K m )
where T m K .
3.
Attention weight calculation: To enhance the attention towards convolutional text features that contribute to effective classification, we employ the improved channel-wise attention (ICWA) mechanism for calculating the attention weights of the text convolution feature Tm across different channels, drawing inspiration from previous literature [28]. The ICWA mechanism operates as follows:
v m = tanh ( W m T m + b m )
α m = sigmoid ( v m )
where W m K × K represents the transformation matrix of various text convolution features, b m K denotes the bias term, v m K signifies the channel attention weight of different text convolution features, and α m = ( α 1 m , α 2 m , , α K m ) , α m [ 0 , 1 ] , a m K indicates the channel attention weight of diverse normalized text convolution features.
4.
Update text features: The text convolution features obtained from the three pooling operations with convolution kernels of sizes 3, 4, and 5 are denoted as T m (where m = 3, 4, or 5). Additionally, the attention weight for each text convolution feature learned using the ICWA mechanism is represented as α m . The updated expression of the text features can be formulated as follows:
T m = α m × T m = [ α 1 m × T 1 m , α 2 m × T 2 m , , α K m × T K m ]
where T m K .
The text features extracted by CNN-ICWA can be expressed as follows:
T C = ( T 3 , T 4 , T 5 )

3.2.3. BiLSTM–Attention Text Feature Extraction

This consists of three steps:
1.
BiLSTM-based text feature extraction: BiLSTM effectively captures the inter-sentence dependencies in signal fault text by considering both the forward and reverse directions, thereby enabling deep semantic analysis. In this study, we employed BiLSTM to extract features from the word vector matrix D of the text, which were then fed into separate forward and reverse LSTM networks for training as per Equations (6)–(11).
h t = F l s t m ( D , h t - 1 )
h t = B l s t m ( D , h t + 1 )
Here, Flstm and Blstm represent the LSTM network in the forward and reverse directions, respectively, while h t and h t are their corresponding hidden-layer outputs. After merging, the output of BiLSTM is as follows:
h t = [ h t h t ]
2.
Attention weight calculation: The context feature information of the text, extracted by the BiLSTM layer, is represented as h t . While h t encompasses the sequential feature information of the text, it should be emphasized that the BiLSTM layer may not effectively prioritize key textual information during the process of feature extraction. To address this limitation, we can utilize the output h n from the implicit state of the last time step in BiLSTM, which contains global feature information of the entire text sequence. By generating attention weights based on h n , our model can learn and prioritize text features that contribute positively to classification tasks. The implementation process is outlined in detail as follows.
Firstly, considering that h n encompasses feature information in both positive and negative directions, the output h n of the BiLSTM layer is derived by aggregating h n based on Equation (23):
h n = h n
Then, the text feature h n is passed to the attention mechanism layer following the BiLSTM layer, and the attention weight r t of the BiLSTM text feature h n is generated based on Equations (24) and (25):
u n = tanh ( W n h n + b n )
r t = exp [ f ( u n , h t ) ] t ( 1 , 2 , , n ) exp [ f ( u n , h t ) ]
where the matrix b n represents the bias of the attention layer, while W n denotes the parameter matrix associated with the attention layer. Additionally, u n signifies the hidden state of the BiLSTM layer output h n , t is the number of words in the text, t ( 1 , 2 , , n ) , f ( u n , h t ) represents the correlation between u n and h t , and r t represents the attention weight of f ( u n , h t ) normalized by importance.
3
Update text features: The text feature h t , obtained through BiLSTM, is calculated based on the attention weight r t to derive the weighted feature representation h n as Equation (26):
h n = t n r t h t

3.2.4. Feature Fusion and Classification

The aforementioned steps successfully extracted CNN-ICWA text features T C and BiLSTM attention text features h n through two distinct channels. Moreover, we employed the approach outlined in Equation (27) to effectively integrate these two feature sets:
z = contact ( T C , h n )
The fused text feature vector z is fed into the softmax classifier, and the diagnosis category of the fault text to be classified is as follows:
y ˜ = softmax ( Θ z + b )
where Θ represents the weight matrix of the softmax classifier, Θ p × s , s denotes the actual number of labels for signal equipment fault data, y ˜ signifies the label probability diagnosed by the model, and p refers to the feature dimension after fault text fusion.
In this study, the dropout layer was incorporated into the fully connected layer of the DEIAM model to enhance the diagnostic performance across various fault datasets. Additionally, the network optimization employed a cross-information entropy loss function, as depicted in Equation (29). Finally, the backpropagation (BP) algorithm was iteratively employed for parameter updates.
L ( y , y ˜ ) = i = 1 s y i log y ˜ i

4. Experimental Results and Analysis

4.1. Experimental Data

A total of 1515 instances of railway signal equipment failure data from the period of 2011 to 2020 were collected from a railway bureau, serving as the experimental data for this study. Each piece of fault data contains the specific fault phenomenon, the fault handling process, and the final fault classification label, which was determined by the railway signal experts after layer-by-layer verification. These data encompass six distinct categories of equipment, with the corresponding percentages presented in Table 1.
Taking the railway signal equipment data in Table 1 as illustrative examples, switches, which are vital components within the railway signal system, exhibit intricate structures and are characterized by their large quantities and frequent usage. Consequently, they tend to experience a relatively high number of faults. The fault occurrence rate follows a descending order for the categories switch, track circuit, ATP, signal light, computer interlocking, and CTC.
The 1515 data collected from the field were taken as the original dataset, which was expanded using EDA and back-translation methods. The optimal enhancement effect of EDA technology is achieved when the enhancement parameters are p r d = 0.1 , p r i = 0.1 , p r s = 0.1 , and p s r = 0.1 . In this study, we consistently set the parameters of p r d , p r i , p r s , and p s r in accordance with these values, while employing an enhancement multiple of n e d a = 4 for EDA samples and n t = 1 for back-translation samples. The distribution of sample numbers for each category in the enhanced dataset is presented in Table 2.

4.2. Evaluation Index

The evaluation indices employed in this study for the classification and diagnosis results of railway signal fault text data included precision, recall, F1 value, and accuracy. The calculation formulae for each index are presented as follows:
P r e c i s i o n = 1 | C | i c ( T P i + T N i ) × T P i T P i + F P i
R e c a l l = 1 | C | i c ( T P i + T N i ) × T P i T P i + F N i
F 1 = 2 × P r e c i s i o n × R e c a l l P r e c i s i o n + R e c a l l
A c c a r a r y = n k N
where C represents the total count of fault texts related to signal equipment, while c denotes the total number of classification categories for these fault texts. T P i is the number of fault samples with fault category i that are properly classified into category i , F N i is the number of fault samples with fault category i that are classified into category n o n i , T N i is the number of fault samples with fault category n o n i that are classified into category n o n i , F P i is the number of fault samples with fault category n o n i that are classified into category i , n k is the number of fault texts that are properly classified, and N is the total number of fault texts.

4.3. Experimental Environment and Parameter Settings

The model in this study was constructed using the PyTorch deep learning framework architecture. The experimental setup consisted of an i7-10510U processor, 16.0 GB RAM, and the Windows 10 operating system. CBOW from the Word2vec model was employed for word vector generation, with a dimensionality of 100. The CNN architecture utilized convolution window sizes of 3, 4, and 5, with each having 150 convolution kernels [28]. For the BiLSTM architecture, there were 128 hidden-layer nodes and a dropout rate of 0.2 for the dropout layer. Finally, the Adam algorithm was utilized for updating the weight matrix of the network during model training, with the learning rate set to 0.001.

4.4. Experimental Results

To comprehensively demonstrate the performance of our proposed model and mitigate any potential deviations caused by randomly selected test data, we adopted a fivefold cross-validation algorithm in our experiments. All experimental data were divided into five parts for testing purposes. During each training process, four parts of the data were used for training, while one part was reserved for testing.

4.4.1. Comparison Results of Data Augmentation and Data Processing Algorithms

To verify the effectiveness of retaining only nouns and verbs in data processing, as well as the impact of data augmentation algorithms on the classification models, we conducted four comparative experiments. The experimental data were divided into two categories: original (O) and enhanced (E) datasets. The original dataset consisted of 1515 pieces of data collected from railway sites, while the enhanced dataset contained 9090 pieces of data obtained after applying Algorithm 1 to improve the original dataset. We categorized our data processing based on whether or not the preprocessed datasets retained only nouns and verbs. Preprocessing operations such as word segmentation and stop-word removal were recorded as F, while preprocessing operations that retained only nouns and verbs after these steps were recorded as B.
The first group consisted of O+F, the second group consisted of O+B, the third group was composed of E+F, and the fourth group encompassed E+B. These four models were trained using a fivefold cross-validation approach, and the average values for accuracy, precision, recall, and F1 from 50 iterations per fold were utilized as the final evaluation results. The comparative assessment outcomes for all four test groups are presented in Table 3.
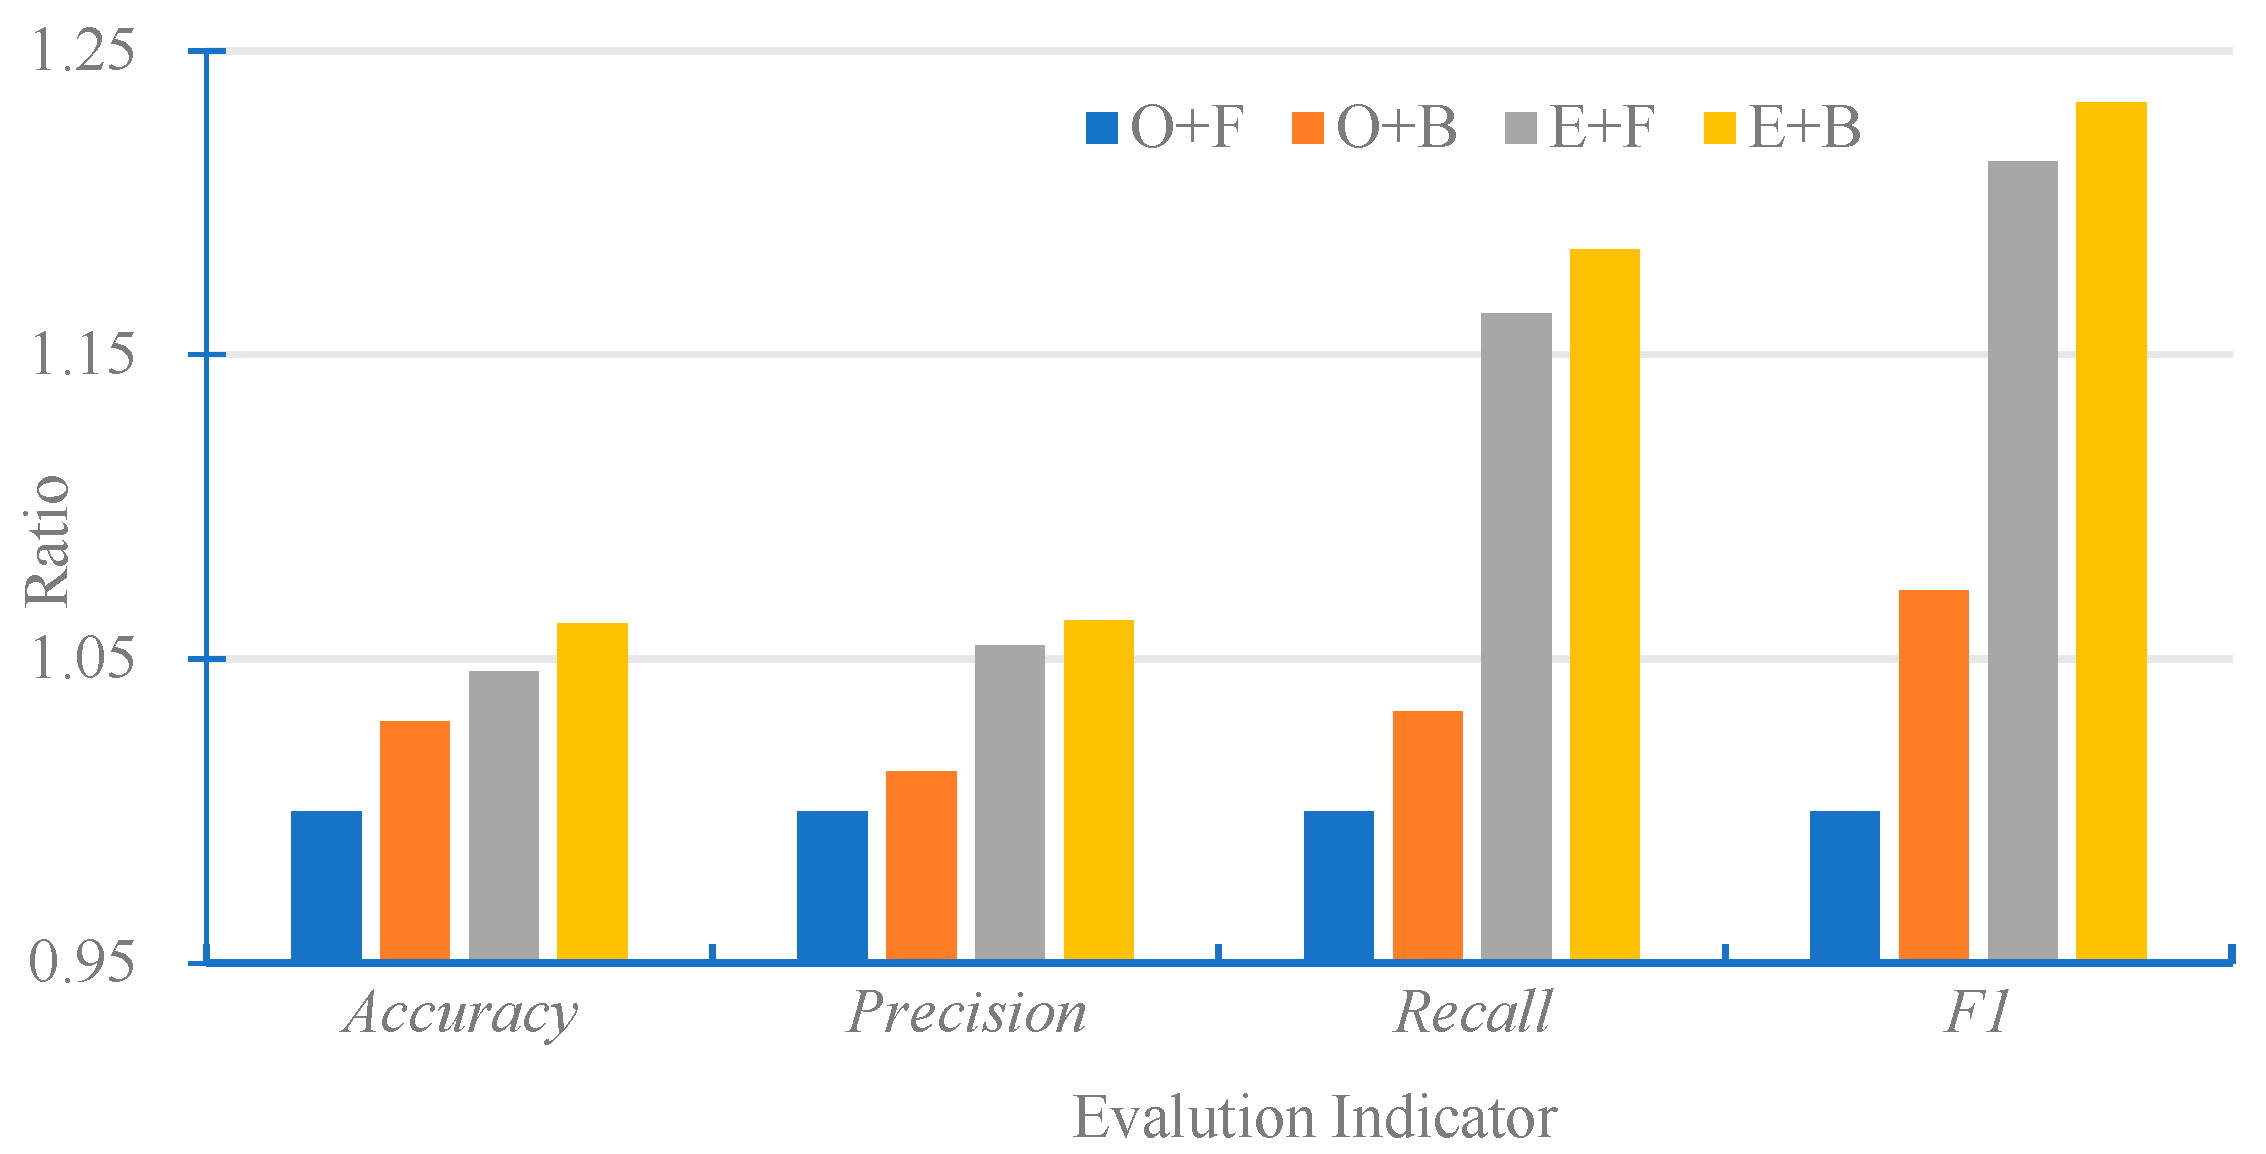
The evaluation data of the first group of experiments in Table 3 (O+F) were taken as the benchmark, and Figure 4 illustrates the comparison between the evaluation indices of the other three groups of experimental data and those of O+F. For the original dataset, O+B exhibited improved evaluation indices compared to O+F, with increases of 2.93%, 1.30%, 3.27%, and 7.23%, respectively. Similarly, for the enhanced dataset, E+B also demonstrated varying degrees of improvement in the evaluation indices compared to E+F, with increases of 1.34%, 0.59%, 2.05%, and 1.86%, respectively. These improvements are significantly higher when compared to the evaluation indices obtained from O+F; specifically, there were increases of 5.99%, 6.07%, 18.76%, and 23.63%, respectively. This analysis highlights that employing data augmentation techniques along with noun and verb retention practices contributes towards enhancing both the size and quality of datasets while reducing noise levels effectively, consequently leading to improved diagnostic performance by the models.

4.4.2. Comparison Results without Considering the Attention Mechanism

The proposed model in this paper incorporates attention mechanisms (attention and ICWA) into both channels. To assess the efficacy of attention mechanisms across different model algorithms, CNN, LSTM, and BiLSTM were selected as benchmark models, resulting in the construction of five models for comparative experiments. The dataset used was E+B, with evaluation metrics consistent with those outlined in Section 4.4.1. Table 4 presents the experimental comparison results of the five models without incorporating attention mechanisms.
The evaluation indices of the BiLSTM+CNN model, obtained through fivefold cross-validation, as shown in Table 4, exhibited higher mean values than the LSTM+CNN, LSTM, CNN, and BiLSTM models. In comparison to the LSTM model, the BiLSTM+CNN model demonstrated improvements in the evaluation indices of 1.80%, 1.93%, 2.00%, and 2.09%, respectively. Notably, the LSTM model exhibited the lowest accuracy among all models, due to potential randomness in the artificial language used for recording fault data text, which weakens contextual associations and hampers the effective capture of sequence features by the model. Conversely, similarly to the CNN model, the BiLSTM+CNN model effectively extracted sequence features from text, resulting in improved accuracy (0.63%) and precision (0.71%).

4.4.3. Comparison Results Based on Attention Mechanisms

In order to further validate the efficacy of attention mechanisms in enhancing the classification models’ predictions, this section takes CNN and BiLSTM as benchmark models. Four comparison models were constructed by incorporating different attention mechanisms (attention and ICWA) at various positions within the models in order to conduct comparative tests. The fusion of text sequence features extracted by BILSTM+attention and convolution features extracted by CNN is denoted as (BiLSTM+attention)+CNN, while BiLSTM+(CNN+ICWA) follows a similar approach. The evaluation metrics used were consistent with those mentioned in Section 4.4.1, and Table 5 presents the average prediction evaluation index for each fold in the fivefold cross-validation test conducted on the DEIAM model. Table 6 showcases the comparison results for the five attention-mechanism-based classification models on the enhanced dataset.
The evaluation indices of the DEIAM model proposed in this paper were significantly higher than those of the other models, as shown in Table 6. Compared with the CNN+ICWA model, there were increases of 2.35%, 2.45%, 3.24%, and 3.44% in the evaluation indices, respectively. Similarly, compared with the BILSTM+attention model, there were increases of 3.27%, 3.72%, 4.36%, and 3.49%, respectively. Furthermore, when compared to the BILSTM+AT+CNN model, the evaluation indices of the BILSTM+CNN+ICWA model showed improvements of 0.62%, 0.44%, 1.40%, and 1.48%, respectively. This indicates that ICWA has a more pronounced effect on improving evaluation indices at the local feature extraction layer than attention at the sequence feature extraction layer.
From Table 4 and Table 6, it can be observed that introducing attention mechanisms enhances the model’s focus on text features, which positively impacts classification tasks and leads to varying degrees of growth in various index values, demonstrating that attention mechanisms improve the overall performance. However, it should be noted that, while enhancing performance, attention mechanisms also increase the computational power and time requirements to some extent.

4.4.4. Comparison Results Based on Data Features and Attention Mechanisms

To further validate the efficacy of the proposed data augmentation technique across different benchmark models, two datasets, O+F and E+B, were selected for analysis. The models were categorized based on whether they incorporated an attention mechanism. Due to space constraints, only six models (BiLSTM, CNN, BiLSTM+CNN, CNN+ICWA, BiLSTM+attention, and DEIAM) were chosen for experimental comparison in Section 4.4.2 and Section 4.4.3. The evaluation metrics remained consistent with those mentioned in Section 4.4.1. Table 7 and Figure 5 present the comparative results of these six models on the O+F and E+B datasets.
According to the index values in Table 7, Figure 5 presents a comparative analysis of the indices for the five models on O+F and E+B. It is evident from Figure 5 that each model exhibited varying degrees of improvement in the evaluation indices on E+B, particularly with respect to the recall and F1 measures, which showed significant enhancements. This underscores the direct impact of data quality on model performance, while also affirming the positive role played by our adopted data processing method and attention mechanism design in enhancing model effectiveness, thereby validating the efficacy of our research approach.
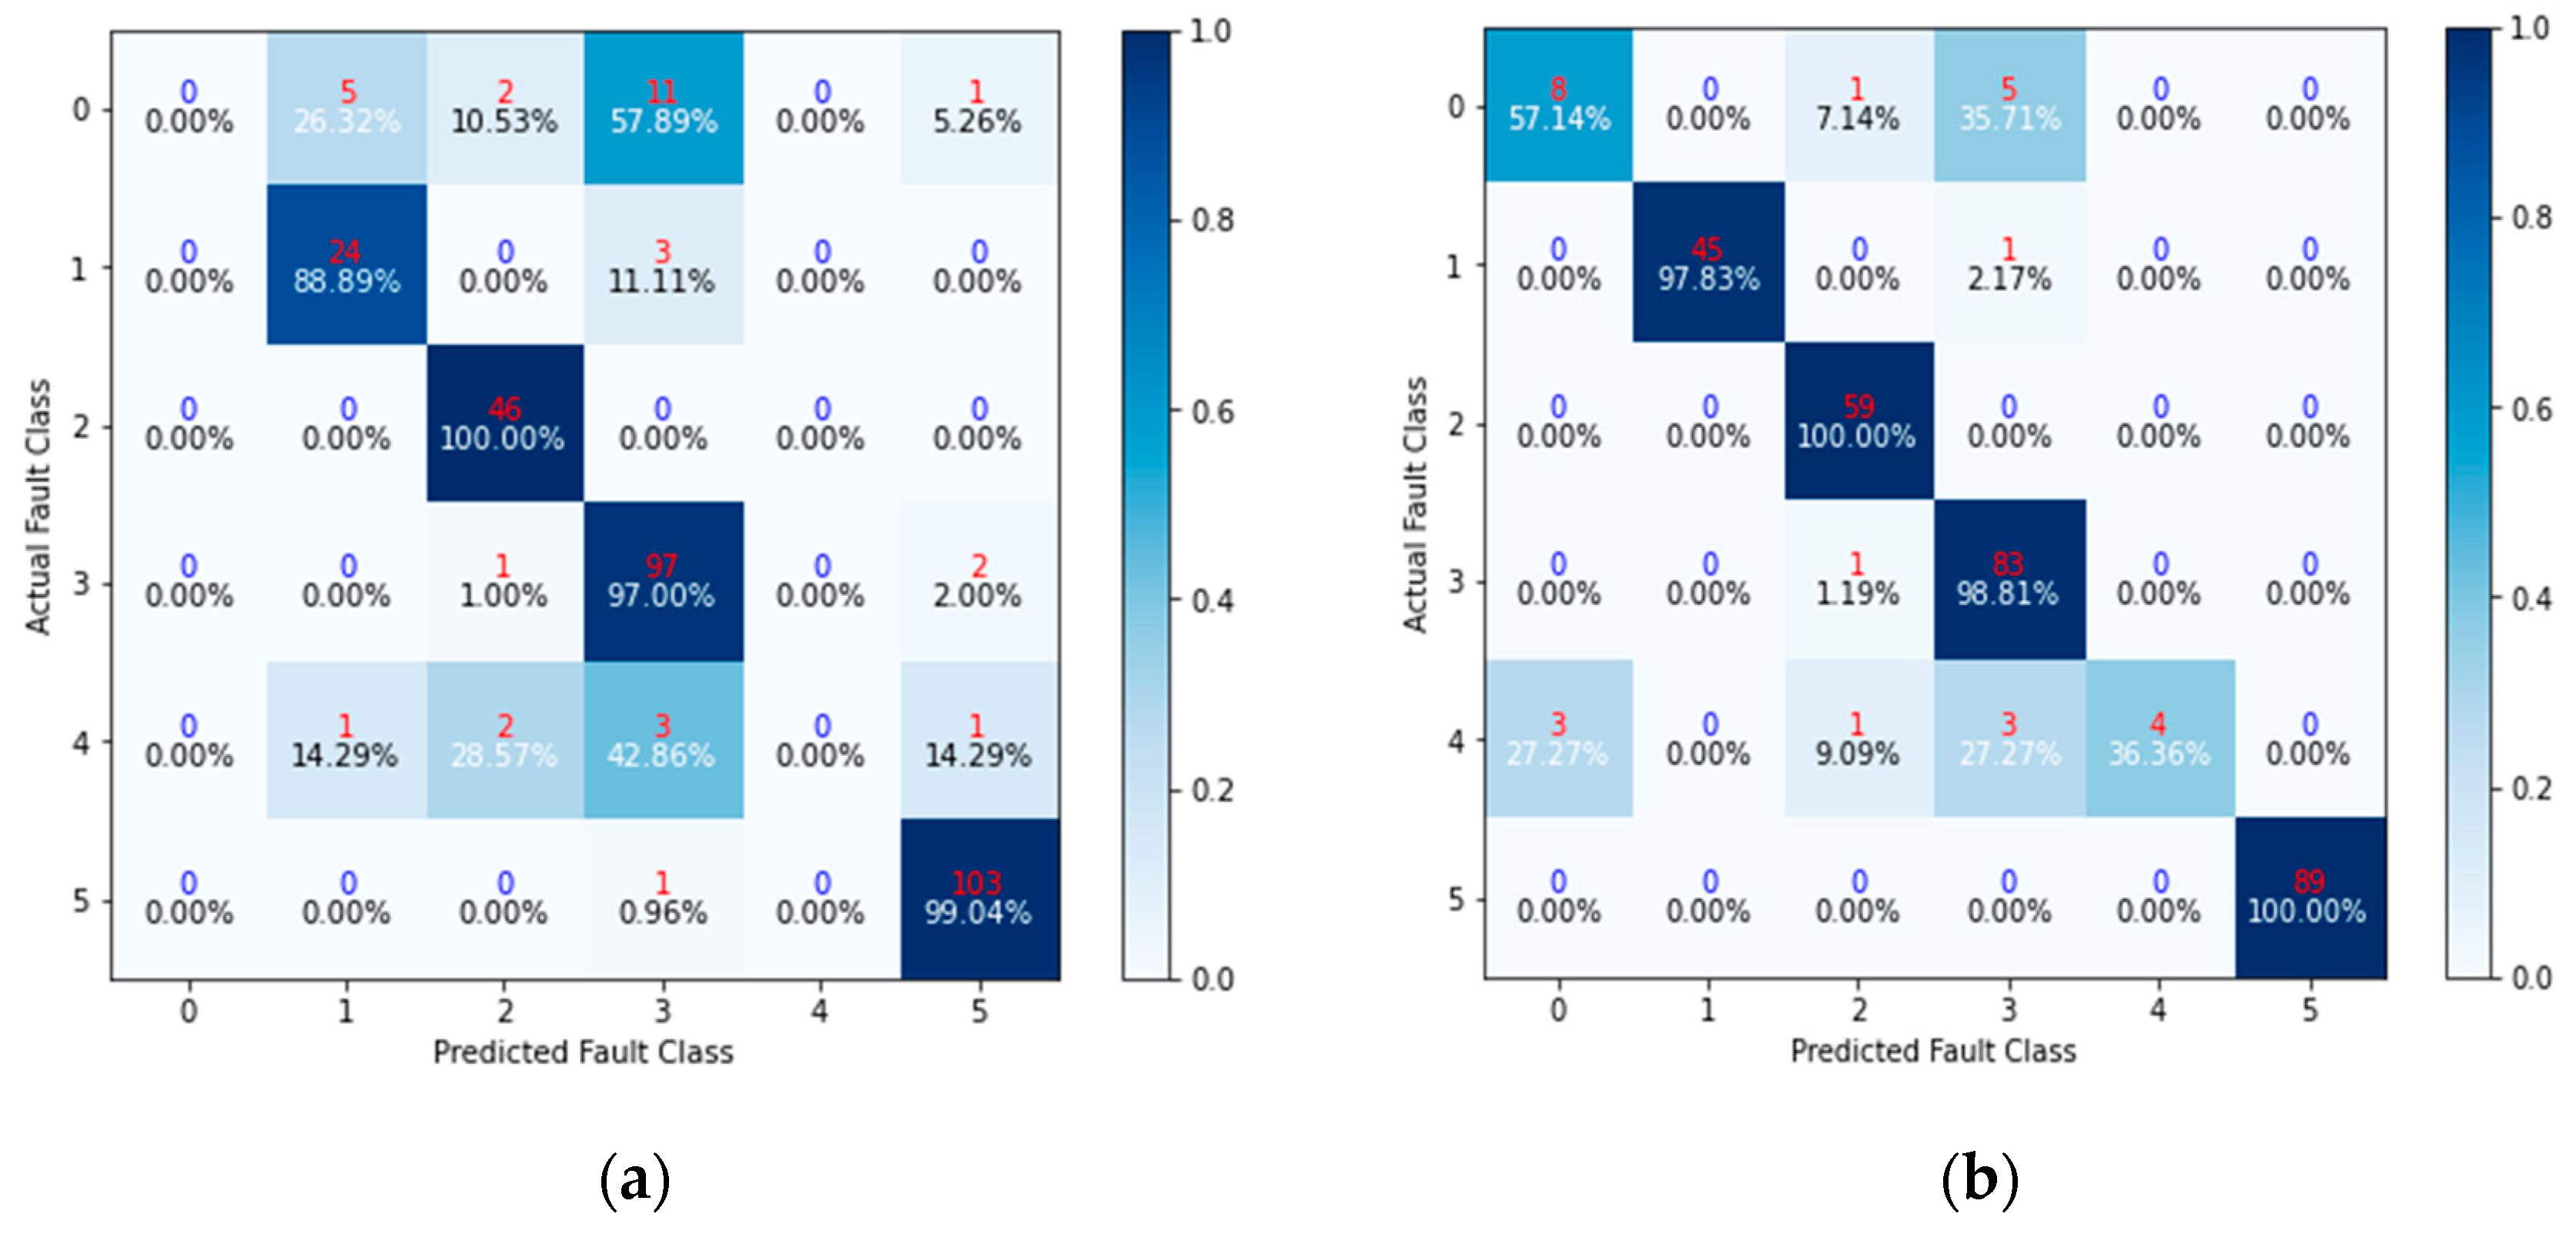
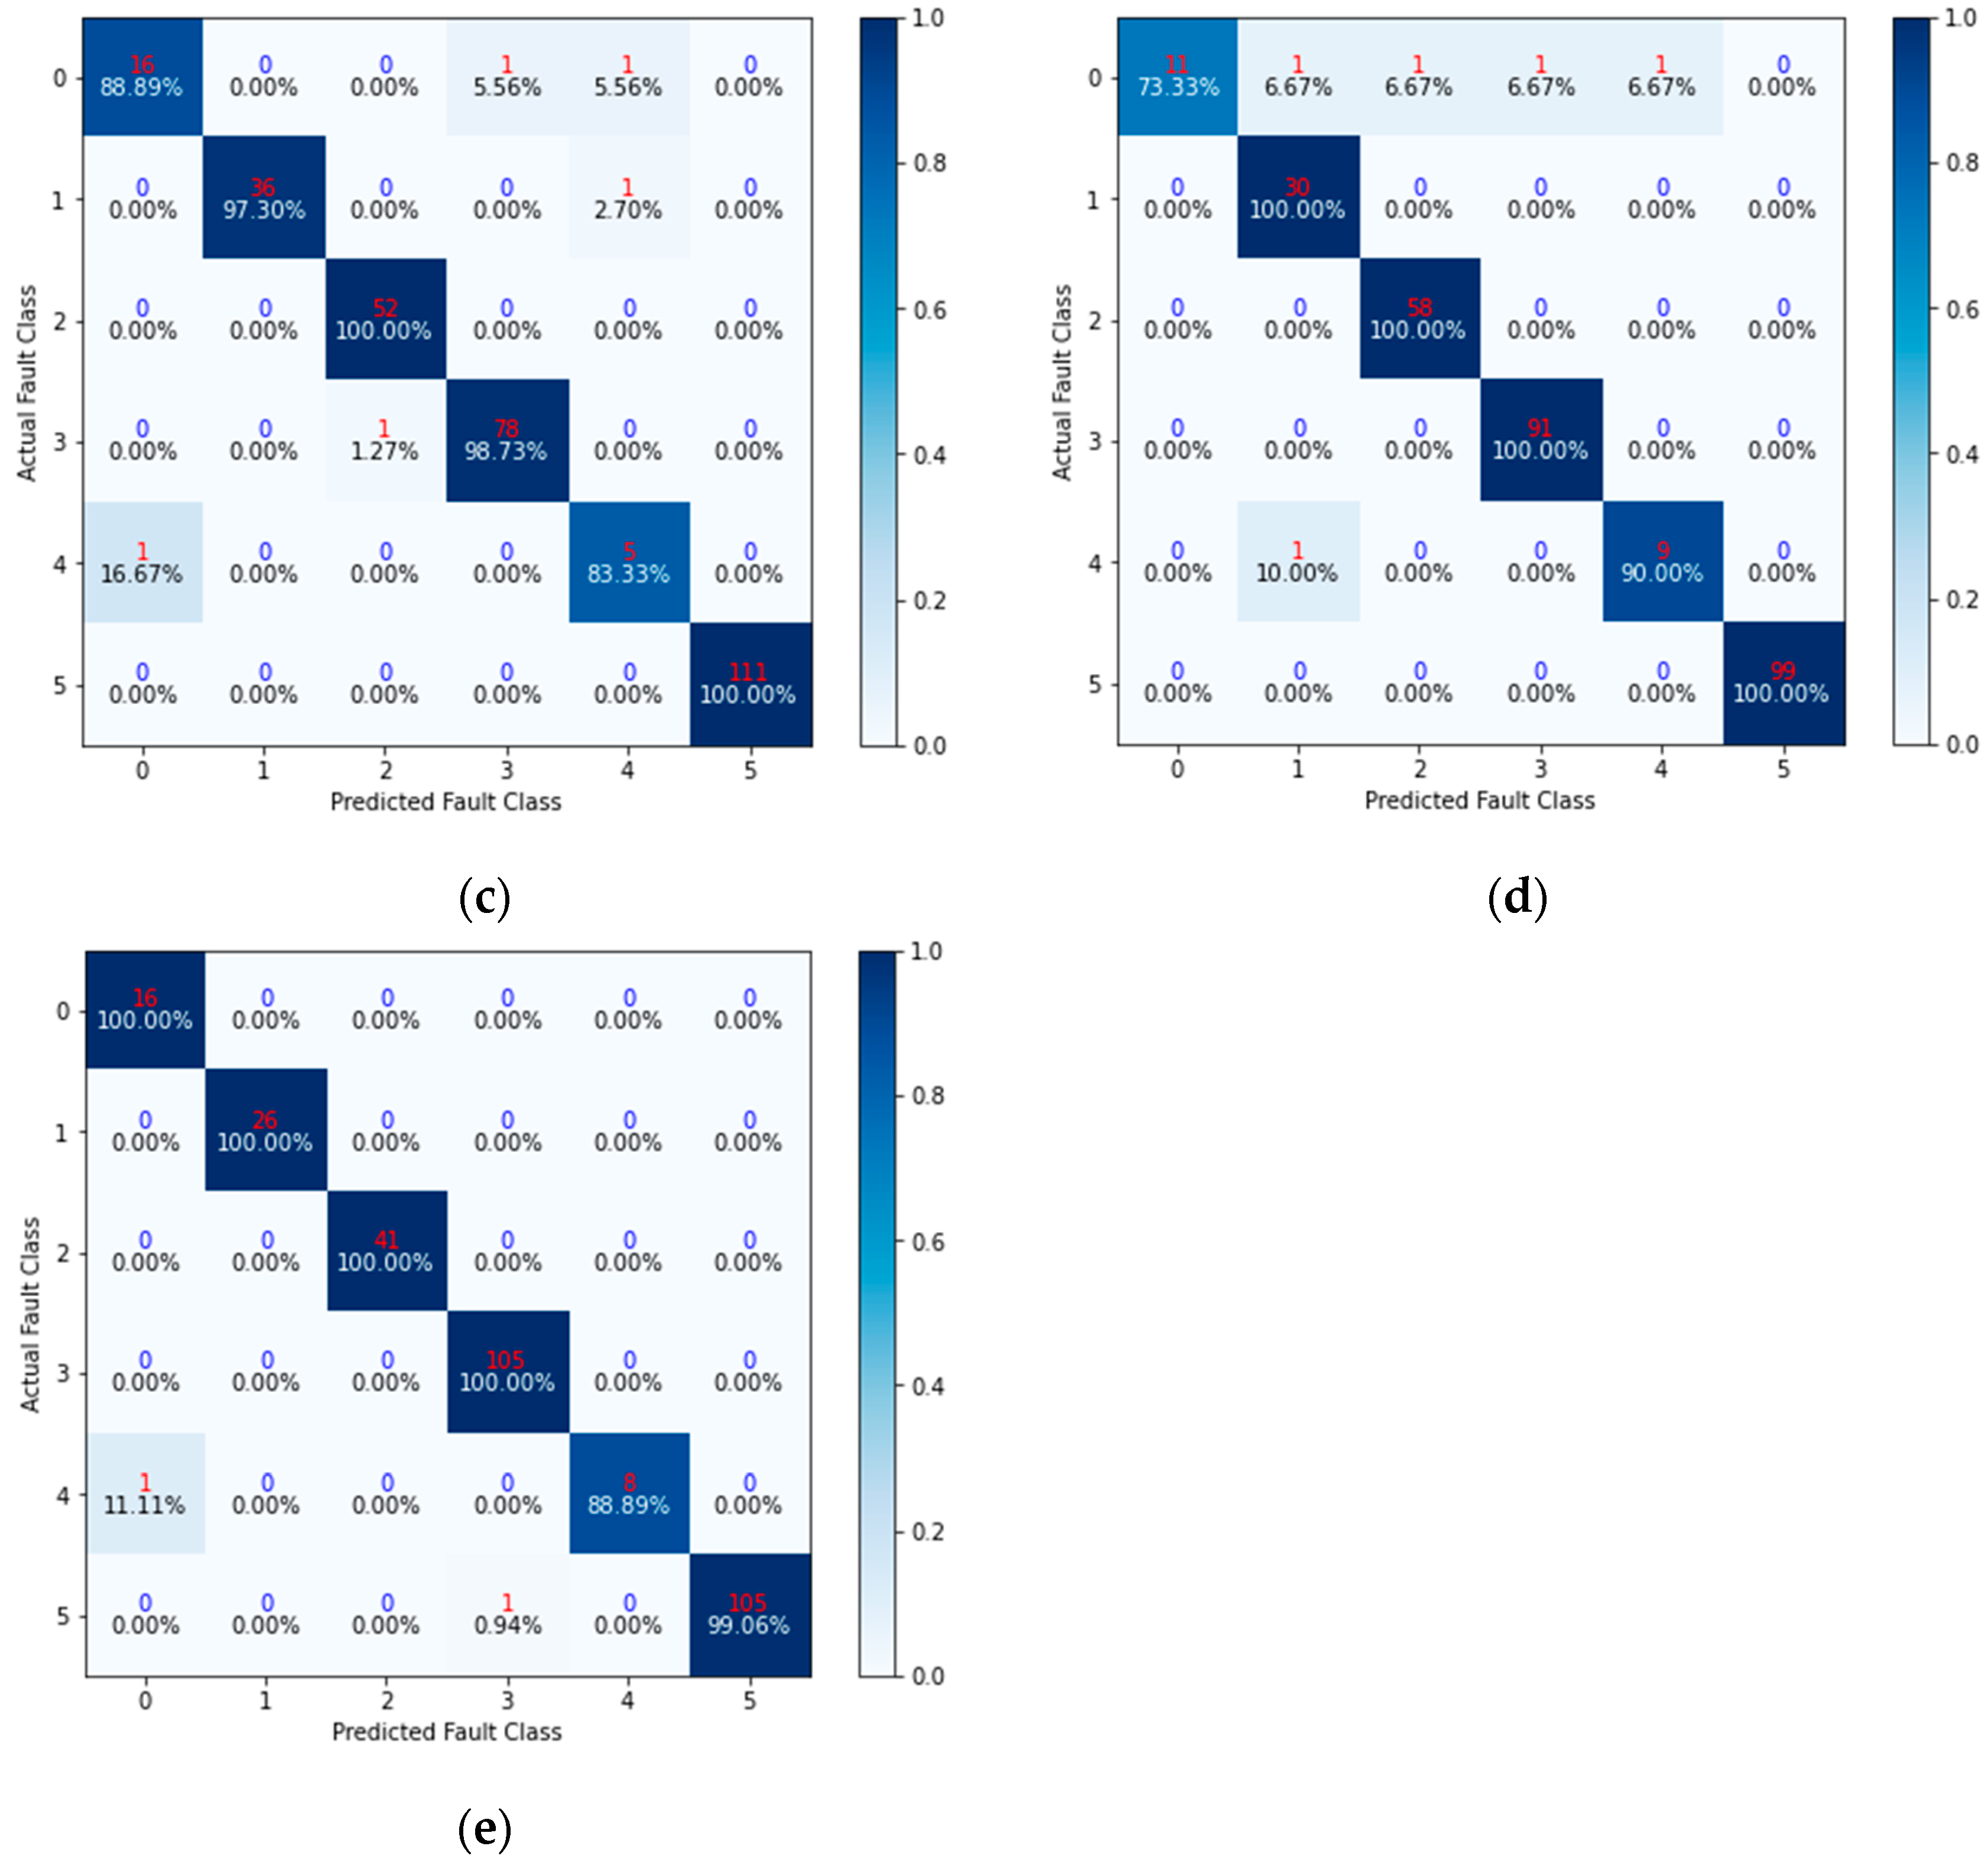
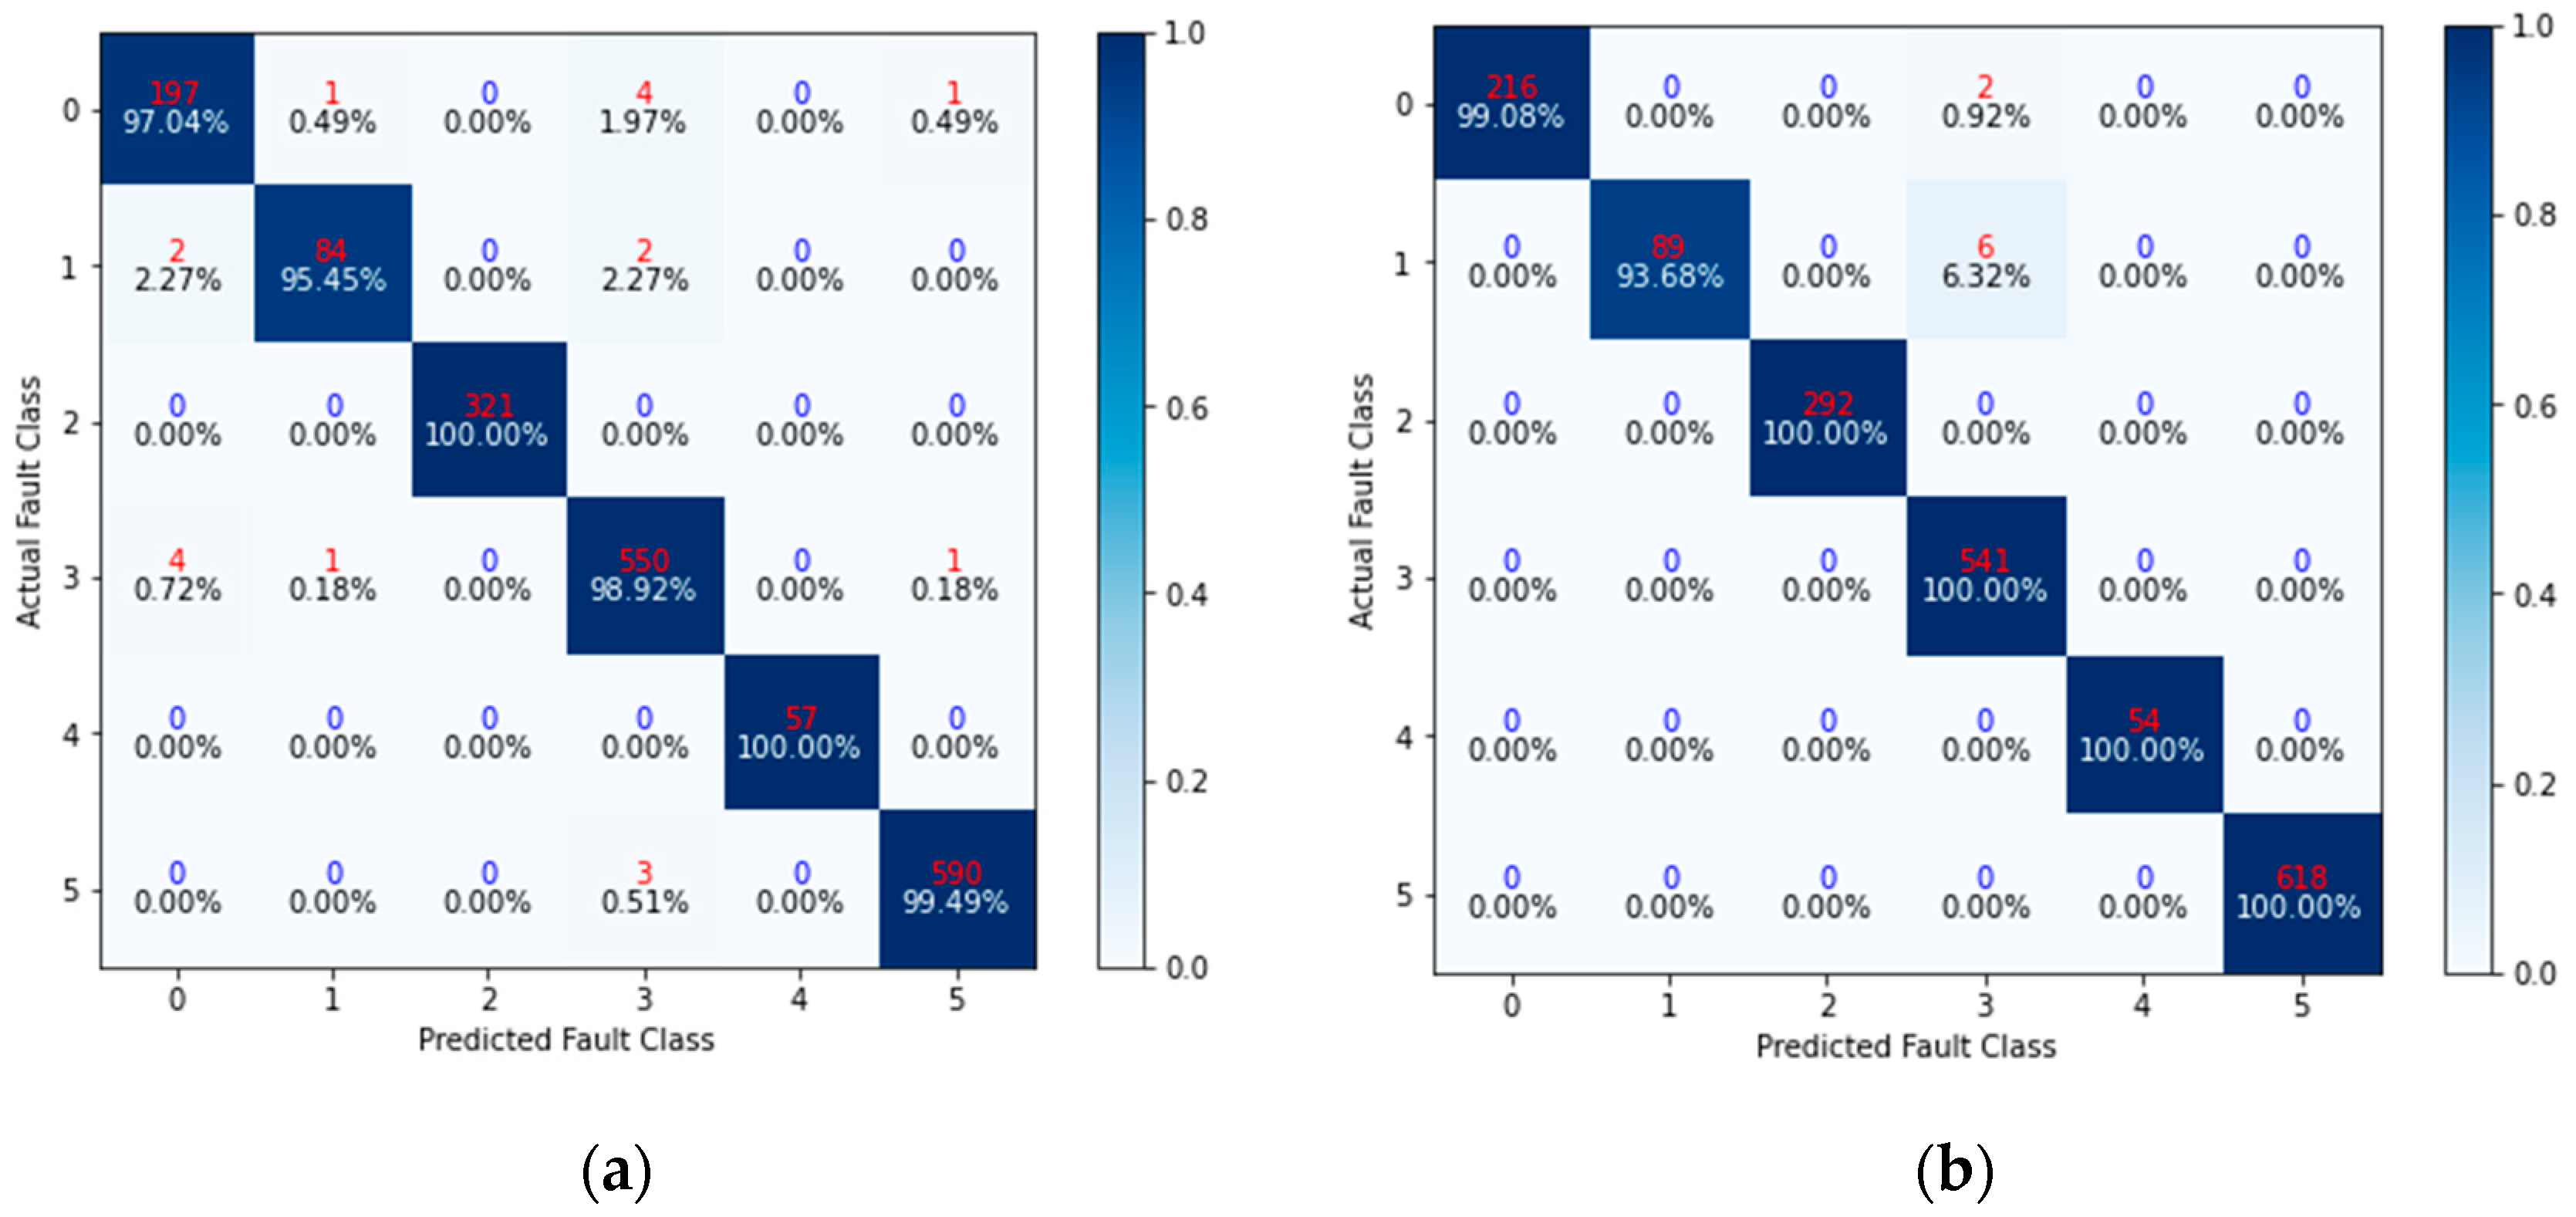
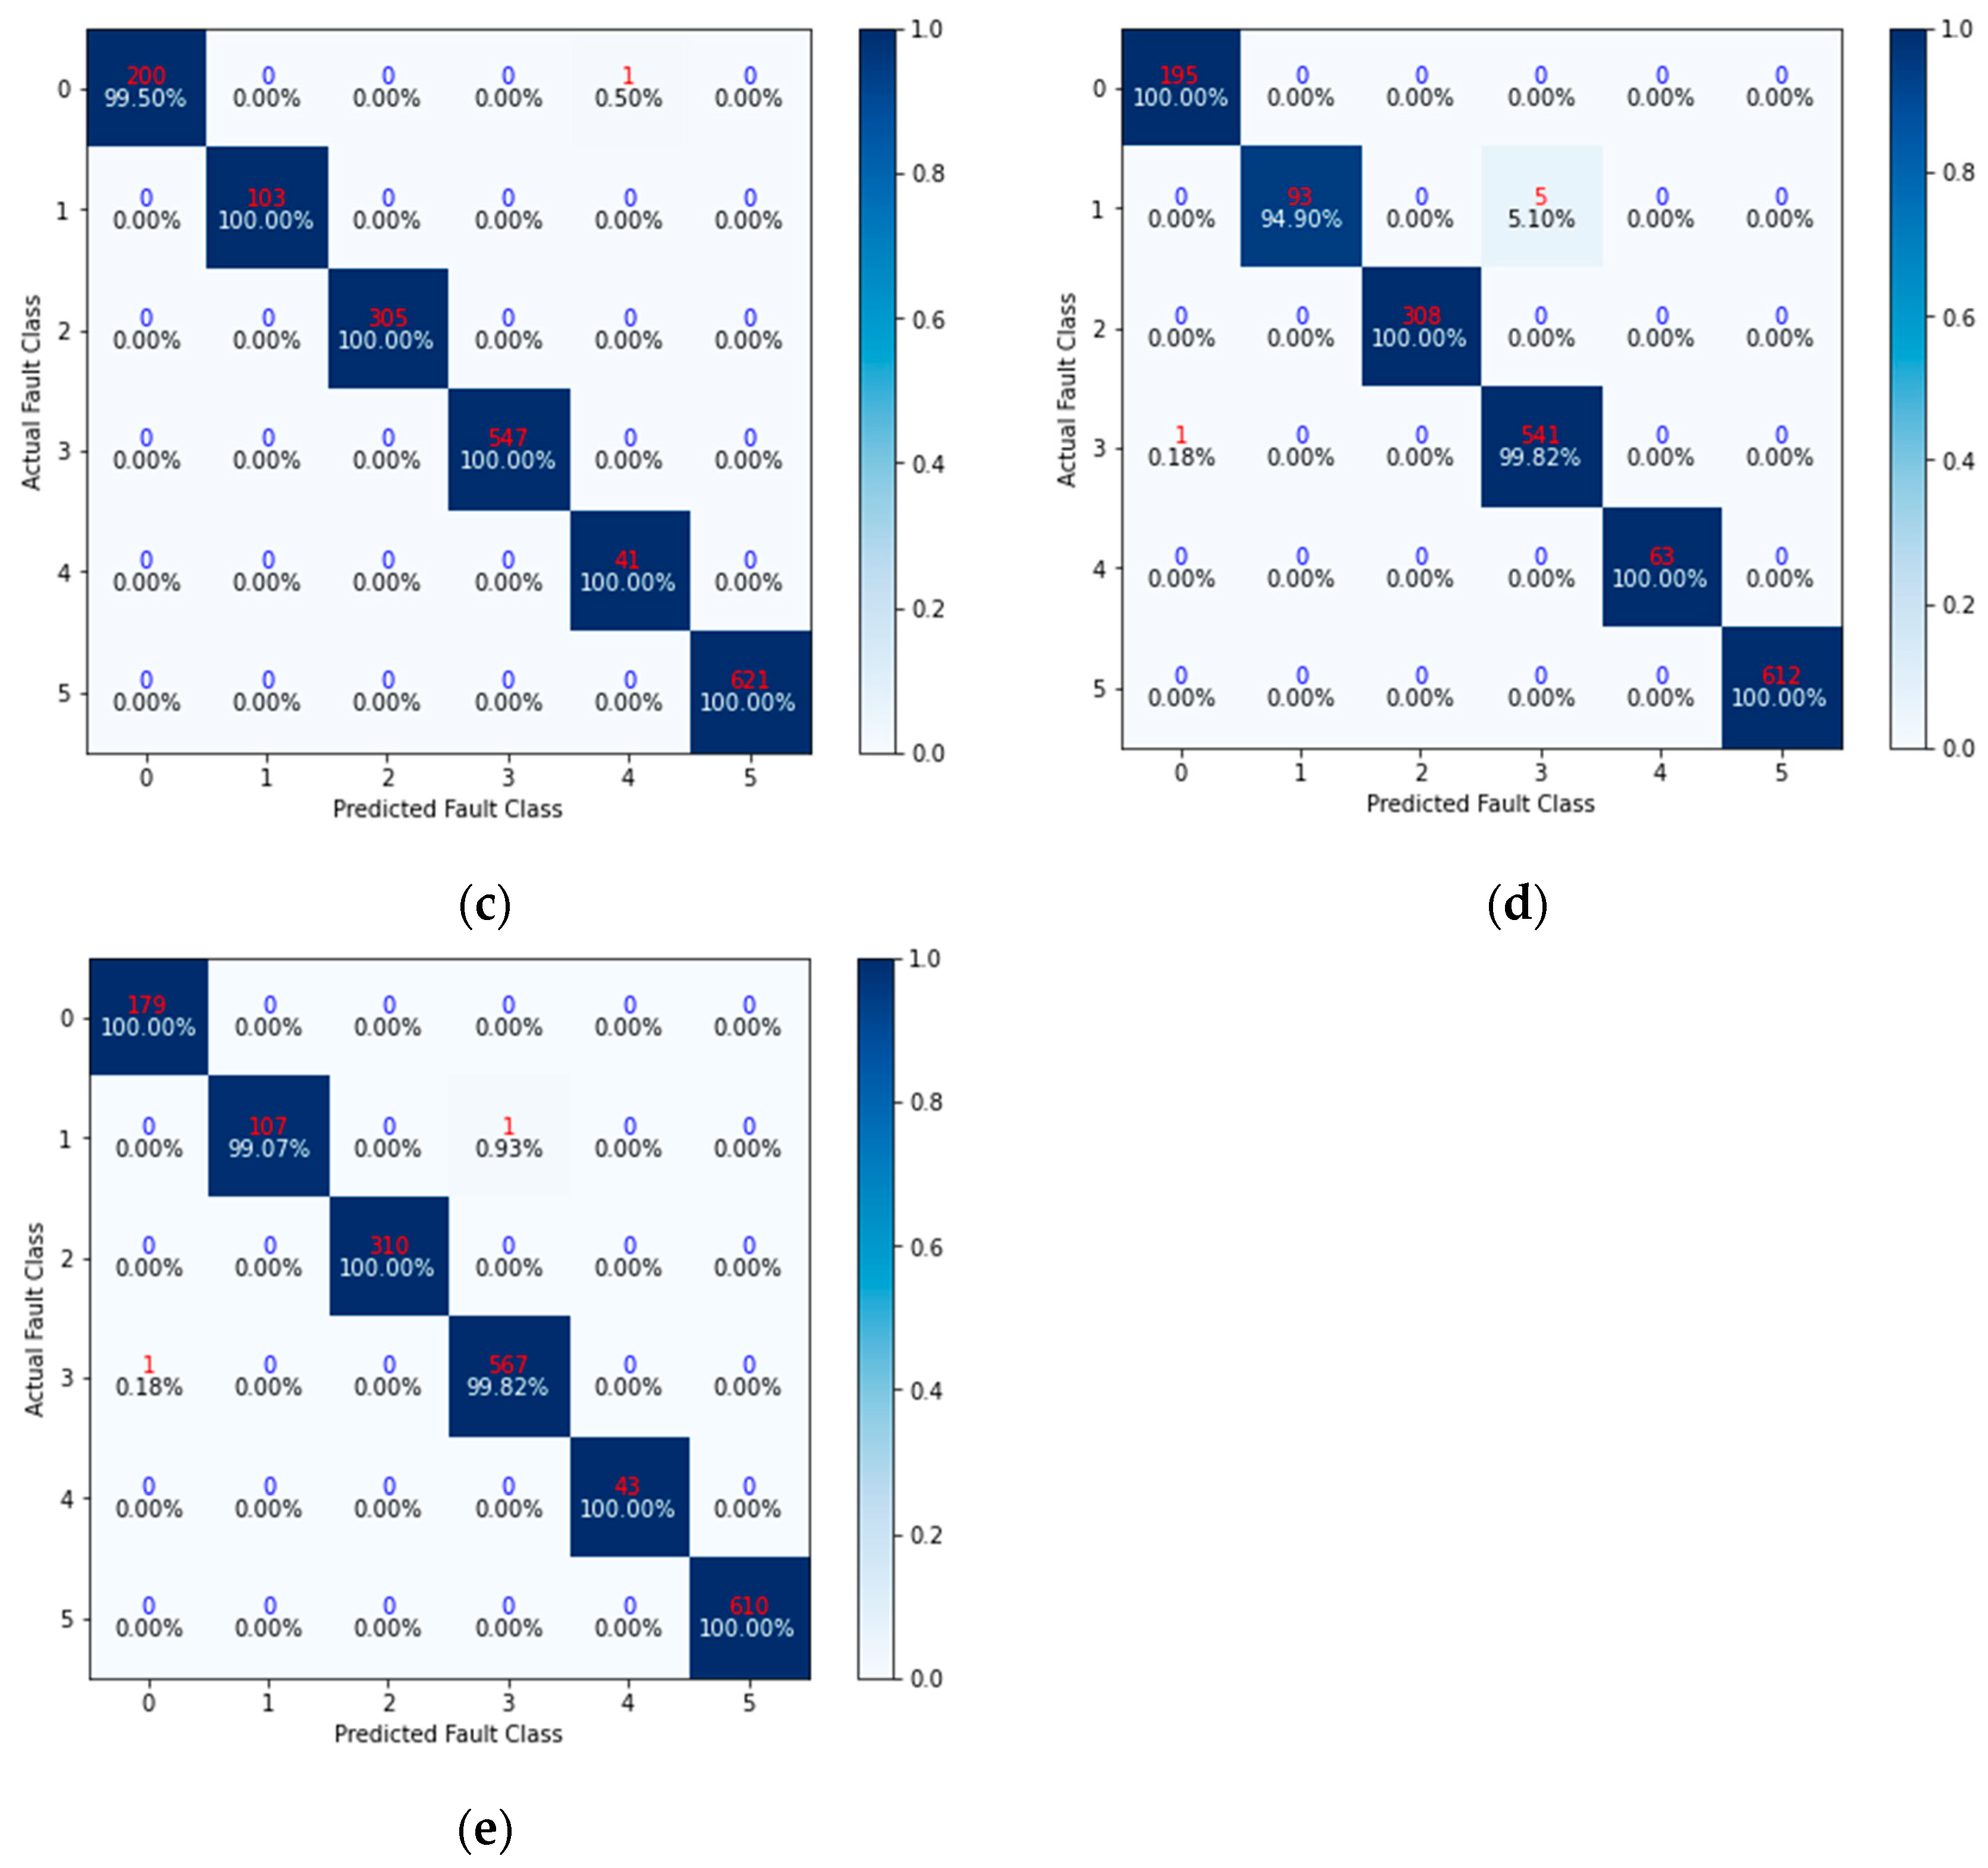
The O+B and E+B datasets were taken as examples to further validate the effectiveness of the DEIAM model in fault diagnosis across various signal equipment categories. The fivefold cross-validation approach was employed for training, and the evaluation results of the confusion matrix were obtained using the prediction data from the 50th round of each fold, as illustrated in Figure 6 and Figure 7.
The comparison of fault diagnosis accuracy in the 50th round per fold between Figure 6 and Figure 7 reveals that the DEIAM model performs better on the E+B dataset than on the O+F dataset. Additionally, Table 1 shows that category 4 represents CTC equipment faults while category 0 represents interlocking equipment faults, with their proportions of fault samples amounting to 2.84% and 5.41%, respectively, indicating their status as minority categories. Regarding the diagnosis effect for minority categories, it can be observed from Figure 6 and Figure 7 that the DEIAM model demonstrated excellent performance on the E+B dataset. For instance, for category 4, its fault diagnosis accuracy is reported as 0% and 100% in Figure 6a and Figure 7a, respectively; similarly, for category 0, its fault diagnosis accuracy is reported as 0% and 97.04% in these figures, respectively. These results demonstrate that for the E+B dataset, the DEIAM model exhibits enhanced response time and improved accuracy in fault diagnosis for minority categories. This suggests that the data processing method proposed in this study effectively mitigates the impact of data imbalance on model performance and enhances the efficacy of fault diagnosis for minority categories.

5. Conclusions

In order to enhance the level of intelligent operations and maintenance of railway signal equipment, a fault diagnosis model based on DEIAM is proposed here, using text data from signal equipment faults in railway units over the past decade. The main conclusions are as follows.
(1)
Data processing technology that includes data enhancement and the retention of names and verbs was shown to improve the size and quality of the dataset compared to the original dataset (O+F). This improvement effectively enhanced the diagnostic performance of the model.
(2)
The improved model, incorporating attention mechanisms, demonstrated improved focus on text features that positively impact classification tasks. This resulted in better fault text feature extraction and overall model performance compared to benchmark models such as BiLSTM and CNNs.
(3)
By integrating sequential and local text features, the enhanced representation of text features was achieved, thereby strengthening the diagnostic performance of the DEIAM model. Compared to other models, the DEIAM model showed superior performance in the accuracy, precision, recall, and F1 evaluation indicators. These results validated its effectiveness in the fault diagnosis and analysis of signal equipment. Furthermore, this provides a new method for further analyzing fault mechanisms and diagnosing signal equipment using big data.
The next phase of research will focus on: (1) expanding the range of signal equipment fault data categories and collecting more signal fault data to validate the universality and effectiveness of the proposed method; and (2) comprehensively addressing time cost and computing power issues related to the attention mechanism in model operation, with a view to further optimizing overall performance.

Author Contributions

Conceptualization, N.Y. and Y.Z.; methodology, J.Z. and B.Z.; data curation, B.Z.; writing—original draft preparation, N.Y.; writing—review and editing, N.Y. and Y.Z.; visualization, B.Z. All authors have read and agreed to the published version of the manuscript.

Funding

This research was funded by the National Natural Science Foundation of China (grants 51967010 and 52262045).

Data Availability Statement

The data that have been used in this study are confidential.

Conflicts of Interest

The authors declare no conflicts of interest.

References

  1. Wang, F.; Xu, T.; Tang, T.; Zhou, M.; Wang, H. Bilevel Feature Extraction-Based Text Mining for Fault Diagnosis of Railway Systems. IEEE Trans. Intell. Transp. 2017, 18, 49–58. [Google Scholar] [CrossRef]
  2. Zhou, Q.; LI, X. Research on short text classification method of railway signal equipment fault based on MCNN. J. Meas. Sci. Instrum. 2019, 16, 2859–2865. [Google Scholar] [CrossRef]
  3. Song, P.; Chen, Y.; Wang, H. Fault diagnosis of on-board equipment based on CNN-ADABOOST. J. Chongqing Univ. Post. Tel. 2023, 35, 1174–1182. [Google Scholar]
  4. Lu, R.; Lin, H.; Xu, L.; Lu, R.; Zhao, Z.; Bai, W. Fault diagnosis based on-board equipment of train control system CNN and PSO-SVM hybrid model. J. Meas. Sci. Instrum. 2022, 13, 430–438. [Google Scholar] [CrossRef]
  5. Wei, W.; Zhao, X.; Ding, Y.; Fan, L. Fault Diagnosis of Vehicle On-board Equipment Based on BiLSTM and Attention Mechanism. Tiedao Xuebao/J. China Railw. Soc. 2022, 44, 53–62. [Google Scholar] [CrossRef]
  6. Martins, A.F.T.; Astudillo, R.F. From softmax to sparsemax: A sparse model of attention and multi-label classification. In Proceedings of the 33rd International Conference on Machine Learning, ICML 2016, New York, NY, USA, 20–22 June 2016; Volume 4, pp. 2432–2443. [Google Scholar] [CrossRef]
  7. Kim, Y.; Denton, C.; Hoang, L.; Rush, A.M. Structured attention networks. In Proceedings of the 5th International Conference on Learning Representations, ICLR 2017—Conference Track, Toulon, France, 24–26 April 2017. [Google Scholar] [CrossRef]
  8. Yang, Z.; Yang, D.; Dyer, C.; He, X.; Smola, A.; Hovy, E. Hierarchical attention networks for document classification. In Proceedings of the 2016 Conference of the North American Chapter of the Association for Computational Linguistics: Human Language Technologies, NAACL HLT 2016, San Diego, CA, USA, 12–17 June 2016; pp. 1480–1489. [Google Scholar] [CrossRef]
  9. Li, X.; Zhang, P.; Shi, T.; Li, P. Research on Fault Diagnosis Method for High-speed Railway Signal Equipment Based on Deep Learning Integration. J. Chin. Railw. Soc. 2020, 42, 97–105. [Google Scholar] [CrossRef]
  10. Wei, J.; Zou, K. EDA: Easy data augmentation techniques for boosting performance on text classification tasks. In Proceedings of the 2019 Conference on Empirical Methods in Natural Language Processing and 9th International Joint Conference on Natural Language Processing, Hong Kong, China, 3–7 November 2019; pp. 6382–6388. [Google Scholar] [CrossRef]
  11. Chawla, N.V.; Bowyer, K.W.; Hall, L.O.; Kegelmeyer, W.P. SMOTE: Synthetic minority over-sampling technique. J. Artif. Intell. Res. 2002, 16, 321–357. [Google Scholar] [CrossRef]
  12. Cieslak, D.A.; Chawla, N.V.; Striegel, A. Combating imbalance in network intrusion datasets. In Proceedings of the 2006 IEEE International Conference on Granular Computing, Atlanta, GA, USA, 10–12 May 2006; pp. 732–737. [Google Scholar] [CrossRef]
  13. Breiman, L. Random forests. Mach. Learn. 2001, 45, 5–32. [Google Scholar] [CrossRef]
  14. Friedman, J. Greedy function approximation: A gradient boosting machine. Ann. Stat. 2001, 29, 1189–1232. [Google Scholar] [CrossRef]
  15. Yang, L.; Li, P.; Xue, R.; Ma, X.; Wu, Y.; Zou, D. Intelligent Classification of Faults of Railway Signal Equipment Based on Imbalanced Text Data Mining. J. Chin. Railw. Soc. 2018, 40, 59–66. [Google Scholar] [CrossRef]
  16. Hofmann, T. Probabilistic Latent Semantic Indexing. ACM Sigir. 2017, 51, 211–218. [Google Scholar] [CrossRef]
  17. Wang, T.; Cai, Y.; Leung, H.; Lau, R.Y.K.; Xie, H.; Li, Q. On entropy-based term weighting schemes for text categorization. Know. Info. Sys. 2021, 63, 2313–2346. [Google Scholar] [CrossRef]
  18. Li, W.; Qi, F.; Tang, M.; Yu, Z. Bidirectional LSTM with self-attention mechanism and multi-channel features for sentiment classification. Neurocomputing 2020, 387, 63–77. [Google Scholar] [CrossRef]
  19. Wei, S.; Yuan, Y.; Wang, J.; Hu, F. Research of Fault Feature Extraction and Diagnosis Method for CTCS On-board Equipment(OBE) Based on Labeled-LDA. J. Chin. Railw. Soc. 2019, 41, 56–66. [Google Scholar] [CrossRef]
  20. Wei, W.; Zhao, X. Bi-TLLDA and CSSVM based fault diagnosis of vehicle on-board equipment for high speed railway. Meas. Sci. Technol. 2021, 32, 085005. [Google Scholar] [CrossRef]
  21. Zhou, L.; Dang, J.; Wang, Y.; Zhang, Z. Fault Diagnosis for On-board Equipment of Train Control System Based on CNN-CSRF Hybrid Model. Tiedao Xuebao/J. Chin. Railw. Soc. 2020, 42, 94–101. [Google Scholar] [CrossRef]
  22. Shang, G.; Meng, Y.; Yang, J.; Cai, B. LSTM-BP neural network based fault diagnosis for on-board equipment of Chinese train control system. J. Beijing Jiaotong Univ. 2019, 43, 54–62. [Google Scholar]
  23. Lin, H.; Hu, N.; Lu, R.; Yuan, T.; Zhao, Z.; Bai, W.; Lin, Q. Fault Diagnosis of a Switch Machine to Prevent High-Speed Railway Accidents Combining Bi-Directional Long Short-Term Memory with the Multiple Learning Classification Based on Associations Model. Machines 2023, 11, 1027. [Google Scholar] [CrossRef]
  24. Shi, L.; Wang, Y.; Cheng, Y.; Weii, R. Review of Attention Mechanism in Natural Language Processing. Data Anal. Know. Dis. 2020, 4, 1–14. [Google Scholar]
  25. Chen, L.; Zhang, H.; Xiao, J.; Nie, L.; Shao, J.; Liu, W.; Chua, T.-S. SCA-CNN: Spatial and channel-wise attention in convolutional networks for image captioning. In Proceedings of the 30th IEEE Conference on Computer Vision and Pattern Recognition, CVPR 2017, Honolulu, HI, USA, 21–26 July 2017; pp. 6298–6306. [Google Scholar] [CrossRef]
  26. Hochreiter, S.; Schmidhuber, J. Long short-term memory. Neural Comput. 1997, 9, 1735. [Google Scholar] [CrossRef]
  27. Fan, C.; Ma, K. Text classification model based on multi channel attention mechanism. Microelectron. Comput. 2022, 39, 33–40. [Google Scholar] [CrossRef]
  28. Liu, Y.; Huang, J.; Ma, Y. An Automatic Method Using Hybrid Neural Networks and Attention Mechanism for Software Bug Triaging. Comp. Rese. Deve. 2020, 57, 461–473. [Google Scholar] [CrossRef]
Figure 1. Attention mechanism calculation process.
Machines 12 00334 g001
Figure 2. LSTM unit structure.
Machines 12 00334 g002
Figure 4. Comparison of evaluation indices based on different data augmentation and data processing algorithms.
Machines 12 00334 g004
Figure 5. Comparison of the effects of six models based on different data features and attention mechanisms on the O+F and E+F test datasets: (a) BiLSTM model; (b) CNN; (c) BiLSTM+CNN; (d) CNN+ICWA; (e) BiLSTM+attention; (f) DEIAM.
Machines 12 00334 g005
Figure 6. Confusion matrix for each fault class of the DEIAM model on the O+F dataset: (a) onefold; (b) twofold; (c) threefold; (d) fourfold; (e) fivefold.
Machines 12 00334 g006aMachines 12 00334 g006b
Figure 7. Confusion matrix for each fault class of the DEIAM model on the E+B dataset: (a) onefold; (b) twofold; (c) threefold; (d) fourfold; (e) fivefold.
Machines 12 00334 g007aMachines 12 00334 g007b
Table 1. Classification and proportion of each category in the original dataset.
LabelCategoryFault DescriptionNumber/ItemPercentage
0Computer interlockingCommunication board equipment failure, acquisition board failure…825.41%
1Signal lightSignal light broken, unable to open…16610.96%
2ATPTrigger emergency braking, communication interrupted…25616.90%
3Track circuitInsulation damage, red light band, white light band…45930.30%
4CTCTerminal display error, crash…432.84%
5SwitchPoor adhesion of switches, no indication of switch positioning/reversal…50933.60%
Table 2. Sample numbers by category in the enhanced dataset.
LabelNumber of Original Data/ItemsNumber of Data Enhanced
082492
1166996
22561536
34592754
443258
55093054
Total15159090
Table 3. Comparison results based on different data enhancement and data processing algorithms (%).
DatasetAccuracyPrecisionRecallF1
O+F93.1493.1081.6178.41
O+B95.8794.3184.2884.08
E+F97.4198.1794.9795.17
E+B98.7298.7596.9296.94
Table 4. Comparison of the effects of 5 models without considering the attention mechanism (%).
ModelAccuracyPrecisionRecallF1
LSTM93.8593.6591.1891.22
LSTM+CNN94.4794.1891.6791.67
BiLSTM94.4694.1092.2491.93
CNN94.9394.8092.4292.47
BiLSTM+CNN95.5495.4693.0093.13
Table 5. The prediction results of the DEIAM model in fivefold incremental learning (%).
Per FoldAccuracyPrecisionRecallF1
K = 195.7295.7387.7187.20
K = 299.3599.3699.3499.35
K = 399.5299.5499.1899.35
K = 499.4299.4499.0599.22
K = 599.6099.6999.3199.56
Mean value98.7298.7596.9296.94
Table 6. Comparison of the effects of five models based on different attention mechanisms (%).
ModelAccuracyPrecisionRecallF1
CNN+ICWA96.4596.3993.8893.72
BiLSTM+attention95.5995.2192.8793.67
(BiLSTM+attention)+CNN96.0396.1693.4093.37
BiILSTM+(CNN+ICWA)96.6396.5894.7194.75
DEIAM98.7298.7596.9296.94
Table 7. Comparison of the effects of six models based on different data features and attention mechanisms (%).
DatasetModelAccuracyPrecisionRecallF1
O+FBiLSTM91.3689.1375.1274.23
CNN92.3291.4074.7572.30
BiLSTM+CNN92.8793.2181.0780.61
CNN+ICWA94.0193.3882.3181.70
BiLSTM+attention93.3291.1981.0581.13
DEIAM95.3794.4183.9883.78
E+BBiLSTM94.4694.1092.2491.93
CNN94.9394.8092.4292.47
BiLSTM+CNN95.5495.4693.0093.13
CNN+ICWA96.4596.3993.8893.72
BiLSTM+attention95.5995.2192.8793.67
DEIAM98.7298.7596.9296.94
Disclaimer/Publisher’s Note: The statements, opinions and data contained in all publications are solely those of the individual author(s) and contributor(s) and not of MDPI and/or the editor(s). MDPI and/or the editor(s) disclaim responsibility for any injury to people or property resulting from any ideas, methods, instructions or products referred to in the content.