Abstract
The wheeled chassis, which is the carrying device of the existing handling robot, is mostly only suitable for flat indoor environments and does not have the ability to work on outdoor rugged terrain, greatly limiting the development of chassis driven handling robots. On this basis, this paper innovatively designs a four-wheel-driving Ackerman chassis with strong vibration absorption and obstacle surmounting capabilities and conducts performance research and optimization on it through quantitative experiments and dynamic simulation. Firstly, based on the introduction of the working principle and structure of the four-wheel-driving Ackerman carrier chassis, a multi-sensor distributed dynamic performance test system is constructed through the analysis of the chassis performance evaluation index. Then, according to the quantitative operation experiment of the chassis, the vibration and acceleration characteristics of the chassis at different positions of the chassis, the amount of slip and straightness of the chassis under different running distance, and the operating characteristics of the chassis under different road conditions and different damping springs conditions were analyzed respectively, which verified the rationality of the chassis design. Finally, by constructing the chassis dynamics simulation model; the influence law of chassis structure; and performance parameters such as chassis wheelbase, guide rod structure, and parameters, wheel friction coefficient and assembly error on the dynamic characteristics of the chassis is studied, and the optimal structure of the four-wheel-driving Ackerman chassis is determined while it is verified based on the simulation results. The research shows that the four-wheel-driving Ackerman chassis has good vibration performance and stability and has strong adaptability to different roads. After optimization, the vibration performance, stability, amount of slip, and straightness of the chassis structure are significantly improved, and the straightness is reduced to 0.399%, which is suitable for precise carriage applications on the chassis. The research has important guiding significance for promoting the development and application of wheeled chassis.
1. Introduction
As a typical service-oriented robot, material-handling robots have developed rapidly and have been applied to a series of industries, such as express logistics, industrial manufacturing, warehouse transportation, hospitals, docks, agriculture, and automobiles. It is estimated that the market for material-handling robots will exceed 18 billion dollars by 2027. However, most of the material-handling robots currently on the market are designed with flat indoor floors, which have poor vibration-reduction ability and do not have the ability to work in obstacles or rough and complex environments. They are only suitable for good indoor factory environments. However, many industries require material handling operations on uneven indoor or outdoor roads, which brings tests to the obstacle crossing ability of the material handling robot chassis and the ability to travel in rugged and complex environments, becoming a pain point that needs to be solved urgently for wheeled chassis.
As the important means of delivery, many scholars have conducted extensive research on the performance, structural design, and optimization methods of wheeled chassis in the early stage. Zheng et al. [1] designed the four-wheel, motor-driven chassis structure; the rotation angle of the front wheel and the variation characteristics of the distance between the front wheel cover and the front wheel are analyzed by motion simulation, and the interference and motion coordination of the structure are verified. Lv et al. [2] proposed a design scheme for the front-axle-swing-steering chassis with rotational and floating functions and determined the optimal design scheme by using the evaluation method of innovative design of mechanical mechanism motion scheme and interference inspection. Zheng [3] used finite element analysis to verify the strength of the modular designed omnidirectional electric chassis. On the basis of the study of the differential steering control strategy of the omnidirectional electric chassis, the control system for the omnidirectional electric chassis was designed. Tian [4] proposed the slip-steering electric chassis with independent control of each wheel’s speed and obtained the optimization method of slip steering power through kinematics analysis and power consumption calculation. Based on the establishment of the four-wheel vehicle dynamics model, Yang [5] designed the control strategy of the four-wheel steering system with feedforward and feedback and the control strategy of the direct yaw moment system and established the rule-based integrated control strategy. Zhu et al. [6] proposed an omnidirectional electric chassis with four-wheel independent driving and independent steering and achieved chassis steering control by establishing the mathematical model of the four-wheel differential steering system. Wang [7] established an intelligent car based on optical guidance and differential steering. The strength, stiffness, uniform speed, acceleration, and steering of the car chassis were simulated using finite element statics analysis, kinematics and dynamics simulation, on the basis of verifying its reasonable structure, a PID fuzzy control strategy was established to reduce overshoot and improve response speed. In order to reduce the influence of the internal and external parameter errors of the inertial measurement unit on the positioning and pose estimation accuracy of wheeled robots, Peng et al. [8] proposed a new algorithm for the internal parameter calibration of the mechanical wheel omnidirectional mobile platform and the external parameter calibration of the mechanical chassis-inertial measurement unit based on principal component analysis and nonlinear optimization. Wang et al. [9] developed a pure electric ground vehicle with four independent driving wheels, and on the basis of the torque response and power efficiency diagram of the motor in the wheel obtained through experimental testing, a torque distribution method to optimize the energy efficiency of four-wheel vehicle operation was proposed. Joa et al. [10] present a four-wheel independent brake control method for vehicle stability under various road conditions without any tire–road friction information and verified the performance of the method via both computer simulations and vehicle tests. Wang et al. [11] perceived the front ground information through the ground detection device installed in front of each wheel of the four wheels of the agricultural vehicle, and then proposed a fast active body leveling method to actively prevent or reduce the body tilt. Huang et al. [12] proposed a path tracking integrated chassis control algorithm using four-wheel steering and direct yaw moment control for four-wheel chassis, which improved the chassis’s path-tracking performance and handling stability. Chi et al. [13] designed a new steer-by-wire suspension system that can meet the large-scale four-wheel independent steering function and verified its feasibility through system multi-body dynamics simulation and time-frequency performance analysis. Zhu et al. [14] designed a forestry chassis with an articulated body with three degrees of freedom and installed luffing wheel legs and carried out a dynamic simulation study on its motion performance based on the proposed obstacle-crossing strategy. Zhang et al. [15] proposed an improved two-front-wheel steering mechanism and an omnidirectional independent steering mechanism integrated with steer-by-wire, which improved the maneuverability and flexibility of the four-wheel steering four-wheel-driving electric vehicle steering system. To solve the problem of uneven distribution of yaw torque on each independent wheel of agricultural four-wheel vehicles, Xu et al. [16] proposed a steering wheel steering angle control method using electric push rods as actuators, which combines PID control and fuzzy regulation for controlling. The feasibility and rationality of the designed wheel steering mechanism were verified through dynamic simulation and virtual simulation of fuzzy PID controller. McGinn et al. [17] proposed and designed a variable-form wheeled robot that can easily traverse cracks and climb steps, achieving terrain adaptation and verified the new variable-form wheeled robot through simulation and prototype testing. Li et al. [18] established a multi-body dynamic model of a wheeled off-road vehicle chassis and—on the basis of using roadblock impact tests to verify—conducted simulation research on the vertical acceleration and body pitch attitude angle of the vehicle under different levels of random road roughness excitation at different operating speeds. In order to improve the trajectory tracking accuracy of the chassis of a small four-wheeled mobile robot, Cao [19] realized the accurate and stable planning and tracking of the chassis through the construction of the robot dynamics model and the tire model, the design of the lateral pose controller based on the optimal feedforward LQR with understeer compensation, and the design of the longitudinal layered speed controller based on PID theory. The stability and effectiveness of the trajectory-tracking controller are verified by controller performance simulation and simulation experiments. Sun [20] designed a six-wheel full-driving wheel chassis and conducted dynamic simulations on its obstacle crossing performance, as well as the mechanical state simulation of the four-wheel and six-wheel model with or without suspension conditions, the parameterized analysis was used to optimize the forward speed of the six-wheel independent suspension chassis and to optimize the spring stiffness of the suspension system, the prototype was built to verify the feasibility of the four motions including bottom linear motion, zero-radius rotation motion, climbing motion and obstacle-crossing motion. Qu et al. [21] constructed a steering coordination control strategy for wheel-to-wheel following linkage on a four-wheel independent steering chassis driven by the hub motor, and the prototype road validation experiment was conducted based on the software and hardware design of the steering control system. Qin et al. [22] innovatively designed a multi suspension wheeled chassis and compared and analyzed the obstacle-crossing height and climbing angle by establishing the mathematical models of multi suspension and traditional structure chassis. Then, the dynamic performance of the chassis was verified through the dynamic simulation and prototype experiments. Gao et al. [23] proposed a wheel train chassis structure with built-in differential gear and designed a wheel chassis with zero-turning-radius capability by establishing the kinematic model, state space equation, and dynamic model of the wheel train chassis; the response of the motor rotation angle; and the gear train rotation angle. The moving stability of the chassis and the anti-lateral pitch resistance performance of the zero turning were verified. Wang et al. [24] established the dynamic model for the obstacle-crossing process of the six-wheeled all-terrain mobile robot based on the D’Alembert’s principle, it was demonstrated that the six-wheeled all-terrain mobile robot can climb vertical obstacles such as stairs combining the dynamic simulation and obstacle-crossing performance experiments of the six-wheeled all-terrain mobile robot. Zhu et al. [25] designed a vehicle chassis flaw detection robot with a complementary omnidirectional wheel motion mechanism, established the motion state equation of the four-wheel flaw detection robot, and decoupled it with an auto disturbance rejection controller to obtain good motion control performance. The research content provides reference and guidance for the application and promotion of the wheeled chassis, as well as theoretical, simulation, and experimental methods for innovative design and research of the wheeled chassis.
In the past few decades, people have proposed and developed steering systems such as conventional steering (CSS) systems, four-wheel steering (4WS) systems, active front steering (AFS) systems, active front independent steering (AFIS) systems, front independent steering (FWIS) systems, four-wheel independent steering (4WIS) systems, and rear independent steering (RWIS) systems [26,27,28,29,30,31]. The characteristics of each system are shown in Table 1.

Table 1.
Characteristics of different steering systems.
The front wheel independent steering system (FWIS) usually refers to the front wheel independent steering. Almost all modern cars adopt this structure, so its market share is very high. The four-wheel steering (4WS) system provides better handling and stability, especially in high-speed driving and emergency obstacle avoidance. It has been applied in some high-performance models and luxury models with a small market share. The active front steering (AFS) system adjusts the front wheel steering angle through the electronic control unit to adapt to different driving conditions. It has been applied in some high-end models, but its popularity in the market is limited. The four-wheel independent steering (4WIS) system allows all four wheels to steer independently and is applied in some specific models, such as high-performance vehicles or concept vehicles. However, due to the complexity and cost being high, the system market share is relatively low. The rear wheel independent steering (RWIS) system allows the rear wheel to be adjusted according to the steering of the front wheel and vehicle speed. This system has been applied in some large vehicles and high-end models, but its popularity in the market is also limited. In general, the FWIS system occupies a dominant position in the modern automobile market. The more advanced steering systems, such as 4WS, AFS, 4WIS, and RWIS, although providing better performance in specific models and applications, have a relatively small market share due to cost and technical complexity. With the development of automotive technology, these advanced steering systems may be applied in more models [32,33,34,35,36].
The Ackerman steering structure belongs to the front wheel independent steering system (FWIS). From the comprehensive comparison of the advantages and disadvantages of each steering structure in Table 1 and the application of the above steering systems, it can be seen that its steering stability and handling advantages are obvious, and the failure rate is low. In order to further improve the performance of the wheeled chassis, based on previous studies, this paper fully considers the advantages of Ackerman steering mechanism, adds shock absorption and buffer devices in the structural design, and designs a four-wheel-driving Ackerman chassis suitable for indoor and outdoor environments. In order to determine the optimal structural performance, a dynamic performance test system for the four-wheel-driving Ackerman carrier chassis is built. The quantitative experiment method is used to carry out the running characteristics experiment and performance analysis of the chassis under various variable conditions, and the dynamic simulation method is used to study the influence law of chassis structure and performance parameters, such as chassis wheelbase, guide bar structure and parameters, wheel friction coefficient, and assembly error on the dynamic characteristics of the chassis. Finally, quantitative experiments and dynamic simulation are combined to determine the optimized structure of four-wheel-driving Ackerman chassis and carry out simulation verification.
Our contributions in this paper are fivefold.
- (1)
- The four-wheel-driving Ackerman carrier chassis composed of an Ackerman steering mechanism and a strong suspension and shock absorption structure is designed to achieve more stable steering and convenient control of the chassis.
- (2)
- The chassis multi-source and multi-point dynamic information testing system based on chassis performance indicators and structural characteristics is proposed and constructed, providing reliable monitoring data for the comprehensive performance evaluation of the chassis.
- (3)
- The verifying and optimizing research method for the rationality of chassis design by combining quantitative experiments with dynamic simulation is proposed.
- (4)
- The slip and offset characteristics of the initial designed chassis are analyzed, and the influence law of road conditions and shock absorption springs on the operating characteristics of the chassis is obtained.
- (5)
- The influence law of chassis structure and performance parameters such as chassis wheelbase, guide rod structure and parameters, wheel friction coefficient, and assembly error on the dynamic characteristics of the chassis is obtained, and the optimal chassis structure size and parameters are determined.
The specific work route of this paper is as follows: Section 2 describes the working principle of the Ackerman steering mechanism and introduces the specific composition of Ackerman steering mechanism and chassis structure of the four-wheel-driving Ackerman carrier chassis. Section 3 analyzes the important evaluation indicators for chassis performance, and designs and builds the multi-source information dynamic testing system for the carrier chassis. Section 4 conducts chassis quantitative experiments under different conditions, and monitors and analyzes the operating characteristics of the chassis based on a dynamic testing system. Section 5 constructs the chassis dynamic simulation model and studies the influence law of chassis structure and performance parameters on the dynamic characteristics of the chassis, and the optimized structure of the chassis is determined based on this. Section 6 shows the relevant conclusions.
2. Design of Four-Wheel-Driving Ackerman Carrier Chassis
2.1. Design Principle and Parameter Analysis of Ackerman Carrier Chassis
The Ackermann structure can provide the appropriate Akerman angle when the vehicle turns, making the steering faster and more flexible. It can provide a smaller turning radius so as to ensure that there is no sliding friction between the tire and the ground and that the tire is in a pure rolling state with the minimum friction force, which reduces the wear of the tire. The Ackerman chassis has excellent modification design space. By installing shock absorbers and suspension structures, it can greatly increase the vehicle’s ability to overcome obstacles and work in rugged and complex environments, while the loading capacity can be improved. Therefore, the Ackerman chassis has excellent performance and is suitable for the design requirements of materials handling. Therefore, this paper designs a four-wheel-driving Ackerman carrier chassis.
Figure 1 shows the Ackermann chassis steering model, in which LZ is the wheelbase, HL is the wheel track, α is the angle of the front wheel in the outside, β is the angle of the front wheel inside, and R is the turning radius. γ is the slip angle, the angle formed between the direction of the chassis speed and the direction of the body orientation. ψ is the course angle; it represents the angle between the chassis body and the X-axis.
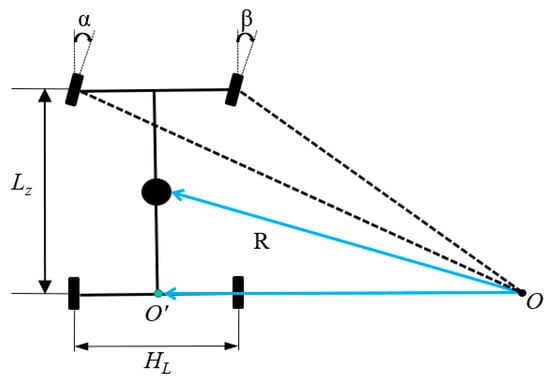
Figure 1.
Ackerman steering principle.
According to the angular velocity formula of the vehicle at low speed:
When the slip angle γ is very small, the rear wheel travels in a straight line and there is no deflection angle, the above formula can be expressed as:
Because the steering radius of the inner and outer front wheels is different:
The average angle of the front wheel is:
And the internal and external rotation difference is:
From the above derivation, it can be concluded that the difference between the two front wheel steering angles is directly proportional to the square of the average steering angle δ. For the vehicle designed according to Ackermann steering geometry, when turning along the curve, the steering angle of the inner wheel is about 2–4° larger than that of the outer wheel by using the equal crank of the four connecting rods, so the center of the four wheel paths roughly intersect with the instantaneous center of pivot (ICP) on the extension line of the rear axle and the vehicle can turn smoothly. Due to the design of Ackerman steering structure, the instantaneous center of pivot (ICP) of the left and right wheels of the front axle is the same, which is the intersection of the vertical line of the forward direction of the front wheel and the extension line of the rear wheel axle. The instantaneous steering center changes with the change of the front wheel angle, and its change trajectory is a straight line, which coincides with the extension line of the rear wheel axle, as shown in Figure 1.
The principle of the Ackermann steering mechanism is as follows: a trapezoidal four link mechanism is used to connect two front wheels. When the trapezoidal four link mechanism deforms, the left and right front wheels will turn towards the same side, but the turning angle will be slightly different to achieve more stable steering. In the design, a curved arm is extended from the rear of the left front wheel connecting rod, and a small connecting rod is used to connect the curved arm with the long connecting rod that moves in a straight line. When the long connecting rod moves in a straight line, Ackermann steering can be achieved. Among them, the linear motion of the long connecting rod is achieved through the gear rack transmission driven by the steering engine, which has a large transmission force, stable operation, and long service life. The Ackermann steering mechanism designed in this article is shown in Figure 2. It is mainly composed of a servo, cogs, racks, steering transfer levers, quad-steering structures, shock-absorbing mountings, etc. Its arrangement with the chassis and wheels is shown in Figure 3. It is connected to the frame through the guide rods and the guide rod sleeves and is connected to the wheels through the shock-absorbing mountings and the turning junctions.
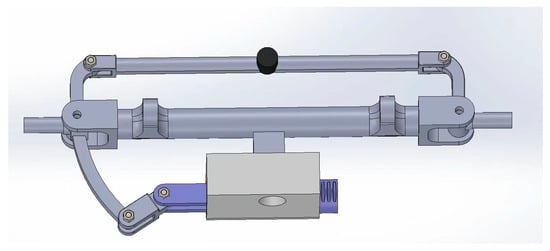
Figure 2.
Ackermann mechanism of the chassis.
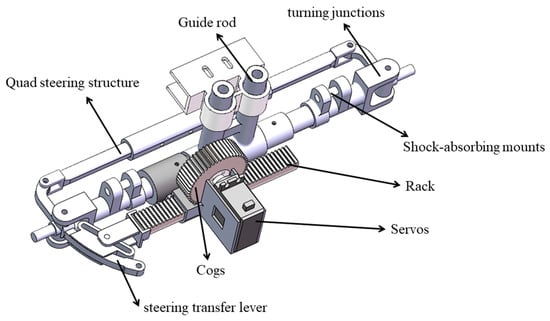
Figure 3.
Installation arrangement of Ackermann steering mechanism.
The model of the Ackerman steering mechanism is analyzed, and the rod model of the Ackerman steering mechanism is obtained as shown in Figure 4. The rod A-B-C-D forms the core trapezoidal four-bar mechanism. The length parameters of each connecting rod of the steering mechanism are shown in Table 2.
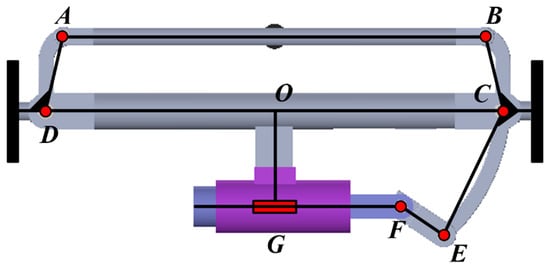
Figure 4.
The rod model of the Ackerman steering mechanism.
Table 2.
The length parameters of each connecting rod of the steering mechanism.
In order to improve the handling robot’s ability to surmount obstacles and work in complex and rugged terrain, the springs are used as the suspension damping structure. The overall structure of the four-wheel-driving Ackerman carrier chassis is shown in Figure 5, which is mainly composed of Ackerman steering mechanism, drive motor, suspension shock-absorbing structure, loaded wheels, main control board, aluminum square tube frame, guide rod, etc. The realized vehicle is shown in Figure 6.
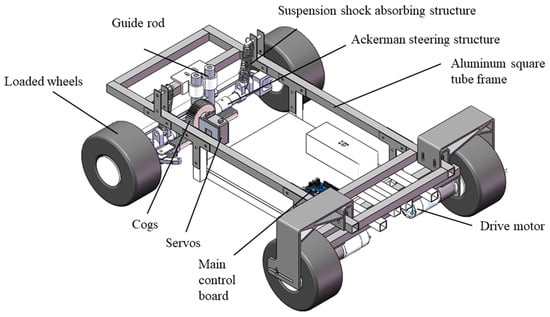
Figure 5.
Construction of four-wheel-driving Akerman carrier chassis.
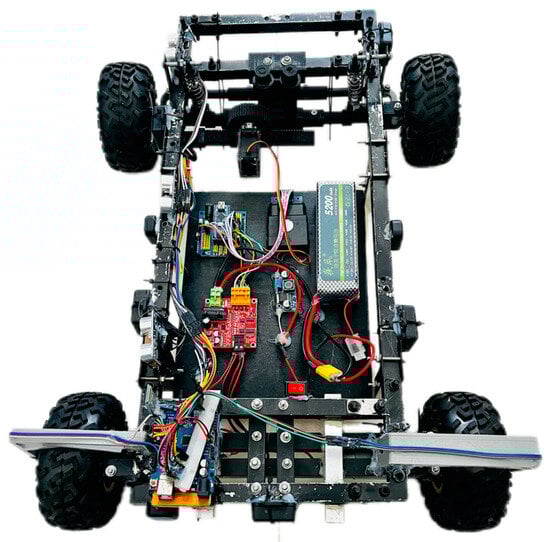
Figure 6.
The realized vehicle.
2.2. Kinematic Model Construction of the Ackerman Carrier Chassis
Based on the steering principle of the Ackermann chassis designed in this article. Assuming that the chassis is a rigid body moving on a horizontal plane, ignoring wheel deformation and slip, a kinematic model of the chassis is established [37] as shown in Figure 7.
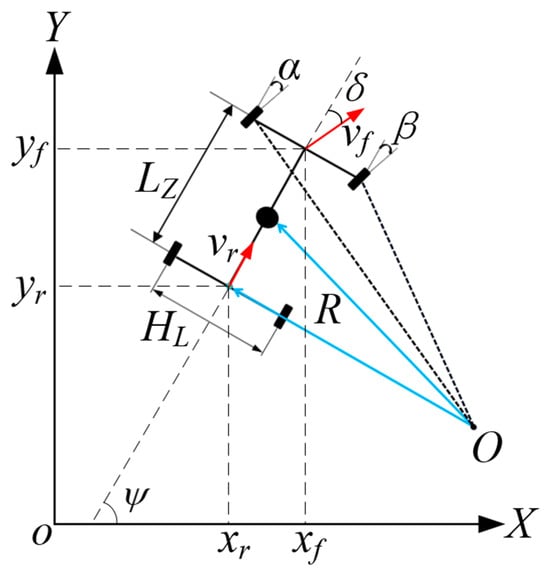
Figure 7.
Kinematic model construction of the Ackerman carrier chassis.
The X-O-Y axis is the geodetic coordinate system, where (xr, yr) and (xf, yf) are the coordinates of the rear and front axle of the vehicle, respectively. vr is the center velocity of the rear axle, and vf is the center velocity of the front axle.
The center velocity of the rear axle is:
The center velocity of the front axle is:
According to the kinematic constraints of the front and rear wheel axles, it can be concluded that:
According to Equations (7) and (10), it can be concluded that:
According to the geometric relationship between the center coordinates of the front and rear wheels, it can be concluded that:
After taking the derivative of Equation (12) over time, combine it with Equation (11):
Substituting Equation (13) into Equation (9), the angular velocity of the shaft center can be obtained.
The relationship between the center velocity of the rear axle and the center velocity of the front axle is:
In summary, the kinematic model of the Ackerman chassis is:
3. Establishment of the Test System for the Four-Wheel-Driving Ackerman Carrier Chassis
3.1. Analysis of the Important Indicators
During the operation of the four-wheel-driving Ackerman carrier chassis, due to the structural characteristics and component characteristics, it is easy to cause problems such as vibration, slip, and running offset. Among them, its vibration characteristics, migration performance, slip amount, and travel straightness have become important performance evaluation factors of the four-wheel-driving Ackerman carrier chassis. Therefore, the multi-position vibration displacement, multi-directional motion acceleration, slip amount, and straightness of the four-wheel-driving Ackerman carrier chassis will be taken as the research object to analyze the design rationality of the four-wheel-driving Ackerman carrier chassis under different working conditions and operating conditions.
3.2. Construction of the Test System Based on Structural Characteristics and Indicator Analysis
In order to realize the comprehensive performance evaluation of the four-wheel-driving Ackerman carrier chassis, the traveling acceleration and vibration displacement of the front, middle, and rear parts and the multi-point on both sides of the vehicle body will be measured, and eight groups of vibration displacement sensors and six groups of traveling acceleration sensors will be respectively arranged, as shown in Figure 8. Due to the suspension shock-absorbing mechanism and Ackermann chassis structure equipped at the front of the vehicle body, in order to ensure the effectiveness of the data, the number of sensors in the front half of the chassis body is greater than that in the rear half. Among the acceleration sensors, two sensors are placed on the front of the vehicle, two sensors in the middle of the two sides, one sensor on the middle bottom surface, and one sensor on the rear end. Among the vibration sensors, three sensors are placed on each of the two sides, and one sensor is placed on each of the front and rear ends. Then, the sensors are defined as Vibration 1 to Vibration 8 and Acceleration 1 to Acceleration 6 according to the location.
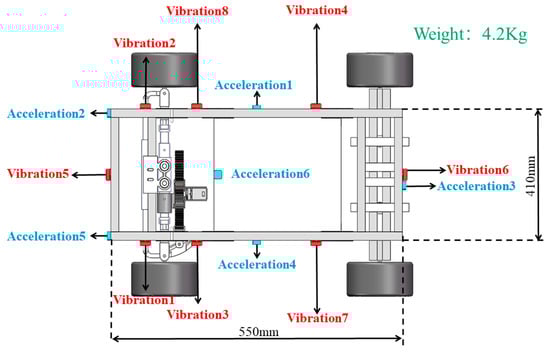
Figure 8.
Multi-sensor distribution characteristics.
In order to measure the straightness and slip amount data, the circuit is redesigned outside of the vehicle body control system circuit, and a 5 V power supply is added to power the test system. The wheel slip amount is measured by using the photoelectric gate counting sensor. The straightness is measured by using three ultrasonic ranging sensors arranged at three different positions on one side of the vehicle body, including the front, middle, and rear. The above two kinds of sensors are powered by the Arduino development board. At the same time, the collected data are returned to the serial port of the development board through a signal line and then transmitted back to the terminal through the HC-05 Bluetooth module, ultimately achieving data collection.
During the slip amount measurement process, two photoelectric counting sensors are arranged on the side of the two rear driving wheels of the chassis. Each wheel is equipped with six gratings, and the photoelectric gate counts 12 times for each rotation of the wheel. The number of times the wheel hub passes through the photoelectric gate during the driving process is recorded, and the number of the turns of the wheel when the chassis moves a certain distance can be obtained by dividing the counting times by 12. Then, the theoretical displacement of the chassis can be calculated based on the diameter. By measuring the actual running displacement, the slip amount can be calculated as the theoretical displacement minus the actual displacement.
The principle of straightness testing is shown in Figure 9. During the experiment, three ultrasonic ranging sensors are used, and they are arranged at the front, middle, and rear positions on one side of the vehicle body. The side of the chassis with the ranging module is placed close to the wall, and the position is adjusted to make the three ranging modules have the same distance from the wall. After the adjustment is completed, the initial data are recorded, and then the chassis is driven to move for a certain distance to record the data of the endpoint ranging module. The three sensors are used to measure the distance to the wall separately, and three motion offsets can be obtained by subtracting the data of the three ranging modules at the initial and final position. Then, multiple measurement experiments are conducted to take the average value to reduce errors.
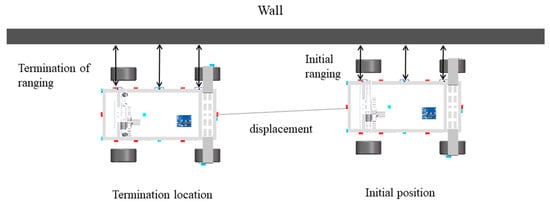
Figure 9.
Principle of straightness test.
The spatial distribution model of the test system on the chassis—consisting of six sets of acceleration sensors, eight sets of vibration sensors, two sets of photoelectric gate counting sensors, and three sets of ultrasonic distance measuring sensors—is shown in Figure 10. The Bluetooth module is used for data transmission. In order to achieve effective installation of the photoelectric gate counting sensor, the photoelectric gate bracket shown in the figure is also independently designed. The performance parameters of the sensors and transmission modules used in the system are shown in Table 3, Table 4, Table 5, Table 6 and Table 7, respectively.
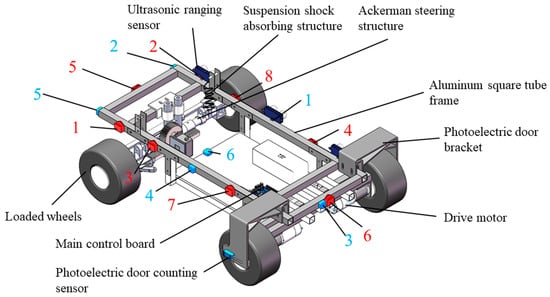
Figure 10.
Three-dimensional schematic of the multi-sensor information test system (the red marks are vibration sensors and the blue ones are acceleration sensors in the figure).
Table 3.
Performance parameters of the acceleration sensors.
Table 4.
Performance parameters of the vibration sensors.
Table 5.
Performance parameters of the photoelectric gate counting sensors.
Table 6.
Performance parameters of the ultrasonic distance measuring sensors.
Table 7.
Bluetooth module.
4. Research on the Performance of Four-Wheel-Driving Ackerman Chassis Based on Quantitative Experiments
The analysis of vibration and acceleration characteristics at different positions of the chassis can evaluate the operational stability, shock absorption, and seismic resistance effect of the vehicle body and the overall design rationality of the chassis. The operational performance of the chassis on different road surfaces is directly related to its adaptability to different road surfaces. The poor shock absorption and seismic resistance effect of the chassis will cause damage to the tire, suspension system, and vehicle structure, affect the stability of the brake, cause inaccurate vehicle positioning, and increase the noise of the vehicle. For the chassis with spring as the shock absorption media, the spring parameters will directly affect the shock absorption and seismic resistance performance of the chassis. Chassis slippage can cause serious consequences such as loss of directional control, collision, turning or high-speed overturning, increased braking distance, suspension system and tire damage. The slippage test experiment can evaluate and improve this important vehicle parameter and analyze the main reasons for vehicle slippage based on experimental data, providing experimental design ideas and reference data for subsequent optimization. The straight-line deviation of the chassis can lead to problems such as deviation of driving trajectory, difficulty in chassis control, increased tire friction, and suspension system damage, which are important indicators for evaluating vehicle performance. Straightness testing experiments can evaluate and improve the straight-line driving performance of the vehicle body. Based on the actual experimental situation and output data, the main reasons for the straight-line deviation distance can analyzed, and the simulation optimization experiments can be designed according to the analysis of the influence of different factors, and the reference data can be provided to help find the best optimization solution. In order to comprehensively test the running performance of the initial designed four-wheel-driving Ackerman chassis, the vibration and acceleration characteristics analysis at different positions, the slip amount test and the straightness test of the chassis with the same running speed under the same damping spring condition, and the running characteristics analysis of the porcelain floor, asphalt road, cement road, and other different road conditions will be carried out. On this basis, the vibration and acceleration characteristics analysis of the chassis with the same running speed under different damping spring conditions will be carried out, and the comprehensive kinematic performance of the four-wheel-driving Ackerman chassis is studied through quantitative test experiments. The roles and relationships of each experiment are shown in Figure 11.
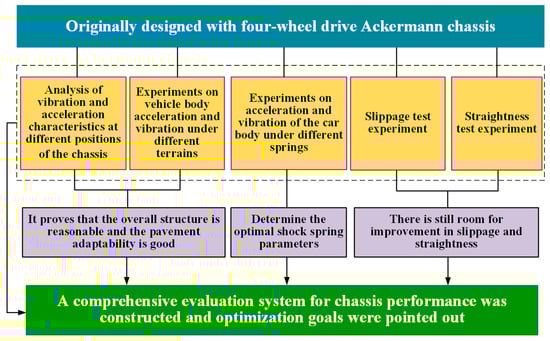
Figure 11.
Effects of each experiment.
4.1. Analysis of Vibration and Acceleration Characteristics at Different Positions of the Chassis
The spring suspension shock-absorbing structure adopts a spring with a wire diameter of 1.2 mm and made of spring steel material. The given chassis driving motor speed is 80 r/min, which is 0.52 m/s. The chassis test running distance is 4 m, and the operating environment is the porcelain floor. Under these conditions, the vibration displacement at eight different positions and the three-dimensional running acceleration curves at six different positions are obtained, as shown in Figure 12, Figure 13, Figure 14 and Figure 15.
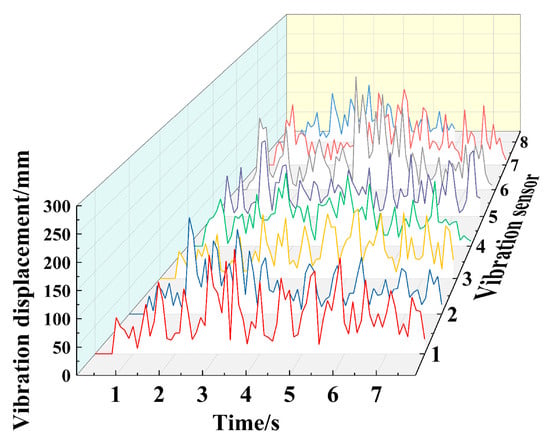
Figure 12.
Vibration displacement at different positions.
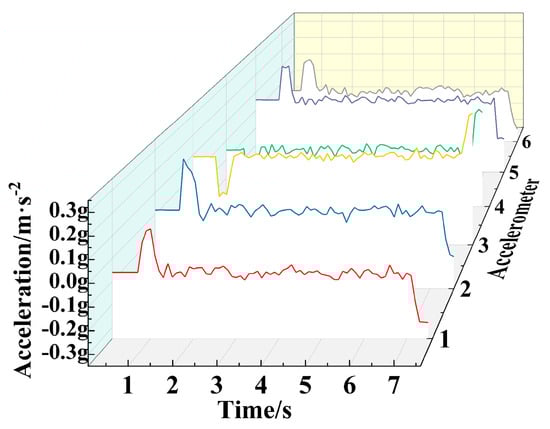
Figure 13.
Acceleration of X-axis at different positions.
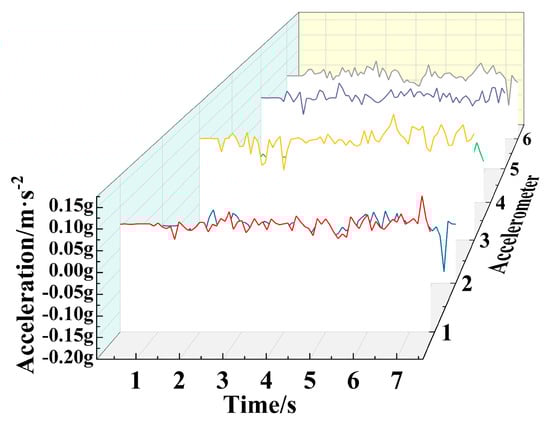
Figure 14.
Acceleration of Y-axis at different positions.
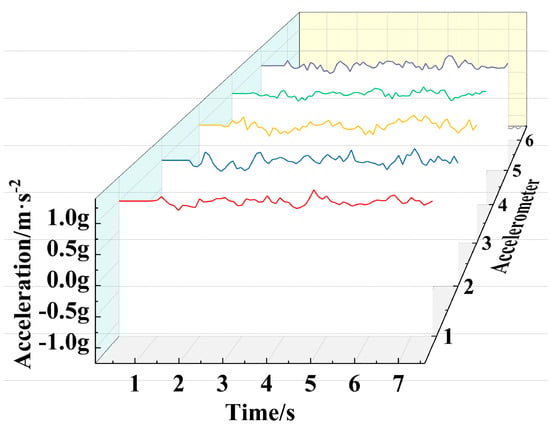
Figure 15.
Acceleration of Z-axis at different positions.
From the figure, it can be seen that with the change of time, the vibration and acceleration at different sampling positions exhibit disordered fluctuation characteristics. Among them, the fluctuation amplitude of the Z-direction operating acceleration curve at different positions is relatively gentle, while the fluctuation amplitude of the vibration displacement and X-direction operating acceleration curve at different positions is more obvious, and the relative fluctuation degree of the vibration displacement curve at different positions is greater. For in-depth analysis, the maximum and average values of vibration signals and acceleration signals at different positions are extracted, as shown in Table 8 and Table 9.
Table 8.
Chassis vibration signals at different positions (μm).
Table 9.
Chassis acceleration signals of X-axis at different positions (× g).
From Figure 12, Figure 13, Figure 14 and Figure 15 and Table 8 and Table 9, it can be seen that the maximum vibration displacement at the position of vibration sensor 6 is 262 μm, which is significantly higher than other positions. Its average vibration displacement is also the maximum value at eight different positions. The reason is that the position of vibration sensor 6 is close to the driving wheel and motor, and during the movement process, there will be significant vibration at the rear of the vehicle body under motor driving conditions. This vibration will have an impact on the stability of the vehicle structure designed in this paper, Therefore, the corresponding shock absorption treatment should be carried out on the driving wheels in the future. The vibration peaks at the other seven positions are between 0.14 and 0.2 mm, and the vibration displacement of the carrier chassis is generally between 0.5 and 1.0 mm, therefore, the chassis designed in this article has more stable vibration performance and good seismic resistance during motion. The average and peak values of vibration displacement at positions 2, 3, 4, 5, and 8 are significantly smaller than those at positions 1 and 6 of the driving wheels, the vibration performance at most positions of the chassis is good, which greatly ensures the smoothness of the transportation process. By comparing and analyzing the average and peak values of vibration displacement at the positions of vibration sensor 6 and vibration sensor 5, it can be concluded that the shock-absorbing mechanism in the front of the vehicle reduces the vibration peak by 94 µm—that is, by 35.88%. Therefore, the chassis’s shock-absorbing mechanism has a significant shock-absorbing effect on the vehicle body.
During the driving process, the maximum instantaneous acceleration of the chassis in the forward direction (X direction) at the starting and ending points of the chassis is only 0.3 g, which is 2.94 m/s2. In case of sudden speed changes, the chassis can still ensure relatively stable motion. At the same time, during the movement process, the average acceleration of each position is within the range of 0.02–0.09 g, indicating that the chassis can maintain a relatively stable motion speed and state.
In summary, the vibration characteristics of the chassis in the vertical direction and the acceleration characteristics in the forward direction prove that the designed chassis has good seismic and shock-absorbing effects and good stability.
4.2. Analysis of Chassis Slip Amount
4.2.1. Experimental Design of Chassis Slip Amount
In the experiment, the spring suspension shock-absorbing structure adopts a spring with a wire diameter of 1.2 mm and spring steel material. The given chassis’s driving motor speed is 80 r/min, which is 0.52 m/s. The chassis test operation distance is 600 mm, 1200 mm, 1800 mm, 2400 mm, 3000 mm, 3600 mm, and 4200 mm respectively, with the operating environment of porcelain floor. Under these conditions, the counting values of two photoelectric counting sensors are obtained respectively.
4.2.2. Chassis Slip Characteristics
The actual operating distance and photoelectric gate count values of the left and right photoelectric counting sensors (named photoelectric counting 1 and photoelectric counting 2 respectively in the testing system) under different calibrated operating distances are shown in Table 10.
Table 10.
Count values of two photoelectric counting sensors under different operating distances.
According to the counting values of the photoelectric counting sensor, the theoretical displacement of the chassis under different operating distance conditions can be obtained, and based on this, the slipping amount of the two wheels can be calculated, as shown in Table 11 and Figure 16.
Table 11.
Theoretical displacement of two wheels under different operating distances.
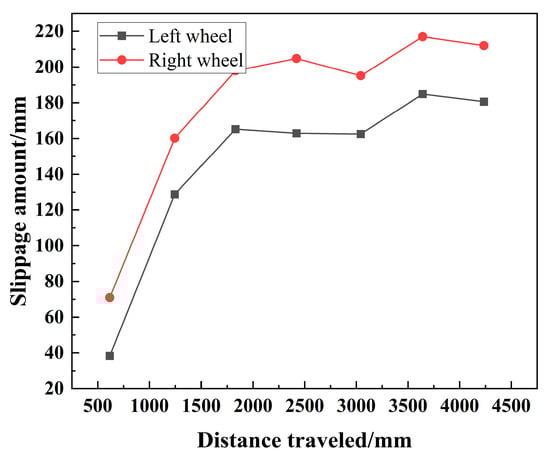
Figure 16.
Slipping amount of the two wheels under different operating distances.
The friction coefficient of the tires selected in the initial design is 0.59. From Table 10 and Table 11 and Figure 16, it can be seen that the chassis designed on a smooth porcelain floor will produce a certain amount of slip, with a large amount of slip during the initial startup stage. After stable operation, the change amplitude in slip quantity is greatly reduced. Due to the presence of the Ackermann steering mechanism, the slip quantity of the right wheel of the vehicle is always greater than that of the left wheel. Finally, the chassis produces a maximum slip amount of 212 mm (right wheel) and 180.6 mm (left wheel) at an actual motion distance of 4235 mm with slip ratios of 5.0% and 4.3%, respectively. This is within the normal slip range of the chassis, but there is still room for further optimization of the slip ratio. Measures need to be taken to correct and improve it to reduce the slip ratio.
4.3. Analysis of Chassis Straightness
4.3.1. Experimental Design of Chassis Straightness
In the experiment, the spring suspension shock-absorbing structure adopts a spring with a wire diameter of 1.2 mm and made of spring steel material. The given chassis driving motor speed is 80 r/min, which is 0.52 m/s. The chassis test runs at distances of 500 mm, 1000 mm, 1500 mm, 2000 mm, and 2500 mm, and the operating environment is porcelain floor. Under these conditions, in order to ensure the effectiveness of the results, five sets of experiments are conducted for each operating distance, and the deviation values of the distance from the sensor to the wall measured by three ultrasonic distance sensors in each set of experiments are obtained.
4.3.2. Chassis Offset Characteristics
Five sets of experiments are conducted separately, and the actual running distance of each experiment is shown in Table 12. The chassis running offset amount measured by three ultrasonic distance sensors under different calibrated running distances, and the average values of the three different position offset amounts are shown in Figure 17, Figure 18, Figure 19, Figure 20 and Figure 21, respectively.
Table 12.
The actual running distance of each experiment.
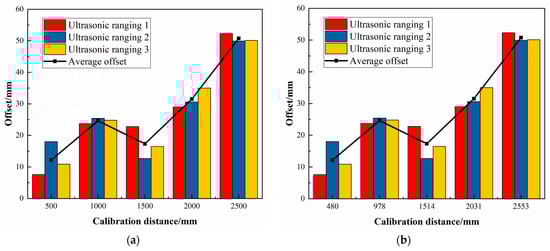
Figure 17.
The deviation values of Experiment 1. (a) Calibrated distance, (b) Actual distance.
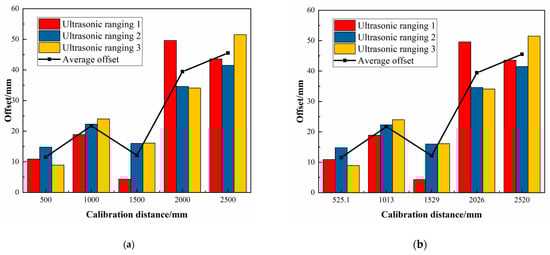
Figure 18.
The deviation values of Experiment 2. (a) Calibrated distance, (b) Actual distance.

Figure 19.
The deviation values of Experiment 3. (a) Calibrated distance, (b) Actual distance.
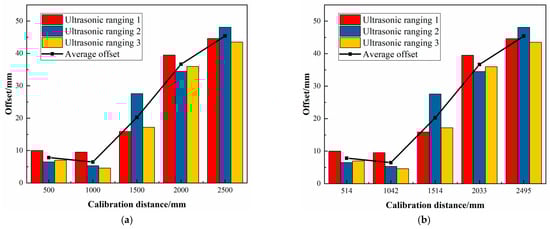
Figure 20.
The deviation values of Experiment 4.(a) Calibrated distance, (b) Actual distance.
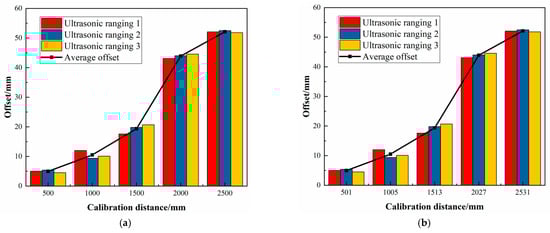
Figure 21.
The deviation values of Experiment 5. (a) Calibrated distance, (b) Actual distance.
The average value of the actual running distance in each of the five sets of experiments corresponding to each calibrated distance is defined as the average actual running distance, and the average value of the average offset amount of the three different positions of the chassis in the five sets of experiments corresponding to each calibrated distance is define as the average offset of the chassis. The ratio of running offset to the actual running distance is defined as the proportion of single offset of the chassis, and the average offset ratio of the three different positions of the chassis body measured in each group of experiments is defined as the offset proportion of the chassis in each group of experiments. By taking the average value of the offset proportion of the chassis in each group of experiments in five groups of experiments, the average deviation proportion of the chassis under different calibrated running distances can be obtained, as shown in Table 13.
Table 13.
The average deviation proportion of the chassis under different calibrated running distances.
From Figure 17, Figure 18, Figure 19, Figure 20, Figure 21, Figure 22 and Figure 23 and Table 11 and Table 12, it can be seen that as the movement distance increases, the offset gradually increases. At the actual distance of 2513 mm, the linear offset reaches the maximum, reaching 43.72 mm. However, according to experimental data, the deviation ratio is mainly concentrated in the range of 1.2% to 2.0%, and the maximum average deviation ratio obtained from multiple experiments is only 1.957%, which meets the working conditions requirements of most transportation workshops, but there is still room for improvement.
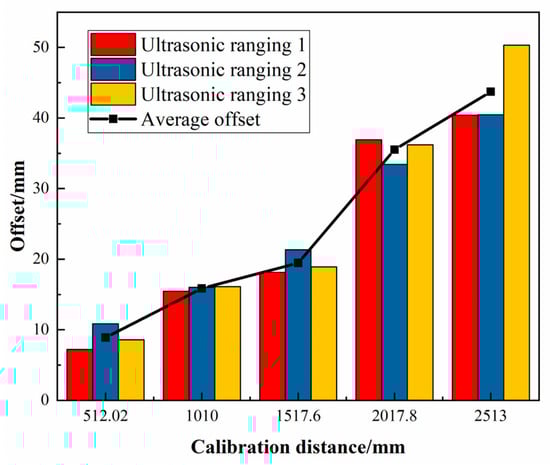
Figure 22.
The average offset.
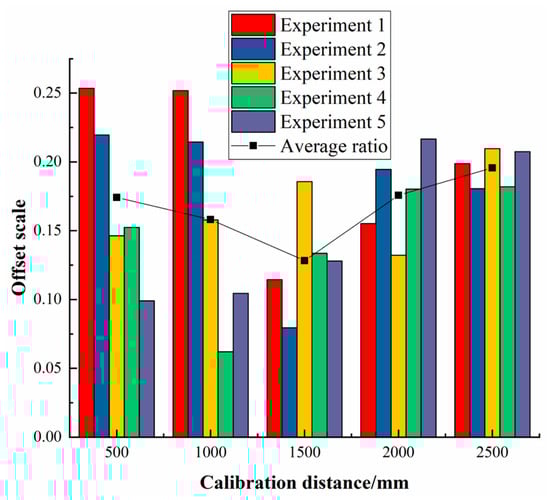
Figure 23.
The average deviation proportion.
4.4. The Impact of Road Conditions on the Operating Characteristics of the Chassis
4.4.1. Experimental Design for Different Road Conditions
In the experiment, the spring suspension shock-absorbing structure adopts a spring with a wire diameter of 1.2 mm and a spring steel material. The given chassis driving motor speed is 80 r/min, which is 0.52 m/s, and the chassis test running distance is 4000 mm. To test the impact of different road conditions on the chassis, the operating environment is selected as porcelain floor, asphalt road, cement road, and 15° slope, as shown in Figure 24. Among them, the 15° slope is built using a PS material slope bridge. Under this condition, each set of experimental data for chassis operation is obtained.
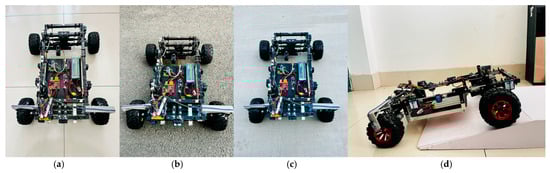
Figure 24.
Operating environment of the chassis. (a) Porcelain floor, (b) Asphalt road, (c) Cement road, (d) 15° slope.
4.4.2. Chassis Operating Characteristics under Different Road Conditions
The vibration displacement and acceleration at different positions of the chassis under four different working conditions, namely porcelain floor, asphalt road, cement road, and 15 ° slope, are obtained through experiments, as shown in Figure 25 and Figure 26.
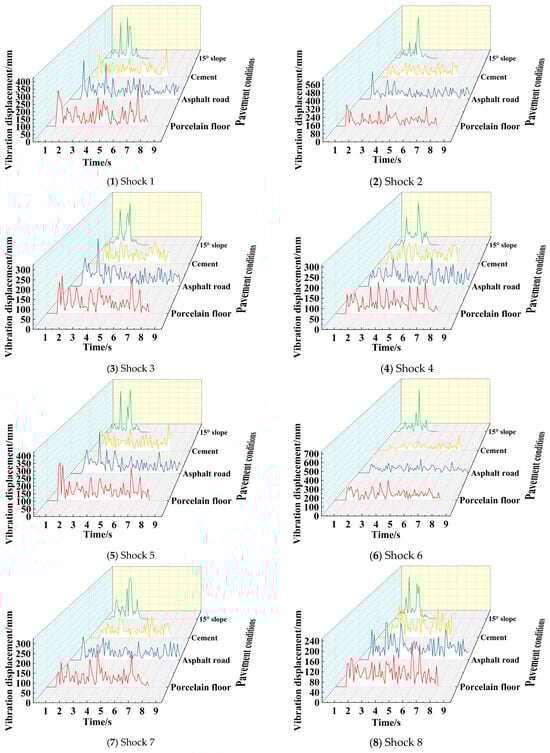
Figure 25.
Vibration displacement.
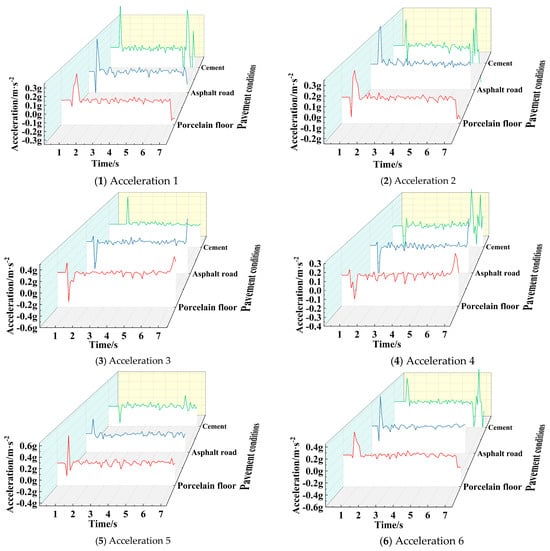
Figure 26.
Acceleration in the X-direction.
From Figure 25, it can be seen that the chassis exhibits disorderly fluctuations at various positions under different working conditions. Among them, the vibration peaks under the working conditions such as porcelain floors, asphalt roads, and cement roads mostly appear in the early or end stages of operation. Under the working conditions with a slope of 15°, the vibration peaks mostly appear in the middle region of operation.
From Figure 26, it can be seen that the peak acceleration in the X-direction under the conditions of porcelain floor and asphalt road mainly occurs in the initial region, while the peak acceleration of Acceleration 2, Acceleration 4, and Acceleration 6 in the X-direction under the condition of cement road occurs at the end of operation.
The peak and average values of multi position vibration displacement of the chassis under four different working conditions, such as porcelain floor, asphalt road, cement road, and 15° slope, as well as the peak and average values of multi position acceleration of the chassis under three different working conditions, namely porcelain floor, asphalt road, and cement road, are extracted respectively, as shown in Table 14 and Table 15.
Table 14.
Vibration signals of different positions of the chassis (μm).
Table 15.
Acceleration signals of different positions of the chassis (× g).
From the table, it can be seen that compared to porcelain flooring, the asphalt road will increase the maximum motion acceleration at each point of the chassis, significantly increase the vibration displacement amplitudes at Vibration 1, Vibration 2, Vibration 3, and Vibration 5, and to some extent reducing the vibration displacement amplitudes at Vibration 4, Vibration 6, Vibration 7, and Vibration 8. That is, the asphalt road will intensify the vibration amplitude at the front part of the chassis and weaken the vibration amplitude at the rear part. The cement road will increase the maximum motion acceleration of each point of the chassis and reduce the vibration displacement amplitude and mean motion acceleration of each point of the chassis. The presence of slope will significantly increase the amplitude of vibration displacement at each point of the chassis, increase the average vibration displacement at positions 2–7, and reduce the average vibration displacement at positions 1 and 8. Based on comprehensive analysis, it can be concluded that the designed chassis performs best on cement road under various terrain conditions.
Under different road conditions, the maximum vibration displacement of the chassis is only 0.649 mm, the maximum average vibration displacement is only 0.090697 mm, and the maximum average acceleration is only 0.0708 g, showing good seismic resistance and stability. Therefore, the designed chassis has good adaptability to the road environment.
4.5. The Influence of Damping Spring on the Operating Characteristics of the Chassis
4.5.1. Calculation and Test of Spring Stiffness
The supporting spring in the suspension shock-absorbing mechanism has an intuitive influence on the shock absorption and bearing characteristics of the system. It is of great significance to select the shock-absorbing spring reasonably. Therefore, different types of springs are first selected for the stiffness test. Stainless steel and spring steel springs with wire diameters of 1.0 mm, 1.2 mm, 1.4 mm, and 1.6 mm were selected. The diameter and length of the springs were 17 mm and 60 mm respectively. The deformation of the springs under the force of 2–13 N was tested according to the method shown in Figure 27, as shown in Figure 28 and Table 16, so as to obtain the spring stiffness, as shown in Table 17.
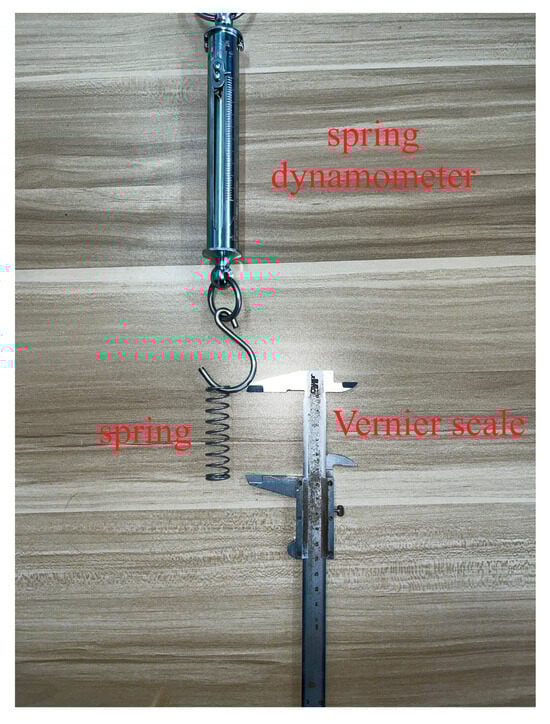
Figure 27.
Deformation experiment of spring under loading.
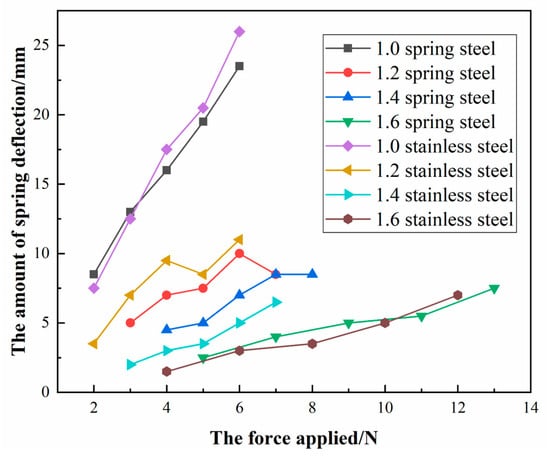
Figure 28.
Spring–loading force curve.
Table 16.
Spring deformation.
Table 17.
Spring stiffness.
4.5.2. Experimental Design under Different Shock-Absorbing Spring
In the experiment, the chassis moves 4 m on the porcelain floor at a speed of 0.52 m/s (80 r/min). The supporting springs in the suspension shock-absorbing mechanism are stainless steel and spring steel springs with wire diameters of 1.0 mm, 1.2 mm, 1.4 mm, and 1.6 mm. Under this condition, each set of experimental data is obtained.
4.5.3. The Operating Characteristics under Different Shock-Absorbing Spring Chassis
The vibration displacement curves of eight different positions, such as chassis Vibration 1 to Vibration 8 are shown in Figure 29. According to Figure 29, the vibration displacement amplitudes of different positions are extracted, and the average vibration displacement is calculated, as shown in Table 18.
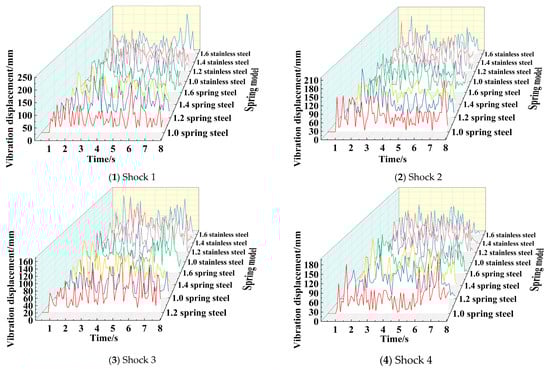
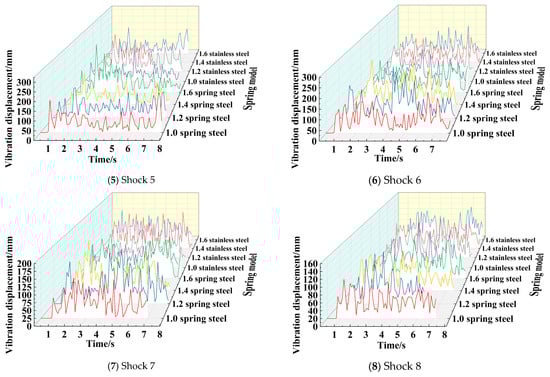
Figure 29.
Spring vibration displacement under different spring conditions.
Table 18.
Chassis vibration signals at different positions (μm).
It can be seen from the figure that as the spring material and wire diameter change, the spring stiffness changes, which in turn leads to a certain change in its motion vibration displacement curve. It can be seen from the data in Table 17 that when the springs of 1.0 stainless steel and 1.4 stainless steel are used as the shock-absorbing mechanism, the overall vibration displacement amplitude and the average vibration displacement of the vibration signals at different positions of the chassis are more superior than other springs. The comparison of the two springs shows that the average vibration displacement of the stainless steel spring with a wire diameter of 1.0 mm is 47.510 µm, the average vibration peak is 155.5 µm, and the standard deviation of the vibration peak is 38.9175. The average vibration displacement of the stainless steel spring with a wire diameter of 1.4 mm is 54.505 µm, the average vibration peak is 153.25 µm, and the standard deviation of the vibration peak is 30.72342. Therefore, the average vibration displacement of the stainless steel spring with a wire diameter of 1.0 mm is small, and the average vibration peak of the stainless steel spring with a wire diameter of 1.4 mm is small. Moreover, the vibration peak of the stainless steel spring with a wire diameter of 1.4 mm has a smaller difference in each position. In the comparison of the two springs, the stainless steel spring with a wire diameter of 1.0 mm has two defects. First, the spring stiffness is small. Although the average vibration displacement is small, the standard deviation of the vibration peak 38.9175 is larger than the stainless steel spring of the wire diameter 1.4 mm with the standard deviation of the vibration peak 30.72342, which makes the vibration displacement change greatly during the movement, which means that there will be severe vibration during the working process. Second, when the wire diameter of 1.0 mm spring is loaded with a certain weight, the descending distance of the chassis is larger, and the failure of the shock-absorbing structure will occur when the spring is completely compressed under the too heavy load. Therefore, the vibration performance is the best when the stainless steel spring with a wire diameter of 1.4 mm installed on the shock-absorbing mechanism.
From Figure 30, it can be seen that though the wire diameter and material of the spring at the shock-absorbing mechanism change, the experimental data show that the form of the acceleration curve of the same sampling point is the same with the change of the spring, and the sharp mutation of the acceleration mainly occurs in the early and late stages of the movement. Although the acceleration of different positions of the chassis body fluctuates during the intermediate motion process, the degree of fluctuation is small.
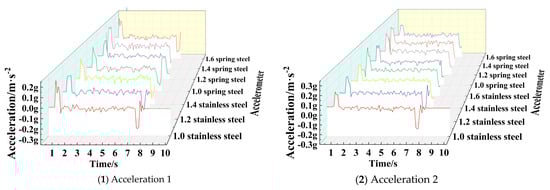
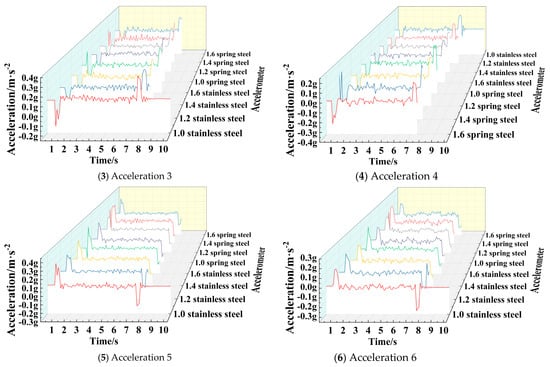
Figure 30.
Motion acceleration in X direction under different spring conditions.
When the shock-absorbing spring adopts springs with different wire diameters and materials, according to the analysis of the maximum and average values of the X-direction acceleration signals at different positions of the chassis in Table 19, it can be seen that the average speed at each position of the chassis is low when 1.4 mm and 1.6 mm diameters of stainless steel and 1.2 mm,1.4 mm, and 1.6 mm diameters of spring steel springs are used. According to the X-direction acceleration diagram, it can be seen that the acceleration will change abruptly during acceleration start-up and braking deceleration, which will affect the motion stability of the chassis. Therefore, the acceleration peaks of the above five springs are mainly analyzed in the acceleration.
Table 19.
X-direction acceleration signals at different positions of the chassis (× g).
Through in-depth analysis of the data in Table 19, the acceleration peak value, the average value of the multi-point acceleration peak value, and the standard deviation of the multi-point acceleration peak value at each position of the chassis can be obtained when using 1.4 mm and 1.6 mm wire diameter stainless steel and 1.2 mm,1.4 mm, and 1.6 mm wire diameter spring steel springs respectively, as shown in Table 20.
Table 20.
X-direction acceleration signals at different positions of the chassis under several spring conditions (× g).
It can be seen from Table 20 that the operating acceleration peaks of 1.4 mm stainless steel and 1.2 mm, 1.4 mm and 1.6 mm spring steel are similar, while the operating acceleration peak of the chassis with 1.6 mm stainless steel spring is larger. The average peak value of multi-point acceleration of 1.6 mm spring steel is the smallest, the average peak value of multi-point acceleration of 1.4 mm stainless steel and 1.4 mm spring steel is similar, and the average peak value of multi-point acceleration of 1.2 mm spring steel and 1.6 mm stainless steel spring is larger. The standard deviation of the multi-point acceleration peak of the 1.4 mm stainless steel spring is the smallest, indicating that the change scope of the acceleration peak at different positions of the chassis is the smallest when the 1.4 mm stainless steel spring is used. Therefore, the stainless steel spring with wire diameter of 1.4 mm installed on the shock-absorbing mechanism has the best overall acceleration performance.
Comprehensive analysis, the shock-absorbing mechanism should be used 1.4 mm diameter stainless steel spring for the chassis designed in this paper.
5. Performance Optimization of Four-Wheel-Driving Ackerman Chassis Based on Dynamic Simulation
The previous section conducted in-depth research and evaluation on the vibration and acceleration characteristics of the chassis under different working conditions, tire slip, and straight-line driving performance using the experimental method of controlling variables. From the above analysis, it can be seen that the performance of the designed four-wheel-driving Ackerman chassis can better meet the application requirements. Meanwhile, through experimental analysis, Section 4 identified the key issues that urgently need improvement in chassis design, determined the optimal damping spring parameters, pointed out that the further optimization space is existed of the vehicle slip and straight-line offset, and constructed a comprehensive chassis performance evaluation system that combines vibration and acceleration characteristics, tire slip, and straight-line driving performance. On the basis of verifying the rationality of the overall chassis design, it provides optimization direction, data support, optimization indicators, and theoretical basis for further simulation optimization. To further improve the comprehensive performance of the chassis, on the basis of the previous research, this chapter will study the influence law of the structural parameters, material parameters, and assembly errors of the four-wheel-driving Ackerman chassis on its dynamic characteristics by constructing its dynamic simulation model, so as to determine the optimal structure and parameters and realize the performance optimization of the four-wheel-driving Ackerman chassis. During this process, the complete optimization process of the four-wheel-drive Ackermann chassis was achieved by combining several quantitative experiments in Section 4 with dynamic simulations in Section 5. The connection between the two parts and the explanation of the combined optimization method are shown in Figure 31.
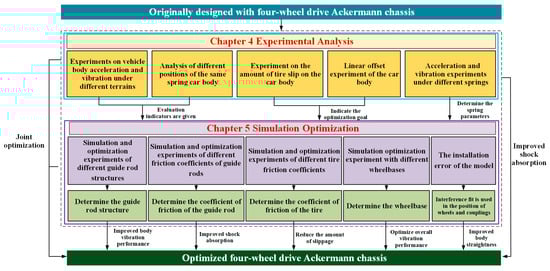
Figure 31.
Performance optimization method combining quantitative experiment and dynamic simulation.
5.1. Simulation Model Construction
Import the 3D model of the designed four-wheel-driving Ackerman chassis into the software ADAMS 2020, draw the ground directly in ADAMS, move the ground to the contact position with the tire of the chassis, and then add a fixed pair between the ground and the ground. Given different densities according to different materials, the frame and connectors are made of aluminum alloy with density of 2.74 g/cm3, Young’s modulus of 7.1805 × 10⁴ N/mm2, and Poisson’s ratio of 0.33. The material of 3D printing structural parts is PLA, the density is 0.992 g/cm3, the Young’s modulus is 2.07 × 10⁵ N/mm2, and the Poisson’s ratio is 0.29. According to the selected product manual, the quality of the motor and reducer is 0.43 kg, the Young’s modulus is 7.1805 × 10⁴ N /mm2, and the Poisson’s ratio is 0.33. The quality of the wheel is obtained according to the selected product manual. The tire is 0.126 kg, the Young’s modulus is 7.84 × 10⁴ N/mm2, and the Poisson’s ratio is 0.47. The hub is 0.02 kg, the Young’s modulus is 2.32 × 10³ N/mm2, and the Poisson’s ratio is 0.394. According to the connection relationship of each part in the physical prototype, the motion pair is added in ADAMS, the fixed pair is added at the thread connection and other fixed joints, the rotating pair is added at the rotating joint, and the moving pair is added at the linear joint. The collision contact constraint is added between the tire and the ground as well as between the gear and the rack, and the friction coefficient between the tire and the ground is set according to the measured data in the experiment. A spring damper is added at the corresponding spring hinge point, and its stiffness is set as the stiffness value of the real spring. The supporting force required at the upper spring hinge point when the physical prototype of the chassis is in a static state is measured, and the preload is set for the spring damper, and the value of the force is the same as the force at the spring hinge point. The final four-wheel-driving Ackerman chassis dynamics simulation model is shown in Figure 32.
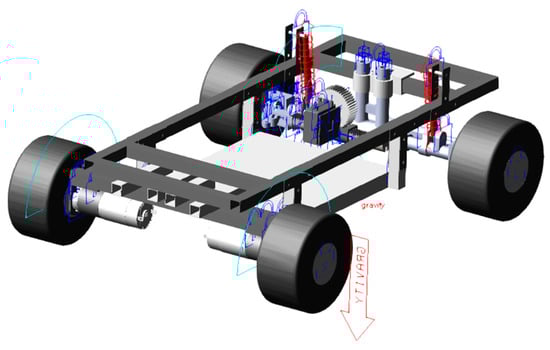
Figure 32.
Four-wheel-driving Ackerman chassis dynamics simulation model.
5.2. Analysis of the Influence of Structure and Material Parameters on the Dynamic Characteristics of Four-Wheel-Driving Ackerman Chassis
Based on the established dynamic simulation model of four-wheel-driving Ackerman chassis, by changing the wheelbase, guide rod structure, guide rod friction coefficient, wheel friction coefficient, stiffness of the Ackerman steering structure, and the fit mode—such as the coupling and other position of the chassis—the influence law of the above chassis structure or material parameters and component matching modes on the dynamic characteristics of the chassis is studied.
5.2.1. The Influence of the Wheelbase on the Dynamic Characteristics
In order to study the influence of the wheelbase on the dynamic characteristics of the chassis, under the condition of keeping other sizes and conditions consistent, three kinds of chassis with different wheelbases—namely the original wheelbase, the original wheelbase +20 mm, and the original wheelbase +40 mm—are established. The spring with the material of spring steel and the wire diameter of 1.2 mm is carried. The speed of the chassis driving motor is given to be 80 r/min, that is 0.52 m/s. The test running distance of the chassis in the simulation is set to be 4 m, and the operating environment is porcelain floor (that is, the dynamic friction parameters obtained in the simulation were determined according to the operation experiment between the chassis and the porcelain floor and set to 0.5932). The vibration displacement curves of different positions of the chassis are obtained by simulation analysis, as shown in Figure 33, the maximum and average values of vibration displacement are shown in Table 21.
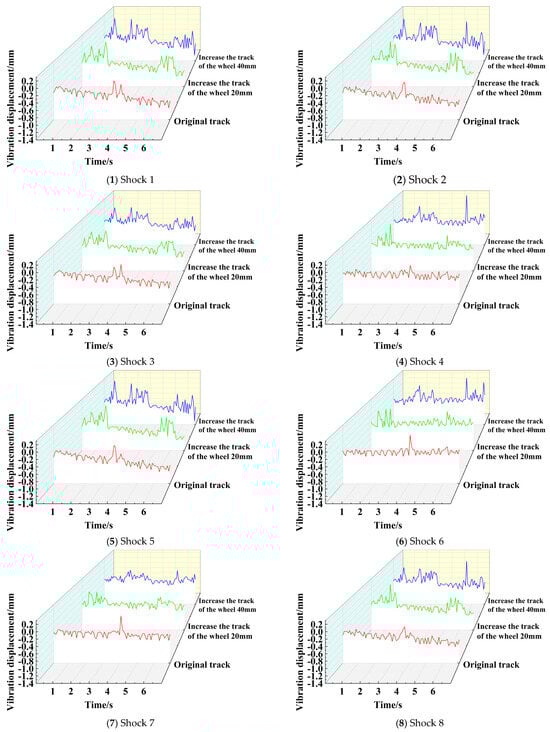
Figure 33.
Vibration displacement of different positions of the chassis under different wheelbases.
Table 21.
Vibration displacement of the different positions on the chassis with different wheel base (μm).
It can be seen from the figure and the data analysis of the peak vibration displacement and average vibration displacement of eight different positions that, for the peak vibration displacement and with the increase in the wheelbase, the vibration sensors 1, 2, 5, and 6 show the gradual increasing trend, and the vibration sensors 3, 4, 7, and 8 show the gradual decreasing trend. It can be obtained that the increase of the wheelbase will increase the vibration amplitude at both ends of the chassis but will reduce the vibration amplitude in the middle of the chassis. The two ends of the chassis have shock-absorbing systems such as springs and wheels, which can adapt to the controllable increase of the vibration peak, while the middle part is the main bearing and transportation part. Therefore, reducing the vibration peak of the middle part is of great significance to the carrying performance of the chassis.
For the average value of the vibration displacement, with the increase in the wheelbase, the average value of the vibration displacement at different positions of the chassis gradually decreases, which indicate that the overall vibration performance of the chassis is gradually improved with the increase of wheelbase. However, the wheelbase of the chassis cannot be increased without limit. Increasing 40 mm on the basis of the original design in this paper is the ultimate wheelbase size of the chassis. Therefore, through the simulation analysis, the wheelbase of the chassis should be taken as the “Original wheelbase + 40 mm”.
5.2.2. The Influence of the Guide Rod Structure on the Dynamic Characteristics
The guide rod is the main connecting part between the Ackerman steering mechanism and the chassis body, and its structural performance has a certain influence on the chassis. In this paper, on the basis of the spring steel material spring with the wire diameter of 1.2 mm as the damping device, the speed of the chassis driving motor is given to be 80 r/min (that is 0.52 m/s), the chassis test running distance is 4 m, and the operating environment is porcelain floor. By constructing the chassis dynamics models with the guide rod form at the Ackerman steering structure of cylindrical guide rod and chute guide rod respectively, the influence of the guide rod form on the chassis vibration characteristics is studied. With the help of simulation analysis, the vibration displacement curves of different positions of the chassis under different guide rod forms are obtained, as shown in Figure 34.
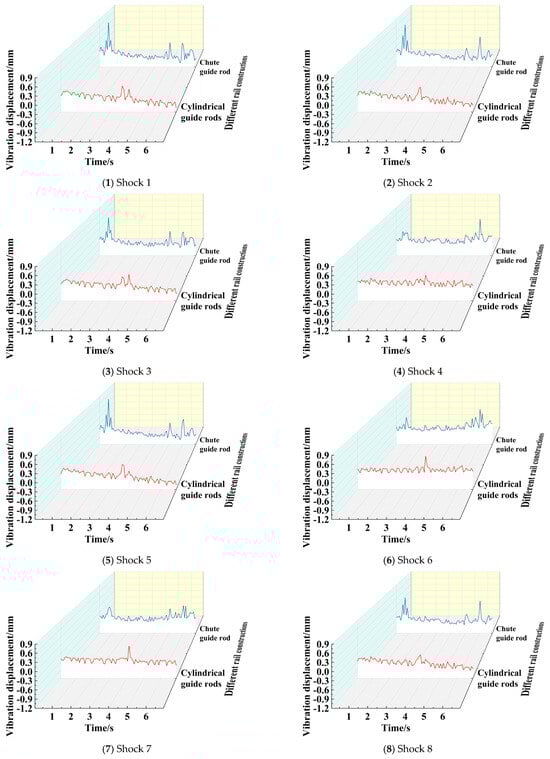
Figure 34.
Vibration displacement in different positions under different guide rod structures.
From the figure, it can be seen that the vibration curve forms of the two guide rods are obviously different. The vibration displacement peaks of the chassis with the chute guide rod appear at both ends of the motion time axis, while the vibration displacement peaks of the chassis with the cylindrical guide rod appear in the middle. For further comparative analysis, the peak and average values of vibration displacement at different positions are extracted, as shown in Table 22.
Table 22.
Vibration displacement at different positions of the chassis with different Guide Rod (μm).
From the table, it can be seen that compared with the cylindrical guide rod, for the chassis with the chute guide rod—except for the vibration displacement extreme value of the position of the vibration sensor 6 increased by less than 1.3%—the vibration displacement extreme values of other positions are reduced, and the average vibration displacement peak value of each position is reduced by 5.78%. The average value of vibration displacement at eight different positions is reduced, and the average value of vibration displacement at each position is reduced by 8.75%. It can be seen that the vibration displacement peak value and the average value of the vibration displacement at each position of the chassis with the chute guide rod are better than those of the cylindrical guide rod.
5.2.3. The Influence of the Friction Coefficient of the Guide Rod on the Dynamic Characteristics
The main function of the guide rod is to constrain the shock-absorbing structure to buffer the movement along the upper and lower directions. During the movement, the guide rod and the guide rod sleeve will produce friction. Therefore, the friction parameters between the guide rod and the guide rod sleeve have an important influence on the chassis performance and shock-absorbing effect. In this paper, the spring steel material spring with a wire diameter of 1.2 mm is used as the shock-absorbing device. The speed of the chassis driving motor is given to be 80 r/min, that is, 0.52 m/s. The chassis test operation distance is 4 m, and the operating environment is porcelain floor. By constructing the chassis dynamics model with the chute guide rod at the Ackerman steering structure, the influence of the friction coefficient of the guide rod on the vibration characteristics of the chassis is studied. The vibration displacement curves of different positions of the chassis are obtained by simulation analysis when the friction coefficient of the guide rod is 0.05, 0.1, 0.3, and 0.5, as shown in Figure 35.
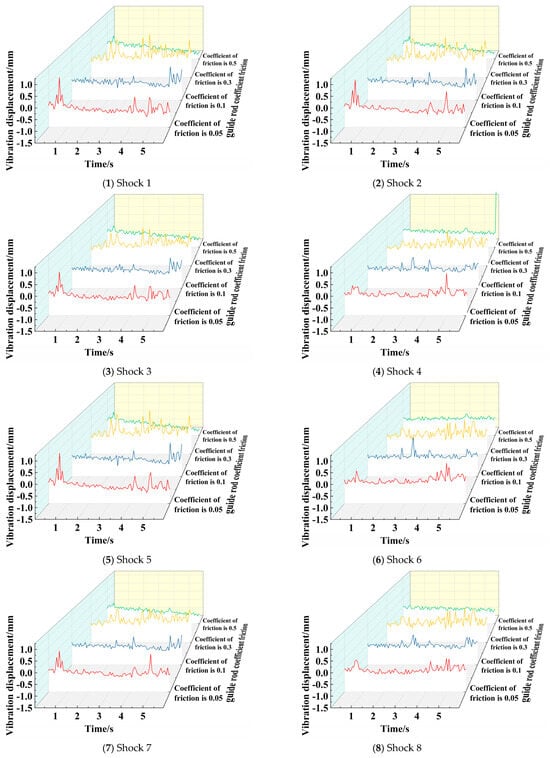
Figure 35.
Vibration displacement of different positions with different friction coefficients.
It can be seen from the figure that different positions of the chassis under different friction coefficients show disorderly fluctuations. As the friction coefficient changes, the trend of the vibration displacement and the position of the extreme value change. For further comparative analysis, the peak and average values of vibration displacement at different positions under different friction coefficients of the guide rod are extracted, as shown in Table 23.
Table 23.
Vibration displacement at different positions of the chassis with different Friction Coefficient (μm).
From the table, it can be seen that when the friction coefficient increases from 0.05 to 0.1 and continues to increase to 0.3, except for the position of the vibration sensor 7, the vibration displacement peaks of the other seven different sampling positions of the chassis gradually decrease with the increase of the friction coefficient. However, as the friction coefficient continues to increase from 0.3 to 0.5, the vibration displacement peaks of the other seven positions of the chassis except for the position of the vibration sensor 7 increase significantly. When the friction coefficient increases from 0.05 to 0.1 and continues to increase to 0.3, the average vibration displacement of the eight different sampling positions of the chassis gradually decreases with the increase of the friction coefficient. However, as the friction coefficient continues to increase from 0.3 to 0.5, the average vibration displacement of the eight positions of the chassis increases significantly. When the friction coefficient is 0.05, the average values of the peak vibration displacement and the average vibration displacement are −0.836 µm and −0.562 µm, respectively. When the friction coefficient is 0.1, the peak vibration displacement and the average vibration displacement are reduced by 4.77% and 3.96%, respectively. When the friction coefficient is 0.3, the peak vibration displacement and the average vibration displacement are reduced by 22.14% and 55.21% respectively. When the friction coefficient is 0.5, the average and peak vibration displacement of each position are obviously increased. Under this friction coefficient, the guide rod of the shock-absorbing mechanism is difficult to move, which greatly weakens the shock-absorbing effect of the shock-absorbing structure. Even the failure of the shock-absorbing mechanism occurs in the process of movement. Through comprehensive analysis, it can be seen that the average value and peak value of the vibration displacement have obvious advantages when the friction coefficient of the guide rod of the shock-absorbing mechanism is 0.3, so the friction coefficient between the guide rod and the guide rod sleeve should be 0.3.
5.2.4. The Influence of Wheel Friction Coefficient on the Slip Amount
The wheel is the main part of the chassis in contact with the ground, and the driving force is generated by its interaction with the ground. The friction parameters between the wheel and the ground during the movement have an important influence on the performance of the chassis. In this paper, based on the spring steel material spring with the wire diameter of 1.2 mm as the shock-absorbing device, the speed of the chassis driving motor is given to be 80 r/min—that is, 0.52 m/s; the chassis test running distance is 4 m; and the operating environment is porcelain floor. By constructing the chassis dynamics model, the influence of wheel friction coefficient on the skidding characteristics of the chassis is studied. With the help of simulation analysis, the vibration displacement curves of different positions of the chassis when the wheel friction coefficient is 0.59 (the original friction coefficient of the wheel), 0.7 and 0.8 are obtained, as shown in Figure 36.
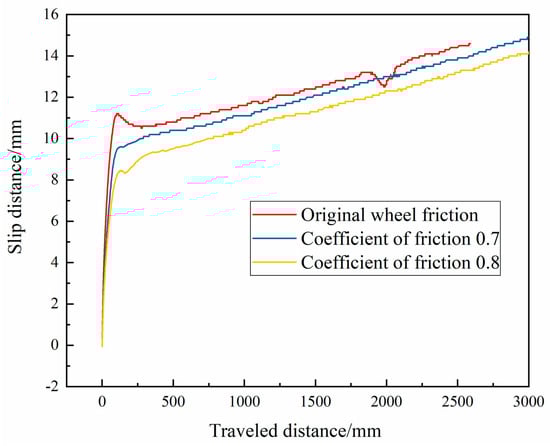
Figure 36.
Wheel slip amount under different wheel friction coefficients.
From the figure, it can be seen that the slip amount of the chassis increases rapidly in the initial stage of the chassis start-up, and increases to an inflection point in a very short time. With the increase in the friction coefficient of the wheel, the slip distance of the chassis decreases gradually under the same running distance.
The peak values of the wheel slippage amount under different wheel friction coefficients are extracted and the slippage ratio is calculated accordingly, as shown in Table 24. It can be seen from the table that when the wheel friction coefficient is 0.7, the slippage amount and slippage ratio decrease by 1.53% rather than the original wheel. When the wheel friction coefficient is 0.8, the slippage amount and slippage ratio decrease by 5.84% rather than the original wheel. Under the condition of different wheel friction coefficients at the same running distance, the slippage amount and slippage ratio of the chassis show the downward trend with the increase of the wheel friction coefficient. Therefore, during the working process of the chassis, we should try to select the tire with higher friction coefficient to adapt to various working conditions. From Automobile Tire Dynamics, it is known that the friction coefficient of the tire is not more than 0.8 in the ground under various conditions. Therefore, the friction coefficient between the chassis wheel and the ground designed in this paper is selected as 0.8, and the material of the wheel tire is selected accordingly to improve the adaptability of the chassis to various working conditions.
Table 24.
Slip characteristics of the wheel.
5.2.5. Chassis Straightness Optimization
The straightness test results of the physical prototype show that though the offset ratio of the initial design chassis is small, the offset is large when the travel distance increases. The reason is that the wheel adopts the transition fit mode. The quality and accuracy of the 3D printing coupling and the installation error of the wheel and the steering mechanism lead to the offset of the wheel direction, thus affecting the driving straightness of the chassis.
Therefore, in the simulation, the interference fit mode is used at the coupling and other positions, controlling the installation error of the steering mechanism and improving the stiffness of the Ackerman steering structure. Based on the spring steel material spring with a wire diameter of 1.2 mm as the shock-absorbing device, the speed of the chassis driving motor is given to be 80 r/min—that is, 0.52 m/s. The motion straightness simulation test of the chassis is carried out with a calibration distance of the chassis test of 2.5 m and an operating environment being porcelain floor.
Firstly, ensure that other conditions are the same as the previous straightness experimental test, adjusting the installation error of the modified model in the simulation, obtain its offset, and compare it with the experimental data as shown in Table 25.
Table 25.
Comparation between the simulation after optimized the installation error and the experiment before the optimization.
It can be seen from the data table that under the same motion distance, the chassis offset is 43.7233 mm in the actual experiment test, while the offset is 27.595 mm in the simulation environment, which is 36.89% lower than that in the actual experiment test environment; the offset ratio is reduced from 1.957% to 1.098%. After optimizing the installation error, the chassis offset obtained in the simulation environment is much smaller than that in the actual experiment test. Therefore, optimizing the installation error can significantly improve the straightness of the designed chassis.
The offset of the wheel direction is another important factor affecting the driving straightness of the chassis. In order to realize the offset of the wheel direction, the operation simulation of different wheel friction coefficients under the same conditions is carried out, and the chassis offset under different wheel friction coefficients is obtained, as shown in Table 26.
Table 26.
Chassis offset under different wheel friction coefficients.
From the simulation results, it can be seen that at the same movement distance, the wheel offset with the wheel friction coefficient of 0.7 is 33.7013 mm, and the offset decreases by 38.75% compared to that of the friction coefficient of 0.6. The wheel offset of the wheel friction coefficient of 0.8 is 16.6153 mm, and the offset reduced by 69.8% compared with that of the friction coefficient of 0.6. As the wheel friction coefficient increases, the overall offset of the chassis decreases significantly. It can be seen that the friction coefficient of the chassis wheel has a crucial influence on its offset, and the higher the tire friction coefficient, the smaller the offset of the chassis is.
5.3. Determination of the Optimized Structure of the Four-Wheel-Driving Ackerman Chassis
Through the study of the dynamic characteristics and variation law of the four-wheel-driving Ackerman chassis based on the single-factor quantitative experiment and dynamic simulation, the important structure and performance parameters of the four-wheel-driving Ackerman chassis are determined, as shown in Table 27.
Table 27.
Optimized structure and performance parameters of the Ackerman chassis.
According to the structure and parameters in Table 27, the dynamic simulation model of the optimized chassis is constructed, and its motion and dynamic performance are verified under the conditions of speed of 80 r/min (0.52 m/s) and motion of 7.15 s (motion distance of 4130 mm). The data of vibration, straightness, slip amount and acceleration are obtained respectively, and compared them with the dynamic simulation data of the original structure (original structure: spring steel spring with wire diameter of 1.2 mm, wheel with original wheelbase, cylindrical guide rod form, guide rod friction coefficient of 0.05 (default value), wheel friction coefficient of 0.59).
The peak and mean values of chassis vibration displacement before and after optimization are shown in Table 28. According to the table, the average vibration value of the original simulation is 0.6277 mm, the average vibration value after optimization is 0.4543 mm, in contrast, the average vibration value is reduced by 27.63%. The vibration peak value of the optimized model is also better than that of the original structure. In contrast, the average vibration peak value of the optimized structure decreases by 2.59%. After the structural optimization of the simulation model, the vibration characteristics of the chassis are significantly improved.
Table 28.
The peak and mean values of chassis vibration displacement before and after optimization.
The simulation results of the peak and mean acceleration of the chassis before and after optimization are shown in Table 29. The average acceleration of the chassis structure before optimization is 0.0116 g. After structural optimization, the average acceleration of the chassis during operation is reduced to 0.005 g. In contrast, the average acceleration of the optimized structure is reduced by 56.76%. The peak acceleration of the original chassis can reach 2.8554 g when starting or braking, after structural optimization, the peak acceleration of starting or braking is reduced to 1.9633 g, in contrast, the peak acceleration after structural optimization is reduced by 31.24%. Through analysis, it can be seen that after the structural optimization, the stability of the chassis in motion and the acceleration mutation when starting or braking have been significantly improved.
Table 29.
The peak and mean values of chassis acceleration before and after optimization (× g).
Under the condition of speed 80 r/min (0.52 m/s) and motion distance 3500 mm, the simulation of chassis slip and straightness after optimization is carried out. The simulation results of chassis slip and straightness before and after optimization are shown in Table 30 and Table 31. According to the tables, when running the same 3500 mm, the slippage amount of the chassis before optimization is 16.12 mm, while the chassis deviation after structure and parameter optimization is only 8.36 mm. In contrast, the slippage amount of the chassis after structure optimization decreased by 48.14%, and the skid resistance was significantly improved. Before optimization, the chassis offset was 55.0189 mm, and the offset ratio reached 1.57%. After optimization, the chassis offset was only 13.96 mm, and the offset ratio decreased to 0.399%. In contrast, the chassis offset decreased by 74.63% after structural optimization. After structural optimization, the running straightness of the chassis was significantly improved.
Table 30.
Slippage amount of the chassis before and after optimization.
Table 31.
Straightness of the chassis before and after optimization.
Based on the above analysis, it can be seen that the vibration performance of the optimized chassis is significantly improved, the slippage amount is gradually reduced, the travel straightness is significantly improved, and the stability is also effectively optimized. Therefore, the comprehensive performance of the optimized four-wheel-driving Ackerman chassis is significantly improved, and the adaptability is further improved, which can be well used for industrial transportation services.
Choi et al. applied the Ackerman geometry theory to the electronic independent four-wheel steering system and tested the influence of the converted Ackerman geometry on the steering performance through the analysis of the experiment [38]. Zhao et al. conducted a detailed design of the Ackerman steering structure, introduced the Ackerman criterion into the size synthesis of the incomplete non-circular gear steering mechanism, and used numerical simulation and kinematic simulation to complete the structural design and verification [39]. Gutiérrez conducted simulation analysis on three steering geometries: Ackermann steering (AS), articulated steering (RS), and explicit independent steering (ES) and compared the three types of steering using positioning error rate [40]. In the above research, Choi et al. only used experimental methods from Ackermann’s related studies. Zhao and Gutiérrez et al. only used simulation methods for research and conclusion verification. In this paper, we confirmed that the overall design of the chassis is reasonable and determined the optimal shock absorber spring through experiments. At the same time, we found that the design was insufficient and pointed out the optimization direction of the simulation through experiments. Further, the structural parameters and material parameters of the chassis body are optimized and verified by simulation. Finally, the optimal chassis parameters are obtained by the two-stage optimization method combining experiment and simulation, which provides a new, better, and more comprehensive idea and technology for the design and optimization of the four-wheel-drive Ackerman chassis.
6. Conclusions
In order to improve the comprehensive performance of the chassis-driven handling robot and expand its application range, this paper designs a four-wheel-driving Ackerman chassis based on the Ackerman steering mechanism. Through the working principle and structural analysis of the chassis, a four-wheel-driving Ackerman carrier chassis dynamic test system was established, and quantitative experiments under different conditions were carried out to test the chassis’s performance. On the basis of verifying the rationality of the chassis design, the chassis operation simulation under different structural and material parameters was carried out by constructing the chassis dynamics simulation model, and the chassis optimization design was completed accordingly. The following conclusions are obtained:
- (1)
- Based on the Ackerman steering mechanism, a four-wheel-driving Ackerman chassis composed of Ackerman steering mechanism, guide rod, suspension shock-absorbing structure, aluminum square tube frame, drive motor, main control board, and loaded wheels is constructed.
- (2)
- The vibration characteristics, migration performance, slippage amount, and travel straightness are determined as the important performance evaluation factors of the carrier chassis. Based on this, a distributed sensing test system for chassis performance is established, which is composed of eight groups of vibration displacement sensors, six groups of travel acceleration sensors, 3three groups of ultrasonic ranging sensors, and two groups of photoelectric gate counting sensors, and the measurement methods of vibration, acceleration, slippage amount, and straightness are proposed.
- (3)
- The single-factor variable analysis method was used to carry out the quantitative operation test of four-wheel-driving Ackerman chassis under different conditions, the results show that in the initial designed four-wheel-driving Ackerman chassis, compared to the tail, the shock-absorbing mechanism in the front of the chassis body can reduce the vibration peak by 35.88%, which has an obvious shock-absorbing effect. The vibration amplitude of the chassis in motion can be controlled below 0.262 mm, and the starting or stopping acceleration mutation can be controlled below 2.94 m/s2, so it has good seismic performance and good motion stability. Although the slippage ratio of the chassis is within the normal range, the slippage amount and the slippage ratio are relatively high, and there is a large optimization space. The offset ratio of the chassis can be controlled within 2%, which meets the requirements of most carrier workshops, but there is still some room for optimization. Under the four different working conditions of porcelain floor, asphalt road, cement road, and 15° slope, the maximum vibration displacement of the chassis is only 0.649 mm, the maximum average vibration displacement is only 0.090697 mm, and the maximum average acceleration is only 0.0708 g. It shows good shock resistance and stability, so the chassis has strong generalization application ability.
- (4)
- According to the chassis running experimental results with the support springs of different diameters and materials as the shock-absorbing mechanism, it can be seen that the vibration performance and acceleration performance of the chassis are the best when the 1.4 mm wire diameter stainless steel spring is used as the shock-absorbing-mechanism. Therefore, the 1.4 mm wire diameter stainless steel spring is determined as the shock-absorbing mechanism.
- (5)
- The multi-body dynamics simulation model of the four-wheel-driving Ackerman chassis is established. The operating characteristics of the chassis under the conditions of wheelbase size change, guide rod structure and friction coefficient change, wheel friction coefficient change, and chassis installation error change are analyzed. When the wheelbase of the chassis changes, the original wheelbase+40 mm can effectively improve the overall vibration performance of the chassis. The vibration peak value and vibration mean value of the chassis with the chute guide rod are better than those of the cylindrical guide rod. When the friction coefficient between the guide rod and the guide rod sleeve is 0.3, the advantages of the mean value and peak value of the chassis vibration are very obvious. When the wheel friction coefficient is 0.8, the slippage amount and slippage ratio of the chassis are the smallest and the practicability to the ground is the highest. When the chassis installation error is eliminated and the wheel friction coefficient is 0.8, the chassis offset is significantly reduced and the straightness is effectively improved.
- (6)
- Through the operation simulation of the optimized four-wheel-driving Ackerman chassis and the comparison with the corresponding simulation results of the chassis before optimization, it can be obtained that the average vibration value of the optimized chassis decreases by 27.63%, and the average vibration peak decreases by 2.59%. After optimization, the average acceleration is reduced by 56.76%, and the peak acceleration is reduced by 31.24% when starting or braking. Under the same operating distance, the optimized chassis slippage amount decreased by 48.14% and the offset decreased by 74.63%. Therefore, the vibration performance and stability of the optimized chassis are significantly improved, and the slippage amount and straightness are effectively improved. After optimization, the straightness of the chassis is reduced to 0.399%, which is suitable for the chassis’s accurate carrier applications.
This paper provides a design scheme of four-wheel-driving Ackerman chassis for industrial transportation and combines the optimization method of quantitative experiment and the dynamic simulation for the optimization analysis of chassis, which is of great significance to promote the development and application of the wheeled chassis.
Author Contributions
Conceptualization, methodology, investigation, writing—review and editing, project administration, funding acquisition, Y.Y.; writing—original draft preparation, X.Z. and B.X.; formal analysis, B.X. and Y.L.; experiment, X.Z., B.X. and Y.L.; data curation, X.Z., B.X., Y.L. and P.J. All authors have read and agreed to the published version of the manuscript.
Funding
This work was supported by National Natural Science Foundation of China (62203428), Innovation Ability Improvement Project of Science and Technology smes in Shandong Province (Grant No. 2023TSGC0334), Jining City key research and development project (Grant No. 2023KJHZ001), Guangdong Basic and Applied Basic Research Foundation (Grant No. 2021A1515110486), and Shenzhen Science and Technology Program (Grant No. RCBS20210706092252054).
Data Availability Statement
Data will be made available on request.
Acknowledgments
Thanks to Yin Meng from Shenzhen Institutes of Advanced Technology (Chinese Academy of Sciences) for his support and help in terms of technology and hardware.
Conflicts of Interest
The authors declare no conflicts of interest.
References
- Zheng, Y.; Zheng, X.; Xiong, Y.; Yang, C.; Hou, L. Modeling and motion simulation of four wheel motor driven chassis. Electron. Meas. Technol. 2020, 43, 170–174. [Google Scholar]
- Lv, Y.; Li, Z.; Zhang, J. Innovation and optimization design on steering mechanism of front axle swing steering four-wheel chassis. J. Chin. Agric. Mech. 2016, 37, 107–110. [Google Scholar]
- Zheng, X. Study on Structure Analysis and Control of Omnidirectional Electric Chassis. Master’s Thesis, Changchun University of Science and Technology, Changchun, China, 2018. [Google Scholar]
- Tian, T. Design and Experiment Research of Four Wheel Independent Drive Chassis. Master’s Thesis, Chinese Academy of Agricultural Mechanization Sciences, Beijing, China, 2012. [Google Scholar]
- Yang, F. Research on Control of Handling and Stability for Four-Wheel Steering and Four-Wheel Independent Driving Vehicle. Master’s Thesis, Wuhan University of Technology, Wuhan, China, 2021. [Google Scholar]
- Zhu, Z.; Lv, Q.; Wang, Y.; Ding, H. Four Wheel Differential Steering Model for Omnidirectional Electric Chassis Applied in Off-road Vehicles. J. Chang. Univ. Sci. Technol. (Nat. Sci. Ed.) 2015, 38, 48–52. [Google Scholar]
- Wang, G. Structure Design and Control Research of Four Wheels Intelligent Vehicle. Master’s Thesis, ShiJiazhuang Tiedao University, Shijiazhuang, China, 2018. [Google Scholar]
- Peng, G.; Lu, Z.; Tan, Z.; He, D.; Li, X. A novel algorithm based on nonlinear optimization for parameters calibration of wheeled robot mobile chasses. Appl. Math. Model. 2021, 95, 396–408. [Google Scholar] [CrossRef]
- Wang, R.; Chen, Y.; Feng, D.; Huang, X.; Wang, J. Development and performance characterization of an electric ground vehicle with independently actuated in-wheel motors. J. Power Sources 2011, 196, 3962–3971. [Google Scholar] [CrossRef]
- Joa, E.; Yi, K.; Sohn, K.; Bae, H. Four-wheel independent brake control to limit tire slip under unknown road conditions. Control. Eng. Pract. 2018, 76, 79–95. [Google Scholar] [CrossRef]
- Wang, Z.; Yang, J.; Liu, P.; Long, X.; Li, H.; Wei, W. Development of an agricultural vehicle levelling system based on rapid active levelling. Biosyst. Eng. 2019, 186, 337–348. [Google Scholar] [CrossRef]
- Hang, P.; Chen, X. Integrated chassis control algorithm design for path tracking based on four-wheel steering and direct yaw-moment control. Proc. Inst. Mech. Eng. 2019, 233, 625–641. [Google Scholar] [CrossRef]
- Chi, C.; Xu, Y.; Xu, G.; Cheng, B.; Shen, J. Modular design and analysis of the x-by-wire center point steering independent suspension for in-wheel electric vehicle. Adv. Mech. Eng. 2018, 10, 1–12. [Google Scholar] [CrossRef]
- Zhu, Y.; Kan, J.; Li, W.; Kang, F. Strategies of traversing obstacles and the simulation for a forestry chassis. Int. J. Adv. Robot. Syst. 2018, 15, 1–13. [Google Scholar] [CrossRef]
- Zhang, Z.; Zhang, X.; Pan, H.; Salman, W.; Rasim, Y.; Liu, X.; Wang, C.; Li, X. A Novel Steering System for a Space-Saving 4WS4WD Electric Vehicle: Design, Modeling, and Road Tests. IEEE Trans. Intell. Transp. Syst. 2017, 18, 114–127. [Google Scholar] [CrossRef]
- Xu, Q.; Li, H.; Wang, Q.; Wang, C. Wheel Deflection Control of Agricultural Vehicles with Four-Wheel Independent Omnidirectional Steering. Actuators 2021, 10, 334. [Google Scholar] [CrossRef]
- McGinn, C.; Cullinan, M.F.; Otubela, M.; Kelly, K. Design of a terrain adaptive wheeled robot for human-orientated environments. Auton. Robot. 2019, 43, 63–78. [Google Scholar] [CrossRef]
- Li, J.; Xie, R.; Zhou, Y.; Tang, R. Driving Dynamics Modeling and Simulation of Wheeled Off-Road Vehicle. Syst. Simul. Technol. 2017, 13, 304–309. [Google Scholar]
- Cao, W. Research on Trajectory Tracking Control of Wheeled Mobile Robot Chassis. Master’s Thesis, Xiamen University of Technology, Xiamen, China, 2022. [Google Scholar]
- Sun, X. Vehicle Body Design and Obstacle Surmounting Performance Analysis of Wheeled Household Monitoring Robot. Master’s Thesis, Harbin University of Science and Technology, Harbin, China, 2015. [Google Scholar]
- Qu, J.; Li, H.; Zhang, R.; Guo, K.; Ding, Y.; Wang, B. Research on steering motion control and experiments of agricultural wheeled robot chassis. J. Chin. Agric. Mech. 2023, 44, 140–147+160. [Google Scholar]
- Qin, Q.; Cheng, M.; Qiu, D.; Jin, L. Research on Chassis Pass Ability of Multi-suspension Wheeled Robot. J. Jiamusi Univ. (Nat. Sci. Ed.) 2023, 41, 101–105+139. [Google Scholar]
- Gao, L.; Qin, J.; Huang, M.; Liu, X. Design and simulation of a new type wheeled robot chassis with zero turning radius. China Sci. Pap. 2021, 16, 911–918. [Google Scholar]
- Wang, C.; Wang, D.; Chen, Y.; Liu, Z.; Xiang, C. Obstacle negotiation performance analysis and simulation for six wheel all-terrain mobile robot. Manuf. Autom. 2016, 38, 72–77. [Google Scholar]
- Zhu, J.; Huang, Y.; Zhang, H. Design and Motion Control of Four-wheel Automotive Chassis Inspection Robot. J. Syst. Simul. 2015, 27, 1548–1555. [Google Scholar]
- Yim, S. Comparison among Active Front, Front Independent, 4-Wheel and 4-Wheel Independent Steering Systems for Vehicle Stability Control. Electronics 2020, 9, 798. [Google Scholar] [CrossRef]
- Obertino, M. Upgrade of the EE-Architecture of an Electric Test Vehicle with Drive-by-Wire Component. Master’s Thesis, Politecnico di Torino, Turin, Italy, 2023. [Google Scholar]
- Kolekar, M.A.; Mulani, M.S.; Nerkar, M.A.; Borchate, S. Review on Steering Mechanism. Int. J. Sci. Adv. Res. Technol. 2017, 3, 1155–1160. [Google Scholar] [CrossRef]
- Klier, W.; Reimann, G.; Reinelt, W. Concept and Functionality of the Active Front Steering System; SAE Technical Paper: Warrendale, PA, USA, 2004; 2004-21-0073; Available online: https://www.sae.org/publications/technical-papers/content/2004-21-0073/ (accessed on 20 February 2024).
- Hang, P.; Chen, X.; Fang, S.; Luo, F. Robust control for four-wheel-independent-steering electric vehicle with steer-by-wire system. Int. J. Automot. Technol. 2017, 18, 785–797. [Google Scholar] [CrossRef]
- Whitehead, J.C. Rear Wheel Steering Dynamics Compared to Front Steering. J. Dyn. Syst. Meas. Control 1990, 112, 88–93. [Google Scholar] [CrossRef]
- Zhihu. 2021 China Automotive Steering System Industry Analysis Report—Industry Scale and Development Trend Analysis. Available online: https://zhuanlan.zhihu.com/p/407711855 (accessed on 7 September 2021).
- China Economic Information Network. The Development Trend of China’s Automotive Steering System Industry in 2023, and the Domestic Industry Penetration Rate Is High, But There Is Still Room for Progress. Available online: https://www.huaon.com/channel/trend/905805.html (accessed on 25 June 2023).
- Zhihu. Bosch China/NSK/ZF Won the Top Three EPS Chinese Market Last Year, and the Domestic Market Entered the Breakthrough Cycle. Available online: https://zhuanlan.zhihu.com/p/471673039 (accessed on 24 February 2022).
- Zhihu. Automobile Active Steering Technology Analysis and Steering System Development Review. Available online: https://zhuanlan.zhihu.com/p/393699574 (accessed on 8 April 2022).
- Four-Wheel Steering System Industry Market Size and Brand Competition Analysis Report (Including Industry Key Enterprises Market Performance and Competitive Strategy Analysis). Available online: https://www.globalmarketmonitor.com.cn/reports/2218093-four-wheel-steering-system-market-report.html (accessed on 10 July 2023).
- Liang, L.; Liu, H.; Li, X.; Zhu, X.; Lan, B.; Liu, Y.; Wang, X. Model-based coordinated trajectory tracking control of skid-steer mobile robot with timing-belt servo system. Electronics 2023, 12, 699. [Google Scholar] [CrossRef]
- Choi, M.W.; Park, J.S.; Lee, B.S.; Lee, M.H. The performance of independent wheels steering vehicle(4WS) applied Ackerman geometry. In Proceedings of the 2008 International Conference on Control, Automation and System, Seoul, Republic of Korea, 14–17 October 2008. [Google Scholar]
- Zhao, J.S.; Liu ZJ, F.X.; Dai, J.S. Design of an Ackermann-type steering mechanism. Proc. Inst. Mech. Eng. Part C J. Mech. Eng. Sci. 2013, 227, 2549–2562. [Google Scholar] [CrossRef]
- Gutiérrez, J.; Apostolopoulos, D.; Gordillo, J.L. Numerical comparison of steering geometries for robotic vehicles by modeling positioning error. Auton. Robot. 2007, 23, 147–159. [Google Scholar] [CrossRef]
Disclaimer/Publisher’s Note: The statements, opinions and data contained in all publications are solely those of the individual author(s) and contributor(s) and not of MDPI and/or the editor(s). MDPI and/or the editor(s) disclaim responsibility for any injury to people or property resulting from any ideas, methods, instructions or products referred to in the content. |
© 2024 by the authors. Licensee MDPI, Basel, Switzerland. This article is an open access article distributed under the terms and conditions of the Creative Commons Attribution (CC BY) license (https://creativecommons.org/licenses/by/4.0/).