Article

Design of Electronic Filter for Noise and Vibration Reduction in Brushed DC Motor

1
Department of Mechanical Engineering, Dong-eui University, 176, Eomgwang-ro, Busanjin-gu, Busan 47340, Republic of Korea
2
Department of Automotive Engineering, Dong-eui University, 176, Eomgwang-ro, Busanjin-gu, Busan 47340, Republic of Korea
*
Author to whom correspondence should be addressed.
Machines 2024, 12(3), 148; https://doi.org/10.3390/machines12030148
Submission received: 25 January 2024 / Revised: 17 February 2024 / Accepted: 19 February 2024 / Published: 20 February 2024
(This article belongs to the Section Electrical Machines and Drives)

Abstract

:
With the recent conversion of internal combustion engines to electric vehicles, new noise issues have arisen, and among them, the noise generated by internal vehicle auxiliary systems is being considered. This study introduces an electronic filter designed with a motor model featuring vibration components, aiming to minimize the noise and vibrations generated by a Brushed DC (BDC) motor commonly employed in vehicle internal systems. It introduces a method to identify the connectors and internal parameters used in the motor for the matching of the model and experimental motor, and to measure and estimate these parameters. The model is separated and executed to ensure convergence, and it is validated by comparing the analysis results with the measured values. A filter is designed using the model to reduce current oscillations in the motor, confirming a subsequent reduction in noise and vibration. This research suggests the potential to attenuate noise and vibration in already produced motors by attaching only a filter without modifying the internal motor structure. Moreover, it is anticipated that a filter can be designed to predict and mitigate the noise and vibration components of the motor based on changes in load.

1. Introduction

Due to technological advancements in the automotive industry and the rise in socio-economic levels, there is an increasing demand for the sophistication of vehicles. Advanced vehicles prioritize not only performance but also various aspects such as comfort, convenience, and stability. Among them, the noise and vibration generated in vehicles are areas of concern as they can cause discomfort for vehicle users. Noise and vibration within vehicles manifest in various forms. In particular, there has been an emergence of noise issues in areas that were not previously considered, especially due to the recent shift from internal combustion engines to electric vehicles. Electric vehicles are generally known to be quieter than traditional internal combustion engine vehicles [1]. However, a new issue has arisen where noises previously masked by engine sounds are now audible. One such issue is the noise generated by auxiliary systems within the vehicle [2].
Motors are used in various locations within the vehicle, such as HVAC (Heating, Ventilating, and Air Conditioning), driver seat adjustment, and vehicle window control [3,4]. The types of motors used can be broadly categorized into Brushed DC motors (BDC) and Brushless DC motors (BLDC). BLDC motors, which are BDC motors with brushes removed, offer a long lifespan and high efficiency. Research on BLDC motors has been conducted due to these advantages. Studies analyzing motor noise and vibrations have utilized methods such as analyzing vibrations using asymmetric z-axis protrusions [5] and analyzing the impact of the stator pole shape and switching methods used on noise and vibrations [6]. Methods for reducing noise and vibrations include forming optimal slots on the rotor pole face [7] or designing an optimal structure to shift the natural frequency of the stator to its maximum value [8]. However, due to the need for additional controllers and relatively higher costs, BDC motors are still used in vehicles for their affordability and easy control.
Several studies have been conducted on the causes of noise and vibration in BDC motors. The vibration of BDC motors is caused by various mechanical factors [9], and among these, research has shown that the interaction between brushes and commutators is the main factor [10]. Additionally, studies have analyzed the vibration components caused by electromagnetic forces [11] and investigated the noise of BDC motors, encompassing both physical and electromagnetic factors across a broad frequency range [12]. In the case of the BDC motor used in vehicles, physical features such as appearance and housing are determined according to the vehicle. Therefore, in this study, the focus was on reducing motor noise and vibration by mitigating electromagnetic factors rather than physical factors.
Studies aimed at reducing noise and vibration in BDC motors by mitigating electromagnetic forces have attached a copper ring to the permanent magnet poles [13], transformed the pole shapes into a sawtooth edge poles configuration [14], and proposed studies introducing poles with different widths in the transverse direction [15]. Furthermore, using 2D Finite Element Method (FEM) analysis, researchers have compared the motor’s magnetic field with radial force and proposed two mitigation methods [16]. Another study analyzed the relationship between the cogging torque and noise, suggesting three methods to reduce it [17]. These studies focused on reducing vibrations by altering the physical structure or shape of the motor internally. However, since the BDC motors used in vehicles are compact, precise modifications to the internal structure require careful work and can incur substantial costs.
On the other hand, there is a method able to mitigate noise and vibration in the motor by adding a filter. Using a filter eliminates the need to alter the internal structure of the motor, and it can be directly connected to the motor or designed in conjunction with a controller, providing high versatility. In related research, studies have been conducted by adding notch filters to the controller to attenuate vibrations [18], and various filters have been designed to compare their noise reduction effects [19]. However, these studies were conducted on synchronous motors and induction motors, limiting their applicability to the BDC motors used inside vehicles. Therefore, this study focuses on researching methods to design filters specifically tailored to BDC motors.
To design the optimal filter, predicting the performance of the motor is essential, and motor models serve as appropriate tools for performance prediction. In studies related to BDC motor models, there have been efforts to model BDC motors operating with PWM controllers [20], compare two motor models for speed estimation [21], and validate methods for controlling the speed of very small BDC motors using modeling [22]. However, these models have limitations as they do not include the vibration components of the motor. On the other hand, there have been studies aiming to create models for predicting the vibration components of BDC motors [23]. However, these models face the challenge of applying virtual motor parameters, making it difficult to compare them directly with real motors.
To use a motor model, it is necessary to know the parameters used in the model. However, some manufacturers may only provide performance-related metrics such as the rated voltage, motor output, and rotational speed. In such cases, it may be challenging to determine the parameters used in the model. Therefore, there may be instances in which each parameter needs to be measured or estimated directly.
In this study, a design is presented for an electronic filter aimed at diminishing the current vibration components of BDC motors, consequently alleviating motor noise and vibration. The vibration originating from the current flow in the motor induces torque vibration, ultimately resulting in motor vibration and noise. Thus, attenuating motor vibration and noise is achievable by minimizing the current vibration within the motor. Our goal was to devise a filter that addresses current vibration utilizing a motor model that considers vibration. To align the experimental motor with the model, the connector attached to the experimental motor is incorporated into the model, and the parameters used in the model are measured. Parameters that are difficult to measure directly are estimated using the model. These measured or estimated parameters are then applied to the model, and its validation is conducted by comparing it with the experimental results. Through a model-based case study, a filter capable of reducing current oscillation in the motor is designed. The designed filter is applied, and the decrease in the noise and vibration components of the motor is verified. By utilizing the designed filter, it is possible to reduce motor noise and vibration without altering the internal structure of the motor. Additionally, other factors such as new loads or external influences can be added to the model, allowing for the prediction of the noise and vibration components associated with them and contributing to the design of appropriate filters.
The remaining sections of this paper are organized as follows. In Section 2, a motor model is introduced, taking into consideration the connector and filter. The method for measuring and estimating the parameters used in the model is explained. Additionally, the issue of the motor model not converging is identified, and a solution is proposed. Moving on to Section 3, an electronic filter is designed to reduce the current oscillation component using the model, and its validation is carried out through experiments. The decrease in motor noise and vibration is confirmed as the current oscillation component decreases. Finally, Section 4 provides a summary of the study’s content.

2. Modeling a Brushed DC Motor

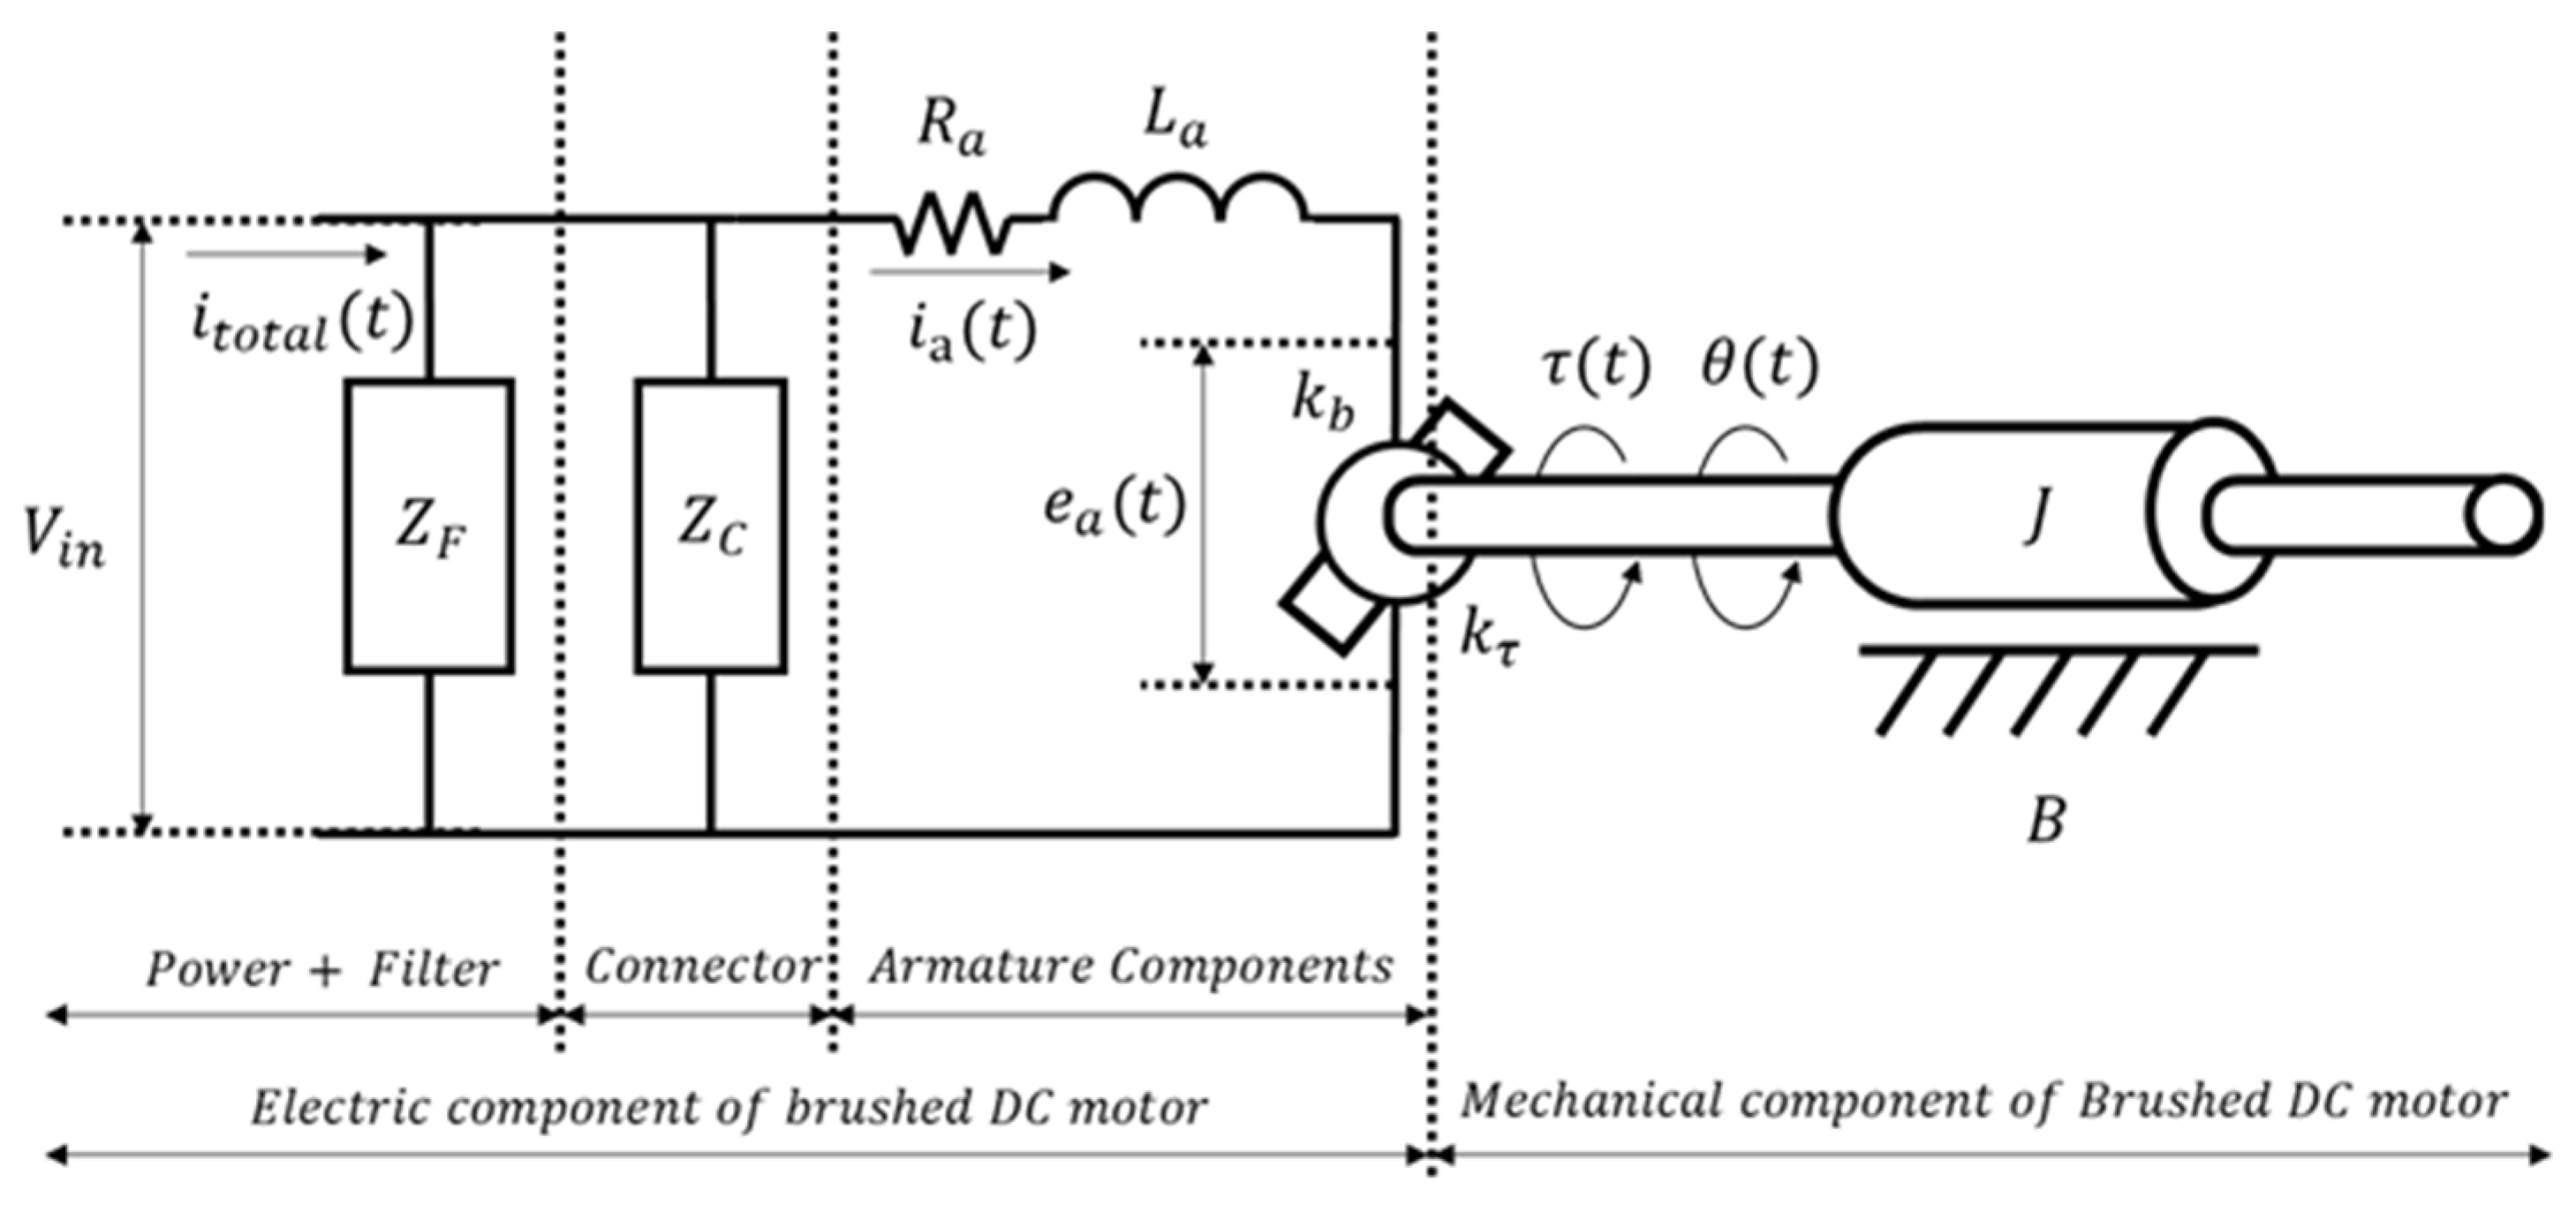
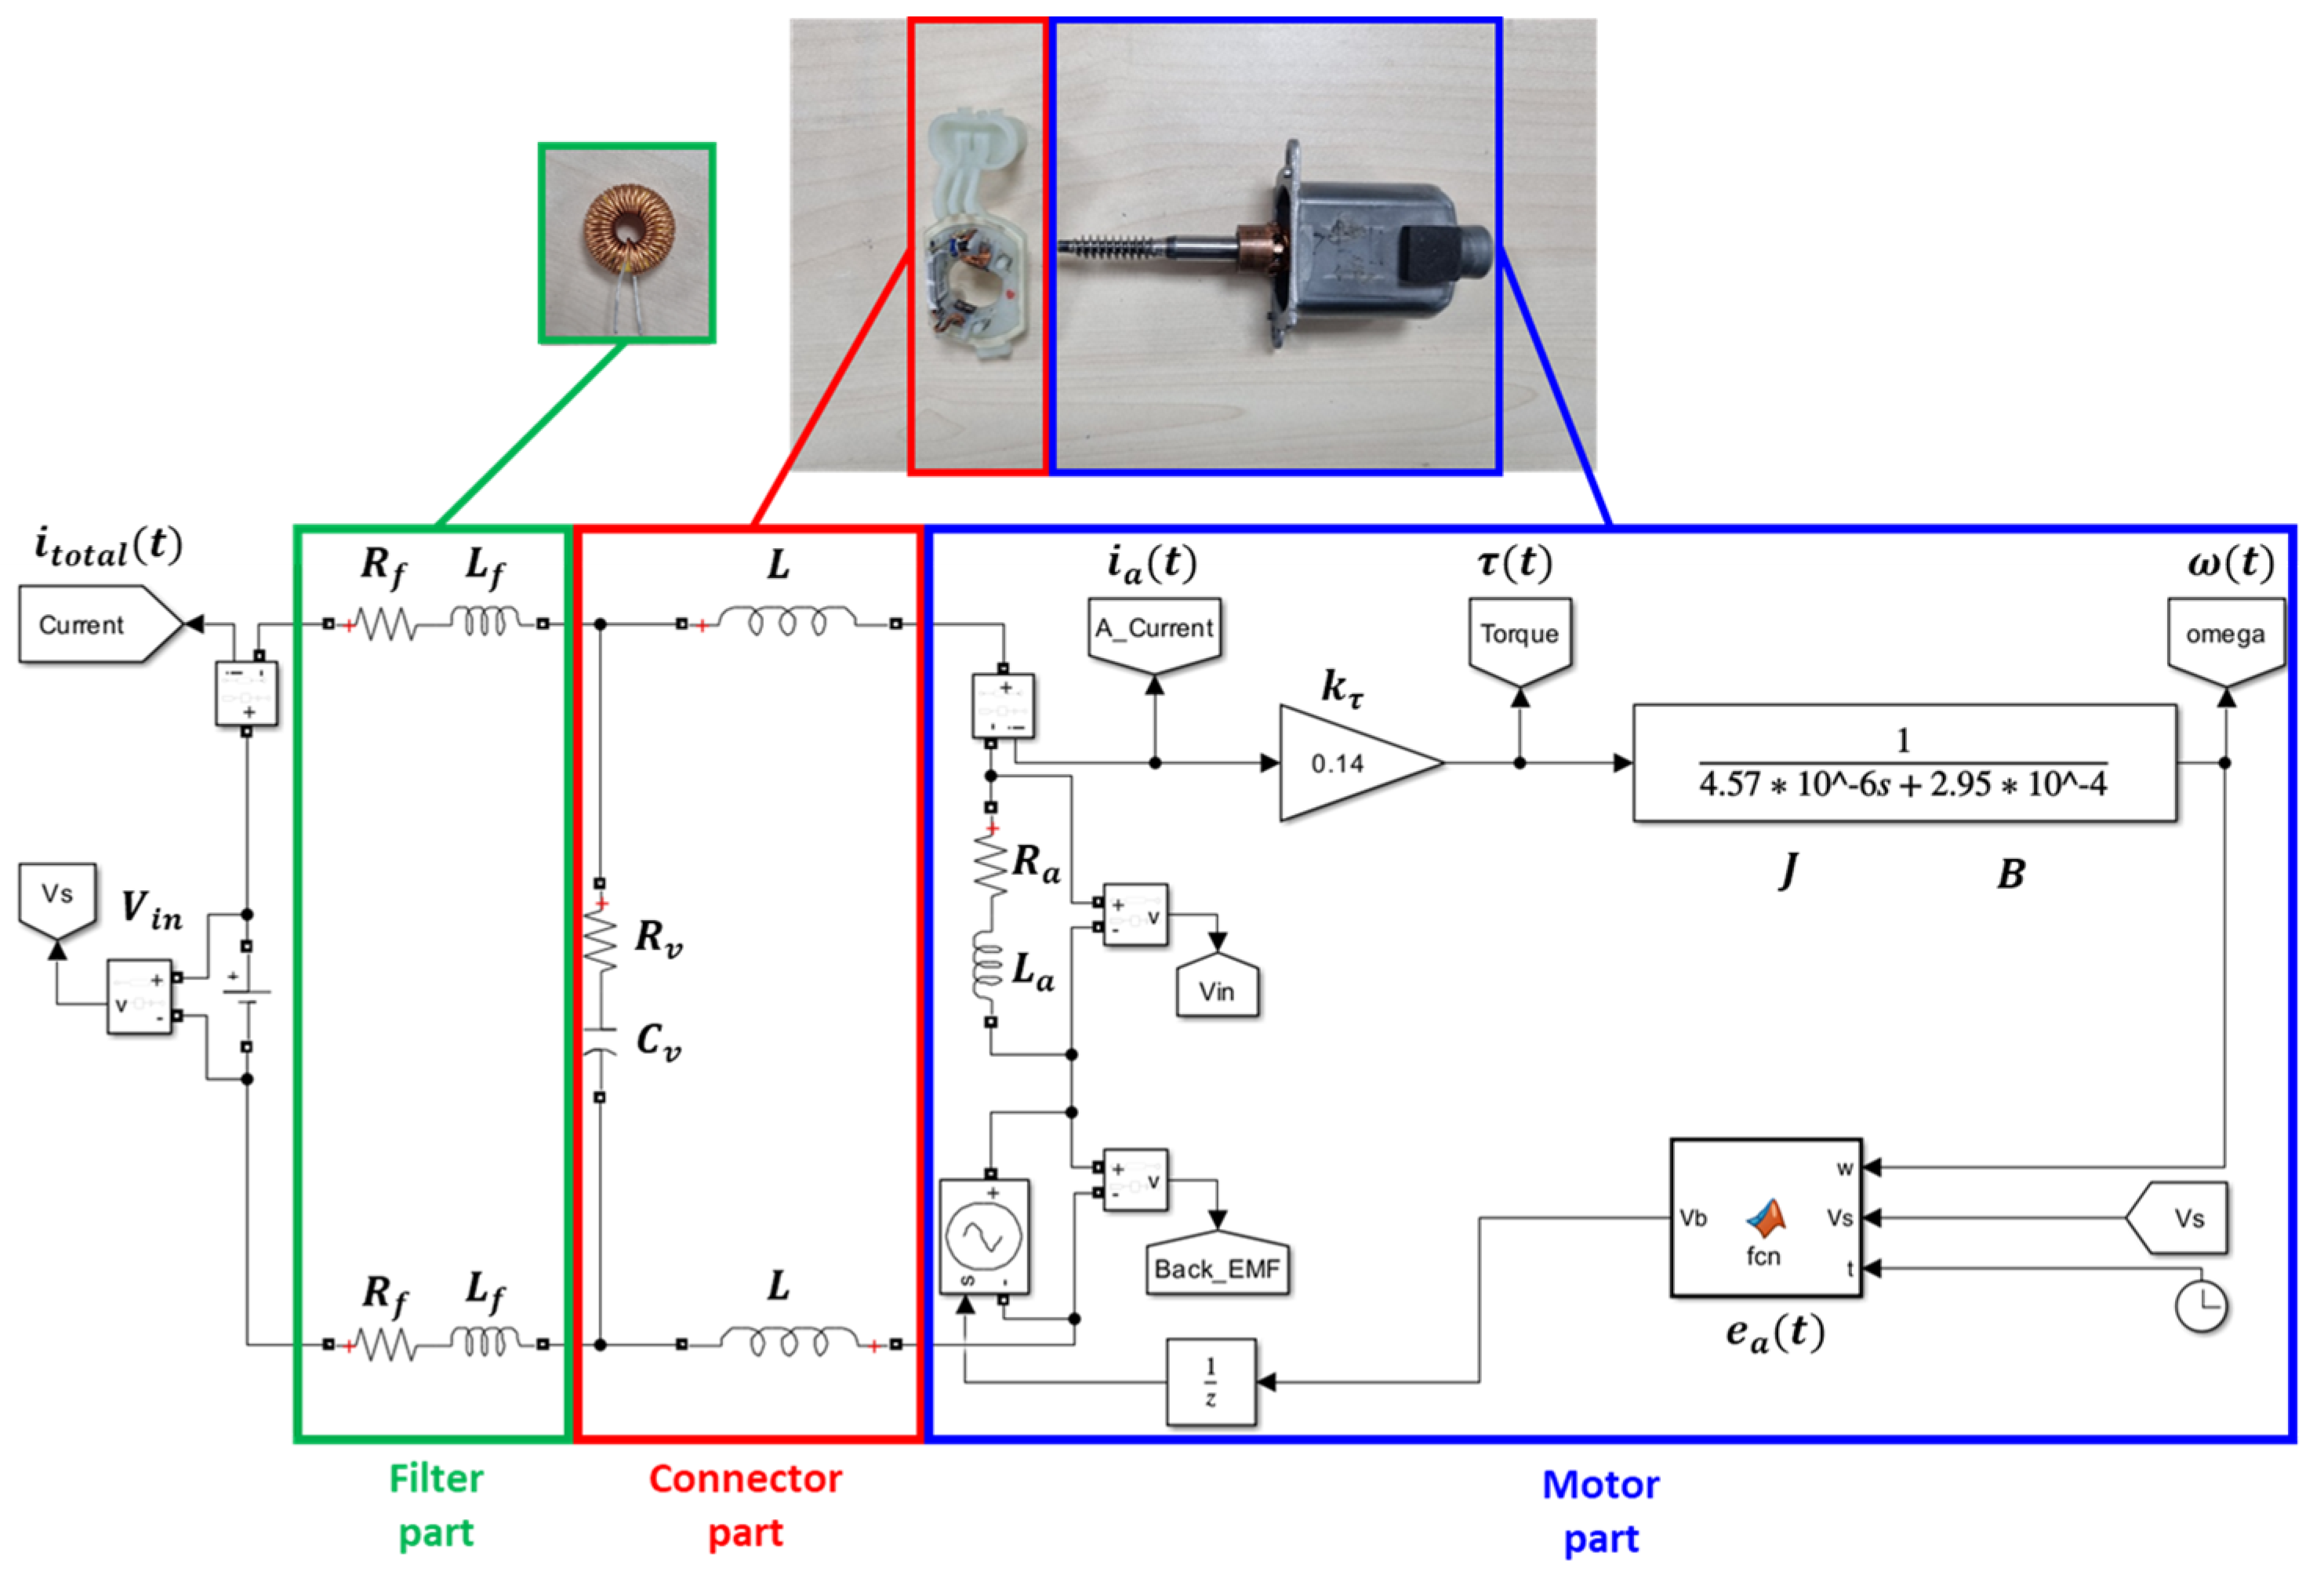
2.1. Brushed DC Motor Modeling including Connector and Filter

The Brushed DC motor used in the research consists of a connector and the motor body. The connector comprises brushes and electronic components, serving as a device to supply power to the motor. To reduce noise and vibration while maintaining the internal structure of the motor, the aim was to design an electronic filter that can be attached between the motor’s connector and the power supply.
Figure 1 depicts an overall schematic of the motor, including the electric filter and the connector. The overall schematic consists of electronic and mechanical elements. The filter and connector of the electronic elements are each represented as impedances, while the motor is depicted, distinguishing the electronic elements that make up the armature from the mechanical elements that move physically. Based on this schematic, the motor used in the experiment was modeled in 1D and is shown in Figure 2.
The model was developed using Matlab/Simulink, based on circuits and transfer functions. The green box within the model represents the filter section, which is connected between the power supply and the connector to reduce the vibrational components of the motor. In this part, the resistor and inductor are connected in series with the connector, and this information is detailed specifically in Section 3. The red box represents the connector part, and the motor used in the experiment is composed of two inductors (L) and one varistor. The varistor is represented as an equivalent circuit with a resistor (Rv) and a capacitor (Cv), which is explained in detail in Section 2.2.1. The blue box represents the motor part, which was modeled using Kirchhoff’s law and Newton’s second law. In particular, the back electromotive force (back EMF) is a noteworthy element. While conventional motor modeling represents back EMF as a constant, in order to include the vibrational components of the motor, the measured back EMF of the motor was input as a sine function based on the rotational speed [1]. The parameters used in the model and the schematic are written in Table 1.

2.2. Motor Parameter Measurement

To utilize the motor model, it is necessary to match the variables used in the model with those of the experimental motor. This section presents the measurement methods and results of the parameters, which include the connector’s inductance and varistor, as well as the motor’s inertia, friction, back EMF, and resistance.

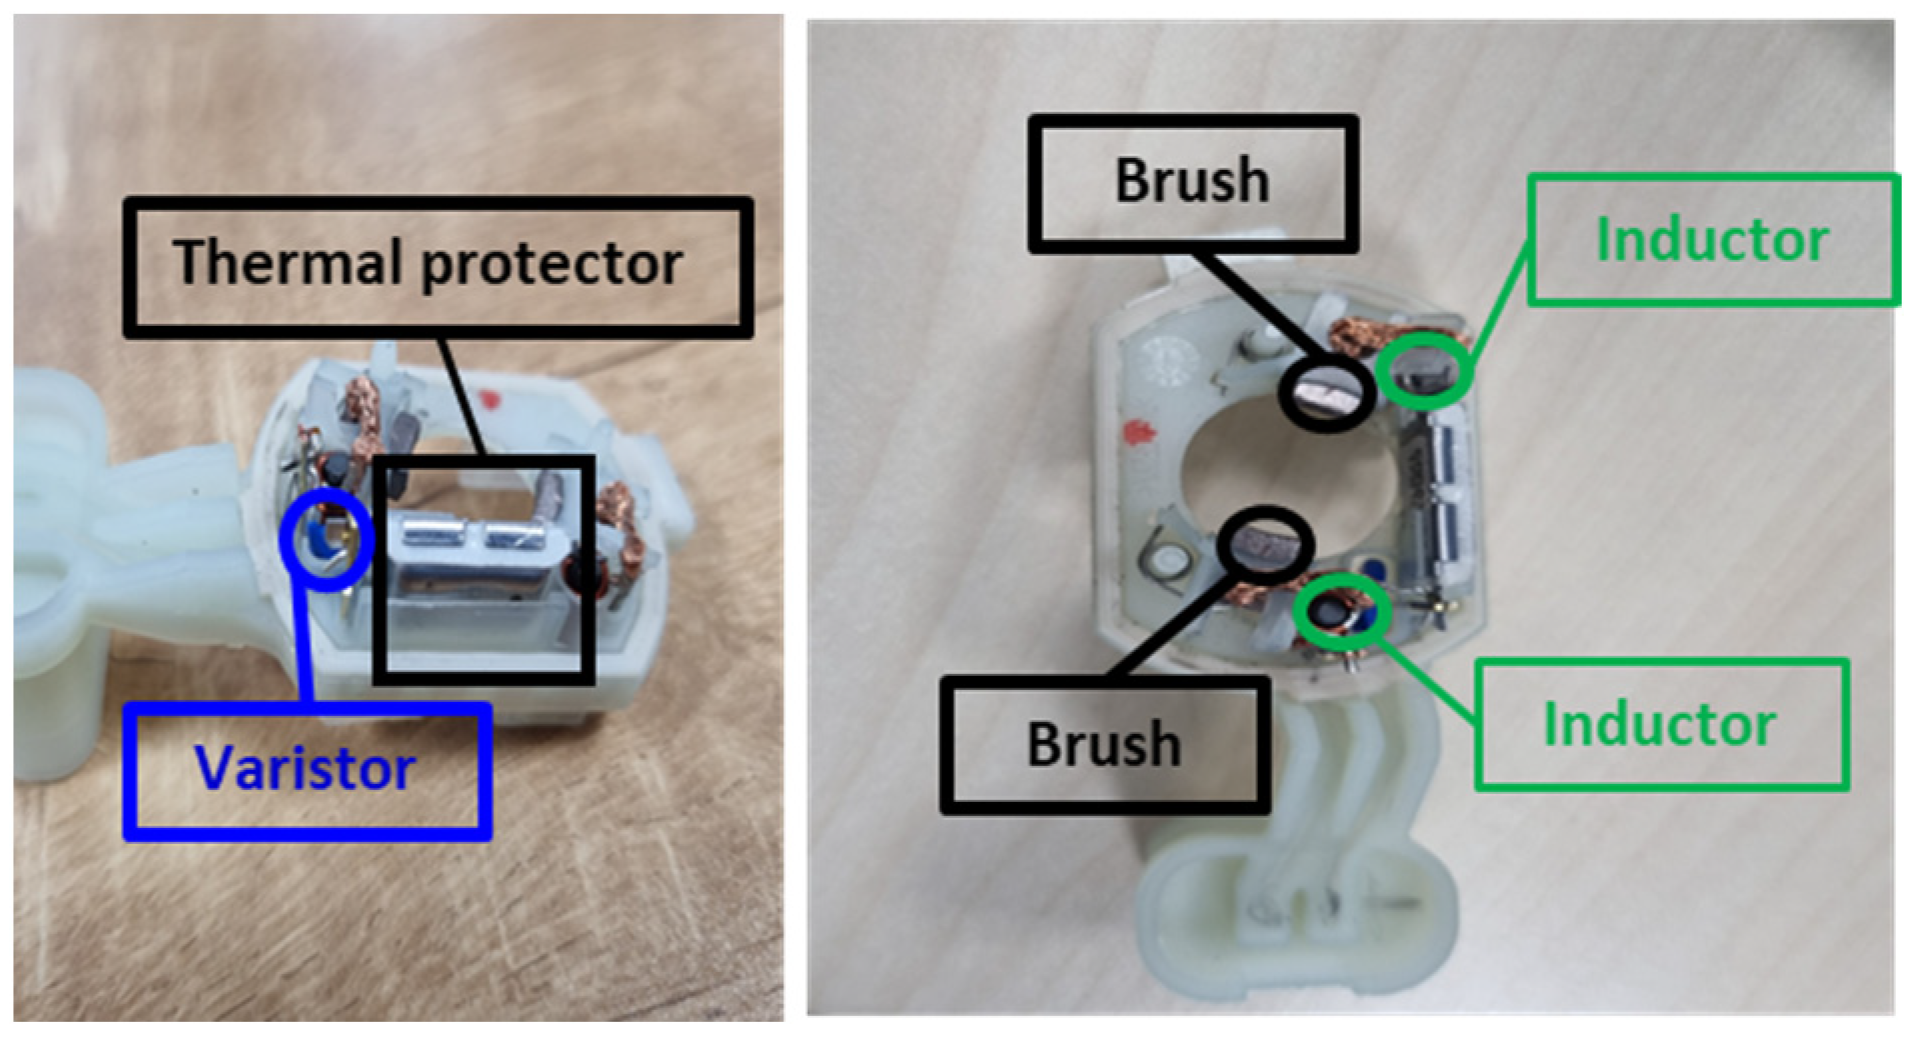
2.2.1. Motor Connector

The internal structure of the experimental motor connector is depicted in Figure 3. The connector comprises a varistor, inductor, thermal protector, and brush. The brush supplies power to the motor through physical friction, and due to its highly nonlinear nature, it has not been represented in the model. The thermal protector plays a role in cutting off electricity to protect the device in case of overheating. However, since this study does not consider the motor’s temperature, it has not been included in the model.
The varistor, indicated by the blue box in Figure 3, is connected in parallel to the power supply. This electronic component exhibits a variable resistance with respect to voltage. At the rated voltage, it maintains a high level of insulation resistance. However, when subjected to overvoltage, the resistance decreases, bypassing excess current to protect the motor. Varistors, with their capacitance components, are sometimes utilized in noise-blocking filters or frequency filters. The varistor used in this study is the S08K20 from EPOS, with a capacitance of 1600 [ p F ] and a resistance of 500 [ M Ω ] when subjected to the rated voltage. In this study, based on the motor operating at the rated voltage, the varistor was applied to the model in the form of an equivalent circuit, connecting it in series with a 1600 [ p F ] capacitor and a 500 [ M Ω ] resistor.
Connected in series at each pole of the power supply are the inductors, indicated by the green boxes. The inductor is a rod core inductor, and its inductance can be calculated using the following formula:
L = μ N 2 A l
At this point, L represents inductance, μ is the permeability, N is the number of turns in the coil, A is the cross-sectional area of the coil, and l is the length of the coil. The permeability μ can be expressed as the product of the relative permeability of the material composing the coil and the permeability on the vacuum. In the case of this inductor, which is made of copper, the relative permeability of copper is approximately 0.999994, so it can be approximated to 1. Through measurements, it has been confirmed that the number of turns N for this coil is 14, the cross-sectional area A is π 2 × 10 3 2   m 2 , and the length l is 14 × 10 3   [ m ] . Therefore, the inductance of the coil is calculated as follows:
L = 4 π × 10 7 × 1 × 14 2 × π ( 2 × 10 3 ) 2 14 × 10 3 = 0.221   [ μ H ]
The equivalent varistor and inductor were modeled by considering the series and parallel configuration between the motor and the power supply. The varistor was first connected in parallel, and the inductor was then connected in series at each pole.

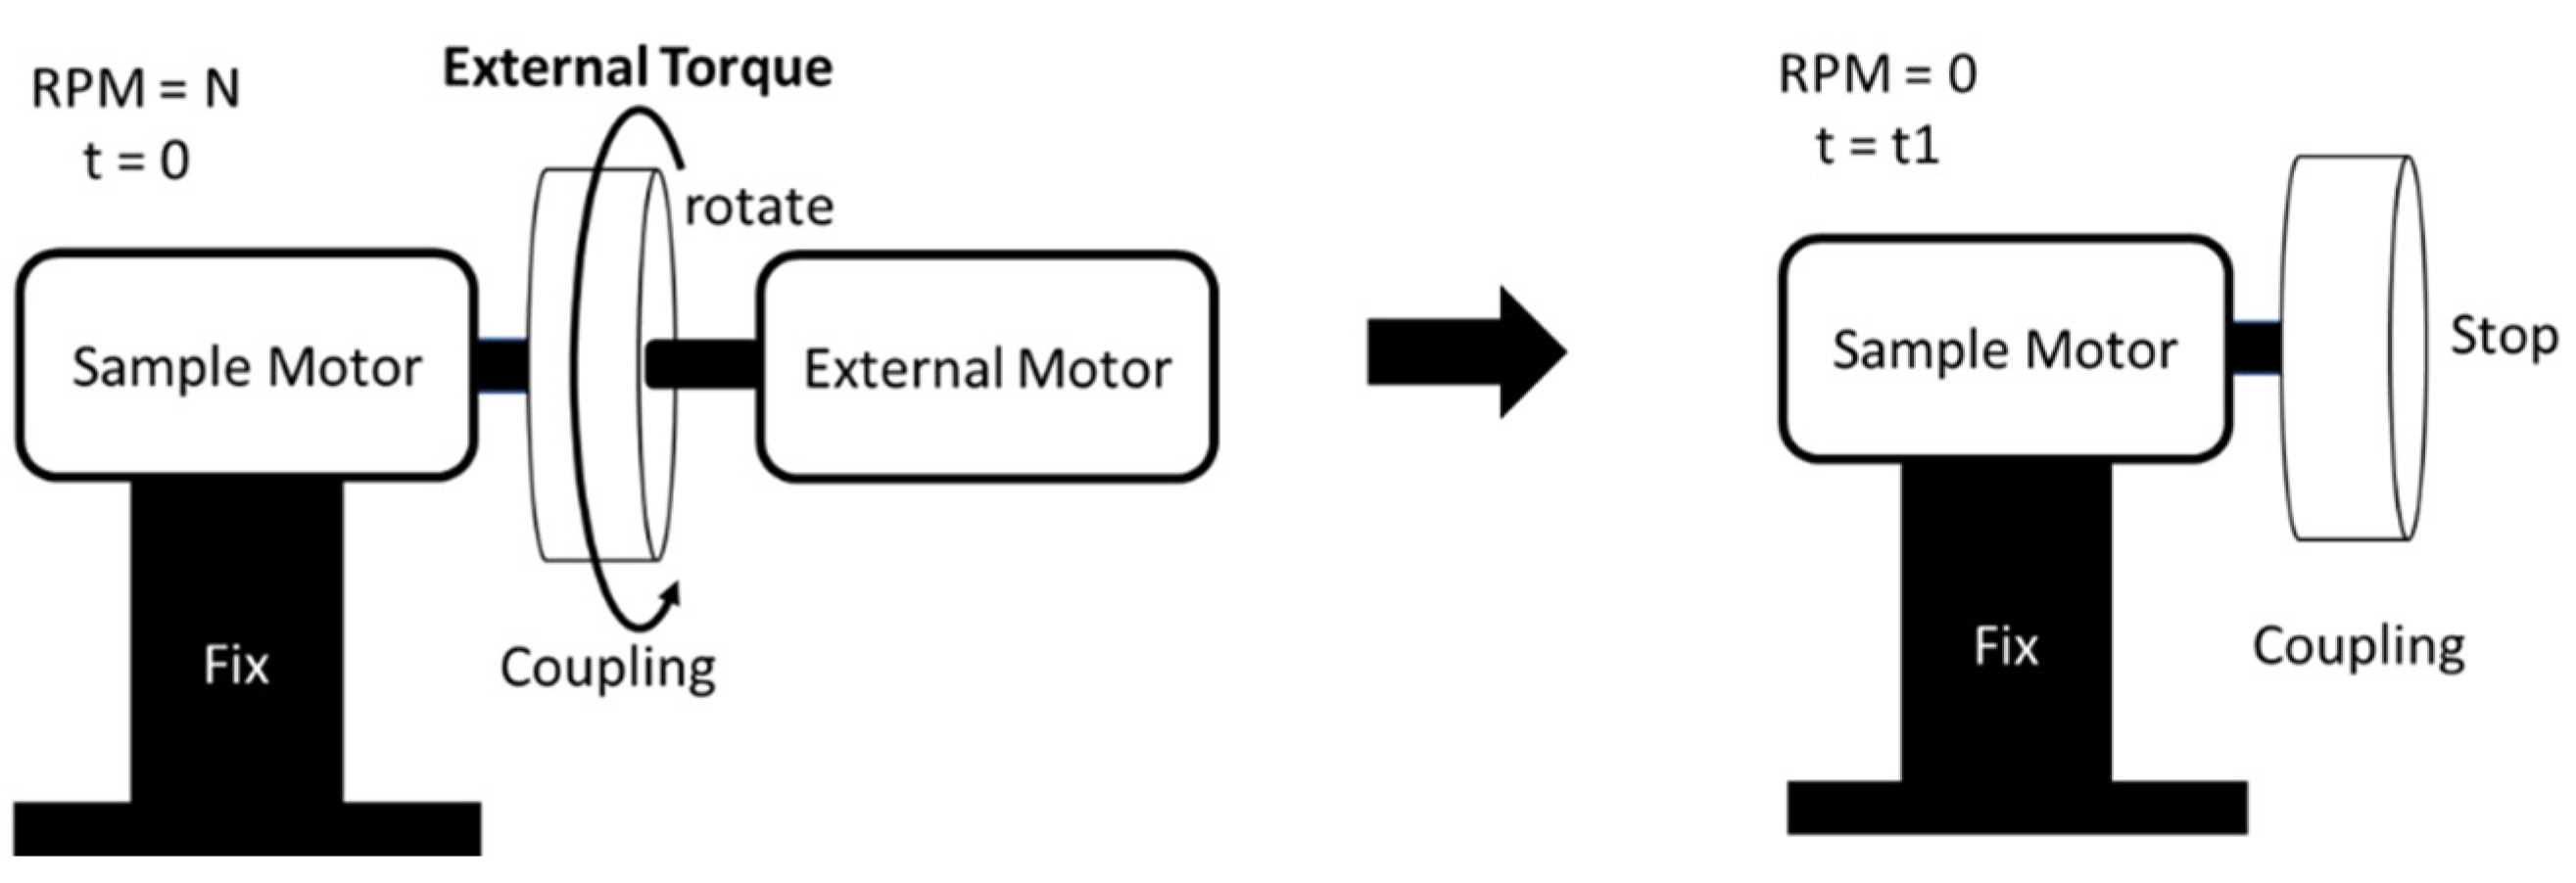
2.2.2. Motor Inertia

The inertia of the motor can be determined by measuring the time it takes for a rotating object to pass between two points on a slope. Detailed information about the measurement method is provided in Appendix A, and the inertia value of the experimental motor was measured to be 4.57 × 10 6   k g m 2 .

2.2.3. Motor Friction

The method used to measure the motor’s friction involves removing the force of a rotating body rotating at a constant speed and measuring the time it takes to come to a stop thereafter. Detailed information about the measurement method is provided in Appendix B, and the friction value of the experimental motor was measured to be 2.95 × 10 4   [ N m / ( r a d / s ) ] .

2.2.4. Motor Resistance

The internal resistance of the motor was measured using a multimeter with a 2-wire measurement method across the commutator of the motor armature, and the resistance value was measured to be 1.1 [Ω].

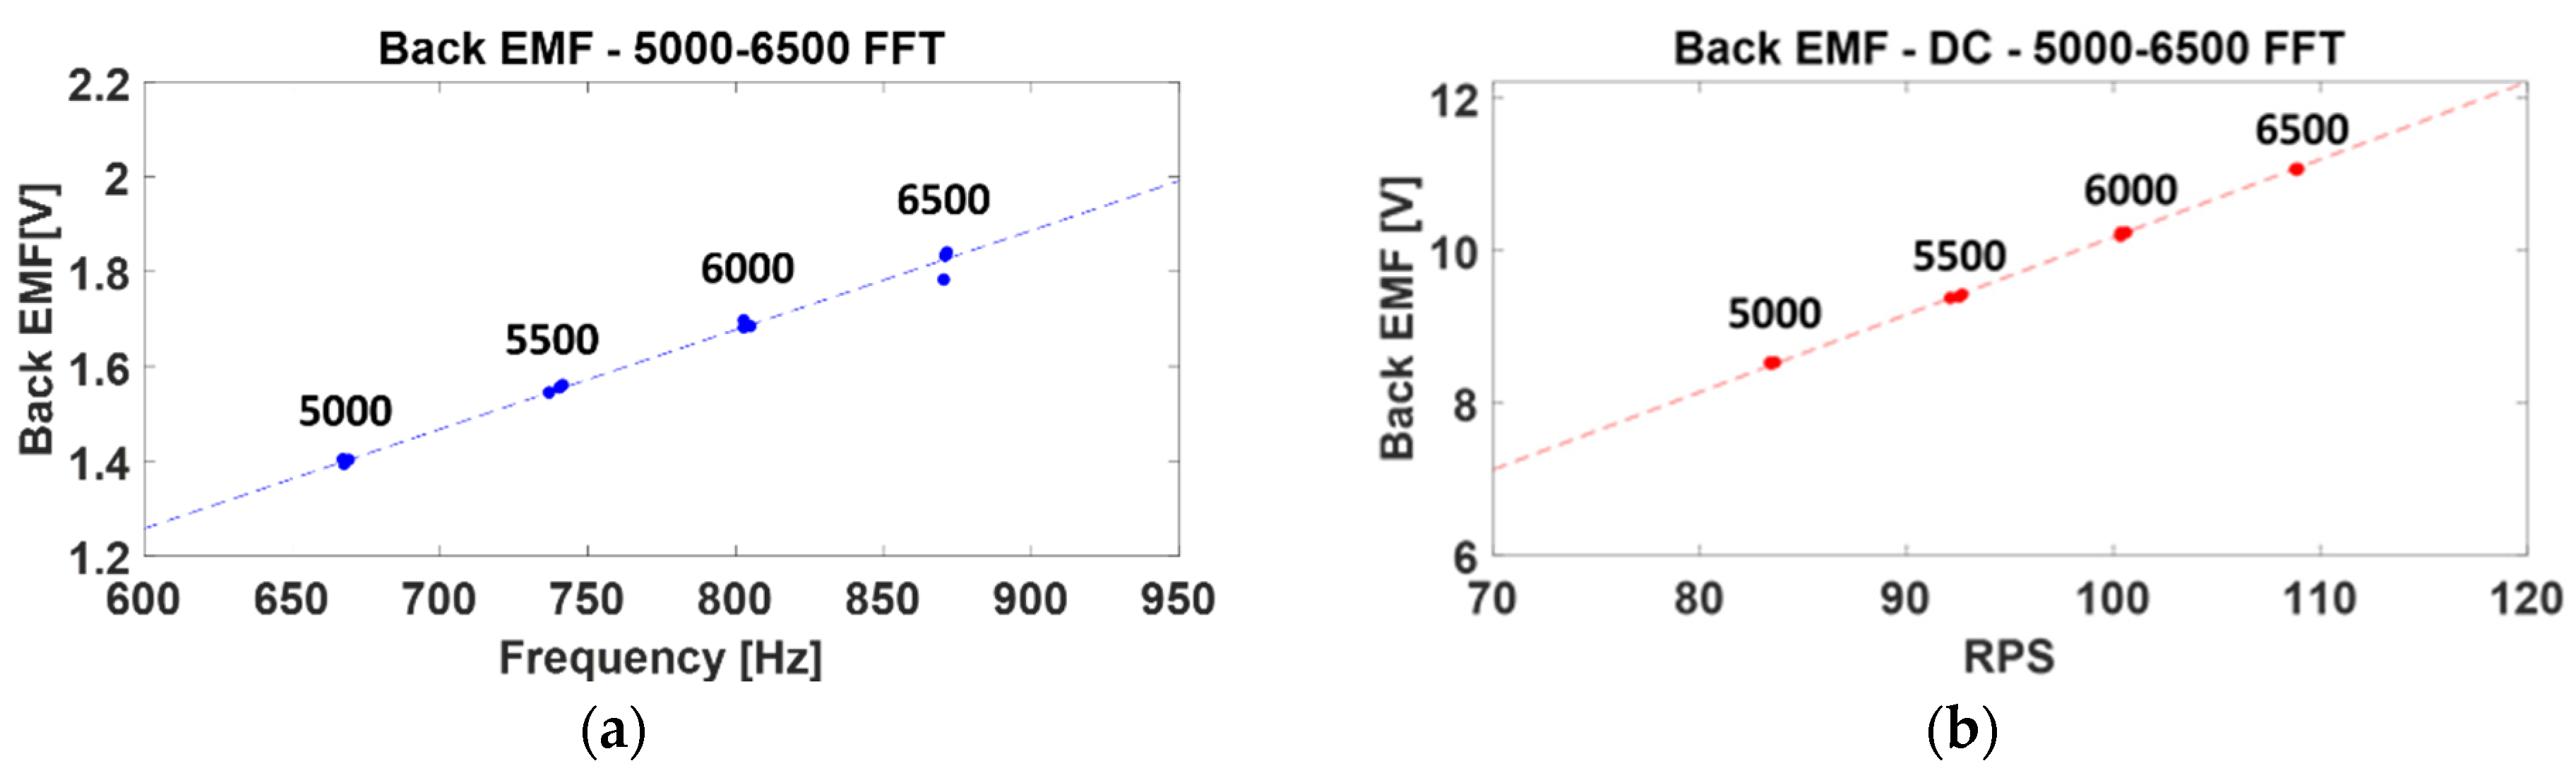
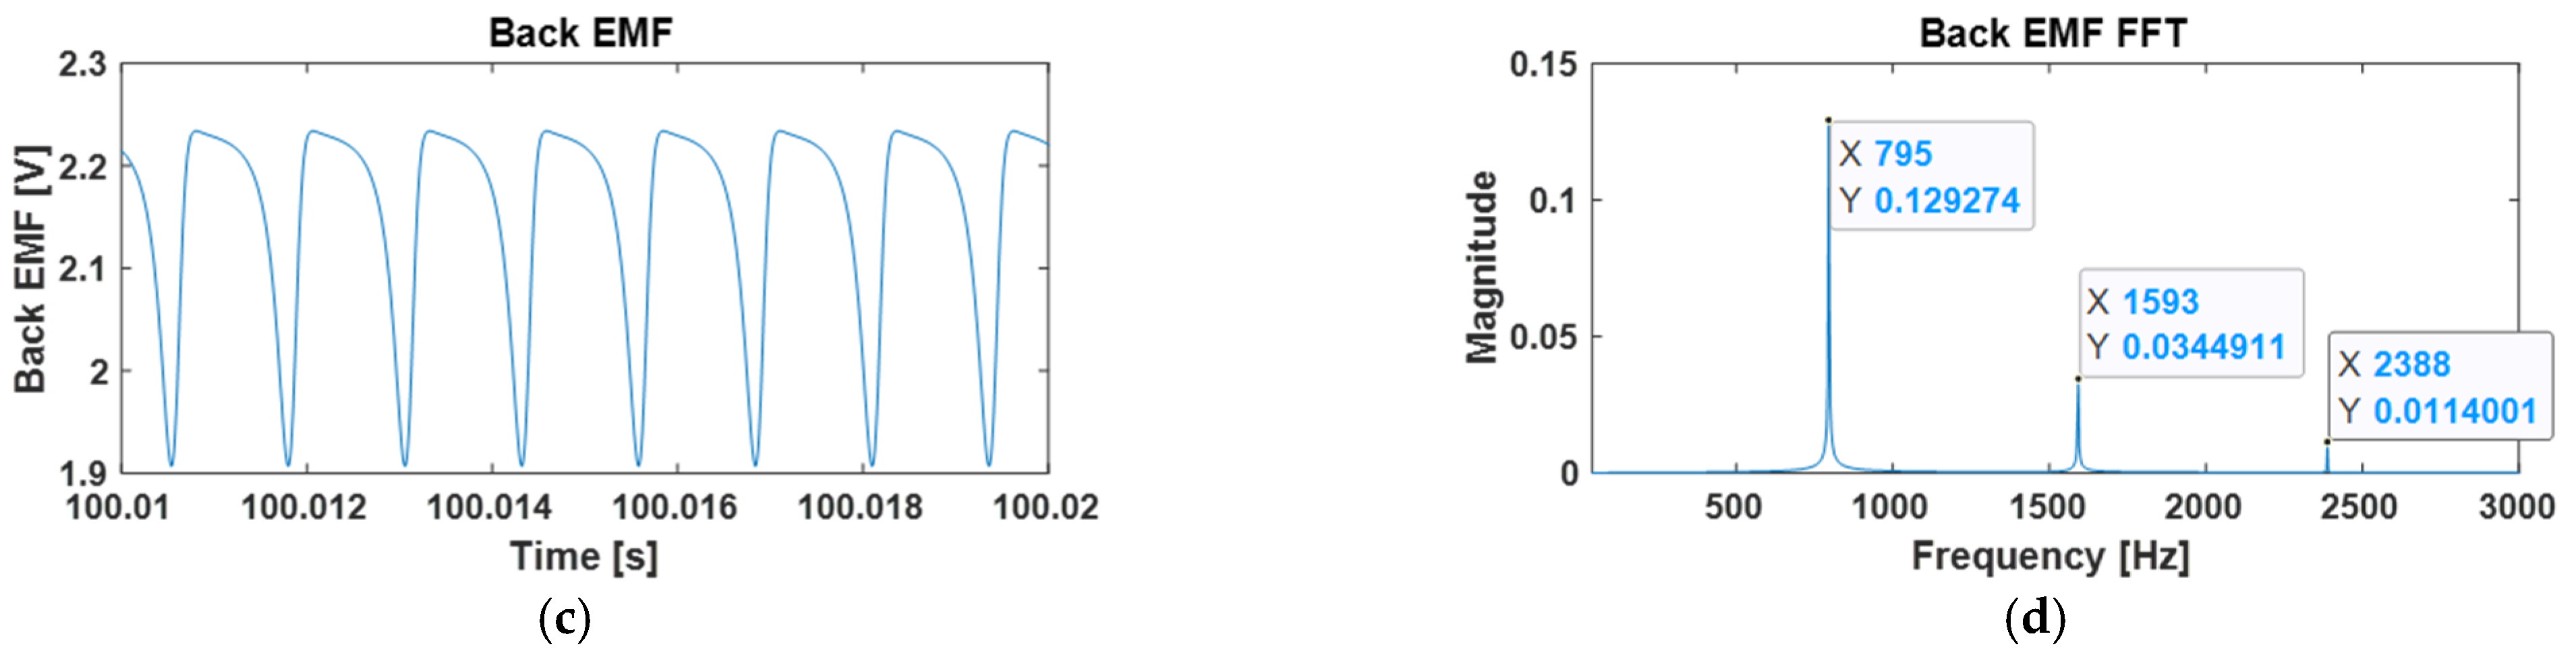
2.2.5. Motor back EMF

The back EMF of the motor represents the characteristics of the motor, and analyzing the back EMF allows for the identification of the motor’s noise and vibration components. To represent the back EMF in the model as a function with oscillatory components rather than a constant, the back EMF was measured. Figure 4 shows the result of the Fast Fourier Transform (FFT) applied to the measured back EMF. The back EMF was measured at four operating points from 5000 RPM to 6500 RPM, and the direction was set to clockwise (CW), considering the rated operating speed of the experimental motor as 6200 RPM. To ensure experimental accuracy, the measurements were conducted three times. Furthermore, since the experimental motor is configured with 2 poles and 8 slots, the main vibration component of the motor appears as an 8th order. The magnitude of the back EMF also showed the largest value in the 8th order at all operating points. Therefore, the measured back EMF data were processed using FFT to distinguish the primary vibration component, characterized by the 8th order, and the DC component. The magnitudes were linearly interpolated at each operating point and expressed as functions, as listed in Table 2. Ultimately, the back EMF function was applied to the model as the sum of the DC component and the 8th order component.

2.3. Motor Parameter Estimation

Parameters that are difficult to measure directly can be estimated by comparing the simulation results with the experimental values. This involves introducing a method to estimate the desired parameter by comparing it with the measurable parameter values and simulation results while varying the parameter of interest.

2.3.1. Estimation Method for Motor Torque Constant and Armature Inductance

The torque constant of a motor is a value that indicates the relationship between the torque output and current flowing through the motor. This constant is determined by the number of turns in the stator, the number of magnets in the rotor, and the size and shape of the magnets. This study aims to estimate the torque constant by comparing it with the motor model. While varying the torque constant and applying it to the model, it was observed that the torque constant influences the motor’s RPM and current. In the model, RPM was calculated using the angular velocity of the model.
Armature inductance is generated by the wires wound inside the motor, and for small-sized motors, it can have very small values, making accurate measurement challenging. When changing the armature inductance in the model, it was observed that only the oscillatory component of the current was affected. In the experiment, the current was measured at the location between the motor connector and the power source, and comparisons were made based on the current values at that location.

2.3.2. Estimation Results

The model was used to observe the trends in RPM and current variation by changing the motor torque constant and armature inductance. It was observed that as the motor’s torque constant increased, the oscillatory components of RPM and current also increased. Conversely, as the armature inductance increased, the oscillatory component of the current decreased. Therefore, the torque constant was first varied to match the experimental motor and RPM, and then the armature inductance was adjusted to align the current oscillation component of the simulation with that of the experimental motor. The measured RPM at the rated voltage was approximately 6200 RPM, and the magnitude of the 8th order of current was about 0.38 [A]. The most suitable torque constant was found to be 0.14, and the armature inductance could be estimated as 0.87 [ m H ] . The changes in RPM with torque constant variation and the changes in the current oscillation component with armature inductance variation are presented in Figure 5.

2.4. Model Convergence Errors and Resolution

When applying the back EMF function to the model, an error was observed where the results did not converge even after a sufficient amount of time, as shown in Figure 6. Harmonic components, in addition to the frequency components input to the model, were generated, and over time, an increasing error in these harmonic components was identified. This error arises because the variable ω in the sine function of the back EMF function exists within the feedback loop and continuously changes with time. To eliminate the error, initially, only the DC component of the back EMF was included and interpreted to converge ω. The value of ω was determined as ω a . Afterward, a function incorporating both the oscillatory component and the DC component was input, and the simulation was conducted by applying the value ω a to the ω of the sine function.

2.5. Model Validation

To validate the model, a comparison was made between the test and simulation results, as shown in Figure 7. The parameter values applied in Section 2.2 and Section 2.3 are used, and these values are recorded in Table 3. The dashed line represents the measured results, and the solid line is the simulation results. The comparison is based on the oscillatory component of the current, which is relatively easy to measure and is a target that can be attenuated through filter design. The measured frequency and magnitude are 825.84 [Hz] and 0.389 [A], respectively, while in the simulation, they are 825.7 [Hz] and 0.380 [A]. The frequency and magnitude values between the measured and simulated results show almost no difference.

3. Designing Electronic Filters for Motor Noise and Vibration Reduction Using a Model

In the motor model, it can be observed that the oscillation of the back EMF leads to the oscillation of the current, and this current oscillation generates torque oscillation, ultimately becoming the physical vibration component of the motor. Accordingly, this study aimed to design an electronic filter to mitigate the 8th order vibration of the current; this was with the purpose of reducing the main vibration component, which is the 8th order vibration, of the experimental motor.

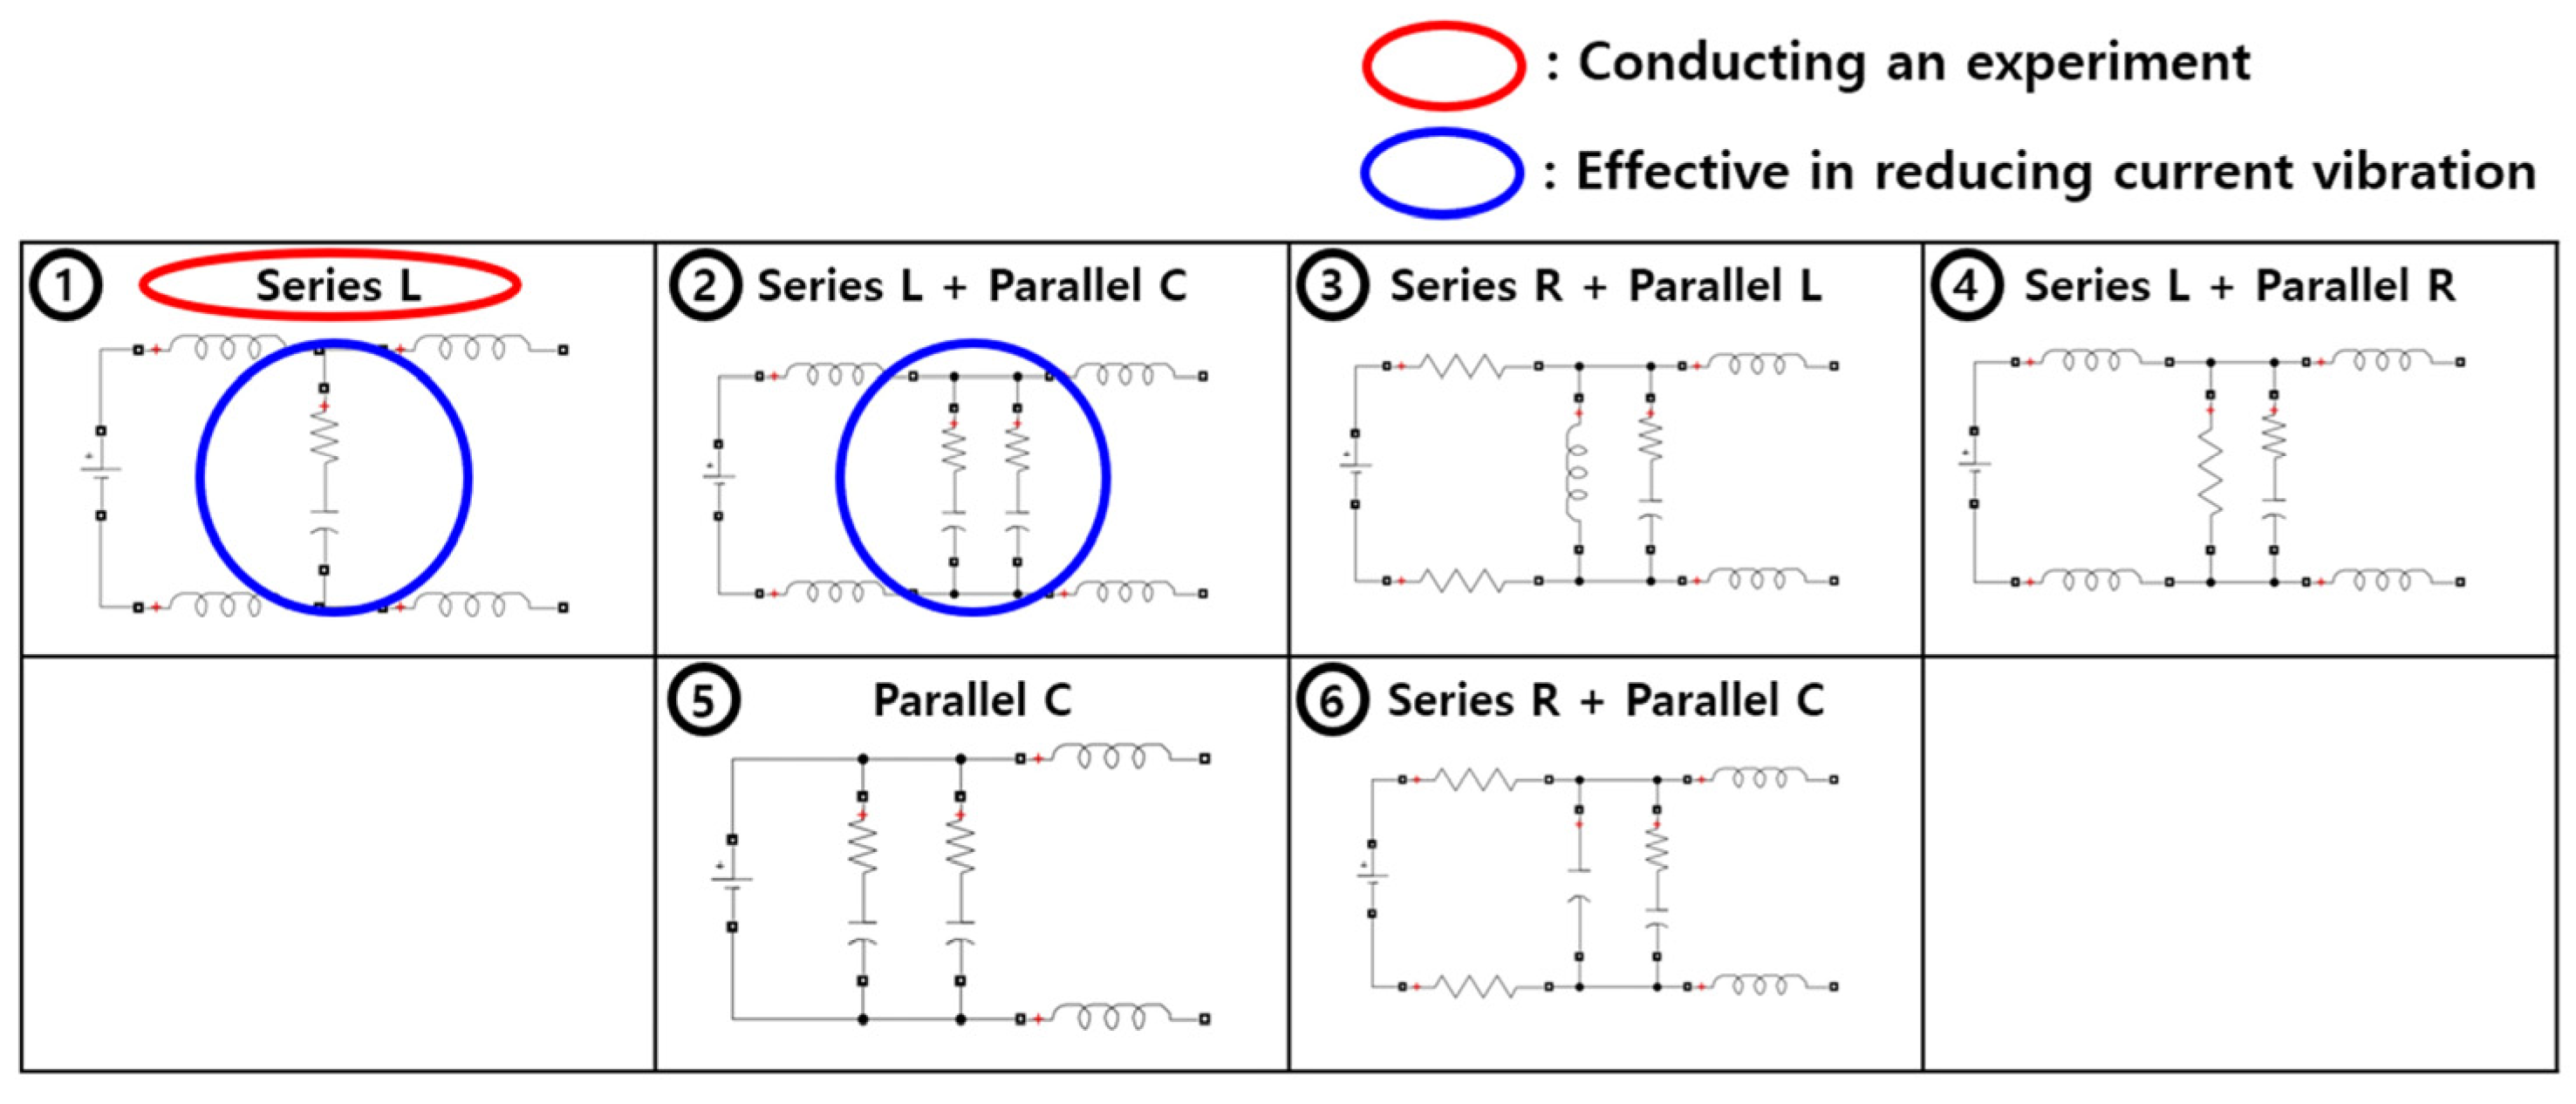
3.1. Case Study of Electronic Filter for Current Reduction Effect

To design a filter with the effect of reducing current oscillation, a case study was conducted. Six different combinations of resistors (R), inductors (L), and capacitors (C) were applied to the model between the power supply and the motor connector. The combined filters are depicted in Figure 8, with the blue circles representing filters that demonstrated a reduction in current oscillation. Connecting the L in series between the connector and the power supply produced the desired filter effect, indicating that the inductor’s property of suppressing current changes contributed to reducing current oscillation. On the other hand, when connecting a series L and parallel R (Case 4), an unexpectedly high back EMF was observed, surpassing the input voltage. Additional investigation is required to understand this unusual phenomenon.

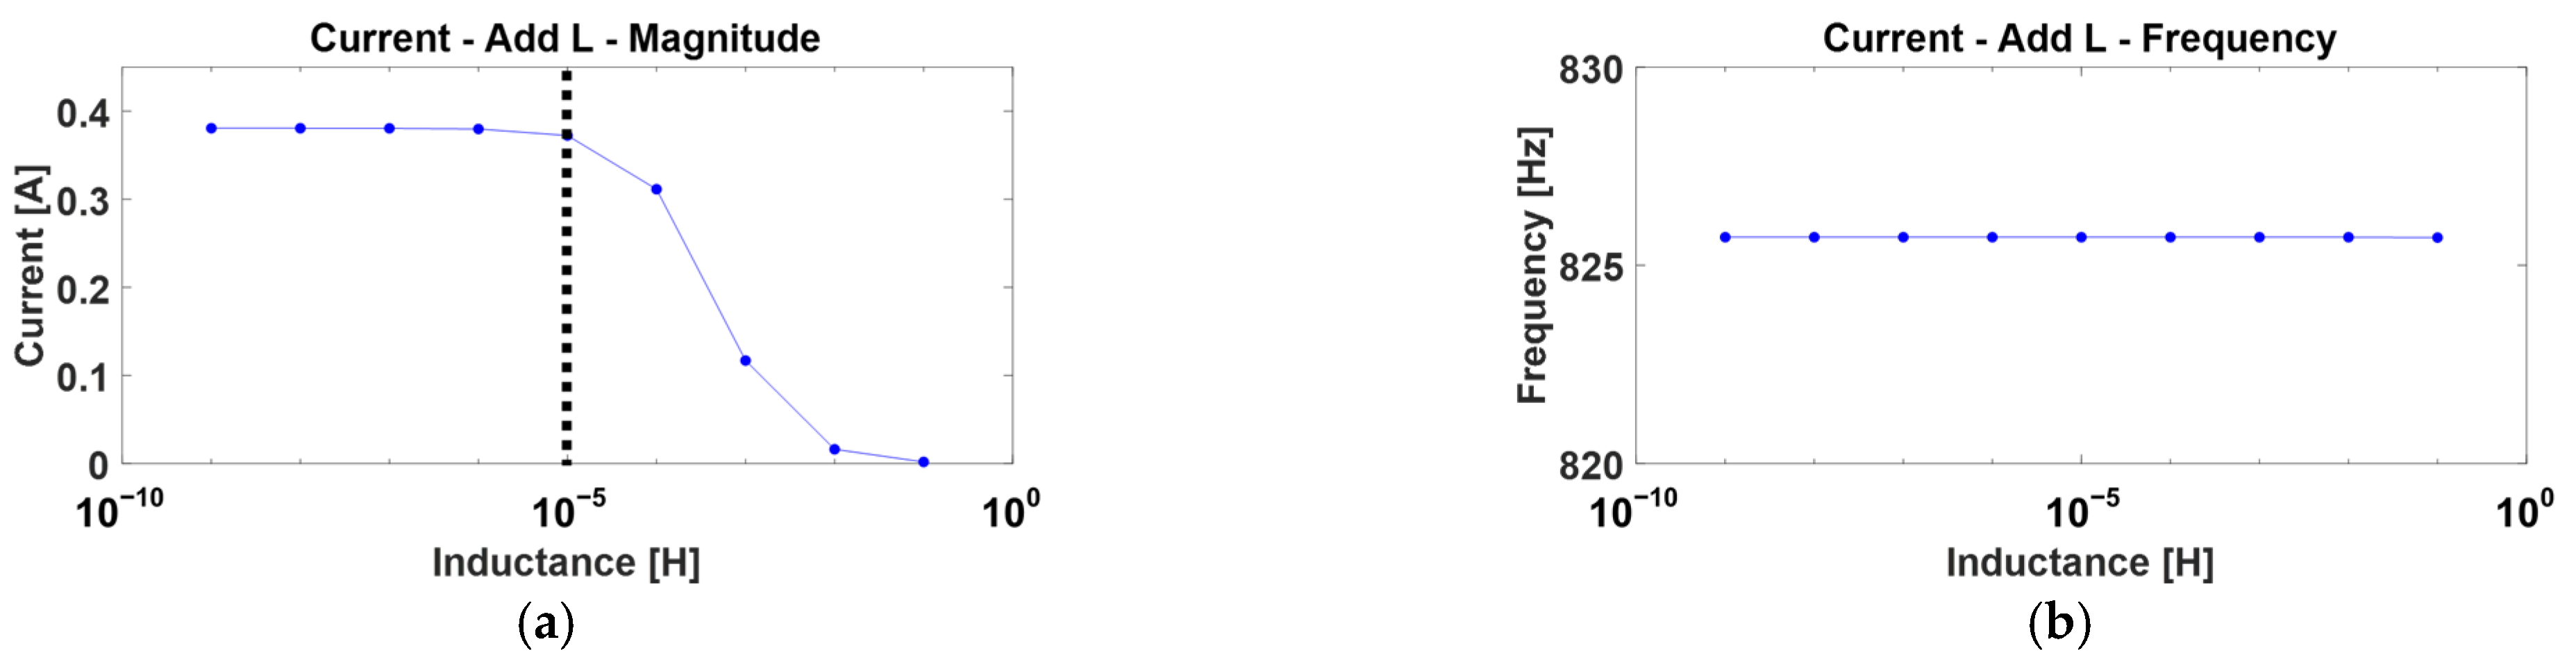
3.2. Simulation Results When Adding Series L

A simulation of the current oscillation components for the serially connected L mentioned in Section 3.1 was conducted. Applying the measured or estimated values from Section 2 to the model and varying the L values from 10 9   [ H ] to 10 1   [ H ] with increments of a factor of ten, the oscillation components of the current were examined. The results are presented in Figure 9. In Figure 9a, it can be observed that when the inductance value was less than 10 5   H , there was little change in the magnitude of the current oscillation. However, as the inductance value increased beyond 10 5   [ H ] , the magnitude of the current oscillation decreased. On the other hand, in Figure 9b, it was confirmed that the frequency of the current oscillation did not change with variations in inductance.

3.3. Experiment for Filter Effect Verification

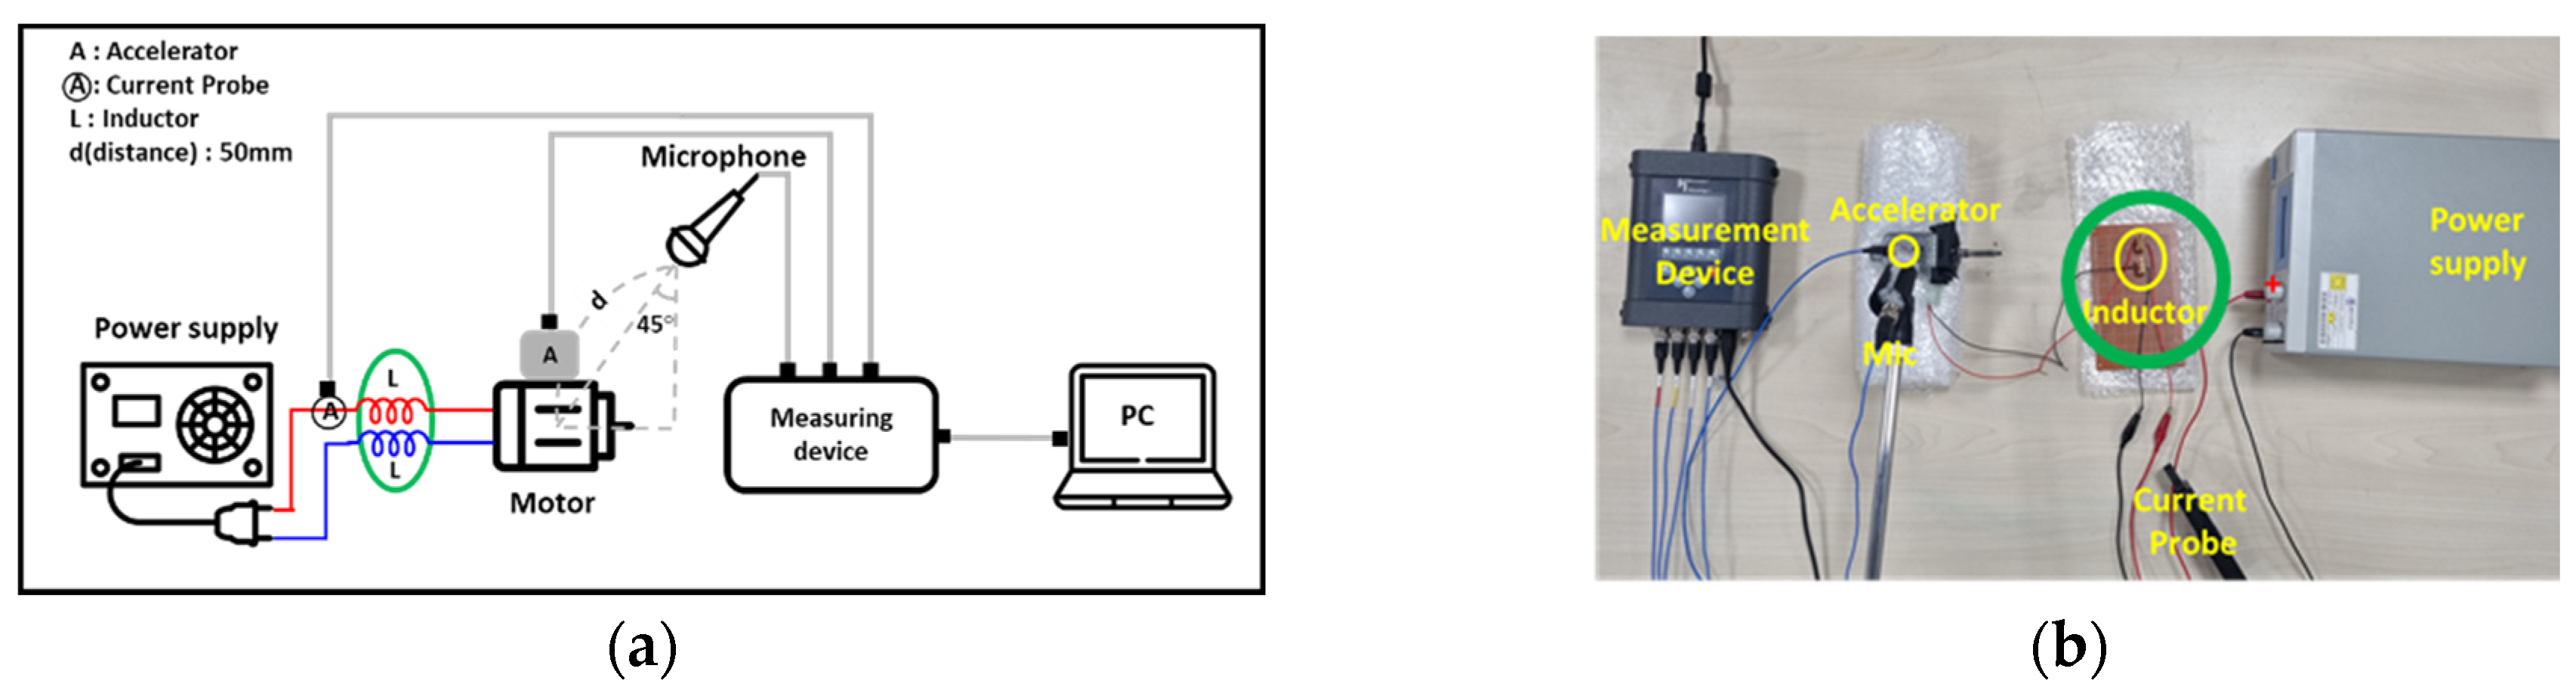
3.3.1. Experimental Schematic and Environment

Figure 10a provides a schematic overview of the test conducted to verify the electronic filter effect, while Figure 10b illustrates the experimental environment. A serial connection of an L-filter between the motor connector and the power supply is represented by the green circle in Figure 10. For the experiment, a toroidal-type inductor known for its easy availability in the market and minimal electromagnetic interference was chosen. A 100   [ m H ] inductor was specifically employed in the test, ensuring the confirmation of a reduction in current oscillation. The motor was supplied with the rated voltage of 12 V as the power supply, and the experiment was conducted under no-load conditions. Current measurements were taken using a current probe between the power supply and the filter. To measure the vibration components of the motor, an accelerometer was attached to it. Additionally, to measure the noise components, the motor was installed 50 [mm] away at a 45⁰ angle from the measurement point.

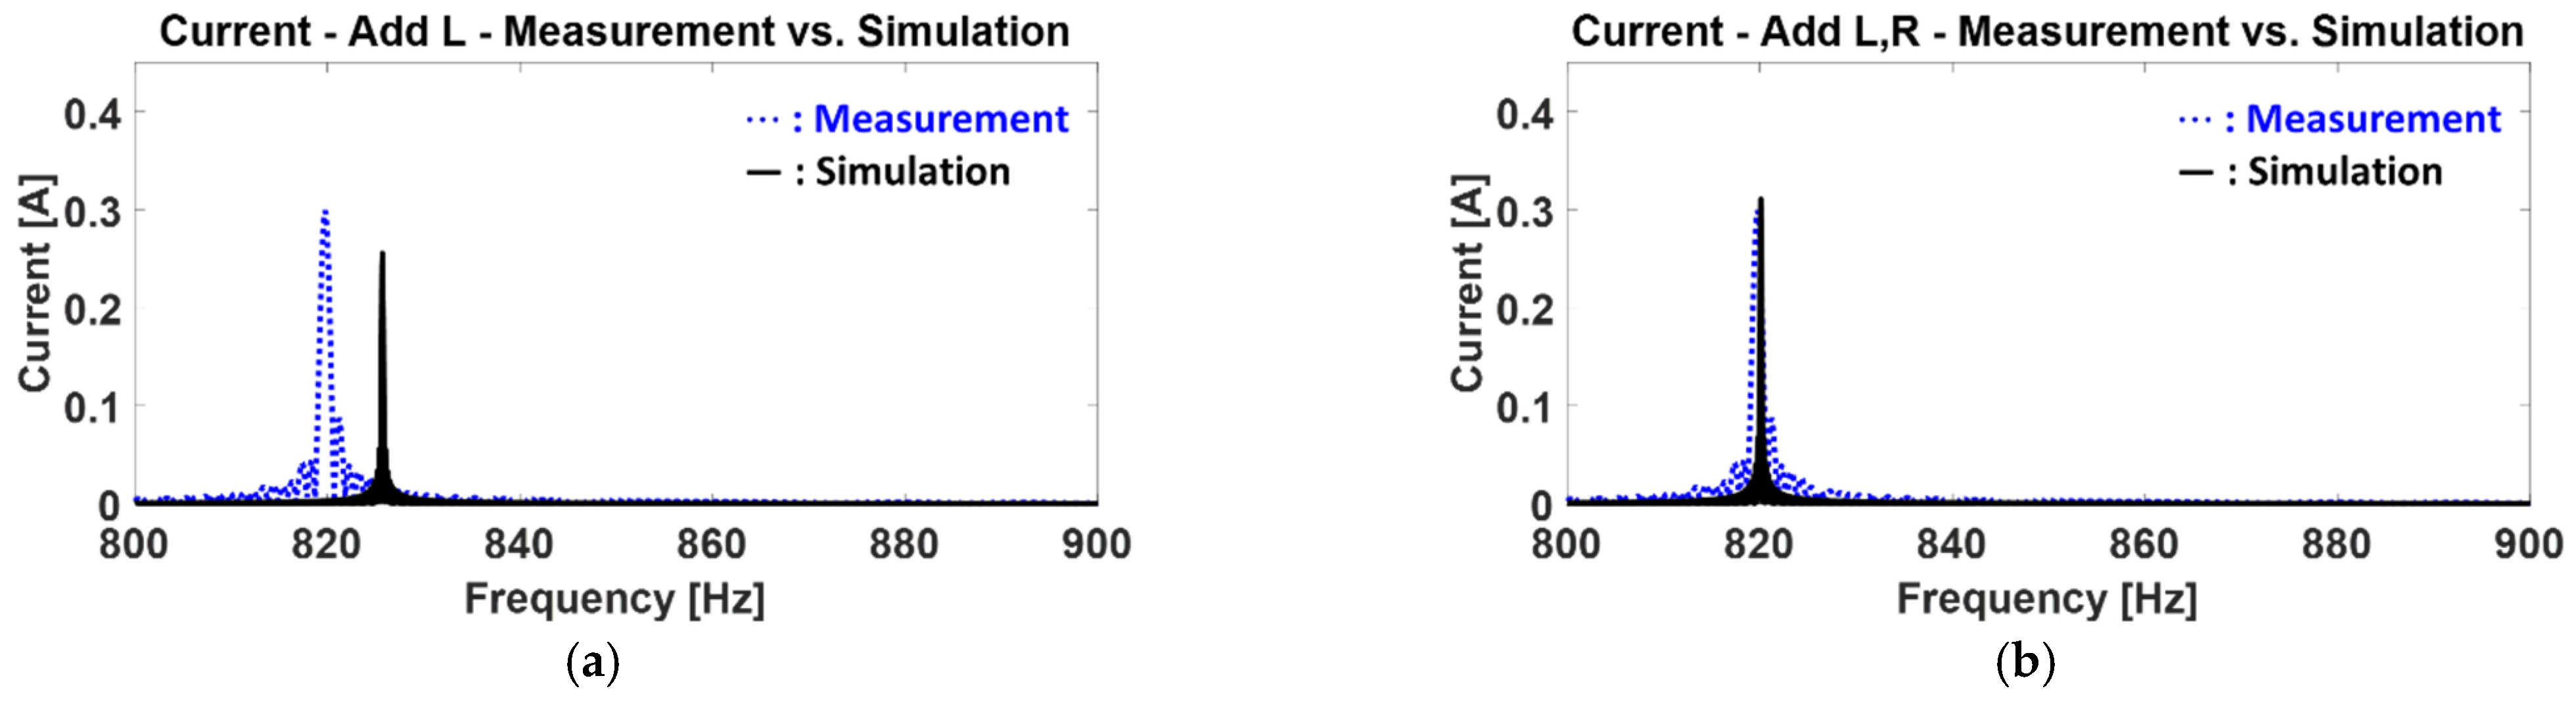
3.3.2. Comparison with Experimental Results and Simulations

In Figure 11, the results of experiments with the introduced series L filter are compared with the simulation results. Dotted lines represent the measured values, while solid lines represent the simulation results. Differences in the frequency and magnitude of the current oscillation component are observed between the two results. This discrepancy arises because the simulation modeled the inductor as an ideal component without considering its inherent resistance. However, real-world inductors have small resistance values, and this aspect needs to be taken into account. Since the resistance of the inductor used in the experiment was lower than the minimum resistance value measurable by a typical multimeter 0.1 [Ω], it was challenging to obtain accurate measurements. Therefore, the decision was made to simulate by connecting an inductor with a resistance value below 0.1 [Ω] in series. Figure 11b shows the simulation results with an added resistance of 0.015 [Ω] in series with the inductor. The simulated current oscillation frequency is 820.1 [Hz] with a magnitude of 0.311 [A], while the measured current oscillation frequency is 819.75 [Hz] with a magnitude of 0.299 [A]. It can be observed that there is almost no difference in both the frequency and magnitude between the simulation and measurement results.

3.3.3. Verification of the Filter Effect

Figure 12 compares the simulation and measured currents based on the with or without of a filter. The blue line represents the state with the filter attached, while the black line represents the state without the filter. The solid line corresponds to the simulation results, and the dashed line represents the measured results. Regardless of the presence of the filter, the model effectively tracks the measured results. It can be observed that, in line with the objectives of this study, the amplitude of the current oscillations decreases due to the presence of the filter. Meanwhile, the frequency decreases. This is attributed to the distribution of the input voltage across the internal resistance of the inductor, causing a reduction in the voltage applied to the motor, subsequently lowering the motor’s rotational speed, and ultimately leading to a decrease in the frequency of current oscillations.

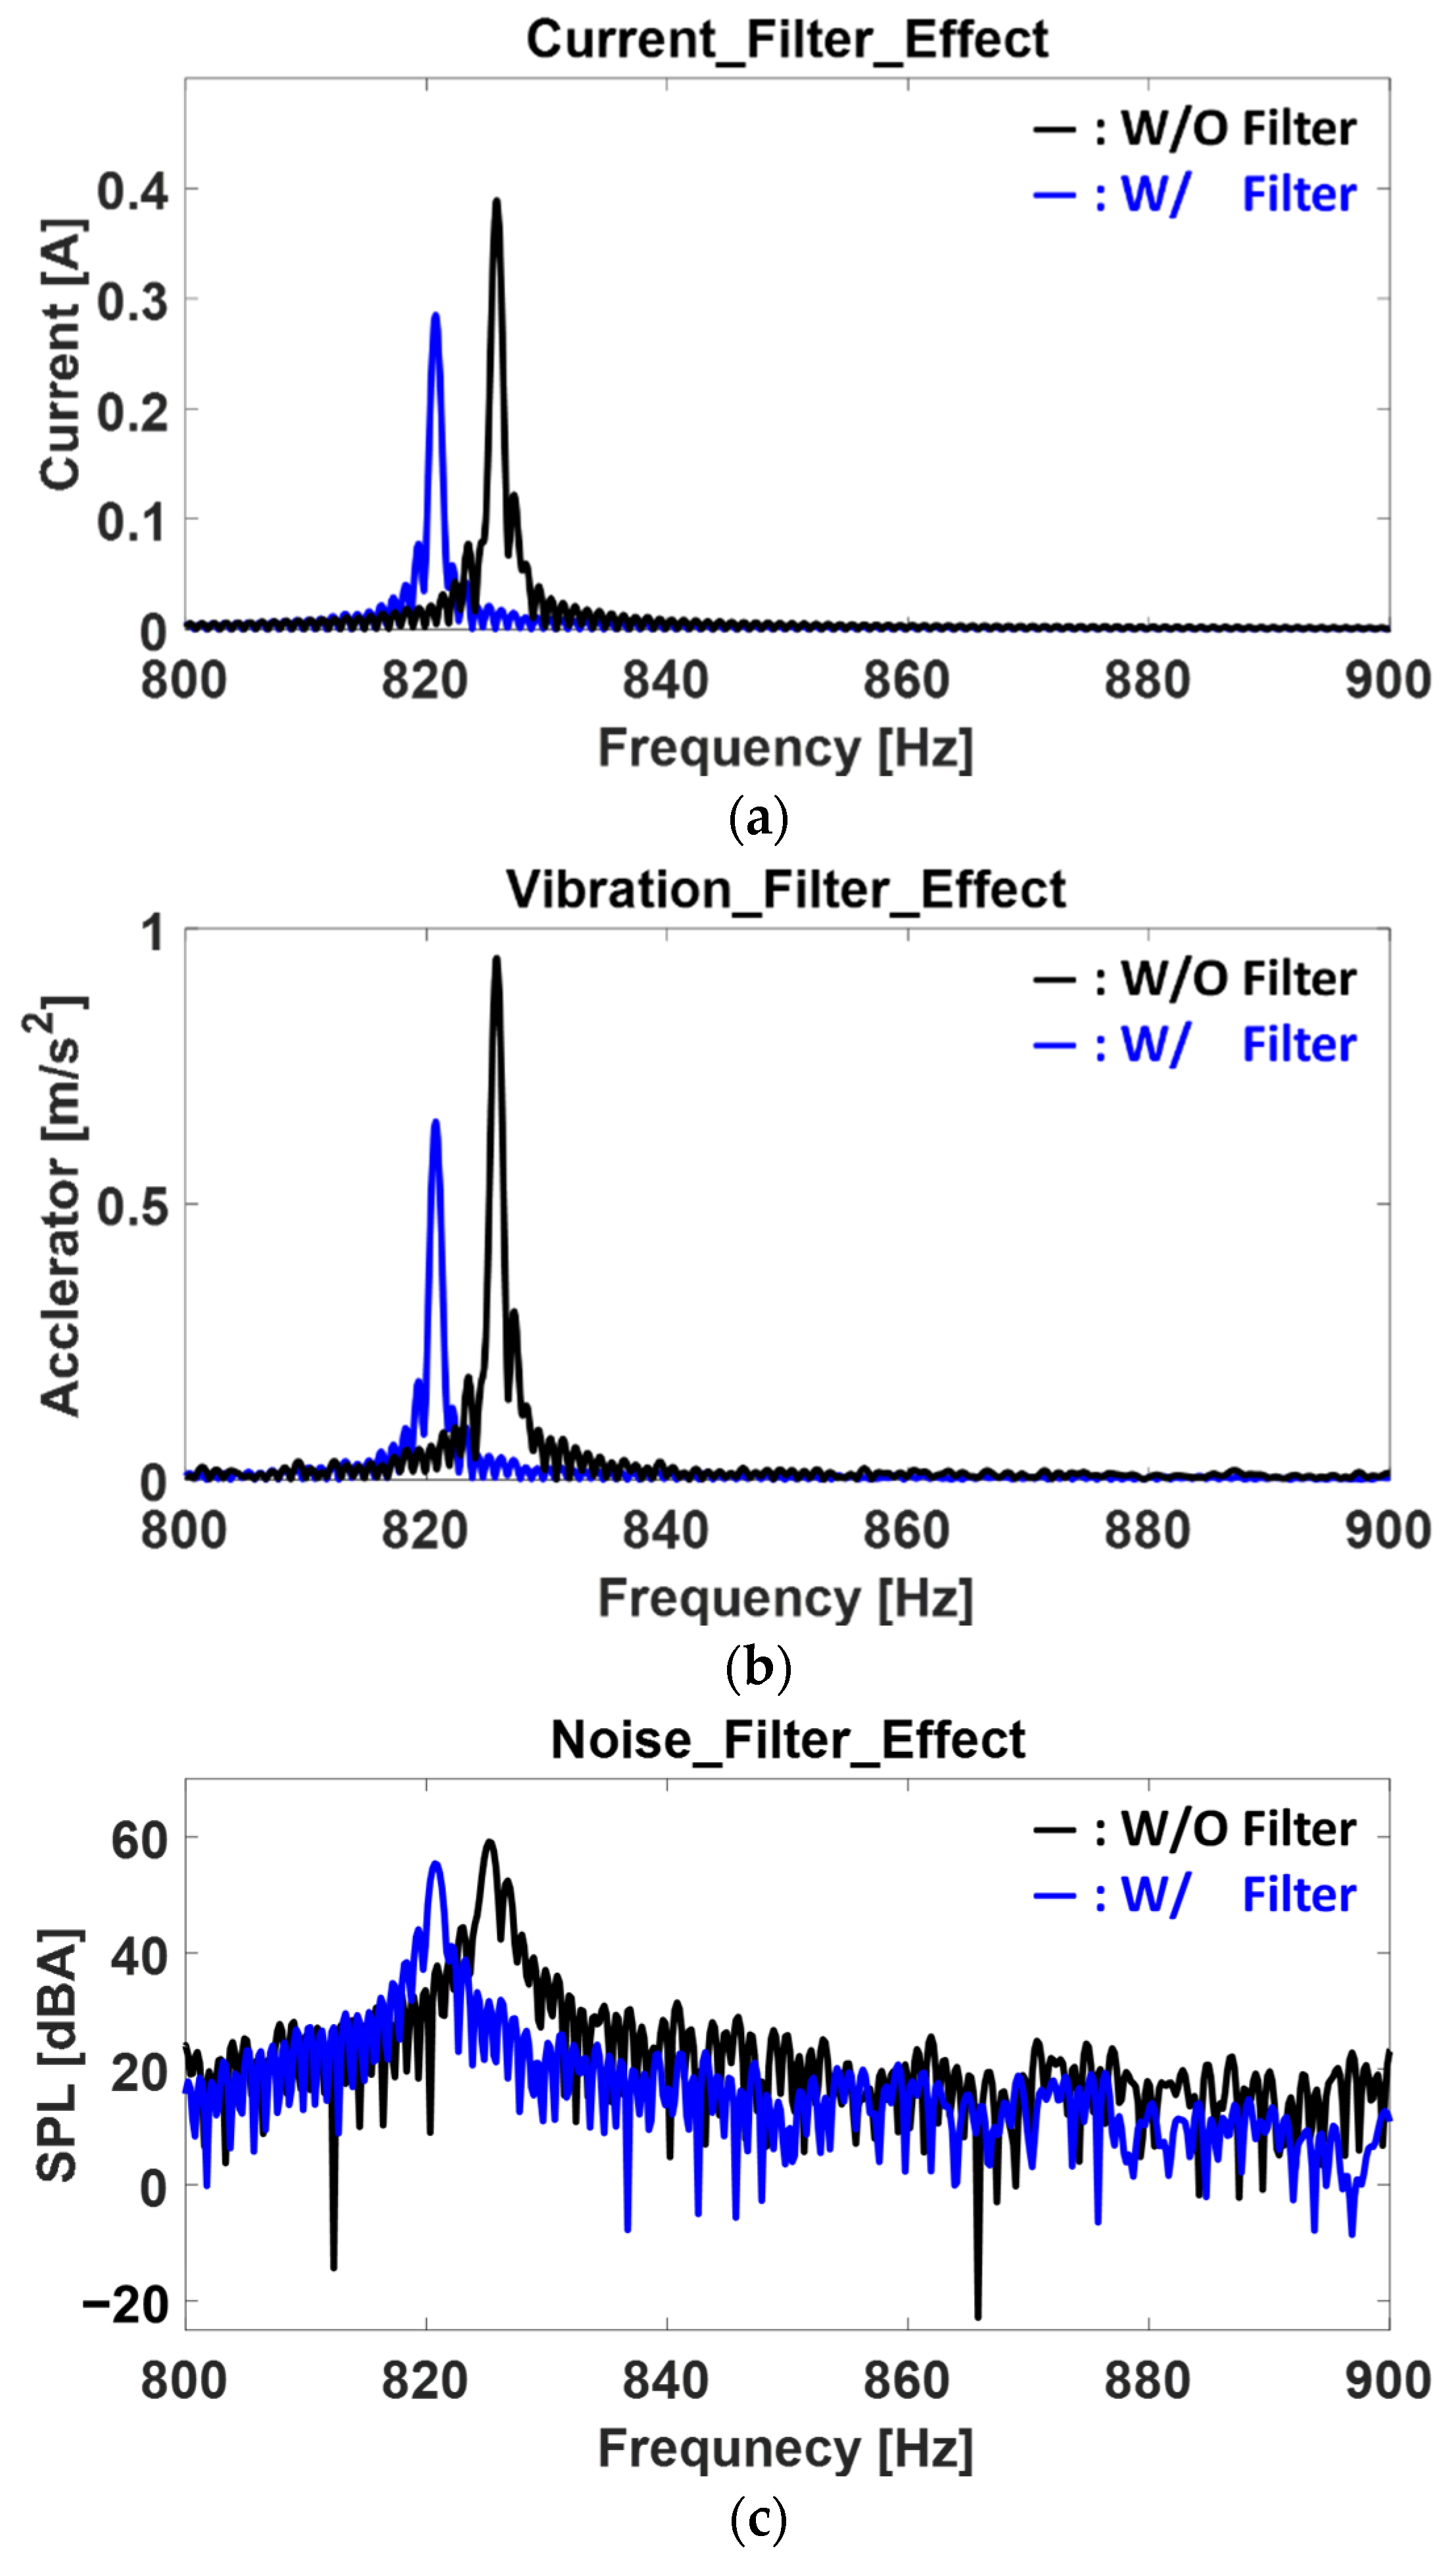
3.4. Verification of Noise and Vibration Reduction Effects

Figure 13 compares the measurements of the current vibration, motor vibration, and motor noise based on the presence or absence of a filter. The black line represents the results without a filter, while the blue line represents the results with a filter. The measurement method is the same as the one mentioned in Section 3.3.1. The waveforms of the current oscillation and vibration appear in similar forms, and the graphs demonstrate that as the current oscillation decreases, the vibration and noise of the motor also decrease. The current oscillation decreases from 0.389 [A] to 0.285 [A], an approximately 26.7% reduction. The motor vibration decreases from 0.947 [m/s²] to 0.649 [m/s²], showing a 31.5% reduction. The motor noise is reduced from 59.135 [dBA] to 55.389 [dBA], indicating a 3.746 [dBA] decrease.

4. Conclusions

To match the parameters of the experimental motor to the motor model, a method was introduced to measure or estimate the model parameters by considering both the motor connector and internal components. Issues related to the non-convergence of the model were identified and resolved. The model was validated by comparing the experimental motor measurements with the model analysis. An electronic filter for reducing current oscillation components was designed using the model, and through experiments, it was confirmed that the motor’s noise and vibration were reduced. The conclusions of this study are as follows:
  • The inductor and varistor in the motor connector were determined by using the formula for rod core inductance or the values provided by the manufacturer’s datasheet. For the varistor, its resistance and capacitance were applied to the model in series connection. The inertia and friction within the motor were measured using an experimental method based on dynamic equations. The back EMF containing the vibration components of the motor was measured at various operating points, linearly interpolated, expressed as a first-order function, and applied to the model. The internal inductance and torque constants, which are challenging to measure directly, were estimated by comparing the measured current and RPM of the experimental motor with the interpreted values.
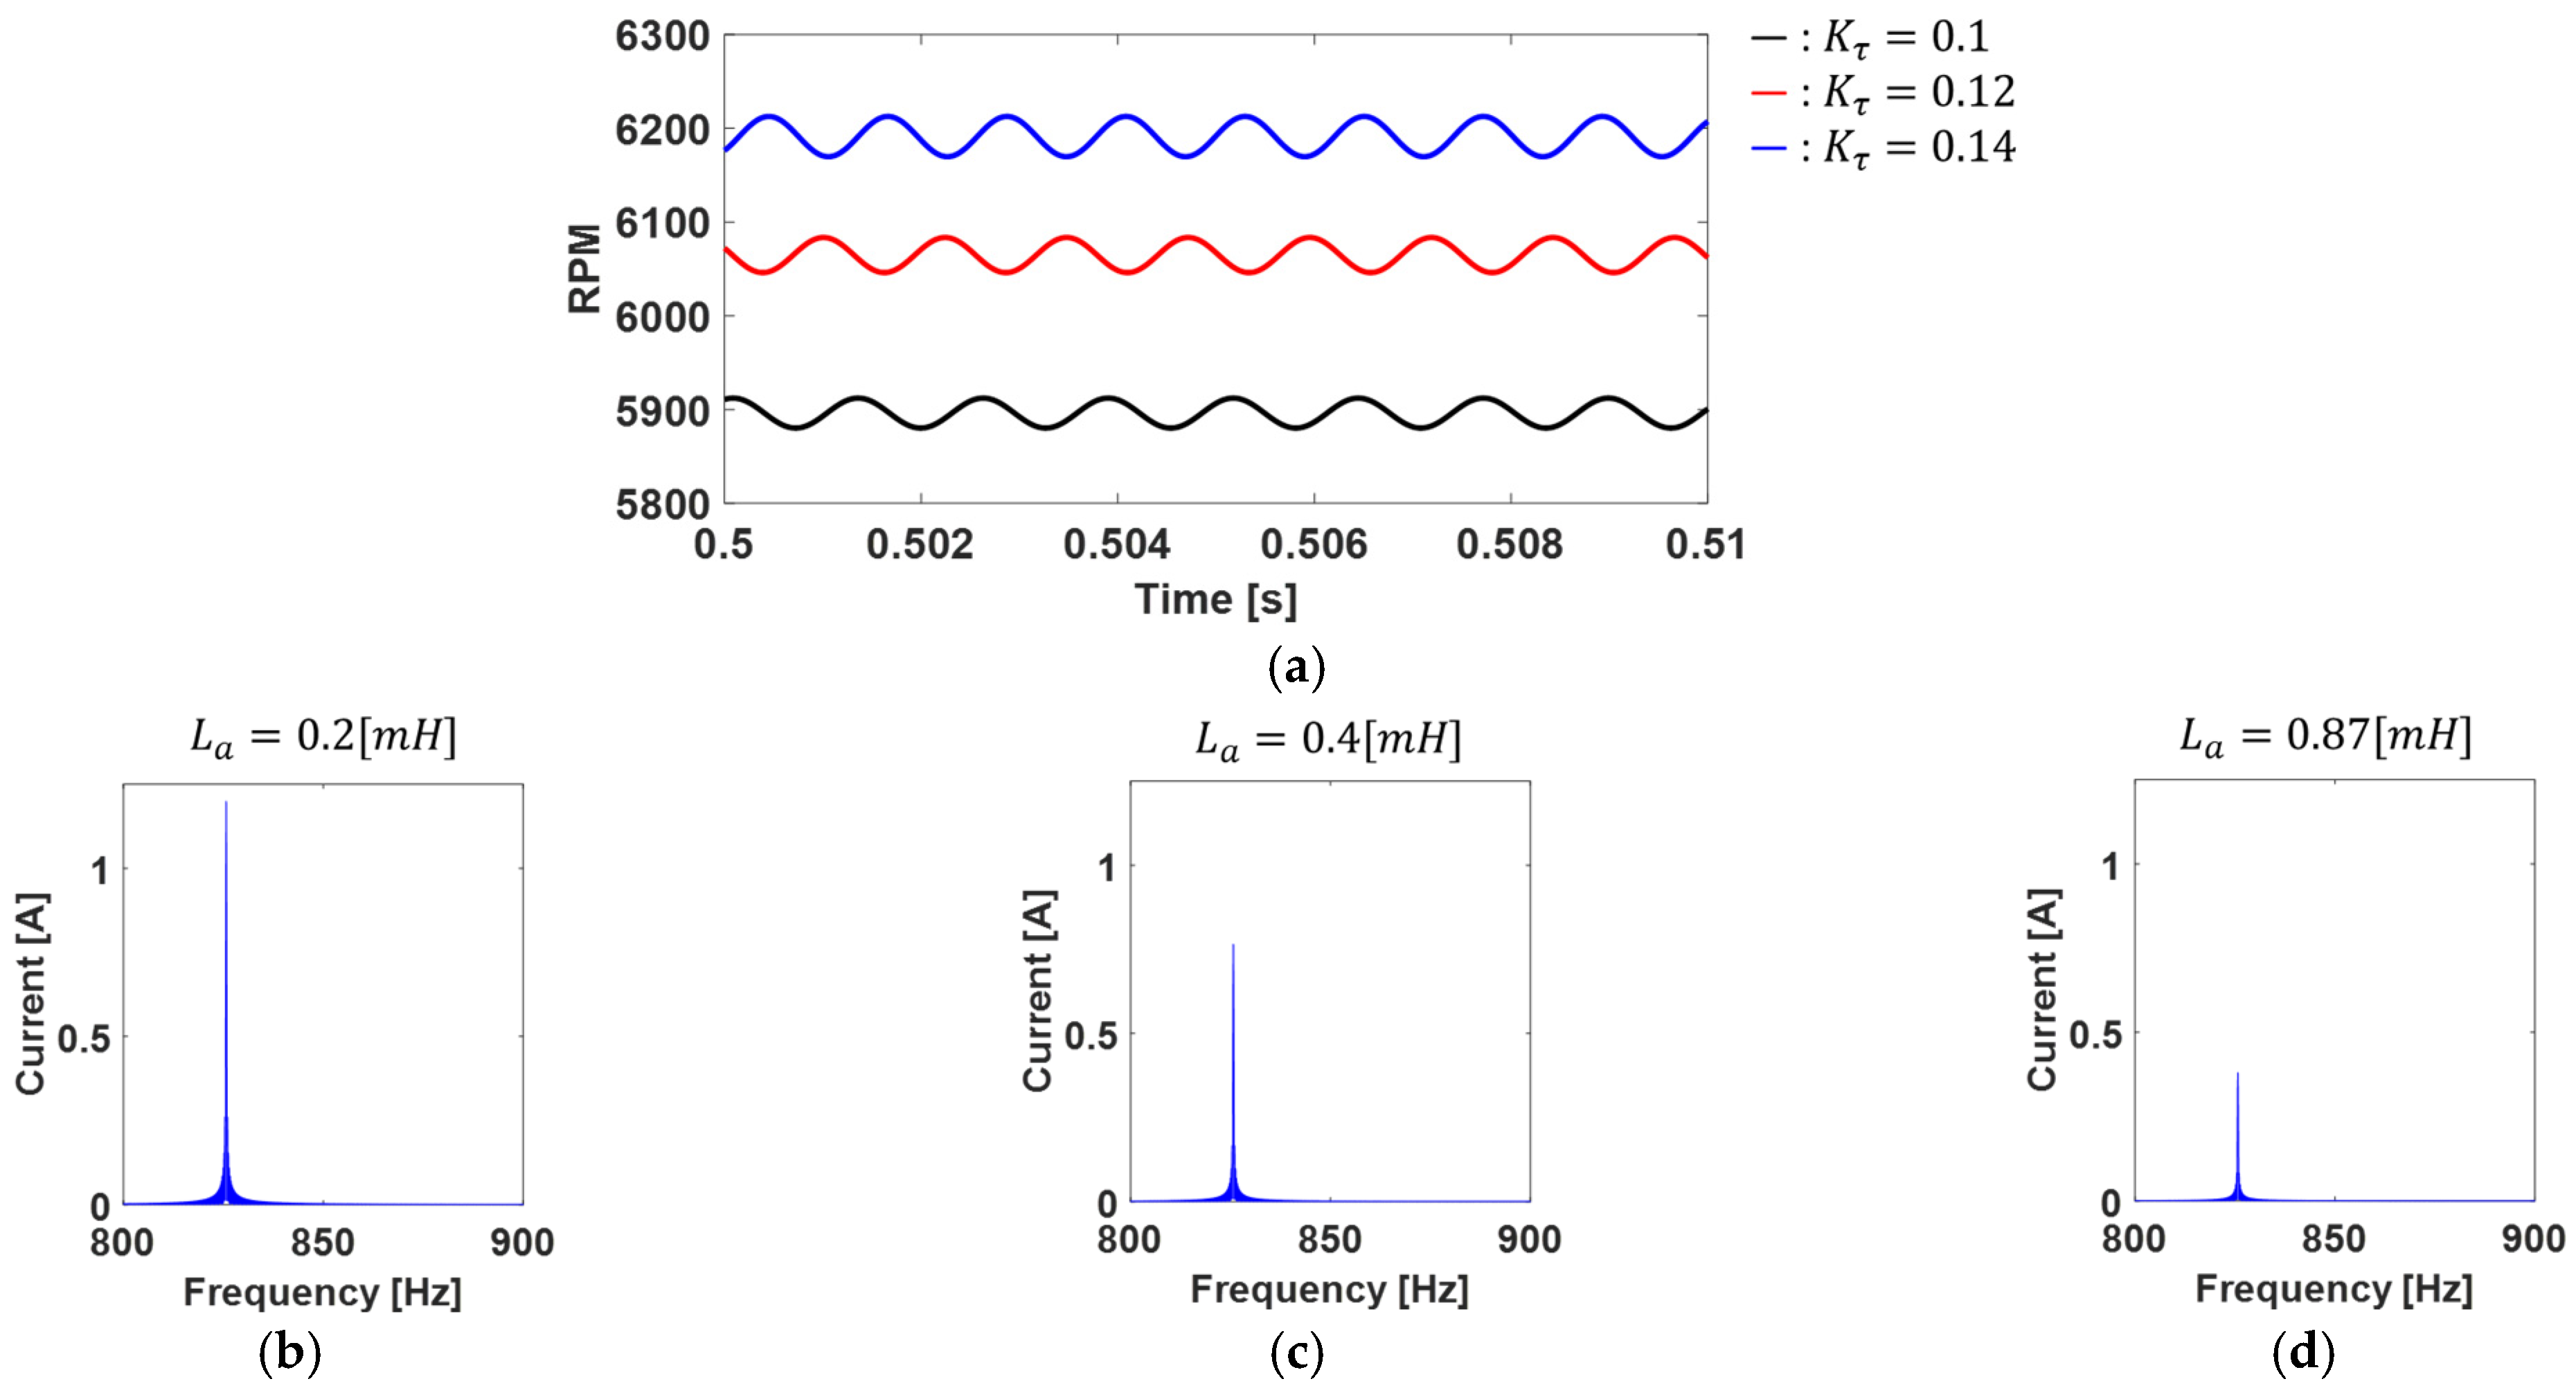
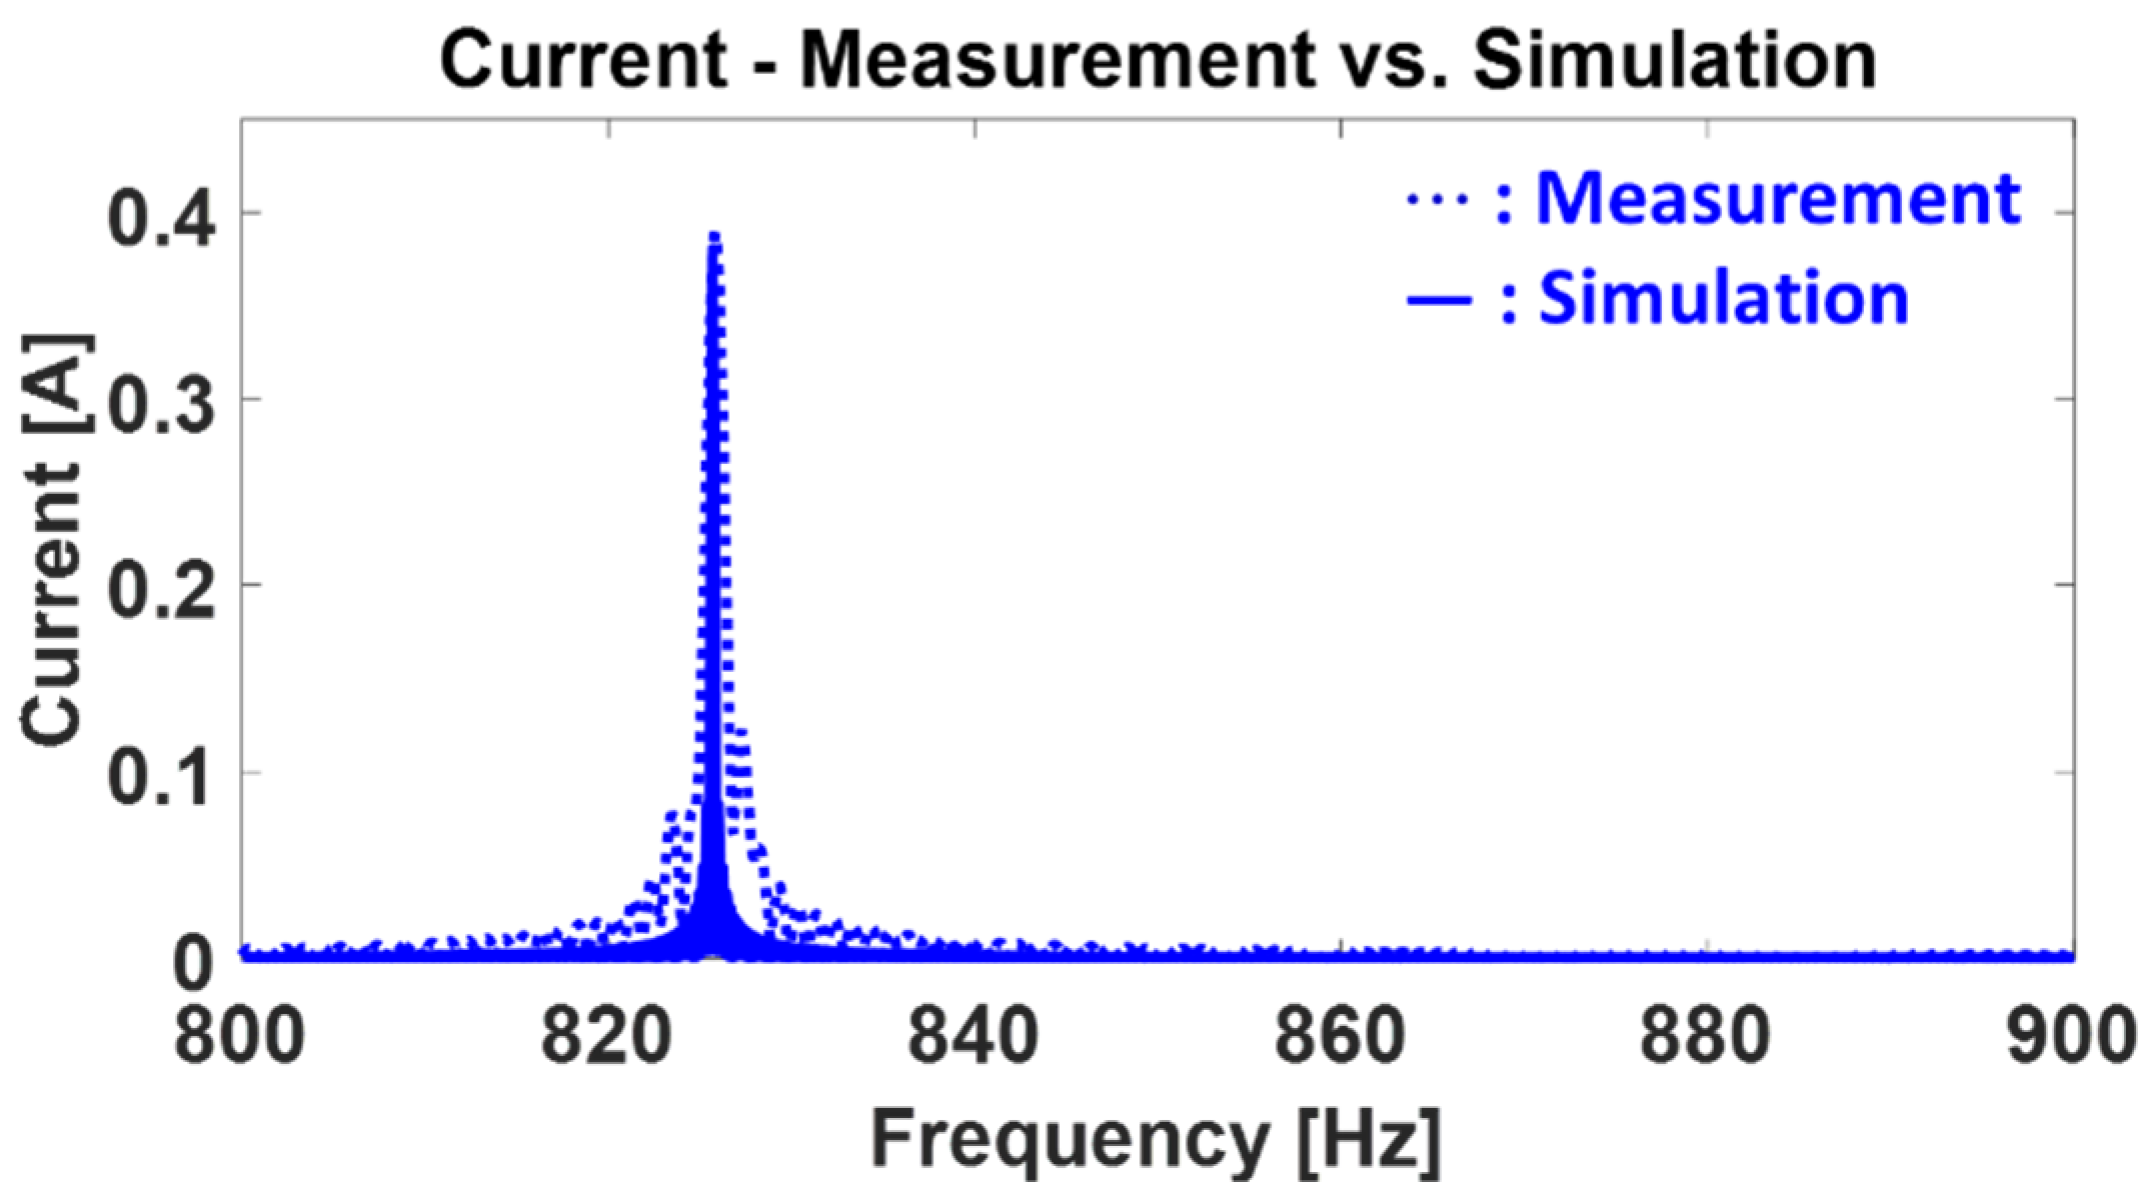
  • It was observed that the model did not converge even after a sufficient amount of time, and this was found to be due to the feedback loop within the model. To address this, the model was made to converge by including only the DC component of the back EMF, and the angular velocity at that point was determined. The obtained angular velocity was then applied to the back EMF term to ensure the convergence of the model. The model was validated by confirming the comparison of the experimental results of the current oscillation component with the simulation results.
  • During the case study using the model, the effect of reducing current oscillations by connecting an inductor in series between the power supply and the motor was observed. For accurate interpretation and experimental comparison, a small resistance within the inductor was added to the model. As a result, the reduction in the current oscillation component was confirmed during both interpretation and experimentation, demonstrating consistency between the two. Furthermore, the effective reduction in motor noise and vibration due to the decrease in the current oscillation component was observed through experiments.
  • By utilizing the completed motor model, it is possible to reduce motor noise and vibration by simply attaching a filter without altering the internal structure of the motor. Therefore, filters can be added to already produced motors to mitigate noise and vibration. Additionally, situations where the motor experiences load can be considered. By incorporating an increase in torque due to the load into the model, changes in current caused by the load can be examined. Consequently, it is anticipated that optimizing the filter can be achieved by appropriately adjusting the filter variables in response to load variations.
  • BDC motors are widely utilized due to their affordability. However, incorporating the designed filter would result in additional expenses, potentially reducing the motor’s price competitiveness. Therefore, there is a limitation in deciding whether to use the filter, as it depends on a consideration of the motor’s price.

Author Contributions

Conceptualization, J.K. and H.K.; methodology, J.K.; software, J.K.; validation, J.K. and H.K.; formal analysis, H.K.; investigation, J.K.; resources, J.K.; data curation, J.K.; writing—original draft preparation, J.K.; writing—review and editing, H.K.; visualization, J.K.; supervision, H.K.; project administration, H.K; funding acquisition, H.K. All authors have read and agreed to the published version of the manuscript.

Funding

This research was supported by the MSIT (Ministry of Science and ICT), Republic of Korea, under the Grand Information Technology Research Center support program (IITP-2024-2020-0-01791) supervised by the IITP (Institute for Information & communications Technology Planning & Evaluation. This work was supported by the National Research Foundation of Korea (NRF) grant funded by the Korea government (MSIT) (No. NRF-2021R1F1A1062389), Republic of Korea.

Data Availability Statement

The data cannot be shared upon the request of the funder.

Conflicts of Interest

The authors declare no conflicts of interest.

Appendix A

To explain the experimental method and theory used to measure the motor’s inertia, descriptions of each parameter are provided in Table A1. Additionally, Figure A1 is presented to aid understanding. The measurement method involves determining the time it takes for a rotating object to pass between two points on an inclined plane (the top and bottom points of the slope) and then substituting that value into the rotational inertia formula (Figure A1a). In this case, it is assumed that the rotating object rolls without slipping. To derive the inertia formula, the conservation of energy can be utilized. According to the law of the conservation of energy, potential energy can be expressed as the sum of translational kinetic energy, rotational kinetic energy, and energy loss due to friction. The expression for this can be formulated as follows:
Figure A1. Diagram explaining the experimental method and theory for measuring motor inertia: (a) Figure of an object rotating on an inclined plane passing between two points on the incline. At t = 0, the rotating body is stationary, and at t = t1, it denotes the time taken to pass through the inclined plane; (b) Displacement in the case of uniform acceleration; (c) The case of a rotating body rolling without slipping.
Machines 12 00148 g0a1
m g h = 1 2 m v 2 + 1 2 J ω 2
In Equation (A1), the left side represents potential energy, and on the right side, the first term is translational kinetic energy, and the second term is rotational kinetic energy. Assuming no slipping, energy loss due to friction is not considered. Next, the displacement can be obtained by integrating the velocity with respect to time, which is expressed as follows:
1 2 t v = l ,                       v = 2 l t
On the other hand, when the rotating object rolls without slipping, the relationship between velocity and acceleration can be expressed as follows (Figure A1c):
l = θ r ,                       v = ω r ,                     ω = 2 l t r
By using Equations (A1)–(A3), the expression for inertia can be derived as follows:
J = m r 2 ( g h t 2 2 l 2 1 )
The height of the ramp used in the experiment is 0.015 [m], and the length of the ramp is 0.908 [m]. The mass of the armature, acting as the rotating part of the motor in the experiment, is 0.114 [kg], and the outermost radius is measured to be 0.012 [m]. To ensure the reliability of the experiment, a total of 10 trials were conducted, and the average value of the measured time was 1.54 [s]. Through this, the inertia of the motor was calculated to be 4.57 × 10 6   [ k g m 2 ] .
Table A1. Names and symbols of parameters used to measure motor inertia.
Element NameSymbolUnit
Mass of the rotating body m [ k g ]
Gravitational acceleration g [ m / s 2 ]
Height of the incline h [ m ]
Length of the incline l [ m ]
Velocity of the rotating body v [ m / s ]
Moment of inertia of the rotating bodyJ [ k g · m 2 ]
Time in motion t [ s ]
Angle of the rotating body θ [ r a d ]
Acceleration of the rotating body ω [ r a d / s 2 ]
Outermost radius of the rotating body r [ m ]

Appendix B

The friction of the rotating object can be determined using the solution to the rotational motion equation, and the equation is as follows:
ω t = ω 0 e ( B J ) t
Here, ω ( t ) represents the angular velocity of the rotating object with respect to time, t is the time it takes for the rotating object to come to a stop from a constant speed, ω 0 is the initial angular velocity of the rotating object, B is the frictional force on the rotating object, and J is the inertia of the rotating object. If the inertia of the rotating object is known, measuring the time it takes for a rotating object to come to a stop after the force is removed allows us to determine the friction. In this case, the inertia of the rotating object can be expressed as the sum of the inertia of the experimental motor and the inertia of the coupling. The inertia of the sample motor was determined in Section 2.2.2, and using the same method, the inertia of the coupling can be calculated. The inertia of the coupling is measured as 4.27 × 10 4   [ k g m 2 ]   , and the total inertia of the rotating object is determined to be 4.32 × 10 4   [ k g m 2 ]   . Using this, a schematic diagram for the method of measuring the motor’s friction is depicted in Figure A2. The external motor was used to rotate the experimental motor at a constant speed of 1700 RPM, 1260 RPM, and 514 RPM. For accuracy, the experiment was conducted five times for each RPM, and the average values were used.
Figure A2. Schematic diagram of motor friction measurement method.
Machines 12 00148 g0a2
According to the results of the tests at each RPM, it was confirmed that the experimental motor came to a complete stop when 3.048 s elapsed at 1700 RPM, 2.192 s at 1260 RPM, and 1.316 s at 514 RPM. Using 1700 RPM as a reference, the situation at 1260 RPM was 0.856 s (case 1), and at 514 RPM, it was 1.732 s (case 2). Similarly, using 1260 RPM as a reference, the situation at 514 RPM was 0.876 s (case 3). The friction coefficients for each case were calculated, and by taking the average, the overall friction was determined to be 2.95 × 10 4   [ N m / ( r a d / s ) ] .

References

  1. Qian, K.; Hou, Z.; Sun, D. Sound Quality Estimation of Electric Vehicles Based on GA-BP Artificial Neural Networks. Appl. Sci. 2020, 10, 5567. [Google Scholar] [CrossRef]
  2. Hua, X.; Thomas, A.; Shultis, K. Recent Progress in Battery Electric Vehicle Noise, Vibration, and Harshness. Sci. Prog. 2021, 104, 1. [Google Scholar] [CrossRef] [PubMed]
  3. Li, Y.B.; Ho, S.L.; Fu, W.N.; Xue, B.F. Analysis and Solution on Squeak Noise of Small Permanent-Magnet DC Brush Motors in Variable Speed Applications. IEEE Trans. Magn. 2009, 45, 4752–4755. [Google Scholar] [CrossRef]
  4. Knezevic, J.M. Low-Cost Low-Resolution Sensorless Positioning of DC Motor Drives for Vehicle Auxiliary Applications. IEEE Trans. Veh. Technol. 2013, 62, 4328–4335. [Google Scholar] [CrossRef]
  5. Kang, G.-H.; Son, Y.-D.; Kim, G.-T. The Noise and Vibration Analysis of BLDC Motor Due to Asymmetrical Permanent Magnet Overhang Effects. In Proceedings of the 2007 IEEE Industry Applications Annual Metting, New Orleans, LA, USA, 23–27 September 2007; pp. 1030–1537. [Google Scholar] [CrossRef]
  6. Saed, N.; Leitner, S.; Krall, F.; Muetze, A. Noise and Vibration Characteristics of Sub-Fractional Horsepower Single-Phase BLDC Drives. Elektrotech. Informationstech. 2022, 139, 260–270. [Google Scholar] [CrossRef]
  7. Hur, J.; Reu, J.W.; Kim, B.W.; Kang, G.H. Vibration Reduction of IPM-Type BLDC Motor Using Negative Third Harmonic Elimination Method of Air-Gap Flux Density. IEEE Trans. Ind. Appl. 2011, 47, 1300–1309. [Google Scholar] [CrossRef]
  8. Jafarboland, M.; Farahabadi, H.B. Optimum Design of the Stator Parameters for Noise and Vibration Reduction in BLDC Motor. IET Electr. Power Appl. 2018, 12, 1297–1305. [Google Scholar] [CrossRef]
  9. Kang, H. The Study of DC Motor Noise and Vibration. SAE Trans. 1995, 104, 2461–2467. [Google Scholar] [CrossRef]
  10. Jung, I.; Yang, H.; Park, T.; Kim, J. A Study on Noise Reduction of a DC Motor. In Proceedings of the Korean Society for Noise and Vibration Engineering Conference, Gyeongju, Republic of Korea, 29–31 October 2004; Volume 5, pp. 764–769. [Google Scholar]
  11. Wang, S.; Hong, J.; Sun, Y.; Shen, J.; Cao, H.; Yang, Z. Analysis and Experimental Verification of Electromagnetic Vibration Mode of PM Brush DC Motors. IEEE Trans. Energy Convers. 2018, 33, 1411–1421. [Google Scholar] [CrossRef]
  12. Cho, Y.T. Characterizing Sources of Small DC Motor Noise and Vibration. Micromachines 2018, 9, 84. [Google Scholar] [CrossRef] [PubMed]
  13. Hong, J.; Wang, S.; Sun, Y.; Cao, H. An Effective Method with Copper Ring for Vibration Reduction in Permanent Magnet Brush DC Motors. IEEE Trans. Magn. 2018, 54, 1–5. [Google Scholar] [CrossRef]
  14. Wang, S.; Yang, Z.; Liu, C. Vibration Reduction Characteristics of Permanent Magnet DC Motors with Sawtooth Edge Poles. IEEE Trans. Energy Convers. 2021, 36, 737–745. [Google Scholar] [CrossRef]
  15. Hong, J.; Wang, S.; Sun, Y.; Cao, H. A PM Pole with Axial Varied Width for Vibration Mitigation in PM Brush DC Motors. IEEE Trans. Ind. Electron. 2019, 66, 3595–3604. [Google Scholar] [CrossRef]
  16. Wang, S.; Hong, J.; Sun, Y.; Cao, H. Analysis and Reduction of Electromagnetic Vibration of PM Brush DC Motors. IEEE Trans. Ind. Appl. 2019, 55, 4605–4612. [Google Scholar] [CrossRef]
  17. Cavagnino, A.; Saied, S.; Vaschetto, S. Experimental Identification and Reduction of Acoustic Noise in Small Brushed DC Motors. IEEE Trans. Ind. Appl. 2014, 50, 317–326. [Google Scholar] [CrossRef]
  18. Lee, D.H.; Lee, J.H.; Ahn, J.W. Mechanical Vibration Reduction Control of Two-Mass Permanent Magnet Synchronous Motor Using Adaptive Notch Filter with Fast Fourier Transform Analysis. IET Electr. Power Appl. 2012, 6, 455–461. [Google Scholar] [CrossRef]
  19. Shami, U.T.; Khan, M.U.; Burhan Khan, M.; Rizvi, T.H.; Khalid, A. A New method for the proposal of acoustic noise reduction in motors. Sci. Int. 2014, 26, 1687–1691. [Google Scholar]
  20. Ghosh, M.; Ghosh, S.; Saha, P.K.; Panda, G.K. Semi-Analytical Dynamic Model of Permanent-Magnet Direct Current Brushed Motor Considering Slotting Effect, Commutation, and PWM-Operated Terminal Voltage. IEEE Trans. Ind. Electron. 2017, 64, 2654–2662. [Google Scholar] [CrossRef]
  21. Vidlak, M.; Makys, P.; Stano, M. Comparison between Model Based and Non-Model Based Sensorless Methods of Brushed DC Motor. In Transportation Research Procedia; Elsevier: Amsterdam, The Netherlands, 2021; Volume 55, pp. 911–918. [Google Scholar]
  22. Scott, J.; McLeish, J.; Round, W.H. Speed Control with Low Armature Loss for Very Small Sensorless Brushed DC Motors. IEEE Trans. Ind. Electron. 2009, 56, 1223–1229. [Google Scholar] [CrossRef]
  23. Kim, H.; Kim, J.; Han, K.; Won, D. 1D Modeling Considering Noise and Vibration of Vehicle Window Brushed DC Motor. Appl. Sci. 2022, 12, 11405. [Google Scholar] [CrossRef]
Figure 1. Schematic diagram of Brushed DC motor including filter and connector.
Machines 12 00148 g001
Figure 2. Brushed DC motor modeling including motor and connector.
Machines 12 00148 g002
Figure 3. Structure and modeling of the motor connectors.
Machines 12 00148 g003
Figure 4. The result of measuring and performing FFT on the back EMF of the experimental motor. The numbers above the points indicate the RPM, and the dashed line represents the linear interpolation result; (a) 8th order component and (b) DC component.
Machines 12 00148 g004
Figure 5. Variations in RPM and current vibration components according to changes in the torque constant and armature inductance: (a) Changes in motor RPM according to variations in the torque constant; (bd) Changes in current variation components according to variations in the armature inductance.
Machines 12 00148 g005
Figure 6. The back EMF varies over time. It indicates that the model does not converge: (a) Time graph of back EMF from 20.01 to 20.02 s; (b) FFT results of (a); (c) Time graph of back EMF from 100.01 to 100.02 s; (d) FFT results of (c).
Machines 12 00148 g006aMachines 12 00148 g006b
Figure 7. Comparison of simulated and experimental results for current vibration components.
Machines 12 00148 g007
Figure 8. Six case studies for verifying the effect of current vibration reduction.
Machines 12 00148 g008
Figure 9. Comparison of current oscillation components with varying L values: (a) Current oscillation magnitude; (b) Current oscillation frequency.
Machines 12 00148 g009
Figure 10. Experimental environment for model validation: (a) Experiment schematic diagram; (b) Experimental environment.
Machines 12 00148 g010
Figure 11. Comparison of experimental and simulation results for current oscillation when a series L filter is added: (a) Comparison of simulation results with ideal inductor and measured values; (b) Comparison of simulation with consideration of the internal resistance of the inductor and measured values.
Machines 12 00148 g011
Figure 12. Comparison of current oscillation components with and without a filter. “W/O” denotes “without filter” and “W/” denotes “with filter”.
Machines 12 00148 g012
Figure 13. Comparison of measurement results with and without filters. “W/O” stands for “without”, and “W/” stands for “with”: (a) Current vibration; (b) Vibration of body of the motor; (c) Motor acoustic noise.
Machines 12 00148 g013
Table 1. Names and symbols of parameters.
Element NameSymbolUnit
Input voltage V i n [V]
Input current i t o t a l ( t ) [A]
Armature resistance R a [ Ω ]
Armature inductance L a [H]
Armature current i a [A]
Back EMF e a ( t ) [V]
Motor armature inertiaJ[ k g · m 2 ]
Viscous damping, friction coefficient B [ N · m / r p m ]
Motor torque τ [ N · m ]
Motor angular position θ [rad]
Motor angular velocity ω [rad/s]
Motor torque constant k τ [ N · m / A ]
Motor back EMF constant k b [ V · s / r a d ]
Filter impedance Z f [ Ω ]
Connector impedance Z c [ Ω ]
Connector inductance L [H]
Connector varistor resistance R v [ Ω ]
Connector varistor capacitance C v [F]
Filter resistance R f [ Ω ]
Filter inductance L f [H]
Table 2. Function of the 8th order and DC component created by linear interpolation.
NameFunction
DC 0.1017 × f + 1.151 × 10 4
8th order (Magnitude) 0.0021 × 8 f + 2.504 × 10 5
Model application 8 t h   o r d e r   c o m p o n e n t × sin 8 ω t + D C
Table 3. Parameter values applied to the model.
Element NameSymbolValueUnit
Input voltage V i n 12[V]
Connector inductance L 0.22 × 10 6 [H]
Armature resistance R a 1.1 [ Ω ]
Armature inductance L a 0.87 × 10 3 [H]
Back EMF e a ( t ) function (refer to Table 2)[V]
Converged angular velocity ω a 648.5032[rad/s]
Motor armature inertiaJ 4.57 × 10 6 [ k g · m 2 ]
Viscous damping, friction coefficient B 2.95 × 10 4 [ N · m / r p m ]
Motor torque constant k τ 0.14 [ N · m / A ]
Connector varistor resistance R v 500 × 10 6 [ Ω ]
Connector varistor capacitance C v 1.6 × 10 6 [F]
Disclaimer/Publisher’s Note: The statements, opinions and data contained in all publications are solely those of the individual author(s) and contributor(s) and not of MDPI and/or the editor(s). MDPI and/or the editor(s) disclaim responsibility for any injury to people or property resulting from any ideas, methods, instructions or products referred to in the content.

