Abstract
In this paper, the cooling performance of oil-cooling PMSM with hairpin winding under various oil parameters is analyzed via a simulation and an experiment. The effects of oil jet positions, oil temperatures, and oil flow rates on the cooling performance are analyzed. It is found that increasing the oil temperature in the range of 20 °C to 60 °C, increasing the flow rate of oil jets whose position angle is from 15° to 45°, and increasing the flow rate in the range of 1 L/min to 2 L/min will significantly improve the cooling performance. The apertures of the oil spray ring are optimized using the Taguchi algorithm. The cooling performance is the best when the flow ratio is m(0°):m(15°):m(30°):m(45°):m(60°):m(75°) = 4%:19%:10%:10%:4%:4%. This study provides a guide for the design of the oil-cooling system for the hairpin winding of the PMSM.
1. Introduction
With the gradual strengthening of people’s environmental awareness, electric vehicles will become the primary development trend in the future. Electric vehicle motors tend to have high power density and high integration. Because hairpin winding motors have a high slot fill factor, they are gradually replacing motors with round winding in electric vehicles. The main losses of the motor include copper loss, iron loss, eddy current loss of permanent magnet, mechanical loss, and stray loss [1,2,3]. The copper loss is the main part of the motor loss [4,5,6]. However, due to the higher copper loss of hairpin winding, the heat dissipation issue of motors with hairpin winding should be addressed. Compared to water, oil can come into direct contact with the winding and remove the heat generated by the winding. Therefore, to meet the heat dissipation requirements of the winding, hairpin winding motors are typically oil-cooling [7,8].
At present, many studies focus on water-cooling structures and water-cooling characteristics [9,10], and the research on oil-cooling motors is insufficient. The oil-cooling research mainly focuses on fewer-layer hairpin winding [11,12,13]. Chuan Liu et al. [11] developed a method for predicting HTCs of the motor with two-layer hairpin winding. Taewook Ha et al. [12] studied the oil injection method to maximize the cooling performance of a motor with six-layer hairpin winding. Chuan Liu et al. [13] investigated the cooling ability of different spray cooling setups on the two-layer end winding. However, compared to the fewer-layer winding, when the number of layers of winding exceeds six, the heat dissipation issue of the multi-layer winding is more serious. Moreover, gaps between the multi-layer winding and oil-cooling characteristics are different from the fewer-layer winding. Therefore, it is necessary to analyze the cooling performance of oil-cooling multi-layer winding.
The analysis methods of motor cooling systems are divided into two methods: the experimental method and the numerical simulation method [14,15,16]. Whether the motor cooling system is water-cooled, air-cooled or oil-cooled, the convective heat transfer area (CHTA), the average convective heat transfer coefficient (CHTC) and the convective thermal resistance (CTR) are the main standards for cooling performance [17,18,19,20]. Xintong Zhang et al. [17] proposed the coupling method of computational fluid dynamics (CFD) and lumped parameter thermal network (LTPN) to calculate the CHTC of an air-cooling motor. Peixin Liang et al. [18] determined the cooling performance of the circumferential water jacket and axial water jacket by comparing the CHTC. Yaohui Gai et al. [19] calculated the CHTC in the hollow shaft cooling system of the rotor with various speeds. F. Zhang et al. [20] established the LPTN of the oil-cooling end winding, in which the CHTC and CTR are important parameters related to temperature rise. Therefore, the CHTA, CHTC and CTR should be calculated to analyze the cooling performance of oil cooling windings.
The studies on oil-cooling motors mainly compare the type of oil jets, oil flow rate and oil temperature [8,21], and determine a better combination of oil spray parameters. Taewook Ha et al. [8] investigated the characteristics of oil behavior in the oil-cooling of motors. They found that the optimal oil temperature, flow rate, and oil level are at 60 °C, 0.140 kg/s, and 85 mm, respectively. In addition, Nyeon Gu Han et al. [21] studied the effect of the churning phenomenon on the cooling performance of motors. They analyzed the effect of oil temperature, oil flow rate, and motor rotation speed on the cooling performance. However, the oil jet position also has a great influence on the cooling performance, and little research has been conducted on the effect of oil jet position on the cooling performance.
There are many kinds of optimized algorithms for the motor structure, for example, the genetic algorithm [22], the simulated annealing algorithm [23,24], the particle swarm optimization algorithm [25]. But the objective function of these global optimization algorithms is complex and the solution time is long. The Taguchi method [26,27] is adopted in this paper, which is a local optimized method with a short solution time and is capable of optimizing multi-objective design. The optimal parameters can be determined in the lowest number of experiments using the Taguchi method.
In order to analyze the cooling performance of the oil-cooling multi-layer hairpin winding, the CFD model is established in this paper. The correctness of the flow field simulation is verified through experiments. The cooling performance under various oil jet positions, oil temperatures, oil flow rates are analyzed. The apertures of the oil spray ring are optimized using the Taguchi method and the cooling performances of the initial model and the optimized model are compared.
2. Experiments and CFD Settings
2.1. PMSM Parameters
Figure 1 shows the oil-cooled PMSM with the 8-layer hairpin winding used in the experiment, and the main parameters are listed in Table 1. The rated speed of the motor is 4700 rpm, and the rated power is 225 kW. The end winding on the left side of the motor is called the welded part, and the other side is called the crown part.
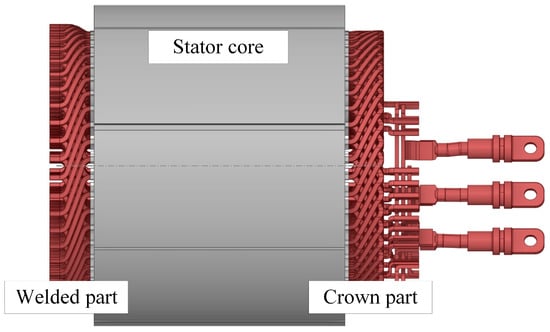
Figure 1.
Oil-cooled PMSM with the 8-layer hairpin winding.

Table 1.
Main parameters of motor.
2.2. Experimental Setup
In this study, as a visual experiment of oil flow, the motor is not heated, and only the oil is heated to a suitable temperature. And the flow field and direction are analyzed to verify the correctness of the simulation. But before carrying out the fluid visual experiment in the hairpin winding, we referenced the relevant literature [12,13]. When analyzing the fluid distribution of the oil-cooling motor, the effect of the rotor was ignored, and a separate stator was used for the experiment in [12,13]. Since the rotor that sprays oil to cool windings is not involved in this paper, it is reasonable to conduct experiments with the stator. The experimental device and schematic diagram used in this study are shown in Figure 2. The oil temperature is usually 60 °C in an electric vehicle (EV) motor. Therefore, in order to ensure the accuracy of the experiment, oil needs to be heated to 60 °C. An oil heater (500 W oil heater with an oil temperature sensor, XinFuTong, Taizhou, China) is used to regulate the temperature of the oil in the tank. An oil pump (DC50B-12100A, DC Pump, Zhongke Century, Shenzhen, China) is used to circulate oil in the system. And a flow meter (K24 flow meter, WenGang, Wenzhou, China) is connected to the pump to control the oil velocity. The heater oil is transported to the visual test chamber. The visual test chamber consists of the stator, the spray ring, the oil groove and the transparent Aggreko shell. In order to study the effects of oil jet positions on cooling performance, a new spray ring is designed in this paper, as shown in Figure 3. By changing the hollow bolts with different apertures, the oil spray ring achieves the adjustment of the aperture of the oil jets, which speeds up the experiment process and saves time. In addition, to acquire its unique shape, the oil spray ring is manufactured using 3D printing technology. And the spray ring is made of a high-temperature-resistant resin that can tolerate the fluid temperature without becoming deformed or soft.
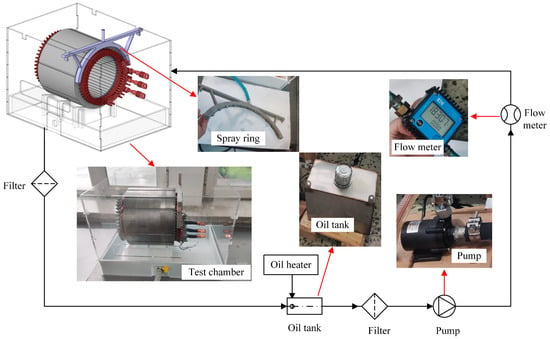
Figure 2.
Experimental device and schematic diagram.
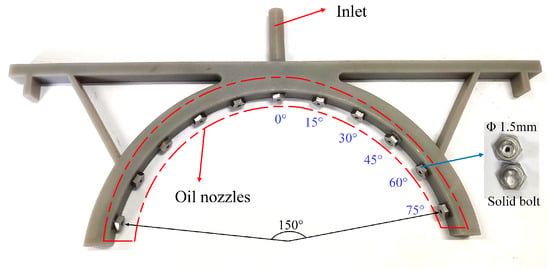
Figure 3.
A new oil spray ring.
According to the actual condition, the vertical distance between the oil spray jet and the winding is 10 mm. As shown in Figure 3, the interval of jets is 15°, and the number of jets is 11. In order to determine the fluid field at various jet positions, the oil jets are placed there with a hollow bolt, the aperture of which is 1.5 mm, while the other oil jets are placed with solid bolts. The oil used in this experiment is ATF D971. The oil parameters at 20 °C, 60 °C and 100 °C are shown in Table 2. The oil flow rate at the crown part is 2 L/min at the rated power. The fluid field on the end winding is tested when the oil jet positions are 0°, 15°, 30°, 45°, 60° and 75°, and the flow rate at each oil spray jet is 0.18 L/min.

Table 2.
Parameters of oil at various temperatures.
2.3. CFD Setting
In the traditional cooling calculation of the motor with hairpin winding, the end winding is usually equivalent to a ring to save calculation time. However, this method cannot calculate the oil distribution on the multi-layer winding accurately. Therefore, this paper established a CFD model based on the real structure of the hairpin winding, as shown in Figure 4. The calculation result based on this model is closer to the real oil flow on the winding, and the accuracy is improved. Due to the symmetry of the winding, a complete 180° semi-circular fluid field model is established and shown in Figure 4. The CFD model is divided into four parts: the oil channel in the spray ring, the region from the oil jet to the end winding surface, gaps between windings, and the cavity of the motor. The inlet flow is the mass flow, and the pressure outlet is located at the bottom. Because the oil flow is laminar, the standard k-ε method and the volume of fluid (VOF) model are used in this paper, and the equation of standard k-ε is expressed as follows [19]:
where k is the turbulence kinetic energy, ε is the dissipation rate, σk, σε, G1ε, G2ε are constants, and Gk is turbulence kinetic term associated with the mean velocity gradient.
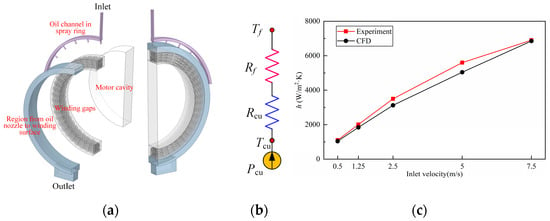
Figure 4.
(a) CFD model. (b) LPTN of oil-cooling winding. Tf is the oil temperature. Rf is the convective thermal resistance. Rcu is the thermal resistance of end winding. Tcu is winding temperature. Pcu is winding heat source. (c) Experiment [28] and CFD results at fluid temperature 50 °C at various inlet velocity values (jet on center, Tsurf = 90 °C).
The sum of the oil volume fraction and air volume fraction is 1 in each volume cell in the VOF method. It can be expressed as follows. For the phase of q, the continuity equation of the VOF is as shown in Formulas (2) and (3).
where ρq is the density, vq is the velocity, and αq is the volume fraction of the phase of q. αoil is the volume fraction of the phase of oil. αair is the volume fraction of the phase of air.
The fluid is assumed to be an incompressible Newtonian fluid. According to the requirements of the wall function, the y+ needs to meet 11.5 < y+ < 200. The y+ is the dimensionless wall distance [19], and it can be expressed as in Formula (4). After detailed meshing, the y+ at the surface of the end winding in this paper is 13, which meets the mesh requirements and the number of grids is 620,000. And in order to verify the experimental results, the flow rate and the oil temperature are the same as the experiment. The fluid field at each oil jet position is calculated as follows:
where y is the height of the first layer grid on the wall, τw is the wall shear stress, ρ is the fluid density, and μ is the fluid dynamic viscosity.
According to the convective thermal resistance calculation using Formula (5) and the LPTN of oil-cooling winding, the CHTA and CHTC determine the CTR. The thermal resistance determines the temperature of the winding, which indicates the oil-cooling performance. Therefore, this paper compares the CHTA, CHTC and CTR to calculate the cooling performance.
where Rf is the convective thermal resistance, h is the convective heat transfer coefficient, and A is the convective heat transfer area.
In [28], the CHTC of oil-cooling on end winding was determined via an experiment. Due to the similar cooling process, it can be used as a reference to verify the correctness of the established model in this paper. Based on the experiment settings and boundary conditions shown in [28], we established a model and finished the simulation. The results show that the CFD results are in good agreement with the experimental results, as shown in Figure 4c. Therefore, the numerical solution method in this paper can accurately calculate the CHTC.
3. Effect of Oil Parameters on Cooling Performance
3.1. Effect of Oil Jet Positions on Cooling Performance
The oil temperature is 60 °C and the total flow rate at the end winding is 2 L/min. The flow rate of a single oil jet in the corresponding experiment is 0.18 L/min. Due to the symmetry of the CFD model, the flow rate of the 0° oil jet is 0.09 L/min and the flow rate of other oil jet positions is 0.18 L/min in the CFD calculation. And in order to compare the cooling performance at the same flow rate of each oil jet, the CHTA of the 0° oil jet is multiplied by 2. Experiments and CFD simulations are carried out when the oil jet position angle is 0°, 15°, 30°, 45°, 60° and 75°, respectively. Because the color of the oil and the winding are similar, these are difficult to discern in the figure. Cases with and without oil coverage are shown in Figure 5. Figure 6 shows the experiment results, and yellow arrows in the figures indicate the oil flow direction observed during the experiment. Figure 7 shows the oil distribution at various positions calculated in simulations. The transparent region is the end winding, and the colored area is the CHTA. The depth of the color indicates the oil velocity. The oil distribution and flow direction of the experiment and CFD are the same, confirming the accuracy of the CFD.
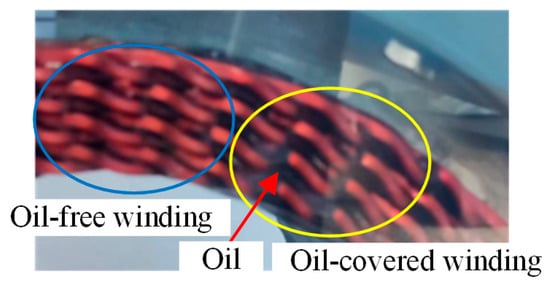
Figure 5.
Oil-covered winding and oil-free winding.

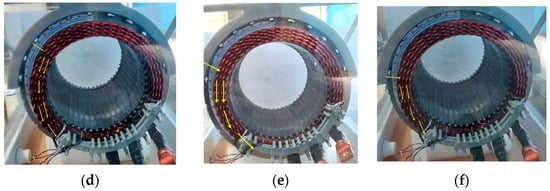
Figure 6.
Oil distribution at various oil jet positions in the experiment. (a) 0°. (b) 15°. (c) 30°. (d) 45°. (e) 60°. (f) 75°.

Figure 7.
Oil distribution on the winding at various oil jet positions in CFD. (a) 0°. (b) 15°. (c) 30°. (d) 45°. (e) 60°. (f) 75°.
It can be seen from Figure 7 that the CHTA varies significantly at various oil jet positions. As shown in Figure 8, the end winding is divided into six parts. The inner-layer windings are the four layers closed to the motor inner cavity, while the outer-layer windings are the other four layers. The convective heat transfer region of the winding is shown in Table 3. When the oil jet position is 0°, the force of gravity is the largest, and the majority of the oil falls vertically. Therefore, the oil flowing from the 0° oil jet is mainly distributed in region I, and covers the outer and inner layers of the winding.
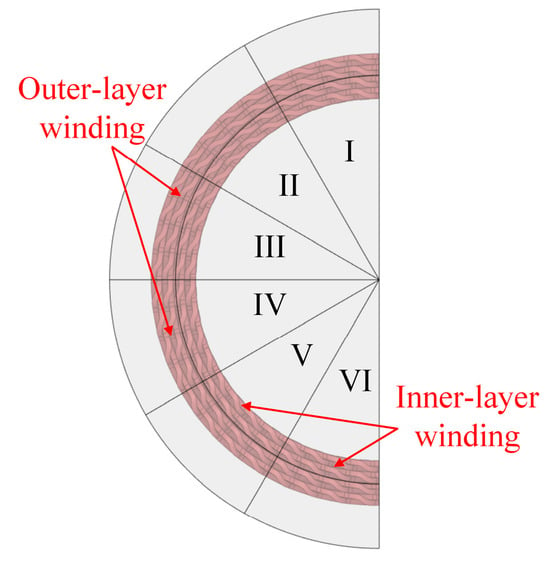
Figure 8.
The end winding is divided into six parts, and they are numbered from I to VI.

Table 3.
The oil distribution region on the winding.
When the oil jet position is from 15° to 45°, gravity is used for it to flow along the winding and the CHTA is larger than other positions. Therefore, the oil flowing from the 15° oil jet covers the full windings of six regions. Because oil flows down along windings, it only cools the inner-layer windings in regions II and III. The oil flowing from the 30° and 45° oil jets covers regions II, III, IV and V. However, when the oil jet position is between 60° and 75°, the gravity on the oil is small, and the oil cannot flow too far on the winding. It only covers the outer-layer winding in regions III, IV and V. By increasing the flow rate of 15°–45° oil jets, the cooling performance significantly improves. And by increasing the flow rate of 60° and 75° oil jets, the cooling performance of the outer winding is better. This indicates that a reasonable flow rate for each jet is important to improve the cooling performance of the motor.
3.2. Effect of the Oil Temperature on Cooling Performance
As shown in Figure 9, oil temperature has a great influence on the oil’s physical properties. Especially important, the dynamic viscosity and thermal conductivity significantly affect the oil distribution. According to the following formulas [19], the CHTC is related to the oil physical properties. When the temperature rises, the dynamic viscosity decreases, resulting in increased fluidity and oil velocity, and the oil distribution on the winding is influenced. Moreover, oil velocity is directly related to the CHTC. At the same time, the increase in specific heat capacity and the decrease in thermal conductivity also affect the oil cooling performance. As a result, the effect of oil temperature on cooling performance is analyzed.
where Nu is Nusselt number, D is hydraulic diameter, h is convective heat transfer coefficient, Re is Reynolds number, λ is the heat conductivity coefficient, Pr is the Prandtl number, ρ is the density, μ is dynamic viscosity, and cp is the specific heat capacity.
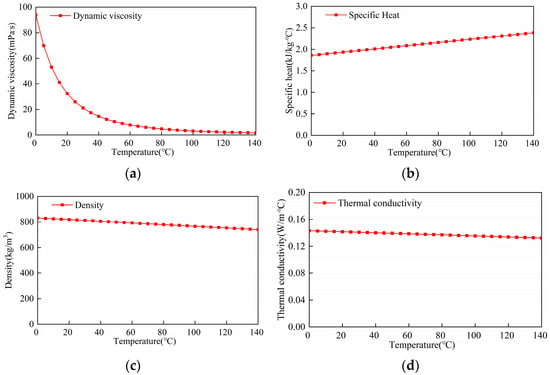
Figure 9.
The trend of the oil’s physical properties with temperature. (a) Dynamic viscosity. (b) Specific heat. (c) Density. (d) Thermal conductivity.
In this study, the flow rate is the same as that in the previous section with a change in the oil temperature from 20 °C to 100 °C. Figure 10 and Figure 11 show the CHTA distribution and the oil velocity at various oil jet positions. In general, as the temperature rises, the oil viscosity gradually decreases and the oil velocity increases, resulting in a decrease in the oil-covered area on the winding. The CHTA at 20 °C, 60 °C, and 100 °C is shown in Figure 12a. β is the angle of the oil jet position. When the temperature decreases, the viscosity of the oil rises, and the oil flow on the winding surface slows, resulting in a higher CHTA of the oil at 20 °C than at other temperatures. At each temperature, the sum of the CHTA at 15°, 30° and 45° is about twice that of the sum of the CHTA at 0°, 60°, and 75°. Therefore, increasing the flow rate in the range of 15–45° can significantly increase the cooling performance. All positions have a larger CHTA at 20 °C than the CHTA at other temperatures. The CHTA at the oil jet positions from 15° to 45° is greater than at other oil jet positions at the same temperature, as mentioned in the previous section.

Figure 10.
Oil distribution and oil velocity at 20 °C. (a) 0°. (b) 15°. (c) 30°. (d) 45°. (e) 60°. (f) 75°.

Figure 11.
Oil distribution and oil velocity at 100 °C. (a) 0°. (b) 15°. (c) 30°. (d) 45°. (e) 60°. (f) 75°.

Figure 12.
Cooling performance at various temperatures. (a) CHTA. (b) CHTC. (c) CTR.
Figure 12b shows the CHTC at various oil temperatures. According to the fluid field, as the oil temperature rises, the oil velocity gradually increases, resulting in an increase in the CHTC at all oil jet positions. The CHTC at 100 °C is three times that at 20 °C. The CHTC is highest at 100 °C, with a value of 160 W/m2·K. Therefore, the change in temperature will significantly affect the CHTC. Figure 12c shows the convective thermal resistance at various temperatures. The CTR difference between 20 °C and 60 °C is significant, while the difference between 60 °C and 100 °C is insignificant. The maximum CTR difference between 20 °C and 60 °C is 0.144 K/W, while the difference between 60 °C and 100 °C at the same oil jet position is only 0.07 K/W.
As a result, increasing the oil temperature can reduce the convective thermal resistance. However, when the oil temperature exceeds 60 °C, the drop in convective thermal resistance is not noticeable and the excessive oil temperature is not beneficial for cooling. Therefore, the excessive oil temperature is unnecessary, which will result in increased power for the oil pump and increased motor loss and the loss of the EV system. The convective thermal resistance of 15° to 45° is smaller than that at other positions at the same temperature.
3.3. Effect of the Oil Flow Rate on Cooling Performance
When the motor is running in different working conditions, the loss of the motor will change in different conditions. The motor temperature is monitored by the control system of the oil pump, and the oil flow setting is achieved in different conditions. Therefore, it is necessary to analyze the oil distribution at different flow rates. The effect of the oil flow rate and the oil jet position on the cooling performance is analyzed. The oil temperature is 60 °C with a change in total oil flow rate from 1 L/min to 3 L/min at the end winding. And the flow rate changes from 0.09 L/min to 0.27 L/min for the single oil jet. Figure 13 and Figure 14 show the oil distribution and the oil velocity at various oil jet positions. In general, as the flow rate rises, the CHTA increases. As shown in Figure 15a, the CHTA increases multiply when the flow rate increases from 1 L/min to 3 L/min. This indicates that the flow rate has a significant effect on the CHTA. However, the CHTA of 15–45° is still larger than the CHTA of the other three positions.

Figure 13.
Oil distribution and oil velocity at 1 L/min. (a) 0°. (b) 15°. (c) 30°. (d) 45°. (e) 60°. (f) 75°.

Figure 14.
Oil distribution and oil velocity at 3 L/min. (a) 0°. (b) 15°. (c) 30°. (d) 45°. (e) 60°. (f) 75°.

Figure 15.
Cooling performance at various flow rates. (a) CHTA. (b) CHTC. (c) CTR.
Figure 15b shows the CHTC under various flow rates. The CHTC is higher when the flow rate is 3 L/min, indicating that the higher the flow rate, the greater the CHTC. However, compared to the effect of oil temperature on the CHTC, the change in flow rates is quite small. It can be seen that the average CHTC is almost the same for each flow rate, which indicates that the average CHTC is mainly affected by oil temperature. Figure 15c shows the CTR at various oil flow rates. The thermal resistance difference between 1 L/min and 2 L/min is large, which indicates that increasing the flow rate in this interval can significantly reduce the winding temperature. However, the thermal resistance difference between 2 L/min and 3 L/min is small. Furthermore, regardless of the flow rate increase in this interval, the thermal resistance remains unchanged, and the winding temperature is not greatly reduced. Therefore, the flow rate affects convective thermal resistance by affecting the CHTA, while oil temperature affects convective thermal resistance by affecting the CHTC.
4. Structure Optimized and Cooling Performance Analysis
Based on the analysis above, it is necessary to optimize the diameter of the oil jet to meet the purpose of increasing the CHTA and CHTC, and reducing the CTR. Therefore, this paper uses the CHTA and CHTC as optimized objectives. The diameters of the oil jets at each position are taken as optimized factors. The Taguchi method is used to optimize the diameters of the oil jets. In order to reduce the number of simulations and save calculation time, d2, d3 and d4 have a great influence on the oil distribution, as shown in Figure 16. Therefore, they are optimized as three independent variables. It is assumed that the oil jet positions of 0°, 60° and 75° have the same diameter d1. The levels of the optimized factors are shown in Table 4. In this paper, an orthogonal matrix with four levels and four factors is established. Sixteen simulation calculations are carried out, greatly reducing the number of calculations. The simulation results obtained via CFD are shown in Table 5.
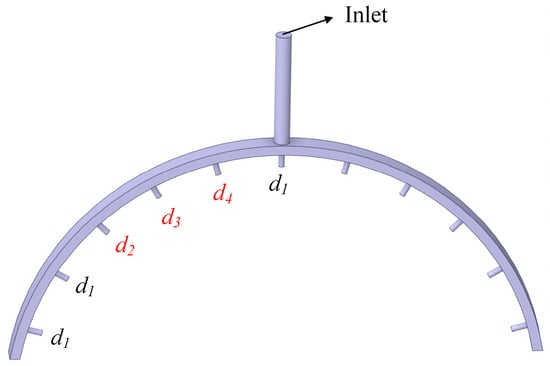
Figure 16.
Fluid field in the oil spray ring. d1, d2, d3, d4 are diameters of oil jets at various positions.

Table 4.
Levels of the optimized factors.

Table 5.
An orthogonal matrix and simulation results.
In order to determine the proportion of all optimized factors affecting each optimized objective, the average and variance are analyzed. The formula for calculating the average value of each optimized objective is as follows:
where m is the average of the simulation of the optimized targets. n is the number of experiments. Si is the optimized target for the simulation i.
Then, the average of the optimized target under different levels is analyzed. For example, when d3 is at level 1, the formula of the CHTA average is as follows:
where md2(A) is the average of the CHTA with optimized factor d2 at level 1. A(1), A(2), A(3), and A(4), respectively, represent the simulation values of the CHTA in the 1st, 2nd, 3rd and 4th test.
According to the above method, the average of the CHTA and CHTC at various levels is shown in Figure 17. When the CHTA is at its maximum, the combination of parameters is d1(2), d2(2), d3(2), d4(4). When the CHTC is at its maximum, the combination of parameters is d1(1), d2(1), d3(4), d4(3).
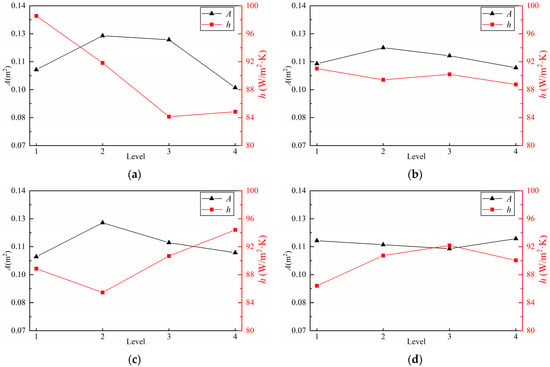
Figure 17.
The average of each optimized objective under each optimized factor. (a) d1. (b) d2. (c) d3. (d) d4.
According to the average of the optimized objectives, the variance can be obtained using the following formula. The variance proportion is calculated as shown in Table 6.
where X represents each optimization factor. S represents the optimized objective. m(S) represents the average of the optimized objective. mxi(S) represents the average value of an optimized objective under the optimized factor X at the level i. SS represents the variance under the optimized factor X. n represents the level value of each optimization factor.

Table 6.
The influence of each optimization factor on different optimization objectives.
It can be seen that d1 and d4 have a greater influence on CHTC, and d2 and d3 have a greater influence on CHTA. Therefore, the levels of d1 and d4 should be selected when the CHTC is maximum. The levels of d2 and d3 should be selected when the CHTA is maximum. The combination of optimized parameters is shown in Table 7. It can be seen that the optimized CHTA is increased by 47%. It is noted that the CHTC is not improved compared with the initial model. Based on the above analysis, this is because the CHTC is mainly related to oil temperature. But the CTR is reduced by 24.9%, which shows that the optimization is effective. The oil distribution of initial model and optimized model is as shown in Figure 18. It can be seen that the optimized model has a larger oil distribution area on the winding. The flow ratio of the initial model and optimized model of each oil jet (from 75° to 0° in clockwise direction is the oil jet number from 1 to 6) is shown in Figure 19, and the flow ratio is m(0°):m(15°):m(30°):m(45°):m(60°): m(75°) = 4%:19%:10%:10%:4%:4%.

Table 7.
Optimized parameter combination.
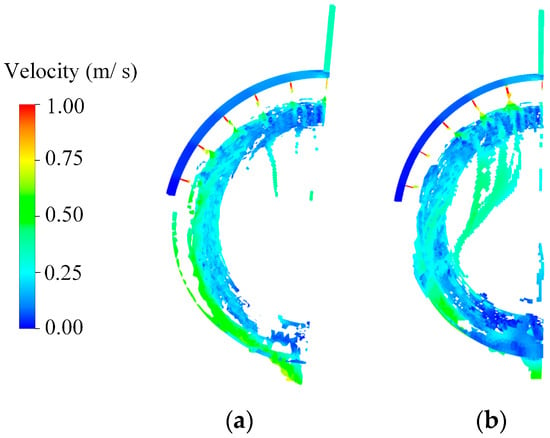
Figure 18.
Oil distribution at 60 °C, 1 L/min. (a) Initial model. (b) Optimized model.
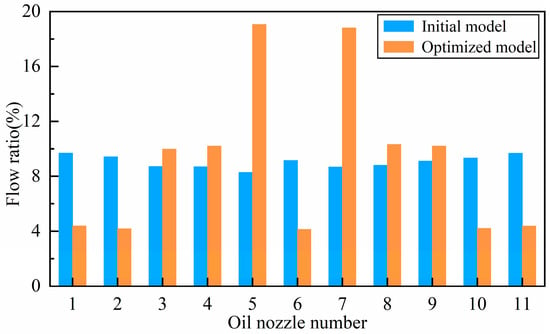
Figure 19.
Flow ratio of initial model and optimized model.
5. Conclusions
In this paper, the effect of the oil jets’ position, the oil temperature, and the flow rate on the cooling performance of PMSM with hairpin winding is quantitatively analyzed. The CHTA varies greatly when the oil jet position is different. By increasing the flow rate of 15°–45° oil jets, the cooling performance significantly improves. And by increasing the flow rate of 60° and 75° oil jets, the cooling performance of the outer winding is better. With the oil temperature increases, the CHTA decreases and the CHTC increases. But when the oil temperature exceeds 60 °C, the decrease in the convective thermal resistance is not obvious. With the flow rate increases, the CHTA and CHTC increase. The flow rate affects convective the thermal resistance by affecting the CHTA, while oil temperature affects the CTR by affecting the CHTC. And when the flow rate is greater than 2 L/min, the winding temperature will not be significantly reduced by increasing the flow rate. The structure of the oil spray ring is optimized using the Taguchi algorithm. The cooling performance is the best when the flow ratio is m(0°):m(15°):m(30°):m(45°):m(60°):m(75°) = 4%:19%:10%:10%:4%:4%.
Author Contributions
Conceptualization, C.Y. and W.C.; software, B.S.; formal analysis, C.Y.; data curation, B.S.; writing—original draft preparation, C.Y.; writing—review and editing, C.Y. and Y.X.; supervision, W.C.; and funding acquisition, W.C. and Y.X. All authors have read and agreed to the published version of the manuscript.
Funding
This work was supported by the National Natural Science Foundation of China (U21A20145), (51977052), (52377045) and the Natural Science Foundation of Heilongjiang Province (ZD2022E006).
Data Availability Statement
Data are contained within the article.
Conflicts of Interest
The authors declare no conflicts of interest.
References
- Cezário, C.A.; Verardi, M.; Borges, S.S.; Silva, J.C.; Oliveira, A.A.M. Transient thermal analysis of an induction electric motor. In Proceedings of the 18th International Congress of Mechanical Engineering, Ouro Preto, Brazil, 6–11 November 2005. [Google Scholar]
- Mi, C.; Slemon, G.R.; Bonert, R. Modeling of iron losses of permanent-magnet synchronous motors. IEEE Trans. Ind. Appl. 2003, 39, 734–742. [Google Scholar]
- Fakhfakh, M.A.; Kasem, M.H.; Tounsi, S.; Neji, R. Thermal analysis of a permanent magnet synchronous motor for electric vehicles. J. Asian Electr. Veh. 2008, 6, 1145–1151. [Google Scholar] [CrossRef]
- Cavazzuti, M.; Gaspari, G.; Pasquale, S.; Stalio, E. Thermal management of a formula e electric motor: Analysis and optimization. Appl. Therm. Eng. 2019, 157, 113733. [Google Scholar] [CrossRef]
- Fan, J.; Zhang, C.; Wang, Z.; Dong, Y.; Nino, C.E.; Tariq, A.R.; Strangas, E.G. Thermal analysis of permanent magnet motor for the electric vehicle application considering driving duty cycle. IEEE Trans. Magn. 2010, 46, 2493–2496. [Google Scholar] [CrossRef]
- Ding, X.; Bhattacharya, M.; Mi, C. Simplified thermal model of PM motors in hybrid vehicle applications taking into account eddy current loss in magnets. J. Asian Electr. Veh. 2010, 8, 1337–1343. [Google Scholar] [CrossRef]
- Chen, P.; Hassine, N.B.; Ouenzerfi, S.; Harmand, S. Experimental and numerical study of stator end-winding cooling with impinging oil nozzle. Appl. Therm. Eng. 2023, 220, 119702. [Google Scholar] [CrossRef]
- Ha, T.; Han, N.G.; Kim, M.S.; Rho, K.H.; Kim, D.K. Experimental study on behavior of coolants, particularly the oil-cooling method in electric vehicle motors using hairpin winding. Energies 2021, 14, 956. [Google Scholar] [CrossRef]
- Huynh, T.A.; Hsieh, M.F. Improvement of traction motor performance for electric vehicles using conductors with insulation of high thermal conductivity considering cooling methods. IEEE Trans. Magn. 2021, 57, 1–5. [Google Scholar] [CrossRef]
- Zhu, G.; Zhu, Y.; Tong, W.; Han, X.; Zhu, J. Double-circulatory thermal analyses of a water-cooled permanent magnet motor based on a modified model. IEEE Trans. Magn. 2018, 54, 1–4. [Google Scholar] [CrossRef]
- Liu, C.; Gerada, D.; Xu, Z.; Chong, Y.C.; Michon, M.; Goss, J.; Li, J.; Gerada, C.; Zhang, H. Estimation of oil spray cooling heat transfer coefficients on hairpin windings with reduced-parameter models. IEEE Trans. Transp. Electrif. 2021, 7, 793–803. [Google Scholar] [CrossRef]
- Ha, T.; Kim, D.K. Study of injection method for maximizing oil-cooling performance of electric vehicle motor with hairpin winding. Energies 2021, 14, 747. [Google Scholar] [CrossRef]
- Liu, C.; Xu, Z.; Gerada, D.; Li, J.; Gerada, C.; Chong, Y.C.; Popescu, M.; Goss, J.; Staton, D.; Zhang, H. Experimental investigation on oil spray cooling with hairpin windings. IEEE Trans. Ind. Electron. 2020, 67, 7343–7353. [Google Scholar] [CrossRef]
- Park, J.; An, J.; Han, K.; Choi, H.-S.; Park, I.S. Enhancement of cooling performance in traction motor of electric vehicle using direct slot cooling method. Appl. Therm. Eng. 2022, 217, 119082. [Google Scholar] [CrossRef]
- Micallef, C.; Pickering, S.J.; Simmons, K.A.; Bradley, K.J. Improved cooling in the end region of a strip-wound totally enclosed fan-cooled induction electric machine. IEEE Trans. Ind. Electron. 2008, 55, 3517–3524. [Google Scholar] [CrossRef]
- Nategh, S.; Huang, Z.; Krings, A.; Wallmark, O.; Leksell, M. Thermal modeling of directly cooled electric machines using lumped parameter and limited CFD analysis. IEEE Trans. Energy Convers. 2013, 28, 979–990. [Google Scholar] [CrossRef]
- Zhang, X.; Zhang, C.; Li, L.; Fu, P. Study on convection heat transfer of end-winding for a 10kW external rotor PMSM with open end cap. IEEE Trans. Energy Convers. 2022, 37, 1934–1945. [Google Scholar] [CrossRef]
- Liang, P.; Chai, F.; Shen, K.; Liu, W. Water jacket and slot optimization of a water-cooling permanent magnet synchronous in-wheel motor. IEEE Trans. Ind. Appl. 2021, 57, 2431–2439. [Google Scholar] [CrossRef]
- Gai, Y.; Ma, C.; Xu, Y.; Chong, Y.C. Numerical prediction and measurement of pressure drop and heat transfer in a water-cooled hollow-shaft rotor for a traction motor application. IET Electr. Power Appl. 2021, 15, 476–486. [Google Scholar] [CrossRef]
- Zhang, F.; Gerada, D.; Xu, Z.; Liu, C.; Zhang, H.; Zou, T.; Chong, Y.C.; Gerada, C. A thermal modeling approach and experimental validation for an oil spray-cooled hairpin winding machine. IEEE Trans. Transp. Electrif. 2021, 7, 2914–2926. [Google Scholar] [CrossRef]
- Han, N.G.; Lee, H.L.; Kim, R.H.; Beom, T.Y.; Kim, Y.K.; Ha, T.W.; Lee, S.W.; Kim, D.K. Thermal analysis of the oil cooling motor according to the churning phenomenon. Appl. Therm. Eng. 2023, 220, 119791. [Google Scholar] [CrossRef]
- Pang, L.; Yang, Q.; Zhao, C.; Zhang, W.; Qin, H. Optimization of cogging torque of hybrid excitation motor based on Genetic Algorithm and TOPSIS method. In Proceedings of the 4th Global Power, Energy and Communication Conference (GPECOM), Nevsehir, Turkey, 14–17 June 2022. [Google Scholar]
- Xu, Z.; Yu, Q.; Wang, H.; Zhang, Y.; Yi, T. Optimal design of hybrid stator pole type bearingless switched reluctance motor with simulated annealing particle swarm optimization algorithm. In Proceedings of the IEEE 5th International Electrical and Energy Conference (CIEEC), Nangjing, China, 27–29 May 2022. [Google Scholar]
- Cao, X.; Li, G.; Ye, Q.; Zhou, R.; Ma, G.; Zhou, F. Multi-objective optimization of permanent magnet synchronous motor based on elite retention hybrid simulated annealing algorithm. In Proceedings of the 12th IEEE Conference on Industrial Electronics and Applications (ICIEA), Siem Reap, Cambodia, 18–20 June 2017. [Google Scholar]
- Kim, C.-H.; Kim, J.-W.; Kim, Y.-J.; Jung, S.-Y. Particle swarm optimization with multiple regression for optimal design of interior permanent magnet synchronous motor. In Proceedings of the 22nd International Conference on Electrical Machines and Systems (ICEMS), Harbin, China, 11–14 August 2019. [Google Scholar]
- Sun, X.; Shi, Z.; Zhu, J. Multi objective design optimization of an IPMSM for EVs based on fuzzy method and sequential Taguchi method. IEEE Trans. Ind. Electron. 2021, 68, 10592–10600. [Google Scholar] [CrossRef]
- Zhao, W.; Ma, A.; Ji, J.; Chen, X.; Yao, T. Multi objective optimization of a Double-Side linear vernier PM Motor using response surface method and differential evolution. IEEE Trans. Ind. Electron. 2020, 67, 80–90. [Google Scholar] [CrossRef]
- Kekelia, B.; Bennion, K.; Feng, X.; Moreno, G.; Cousineau, J.E.; Narumanchi, S.; Tomerlin, J. Surface temperature effect on convective heat transfer coefficients for jet impingement cooling of electric machines with automatic transmission fluid. In Proceedings of the ASME 2019 International Technical Conference and Exhibition on Packaging and Integration of Electronic and Photonic Microsystems (IPACK2019), Anaheim, CA, USA, 7–9 October 2019. [Google Scholar]
Disclaimer/Publisher’s Note: The statements, opinions and data contained in all publications are solely those of the individual author(s) and contributor(s) and not of MDPI and/or the editor(s). MDPI and/or the editor(s) disclaim responsibility for any injury to people or property resulting from any ideas, methods, instructions or products referred to in the content. |
© 2024 by the authors. Licensee MDPI, Basel, Switzerland. This article is an open access article distributed under the terms and conditions of the Creative Commons Attribution (CC BY) license (https://creativecommons.org/licenses/by/4.0/).