Article

Modeling of Chatter Stability for the Robot Milling of Natural Marble

Institute of Manufacturing Engineering, Huaqiao University, Xiamen 361021, China
*
Author to whom correspondence should be addressed.
Machines 2024, 12(12), 942; https://doi.org/10.3390/machines12120942
Submission received: 4 November 2024 / Revised: 12 December 2024 / Accepted: 16 December 2024 / Published: 21 December 2024
(This article belongs to the Section Material Processing Technology)

Abstract

:
Industrial robots are widely used in the field of processing because of their many advantages, such as their high flexibility and wide processing range, but the chatter phenomenon limits their application. In this study, a chatter model for the robot milling of natural marble is established that analyzes the effect of the milling parameters and position. The chatter stability model is first established based on the zeroth-order approximation method, in which the robot milling system is simplified into a vibration system with two degrees of freedom. The milling force coefficients are determined by robot milling experiments, and the modal parameters of the robot milling system are identified based on the single-point excitation and pickup methods, which are essential for the establishment of the chatter stability model. Second, robot milling experiments are conducted to verify the established model, proving its high prediction accuracy. Finally, the effect of the milling parameters and position on the chatter stability of the robot milling system is discussed. These conclusions can be references for the robot milling of natural marble.

1. Introduction

Stone carvings with complex profiles are of great value and are usually processed by hand. However, the low production efficiency and high pollution associated with stone carving have severely restricted its development. Due to their high degree of flexibility, robot milling systems have gradually been introduced into the processing of stone carving in recent years in the place of manual carving. However, the chatter of robot milling systems during the machining process seriously affects the quality of machined surfaces and the lifespan of milling cutters [1,2].
Chatter occurs due to dynamic forces acting within a mechanical system whose frequency is close to the natural frequency of the mechanical system [3,4]. The stability of this chatter can be analyzed via experimental and analytic methods. However, the experimental approach requires a large amount of data, making it time-consuming and inefficient. Therefore, most of the studies that have been conducted have been based on the analytic method. The chatter stability of robot machining systems has been extensively studied [5], and regenerative and mode coupling chatter are the two primary chatter mechanisms in these systems. Pan et al. [6] analyzed the chatter of a robot machining system and found that coupled chatter is more likely to occur when the stiffness of the two directions of the robot system is similar and the cutting forces are medium- or low-frequency signals. In addition, Cordes et al. [7] found that coupled chatter is caused by the low stiffness of the robot milling system when the rotation speed of the milling cutter is low, and regenerative chatter is dominated by the modal parameters of the spindle under similar conditions The conclusions were verified by robot milling experiments using titanium and aluminum alloys, respectively. The influential factors of chatter stability in robot machining systems have been analyzed based on the study of chatter mechanisms. Cen et al. [8] presented a conservative congruence transformation (CCT) stiffness model for avoiding mode coupling chatter. Ji et al. [9] studied the influence of the overhang length of the milling cutter on the stability behavior of robotic milling. When the cutter overhang was increased and the feed direction was along the Y-axis of the robot global coordinate system, the stability lobe diagrams were more consistent with the actual milling state, considering the multi-mode coupling effect. Mao et al. [10], through experiments and Spearman correlation analysis, deduced that mode coupling chatter does not occur in robotic milling. Yang et al. [11] proposed a dual-tree complex wavelet packet transform to extract the energy of different frequency bands, from which the fractional energy entropy is obtained to characterize the chatter state in a robotic mill under various robot posture and cutting parameters.
The analytic method for the determination of chatter stability consists of frequency- and time-domain analyses. The commonly used frequency-domain analysis methods include zeroth-order approximation (ZOA) [12] and the multi-frequency-domain method [13]. Regenerative chatter is more prone to occur at a high spindle rotation speed. A stability lobe diagram (SLD) is the primary method for studying regenerative chatter [5]. Hao et al. [14] used the ZOA method to predict the SLD of robot machining; they proved that the regenerative chatter theory is applicable to robotic high-speed milling, and a number of high-speed slotting aluminum tests were performed to verify the results. Li et al. [15] established a cutting force model and robot structure model to study chatter mechanisms and used the ZOA method to analyze the SLD; the results showed that a fast Fourier transformation and the RMS value of the acoustic emission signals could be used for the detection and verification of chatter in robotic milling. Shi et al. [16] proposed a tool tip frequency response prediction method considering the interface stiffness characteristics of the spindle–tool system for the stability prediction of robotic milling under various posture conditions. Chen et al. [17] proposed an optimized variational mode decomposition (OVMD) with multi-band information fusion and compression technology (MT) to identify chatter; the cross-entropy of the image (CEI) was concluded to be the final indicator for identifying the occurrence of chatter. Lei et al. [18] considered the cross-coupling of the tool tip frequency response function (FRF), based on a multi-task Gaussian process (MTGP) regression model, to predict milling chatter and validated their results experimentally. Tunc et al. [19] identified chatter based on the machined surface and machining nose and studied the influence of the cutting path, type, and machining position on the stability of a robot machining system. Li et al. [20] studied the effects of the machining path, tool clamping position, etc. on the chatter stability of a robot milling system and demonstrated that the dynamic performance of the system and change in machining parameters have an impact on the chatter stability. Xin et al. [21] studied the effect of low-frequency vibrations caused by the robot structure mode and verified their results via experiments with different postures.
Although the chatter stability of robot milling systems has been extensively studied, most research has focused on the milling of metals, and the chatter stability of the robot milling of natural marble has not been reported. Compared to metal, natural marble has a complex composition and uneven structure, which are traits of typical brittle materials. Chatter may lead to tool damage and surface collapse (Figure 1). Therefore, it is essential to study the chatter stability of the robot milling of natural marble.
In this study, a chatter stability model for the robot milling of natural marble is established based on the zeroth-order approximation method. To establish the model, the milling force coefficients are determined by robot milling experiments, and the modal parameters of the robot milling system are identified based on the single-point excitation and pickup methods. The accuracy of the chatter stability model is verified by the robot milling experiments of natural marble. Then, the effects of the milling parameters and position on the chatter stability of the robot milling system are discussed.

2. Experimental Design

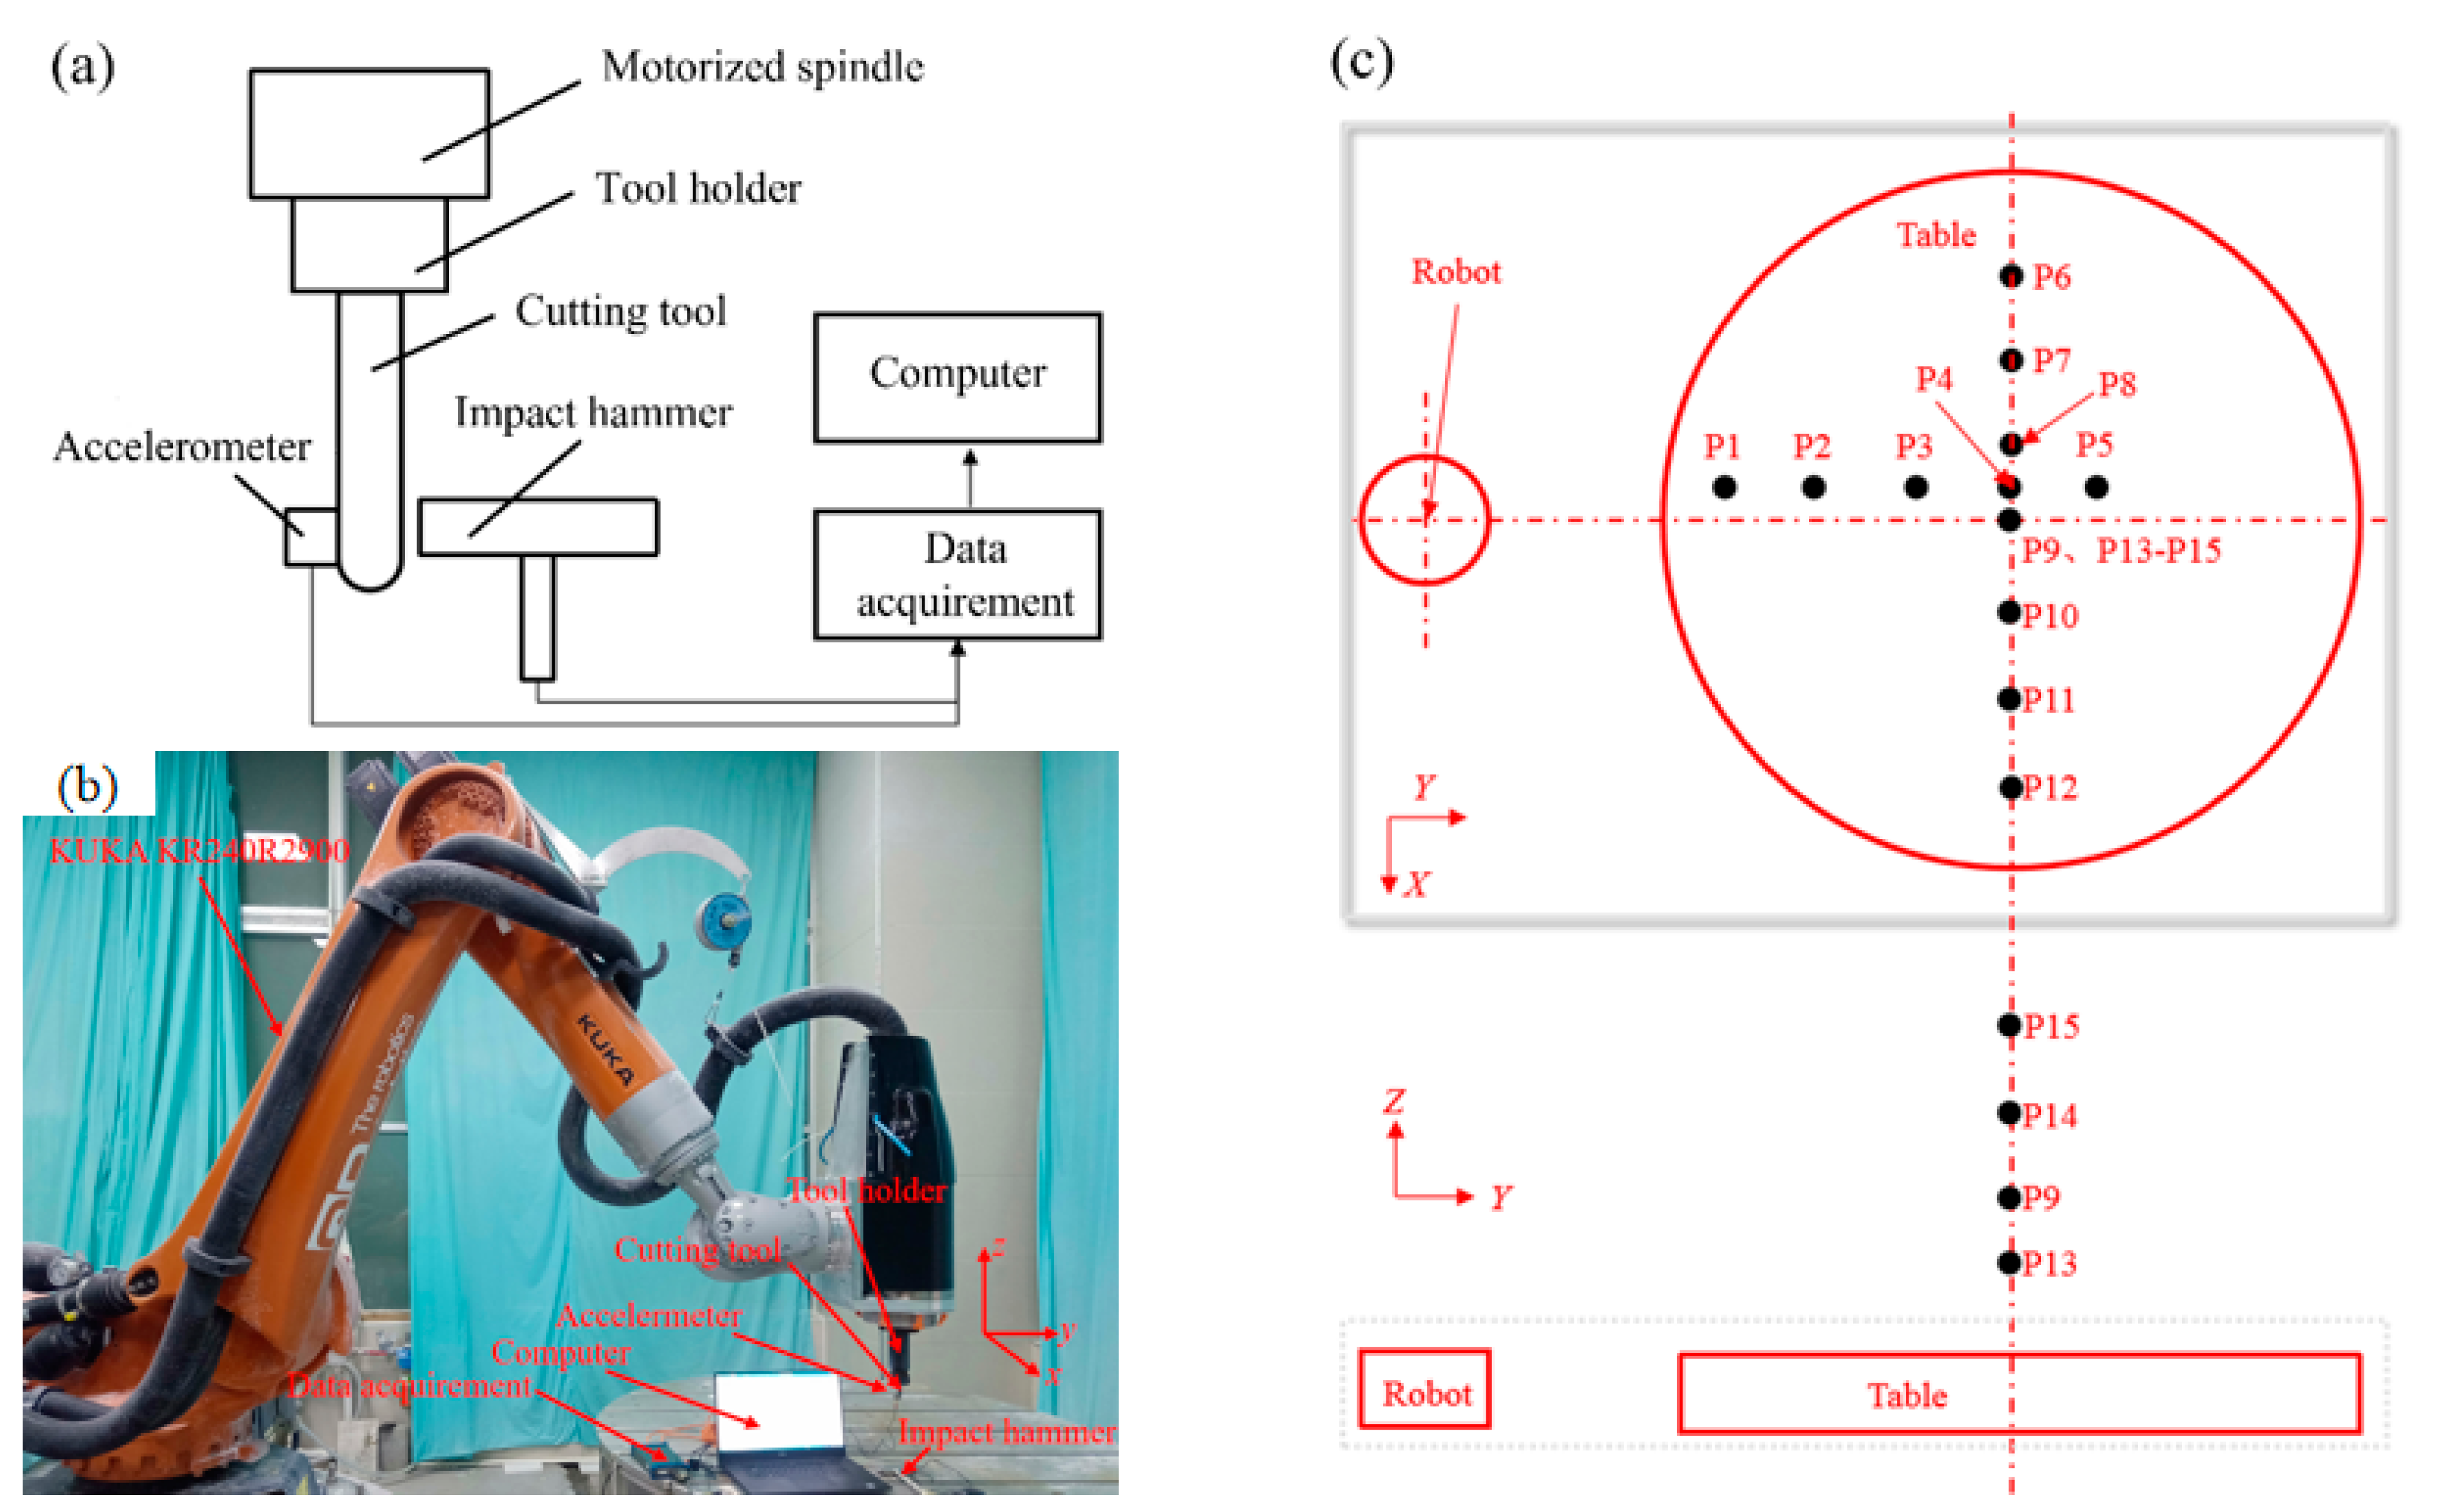
2.1. Description of the Robot Milling System

The robot milling system used in this study is shown in Figure 2; the system is a KUKA KR240R2900 (Augsburg, Germany). The maximum loading, pose repeatability, and maximum working radius are 240 kg, 0.06 mm, and 2860 mm, respectively. The power and maximum rotation speeds of the motorized spindle are 22 kW and 10,000 r/min, respectively. The maximum load and rotation speed are 15 tons and 10 r/min. A ball-end milling cutter made of cemented carbide with a diameter of 10 mm was selected in this study. The number of cutting edges and helix angle are 2 and 30°, respectively.
Natural marble produced in Ya’an, China, with the dimensions of 200 mm × 200 mm × 200 mm, was used as the workpiece. The sample is classified as medium-grained calcite marble with the following characteristics: a composition of more than 99% calcite; 70% medium grain size (1–2 mm); 30% microparticles (0.2–1 mm); significant granular-shaped dynamic recrystallization, with each indented; and a messy distribution.

2.2. Experiments for the Identification of Milling Force Coefficients

Measuring the milling force of the specific milling parameters is the typical method used for the identification of milling force coefficients. In order to eliminate the effects of coaxial error and the run-out of the cutting tool on the experiment results, the slot-milling mode was used in the experiments. In this study, milling experiments with various feeds were designed for the identification of coefficients. Two cutting depths in the axial direction were used to improve the identification. The experimental design is shown in Table 1. All the milling experiments were repeated three times to guarantee the repeatability of the results.
The measurement of milling forces is the basis for the identification of milling force coefficients with high accuracy. A diagram of the milling forces is shown in Figure 3. The milling forces were acquired via a dynamic dynamometer (Kistler 9257B, Winterthur, Switzerland) with an accuracy of 0.1 N and a sampling frequency of 10,000 Hz.

2.3. Experiments for the Identification of Modal Parameters

The single-point excitation and pickup methods were utilized to identify the modal parameters of the robot milling system. As shown in Figure 4a,b, the excitation was implemented by an impact hammer made of nylon. The vibration was sampled using an accelerometer (Shanghai Hongqin Information Technology Co., Ltd. HA0701, Shanghai, China) attached to the milling cutter. The vibration signals were recorded by the data acquirement system (Jiangsu Donghua Test Technology Co., Ltd., DH5981, Jingjiang, China) with a sampling frequency of 5 kHz. Robot milling systems are more flexible compared to other machine tools, and the position of the milling cutter may influence the modal parameters. Therefore, the modal parameters for different milling cutting positions were identified. The positions of the milling cutter designed in this study are shown in Figure 4c; the coordinates of the positions are also listed in Table 2. For all milling cutter positions, the axial of the milling cutter is parallel to the Z-axis.

2.4. Experiments for the Accuracy Verification of the Established Chatter Model

After the identification of the milling force coefficients and modal parameters, the chatter stability model for the process of the robot milling of natural marble was established. In order to verify the accuracy of the established model, two milling experiments with the slot-milling mode at the position of P9 presented in Figure 5 were carried out, in which the milling forces were recorded to evaluate their chatter stability. The experimental design for the accuracy verification is shown in Table 3.

3. Modeling of Chatter Stability

3.1. Model of the Milling Force Coefficients

The analysis of milling forces is the basis for the identification of the milling force coefficients. The milling force coefficient model, established on the basis of the general milling force model, is essential for the identification of the coefficients with high accuracy [22]. In this study, a ball-end mill was used for the analysis of chatter stability. The mechanical model of the ball-end mill is shown in Figure 3.
The average milling forces are expressed as follows:
F x ¯ = F x e + f z F x c F y ¯ = F y e + f z F y c F z ¯ = F z e + f z F z c
where F x ¯ , F y ¯ , and F z ¯ are the average milling forces in the X-, Y-, and Z-directions, respectively. Fxe, Fye, and Fze are the average plowing forces in the X-, Y-, and Z-directions, respectively, and Fxc, Fyc, and Fzc are the average shear forces in the X-, Y-, and Z-directions, respectively.
Therefore, the milling force coefficient can be expressed as follows:
K t c = 2 π N f A 1 × C 3 F x c ( C 2 C 1 ) F y c C 3 2 + ( C 2 C 1 ) 2 K r c = 2 π N f ( A 2 2 + A 3 2 ) × A 2 ( ( C 2 C 1 ) F x c + C 3 F y c ) C 3 2 + ( C 2 C 1 ) 2 A 3 F z c C 5 K a c = 2 π N f ( A 2 2 + A 3 2 ) × A 3 ( ( C 2 C 1 ) F x c + C 3 F y c ) C 3 2 + ( C 2 C 1 ) 2 + A 2 F z c C 5 K t e = 2 π N f B 1 × C 4 F x e + C 5 F y e C 4 2 + C 5 2 K r e = 2 π N f ( B 2 2 + B 3 2 ) × B 2 ( C 5 F x e C 4 F y e ) C 4 2 + C 5 2 + B 3 F z e 2 C 1 K a e = 2 π N f ( B 2 2 + B 3 2 ) × B 2 ( C 5 F x e C 4 F y e ) C 4 2 + C 5 2 B 2 F z e 2 C 1
where Ktc, Krc, and Kac are the shear force coefficients in the tangential, radial, and axial directions, respectively, and Kte, Kre, and Kae are the plowing force coefficients in the tangential, radial, and axial directions, respectively.
A1~A3 and C1~C5 can be determined by the following equations:
A 1 = κ min κ max R sin κ d κ , A 2 = κ min κ max R sin 2 κ d κ , A 3 = κ min κ max R sin κ cos κ d κ , C 1 = 1 2 ϕ ϕ s t ϕ e x , C 2 = 1 4 sin 2 ϕ ϕ s t ϕ e x , C 3 = 1 4 cos 2 ϕ ϕ s t ϕ e x , C 4 = sin ϕ ϕ s t ϕ e x , C 5 = cos ϕ ϕ s t ϕ e x
where κmin and κmax are the maximum and minimum contact angles in the axial direction, and φst and φex are the contact angles in the radial direction when the cutting tool cuts in and out.

3.2. Model of Chatter Stability

The diagram of the vibration system with two degrees during the milling process is shown in Figure 6, which can be described by Equation (4).
m x x ¨ + c x x ˙ + k x x = i = 1 N F x i = F x ( t ) m y y ¨ + c y y ˙ + k y y = i = 1 N F y i = F y ( t )
where mx and my are the mass of the vibration system in the X- and Y-directions, and cx and cy denote the damping of the vibration system in the X- and Y-directions. kx and ky are the stiffness of the vibration system in the X- and Y-directions. N is the number of cutting edges of the ball-end mill, and Fxi and Fyi are the milling forces applied on the cutting edge i.
The milling forces in the frequency domain can be described by Equation (5):
F e i ω c t = 1 2 a p K t c 1 e i ω c T A 0 [ G ( i ω c ) ] F e i ω c t  
where ωc is the chatter frequency, T is the cycle time, [A0] is the mean value of [A(t)], [A(t)] is a periodic function of the tool tooth pass frequency, and [G(c)] is the transmission function matrix of the contact zone between the cutting tools and workpiece.
[A0] can be expressed by the following:
A 0 = 1 φ p ϕ s t ϕ e x [ A ( ϕ ) ] d ϕ = π 2 N α x x α x y α y x α y y
where axx, axy, ayx, and ayy are the direction coefficients, which are described by the following equations:
α x x = j = 0 N 1 g ( ϕ i ) sin ( 2 ϕ i ) + K r ( 1 cos ( 2 ϕ i ) ) α x y = j = 0 N 1 g ( ϕ i ) 1 + cos ( 2 ϕ i ) + K r sin ( 2 ϕ i ) α y x = j = 0 N 1 g ( ϕ i ) 1 cos ( 2 ϕ i ) + K r sin ( 2 ϕ i ) α y y = j = 0 N 1 g ( ϕ i ) sin ( 2 ϕ i ) K r ( 1 + cos ( 2 ϕ i ) )
where Kr is equal to Krc/Ktc.
[G()] is described by Equation (8):
G ( i ω ) = G x x ( i ω ) G x y ( i ω ) G y x ( i ω ) G y y ( i ω )
where Gxx() and Gyy() are the direct transmission functions in the X- and Y-directions, respectively, and Gxy() and Gyx() are the cross-transmission functions in the X- and Y-directions, respectively.
The feature value of Equation (5) is shown in Equation (9):
Λ = N 4 π a p K t c ( 1 e i ω c T )  
Therefore, the feature function of Equation (9) can be determined by Equation (10):
det I + Λ [ G 0 ( i ω c ) ] = 0
The feature value of Equation (10) can be calculated based on the chatter frequency ωc, the milling force coefficients Ktc and Kr, and the radial contact angles φst and φex, as well as the transmission function. The feature function can be simplified to Equation (11) when the cross-transmission function is ignored:
a 0 Λ 2 + a 1 Λ + 1 = 0 a 0 = G x x ( i ω c ) G y y ( i ω c ) ( α x x α y y α x y α y x ) a 1 = α x x G x x ( i ω c ) + α y y G y y ( i ω c )  
The feature value of Equation (11) is shown in the following equation:
Λ = 1 2 a 0 ( a 1 ± a 1 2 4 a 0 )
The feature value of Equation (11) consists of the real and virtual components because Equation (12) is a plural, as shown in Equation (13):
Λ = Λ R + i Λ I
Equation (14) can be obtained based on the Euler formula:
e i ω c T = cos ( ω c T ) i sin ( ω c T )
Therefore, the critical axial cutting depth can be determined based on the following equation:
a plim = 2 π N K t c [ Λ R ( 1 cos ω c T ) + Λ I sin ω c T 1 cos ω c T + i Λ I ( 1 cos ω c T ) Λ R sin ω c T 1 cos ω c T ]  
The virtual part is equal to 0 because aplim is a real number, which is expressed by Equation (16):
Λ I ( 1 cos ω c T ) Λ R sin ω c T = 0  
Therefore, the contact angle in the axial direction can be described by the following equation:
κ = Λ I Λ R = sin ω c T 1 cos ω c T = cos ω c T 2 sin ω c T 2 = tan [ π 2 ω c T 2 ] = tan Ψ
Equation (15) can be converted into Equation (18) based on the aforementioned analysis:
a plim = 2 π Λ R ( 1 + κ 2 ) N K t c
Then, the phase displacement can be determined by the following equations:
Ψ = arctan κ
ε = π 2 Ψ
where ε is the phase shift between the internal and external modulation. If k is an integer multiple of the vibration ripple frequency, the following equation can be obtained:
ω c T = ε + 2 k π
Then, the rotation speed of the spindle can be expressed by the following equation:
n = 60 N ( 2 k + 1 ) π 2 tan 1 ( Λ I / Λ R )

4. Results and Discussion

4.1. Identification of Milling Force Coefficients and Modal Parameters

The typical milling force during the machining of natural marble is shown in Figure 7. The original milling forces were filtered with a low-pass mode to eliminate the influence of the nose on the measured milling forces. The cut-off frequency was determined to be five times the passing frequency of the cutting edge. The comparison of the milling force in the X-direction before and after filtering is shown in Figure 7a. Then, the envelope lines of the filtered milling force were generated to obtain the peak and valley values, as shown in Figure 7b, whose average value was determined as the milling force.
The milling forces for all the experiments described in Table 1 were determined according to the aforementioned method, as shown in Table 4. A linear regression analysis of the milling forces in three directions was carried out, in which the feed per cutting edge fz was selected as the independent variable. The analyzed results are presented in Equations (23) and (24) for axial cutting depths of 5 mm and 6 mm, respectively. The plowing and shear forces were determined according to Equation (1), as shown in Table 5.
F ¯ x = 299.57 + 1121.94 f z ( R 2 = 0.927 ) F ¯ y = 859.37 3886.60 f z ( R 2 = 0.977 ) F ¯ z = 199.73 310.824 f z ( R 2 = 0.806 )  
F ¯ x = 326.69 + 2280.04 f z   ( R 2 = 0.844 ) F ¯ y = 1016.72 5250.08 f z   ( R 2 = 0.890 ) F ¯ z = 159.53 810.54 f z   ( R 2 = 0.675 )  
According to Equation (2) and the milling forces presented in Table 4, the milling force coefficients were determined, as shown in Table 6. The average values for the two axial cutting depths are also given in Table 6. As the axial depth of the cuts varies, different parts of the ball-end mill participate in the milling process. When the axial depth of a cut (ap) is less than or equal to 5 mm, only the ball part participates in the milling operation. When the axial depth of a cut (ap) is greater than 5 mm, both the ball and cylindrical part participate in the milling operation simultaneously. Consequently, the milling force coefficient changes as the axial depth of the cut varies. To improve the accuracy of the input parameters in the chatter stability model, this study takes their average value as the final milling force coefficient.

4.2. Identification of Modal Parameters

The acceleration frequency response function Ha (ω) can be directly obtained by the identification of the modal parameters. The typical acceleration frequency response functions in the X- and Y-directions are shown in Figure 8. The identified modal parameters for different positions of the milling cutter are listed in Table 7.

4.3. Accuracy Verification of the Established Chatter Model

According to the identified milling force coefficients and modal parameters, the stability lobe diagram of P9 was drawn, as shown in Figure 5. The value of the peak rises while the value of the valley is constant as the rotation speed increases. The value of the valley is the minimum critical axial cutting depth (aplim)min. The stability lobe diagram is divided into absolute stable, conditional stable, and chatter zones. In the absolute zone, the milling process is always stable for all rotation speeds. In the conditional stable zone, the milling process is stable when the milling parameters meet the specific conditions. The chatter occurs in the chatter zone. In order to improve machining efficiency, the milling parameters are usually determined in the conditional stable zone. It could also be concluded that an increase in the rotation speed helps avoid the occurrence of chatter. Although natural marble belongs to the brittle material type, and its properties are not similar to metal materials, the stability lobe diagram of natural marble is similar to that of metal materials, and the value of (aplim)min is also near [23]. It can be concluded that the experiments A and B listed in Table 3 are in a state of stability and non-stability, respectively. A fast Fourier transformation (FFT) of the milling forces of experiments A and B was implemented.
As shown in Figure 9, the signals of experiment A consisted of the frequency of the spindle rotation, the passing frequency of the cutting edge, and the frequency multiplication of the above two frequencies, which proved that the robot milling system was stable during the implementation of experiment A. With regard to the results of experiment B presented in Figure 10, an additional bifurcation frequency was found for both milling forces in the X- and Y-directions, which illustrated the non-stability of experiment B. The chatter stability of both experiments A and B can be predicted by the model established in this study, which proves that the established chatter model has a high accuracy.

4.4. Effect of Milling Parameters and Position on Chatter Stability

4.4.1. Effect of Milling Parameters on Chatter Stability

The stability lobe diagrams for the different radial cutting depths at point P9 are shown in Figure 11a. The minimum critical axial cutting depths for the different radial cutting depths are also presented in Figure 11b. It can be found that the minimum critical axial cutting depth declines with an increase in the radial cutting depth. However, the decline rate decreases as the radial cutting depth increases. The increase rate of the stability lobe diagram from the valley to the peak increases with an increase in the radial cutting depth, which means that the area of the conditional stable zone grows with the increase in the radial cutting depth.

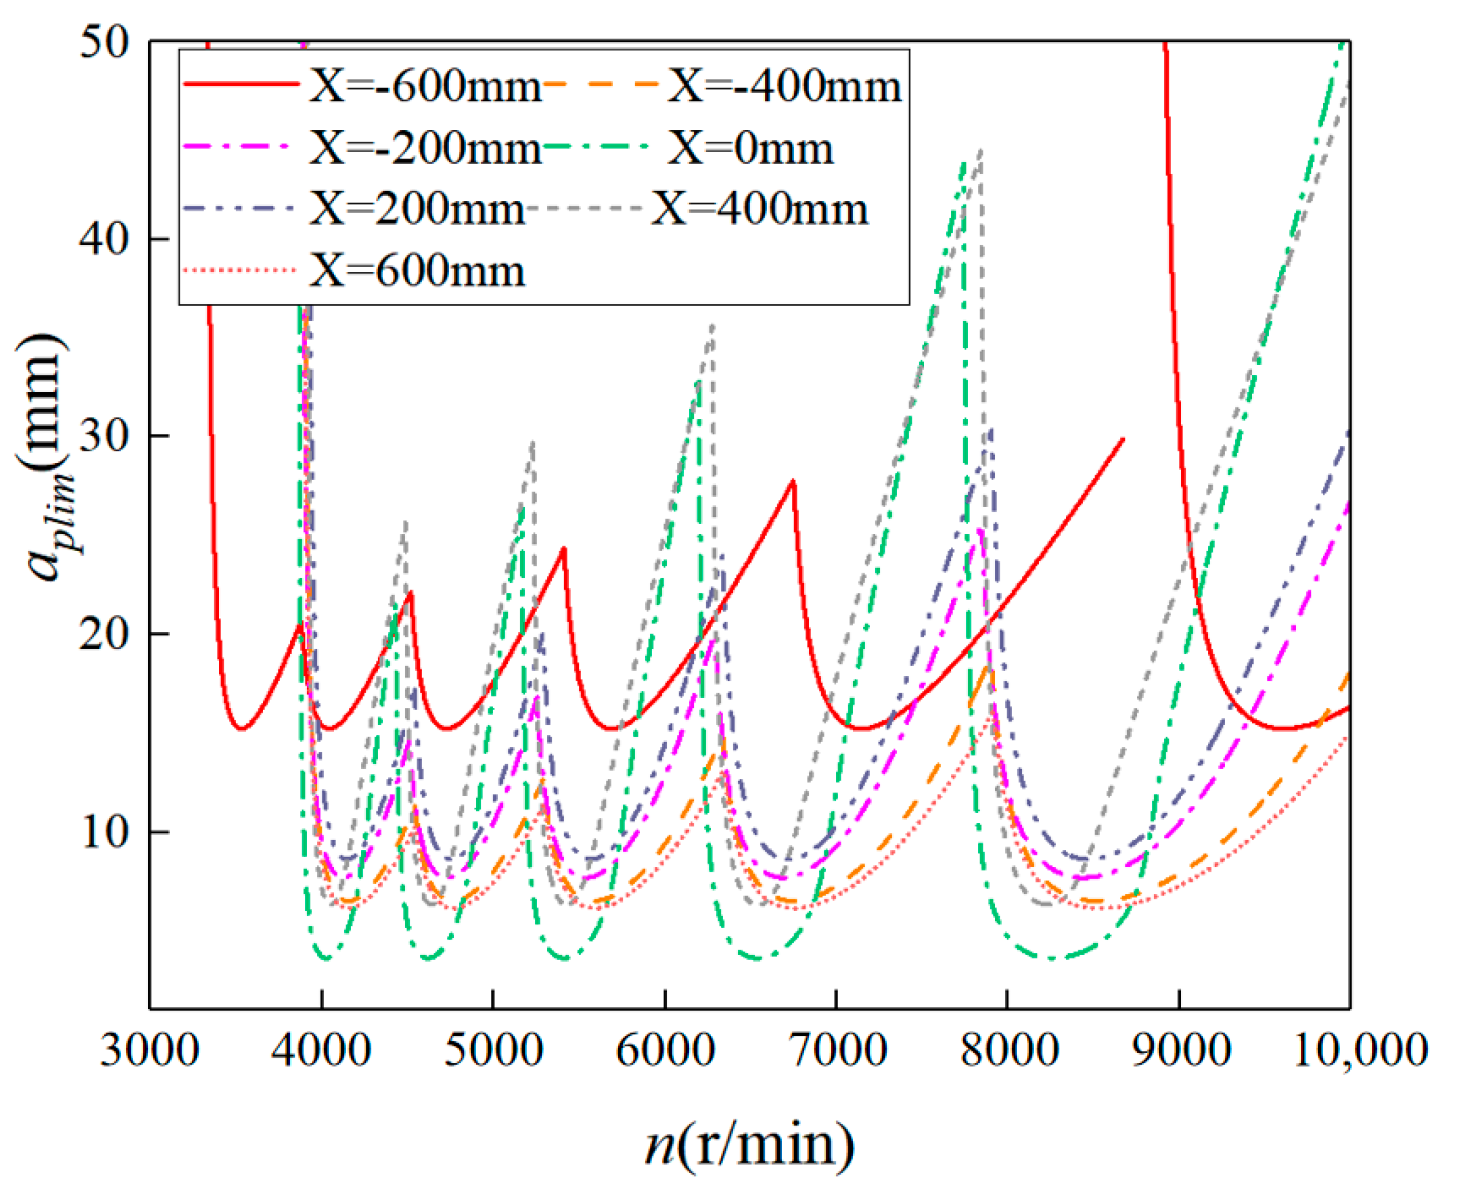
4.4.2. Effect of Milling Position on Chatter Stability

When the coordinate values in the Y- and Z-directions are constant (Y = 2000.07 mm, Z = 474.4 mm), the stability lobe diagrams for different measurement positions in the X-direction are shown in Figure 11. The stability lobe diagram for the coordinate values of 0 mm in the X-direction is the reference. The stability lobe diagram for the coordinate values of −600 mm in the X-direction moves toward the upper and left directions because of an increase in damping and a decrease in natural frequency in the Y-direction, respectively, which improves the stability of the robot milling system. The stability lobe diagram for the coordinate values of 400 mm in the X-direction slightly moves toward the upper direction, which also enhances the stability of the robot milling system. For the other stability lobe diagrams presented in Figure 12, their peaks decline significantly, which reduces stability.
When the coordinate values in the X- and Z-directions are constant (X =−19.5 mm, Z = 474.4 mm), the stability lobe diagrams for different measurement positions in the X-direction are shown in Figure 13. The stability lobe diagram with coordinate values of 2000.07 mm in the Y-direction is set as the reference. As the milling cutter moves in the positive Y-direction, the minimum critical axial cutting depth is constant, and the peak of the stability lobe diagram increases significantly, which makes the robot milling system more stable. The peak of the stability lobe diagram rises obviously and then declines when the milling cutter moves along the negative Y-direction.
When the coordinate values in the X- and Y-directions are constant (X = 0 mm, Y = 2000.07 mm), the stability lobe diagrams for different measurement positions in the X-direction are shown in Figure 14. The stability lobe diagram with the coordinate values of 474.4 mm in the Z-direction is set as the reference. As the milling cutter moves downward, the minimum critical axial cutting depth decreases from 3.63 mm to 2.88 mm, and the peak of the stability lobe diagram declines significantly because of a decrease in stiffness, which makes the robot milling system more unstable. As the milling cutter moves upward, the minimum critical axial cutting depth declines then increases, while the peak of the stability lobe diagram decreases continuously, which worsens the stability of the robot milling system.

4.5. Industrial Applications

The chatter model constructed in this study relates to robot milling along the negative Z-axis. It investigated the modal parameters in different regions of the XY plane of the worktable and at different positions along the Z-direction and further examined their influences on the stability lobe diagram.
Computer-aided manufacturing (CAM) programming was used in the context of stone carving, which involves the machining of complex geometries. Codes were generated following off-line simulation. Any changes in the radial or axial depth of cuts would significantly increase the complexity of the programming and therefore the machining efficiency. Similarly, changes in the feed rate would also affect machining efficiency. In contrast, adjusting the spindle speed to ensure that machining remains within a stable region is a relatively simple and practical approach.
Based on the effect of the milling position on chatter stability, as presented in Section 4.4.2, when machining along the Z-axis from top to bottom, when the spindle speed reaches its maximum value of 10,000 rpm, the critical axial cutting depths, except for the case where X = −600 mm, are all at elevated levels. This eliminates the need to adjust the spindle speed at different positions, thereby reducing programming time. Consequently, in practical carving applications, consideration should be given to machining at a spindle speed of 10,000 rpm. It should be noted, however, that the continuous use of the maximum spindle speed over a long period of time is detrimental to the life of the spindle, so careful monitoring of its condition is essential.
This model can be used to analyze machining operations in other directions, providing a valuable guide to carving operations.

5. Conclusions

In this study, a chatter stability model for the robot milling of natural marble was established, and the accuracy of the established model was verified experimentally. Our conclusions are as follows:
  • An accurate chatter stability model for the robot milling of natural marble can be established based on the zeroth-order approximation method.
  • With an increase in the radial cutting depth, the minimum critical axial cutting depth decreases sharply and then stabilizes, and the area of the absolute stable zone decreases sharply, while the conditional stable zone area increases slightly.
    • With the stability lobe diagram of 0 mm in the X-direction as the reference, the stability lobe diagram for the coordinate values of −600 mm in the X-direction moves toward the upper and left directions, which improves the stability of the robot milling system.
  • The stability lobe diagram for the coordinate values of 400 mm in the X-direction slightly moves toward the upper direction, which enhances the stability of the robot milling system.
  • As the milling cutter moves in the positive Y-direction, the minimum critical axial cutting depth is constant, and the peak of the stability lobe diagram increases significantly, which makes the robot milling system more stable. The peak of the stability lobe diagram rises obviously and then declines when the milling cutter moves along the negative Y-direction.
  • As the milling cutter moves upward, the minimum critical axial cutting depth declines then increases, while the peak of the stability lobe diagram decreases continuously, which worsens the stability of the robot milling system.

Author Contributions

All authors contributed to the conception and design of the study. Material preparation, data collection, and analysis were performed by J.H. and H.H. The first draft of the manuscript was written by J.H., and all authors commented on previous versions of the manuscript. All authors have read and agreed to the published version of the manuscript.

Funding

This research was funded by the Fujian Science and Technology Project, grant numbers 2022H0018 and 2022H6029, and Industrial Robot and Intelligent Manufacturing Engineering Research Center of Colleges and Universities in Fujian Province, grant number Gyjq2002.

Data Availability Statement

The datasets used or analyzed during the current study are available from the corresponding author on reasonable request.

Conflicts of Interest

The authors declare no conflicts of interest.

References

  1. Tian, H.; Pang, B.; Liu, J.; Meng, D.; Dang, X. Influence of different position modal parameters on milling chatter stability of orthopedic surgery robots. Sci. Rep. 2024, 14, 10581. [Google Scholar] [CrossRef] [PubMed]
  2. Liao, W.; Zheng, K.; Sun, L.; Dong, S.; Zhang, L. Review on chatter stability in robotic machining for large complex components. Acta Aeronaut. Astronaut. Sin. 2022, 43, 026061. [Google Scholar]
  3. Wu, J.; Tang, X.; Xin, S.; Wang, C.; Peng, F.; Yan, R. Research on the directionality of end dynamic compliance dominated by milling robot body structure and milling vibration suppression. Robot. Comput.-Integr. Manuf. 2024, 85, 102631. [Google Scholar] [CrossRef]
  4. Nie, W.; Zheng, M.; Zhang, W.; Liu, Y.; Bi, Y. Analytical prediction of chatter stability with the effect of multiple delays for variable pitch end mills and optimization of pitch parameters. Int. J. Adv. Manuf. Technol. 2022, 124, 2645–2658. [Google Scholar] [CrossRef]
  5. Liu, Z.; Deng, Z.; Yi, L.; Ge, J.; Yang, P. A review of research on robot machining chatter. Int. J. Adv. Manuf. Technol. 2024, 135, 49–79. [Google Scholar] [CrossRef]
  6. Pan, Z.; Zhang, H.; Zhu, Z.; Wang, J. Chatter analysis of robotic machining process. J. Mater. Process. Technol. 2006, 173, 301–309. [Google Scholar] [CrossRef]
  7. Cordes, M.; Hintze, W.; Altintas, Y. Chatter stability in robotic milling. Robot. Comput.-Integr. Manuf. 2019, 55, 11–18. [Google Scholar] [CrossRef]
  8. Cen, L.; Melkote, S.N. CCT-based mode coupling chatter avoidance in robotic milling. J. Manuf. Process. 2017, 29, 50–61. [Google Scholar] [CrossRef]
  9. Ji, Y.; Liu, R. Research on the influence of cutter overhang length on robotic milling chatter stability. Sci. Rep. 2024, 14, 24838. [Google Scholar] [CrossRef]
  10. Mao, S.-H.; Ye, S.-T.; Jiang, Y.-R.; Shen, C.-Q.; Zhang, X.-J.; Yan, S.-J.; Ding, H. On the existence of mode-coupling chatter in robotic milling based on chatter type indicators extracted by dynamic mode decomposition. Mech. Syst. Signal Process. 2024, 220, 111591. [Google Scholar] [CrossRef]
  11. Yang, B.; Guo, K.; Zhou, Q.; Sun, J. Early chatter detection in robotic milling under variable robot postures and cutting parameters. Mech. Syst. Signal Process. 2023, 186, 109860. [Google Scholar] [CrossRef]
  12. Altintaş, Y.; Budak, E. Analytical Prediction of Stability Lobes in Milling. CIRP Ann. 1995, 44, 357–362. [Google Scholar] [CrossRef]
  13. Budak, E.; Altintas, Y. Analytical prediction of chatter stability in milling-Part I general formulation. J. Dyn. Syst. Meas. Control ASME 1998, 120, 22–30. [Google Scholar] [CrossRef]
  14. Hao, D.; Wang, W.; Liu, Z.; Yun, C. Experimental study of stability prediction for high-speed robotic milling of aluminum. J. Vib. Control 2020, 26, 387–398. [Google Scholar] [CrossRef]
  15. Li, M.; Huang, D.; Yang, X. Chatter stability prediction and detection during high-speed robotic milling process based on acoustic emission technique. Int. J. Adv. Manuf. Technol. 2021, 117, 1589–1599. [Google Scholar] [CrossRef]
  16. Guihong, S.; Zhiqiang, L.; Yuchao, D.; Yi, Y.; Sichen, C.; Zirui, G.; Haoran, Z.; Zhibing, L.; Tianyang, Q.; Xibin, W. Stability prediction for robotic milling based on tool tip frequency response prediction by considering the interface stiffness of spindle-tool system. J. Sound Vib. 2024, 585, 118471. [Google Scholar] [CrossRef]
  17. Chen, S.; Liang, Z.; Du, Y.; Gao, Z.; Zheng, H.; Liu, Z.; Qiu, T.; Wang, X. Early chatter identification based on optimized VMD with multi-band information fusion and compression method in robotic milling process. Chin. J. Aeronaut. 2024, 37, 464–484. [Google Scholar] [CrossRef]
  18. Lei, Y.; Hou, T.; Ding, Y. Prediction of the Posture-Dependent Tool Tip Dynamics in Robotic Milling Based on Multi-Task Gaussian Process Regressions. Robot. Comput.-Integr. Manuf. 2023, 81, 102508. [Google Scholar] [CrossRef]
  19. Tunc, L.T.; Stoddart, D. Tool path pattern and feed direction selection in robotic milling for increased chatter-free material removal rate. Int. J. Adv. Manuf. Technol. 2017, 89, 2907–2918. [Google Scholar] [CrossRef]
  20. Li, J.; Li, B.; Shen, N.; Qian, H.; Guo, Z. Effect of the cutter path and the workpiece clamping position on the stability of the robotic milling system. Int. J. Adv. Manuf. Technol. 2016, 89, 2919–2933. [Google Scholar] [CrossRef]
  21. Xin, S.; Peng, F.; Tang, X.; Yan, R.; Li, Z.; Wu, J. Research on the influence of robot structural mode on regenerative chatter in milling and analysis of stability boundary improvement domain. Int. J. Mach. Tools Manuf. 2022, 179, 103918. [Google Scholar] [CrossRef]
  22. Mann, B.P.; Edes, B.T.; Easley, S.J.; Young, K.A.; Ma, K. Chatter vibration and surface location error prediction for helical end mills. Int. J. Mach. Tools Manuf. 2008, 48, 350–361. [Google Scholar] [CrossRef]
  23. Mejri, S.; Gagnol, V.; Le, T.-P.; Sabourin, L.; Ray, P.; Paultre, P. Dynamic characterization of machining robot and stability analysis. Int. J. Adv. Manuf. Technol. 2015, 82, 351–359. [Google Scholar] [CrossRef]
Figure 1. Chatter causes (a) tool damage and (b) surface collapse.
Machines 12 00942 g001
Figure 2. The robot milling system.
Machines 12 00942 g002
Figure 3. Diagram of the measurement of milling forces.
Machines 12 00942 g003
Figure 4. Identification of the modal parameters: (a) diagram of the measurement process; (b) the measurement equipment; and (c) distribution of the measurement positions.
Machines 12 00942 g004
Figure 5. Stability lobe diagram of the measurement point P9.
Machines 12 00942 g005
Figure 6. Diagram of the vibration system with two degrees for the milling process.
Machines 12 00942 g006
Figure 7. The typical milling force in the X-direction: (a) comparison of the milling forces in the X-direction before and after filtering; (b) milling force signals with envelope lines.
Machines 12 00942 g007
Figure 8. Typical acceleration frequency response functions in the X- and Y-directions.
Machines 12 00942 g008
Figure 9. Amplitude–frequency diagram of experiment A: (a) amplitude–frequency diagram in the X-direction; (b) amplitude–frequency diagram in the Y-direction.
Machines 12 00942 g009
Figure 10. Amplitude–frequency diagram of experiment B: (a) amplitude–frequency diagram in the X-direction; (b) amplitude–frequency diagram in the Y-direction.
Machines 12 00942 g010
Figure 11. (a) Stability lobe diagrams for different radial cutting depths and (b) minimum critical axial cutting depths for different radial cutting depths.
Machines 12 00942 g011
Figure 12. Stability lobe diagrams for different measurement positions in the X-direction.
Machines 12 00942 g012
Figure 13. Stability lobe diagrams for different measurement positions in the Y-direction.
Machines 12 00942 g013
Figure 14. Stability lobe diagrams for different measurement positions in the Z-direction.
Machines 12 00942 g014
Table 1. Experimental design for the identification of the milling force coefficients.
No. Rotation Speed
n (r/min)
Feed per Cutting Edge
fz (mm/z)
Axial Cutting Depth
ap (mm)
180000.055
280000.105
380000.155
480000.056
580000.106
680000.156
Table 2. The coordinates of the milling cutter positions.
No.X (mm)Y (mm)Z (mm)No.X (mm)Y (mm)Z (mm)
P1−19.51262.61474.4P902000.07474.4
P2−19.51598.97474.4P102002000.07474.4
P3−19.51874.79474.4P114002000.07474.4
P4−19.52000.07474.4P126002000.07474.4
P5−19.52249.98474.4P1302000.07350
P6−6002000.07474.4P1402000.07600
P7−4002000.07474.4P1502000.07800
P8−2002000.07474.4
Table 3. Experimental design for the accuracy verification of the established model.
No.Rotation Speed
n (r/min)
Feed per Cutting Edge
fz (mm/z)
Axial Cutting Depth
ap (mm)
Radial Cutting Depth
ae (mm)
Exp. A75000.157.55
Exp. B81000.1555
Table 4. Average milling forces for the different milling experiments.
No.Fx (N)Fy (N)Fz (N)
1364.76−1070.83188.60
2393.59−1213.78159.83
3476.95−1459.49157.52
4412.45−1225.90183.56
5611.19−1648.38271.77
6640.45−1750.91263.71
Table 5. Plowing and shear forces for the different axial cutting depths.
ap (mm)Fxe (N)Fxc (N)Fye (N)Fyc (N)Fze (N)Fzc (N)
5299.571121.94−859.37−3886.60199.73−310.82
6326.692280.04−1016.72−5250.08159.53801.54
Table 6. Milling force coefficients for the machining of natural marble.
Ktc
(N/mm2)
Krc
(N/mm2)
Kac
(N/mm2)
Kte
(N/mm)
Kre
(N/mm)
Kae
(N/mm)
ap = 5 mm1554.64350.28347.33125.0653.4922.24
ap = 6 mm1755.71851.55160.76117.3345.0126.47
Average values1655.18600.91254.04121.2049.2524.35
Table 7. Identified modal parameters.
X-DirectionY-Direction
No.ω (Hz)ζ (%)K (m × N−1)ω (Hz)ζ (%)K (m × N−1)
P1820.9332.9981.91 × 1071013.0551.9852.31 × 107
P2821.0023.0121.90 × 1071023.6282.5651.83 × 107
P3826.2402.9191.91 × 1071032.8862.1002.70 × 107
P4820.8062.4452.33 × 1071034.2353.0411.96 × 107
P5821.8492.9101.85 × 1071023.2132.5642.29 × 107
P6823.9933.1491.54 × 107841.0725.1431.12 × 107
P7826.1482.392.05 × 1071026.9793.2281.81 × 107
P8827.7412.7111.78 × 1071021.6302.9631.91 × 107
P9825.0263.4671.40 × 1071026.2901.9742.69 × 107
P10824.8493.2031.55 × 1071029.1592.5961.98 × 107
P11890.2247.2389.72 × 1061031.7913.0821.72 × 107
P12822.2352.3742.42 × 1071027.2562.5521.86 × 107
P13827.7792.9081.83 × 1071025.5872.3781.99 × 107
P14823.0282.9971.76 × 1071023.5102.9771.83 × 107
P15825.1232.4782.00 × 1071034.0813.2211.97 × 107
ω—frequency; ζ—damping ratio; K—stiffness.
Disclaimer/Publisher’s Note: The statements, opinions and data contained in all publications are solely those of the individual author(s) and contributor(s) and not of MDPI and/or the editor(s). MDPI and/or the editor(s) disclaim responsibility for any injury to people or property resulting from any ideas, methods, instructions or products referred to in the content.

