Article

Multiple Electromechanical-Failure Detection in Induction Motor Using Thermographic Intensity Profile and Artificial Neural Network

by
Emmanuel Resendiz-Ochoa
1,
Salvador Calderon-Uribe
2,
Luis A. Morales-Hernandez
2,
Carlos A. Perez-Ramirez
3 and
Irving A. Cruz-Albarran
1,*
1
Artificial Intelligence Systems Applied to Biomedical and Mechanical Models, Faculty of Engineering, Autonomus University of Queretaro, Campus San Juan del Rio, Rio Moctezuma 249, Col. San Cayetano, San Juan del Rio 76807, Queretaro, Mexico
2
Mechatronics, Faculty of Engineering, Autonomus University of Queretaro, Campus San Juan del Rio, Rio Moctezuma 249, Col. San Cayetano, San Juan del Rio 76807, Queretaro, Mexico
3
Artificial Intelligence Systems Applied to Biomedical and Mechanical Models, Faculty of Engineering, Autonomus University of Queretaro, Campus Aeropuerto, Carretera a Chichimequillas S/N, Ejido Bolanos, Santiago de Queretaro 76140, Queretaro, Mexico
*
Author to whom correspondence should be addressed.
Machines 2024, 12(12), 928; https://doi.org/10.3390/machines12120928
Submission received: 1 November 2024 / Revised: 4 December 2024 / Accepted: 16 December 2024 / Published: 17 December 2024

Abstract

The use of artificial intelligence-based techniques to solve engineering problems is increasing. One of the most challenging tasks facing industry is the timely diagnosis of failures in electromechanical systems, as they are an essential part of production systems. In this sense, the earlier the detection, the higher the economic loss reduction. For this reason, this work proposes the development of a new methodology based on infrared thermography and an artificial intelligence-based classifier for the detection of multiple faults in an electromechanical system. The proposal combines the intensity profile of the grey-scale image, the use of Fast Fourier Transform and an artificial neural network to perform the detection of twelve states for the state of an electromechanical system: healthy, bearing defect, broken rotor bar, misalignment and gear wear on the gearbox. From the experimental setup, 50 thermographic images were obtained for each state. The method was implemented and tested under different conditions to verify its reliability. The results show that the precision, accuracy, recall and F1-score are higher than 99%. Thus, it can be concluded that it is possible to detect multiple conditions in an electromechanical system using the intensity profile and an artificial neural network, achieving good accuracy and reliability.

1. Introduction

The new industrial revolution, known as Industry 4.0, has led to the transformation of conventional industrial processes into new and complex ones, based on the implementation of new technologies to overcome the challenges of modern industrial processes. In this sense, electromechanical systems are used in various industrial applications, in which different interconnected elements intervene, such as induction motors (IM), gearboxes (GB), mechanical couplings, transmission shafts, pulleys, and belts or conveyors [1]. The IM and the GB are the most common elements in electromechanical systems installed in industrial processes, since they play a key role in the efficiency of the process; therefore, the use of these elements is due to their robustness, efficiency and versatility [2,3]. However, the implementation of these elements requires a smooth and fault-free operation in the harsh conditions of the industrial environment. In fact, the occurrence of IM and GB failures can result in reduced production, lost revenue and energy loss, which ultimately represents a major challenge to ensuring smooth industrial operation. Furthermore, it should be noted that the continuous use of defective equipment (IM and GB) within the industrial process can affect the performance of other mechanically or electrically connected equipment. Therefore, the monitoring and timely detection of faults in electromechanical systems is of paramount importance for the safety, long life and high efficiency of the manufacturing process [4,5].
Strategies for condition monitoring and fault detection in both IM and GB should be a mandatory task in industrial processes because it allows to ensure the correct functioning and optimal state of the industrial equipment. Monitoring and fault detection have traditionally been performed by applying different methods or strategies to evaluate the actual state of electromechanical systems. Among the most prominent classical techniques, vibration-based analysis has been shown to provide effective fault detection. However, it is an invasive method that involves mounting various sensors on rigid parts closest to the element to be monitored, which compromises the safety of the technician performing the monitoring as well as the operation of the process [6,7,8]. Motor Current Signature Analysis (MCSA) is another classic technique widely used for monitoring and fault detection, which is an invasive technique as it uses sensors that must be placed at the electrical connection [9,10,11]. On the other hand, sound-based analysis and torque-based analysis are approaches that are also used to achieve condition monitoring and evaluation, since these physical quantities are equally affected by the occurrence of faults. However, condition monitoring using sound and torque signals is still being researched and its implementation is limited because the measurement of torque signals is invasive, and the detection of sound signals is subject to background noise from other processes [12,13,14,15]. Detection and identification of faults in IM and GB can be achieved by processing vibrations, stator currents, sound, and torque, among others, but the complexity increases depending on the signal processing technique used. Techniques such as the Fast Fourier Transform (FFT) and the Wavelet Transform (WT) are the most used for signal processing because it has been shown that by increasing the amplitude of the frequency patterns associated with faults (in the frequency and/or time-frequency domain), it is possible to detect and classify faults. However, when using this type of technique, knowledge, skill and experience are required to interpret the results to make an accurate diagnosis [16,17].
In recent years, infrared thermography has emerged as a technology that can be integrated to monitor the condition of an electromechanical system. Since IRT is a non-invasive, non-destructive technology with a wide monitoring range, this technique, if properly implemented, can provide an adequate solution to the fault detection methods in IM and GB [18]. In the literature, it is reported that thermography-based diagnosis can be performed by three main approaches, which are: manual inspection, semi-automatic diagnosis and intelligent fault identification [19]. Nowadays, the implementation of artificial intelligence (AI)-based methods is being used to propose novel methods for monitoring, detecting and automatically classifying faults in electromechanical systems. This involves the implementation of advanced AI methods such as machine learning (ML) and deep learning (DL) for automatic feature extraction without the interference of human expertise; furthermore, automatic fault classification is achieved without the need for expert judgement in the field [20]. The specific flow of IRT-based rotating machinery fault diagnosis methods are infrared thermal image acquisition, image pre-processing, feature parameter extraction and fault diagnosis. Therefore, various AI methods based on supervised and unsupervised learning are implemented for automatic fault classification in electromechanical systems, and among the most used are linear and logistic regression, Naive Bayes, decision tree, k-means, k-nearest neighbor (kNN), support vector machine (SVM), multilayer perceptron (MLP) [21,22,23]. More recently, DL has been incorporated for accurate fault detection and classification; in fact, the implementation of DL techniques with thermographic imaging has been used to assess the condition of electromechanical systems [24,25,26]. In this sense, a convolutional neural network (CNN) is the most common DL technique used as an intelligent algorithm that performs defect classification by processing infrared thermography. More precisely, CNN is a technique that allows the direct evaluation of thermographic images, and although precise results are obtained, they are composed of complex structures that generate a high computational load, since the training procedures require a significant amount of available data [27,28,29]. However, with technological and scientific progress, this has been constantly reduced. In this sense, different methodologies have been reported in which IRT is applied to the monitoring of conditions in the IM and GB. For example, Li et al. [27] proposed a methodology based on a support vector machine (SVM) to detect different conditions in gearboxes from IRT. They obtained an average accuracy of 91% for failures such as pitted, broken, missing and cracked teeth. Glowacz [30] proposed a method based on IRT for the detection of broken bars in the induction motor. He implemented a fusion of different histogram algorithms to extract features from IRT images and used a Long Short-Term Memory (LSTM) neural network to classify the type of failure, obtaining an accuracy range between 95 and 100%. Sharma et al. [31] implemented IRT with a convolutional neural network (CNN) and detected whether an IM had a failure due to a damaged bearing, achieving a detection accuracy between 90 and 99%. They concluded that this accuracy improves with the extent and location of bearing damage. They also noted that the size of the dataset should be considered to obtain the best possible results. Similar conclusions have been reported by [32,33,34]. In this regard, some aspects can be concluded from the presented works: (1) to the authors’ knowledge, the proposal of new methodologies for the study of multi-faults that can occur in IM and GB with IRT is still missing, and (2) the implementation of signal processing methods, such as FFT, which allow them to be implemented from thermal images, are not considered in methodologies for fault detection on IM and GB.
Therefore, this work proposes a non-invasive and non-destructive methodology that allows the automatic classification of multiple failures in an electromechanical system, focusing on the analysis of MI and GB by means of IRT and AI. The methodology processes thermographic images to obtain the operating conditions of MI and GB with their thermal behavior. Once the IRTs are obtained, digital processing of the image is carried out to obtain the intensity profile, which consists of a graphical representation used to analyze the intensity variation through the image columns. Once the intensity profile is obtained, the implementation of a multilayer perceptron (MLP) is proposed for the classification of the proposed multiple faults present in the electromechanical system of this work. For this type of classification problem, the non-linearity is defined by the SoftMax activation function. Initially, the methodology is implemented for the classification of several conditions for the IM: healthy state (HTL), bearing defect (BD), broken rotor bar (BRB) and mechanical misalignment (MAL), as well as conditions in the GB: 50% and 75% wear on the gear teeth. To reinforce and increase the classification accuracy of the method, an FFT is applied to the intensity profile obtained from the IRT, which allows the extraction of the behavior of the signals in the frequency domain, and this signal is sent directly to the MLP for classification, obtaining an increase in the accuracy of classification of the different faults in the IM and GB. Finally, to test the robustness of the methodology, the IRT images are mirrored, and their intensities are modified, both to increase the size of the database and to analyze multiple faults in an electromechanical system.

2. Methodology

This section describes the proposed methodology for a fault detection system in IM. The main objective of this study is to develop a system that allows the classification of twelve different conditions in IM and GB using the temperature variation measured by thermographic images. Figure 1 shows an overview of the proposed methodology. From this figure it can be seen that a comparison of the system is carried out using two different approaches, divided into three phases: pre-processing, training validation and testing (classification and visualization). In both comparisons, during the pre-processing stage, the intensity profile of the image is calculated to extract temperature variations based on the pixel intensity value. However, in the second method, the frequency content of the intensity profile is obtained by calculating FFT. In the training and validation stage, the intensity profile vector is used as a feature set to train the classification model based on artificial neural networks. Finally, for the testing stage, the intensity profile vectors are extracted from another set of images to evaluate the classifier and measure the model performance.
The proposed methodology was developed and tested in a standard computing environment with an Intel Core i5 9th generation processor at 3.6GHz, a GTX 1050 graphics card, and 12 GB of RAM.

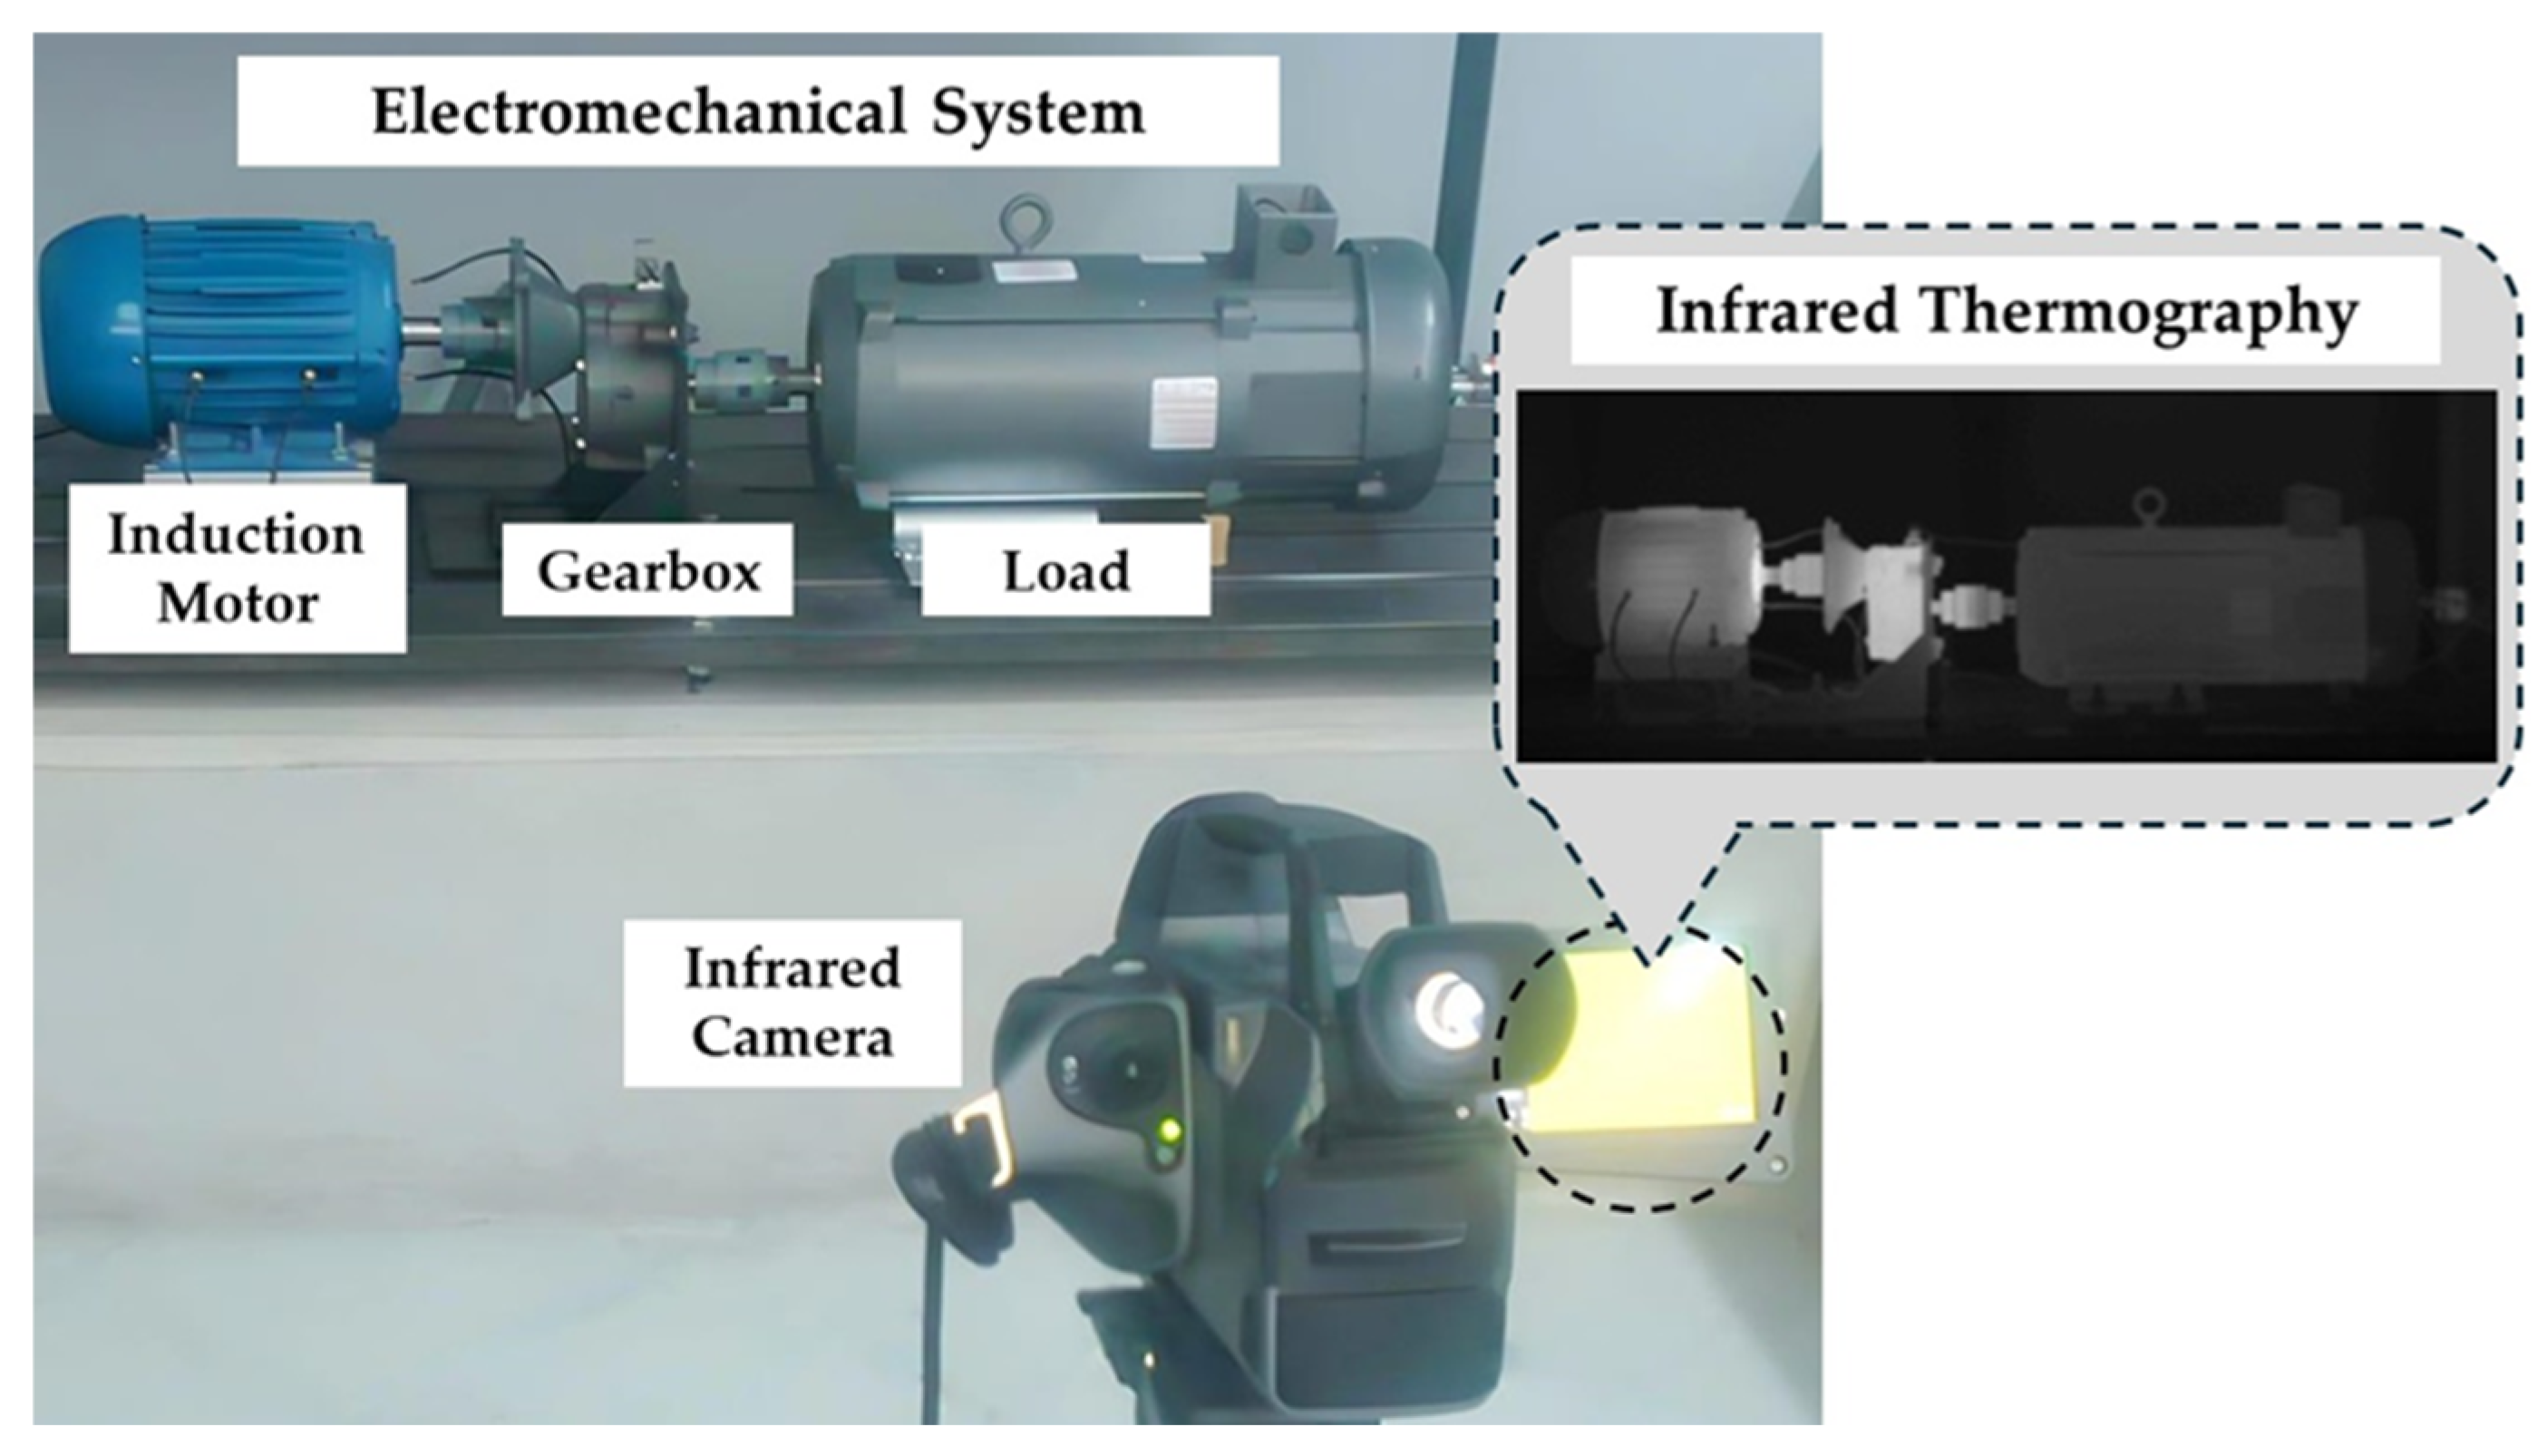
2.1. Experimental Setup

This work is based on the experiment documented in [33]. The main innovation of this research is a robust methodology that, through intelligent algorithms, is able to automatically classify multiple faults (12 different conditions) that can occur in the primary components of an electromechanical system, including the induction motor and the gearbox. Figure 2 shows the configuration of the system to be tested; the thermographic image is in grey scale. The tests are carried out on an electromechanical system whose main elements are the induction motor and the gearbox. The test bench consists of a 1.5 kW three-phase induction motor (WEG00236ET3E145T-W22) electrically connected to a variable frequency drive (VFD) (WEGCFW08) for power supply and speed control. This electrical element is mechanically coupled by a rigid coupling to a 4:1 gearbox (BALDOR GCF4 X 01AA) which drives its input shaft. This gearbox is used to test the different levels of uniform wear in the gears analyzed in this paper. In addition, the gearbox is mechanically coupled by a rigid coupling to a DC generator motor (BALDOR CDP3604). This generator is the load that produces approximately 20% of the nominal load of the induction motor under working conditions. The impact of the load applied to an electromechanical system is important to consider, particularly in the case of induction motors, as this can significantly influence the potential for failure. When the load is not uniform, unbalanced forces can be generated, resulting in mechanical vibrations. This can result in bearing fatigue, mechanical clearances in the coupling between the motor and the load (misalignment), accelerated wear in the gears, and other failures. Furthermore, when mechanical vibrations are present, a temperature differential is produced due to the increase in friction [34].
A thermographic infrared camera (model FLIR GF320, manufactured by FLIR Systems Incorporated) is used as the data acquisition sensor to monitor the thermal behavior of the induction motor and gearbox. The FLIR GF320 has a resolution of 320 × 240 (76,800) pixels, a spectral range of 3.2–3.4 µm and a thermal sensitivity/noise equivalent temperature difference (NETD) of <15 mK at 30 °C. Measurements made with this camera are obtained with an accuracy of ±1 °C and it can measure the object temperature within a range of −20 to +350 °C or 0 to +100 °C. To obtain a more accurate measurement, the IR camera is adjusted for each test. These factors are emissivity, ambient temperature, relative humidity, reflected temperature and the distance between the electromechanical systems and the infrared camera. The FLUKE 975 Air Quality Meter is used to monitor environmental conditions such as ambient temperature and relative humidity. Thermographic images are acquired using the grey-scale color palette, as a change in the intensity value of a pixel in the grey-scale image is proportional to a change in temperature, i.e., it shows linear behavior. The emissivity value is set to 0.95, as recommended in previous work on electrical systems [33].
In this work, 12 electromechanical system conditions are proposed to be diagnosed. For the induction motor, four conditions are considered, healthy condition (HLT) and under different failure conditions such as ball bearing defect (BD), broken rotor bar (BRB) and misalignment (MAL). The BRB condition is simulated by drilling the rotor to a depth of 8 mm to break a rotor bar. For the BD condition, a 2 mm hole is drilled in the outer ring of the bearing. The MAL condition is created by moving the free end of the IM to create a 5 mm misalignment in the horizontal plane from the free end only. On the other hand, to carry out the study of the gear conditions, three conditions were proposed, the first being the healthy condition GB (GB-HTL), while the second and third conditions are generated with 50% and 75% uniform wear on the gear teeth. To produce the gear wear failure condition, a gear factory was commissioned to produce it artificially.
For each of the tests proposed in this methodology, a time of 80 min was considered, as this is the time in which the electromechanical system reaches its thermal stability. The thermal time constant of the machine heating was determined using an empirical method based on experience, observation and experimentation of the thermal behavior of the electromechanical system in a healthy state [20,35]. This is the time taken for the system to reach thermal stability, i.e., no further significant changes in temperature rise. This time was used for all the tests proposed in this research. The thermographic images were taken every minute so that at the end of each test 80 images were obtained for the test. It should be noted that for this work images from 15 to 65 min are used, as there is no significant temperature change in the first and last 15 min. In the end, a total of 600 thermographic images are used, 50 for each condition. Since in this work only the areas of the motor induction and the gearbox were analyzed, it was decided to crop only these areas from the original image, leaving an image of 70 × 140 pixels.

2.2. The Intensity Profile

In digital image processing, the intensity profile is a graphical representation used to analyze the intensity variation across the columns of the image [36]. Thus, considering a digital image I of size M × N denoted by I i , j , { i = 1 , , M ; j = 1 , , N } where G = { 1,2 , , N g } is the set of N g quantized gray levels, the equation for calculating the intensity profile is expressed by (1).
x j = 1 M i M I ( i , j ) ; j = 1 , , N
where x j is the average intensity in column j and I ( i , j ) is the value of the intensity at position i , j , M is the number of rows, N is the number of columns, and I i , j G . In this way, it is possible to reduce the dimensionality of an image I of size M × N to a vector x of size 1 × N while preserving the information related to the temperature distribution over the image. In this study, the intensity profile x extracted from the thermographic image is used as a feature set to classify the different conditions in IM and GB, transforming from an image I ( i , j ) into a vector x ( j ) while preserving the temperature distribution along the vector (Figure 3).

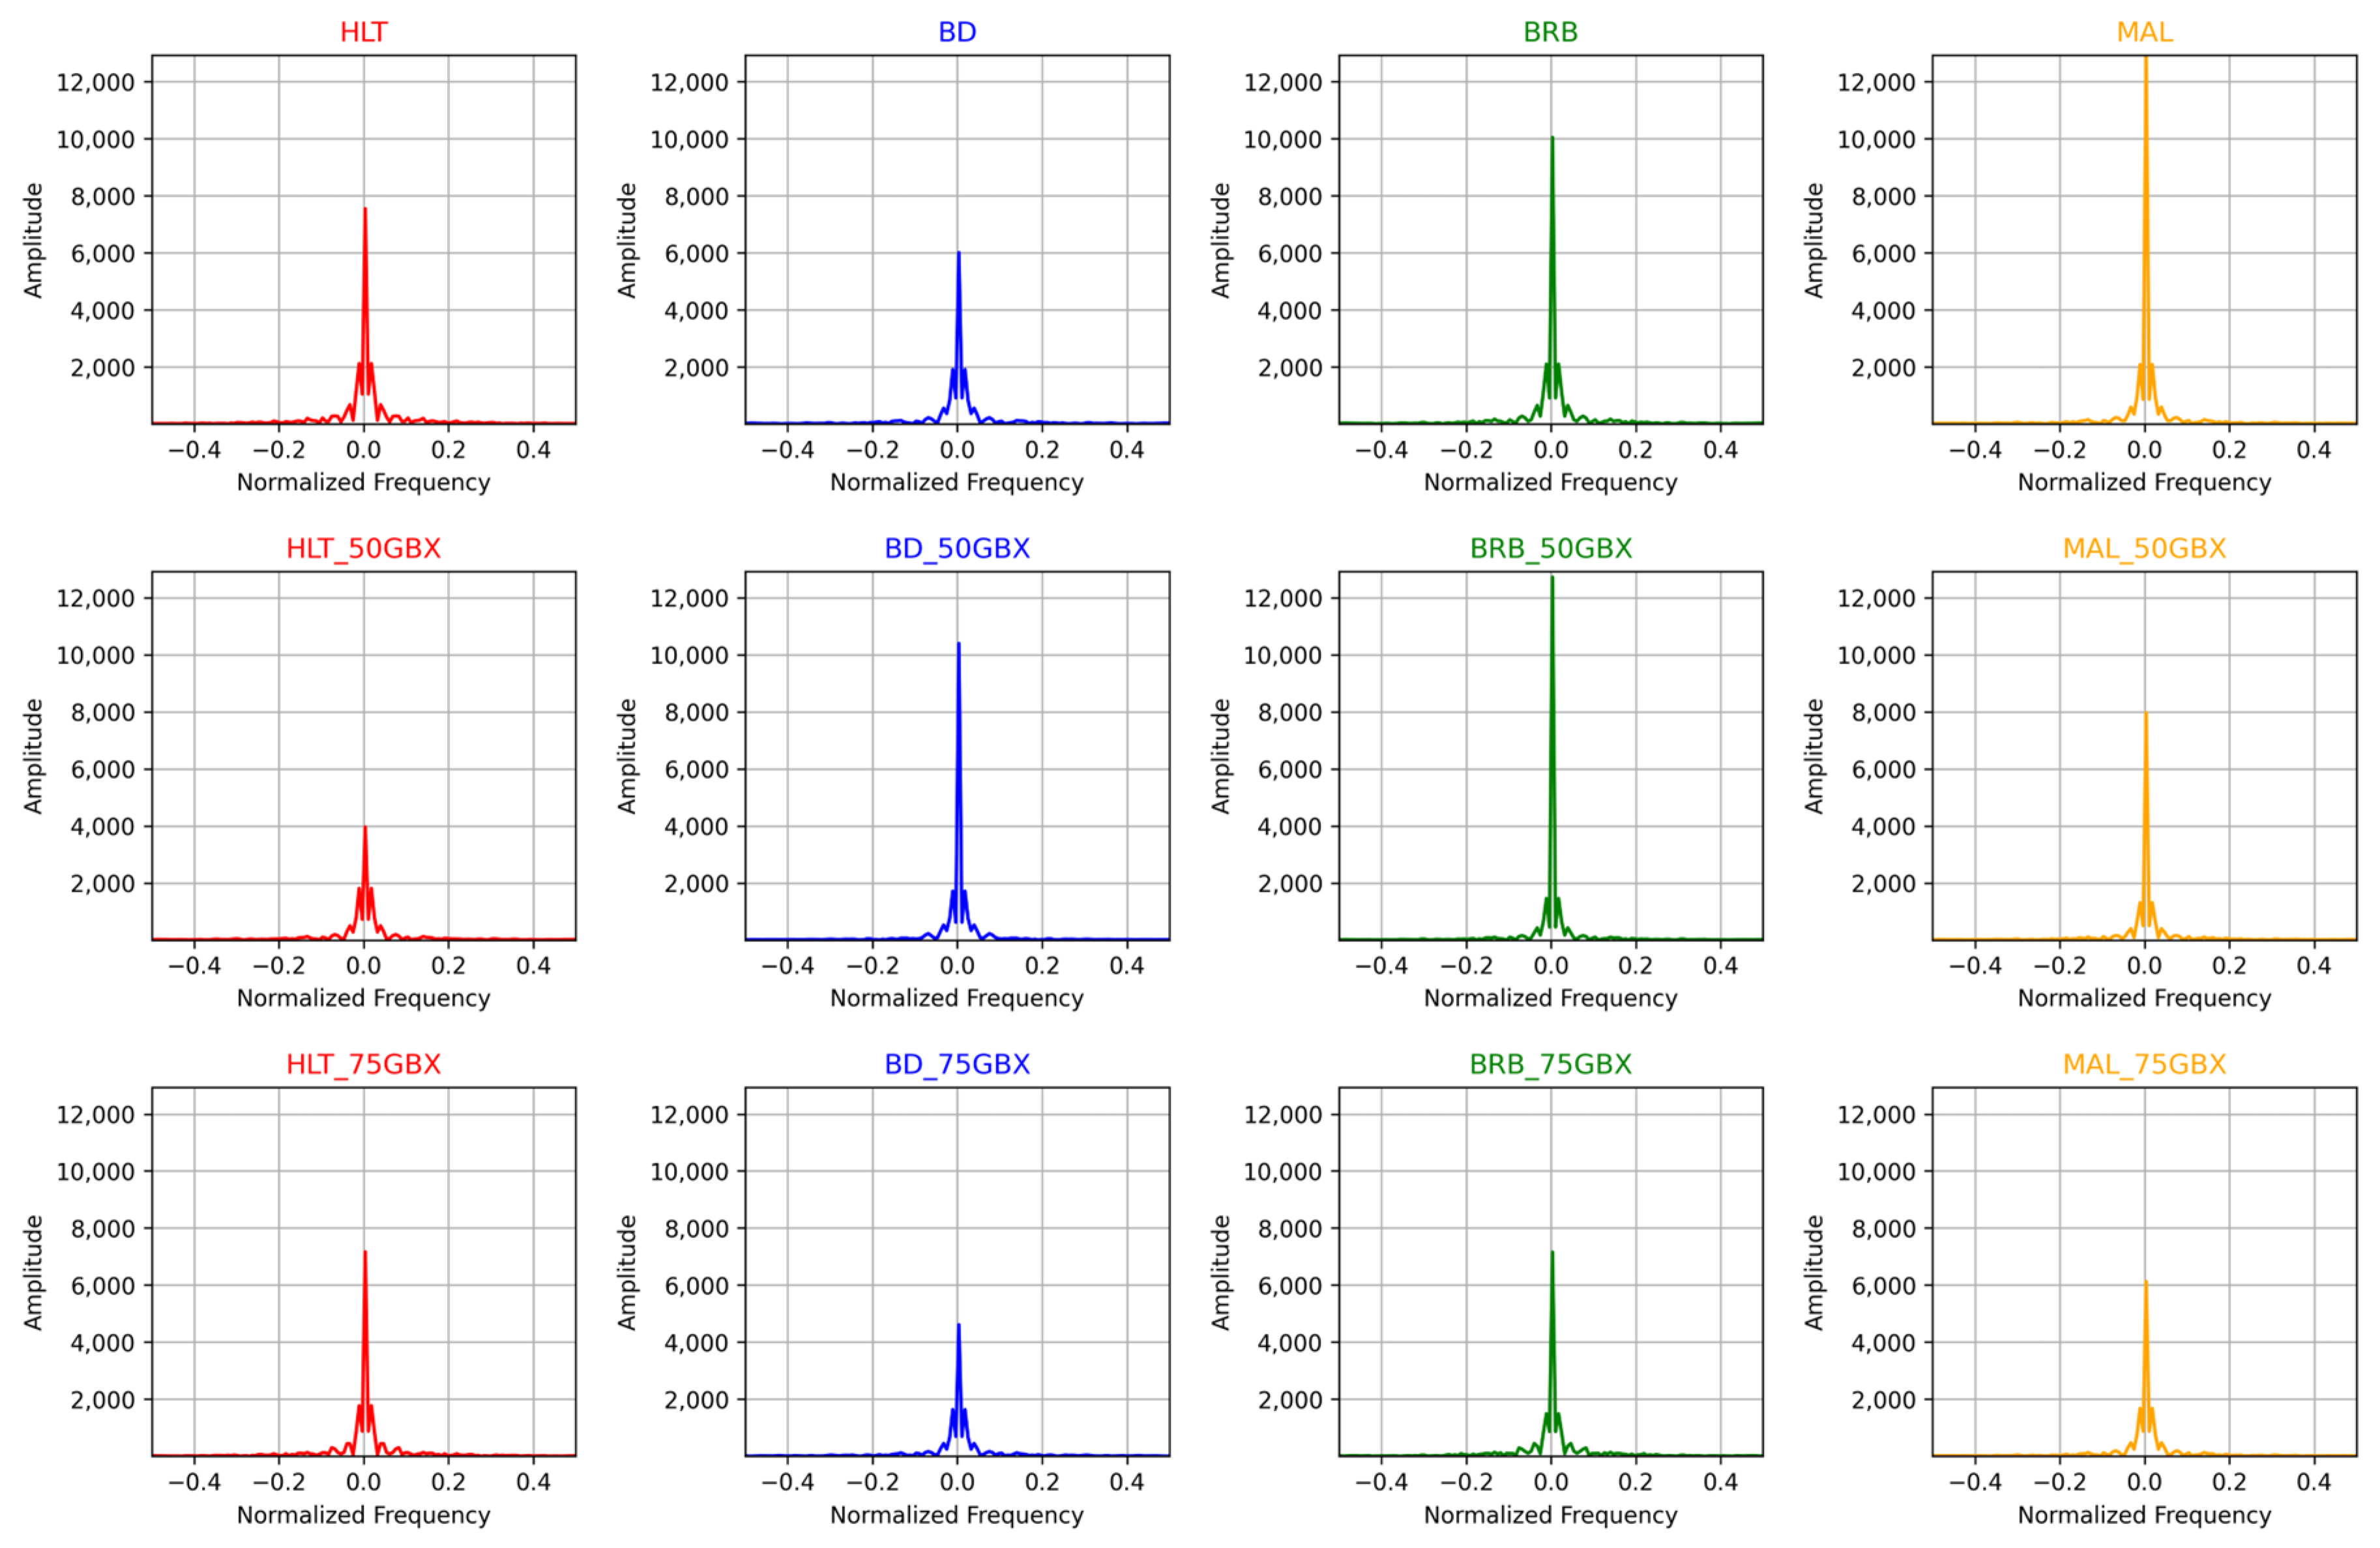
2.3. Fast Fourier Transform

FFT is a mathematical tool used to extract signal behavior in the frequency domain [37]. FFT has become a fundamental tool for fault detection in induction motors because it can show different frequency components present in the signals [38,39], in this case the frequency components present in the profile intensity of the thermographic image. In addition, FFT is characterized by its ability to process signals in a simple and fast way, making it suitable for real-time applications. In that sense, for a discrete signal x ( n ) whose values indicate the average temperature distribution over the image I , the discrete Fourier Transform X ( k ) is defined as
X k = n = 0 N 1 x ( n ) e 2 π i N k n , k = 0 , , N 1
where i is the imaginary unit and e 2 π i N = cos 2 π N i s i n 2 π N .
Thus, by obtaining X k from the intensity profile ( x ), it is possible to analyze the temperature variation as a function of the frequencies present in the signal, which helps to identify periodic patterns, cyclic trends, or frequency variations that indicate recurring thermal phenomena, such as abrupt or anomalous temperature changes.
Both signals ( x and X ) were considered as feature sets for training the model, replacing the dataset of 600 thermographic images of size 70 × 140   ( 600,70,140 ) by a set of signals of the form ( 600,1 , 140 ) . Thus, to generate the training validation and evaluation datasets, two randomly selected subsets were generated according to an 80–20% ratio. The training validation subset consisted of 480 samples (432 samples for training and 48 samples for validation), which were used to tune the hyperparameters. The evaluation subset consisted of the remaining 20%, or 120 samples, which were used to evaluate the fitted model.

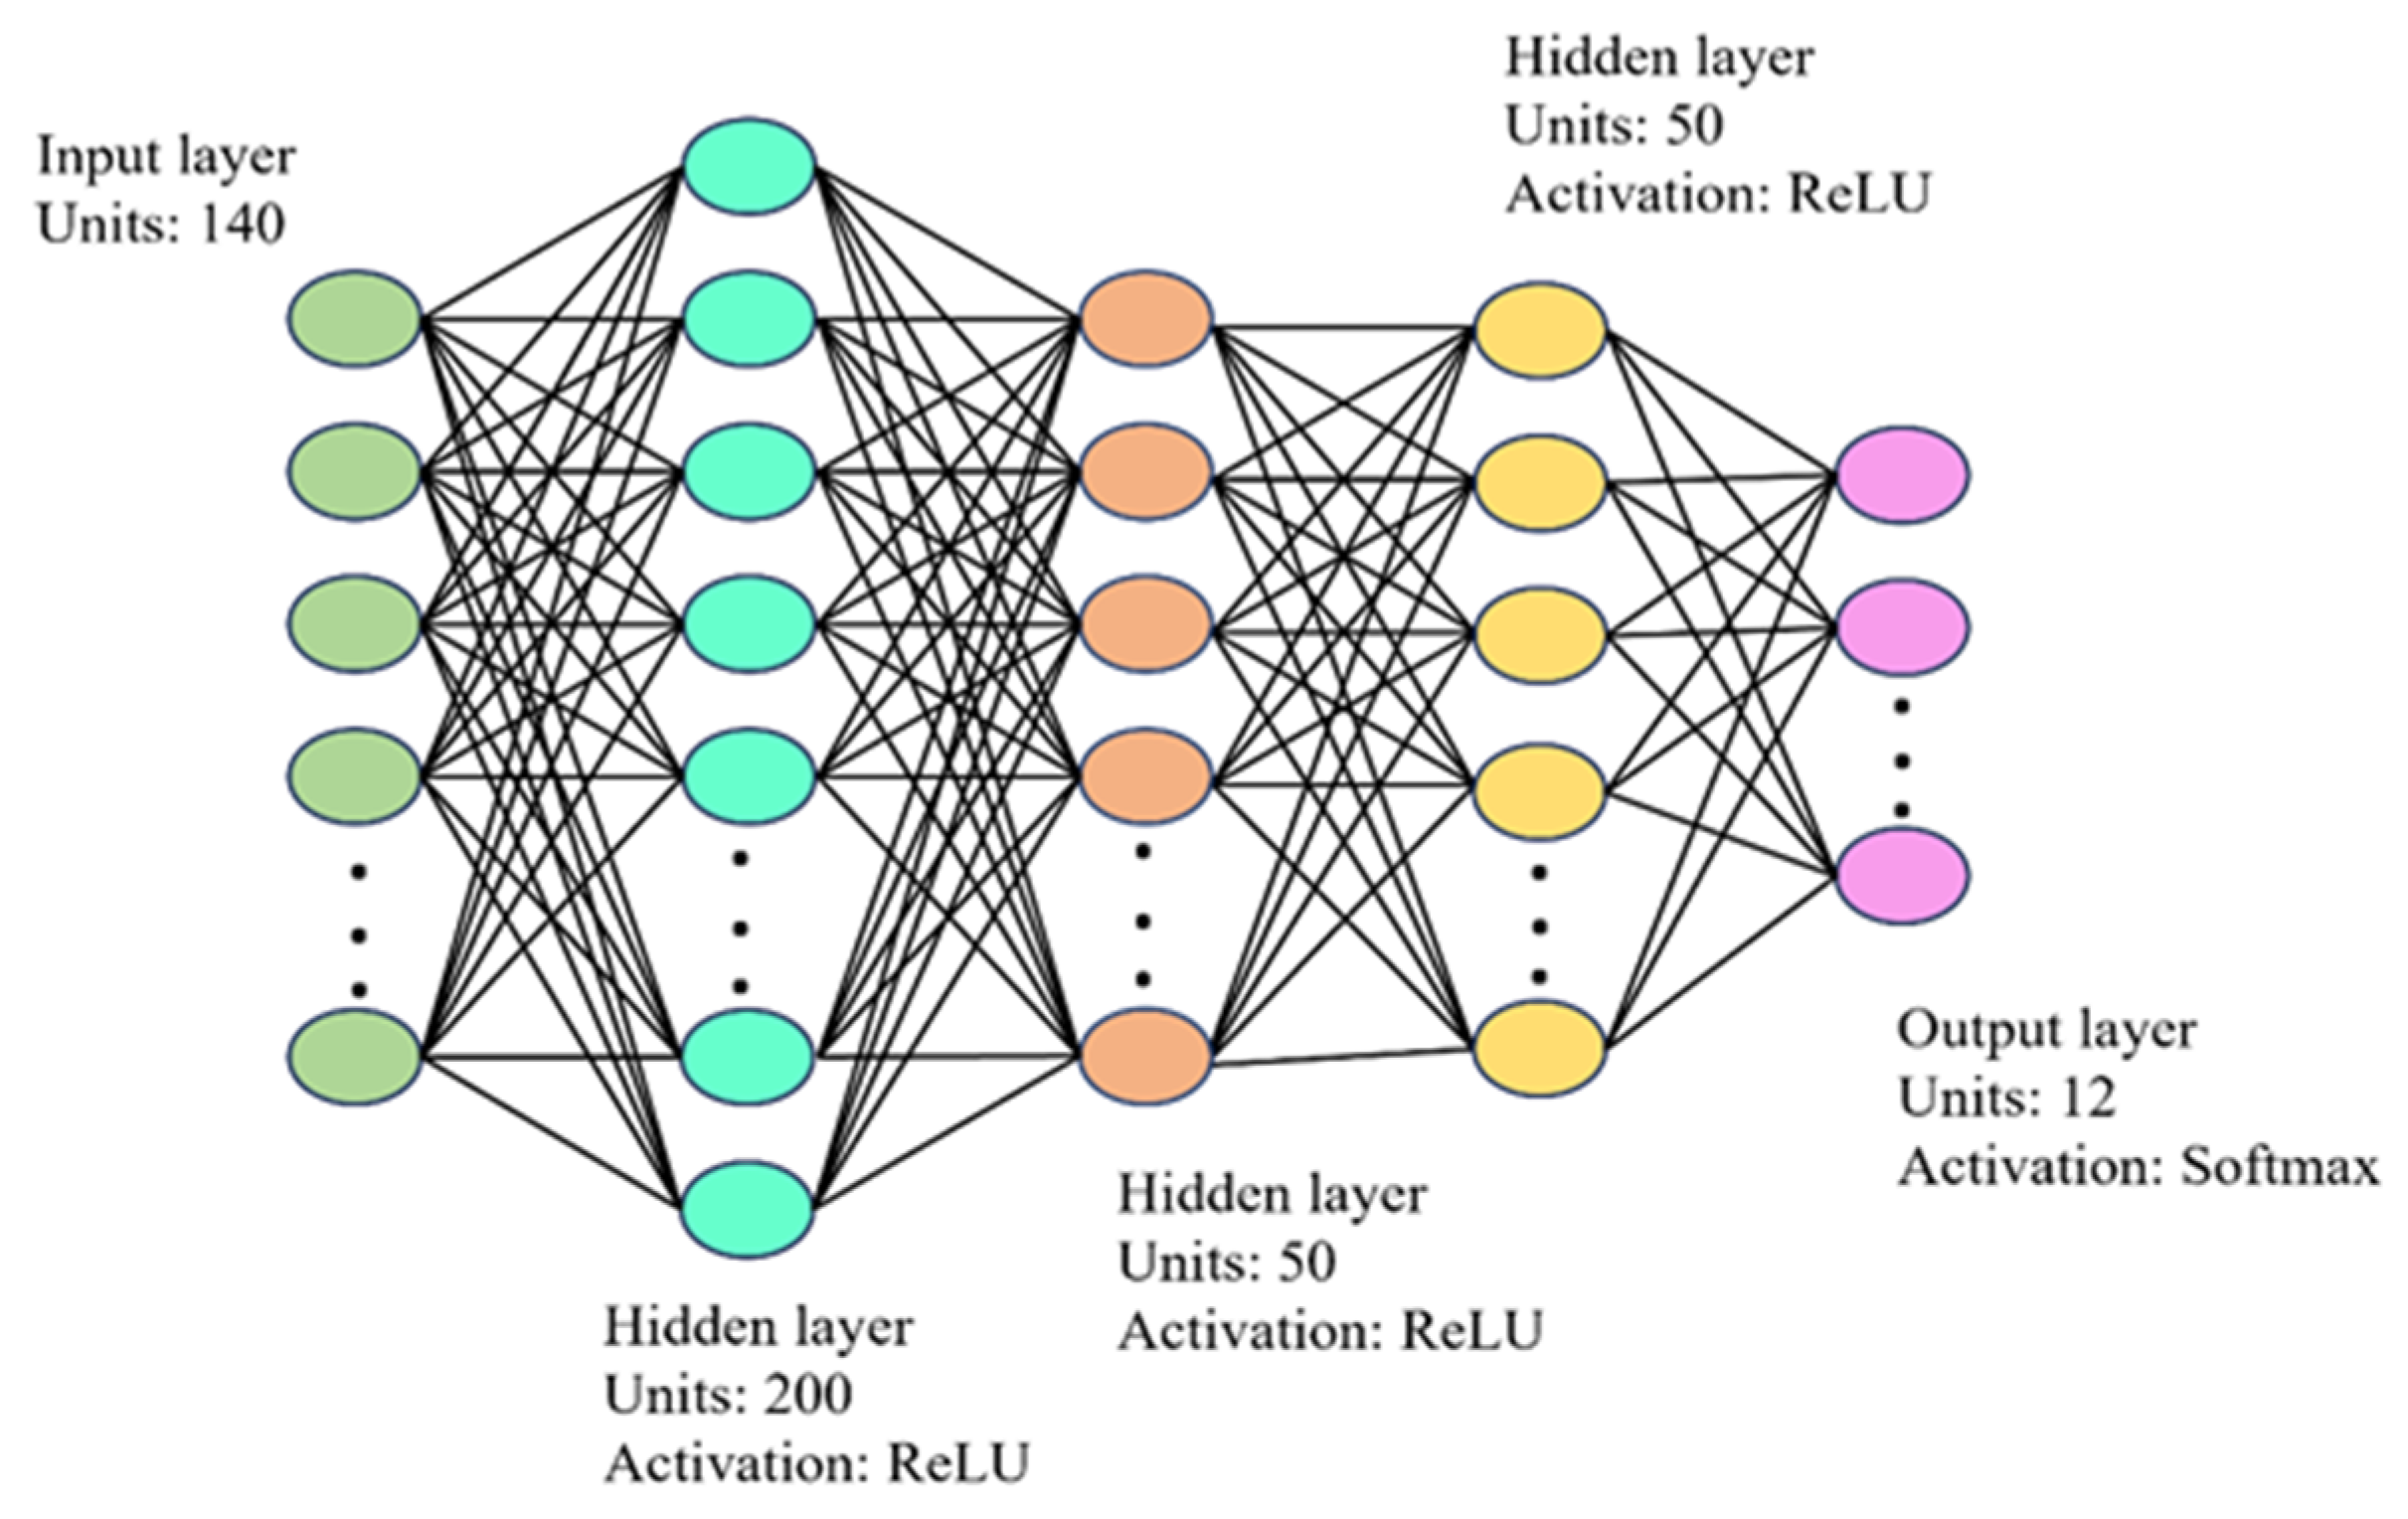
2.4. Multilayer Perceptron

A multilayer perceptron (MLP), also known as a feed-forward neural network (FFNN), is used for data classification [40]. The MLP essentially consists of a series of L linear layers, combined with element-wise non-linear functions (activation functions) per element. Figure 4 shows an MLP with an input layer of D units, 2 hidden layers of K 1 and K 2 units, and an output layer.
From Figure 4, it is possible to observe that the k -th hidden unit in layer l is given by (3),
h k ( l ) = φ l b k l + j = 1 K l 1 ω j k l h j l 1
where φ l is the activation function in the layer l , b k l is the bias of the layer l at node k , ω j k l is the weight of the connection from node j in the layer l 1 to node k in the layer l .
For a classification problem such as detecting different conditions in IM, the final non-linearity φ can be defined using the SoftMax activation function. This activation function is a generalization of the sigmoid function (4). SoftMax generates a probability distribution over multiple classes by “compressing” a k -dimensional vector, z , of arbitrary real values into a k -dimensional vector, σ ( z ) , of real values in the range of [0, 1]. The SoftMax function is given by (5) and (6) [41,42].
σ z = 1 1 + e z , w h e r e   z = x 1 ω 1 + x 2 ω 2 + + x n ω n
σ : R K [ 0,1 ] K
σ z j = e z j k = 1 K e z k   f o r   j = 1 , , K
where z is the input vector composed of the feature values x n multiplied by the weights ω n and σ z j is the j -th element of the resulting vector after applying the SoftMax function. To train the MLP, the cross-entropy loss function (7) uses the probability of the final non-linearity to quantify the difference between the conditions predicted by the MLP model and the actual values of the dataset [43,44].
L C E = i = 1 n t i l o g ( p i ) ,   for   the   n   classes
where t i is the true condition and p i is the probability generated by the SoftMax activation function for the i -th error. Thus, to adjust the weights and biases of the MLP during training, there are different optimizers in the literature (such as SGD, Adam, AdaGrad, and RMSprop) and the selection of the appropriate optimizer plays an important role in the classification process. In this study, an empirical process was carried out, and the Adam optimizer was selected [45], as it gave better results. Thus, the parameters ω ( t ) and L ( t ) , where the index t indicates the current training iteration, the parameter update in Adam is defined by Equations (8)–(12).
m ω ( t + 1 ) β 1 m ω ( t ) + ( 1 β 1 ) w L ( t )
v ω ( t + 1 ) β 2 v ω ( t ) + ( 1 β 2 ) ( w L ( t ) ) 2
m ^ ω = m ω t + 1 1 ( β 1 ) ( t + 1 )
v ^ ω = v ω t + 1 1 ( β 2 ) ( t + 1 )
w t + 1 ω t η m ^ ω v ^ ω + ϵ
In Equations (8) and (9), β 1 and β 2 are the gradient decay factors and the second moment gradient factors, respectively. In Equation (12), ϵ is a small scalar to avoid division by zero.
To measure the performance of the classification model, the accuracy metric was used, which is defined as the closeness of a given set of measurements (observations or readings) to their true value, represented by Equation (13).
A c c u r a c y = T P + T N T P + F P + T N + F N
where T P is the number of cases in which the model correctly classified the specific class, T N is the number of cases in which the model correctly classified out of category, F P is the number of cases in which the model incorrectly classified class membership, and F N is the number of cases in which the model incorrectly classified out of category.

2.5. Image Variations

The generation of new image sets through variations in the initial samples allows to evaluate the relevance of the extracted features and the structure of the classification model, considering variations that describe possible scenarios in which the images can be modified. In this sense, Table 1 shows the experimental matrix regarding the different variations in the dataset, defining each test with the same dimensions as the initial database (600, 70, 140), considering the variation in orientation as a change in the position of the thermographic camera and the variation in intensity as a change in the range of temperatures defined in the image acquisition process.

3. Results

This section presents experiments to evaluate and measure the classification model using intensity profiles and their frequency equivalent. The evaluation is performed by quantitative analysis of the database presented in the previous section. First, the tuning of the neural network hyperparameters is discussed and the performance of both approaches is compared using different evaluation metrics. Similarly, the accuracy of the model is evaluated using images subjected to variations in intensity and orientation (specular). The intensity profile features are then used to train classical machine learning models, and their performance is measured. Finally, the different approaches are compared with models proposed in the literature.

3.1. Application of Fast Fourier Transform to the Profile Intensity

The results of the FFT decomposition under different faults and their spectrum analysis are shown in Figure 5. There is a difference between each spectrum of each fault.

3.2. Hyperparameter Tuning and Training Results

This section presents the results of the hyperparameter tuning of the artificial neural network (ANN) model. In the studies presented by refs. [46,47], it is described that the number of neurons, the number of hidden layers and the number of epochs depend on the complexity of the problem. In this study, the model is only responsible for classifying conditions based on the patterns recorded by the intensity profiles. Therefore, many hidden layers are not necessary. The number of neurons followed a pattern such that the number of neurons in the input layer corresponded to the length of the intensity profile, the number of neurons in the hidden layers increased, and the number of classes in the output layer corresponded to the number of classes in the output layer (Figure 6).
Table 2 shows the configurations and performance results of the implemented model. The number of hidden layers, the number of neurons and the batch size were varied. The latter is important because of its influence on performance, training stability and convergence speed [47].
From the previous table, it can be seen that the performance of the models with both approaches (intensity and frequency) is quite consistent when using a batch size of 32 samples, 3 hidden layers organized in 200, 50 and 50 neurons, respectively, and a learning rate of 0.01 with the Adam optimizer. Because of this consistency, new evaluation metrics were obtained, and the dimensions of the database were varied (Table 3) in order to compare the performance of the best models in more detail.
While Table 3 shows a similarity in performance between the two approaches, using FFT on the intensity profile requires more training and inference time, as well as an additional phase in the pre-processing stage. Therefore, implementing this approach in real-world environments requires proper design if a fully optimized system is desired.

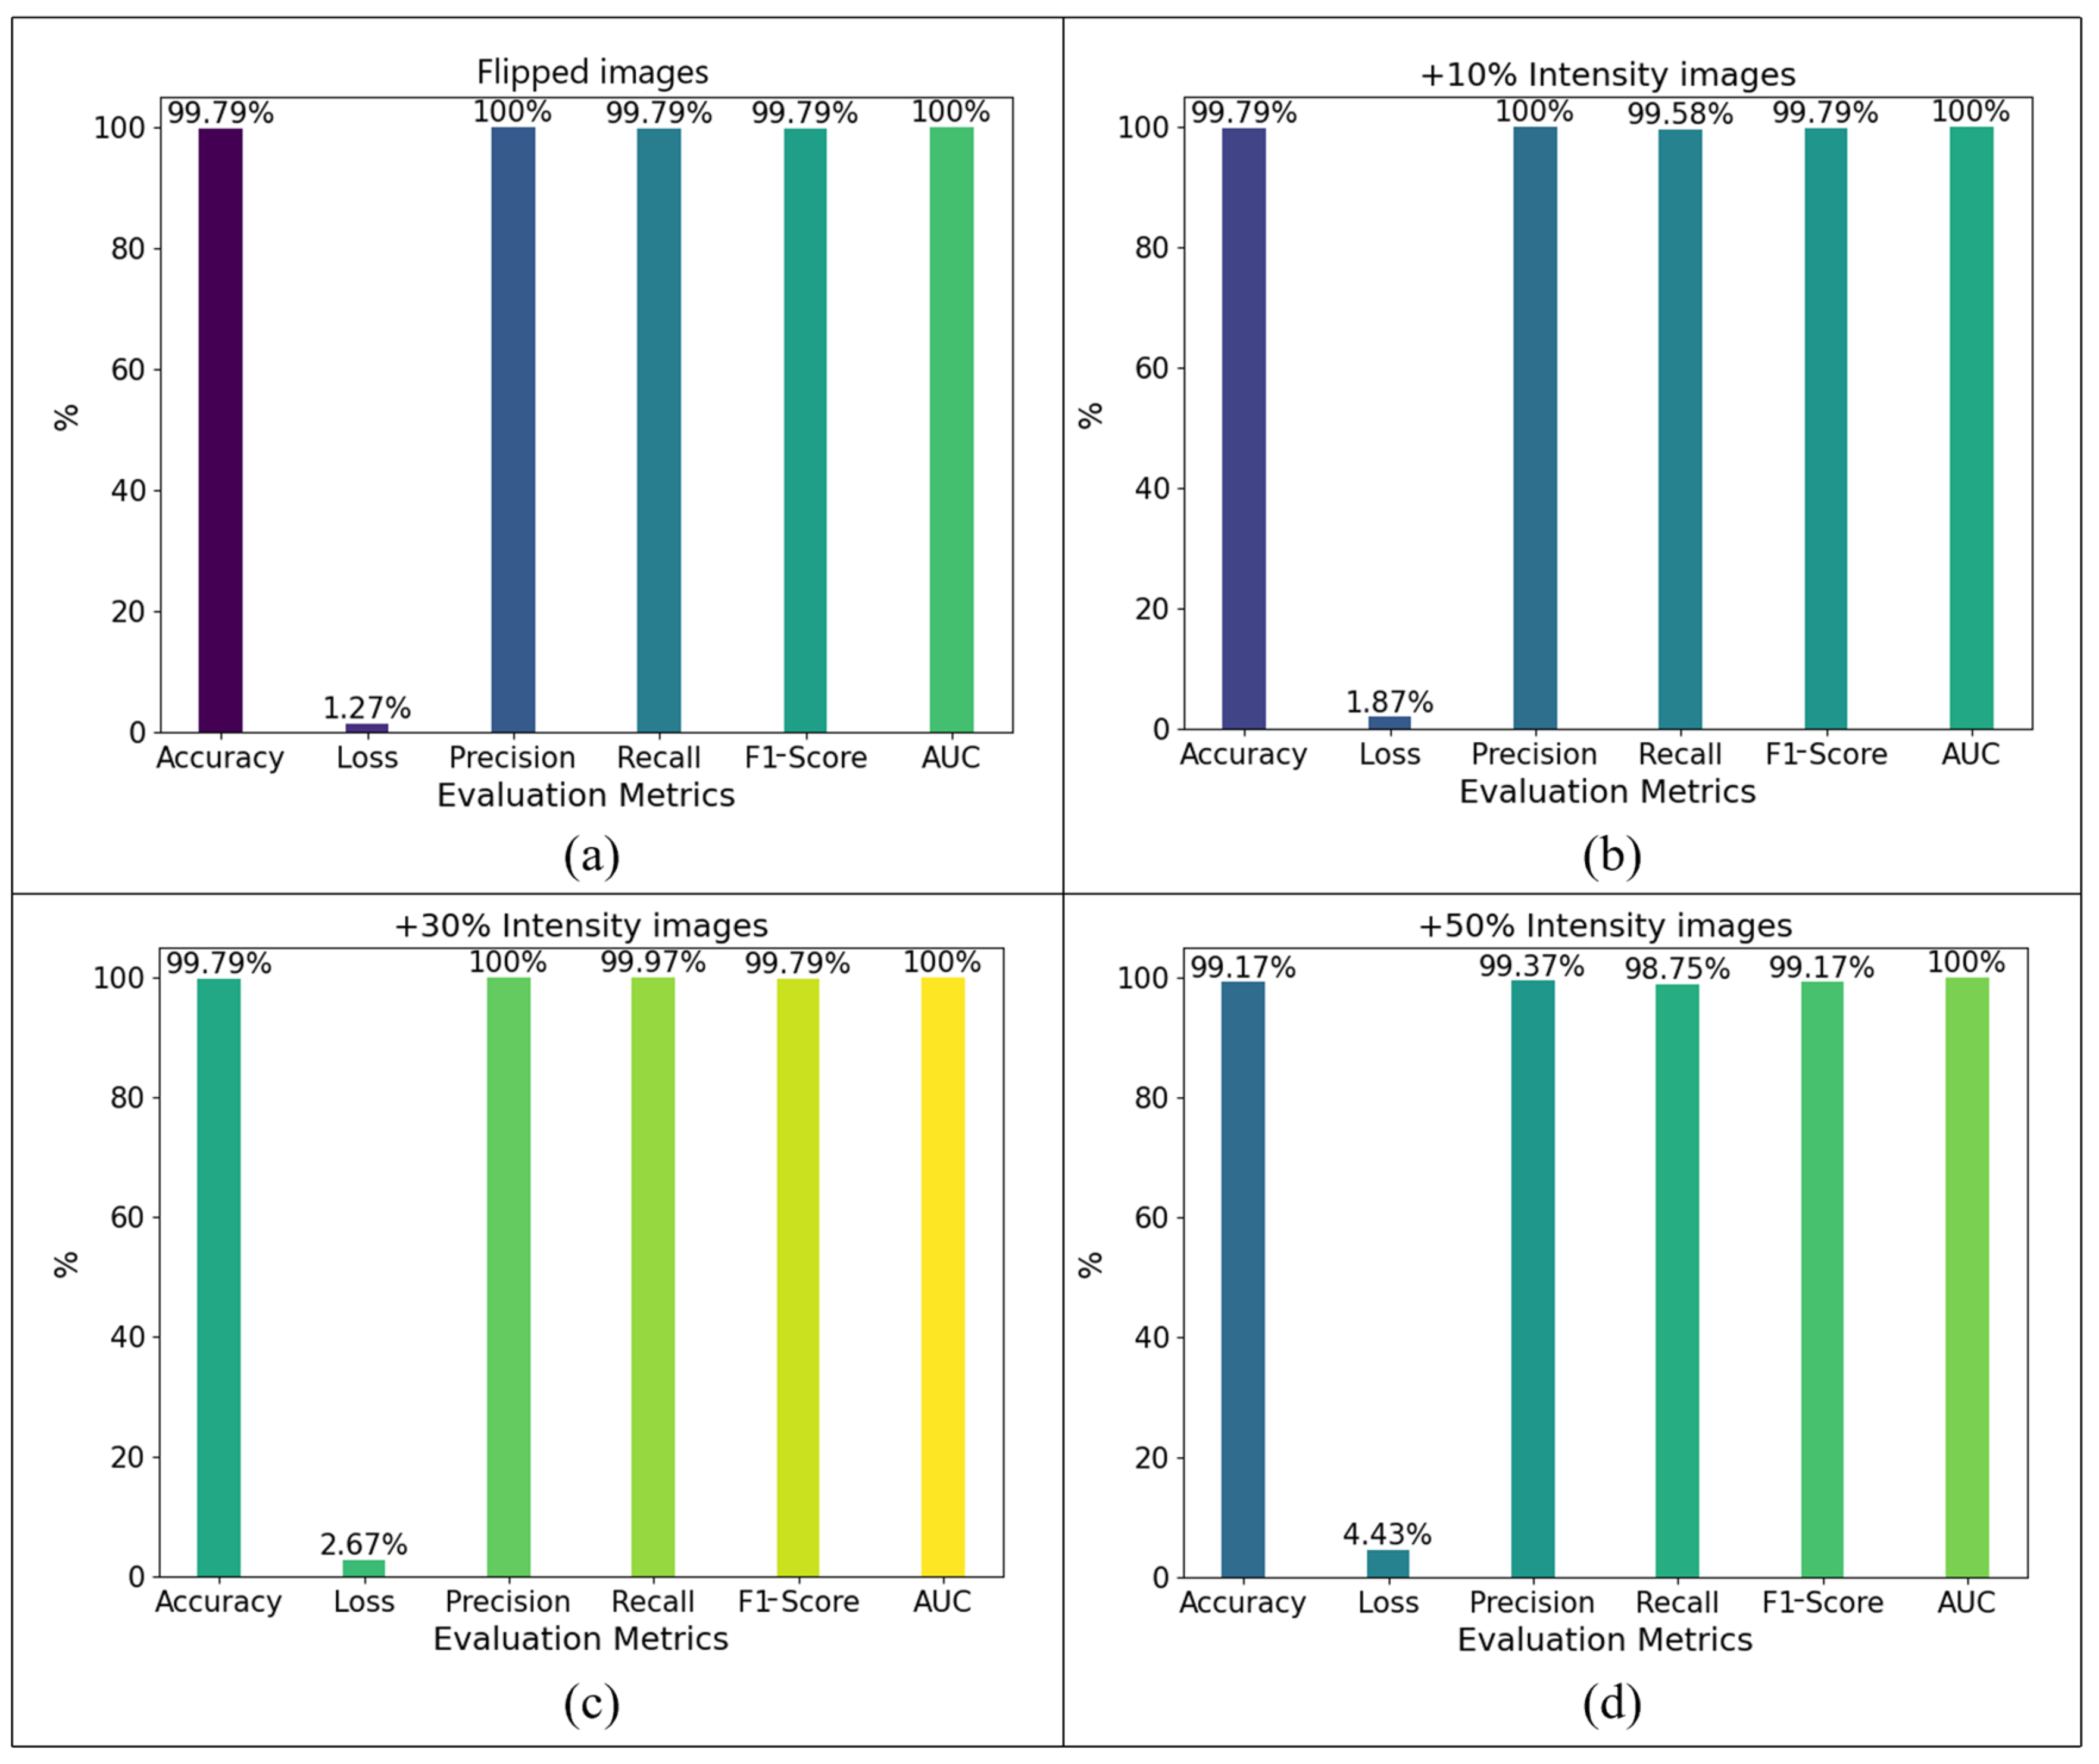
3.3. Robustness Evaluation

To measure the relevance of the intensity profile as a feature set and the ability of the model to generalize across different conditions in the input images, the optimized model (defined in the previous section) was trained and evaluated using the four different tests defined in Table 1. Each test defines a new set of images of the same size as the initial database, with variations in orientation (specular), and three different sets of images with variations in intensity. These variations are defined by increasing the intensity of the images by 10%, 30% and 50%. The evaluation results are shown in Figure 7, it can be seen that variations in orientation do not directly affect the performance of the model due to the nature of the input features. Similarly, a uniform increase in intensity across the input images does not affect the efficiency of the model, as the intensity profile measures and compresses pixel intensity across the image.

3.4. Compararisons Between Models

Finally, the ANN architecture proposed in this study is compared with three different classical machine learning models: multinomial logistic regression (LR), k-nearest neighbors (KNN) and random forest (RF). Similarly, these models were trained, validated and evaluated using the same data distribution as the ANN. Table 4 shows the evaluation metrics of the implemented models.
From Table 3 and Table 4, the model proposed in this work achieved the best performance with an accuracy of 100%, followed by the LR model with an accuracy of 99%. Finally, the K-NN and RF models with accuracies below 95%.

4. Discussion

The objective of this research was to develop a system for multi-failure detection in an electromechanical system using thermographic images. The main contributions of the proposal are based on two points. First, a novel methodology based on obtaining an intensity profile followed by an FFT and a basic architecture of an ANN. Second, to obtain performance parameters such as precision, accuracy, recall and F1-Score higher than 99% under different conditions.
The comparison of the results of the proposal of this work with other existing in the literature based on thermographic images is shown in Table 5. These approaches are based on the implementation of classifiers such as linear discriminant analysis (LDA) + neural networks, support vector machines (SVMs), self-organizing maps, and convolutional neural networks. It can be observed that all of them achieve a very good performance, all of them exceed 84%, and some of them even reach 100%. Regarding the proposed model, it achieves the same accuracy as composite or assembled models (i.e., models that couple two or more classifiers to increase their accuracy) and at the same time classifies a greater number of conditions, indicating that the intensity profile, FFT and ANN approach is a simple and powerful tool for fault detection in induction motors using thermographic images. Another advantage is that it achieves the highest accuracy by using only the thermographic images acquired during the experimental setup, since there are other methods that use data augmentation to achieve higher accuracies. On the other hand, to verify the robustness of the method, the tests were repeated, but instead of using the original database, a new one was created using some image processing techniques, such as mirroring and intensity level variation. The reason for this is that, in real life, the electromechanical system can be inverted, or the temperature range of the thermal camera can be set automatically. Despite these variations, the performance indicators remained above 98.75%.
On the other hand, it should be mentioned that the proposed system can infer the conditions with an average inference time of 0.0017 s (in the time domain) and 0.0073 s (in the frequency domain) per sample, making it suitable for online applications. However, it is important to note that to ensure the validity of online implementation, the system should be integrated with hardware capable of acquiring and processing thermal images in real time, such as embedded systems with processors like ARM-based microcontrollers (e.g., Cortex-M series) or digital signal processors (DSP).
Despite the good results obtained from the research, some limitations can be observed, for example, only the objects to be analyzed should be inside the thermal image, since any disturbance can modify the intensity profile, so there would be a bias in the result, for this reason it is suggested to focus only on the working area in the shot. On the other hand, the intensity profile should be carried out only with the grey-scale color palette; therefore, from the acquisition of thermographic images, it is suggested to perform them in this color palette. Similarly, as shown in the results, the lower the number of training images of the system, the lower the accuracy achieved, so it is recommended to acquire as many images as possible during the experimental setup. Finally, if other defects were to be included, it would be necessary to have the dataset of thermographic images containing the fault, then make the necessary adjustments to the neural network, retrain it and finally validate it. To develop the dataset, it is necessary to collect thermographic images when the system is operating only with the desired fault, otherwise there could be a bias of information.

5. Conclusions

The main contribution of this work is a novel methodology based on infrared thermography for the intelligent detection of 12 conventional defects in electromechanical systems. The conditions detected include healthy, broken rotor bar, misalignment, bearing defect and different levels of gear wear in the gearbox. The method consists of a grey-scale thermographic image intensity profile followed by FFT and ANN. The ANN has a simple architecture, the best configuration was with a batch of 32 samples, 3 hidden layers organized in 200, 50 and 50 neurons, respectively, and a learning rate of 0.01 using Adam’s optimizer. This allows a low training and inference time, which would allow its implementation in an embedded system for real-world applications, such as industrial applications on production lines. The performance results of the method indicators, such as precision, accuracy, F1-Score and recall, exceed 99%, even when there are disturbances in the input data, such as an intensity variation or mirror imaging.
Based on the experience gained in this work, it is proposed as future work to continue experimenting with other electromechanical system failures, for example in the electrical part; also, to test other artificial intelligence techniques; finally, to test the method with low-cost thermography equipment to explore the possibility of developing a low-cost intelligent sensor.

Author Contributions

Conceptualization, E.R.-O. and I.A.C.-A.; methodology, S.C.-U. and I.A.C.-A.; software, S.C.-U. and C.A.P.-R.; validation, E.R.-O., C.A.P.-R. and L.A.M.-H.; formal analysis, S.C.-U. and I.A.C.-A.; investigation, E.R.-O.; resources, E.R.-O., S.C.-U. and I.A.C.-A.; data curation, S.C.-U.; writing—original draft preparation, E.R.-O., S.C.-U. and I.A.C.-A.; writing—review and editing, L.A.M.-H. and C.A.P.-R.; visualization, E.R.-O. and I.A.C.-A.; supervision, L.A.M.-H.; project administration, C.A.P.-R. and I.A.C.-A.; funding acquisition, C.A.P.-R. All authors have read and agreed to the published version of the manuscript.

Funding

This research received no external funding.

Data Availability Statement

The data presented in this study are not publicly available due to privacy issues.

Acknowledgments

The second author would like to thank the Mexican Council of Humanities, Science and Technology (CONAHCYT) for the scholarship awarded.

Conflicts of Interest

The authors declare no conflicts of interest.

References

  1. Wang, R.; Xu, J.; Zhang, W.; Gao, J.; Li, Y.; Chen, F. Reliability analysis of complex electromechanical systems: State, of the art, challenges, and prospects. Qual. Reliab. Eng. Int. 2022, 38, 3935–3969. [Google Scholar] [CrossRef]
  2. Choudhary, A.; Mishra, R.K.; Fatima, S.; Panigrahi, B.K. Multi-input CNN based vibro-acoustic fusion for accurate fault diagnosis of induction motor. Eng. Appl. Artif. Intell. 2023, 120, 105872. [Google Scholar] [CrossRef]
  3. Zhao, D.; Cui, L.; Liu, D. Bearing Weak Fault Feature Extraction Under Time-Varying Speed Conditions Based on Frequency Matching Demodulation Transform. IEEE/ASME Trans. Mechatron. 2023, 28, 1627–1637. [Google Scholar] [CrossRef]
  4. Li, M.; Liu, Y.; Wang, T.; Chu, F.; Peng, Z. Adaptive synchronous demodulation transforms with application to analyzing multicomponent signals for machinery fault diagnostics. Mech. Syst. Signal Process. 2023, 191, 110208. [Google Scholar] [CrossRef]
  5. Yakhni, M.F.; Cauet, S.; Sakout, A.; Assoum, H.; Etien, E.; Rambault, L.; El-Gohary, M. Variable speed induction motors’ fault detection based on transient motor current signatures analysis: A review. Mech. Syst. Signal Process. 2023, 184, 109737. [Google Scholar] [CrossRef]
  6. Jaros, R.; Byrtus, R.; Dohnal, J.; Danys, L.; Baros, J.; Koziorek, J.; Zmij, P.; Martinek, R. Advanced Signal Processing Methods for Condition Monitoring. Arch. Comput. Methods Eng. 2023, 30, 1553–1577. [Google Scholar] [CrossRef]
  7. Mishra, S.K.; Shakya, P.; Babureddy, P.; Vignesh, S.A. An approach to improve high-frequency resonance technique for bearing fault diagnosis. Measurement 2021, 178, 109318. [Google Scholar] [CrossRef]
  8. Wang, H.; Chen, S.; Zhai, W. Data-driven adaptive chirp mode decomposition with application to machine fault diagnosis under non-stationary conditions. Mech. Syst. Signal Proc. 2023, 188, 109997. [Google Scholar] [CrossRef]
  9. Tabasi, M.; Mostafavi, M.; Ojaghi, M. Motor Current Signature Analysis for Detecting Local Defects on Rolling Element Bearings of Induction Motors. Arab. J. Sci. Eng. 2023, 48, 14811–14822. [Google Scholar] [CrossRef]
  10. Nazari, S.; Shokoohi, S.; Moshtagh, J. A Current Noise Cancellation Method Based on Integration of Stator Synchronized Currents for Bearing Fault Diagnosis. IEEE Trans. Instrum. Meas. 2023, 73, 3504208. [Google Scholar] [CrossRef]
  11. Lee, J.; Lee, Y.; Kim, N. Detection and analysis of shaft misalignment in application of production and logistics systems using motor current signature analysis. Exp. Syst. Appl. 2023, 217, 119463. [Google Scholar] [CrossRef]
  12. Patil, S.; Jalan, A.K.; Marathe, A. Condition Monitoring of Misaligned Rotor System Using Acoustic Sensor by Response Surface Methodology. ASME J. Nondestruct. Eval. 2023, 6, 011002. [Google Scholar] [CrossRef]
  13. Motahari-Nezhad, M.; Jafari, S.M. Comparison of MLP and RBF neural networks for bearing remaining useful life prediction based on acoustic emission. Proc. Inst. Mech. Eng. J. Eng. Tribol. 2023, 237, 129–148. [Google Scholar] [CrossRef]
  14. Zamudio-Ramirez, I.; Osornio-Rios, R.A.; Antonino-Daviu, J.A. Smart Sensor for Fault Detection in Induction Motors Based on the Combined Analysis of Stray-Flux and Current Signals: A Flexible, Robust Approach. IEEE Ind. Appl. Mag. 2022, 28, 56–66. [Google Scholar] [CrossRef]
  15. Lamim Filho, P.C.M.; Rabelo Baccarini, L.M.; Batista, F.B.; Araújo, A.C. Orbit Analysis from a Stray Flux Full Spectrum for Induction Machine Fault Detection. IEEE Sens. J. 2022, 21, 16152–16161. [Google Scholar] [CrossRef]
  16. Cherif, H.; Benakcha, A.; Laib, I.; Chehaidia, S.E.; Menacer, A.; Soudan, B.; Olabi, A.G. Early detection and localization of stator inter-turn faults based on discrete wavelet energy ratio and neural networks in induction motor. Energy 2020, 212, 118684. [Google Scholar] [CrossRef]
  17. Amanuel, T.; Ghirmay, A.; Ghebremeskel, H.; Ghebrehiwet, R.; Bahlibi, W. Comparative analysis of signal processing techniques for fault detection in three phase induction motor. J. Electron. 2021, 3, 61–76. [Google Scholar] [CrossRef]
  18. Resendiz-Ochoa, E.; Saucedo-Dorantes, J.J.; Benitez-Rangel, J.P.; Osornio-Rios, R.A.; Morales-Hernandez, L.A. Novel methodology for condition monitoring of gear wear using supervised learning and infrared thermography. Appl. Sci. 2020, 10, 506. [Google Scholar] [CrossRef]
  19. Xia, C.; Ren, M.; Wang, B.; Dong, M.; Xu, G.; Xie, J.; Zhang, C. Infrared thermography-based diagnostics on power equipment: State-of-the-art. High Volt. 2021, 6, 387–407. [Google Scholar] [CrossRef]
  20. Balakrishnan, G.K.; Yaw, C.T.; Koh, S.P.; Abedin, T.; Raj, A.A.; Tiong, S.K.; Chen, C.P. A review of infrared thermography for condition-based monitoring in electrical energy: Applications and recommendations. Energies 2022, 15, 6000. [Google Scholar] [CrossRef]
  21. Charitha, B.V.; Ananthan, T. Machine Learning Based Fault Detection in Induction Motor using Thermal Imaging. In Proceedings of the 2022 3rd International Conference on Electronics and Sustainable Communication Systems (ICESC), Coimbatore, India, 17–19 August 2022; pp. 929–936. [Google Scholar] [CrossRef]
  22. Choudhary, A.; Goyal, D.; Letha, S.S. Infrared thermography-based fault diagnosis of induction motor bearings using machine learning. IEEE Sens. J. 2020, 21, 1727–1734. [Google Scholar] [CrossRef]
  23. Choudhary, A.; Goyal, D.; Shimi, S.L.; Akula, A. Condition monitoring and fault diagnosis of induction motors: A review. Arch. Comput. Methods Eng. 2019, 26, 1221–1238. [Google Scholar] [CrossRef]
  24. Shen, S.; Lu, H.; Sadoughi, M.; Hu, C.; Nemani, V.; Thelen, A.; Webster, K.; Darr, M.; Sidon, J.; Kenny, S. A physics-informed deep learning approach for bearing fault detection. Eng. Appl. Artif. Intell. 2021, 103, 104295. [Google Scholar] [CrossRef]
  25. Nasiri, A.; Taheri-Garavand, A.; Omid, M.; Carlomagno, G.M. Intelligent fault diagnosis of cooling radiator based on deep learning analysis of infrared thermal images. Appl. Therm. Eng. 2019, 163, 114410. [Google Scholar] [CrossRef]
  26. Janssens, O.; Van de Walle, R.; Loccufier, M.; Van Hoecke, S. Deep learning for infrared thermal image based machine health monitoring. IEEE/ASME Trans. Mechatron. 2017, 23, 151–159. [Google Scholar] [CrossRef]
  27. Li, Y.; Du, X.; Wang, X.; Si, S. Industrial gearbox fault diagnosis based on multi-scale convolutional neural networks and thermal imaging. ISA Trans. 2022, 129, 309–320. [Google Scholar] [CrossRef] [PubMed]
  28. Li, Y.; Du, X.; Wan, F.; Wang, X.; Yu, H. Rotating machinery fault diagnosis based on convolutional neural network and infrared thermal imaging. Chin. J. Aeronaut. 2020, 33, 427–438. [Google Scholar] [CrossRef]
  29. Shao, H.; Xia, M.; Han, G.; Zhang, Y.; Wan, J. Intelligent fault diagnosis of rotor-bearing system under varying working conditions with modified transfer convolutional neural network and thermal images. IEEE Trans. Ind. Inform. 2020, 17, 3488–3496. [Google Scholar] [CrossRef]
  30. Glowacz, A. Thermographic fault diagnosis of shaft of BLDC motor. Sensors 2022, 22, 8537. [Google Scholar] [CrossRef]
  31. Sharma, K.; Goyal, D.; Kanda, R. Intelligent Fault Diagnosis of Bearings based on Convolutional Neural Network using Infrared Thermography. Proc. Inst. Mech. Eng. Part J J. Eng. Tribol. 2022, 236, 2439–2446. [Google Scholar] [CrossRef]
  32. Alvarado-Hernandez, A.I.; Zamudio-Ramirez, I.; Jaen-Cuellar, A.Y.; Osornio-Rios, R.A.; Donderis-Quiles, V.; Antonino-Daviu, J.A. Infrared Thermography Smart Sensor for the Condition Monitoring of Gearbox and Bearings Faults in Induction Motors. Sensors 2022, 22, 6075. [Google Scholar] [CrossRef] [PubMed]
  33. Resendiz-Ochoa, E.; Osornio-Rios, R.A.; Benitez-Rangel, J.P.; Romero-Troncoso, R.D.J.; Morales-Hernandez, L.A. Induction motor failure analysis: An automatic methodology based on infrared imaging. IEEE Access 2018, 6, 76993–77003. [Google Scholar] [CrossRef]
  34. Badran, O.; Sarhan, H.; Alomour, B. Thermal performance analysis of induction motor. Int. J. Heat Technol. 2012, 30, 75–88. [Google Scholar]
  35. Picazo-Rodenas, M.J.; Antonino-Daviu, J.; Climente-Alarcon, V.; Royo-Pastor, R.; Mota-Villar, A. Combination of noninvasive approaches for general assessment of induction motors. IEEE Trans. Ind. Appl. 2015, 51, 2172–2180. [Google Scholar] [CrossRef]
  36. Milford, M.J.; Wyeth, G.F. Single Camera Vision-only SLAM on a Suburban Road Network. In Proceedings of the 2008 International Conference on Robotics and Automation, Pasadena, CA, USA, 19–23 May 2008; pp. 3684–3689. [Google Scholar] [CrossRef]
  37. Serbes, G.; Sakar, B.E.; Gulcur, H.O.; Aydin, N. An emboli detection system based on Dual Tree Complex Wavelet Transform and ensemble learning. Appl. Soft Comput. 2015, 37, 87–94. [Google Scholar] [CrossRef]
  38. Romero-Troncoso, R.J. Multirate signal processing to improve FFT-based analysis for detecting faults in induction motors. IEEE Trans. Industr. Inform. 2017, 13, 1291–1300. [Google Scholar] [CrossRef]
  39. Kumar, R.R.; Andriollo, M.; Cirrincione, G.; Cirrincione, M.; Tortella, A. A Comprehensive Review of Conventional and Intelligence-Based Approaches for the Fault Diagnosis and Condition Monitoring of Induction Motors. Energies 2022, 15, 8938. [Google Scholar] [CrossRef]
  40. Murphy, K.P. Probabilistic Machine Learning: Advanced Topics; MIT Press: Cambridge, MA, USA, 2023. [Google Scholar]
  41. Tao, S.; Zhang, T.; Yang, J.; Wang, X.; Lu, W. Bearing fault diagnosis method based on stacked autoencoder and softmax regression. In Proceeding of the 2015 34th Chinese Control Conference, Hangzhou, China, 28–30 July 2015; pp. 6331–6335. [Google Scholar] [CrossRef]
  42. Lee, J.H.; Pack, J.H.; Lee, I.S. Fault diagnosis of induction motor using convolutional neural network. Appl. Sci. 2019, 9, 2950. [Google Scholar] [CrossRef]
  43. Zhou, Y.; Wang, X.; Zhang, M.; Zhu, J.; Zheng, R.; Wu, Q. MPCE: A maximum probability based cross entropy loss function for neural network classification. IEEE Access 2019, 7, 146331–146341. [Google Scholar] [CrossRef]
  44. Xiao, D.; Huang, Y.; Qin, C.; Shi, H.; Li, Y. Fault diagnosis of induction motors using recurrence quantification analysis and LSTM with weighted BN. Shock. Vib. 2019, 2019, 1–14. [Google Scholar] [CrossRef]
  45. Kumar, A.; Sarkar, S.; Pradhan, C. Malaria disease detection using cnn technique with sgd, rmsprop and adam optimizers. In Deep Learning Techniques for Biomedical and Health Informatics; Springer: Berlin/Heidelberg, Germany, 2020; pp. 211–230. [Google Scholar] [CrossRef]
  46. Skowron, M.; Orlowska-Kowalska, T.; Wolkiewicz, M.; Kowalski, C.T. Convolutional neural network-based stator current data-driven incipient stator fault diagnosis of inverter-fed induction motor. Energies 2020, 13, 1475. [Google Scholar] [CrossRef]
  47. Huda, A.N.; Taib, S. Application of infrared thermography for predictive/preventive maintenance of thermal defect in electrical equipment. Appl. Therm. Eng. 2013, 61, 220–227. [Google Scholar] [CrossRef]
  48. Delgado-Prieto, M.; Carino-Corrales, J.A.; Saucedo-Dorantes, J.J.; de Jesus Romero-Troncoso, R.; Osornio-Rios, R.A. Thermography-based methodology for multifault diagnosis on kinematic chain. IEEE Trans. Ind. Inform. 2018, 14, 5553–5562. [Google Scholar] [CrossRef]
  49. Mahami, A.; Rahmoune, C.; Bettahar, T.; Benazzouz, D. Induction motor condition monitoring using infrared thermography imaging and ensemble learning techniques. Adv. Mech. Eng. 2021, 13, 168781402110609. [Google Scholar] [CrossRef]
  50. Javed, M.R.; Shabbir, Z.; Asghar, F.; Amjad, W.; Mahmood, F.; Khan, M.O.; Virk, U.S.; Waleed, A.; Haider, Z.M. An efficient fault detection method for induction motors using thermal imaging and Machine Vision. Sustainability 2022, 14, 9060. [Google Scholar] [CrossRef]
  51. Khanjani, M.; Ezoji, M. Electrical fault detection in three-phase induction motor using deep network-based features of thermograms. Meas. J. Int. Meas. Confed. 2021, 173, 108622. [Google Scholar] [CrossRef]
  52. Osornio-Rios, R.A.; Jaen-Cuellar, A.Y.; Alvarado-Hernandez, A.I.; Zamudio-Ramirez, I.; Cruz-Albarran, I.A.; Antonino-Daviu, J.A. Fault detection and classification in kinematic chains by means of PCA extraction-reduction of features from thermographic images. Meas. J. Int. Meas. Confed. 2022, 197, 111340. [Google Scholar] [CrossRef]
  53. Trejo-Chavez, O.; Cruz-Albarran, I.A.; Resendiz-Ochoa, E.; Salinas-Aguilar, A.; Morales-Hernandez, L.A.; Basurto-Hurtado, J.A.; Perez-Ramirez, C.A. A CNN-based methodology for identifying mechanical faults in induction motors using thermography. Machines 2023, 11, 752. [Google Scholar] [CrossRef]
  54. Dahmer dos Santos, L.F.; dos Santos Canuto, J.L.; Thom de Souza, R.C.; Aylon, L.B.R. Thermographic image-based diagnosis of failures in electrical motors using deep transfer learning. Eng. Appl. Artif. Intell. 2023, 126, 107106. [Google Scholar] [CrossRef]
  55. Li, Q.-Y.; Wong, P.-K.; Vong, C.-M.; Fei, K.; Chan, I.-N. A novel electric motor fault diagnosis by using a convolutional neural network, normalized thermal images and few-shot learning. Electronics 2023, 13, 108. [Google Scholar] [CrossRef]
Figure 1. Proposed general methodology for multi-fault classification in electromechanical systems.
Machines 12 00928 g001
Figure 2. Experimental test bench used to test and detect failures in IM and GB wear.
Machines 12 00928 g002
Figure 3. Intensity vectors generated from thermographic images.
Machines 12 00928 g003
Figure 4. Feed-forward neural network with D inputs, K 1 hidden units in layer 1, K 2 hidden units in layer 2, and C .
Machines 12 00928 g004
Figure 5. FFT spectrum of each condition of the electromechanical system.
Machines 12 00928 g005
Figure 6. Proposed structure of the ANN model.
Machines 12 00928 g006
Figure 7. ANN model evaluation metrics against variations in input images: (a) flipped images, (b) images with +10% intensity, (c) images with +30% intensity, and (d) images with +50% intensity.
Machines 12 00928 g007
Table 1. Experiment matrix: image variations.
VariationsOrientationIntensity lvl.1Intensity lvl.2Intensity lvl.3
TestSpecular+10%+30%+50%
Table 2. Model performance using intensity profiles.
MLP (Optimizer: Adam, lr: 0.01)
Hidden
Layers
Neurons
in the Hidden Layer
Batch SizeEpochsAccuracy
2300,100323099%
646099%
12812099%
200,50326099%
649099%
1289099%
150,203212062%
648099%
12812079%
3300,100,50325099%
6412099%
12812098%
200,50,503290100%
646099%
12810099%
150,50,20327099%
6412066%
12812060%
MLP+FFT (Optimizer: Adam, lr: 0.01)
Hidden
Layers
Neurons
in the Hidden Layer
Batch SizeEpochsAccuracy
2300,1003275100%
6460100%
1287098%
200,503210099%
649099%
1289099%
150,203212020%
6412011%
12812010%
3300,100,503270100%
647599%
1288599%
200,50,5032100100%
649099%
12810099%
150,50,203212070%
6412096%
12812016%
Table 3. Evaluation metrics based on database size and method type.
DatabaseAccuracyPrecisionF1-ScoreAUCRecallTime of Training (s)Time of
Inference (s)
PI600100%100%99.81%100%99.79%22.480.0017
PIF100%100%100%100%100%29.170.0073
PI48099.22%99.74%99.22%100%98.9622.290.0119
PIF100%100%100%100%100%25.530.0116
PI36099.31%99.65%99.31%100%98.61%24.520.0024
PIF100%100%100%100%100%35.230.0090
PI24098.44%100%99.48%100%97.92%16.940.0101
PIF100%100%100%100%100%22.140.0090
PI12098.96%100%98.95%99.96%90.62%12.580.0306
PIF98.96%98.96%98.96%100%98.96%23.470.0169
Abbreviations: PI = percent intensity profile; PIF = percent intensity profile in frequency.
Table 4. Evaluation metrics for machine learning models.
ModelAccuracyPrecisionRecallF1-Score
KNN93.00%94.00%92.500%92.70%
RF93.00%95.32%93.33%92.95%
LR99.00%99.30%99.16%99.19%
ANN (proposed)100.00%100.00%100.00%100.00%
Table 5. Comparison of multi-failure detection methods for electromechanical systems based on thermographic imaging.
ReferenceClassification MethodImages/
Camera
Fault (Number)Accuracy
[48]Self-organizing maps240/FLIR GF320Healthy, unbalance, misalignment, bearing (4)84.4–99.7%
[49]Extremely randomized tree-/Dali-tech T4/T8Healthy, short circuit faults in the stator windings (9)100%
[50]SVM36/-Healthy, overload, fault (3)97%
[51]K-means + SVM394/Dali-tech T8Healthy, blocked rotor, blocked fan, short circuit at different levels in one, two or three phases of stator (11)100%
[52]PCA—ANN2160/FLIR LEPTON 3Healthy, misalignment, unbalance, broken bars, rolling bearing fault, wear and tear in the gearbox (12)96.8%
[53]CNN200/FLIR GF320Healthy, ball bearing damage, broken rotor bar, misalignment (4)95–99.6%
[54]CNN (RegNetX002)369/Dali-tech T4/T8Healthy, cooling, rotor, and stator-1, 2 or 3 phases (11)98.18%
[55]CNN2820/UTi260BThree motors: healthy, bearing fault, coil fault, fan fault (11)91.8–98.9%
Intensity profile + ANN (Proposed)600/FLIR GF320Healthy, bearing defect, broken rotor bar, misalignment, 50 % and 75 % gear wear in gearbox (12)100%
Disclaimer/Publisher’s Note: The statements, opinions and data contained in all publications are solely those of the individual author(s) and contributor(s) and not of MDPI and/or the editor(s). MDPI and/or the editor(s) disclaim responsibility for any injury to people or property resulting from any ideas, methods, instructions or products referred to in the content.

