1. Introduction
Gear systems are widely used in the mechanical field due to their unique advantages. These systems have minimal energy loss, with transmission efficiency exceeding 90%, and can endure significant loads and impacts, showcasing excellent load-bearing capacity. This ensures stability and reliability during the transmission process [
1]. As a core component of these systems, gears are susceptible to faults such as cracks, tooth breakage, pitting, and spalling under conditions of overload and fatigue [
2,
3,
4]. These failures not only pose serious threats to the safe operation of the system but can also lead to substantial economic losses and, in severe cases, endanger human safety [
5]. Therefore, understanding the mechanisms of gear failures is crucial for ensuring system safety [
6,
7]. Among common gearbox failures, tooth root cracks and bearing outer ring defects significantly impact the normal operation of gearboxes [
8,
9,
10]. By analyzing the mechanisms of tooth root cracks and bearing outer ring faults, we can unveil the failure evolution process. Understanding this evolution pattern will help in predicting faults more accurately, allowing for timely preventive measures. The characteristic frequencies extracted from the research findings can serve as key diagnostic indicators in practical fault diagnosis systems. By comparing these fault characteristics with real-time data, we can effectively determine whether a fault has occurred or is evolving, providing strong support for equipment maintenance.
In the study of tooth root crack failures, Fakher et al. [
11] introduced linear cracks at the tooth root fillet and found that the meshing of cracked teeth reduces the effective tooth width and time-varying mesh stiffness of the gear. Yang et al. [
12,
13] further refined the calculation formula for time-varying mesh stiffness under linear crack conditions and validated it through finite element analysis. Li et al. [
14] developed a dynamic model of a gear system with crack faults, simulating the effects of linear cracks at different depths. Their study revealed that as crack depth increases, the vibration amplitude of the system grows significantly.
In the above-mentioned studies on gear failures, time-varying mesh stiffness changes with the gear meshing state, and mesh stiffness is an important nonlinear factor in gear research. Yang et al. [
15] were the first to propose simplifying gear teeth as a cantilever beam model. Based on this, Tian [
16] and Wu et al. [
17] introduced shear stiffness to further improve the method. Zhou [
18] and Wan et al. [
19] considered the effect of foundation stiffness, enhancing the accuracy of the calculations. To address the issue of overestimated stiffness in the dual-tooth meshing zone due to the lack of consideration for tooth-to-tooth coupling effects in traditional methods, Wang et al. [
20] used the finite element method to significantly reduce the calculation error. Ma et al. [
21] adjusted the mesh stiffness of the dual-tooth meshing zone using correction factors. However, these methods require the finite element model to be reconstructed for different gear types. To improve the generalizability of the potential energy method, Timo et al. [
22] used empirical formulas to calculate gear mesh stiffness.
In studies on bearing outer ring failures, Randall et al. [
23,
24] established a two-degree-of-freedom bearing dynamics equation to simulate raceway and rolling element failures. Jiang et al. [
25] further refined this model by considering the spatial relationships between components. Wang et al. [
26] simulated bearing outer ring defects using boundary functions and developed a three-degree-of-freedom rolling bearing dynamics equation to study system bifurcation and chaotic phenomena. Zhang et al. [
27] simulated bearing outer ring failures by varying the bearing clearance and analyzed vibration signals at different measurement points. Pang et al. [
28] introduced displacement excitation to simulate outer ring faults, demonstrating that the rotor and bearing produced low-frequency and high-frequency resonances, respectively.
Currently, research on single faults such as tooth root cracks and bearing outer ring defects is relatively mature. However, there are still limitations. The method of replacing actual crack propagation paths with linear cracks does not consider the variation in stress intensity factors at the crack tip during propagation. Additionally, tooth-to-tooth coupling effects have a significant impact on gear mesh stiffness, and in practical operations, gearbox failures often manifest as compound failures. As cracks continue to propagate, the influence of compound failures on the system becomes more pronounced. This paper simulates the actual crack propagation path and calculates the gear’s time-varying mesh stiffness based on the crack’s actual deterioration path, taking tooth-to-tooth coupling effects into account. A dynamic model of the system with compound faults of tooth root cracks and bearing outer ring defects is established to study the variations in the system’s dynamic characteristics during crack deterioration.
2. Simulation Analysis of Fatigue Crack Growth
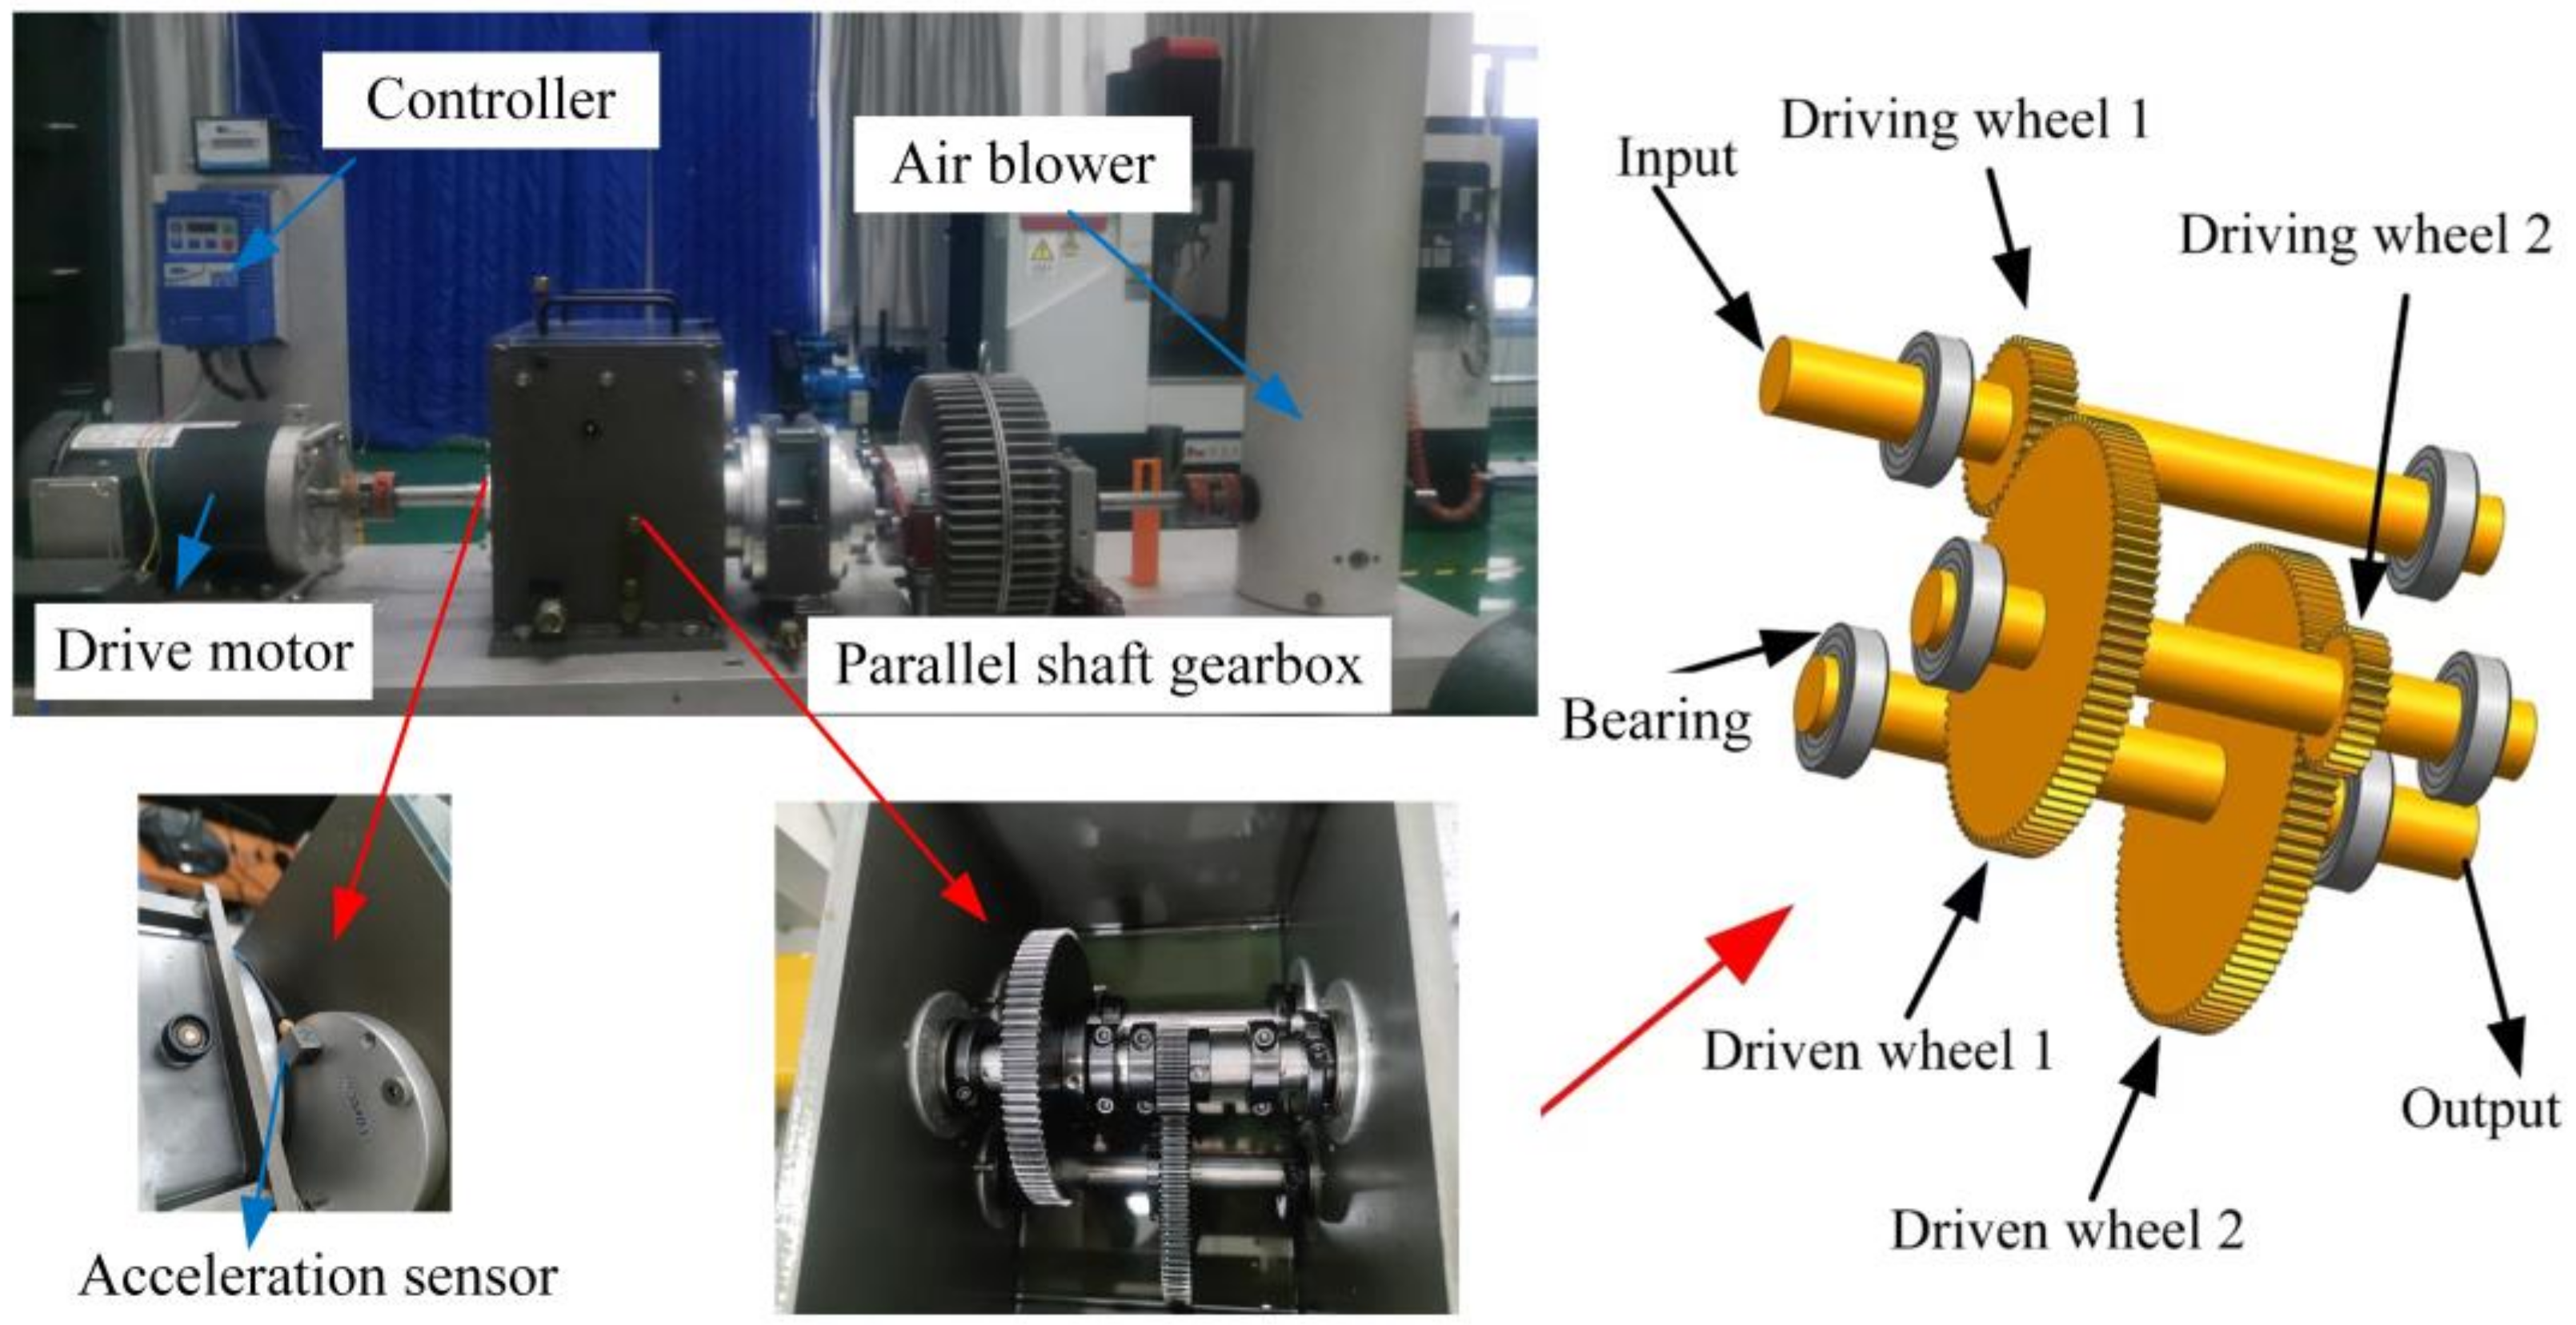
This paper takes the power transmission fault diagnosis comprehensive test bench of the wind turbine as the research object, as shown in
Figure 1. The test bench mainly consists of a controller, a driving motor, a two-stage parallel shaft gear transmission system, and a wind turbine. The accelerometer is located on the end cover on the active side of the input shaft gear. The gear parameters are shown in
Table 1. The crack propagation of gear teeth is closely related to material properties, which determine the material’s fracture toughness and fracture threshold value. The gear material of the gearbox is 45 steel, and its material-related parameters are listed in
Table 2.
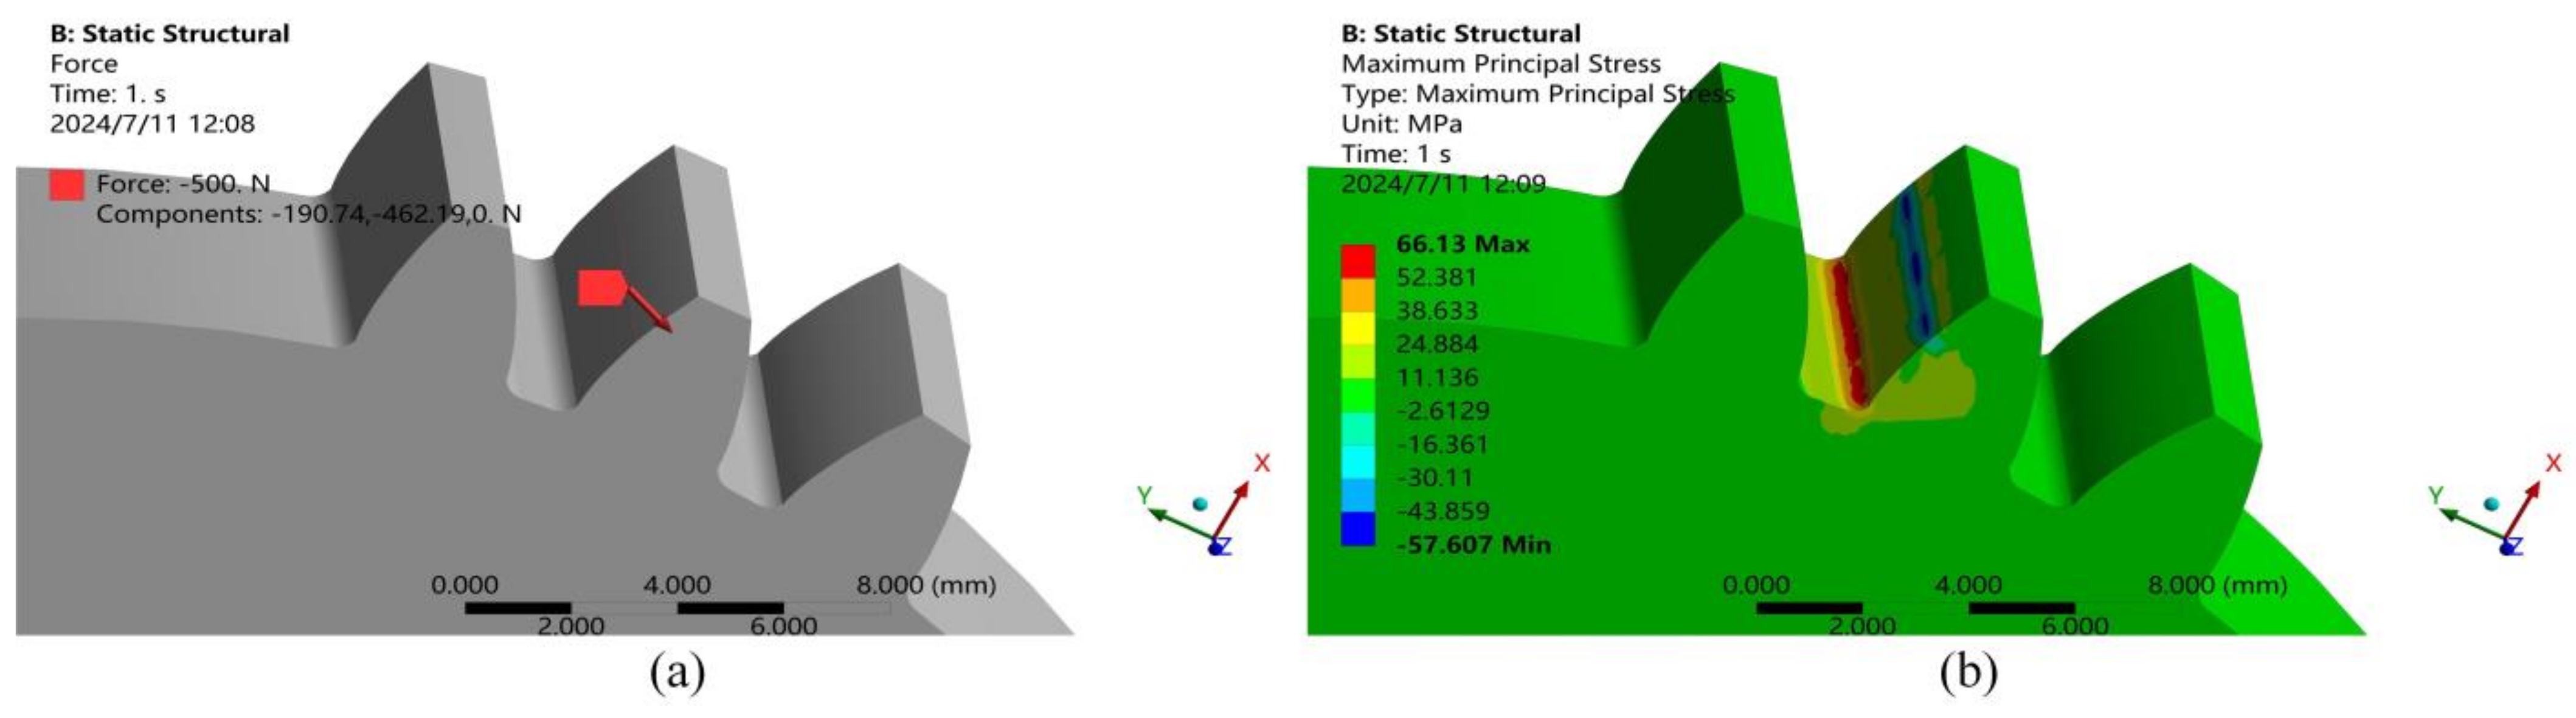
A 36-tooth gear was selected as the subject of this study, and the crack propagation path of a tooth root crack was analyzed using the intelligent crack growth module in Workbench. A gear model was established, with fixed constraints applied at the gear shaft hole location. A line load was applied at the highest point of the single-tooth meshing zone to determine the maximum stress point. The maximum stress point was located at the tooth root fillet, with coordinates (25.337, 1.4847, 11.625), as shown in
Figure 2.
The maximum stress point was set as the crack expansion point, the initial crack of 0.2 mm was drawn, and the central axis of the crack was perpendicular to the tooth profile. The crack growth path at the root of the gear was simulated using the Workbench Smart Crack Growth Module based on the Pairs formula, with the related parameters of the Pairs formula shown in
Table 2. The loading model used is the HPSTC model. Compared with the crack deterioration path under the fatigue test, the simulated crack growth path is consistent with the experimental results. The fracture surface is concave, and the path curvature gradually increases, as shown in
Figure 3.
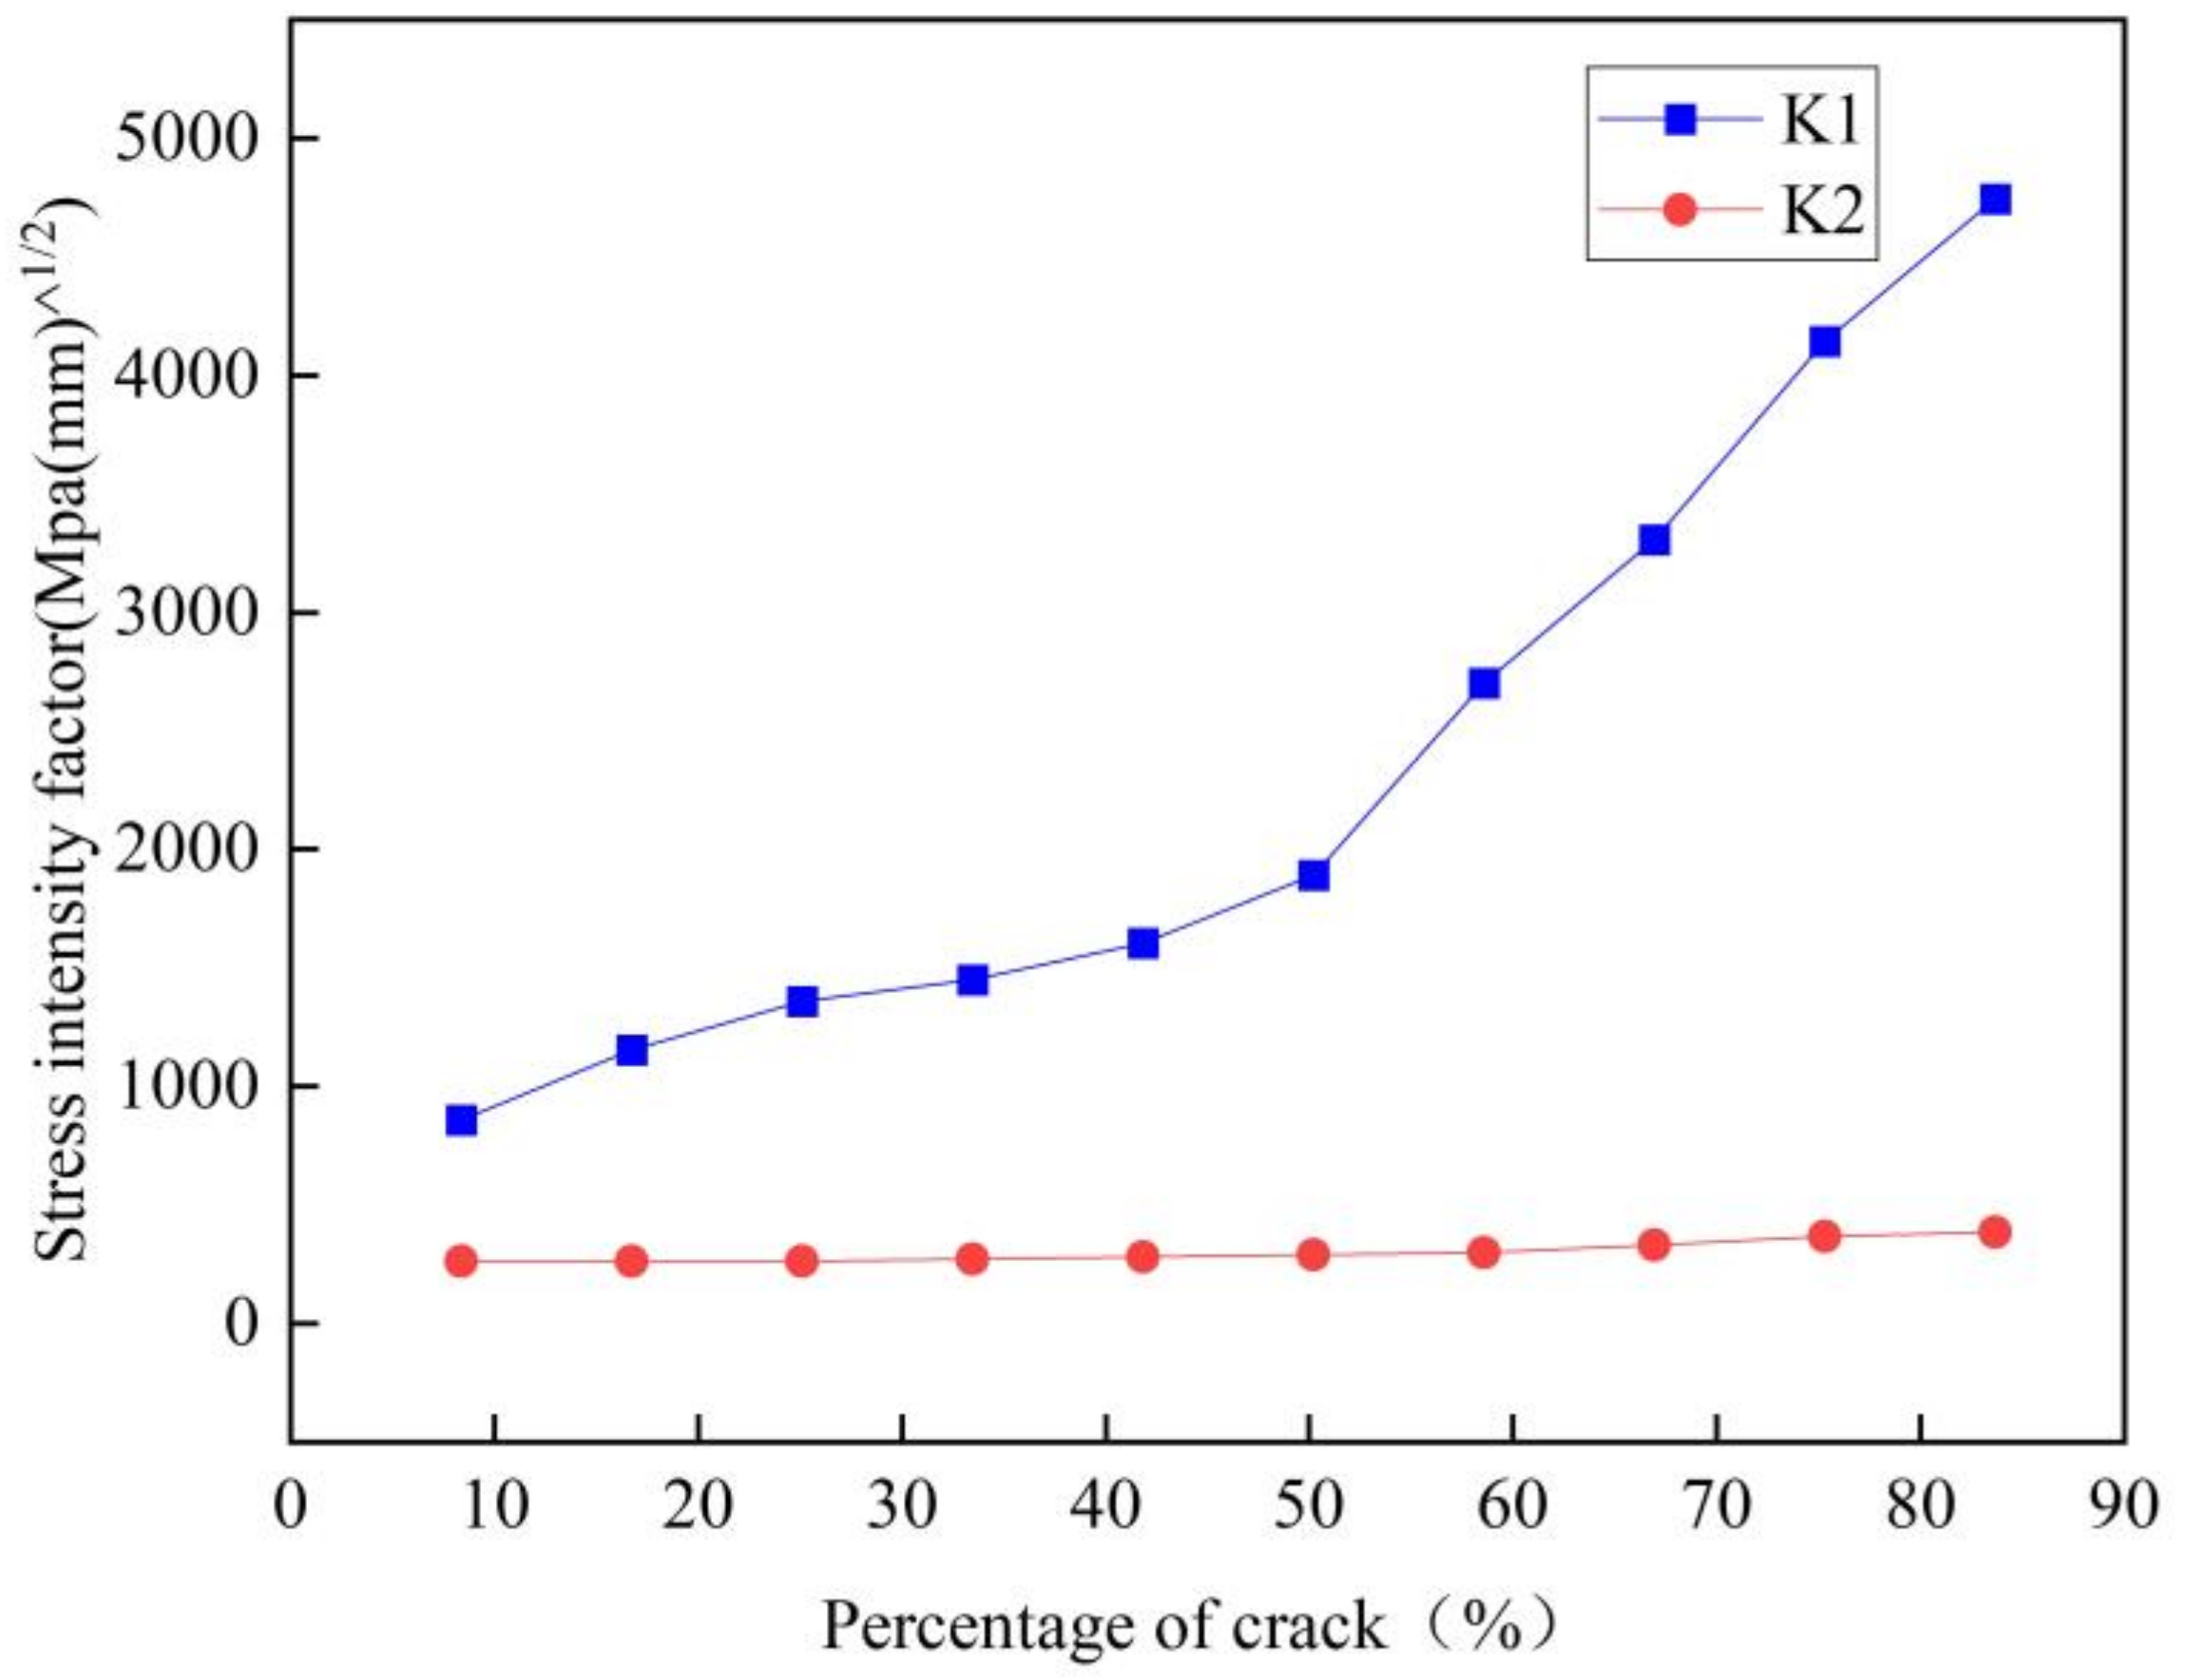
Figure 4 illustrates the changing trend of stress intensity factors K1 and K2 during crack expansion. The figure indicates that K1 and K2 increase as crack depth increases, but the value of K1 is much more significant than K2. The fracture form of the gear crack is primarily a type I crack, with the dangerous fracture point occurring when the crack depth reaches approximately 60%. From this point on, the gear tooth may break at any time, resulting in a broken tooth fault.
3. TVMS Under Crack Deterioration
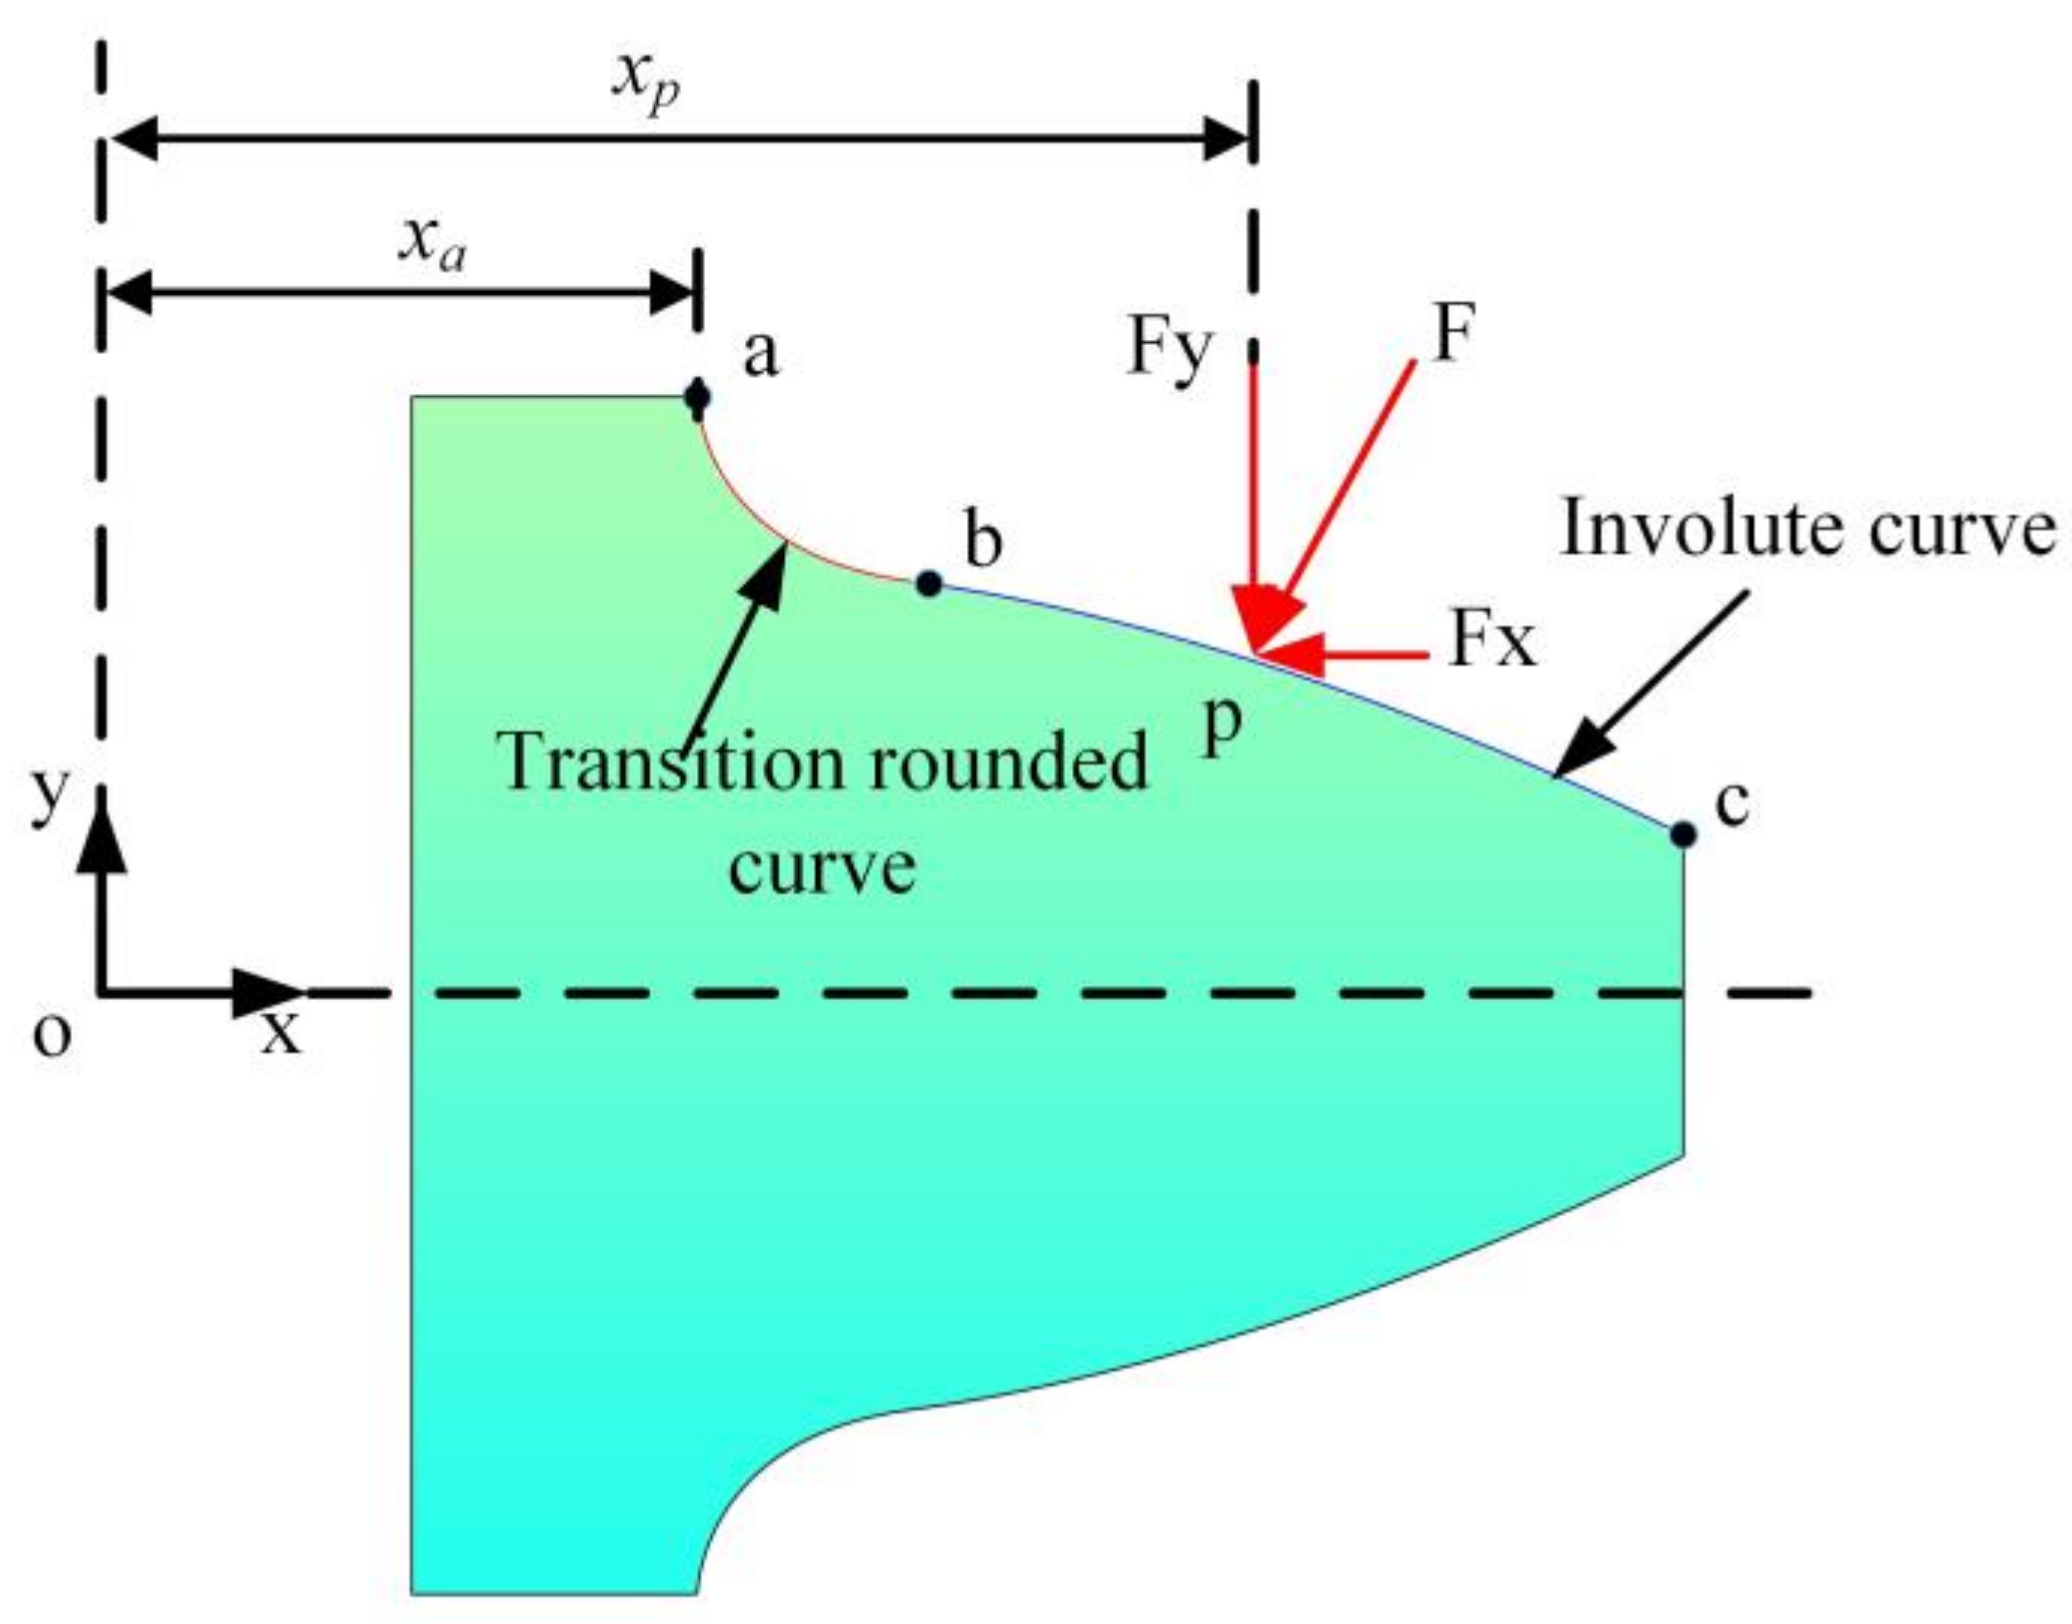
The gear tooth profile consists of two parts: tooth root arc and involute curve. As shown in
Figure 5. Through the force analysis of gear teeth, the energy of gear teeth is divided into five parts: axial compression energy
, bending energy
, shear energy
, Hertz contact energy
, and matrix energy
[
29]. The analytical formula can be seen in Equation (1).
where
is the gear meshing force,
is the moment of inertia,
is the cross sectional area.
By further deriving Equation (1), energy can be transformed into the corresponding stiffness, as shown in Equation (2):
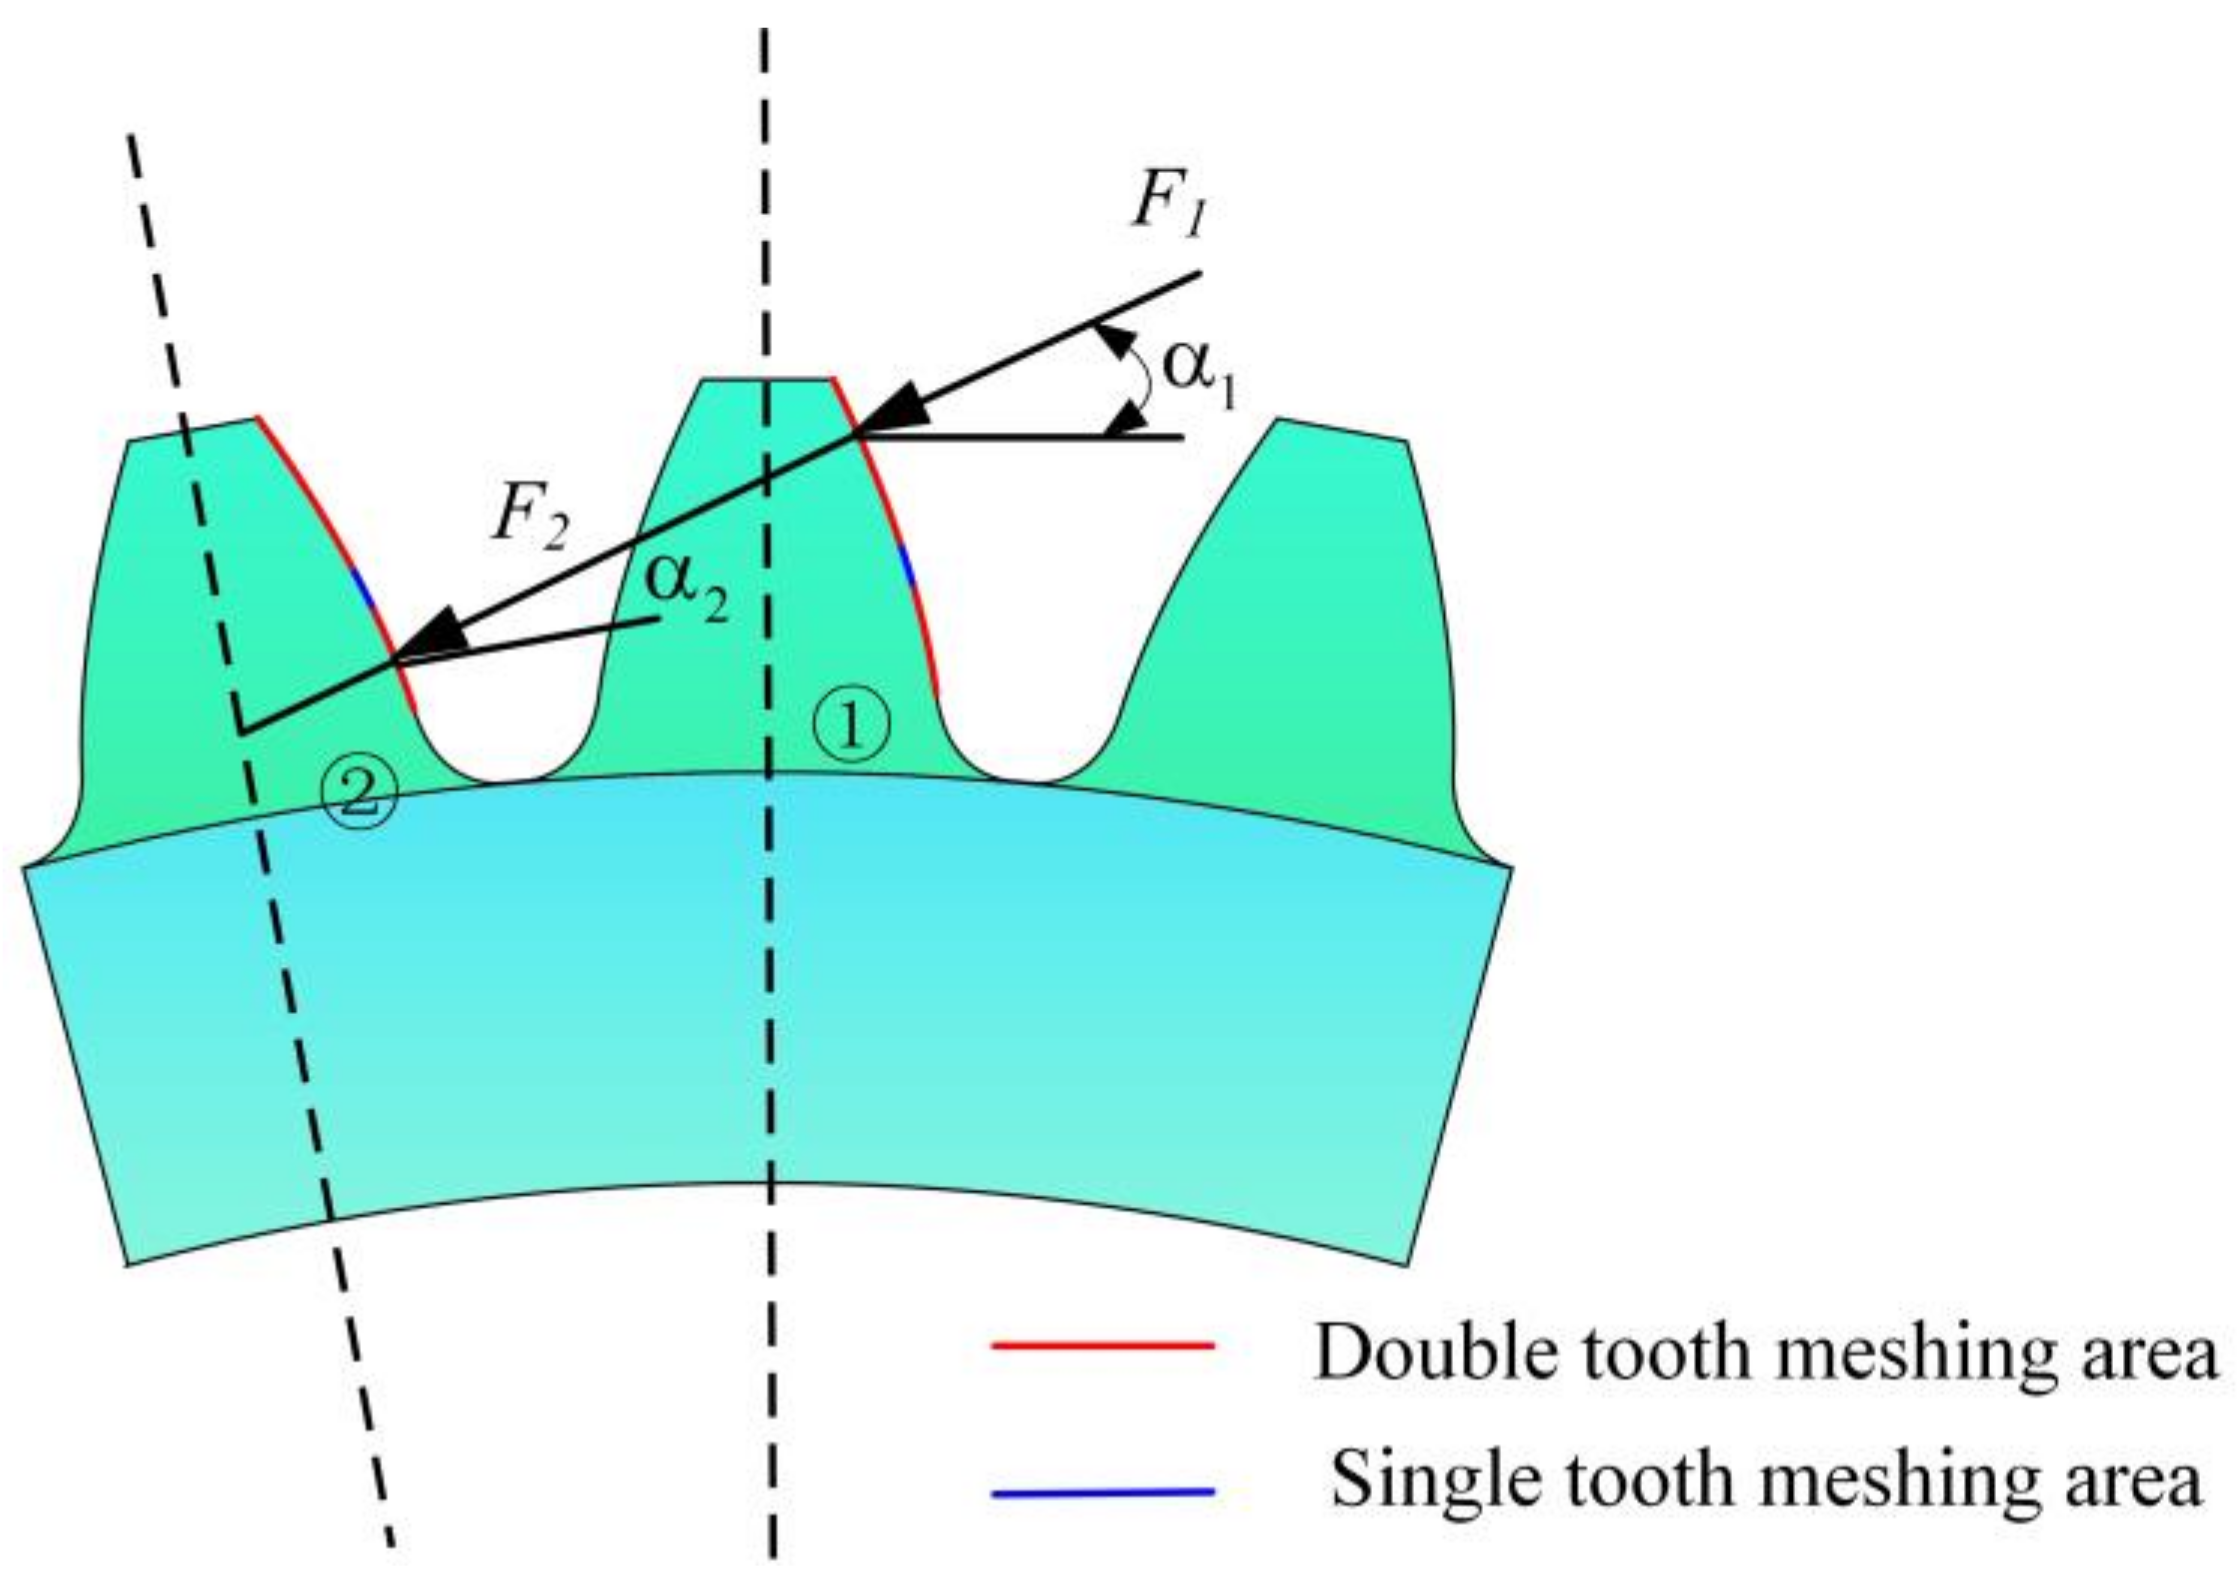
To address the issue of excessive time-varying meshing stiffness (TVMS) in the double-tooth meshing area caused by the lack of consideration of the coupling between the teeth in the traditional method, different matrix stiffness calculation formulas are used to compute the matrix stiffness in different meshing zones.
There is only one tooth carrying load in the single-tooth engagement area, so there is no need to consider the coupling effect between teeth. Sainsot’s formula is used to calculate the matrix stiffness, as shown in Equation (3):
where
,
,
,
,
, and
are detailed in reference [
30].
In the double-tooth engagement zone, two pairs of gear teeth participate in the force simultaneously, as shown in
Figure 6. The force on the first pair of gears will be transferred to the second pair of gears along with the substrate. The matrix stiffness of each tooth needs to be calculated separately, as shown in Equation (4):
where
and
are the stiffness of the gear matrix of No. 1 tooth and No. 2 tooth in the double-tooth meshes area;
and
are the contributions of
and
in the matrix deformation of No. 1 tooth; and
and
are the contributions of
and
in the matrix deformation of No. 2 tooth, respectively.
,
,
, and
are shown in Equations (5) and (6):
where, for
,
,
,
,
,
,
,
,
,
,
,
,
see reference [
31] for details.
In summary, the calculation formula of the TVMS is shown in Equation (7):
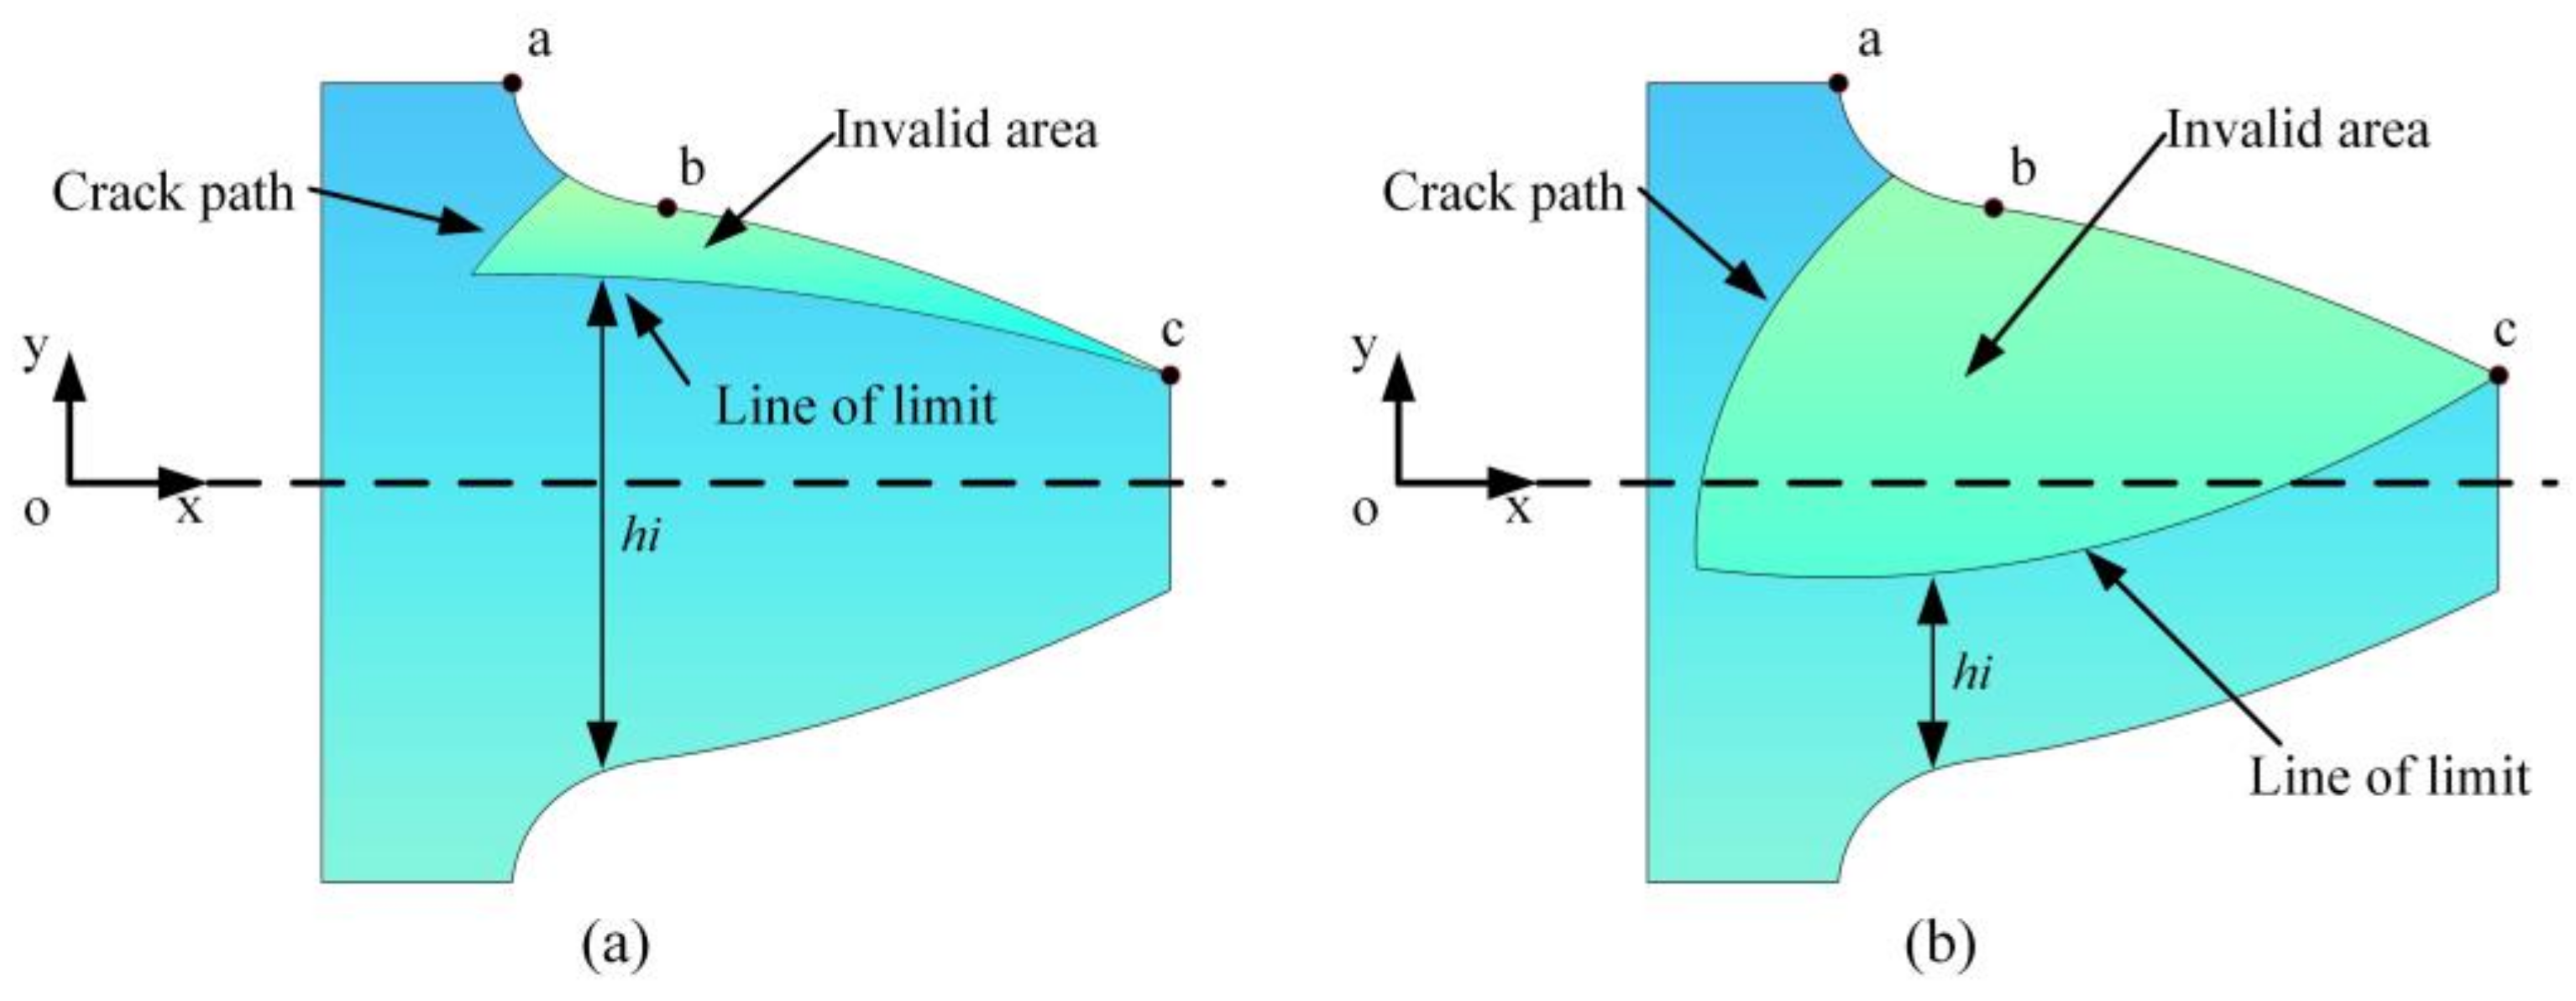
Based on the above crack deterioration path, the stress state of the cracked gear tooth is analyzed. The presence of cracks leads to changes in the effective bearing area of the gear teeth during meshing [
32]. The invalid area refers to the region that does not participate in load-bearing during meshing, and it is a closed area formed by the crack path, tooth profile curve, and the limit line. The limit line is a parabola, with the starting point being the endpoint of the crack propagation path and the endpoint being the gear tooth vertex. The parabola can be classified into two types: opening upwards and opening downwards. A schematic diagram of the limit line is shown in
Figure 7. As the crack continues to deteriorate, the invalid area gradually increases. Under the action of crack deterioration,
and
are shown in Equation (8):
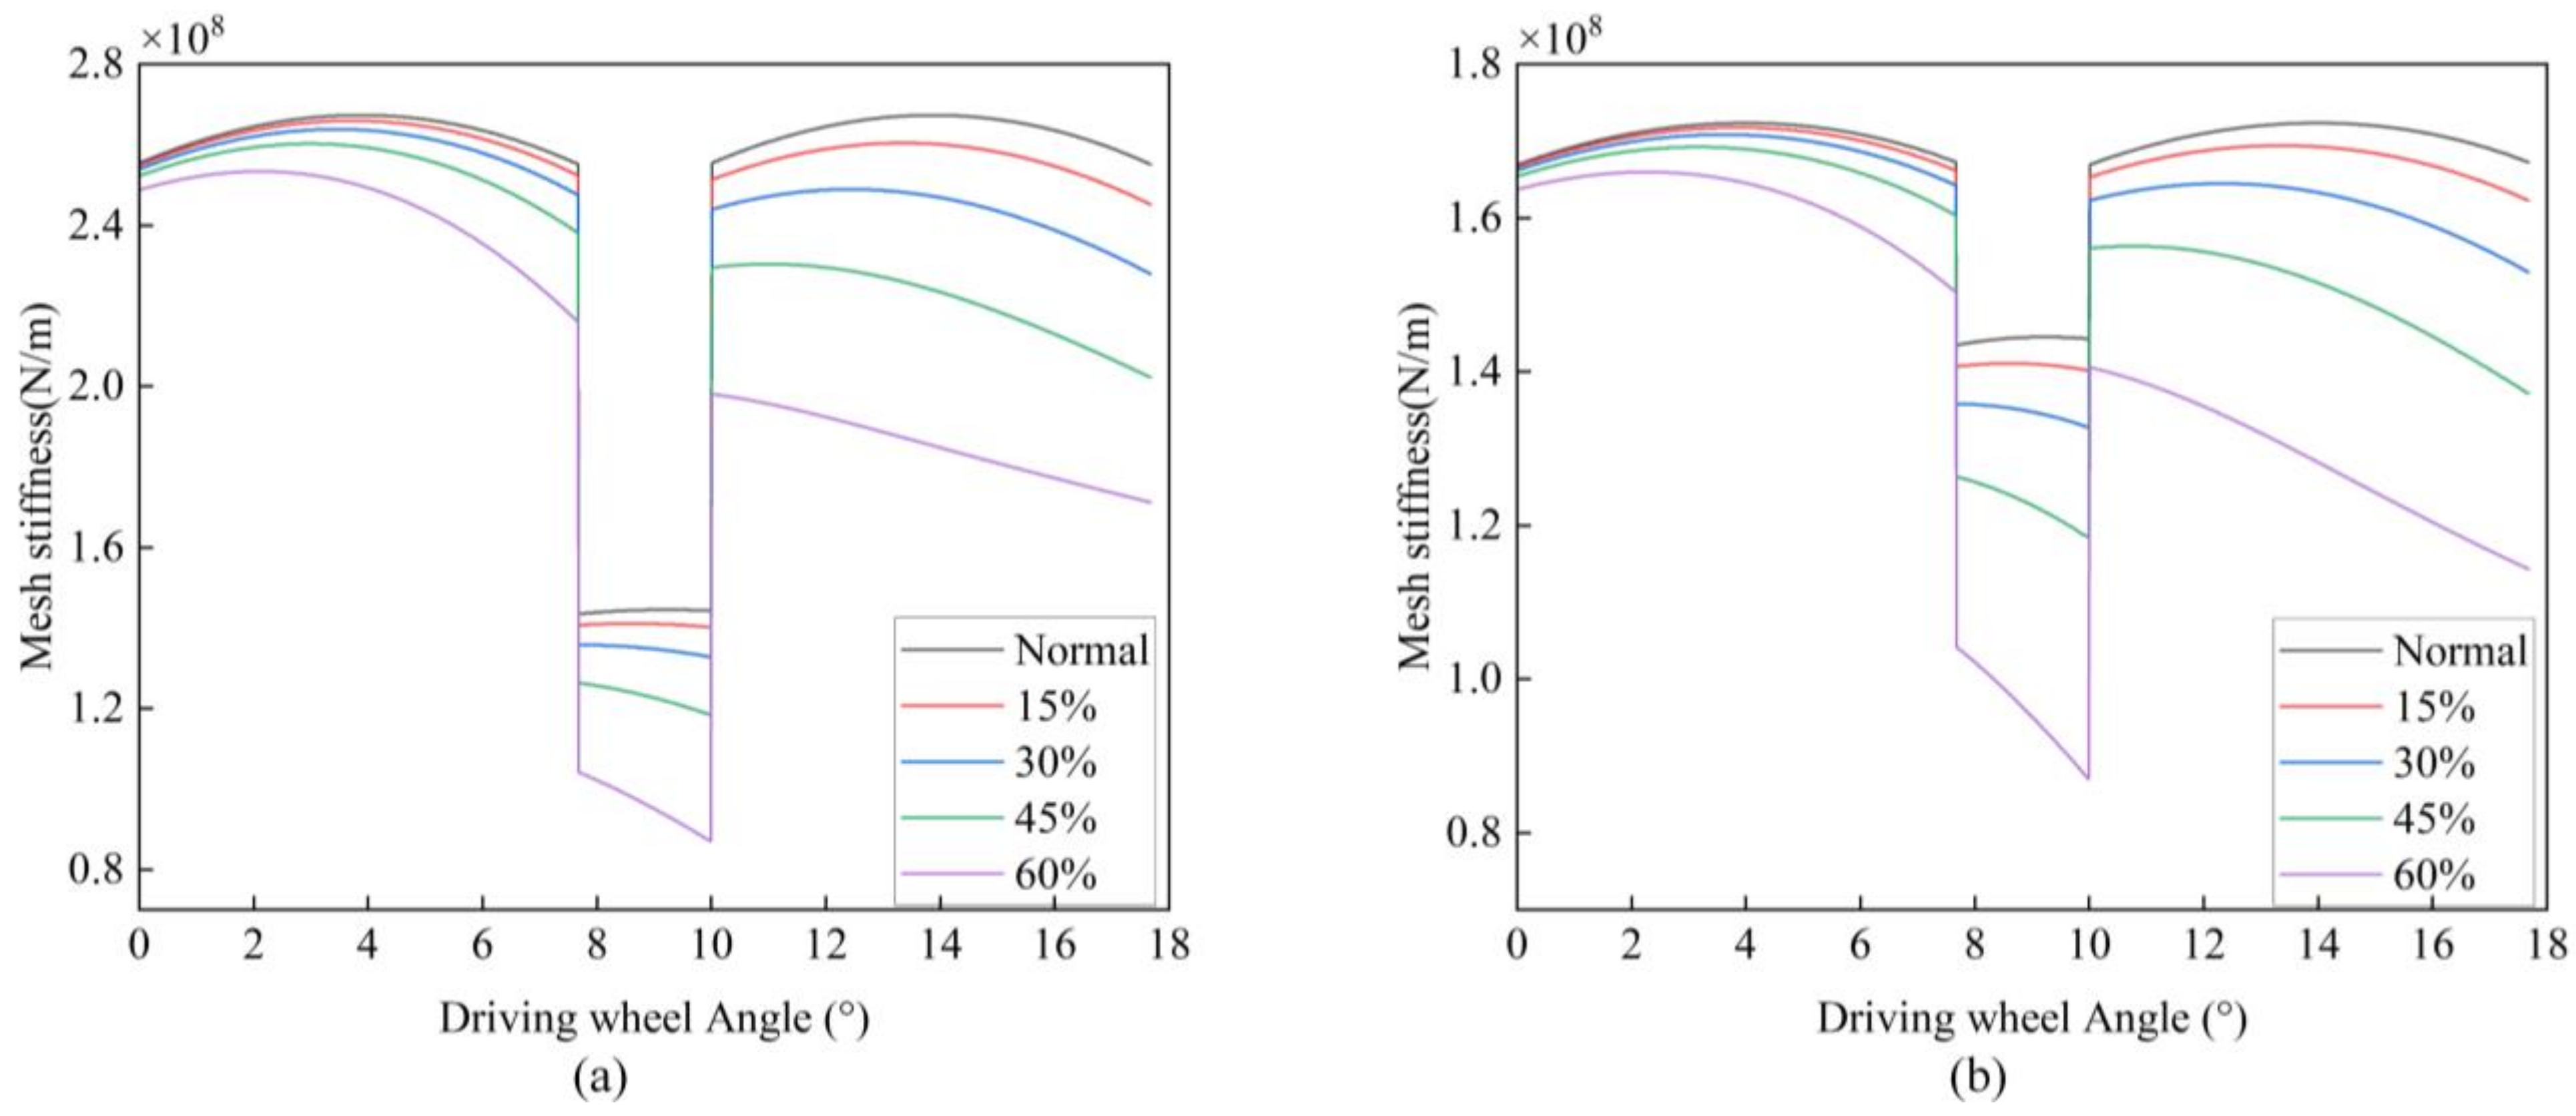
When the crack deteriorates to about 60%, the dangerous fracture point is reached, and the tooth may fracture at any time from this point on through the analysis of k1. Therefore, this paper calculates and analyses the variation law of the TVMS before the crack reaches the critical fracture point. When the crack propagates to 60%, the dangerous fracture point is reached, and the tooth may fracture at any time from this point on. Therefore, this paper calculates and analyses the variation law of the TVMS before the crack reaches the critical fracture point. The percentage of crack growth is shown in
Figure 8. With the continuous deterioration of the crack, the gear meshing stiffness decreases continuously because the effective bearing area decreases continuously, and the invalid bearing area increases continuously. The decreased amplitude of the TVMS increases with the deterioration of the crack. Under the crack fault, the TVMS gradually decreased as the meshing line moved from the tooth root position to the tooth top position. In this process, compared with the healthy gear teeth, the invalid bearing area of the cracked gear teeth is constantly expanding. Compared with the situation without considering the inter-tooth coupling, the TVMS of the meshing area of the two teeth considering the inter-tooth coupling decreases significantly by about 53.03%. When the crack is extended to 60%, the stiffness of the second two-tooth meshing area is smaller than that of the normal gear single-tooth meshing area. This is because the second two-tooth meshing area is the meshing between the top tooth of the faulty gear and the root tooth of the normal gear, mainly carried by the faulty gear. Therefore, the coupling effect between teeth must be when calculating the TVMS under the crack addressed. The variation of TVMS is shown in
Figure 9.
Figure 9a represents the time-varying mesh stiffness of the cracked gear without considering the inter-tooth coupling, while
Figure 9b represents the time-varying mesh stiffness of the cracked gear with inter-tooth coupling considered.
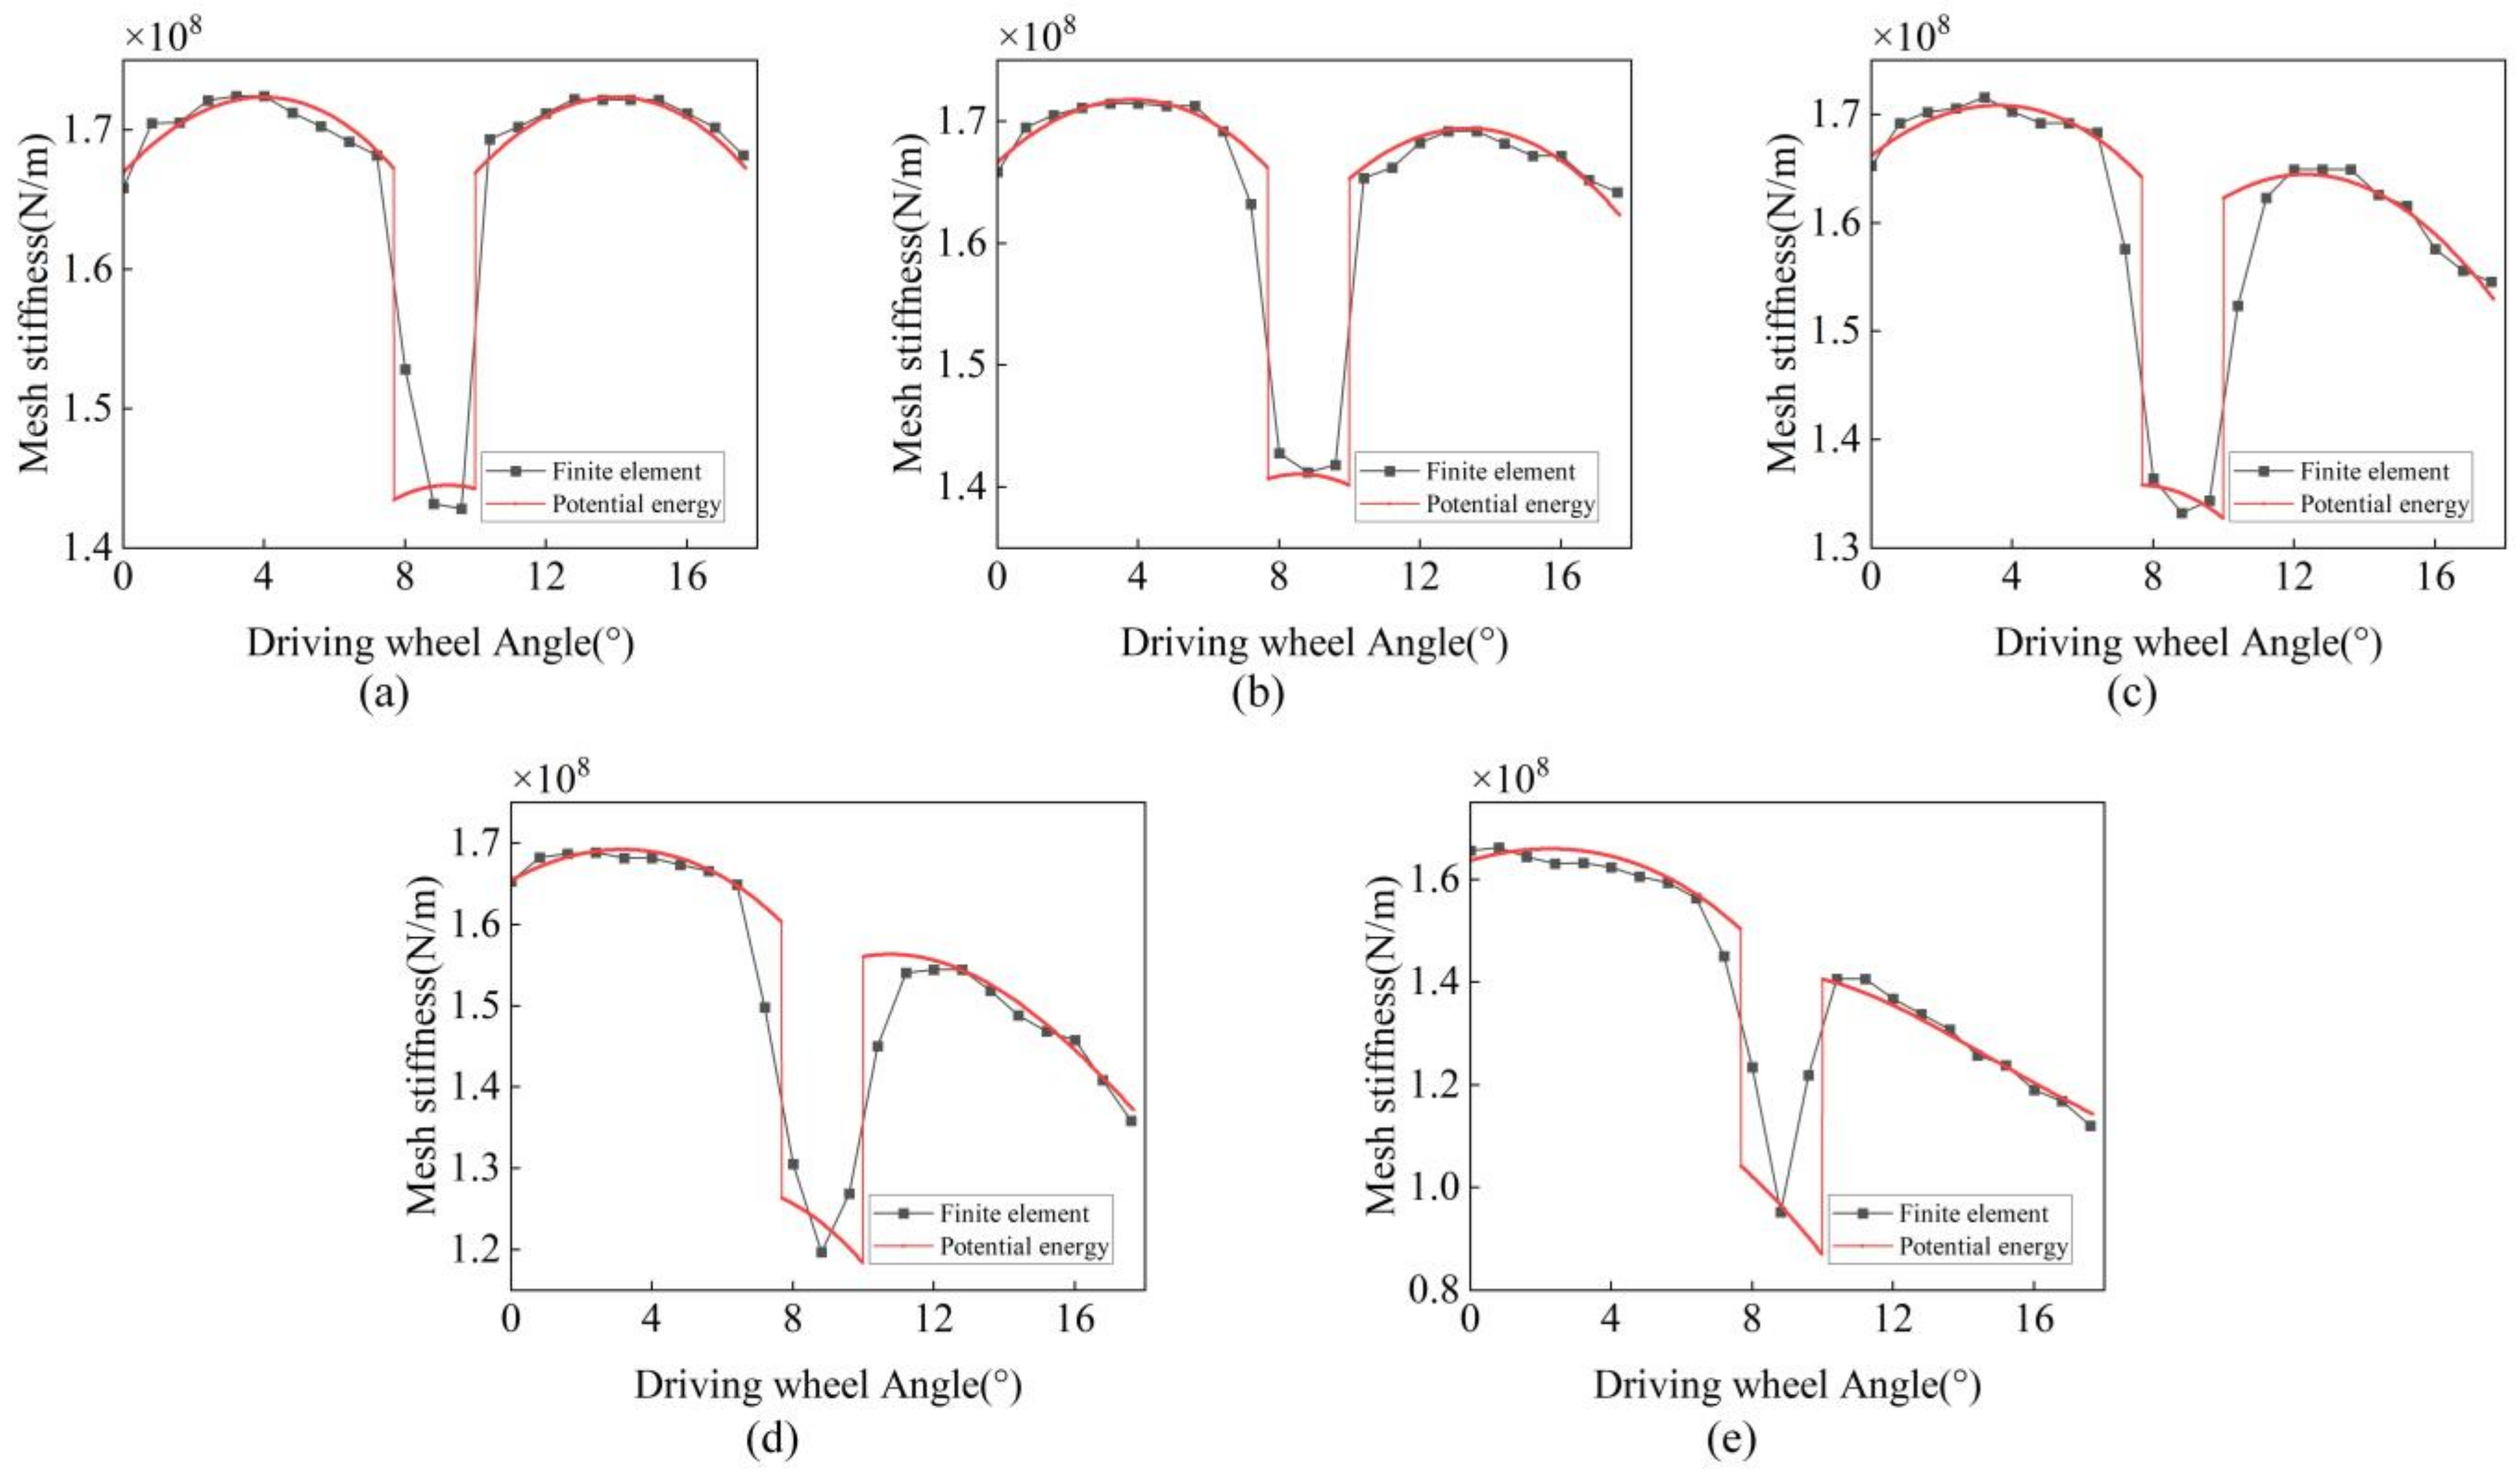
The time-varying mesh stiffness calculated using the potential energy method was validated through transient structural analysis in ANSYS. A rotational speed was applied to the driving gear, while a load was applied to the driven gear. The contact was set to “adjusting contact”. The mesh was generated using tetrahedral elements, as shown in
Figure 10. Finite element analysis was performed to simulate the time-varying mesh stiffness of normal gear and gears with deterioration levels of 15%, 30%, 45%, and 60%. The comparison results are shown in
Figure 11. In the dual-tooth meshing region, the results from both methods are largely consistent, while some discrepancies are observed in the single-tooth meshing region. This is due to the fact that during the actual meshing process, gear deformation leads to premature engagement and delayed disengagement of the gear teeth, reducing the load-bearing time in the single-tooth meshing region. This effect becomes more pronounced as the crack deterioration progresses.
4. Establishment of Dynamic Model of the Parallel Shaft Gearbox of Wind Turbine
Using the finite element method, a dynamic model of the two-stage parallel shaft gearbox is established. The structural diagram of the parallel shaft gearbox of the wind turbine is illustrated in
Figure 1. The parallel shaft gearbox of a wind turbine comprises three components: gear, bearing, and shaft. The shaft and bearing parameters are provided in
Table 3 and
Table 4.
The finite element method divides the two-stage parallel shaft gear system into three elements. There are three types of elements: shaft segment element, meshing element, and bearing element, as shown in
Figure 12, where the input shaft is divided into 12 elements, the intermediate shaft into 8 elements, and the output shaft into 9 elements. Node 7 and Node 16 contain the first stage driving wheel and slave wheel, meshing each other to form the first stage gear meshing unit; Node 20 and Node 29 contain the second stage driving wheel and slave wheel, meshing each other to form the second stage gear meshing unit. Node 5, Node 13, Node 14, Node 22, Node 23, and Node 31 contain bearings and form bearing units. In the simulation process, a rotational speed is applied to the input shaft to simulate the actual operating condition of the wind turbine, while a torque is applied to the output shaft to simulate the load condition at the output end.
4.1. Shaft Element
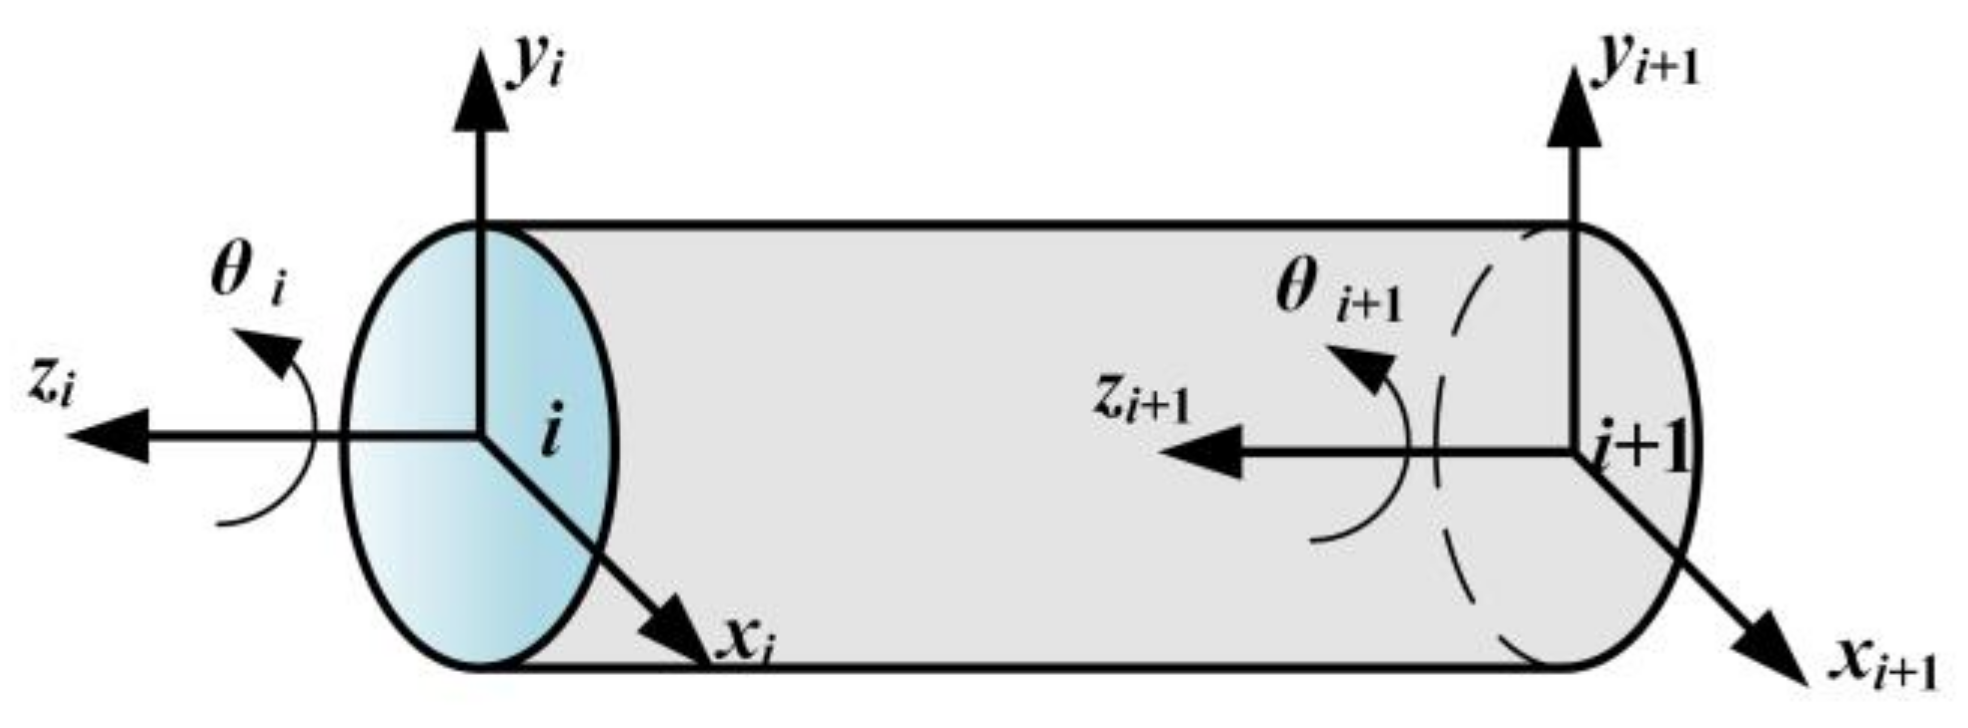
Timoshenko beam elements are used in this paper. Since the research object is the parallel shaft gearbox of a wind turbine, the gearbox transmission shaft is primarily affected by torsion and bending, with minimal axial force. Consequently, two lateral translations and one torsional are considered for each axis element node. The coordinate system of the axis segment element is shown in
Figure 13. The displacement component of the element section is represented in Equation (9):
Rayleigh damping is used for the structure damping, as shown in Equation (10):
where is the scaling coefficient of Raleigh damping, and M and K as shown in Equations (11) and (12):
where
is the element length,
is the element cross-sectional area.
Then, dynamic equation of axial element is shown in Equation (13):
4.2. Gear Meshing Element
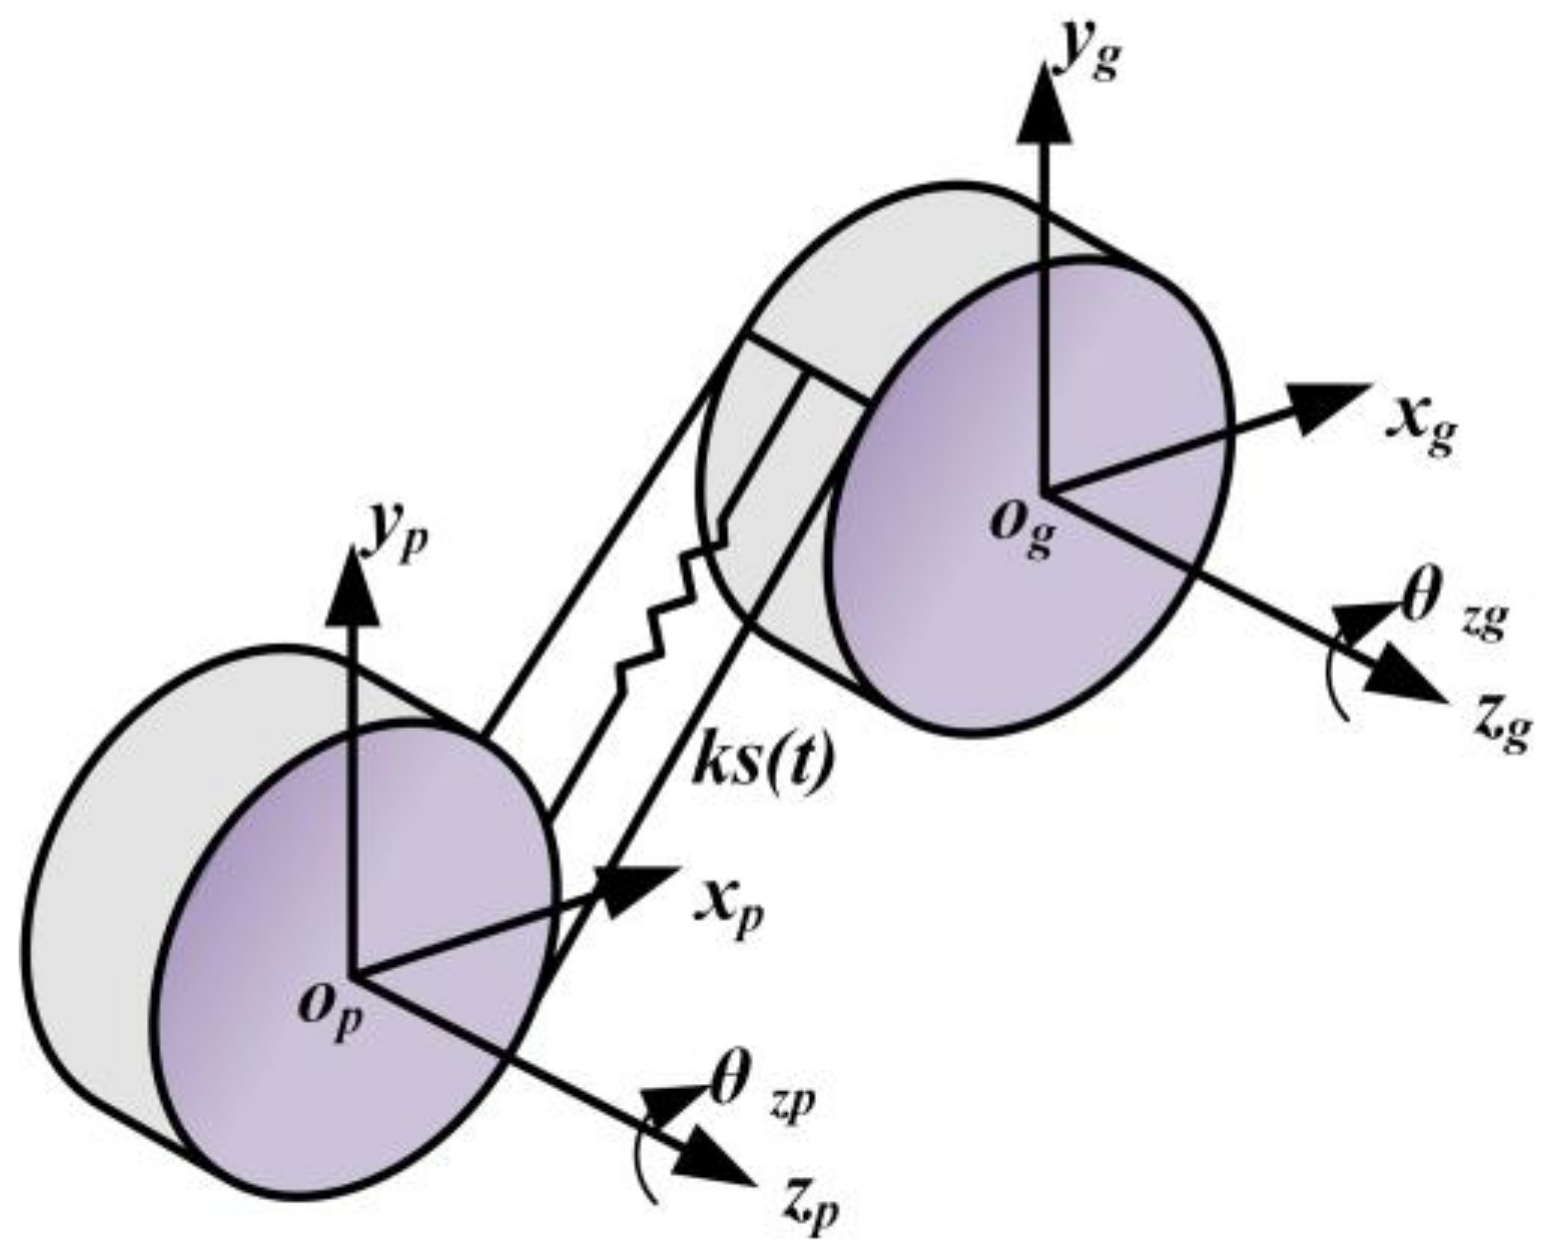
Modelling the gear meshing unit, there are torsional and radial vibrations in the direction of the perpendicular and axis, and there is no axial movement [
33], as shown in
Figure 14. The displacement component of the element node is shown in Equation (14):
The vibration displacement is projected along the meshing line direction, and the relative total deformation between gear pairs is shown in Equation (15):
where
.
The dynamics equation of the gear meshing element is given in Equation (16):
where
is the TVMS, and
is the meshing damping.
Then, the dynamic equation of the meshing element is shown in Equation (17):
where
,
,
.
4.3. Bearing Element
Considering radial vibration, with no axial movement, as shown in
Figure 15. The displacement component of the element joint is provided in Equation (18):
The contact deformation between a normal bearing and a bearing with an outer ring fault is illustrated in
Figure 16. When a rolling element enters the damaged area of the outer ring, the bearing clearance suddenly increases, leading to a rapid decrease in the Hertzian contact force between the roller and the inner and outer rings. This directly affects the contact state between the roller and the outer ring [
27,
28]. The reduction in contact force causes a significant change in the stiffness of the bearing. The outer ring fault has a damage diameter of
and a damage depth of
. The contact deformation of the rolling element during operation is described by Equation (19).
where
is the clearance of bearings,
is speed of bearing cage,
is the initial angle of the rolling element,
, and
.
Under quasi-static conditions, the resultant force on the bearing is shown in Equation (20):
If the displacement and deformation are differentiated, the total bearing stiffness is as shown in Equation (21):
where
is the load-deformation index,
is the total contact stiffness, as shown in Equation (22):
where
and
are the contact stiffness, as shown in Equation (23):
where
,
,
, and
are the ellipse parameters.
Then, the differential Equation of bearing unit motion is shown in Equation (24):
where
,
,
.
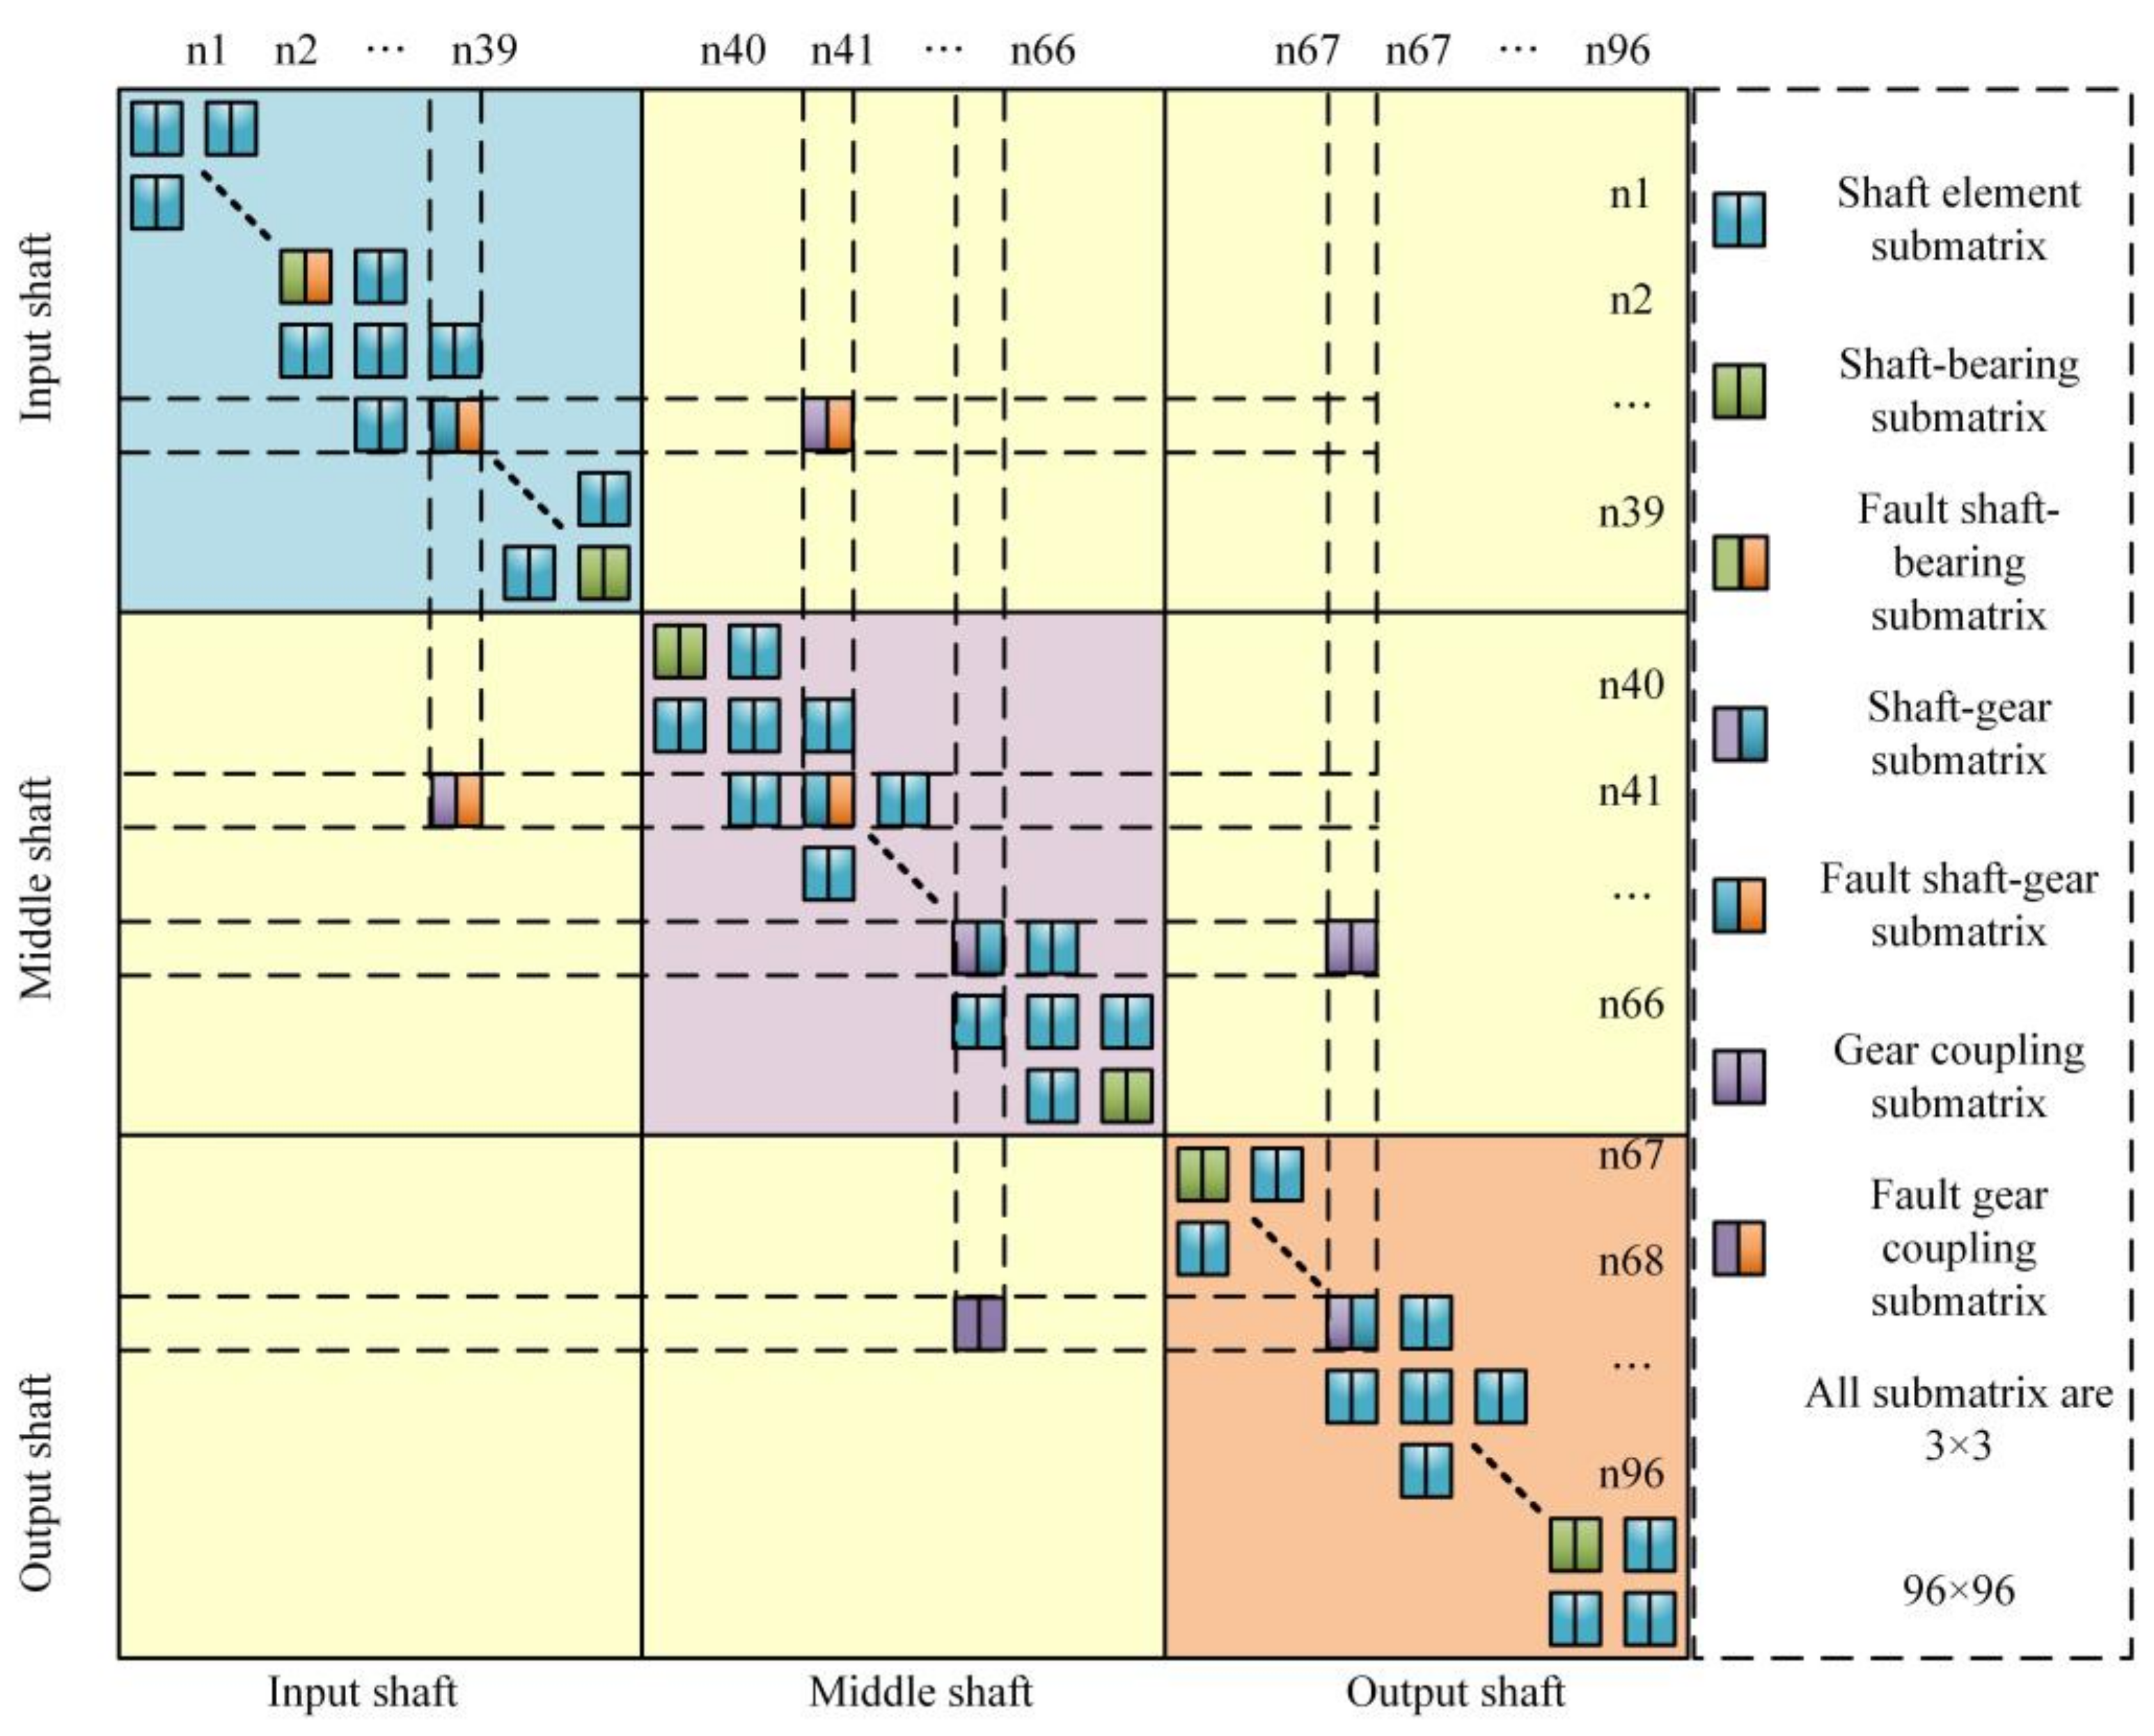
4.4. Unit Assembly
The overall motion equation of the parallel shaft gearbox of the wind turbine is shown in Equation (25). The total stiffness matrix is shown in
Figure 17.
5. Dynamic Response Analysis
The dynamic response in both healthy and faulty states is solved using the Newmark method [
34,
35]. The input speed of the input shaft is
, the input shaft rotation frequency is
, the middle shaft rotation frequency is
, the output shaft rotation frequency is
, the first stage gear meshing frequency is
, the second stage meshing frequency is
, and the bearing outer ring fault frequency is
. The crack gear is on the input shaft, the crack fault period is
, and the bearing fault period is
.
Since the crack gear and the fault bearing are on the input shaft, the vibration acceleration of node five is analyzed. The vibration response of the system without fault is shown in
Figure 18. Without fault, the time-domain signal has no obvious impact, and the frequency-domain signal is mainly composed of the gear meshing frequency and its doubling frequency.
The time-domain response under crack deterioration is shown in the
Figure 19. Crack faults lead to periodic shocks. With the continuous deterioration of the crack, the impact period becomes increasingly obvious, and the impact period is
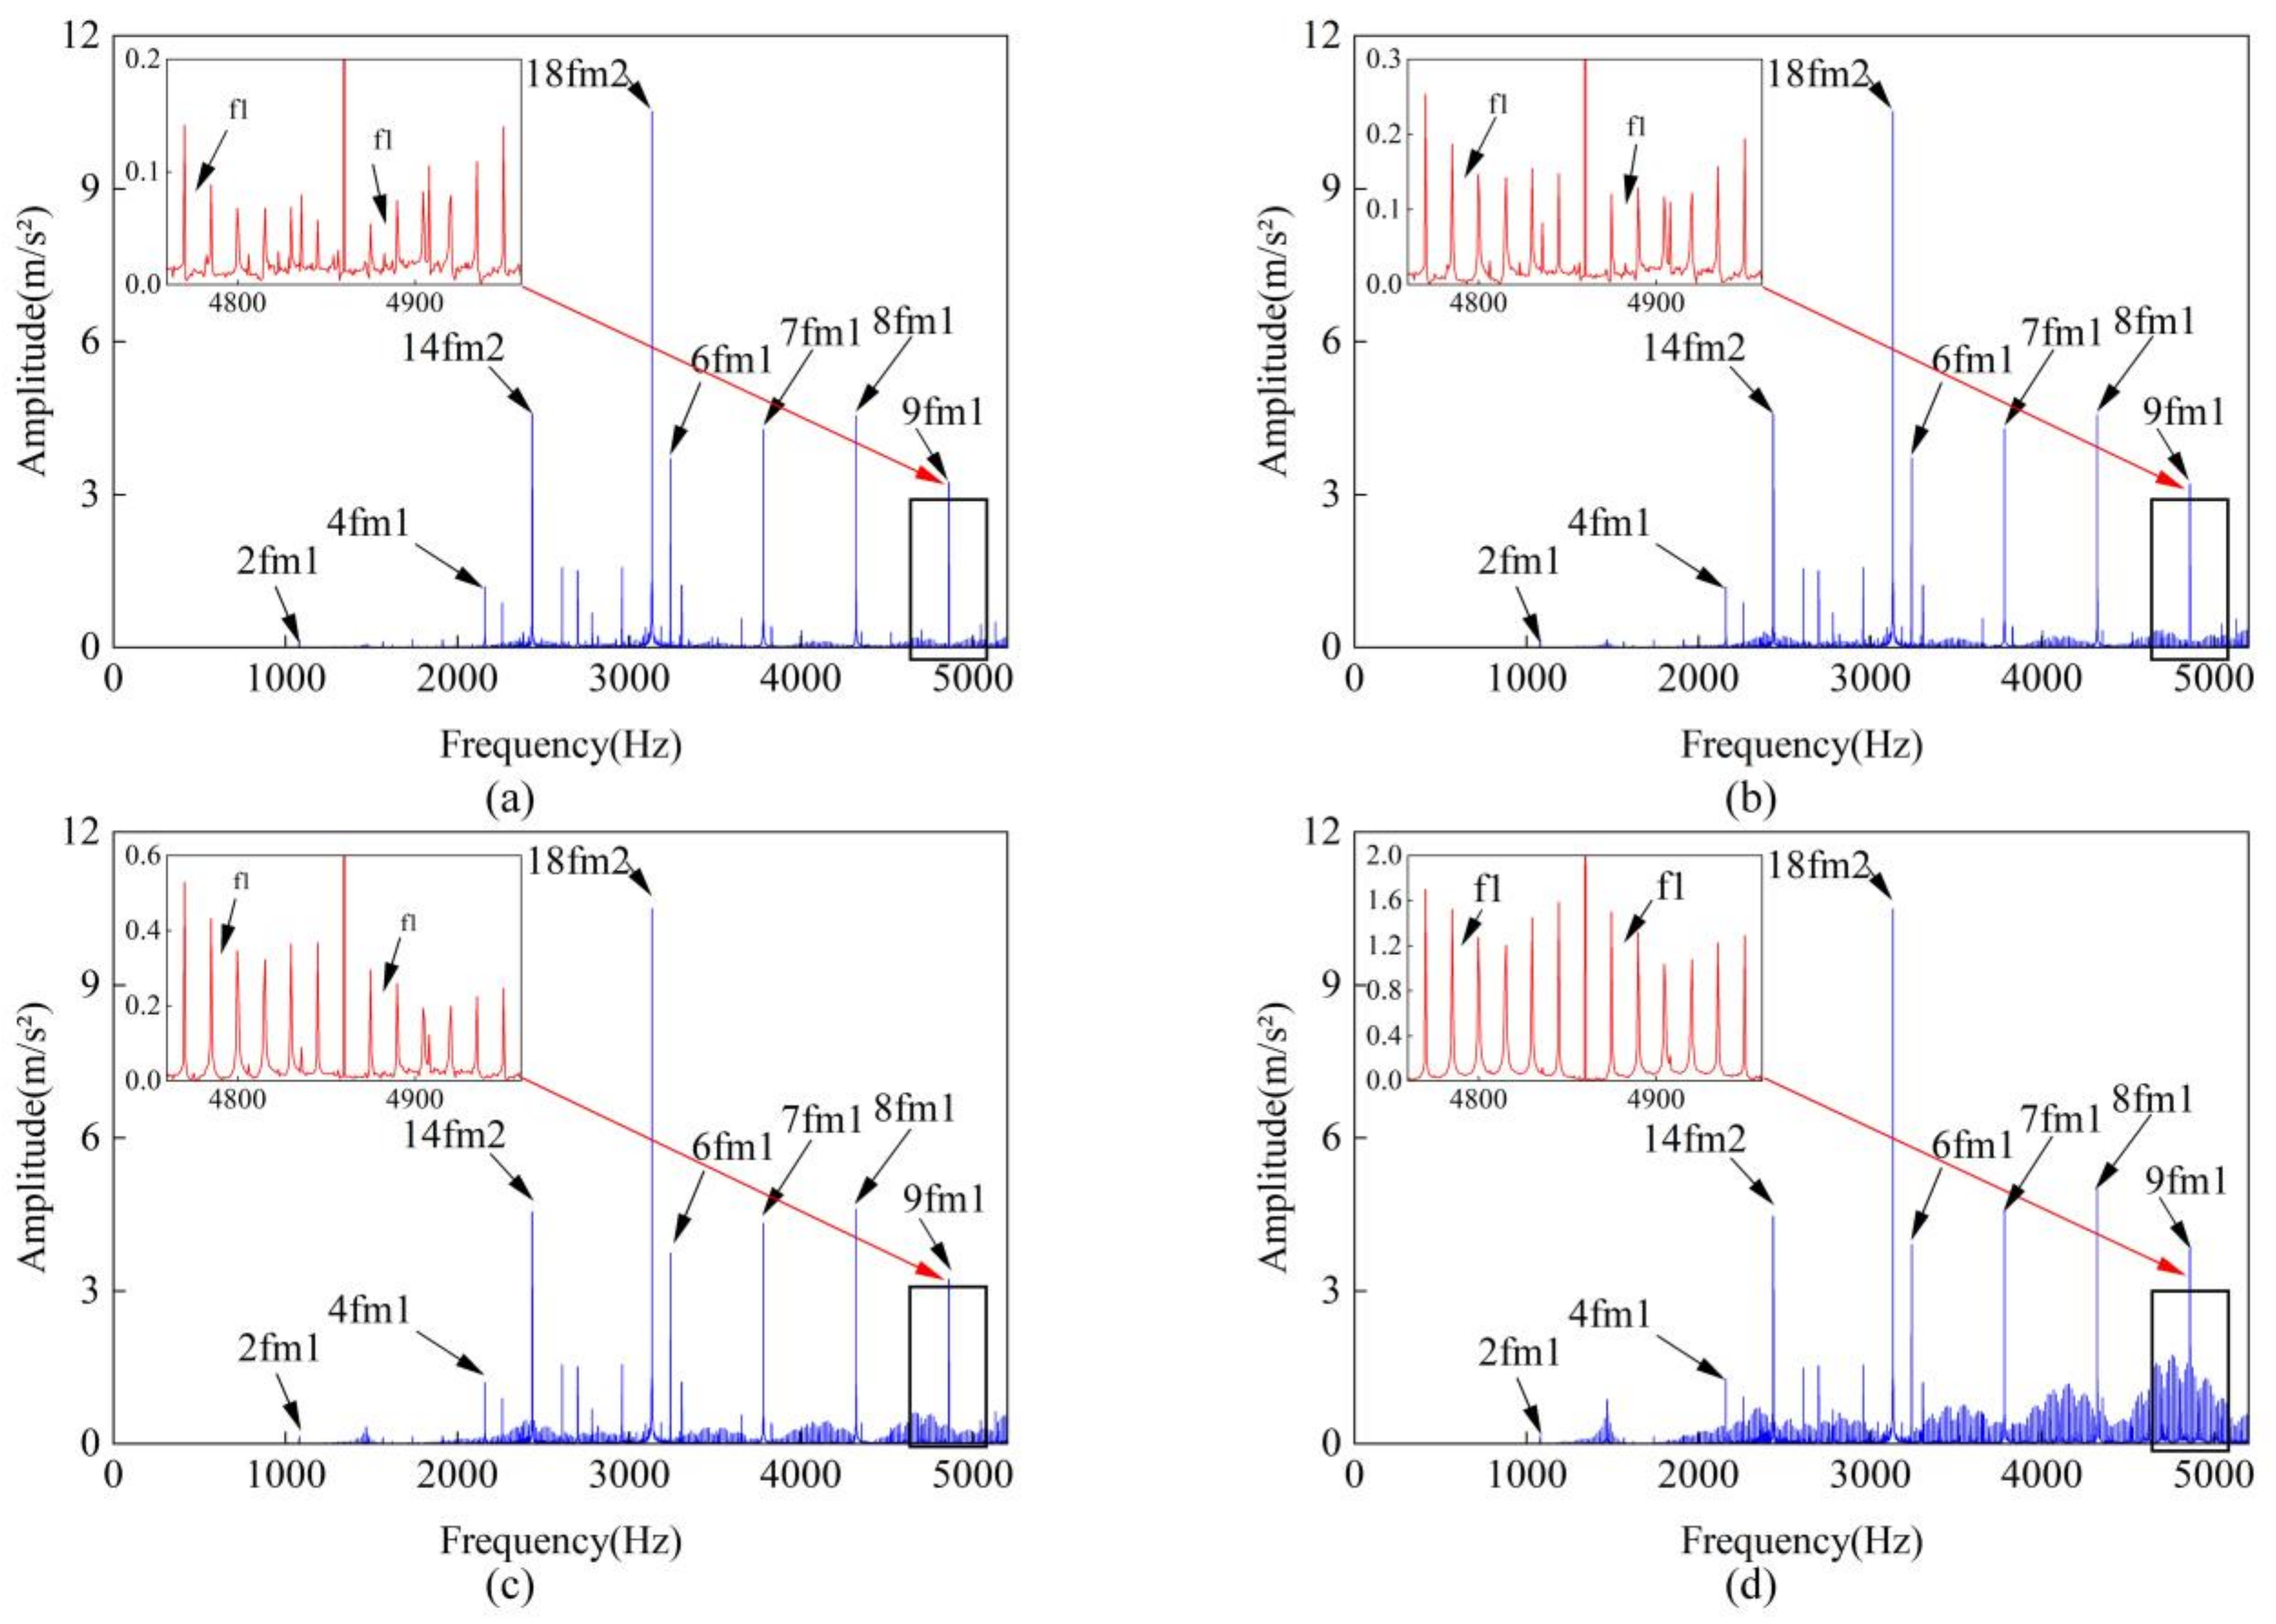
, which is caused by the continuous decrease in the mesh stiffness with the continuous deterioration of the crack. The frequency-domain response of the system under crack deterioration is shown in
Figure 20. The crack fault will lead to side frequency bands with
intervals around the meshing frequency and doubling frequency. Because the crack gear is on the input shaft, the turn frequency is
. The amplitude of the side frequency band increases with the continuous deterioration of the crack.
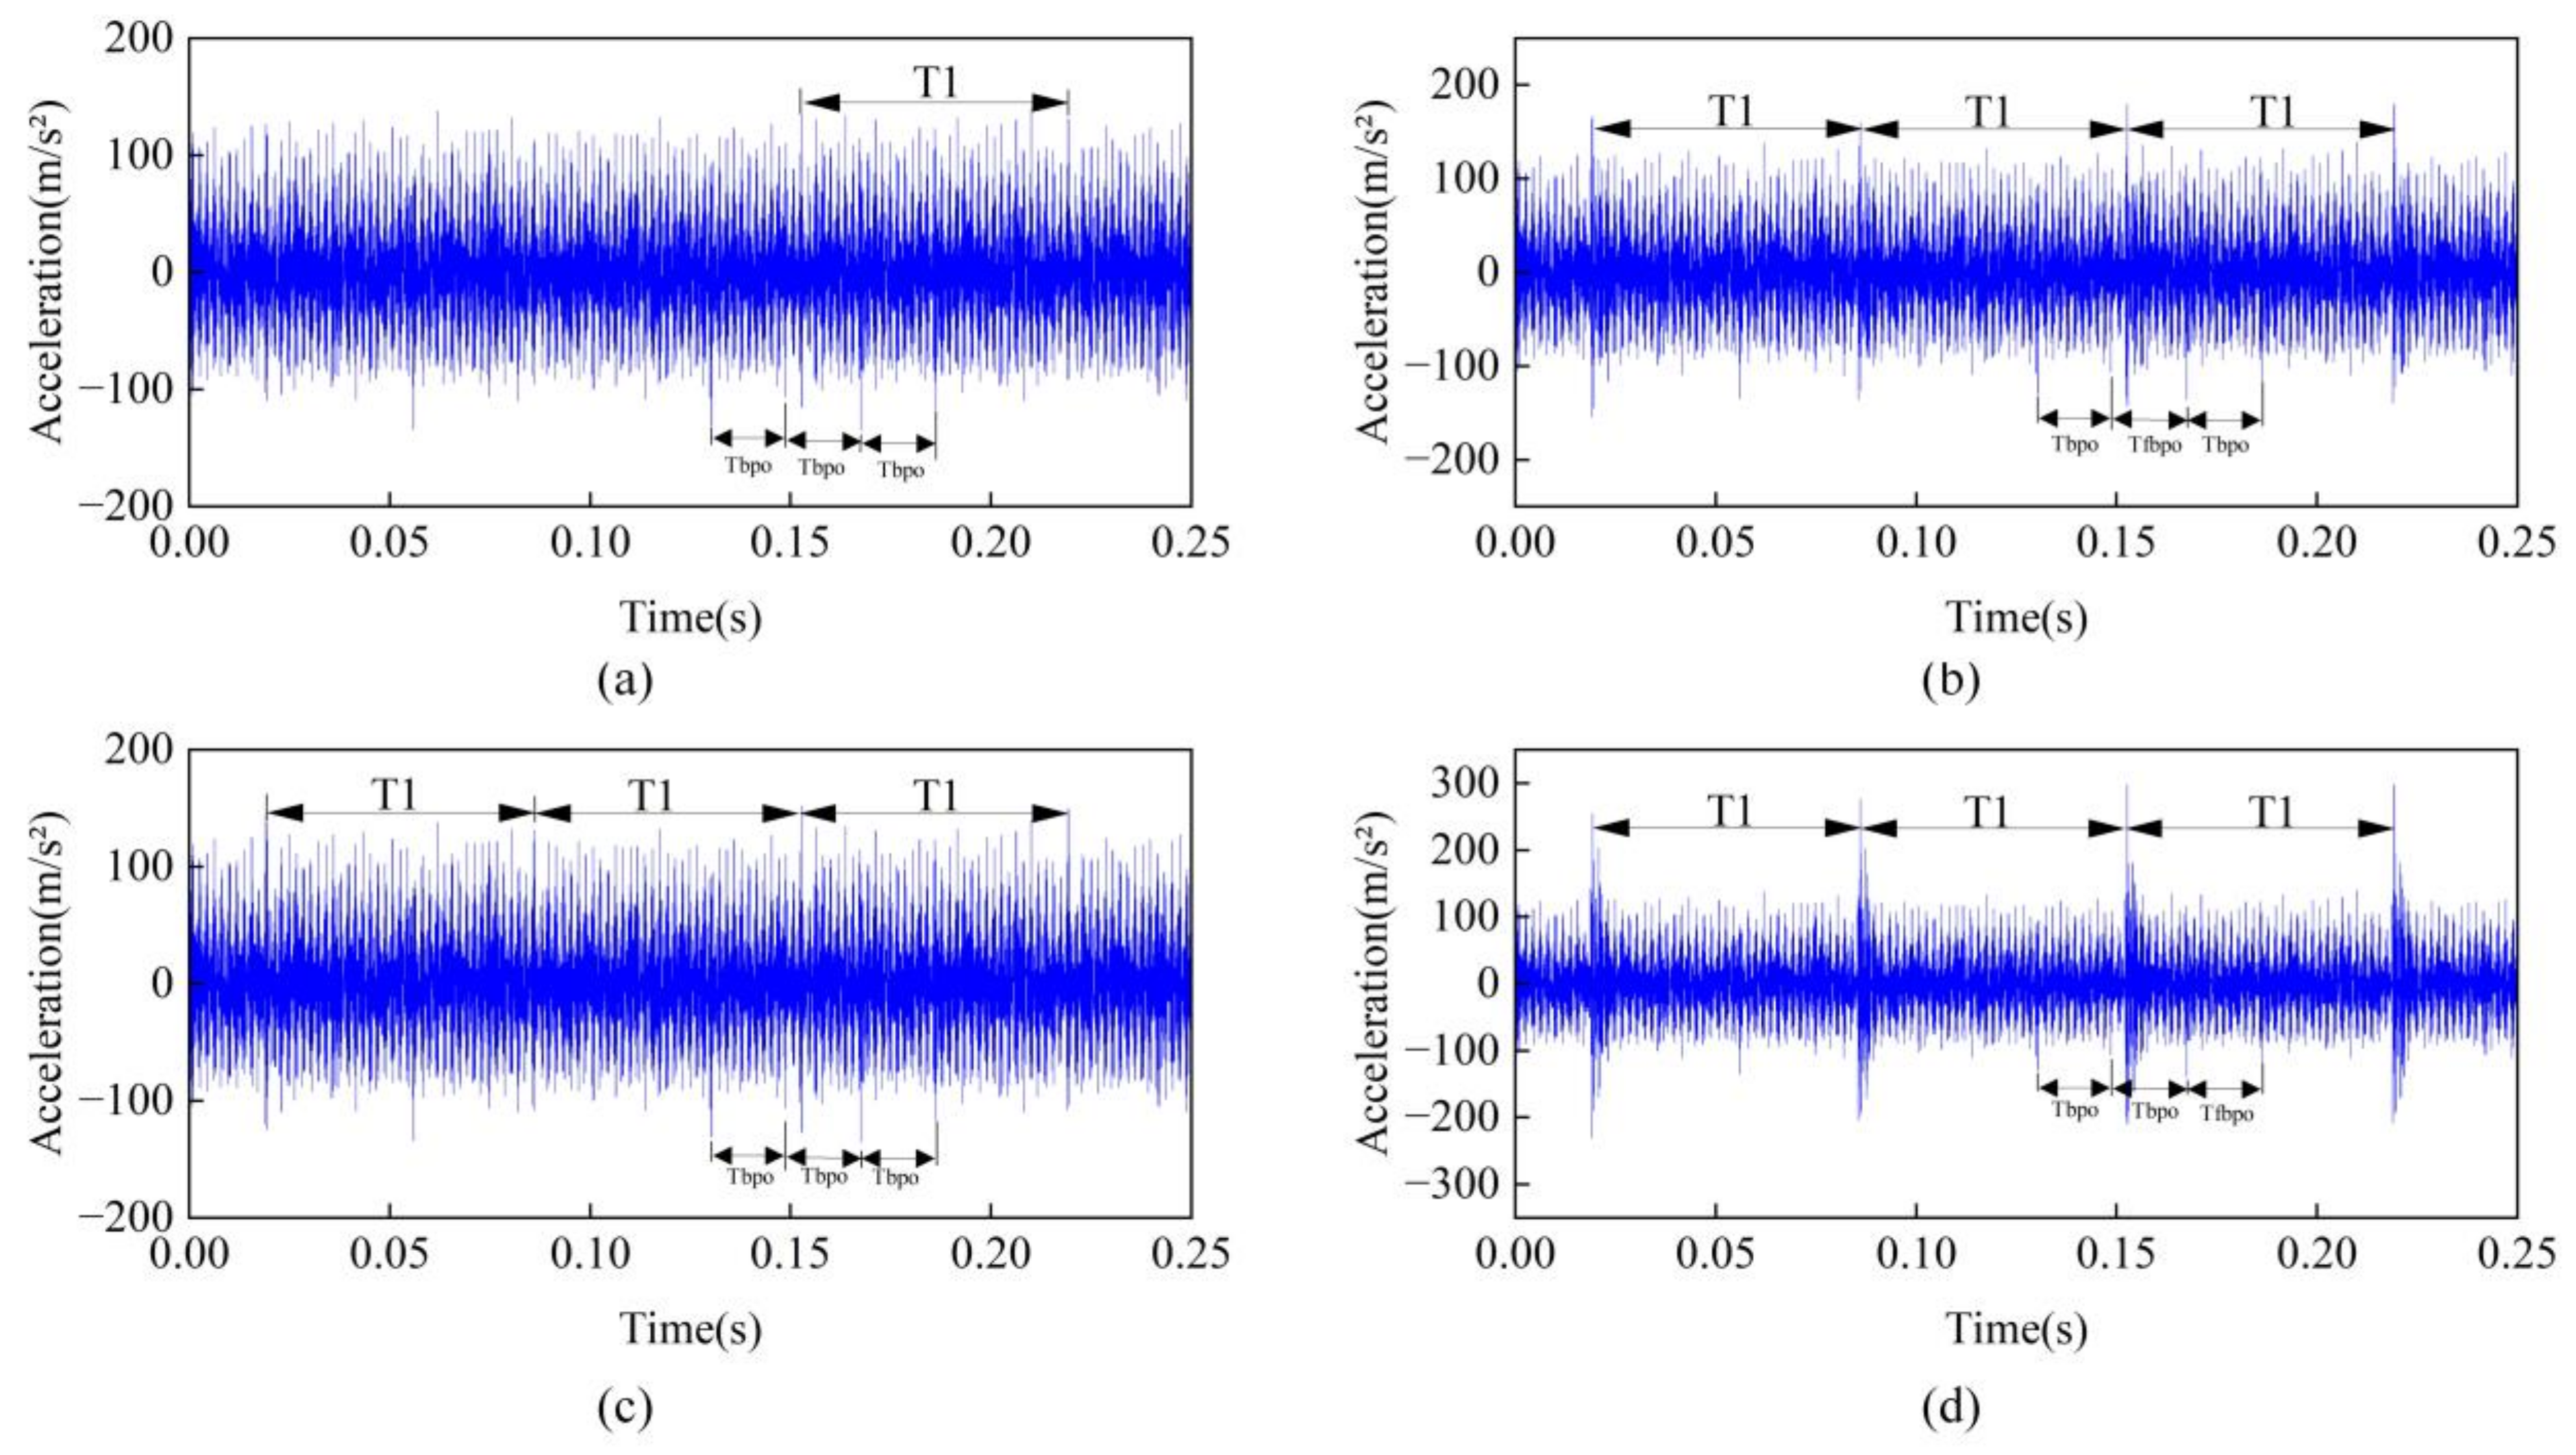
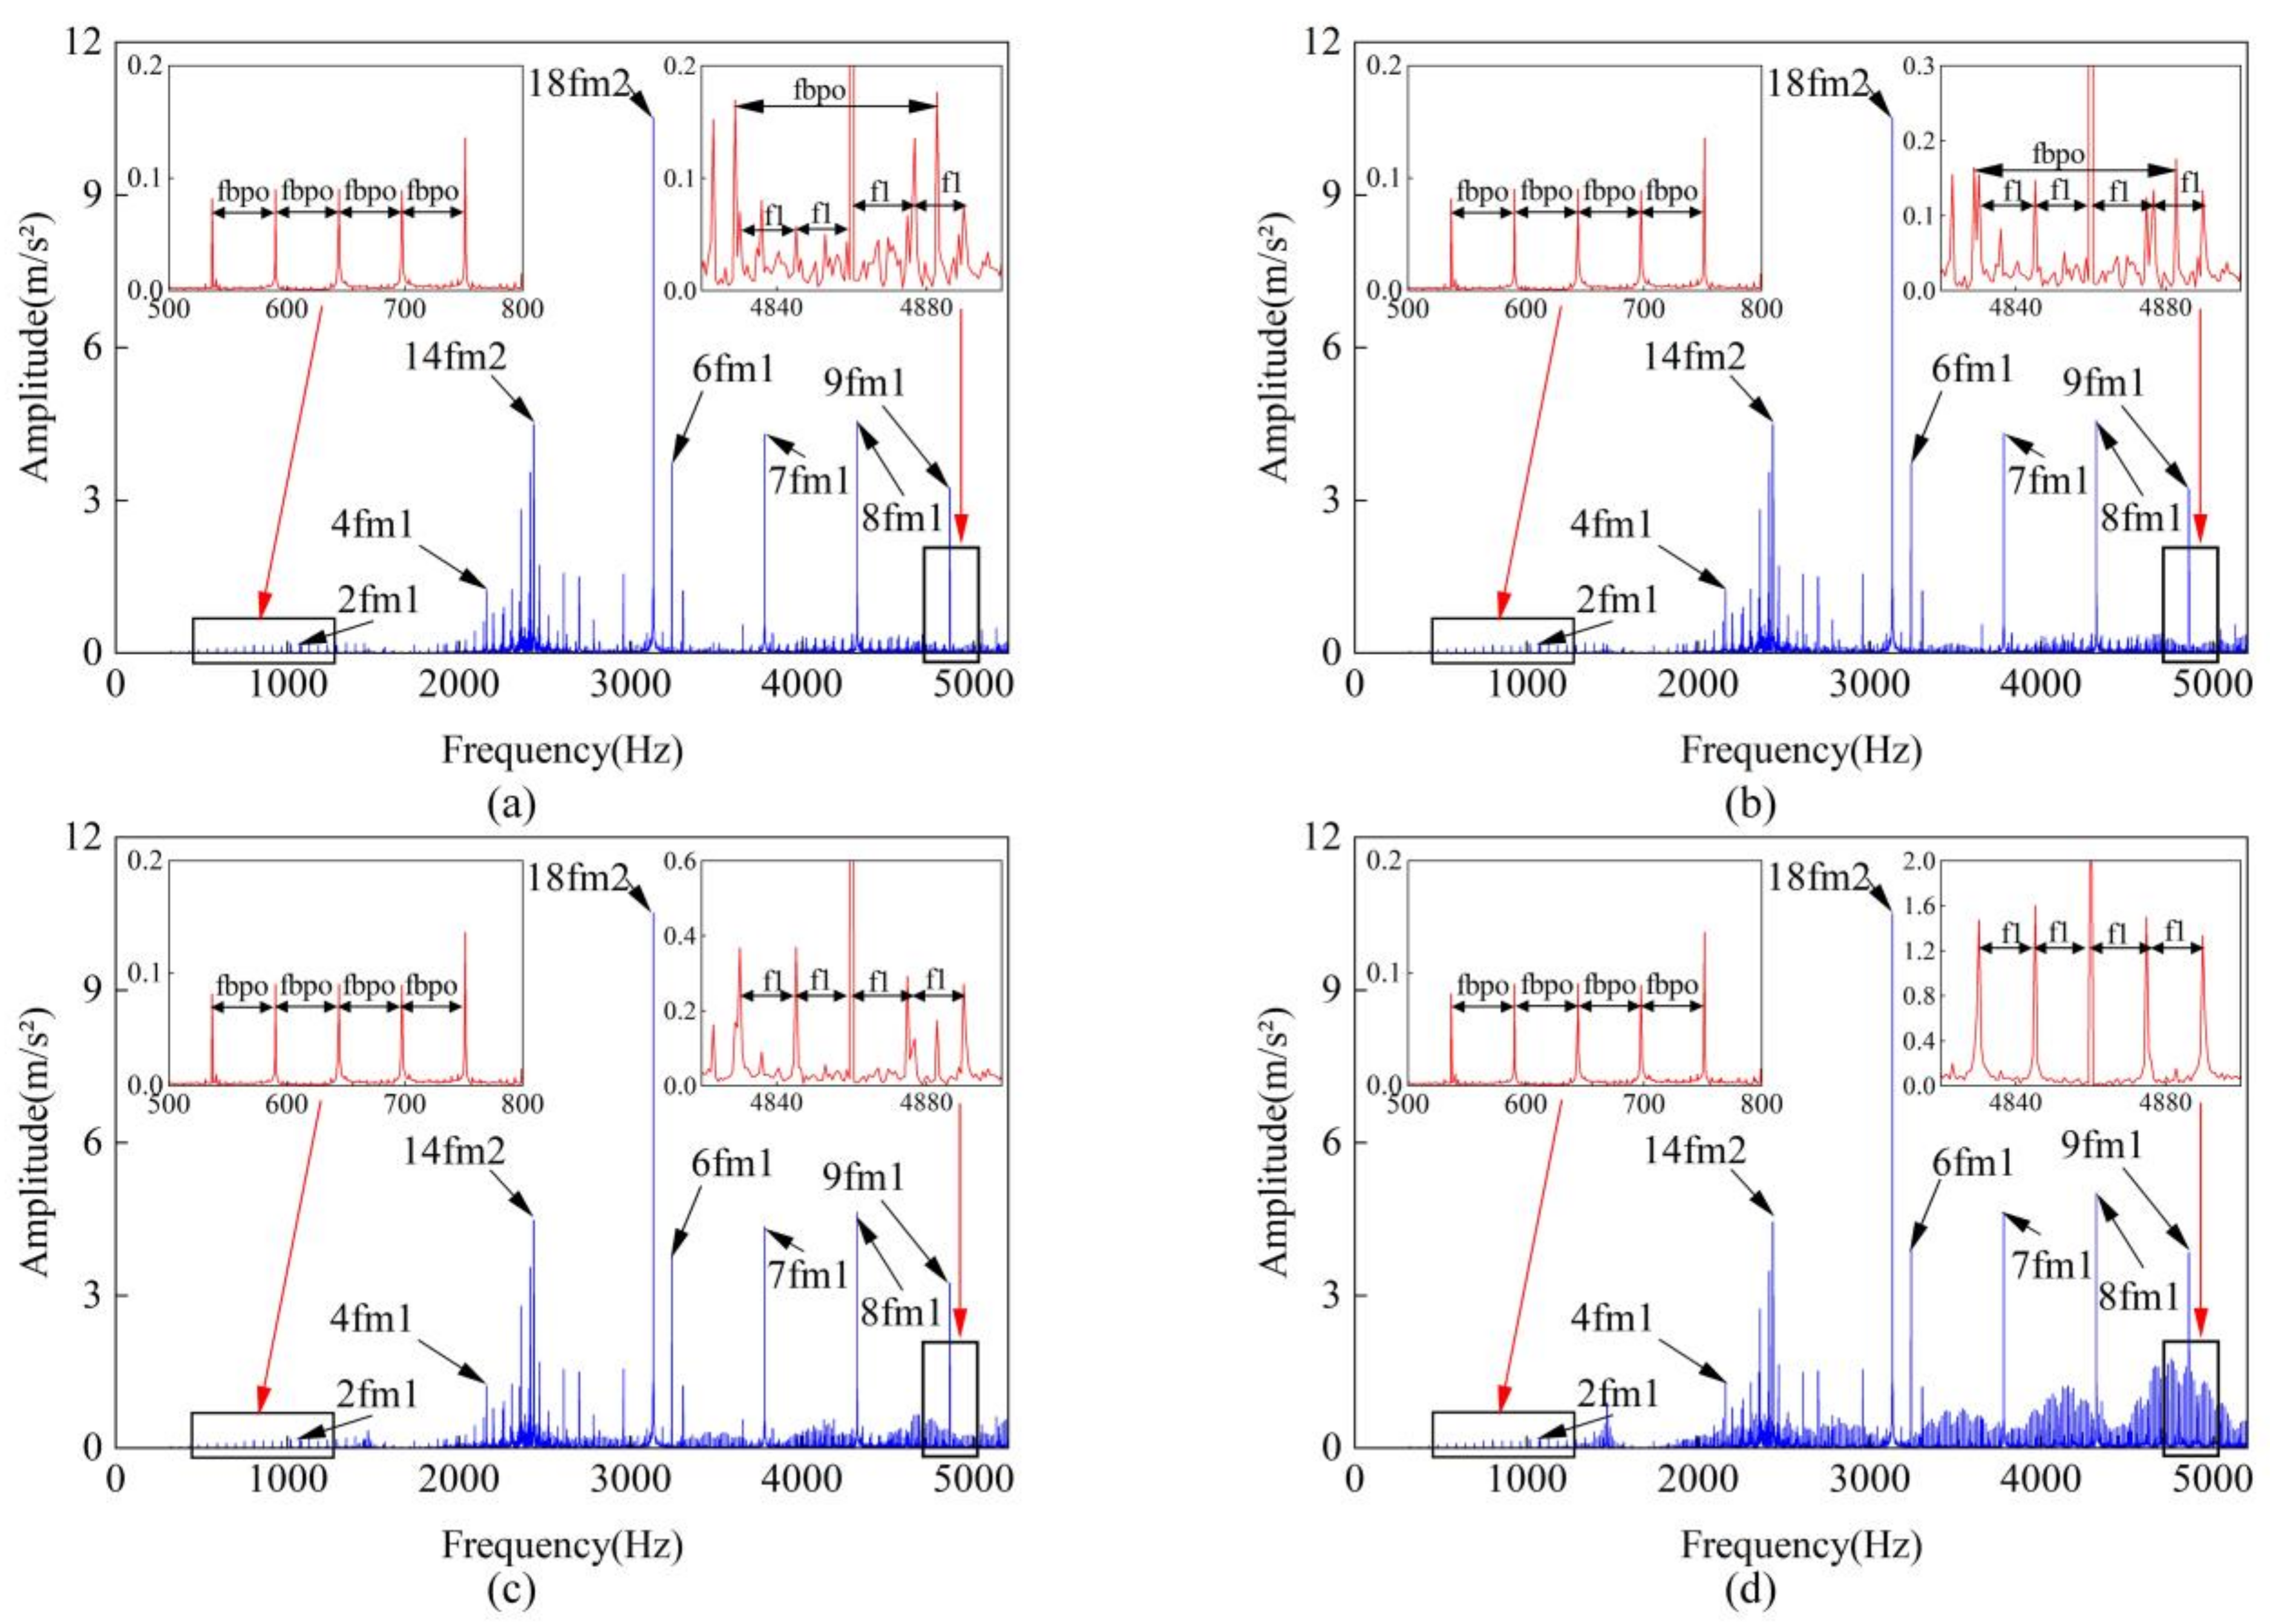
The time-domain response of the system with a deteriorating crack and an outer-ring bearing fault is shown in
Figure 21, while the frequency-domain response is depicted in
Figure 22. Compared to a single crack fault, the time-domain plot reveals impacts with a periodicity of
, and the frequency-domain plot exhibits the characteristic frequency
of the bearing outer ring fault. Near the gear meshing frequency and its harmonics, when the crack deterioration is at a low level, the amplitude of the bearing outer ring fault frequency is higher than the sideband amplitude generated by the crack fault, making the outer ring fault characteristics more prominent and easier to identify. However, when the crack deterioration reaches 30%, the amplitudes of both fault types become similar, making it difficult to distinguish between them. As the crack deteriorates further, the amplitude of the sidebands gradually increases, eventually overshadowing the bearing outer ring fault characteristics, with the system’s faults increasingly dominated by the crack.
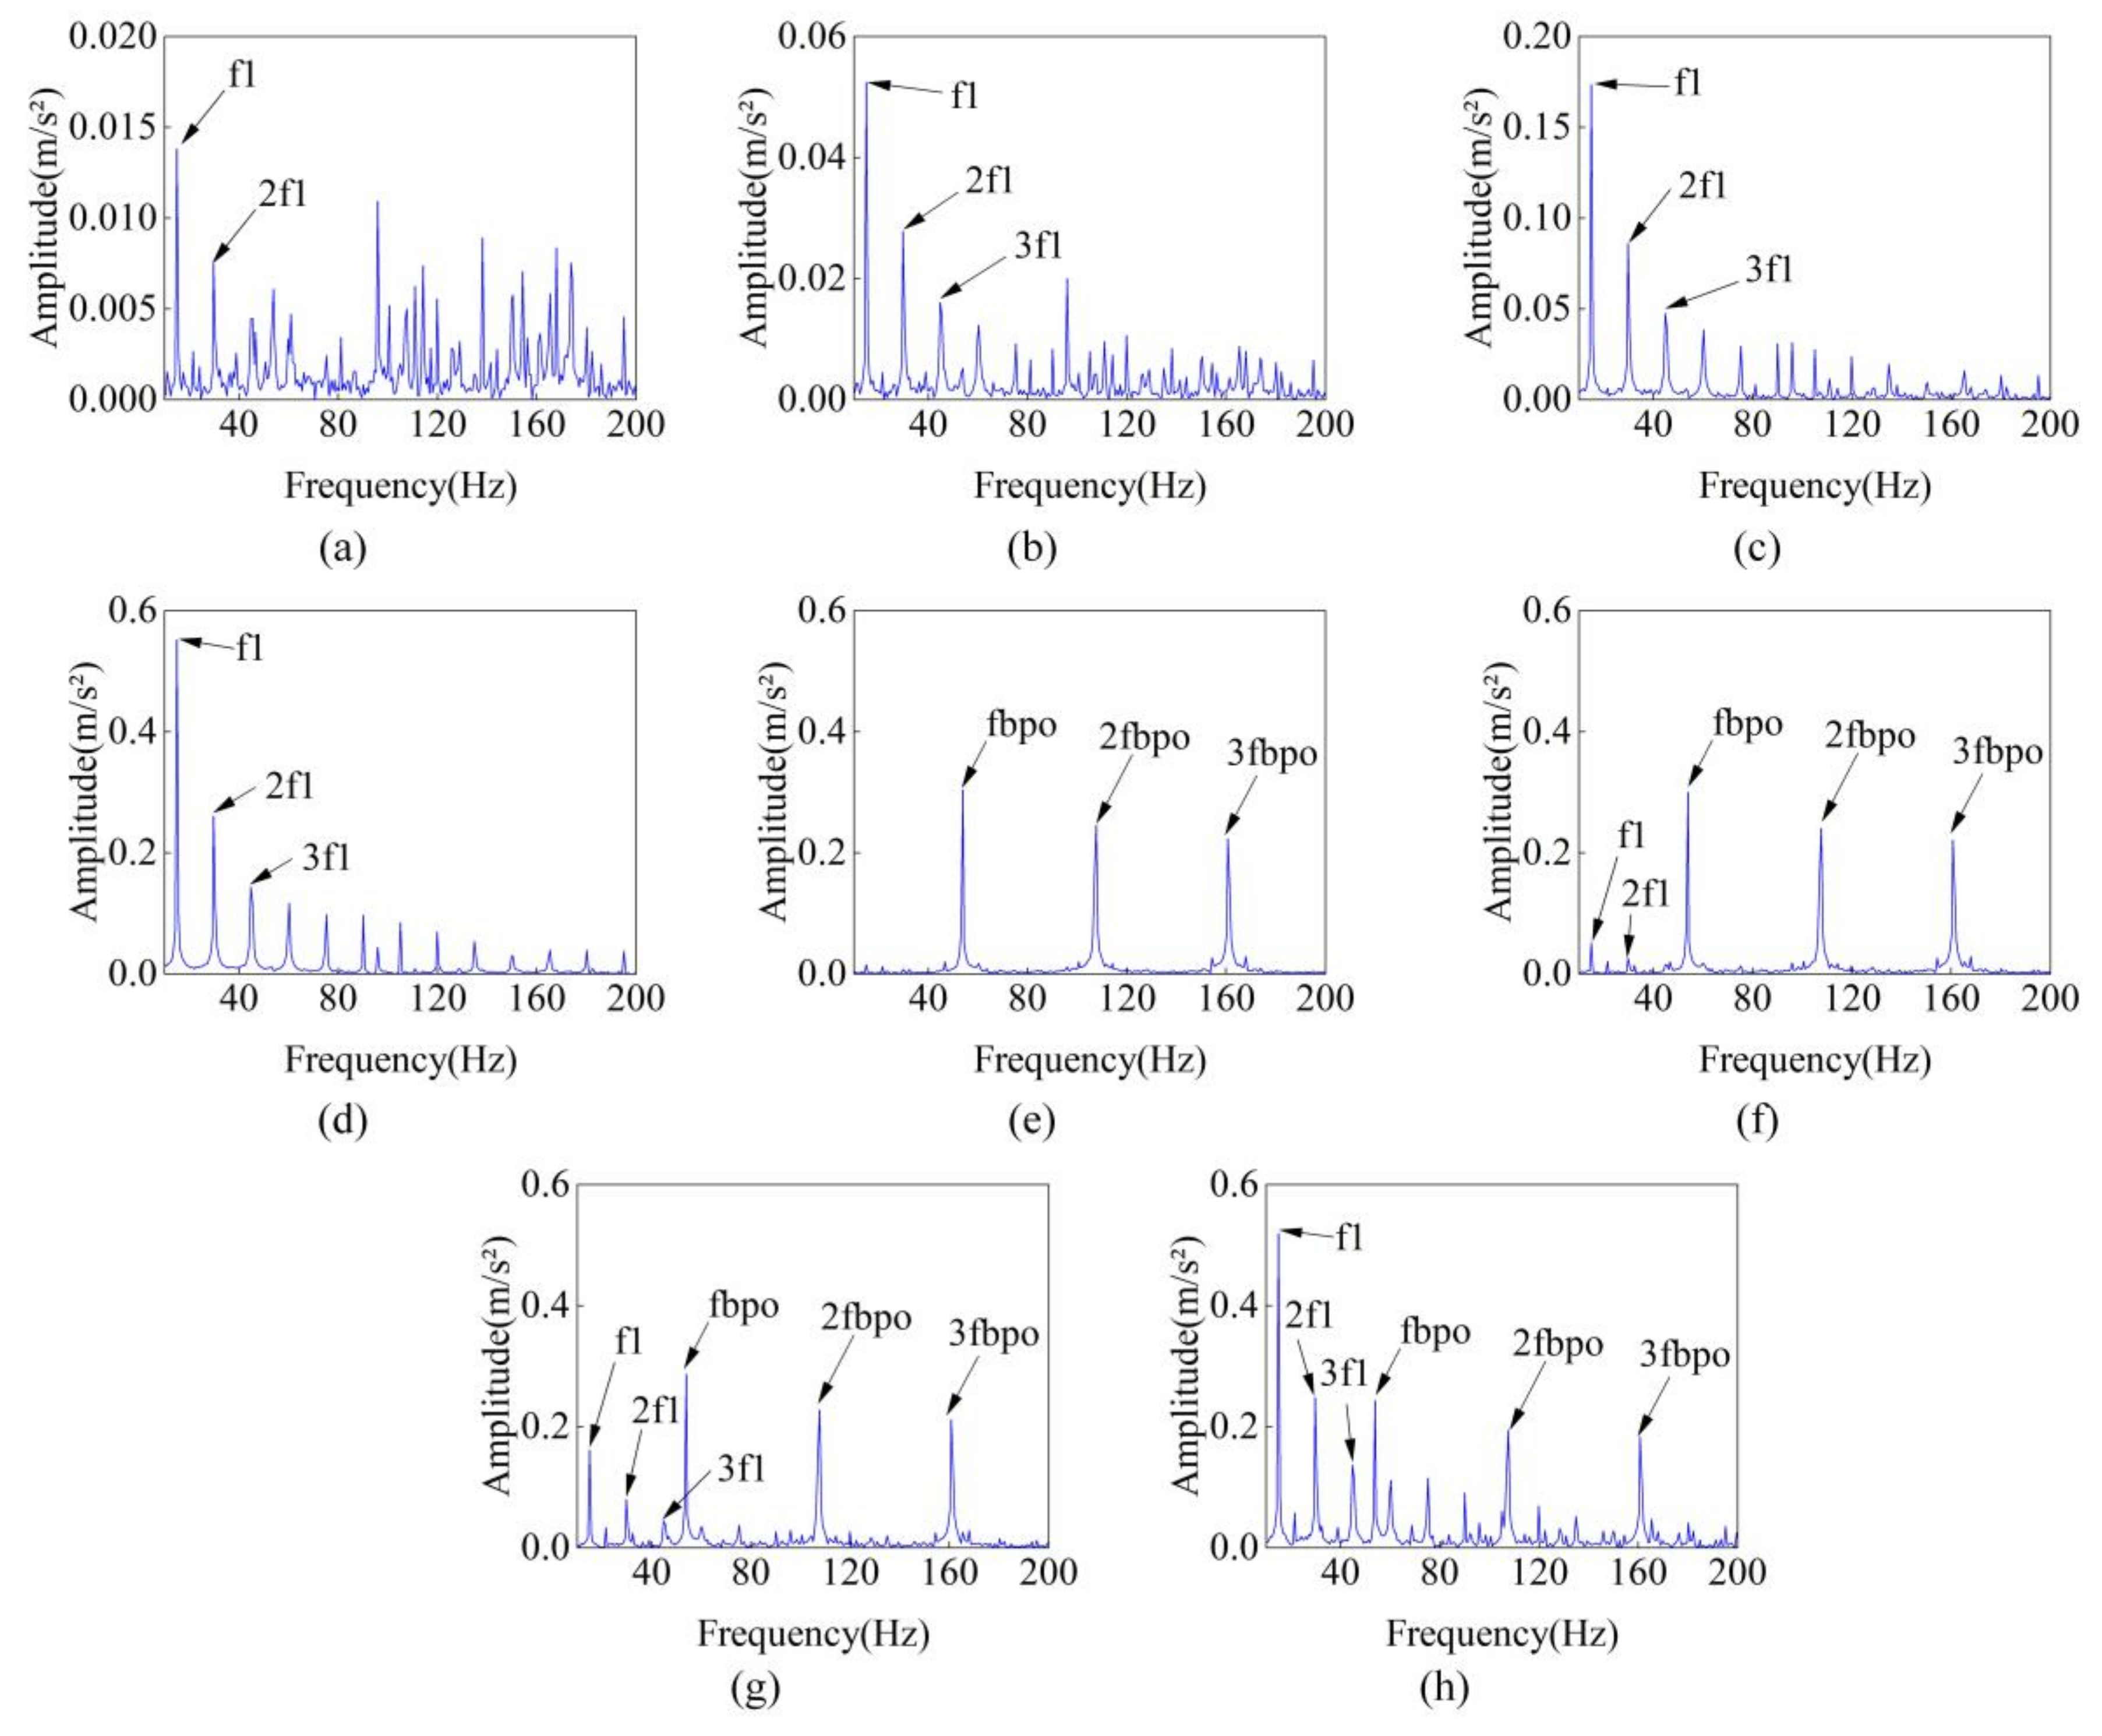
To highlight the fault frequency, the aforementioned vibration acceleration signal is processed using band-pass filtering, with the filter band encompassing the fault frequency range of 500–1200 Hz. The envelope spectrum is illustrated in
Figure 23. With the continuous deterioration of the crack, the amplitude of
and
multiple in the envelope spectrum increases continuously, and the crack fault characteristics become increasingly obvious. The envelope spectrum of tooth root crack-bearing outer ring composite faults contains not only crack fault features but also bearing fault features, such as
,
, and
. When the crack deterioration degree is low, the crack fault feature is not apparent. With the continuous deterioration of the crack, the crack fault feature is gradually apparent, and the deterioration reaches 60%. The amplitude of
even exceeds the amplitude of
. It further shows that when the crack deterioration degree is low, the bearing fault has a large impact, and with the deterioration of the crack, the impact of the crack fault gradually increases.
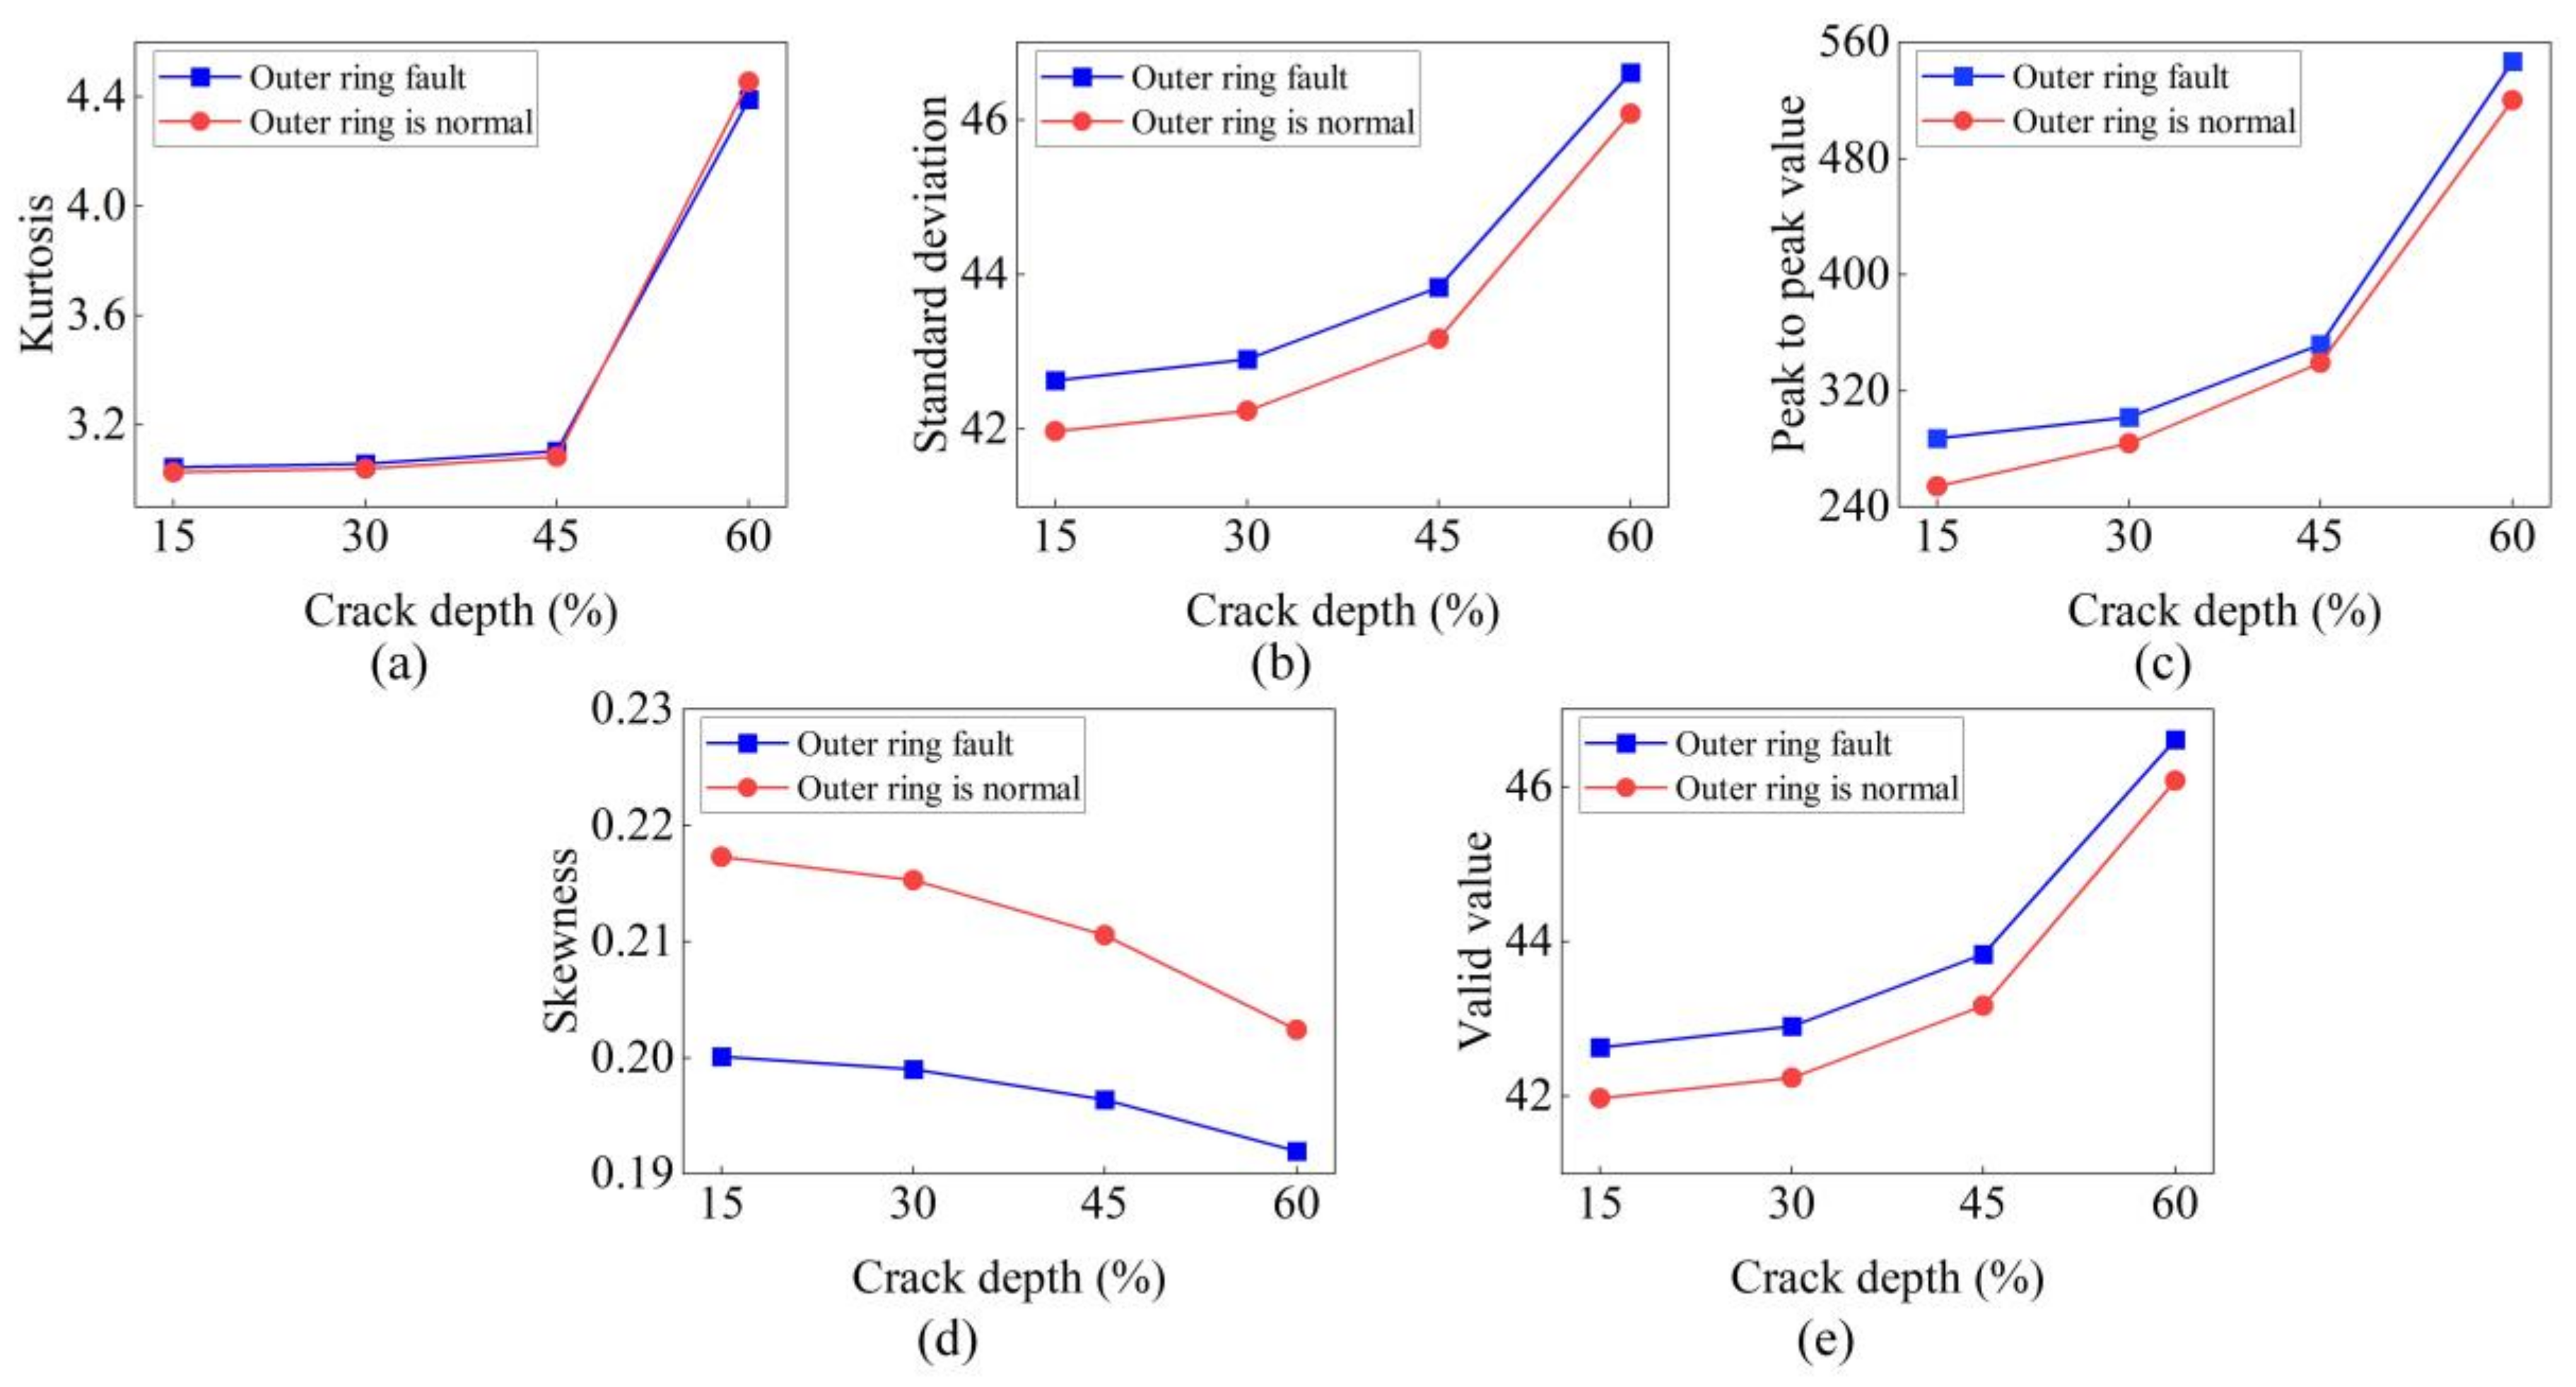
In order to further describe the crack deterioration characteristics, the time-domain characteristics are analyzed, and the variation trend of time-domain characteristics is shown in
Figure 24. The skewness value gradually decreases with the deterioration of the crack, while the kurtosis, standard deviation, peak-to-peak value, and effective value continuously increase with the deterioration of the crack. The standard deviation, peak-to-peak value and effective value of the root crack-bearing outer ring composite fault are more significant than the standard deviation, peak-to-peak value, and effective value of the root crack-bearing outer ring composite fault, but the skewness value of the root crack-bearing outer ring composite fault is smaller than the skewness value of the root crack-bearing outer ring composite fault. There is no significant difference in kurtosis value between the two.
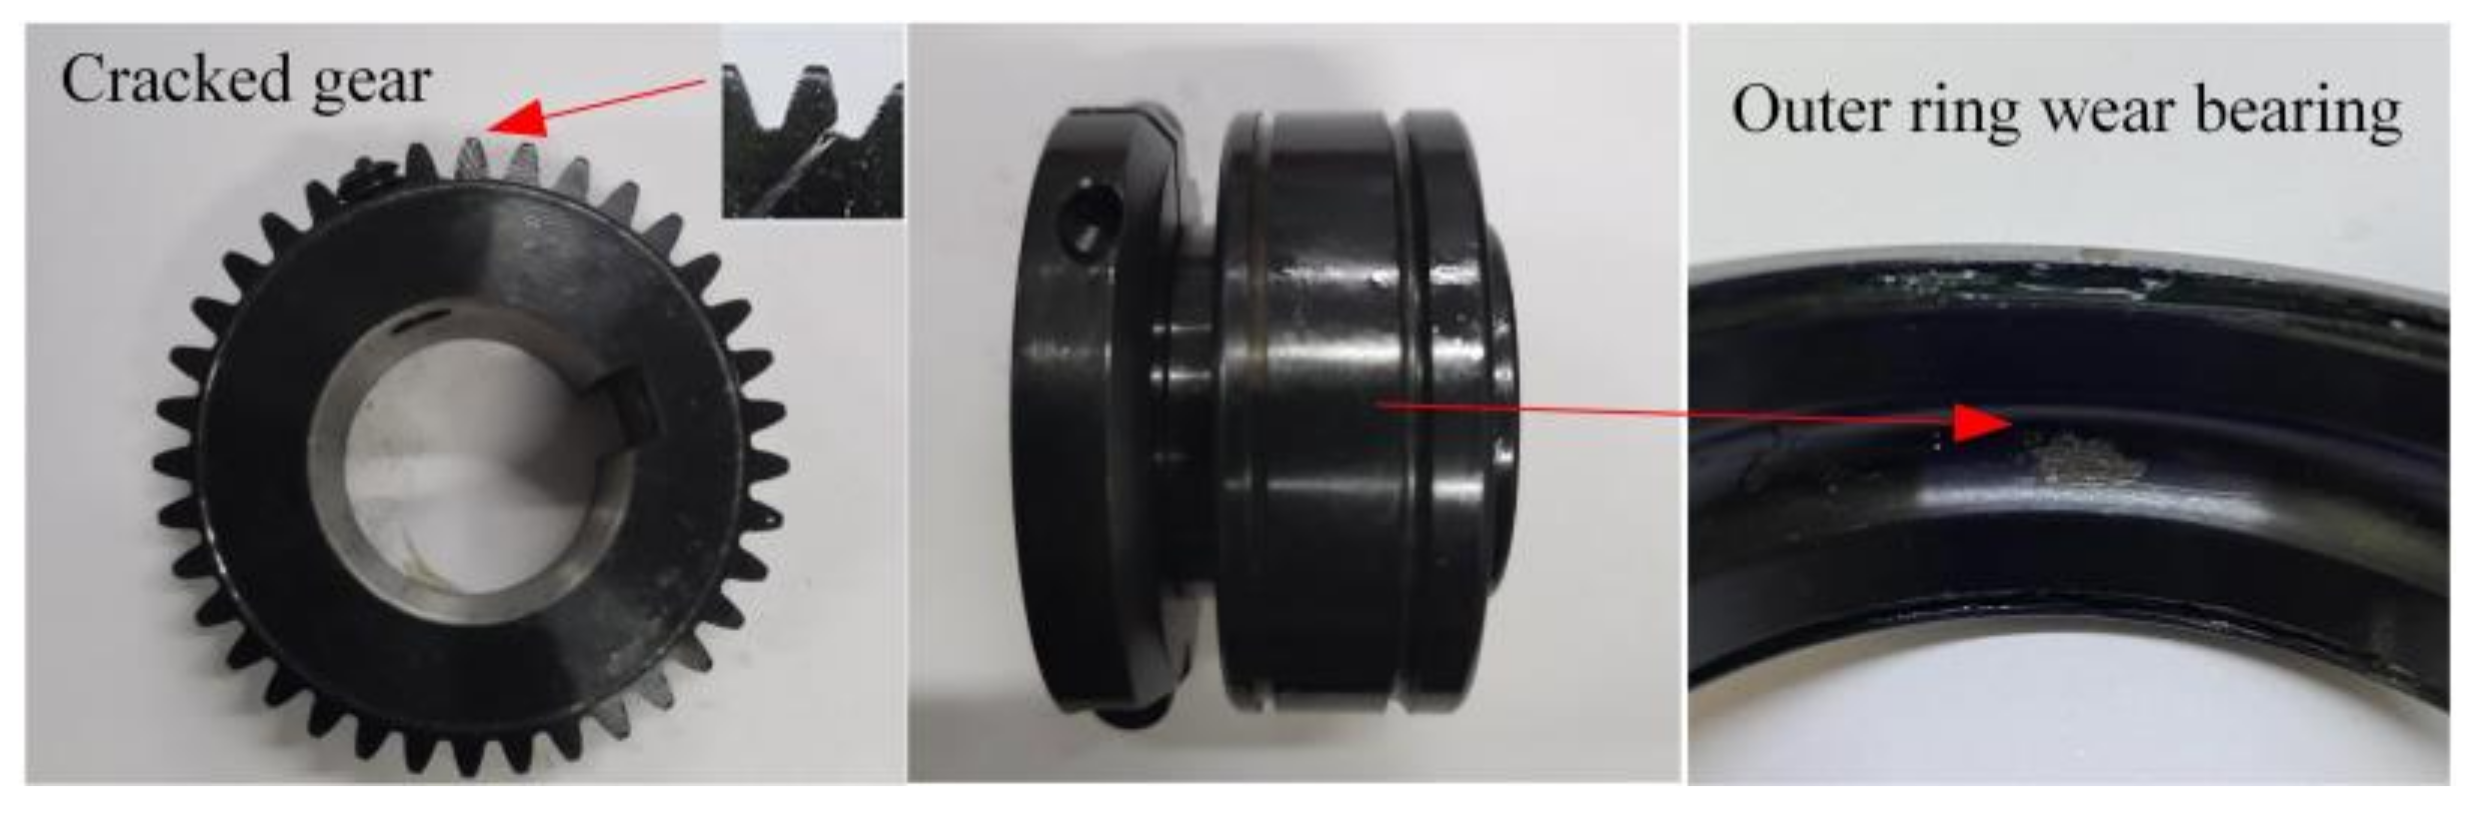
6. Experimental Verification
The comprehensive experimental platform for fault diagnosis of the power transmission system in the wind turbine is shown in
Figure 1, and the faulty gear and faulty bearing are shown in
Figure 25. The crack depth is 2 mm (49%). The wear area on the outer ring is elliptical and irregular. The installation positions of the faulty gear and faulty bearing are consistent with the simulation, where the input shaft driving wheel is the cracked gear, and the bearing on the cracked gear side is the faulty bearing. The initial conditions are also the same as in the simulation, with a rotational speed applied to the input shaft and a torque applied to the output shaft; that is,
,
,
,
,
,
,
,
,
.
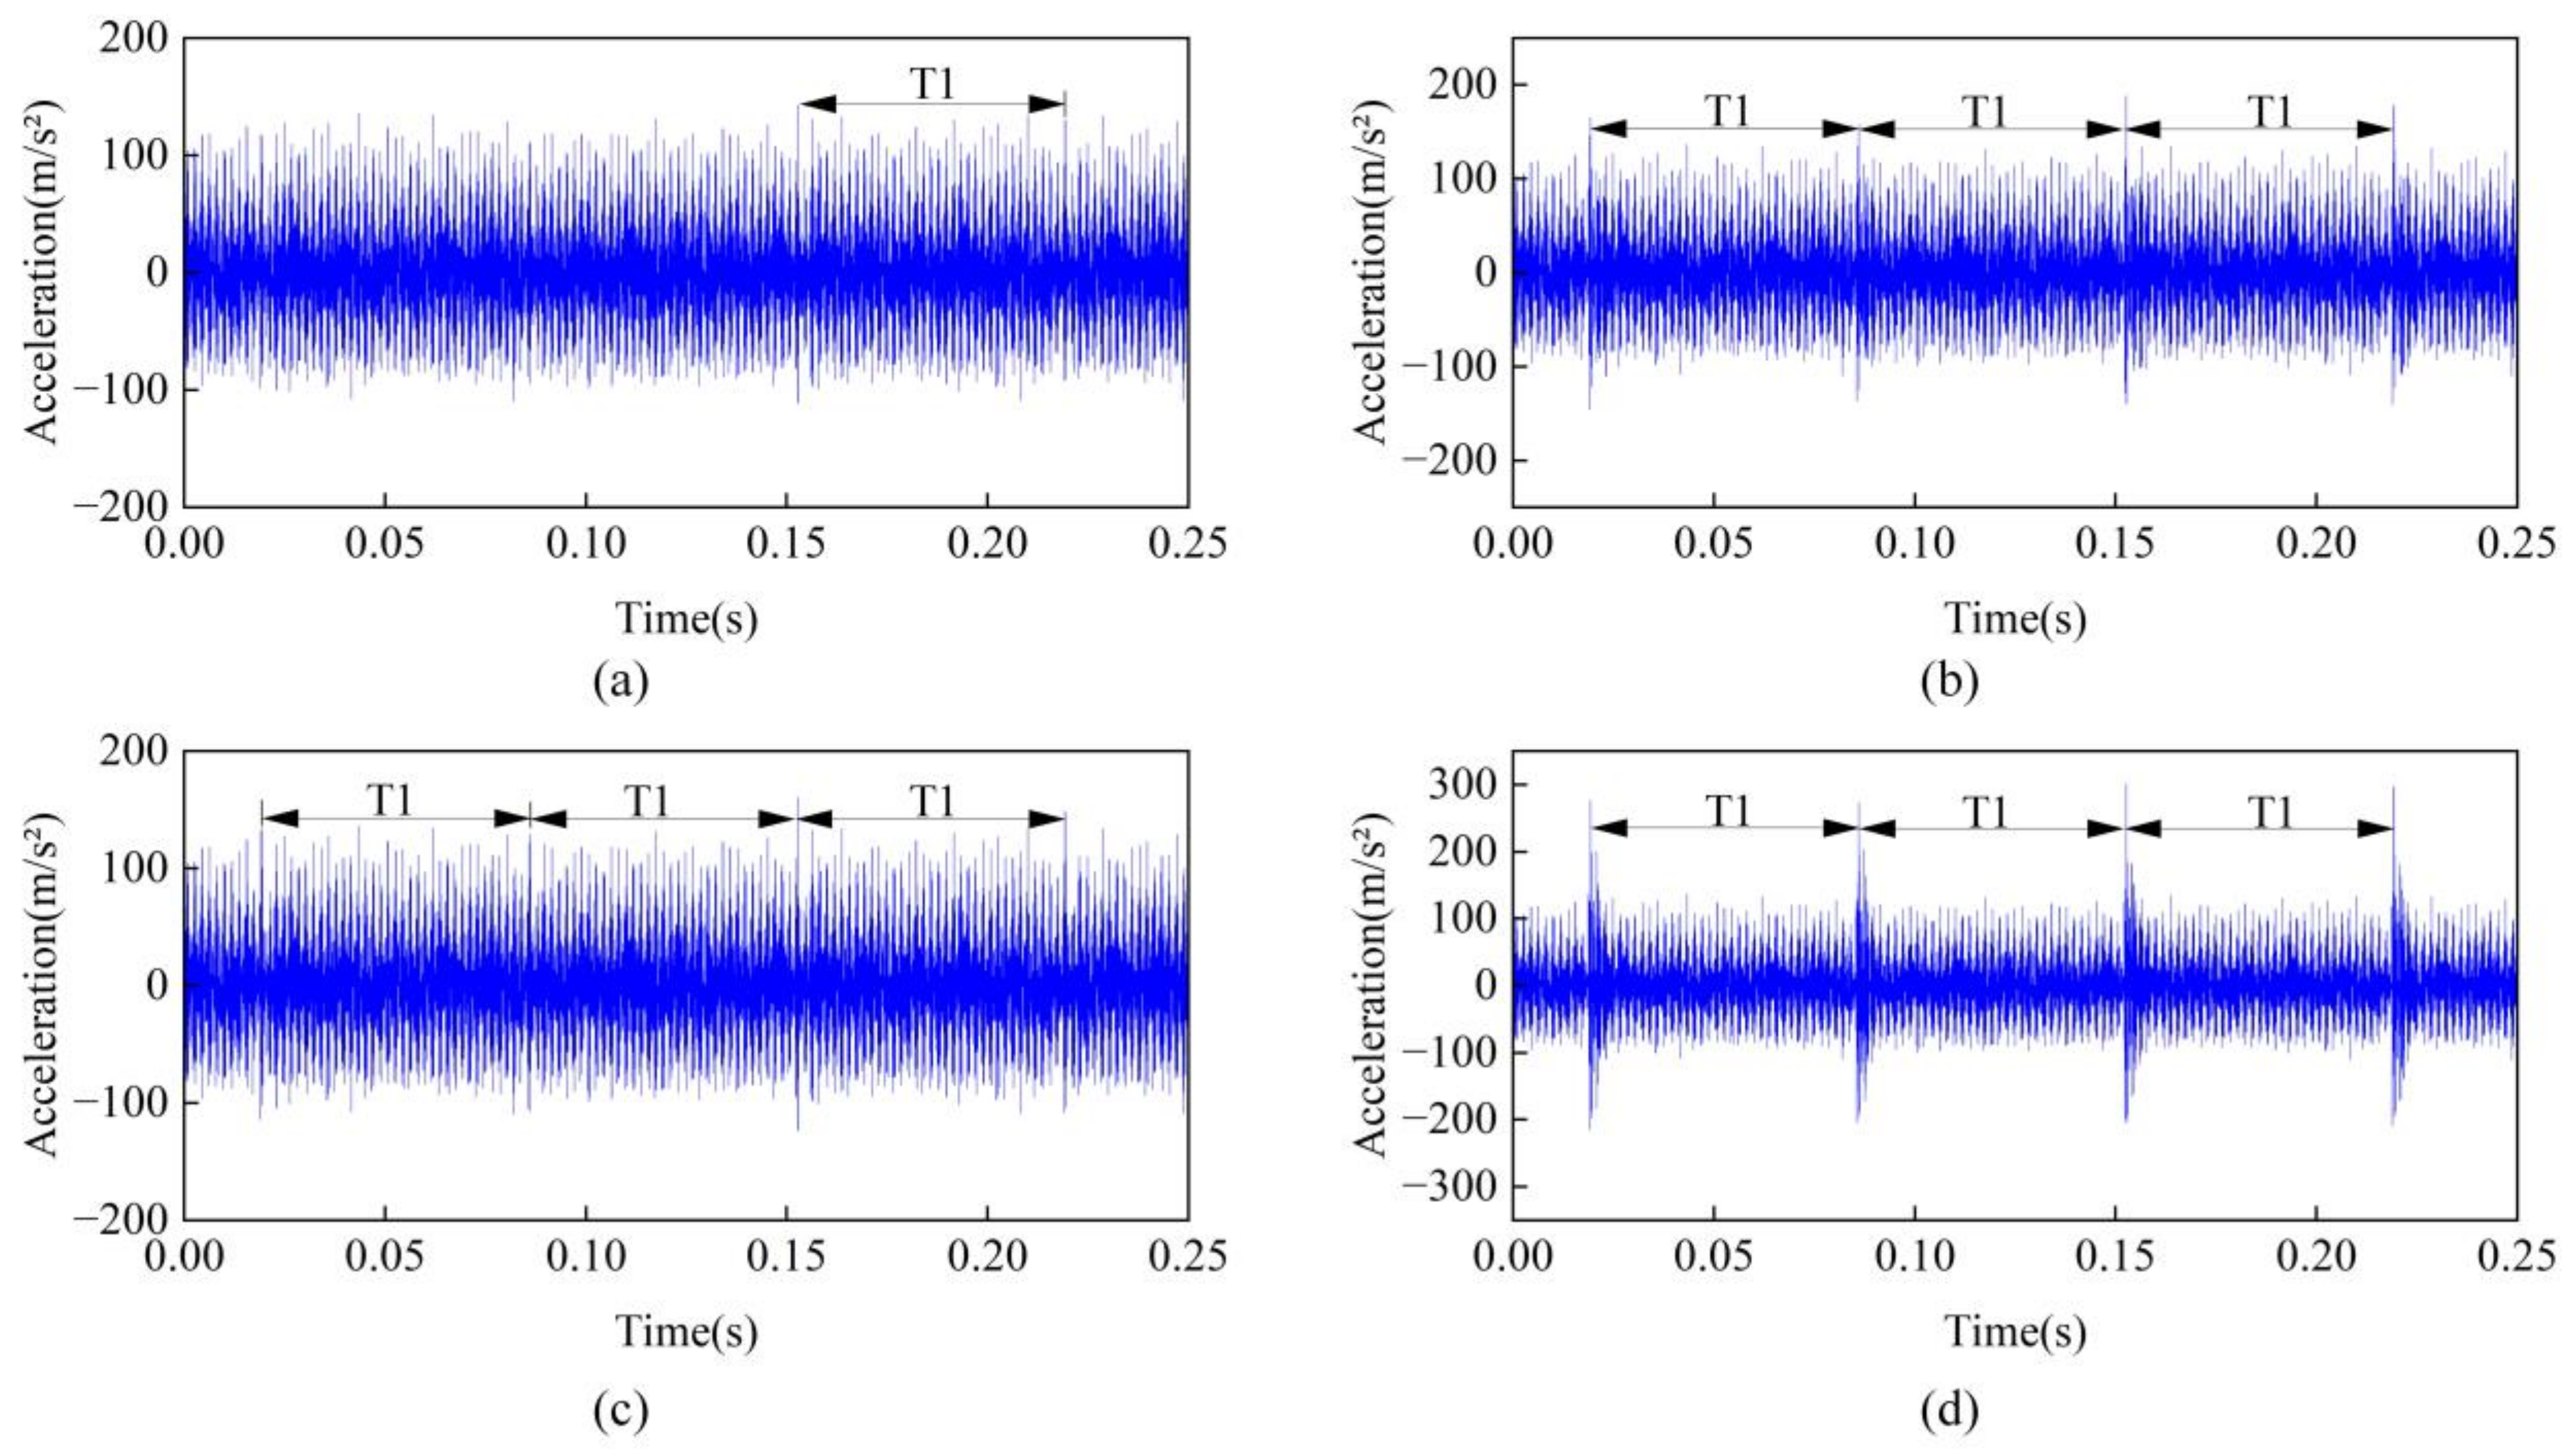
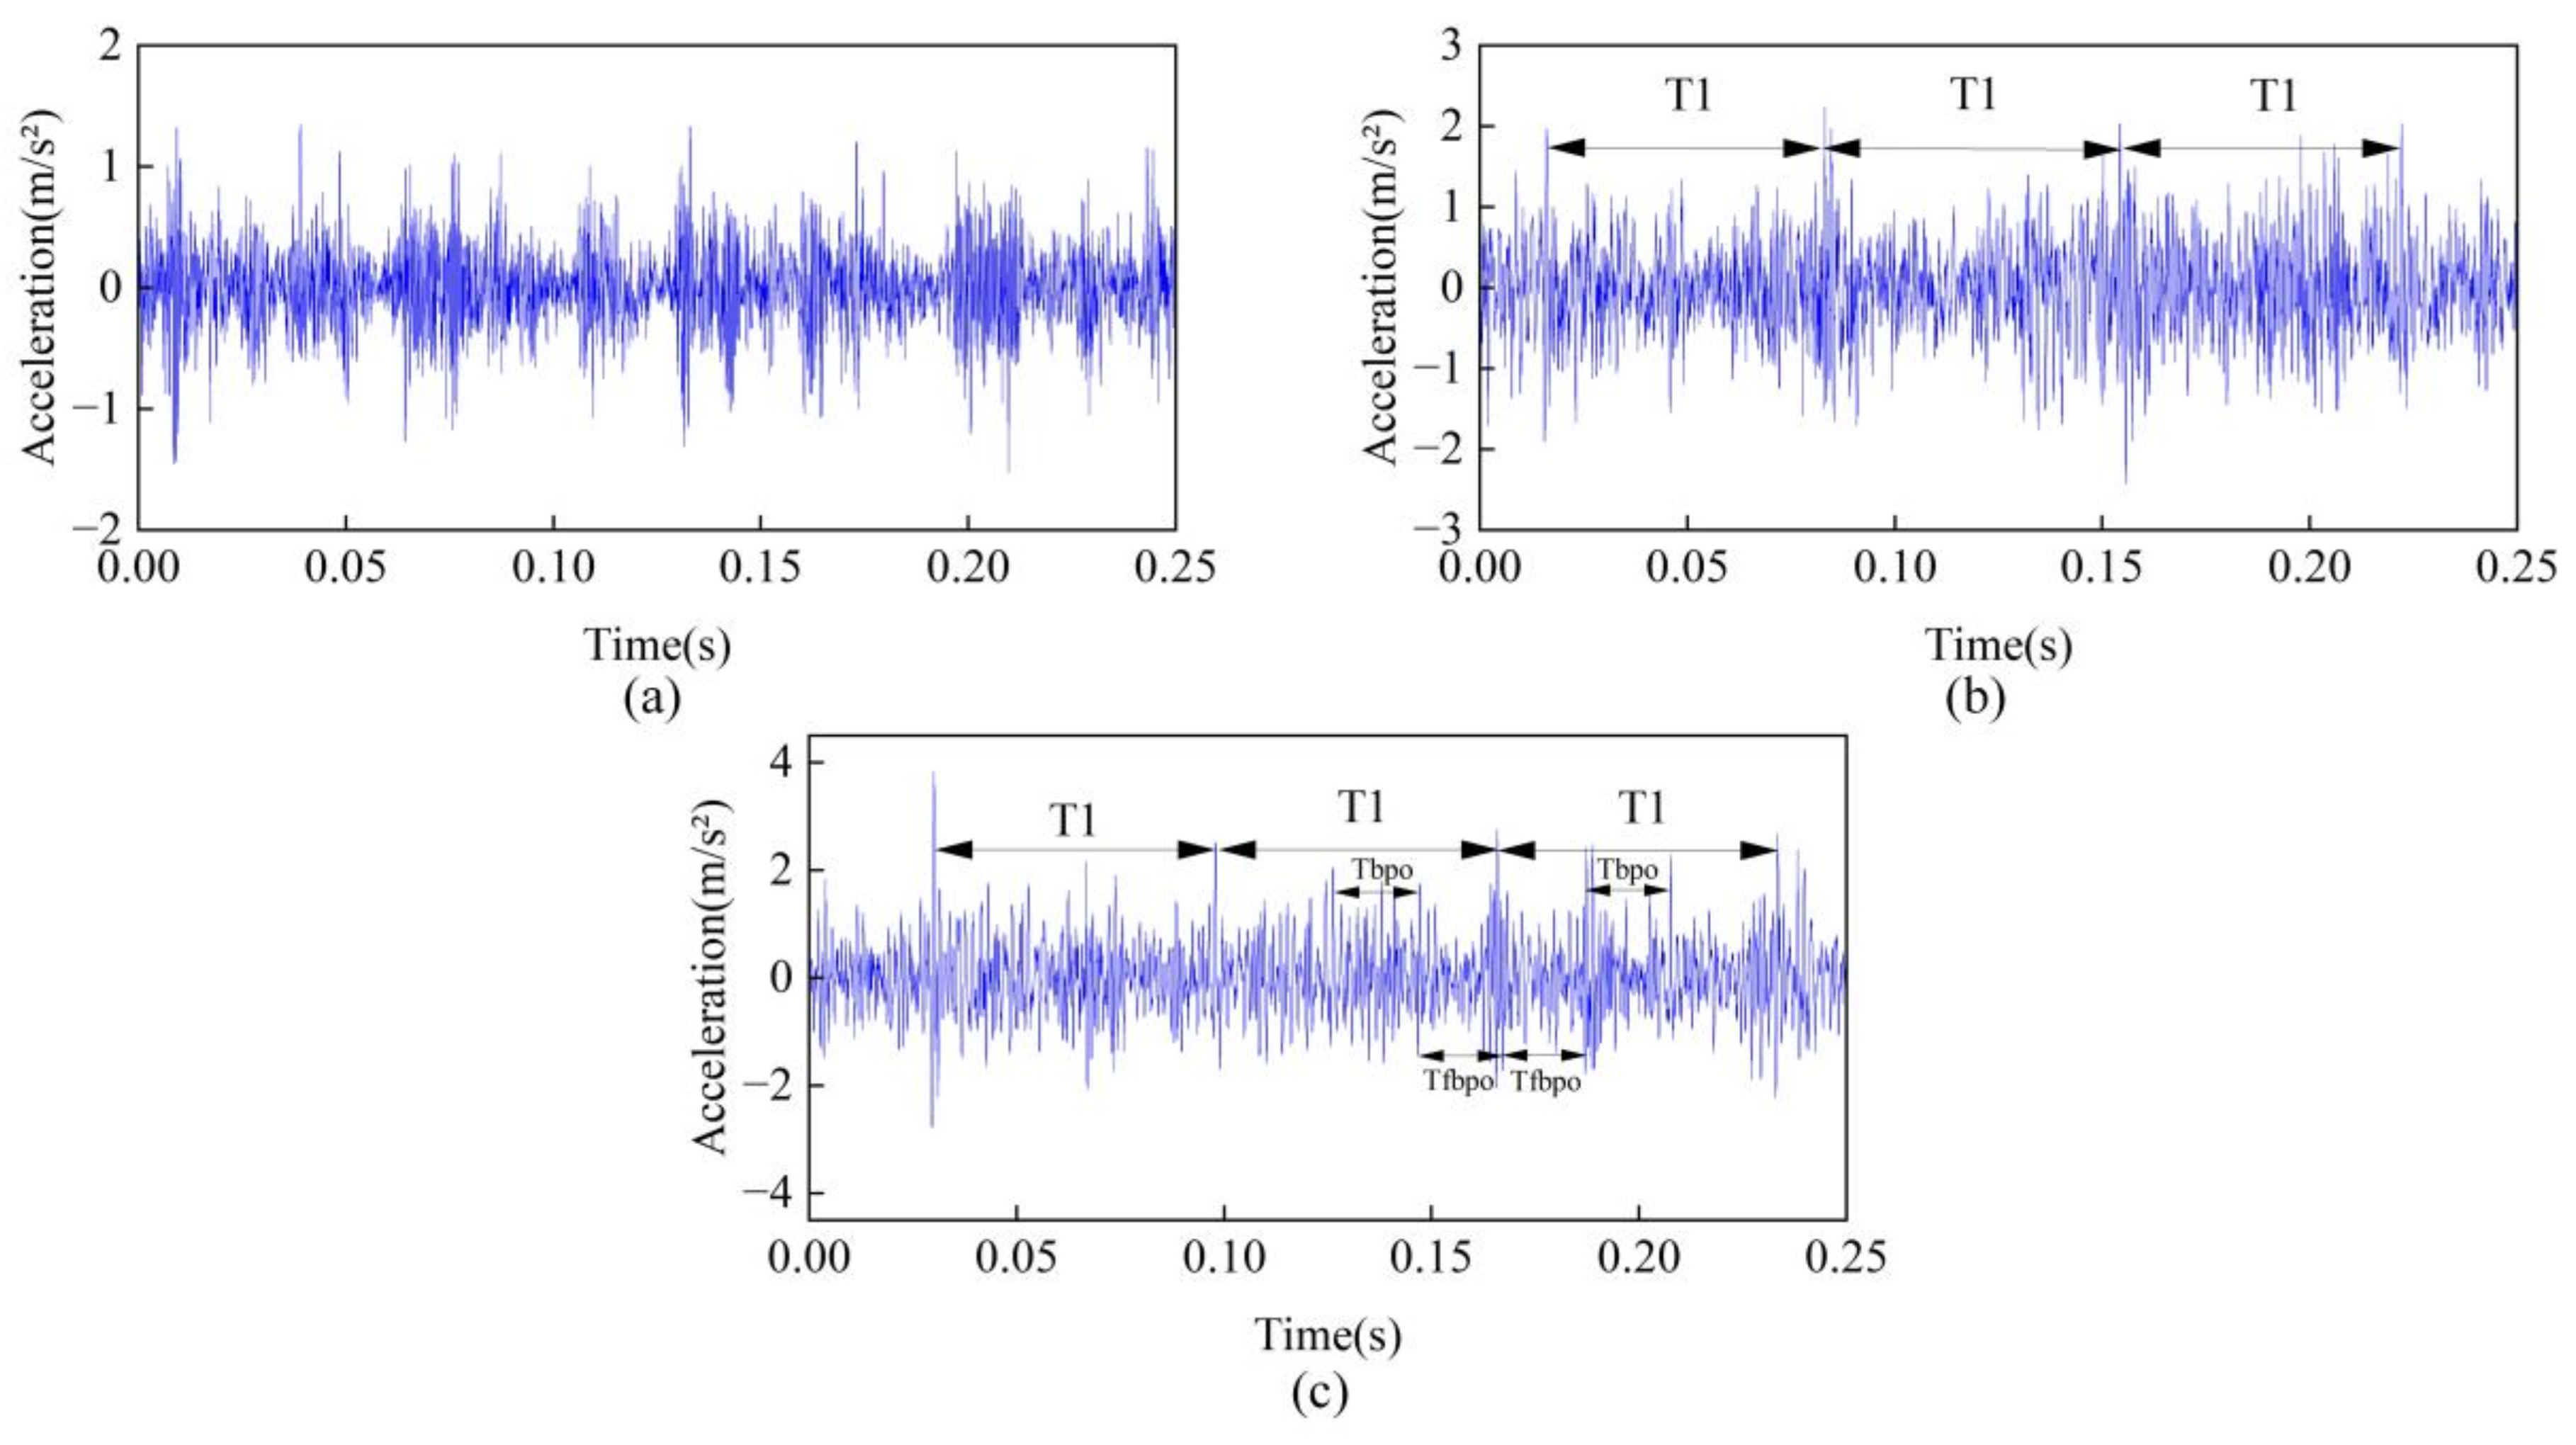
The vibration acceleration results under healthy condition, crack-only fault, and crack and bearing outer ring composite fault are shown in
Figure 26. In the case of the crack-only fault, the time-domain signal exhibits periodic impacts with a period of
, which is consistent with the simulation results shown in
Figure 19. Under the crack and bearing outer ring composite fault condition, the time-domain signal also exhibits periodic impacts with a period of
, which is caused by the bearing outer ring fault and is consistent with the simulation results shown in
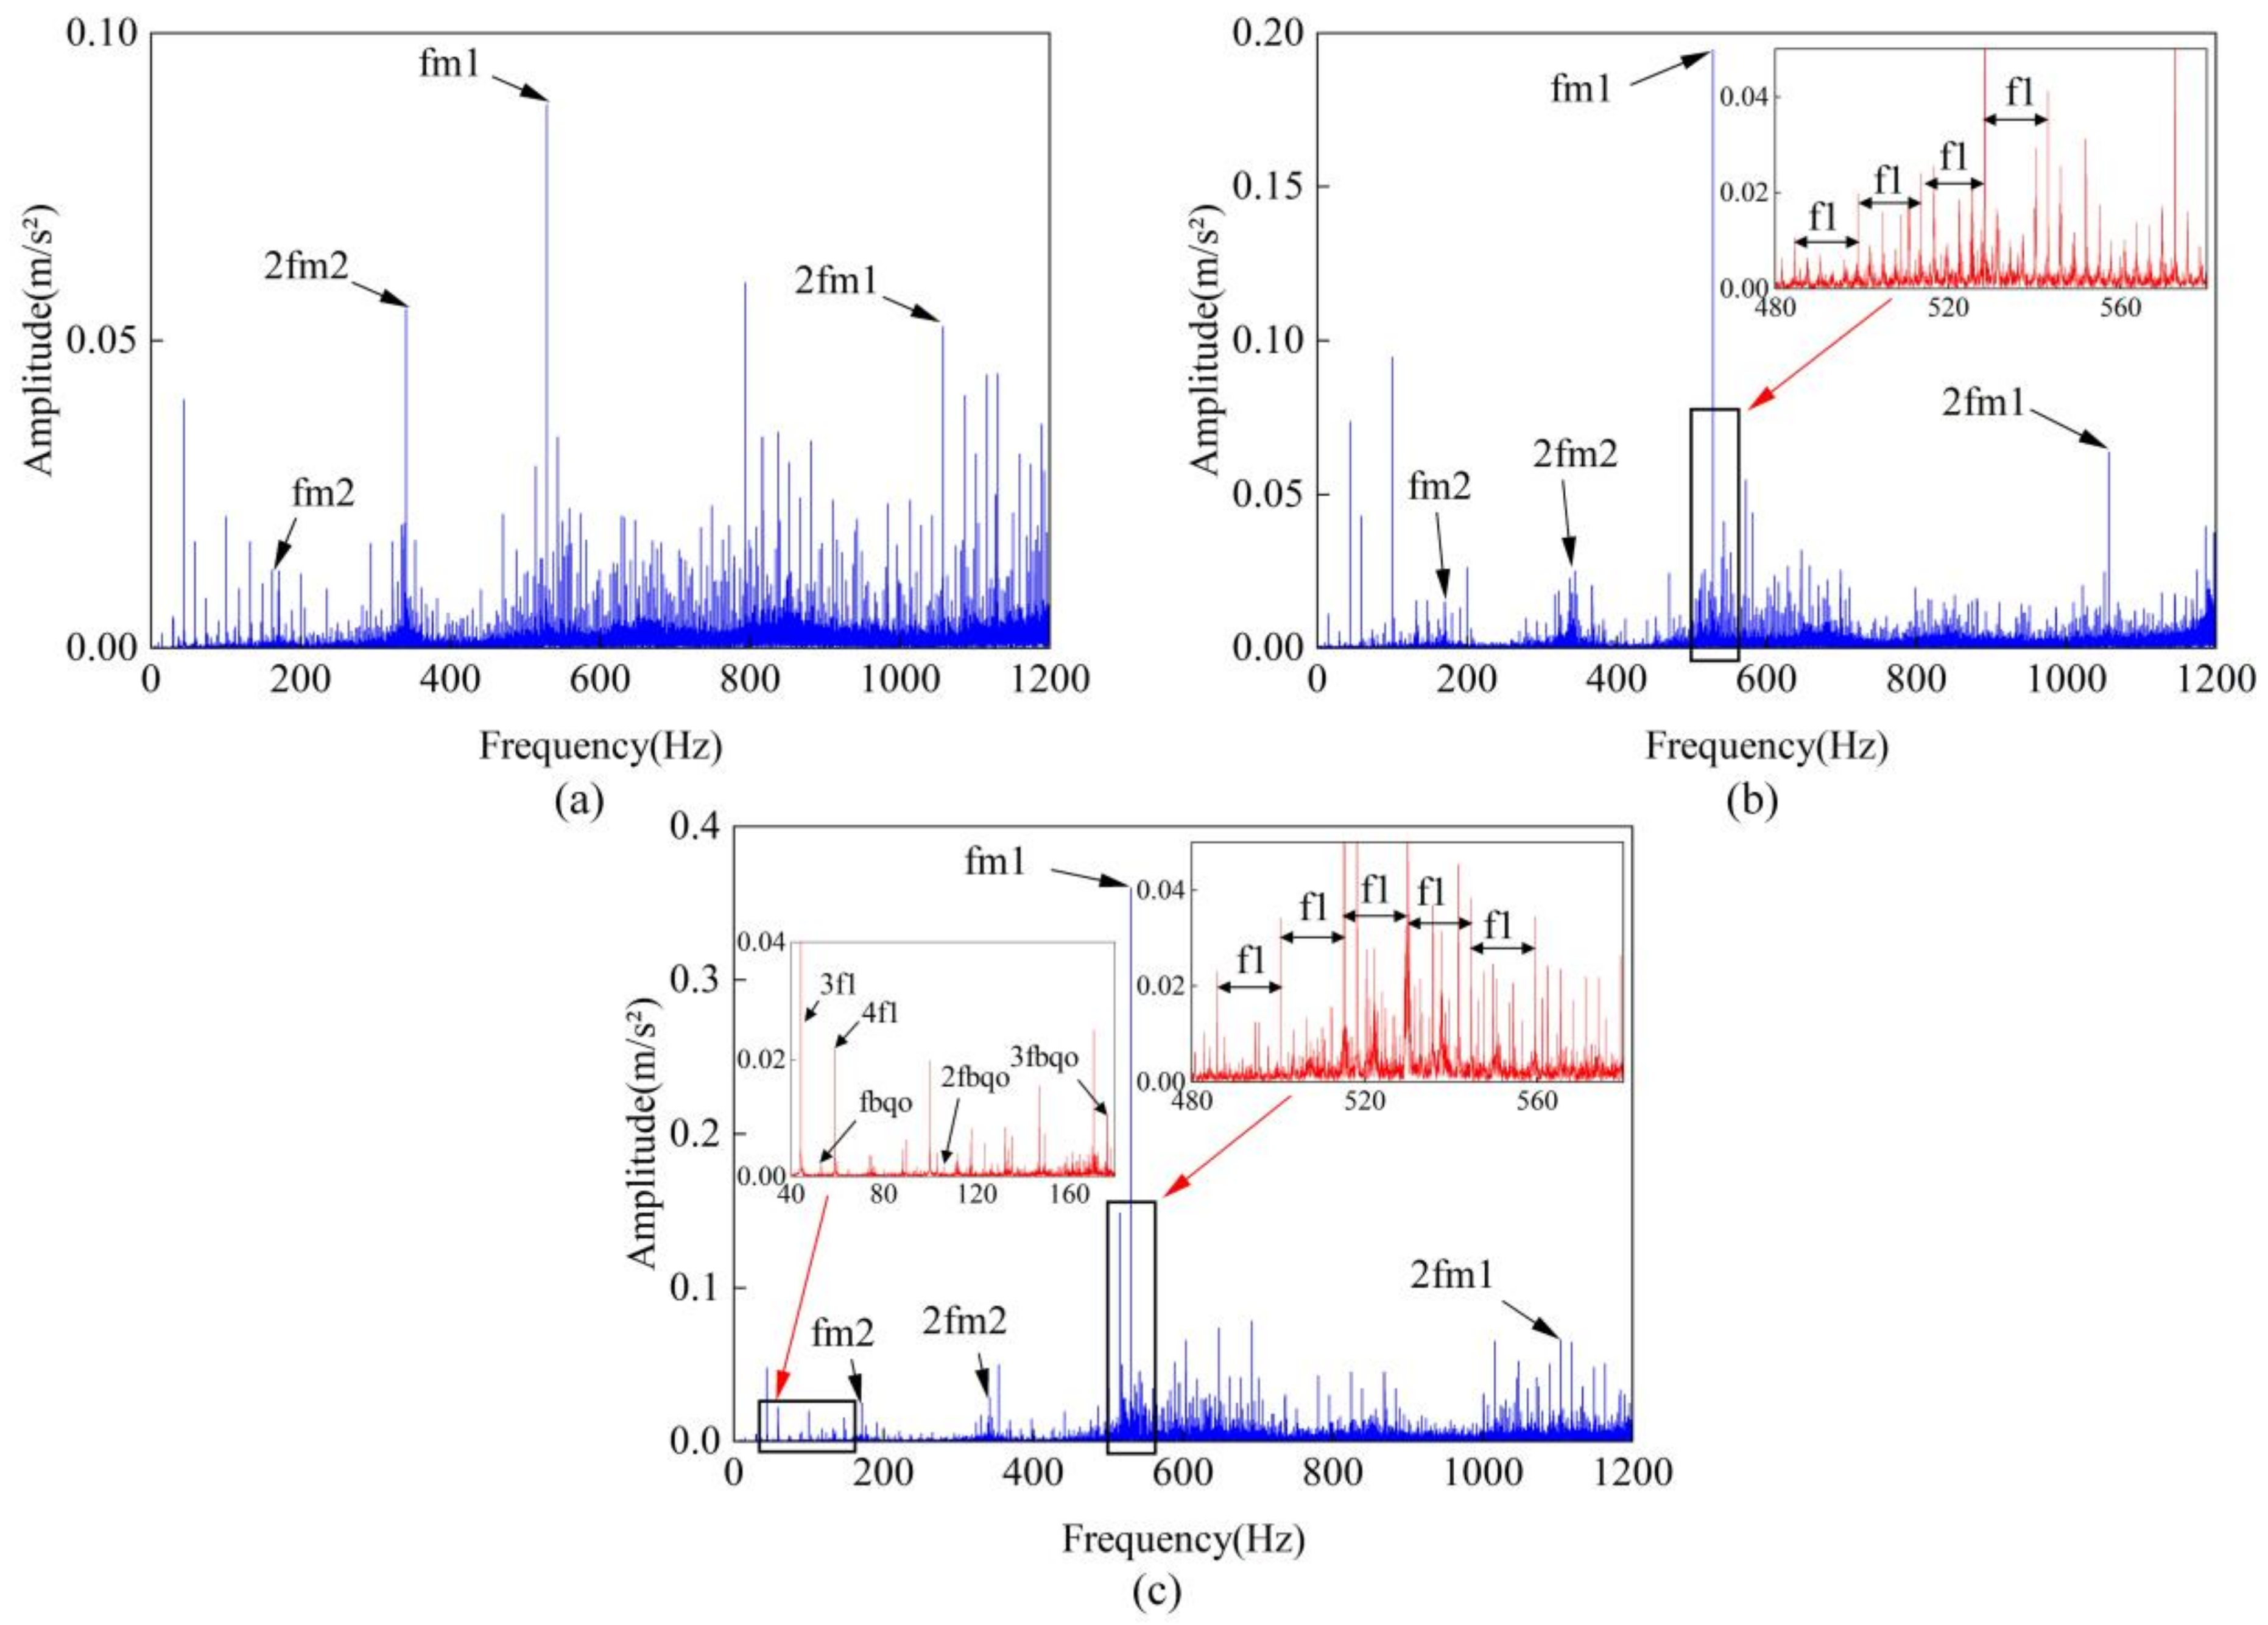
Figure 21. The frequency-domain spectrum of the experimental signal is shown in
Figure 27. Compared to the simulation signal, the frequency-domain spectrum of the experimental signal exhibits more complex sideband components due to the presence of noise in the experimental environment. However, the sideband components caused by the crack fault remain prominent, with sidebands spaced by
appearing near the harmonics of the meshing frequency. Additionally, in the frequency-domain plot under the crack and bearing outer ring composite fault, the bearing outer ring fault characteristic frequency component
appears, which is consistent with the simulation results shown in
Figure 20 and
Figure 22.
The aforementioned vibration acceleration signal is processed using band-pass filtering, with the frequency band containing the fault frequency set to 500–1200 Hz. The envelope spectrum is shown in the
Figure 28. The envelope spectrum under the crack-only fault shows the rotational frequency of the shaft on which the cracked gear is located, as well as its harmonic components, such as,
,
, and
. The envelope spectrum under the crack and bearing outer ring composite fault also exhibits the characteristic frequency of the bearing outer ring fault and its harmonic components, such as
,
, and
. This is consistent with the envelope spectrum of the simulation signal shown in
Figure 23.
7. Conclusions
This study simulates the actual crack propagation path, taking into account tooth-to-tooth coupling effects to calculate the time-varying mesh stiffness of gears. A dynamic model of the gear system with compound faults, including tooth root cracks and bearing outer ring defects, is established to analyze the system’s dynamic response under varying levels of deterioration. The conclusions are as follows:
The actual crack propagation path exhibits a concave shape, with the curvature of the path gradually increasing as the crack deteriorates. When the crack reaches 60% deterioration, it approaches the critical fracture point of the gear.
Compared to calculations that neglect the tooth-to-tooth coupling effect, incorporating this effect results in a reduction of approximately 53.03% in gear mesh stiffness within the dual-tooth meshing zone, aligning more closely with finite element analysis results.
When the crack deterioration is at a lower level, the amplitude of the bearing outer ring fault characteristic frequency near the gear meshing frequency and its harmonics is higher than the sideband amplitude caused by the crack. When the crack deteriorates to 30%, the amplitudes of the two become similar, making it difficult to distinguish fault characteristics. As the crack deteriorates further, the sideband amplitude increases continuously, gradually overwhelming the characteristic frequency of the bearing outer ring fault.
In addition to root cracks and outer ring bearing faults, future research could extend to other common fault types, such as tooth surface wear and ball bearing faults, thereby further enriching the theoretical foundation. The proposed model for calculating mesh stiffness does not take into account the deformation of gear teeth during operation; thus, future efforts could focus on refining this model to improve computational accuracy. Furthermore, based on the fault characteristic frequencies presented in this study, real-time monitoring systems could be developed to track the operational status of the system and provide timely alerts, thereby enhancing the safety and reliability of the system.


