Article

Lower Limb Joint Angle Prediction Based on Multistream Signaling and Quantile Regression, Temporal Convolution Network–Bidirectional Long Short-Term Memory Network Neural Network

1
School of Mechanical and Equipment Engineering, Hebei University of Engineering, Handan 056038, China
2
Key Laboratory of Intelligent Industrial Equipment Technology of Hebei Province, Hebei University of Engineering, Handan 056038, China
*
Author to whom correspondence should be addressed.
Machines 2024, 12(12), 901; https://doi.org/10.3390/machines12120901
Submission received: 8 November 2024 / Revised: 2 December 2024 / Accepted: 3 December 2024 / Published: 8 December 2024
(This article belongs to the Section Robotics, Mechatronics and Intelligent Machines)

Abstract

In recent years, the increasing number of patients with spinal cord injuries, strokes, and lower limb disabilities has led to the gradual development of rehabilitation-assisted exoskeleton robots. A critical aspect of these robots is their ability to accurately sense human movement intentions to achieve smooth and natural control. This paper describes research carried out on predicting the motion angles of human lower limb joints. Based on the design of a signal acquisition system for physiological muscle signals and inertial measurement unit (IMU) data, a hybrid neural network prediction model (QRTCN-BiLSTM) and a single neural network prediction model (QRBiLSTM) were constructed using quantile regression, temporal convolution network (TCN) and bidirectional long short-term memory network (BiLSTM), respectively. At the same time, 7-channel surface electromyographic signals (sEMG) and 12-channel IMU data from hip and knee joints were collected and input into the QRBiLSTM and QRTCN-BiLSTM models to unfold the training and analyze the comparison. The results show that the QRTCN-BiLSTM model can more accurately infer human movement intention and provide a more reliable and accurate prediction tool for human–robot interaction research in rehabilitation robotics.

Graphical Abstract

1. Introduction

In recent years, due to the increasing number of patients with spinal cord injuries, strokes, and lower limb disabilities, rehabilitation-assisted exoskeleton robots have come into focus [1,2,3,4,5,6,7]. A large number of research works have focused on developing synchronized and proportional control mechanisms for these devices, where accurately capturing the intent of human movement is critical to achieve smooth and natural control [8,9,10]. Effective decoding of human behavioral information provides a solid theoretical foundation for exploring the patterns of human behavior [11].
Surface electromyography (sEMG), based on its non-invasive and easily accessible characteristics, has become an ideal biosignal for predicting motor intentions, and its applications include motion pattern detection, gait phase classification, and prediction of lower limb joint angles [12,13,14,15,16]. However, sensor placement, skin moisture, and muscle fatigue may affect the quality of EMG signals [17]. For the same subject repeating the same movement in different situations or for other subjects performing similar movements, the acquired sEMG signals may exhibit significant differences. This signal variability poses a challenge when using sEMG signals to predict the movement intentions of different subjects.
With the rapid development of deep learning technology, using machine learning algorithms to construct sEMG signal-based joint angle estimation models has become the most popular method of joint angle estimation [18]. Zhang F et al. [19] estimated the joint angles of the human leg by collecting sEMG signals and using a BP neural network to calculate the angles. Song Q et al. [20] used sEMG as input data and trained a model using an LSTM neural network to achieve continuous online lower limb joint angle prediction. Yi C et al. [21] used an end-to-end long short-term memory (LSTM) network to make predictions by analyzing the starting point of the EMG signal (motor-mechanical delay), which can achieve continuous kinematic parameter prediction, thereby improving the assistance performance of the lower extremity exoskeleton. Zhang Y-P et al. [22] collected various types of gait information such as plantar pressure information, joint angle information, and surface electromyography signal information and used a convolutional neural network (CNN) for training to achieve joint angle prediction. Coker et al. [23] used sEMG signals as input and used an artificial neural network (ANN) to predict the movement intention of the lower limbs. Baby Jephil et al. [24] used sEMG signals and a support vector machine (SVM) classifier to identify plantar flexion and dorsiflexion movement patterns. Goh, G.L. et al. [25] studied the joint angles of a flexible robotic finger and compared three models: linear regression, decision tree, and K-nearest neighbor regression. The results showed that the K-nearest neighbor regression model best predicted the correlation between temperature, tension, and bending angle. However, the above study only used a single neural network for prediction, which has certain limitations on the experimental prediction results.
By combining one or more neural networks, the respective advantages of multiple neural networks can be combined to improve the accuracy of the prediction. Li W et al. [26] used an electromyography (EMG) signal acquisition device and a gyroscope sensor to collect sEMG signals and joint angle information, respectively, and accurately estimated human movement intentions using a fuzzy wavelet neural network (FWNN) and a zero-centered neural network (ZNN). Zhu M et al. [27] solved the problem of sEMG signal prediction by combining a hybrid model combining a convolutional neural network (CNN) and a long short-term memory network (LSTM), and using an improved principal component analysis (PCA) method to process and predict the sEMG signal, they solved the problem of sEMG signal prediction and provided a more accurate and effective prediction model. Astudillo F et al. [28] and Khairuddin IM et al. [29] collected the sEMG signals as input, extracted multiple feature values such as waveform length (WL), mean absolute value (MAV), and root mean square (RMS), and used classifiers such as linear discriminant analysis (LDA), logistic regression (LR), decision trees (DT), support vector machines (SVM), and k-nearest neighbors (k-NN) for classification, achieving accurate classification of motor intent.
Inspired by the above literature, this study constructed a QRTCN-BiLSTM neural network to predict the motion angles of lower limb joints. The model was analyzed by quantile regression, which integrates the fast feature extraction property of temporal convolutional network (TCN) with the efficient temporal analysis performance of bidirectional long and short-term memory network (BiLSTM), presenting good learning and prediction performance.
Meanwhile, a signal acquisition system integrating physiological muscle signals and inertial measurement unit data was designed in the study, which provided multi-dimensional data support for the accurate recognition of lower limb movement intention in the experiment. The processed relevant data were input into the QRBiLSTM and QRTCN-BiLSTM models, respectively, for training and comparative analysis, which confirmed the effectiveness of the proposed QRTCN-BiLSTM model in dealing with complex human motion data.

2. Materials and Methods

The primary process of this study consisted of four stages, from signal acquisition to angle prediction:
  • The sEMG and IMU sensors acquire the lower limb muscle signals;
  • The resulting data are filtered and subjected to signal smoothing and normalization by preprocessing and post-processing;
  • A more comprehensive range of input sequences is obtained by stacking the 3-layer TCN residual module;
  • The BiLSTM neural network is imported for joint angle prediction.

2.1. Signal Acquisition

This study aimed to estimate hip and knee angles during walking based on electromyography of human leg muscles. Five healthy male subjects, aged between 23 and 28 years, with no history of neuromuscular disease, participated in the signal acquisition experiment; the experimental procedure was explained to the subjects in detail before the start of the test experiment. The basic information of the subjects is shown in Table 1.
After being equipped with the sensors, all subjects were asked to walk at a constant speed on level ground. Before each experiment, the subjects were given sufficient rest to prevent muscle fatigue and enough time to acclimate before recording data to ensure no discomfort during the walk. The experimental scenario is shown in Figure 1.
The test experiment focused on collecting dynamic signals during walking, covering sEMG data and IMU data at both the hip and knee joints. The primary control device for data collection was a 32-bit microcontroller development board ESP-WROOM-32, developed by Espressif. The ADC analog signals generated by the sEMG sensors and the signals collected by the IMUs (converted to digital signals by the IIC protocol) are transmitted to a PC through the ESP32 via the serial bus for data transmission.
During testing, the sEMG sensor signal is collected at a frequency of 500 Hz. And the target is seven significant muscles of the human lower limb: tibialis anterior (TA), medial gastrocnemius (MG), soleus (SOL), vastus lateralis (VL), rectus femoris (RF), biceps femoris (BF), and semitendinosus (ST). The sensors were fixed on the muscle surface by disposable gel electrodes, and the skin surface was shaved and wiped clean with alcohol to reduce the contact impedance between the skin and the sensors; two electrodes were set up for each muscle; and the distance between the electrodes was set at 2 cm (center-to-center).
When the sEMG signal was acquired, the subject walked on flat ground at a uniform speed, and the whole signal was periodically distributed. However, during the acquisition process, the signal was first irregularly perturbed, then periodic, and finally, irregularly perturbed. The periodic signal part was retained when selecting the signal, and the more significantly perturbed parts at the beginning and the end were deleted. Figure 2 shows the main sEMG signals acquired in the test experiment. The acquired surface electromyography (sEMG) signal is a weak signal, which is bound to be affected by many physical factors such as hair obstruction, sebum interference, and crosstalk induced by neighboring muscles, as well as by electrode cables and industrial frequency perturbations in the acquisition process. This leads to a large amount of noise in the original EMG signal, causing the acquired signal to vibrate violently, thus seriously affecting the accuracy of the original EMG signal, quickly leading to the distortion of the sEMG signal.
For the measurement of lower limb joint angles, an inertial measurement unit (IMU) was used for data acquisition. The sampling frequency was 500 hz. The experimental scenario is shown in Figure 1. A sensor was placed in each of the hip and knee joints, where the sensor IMU1 represents the measurement of the hip joint, and IMU2 represents the measurement of the knee joint.
The inertial measurement unit (IMU) uses the MPU6050 module from InvenSense, the world’s first 6-axis motion processing component. It integrates a 3-axis gyroscope and a 3-axis accelerometer, with an embedded IIC interface to connect to external magnetic sensors. The IMU utilizes its own Digital Motion Processor (DMP) to perform hardware-accelerated imaging, outputting complete 9-axis attitude fusion data.
Figure 3 shows the capture IMU signals, which are the six-axis signals output from the IMU sensor (angular velocity and angular acceleration in three directions). When the IMU signals are collected, all the signals are also periodically distributed. When selecting the signals, the periodic part of the signal is retained, and the more disturbed parts at the beginning and the end are deleted.
Two problems occur during the acquisition of IMU signals. On the one hand, the limb jitter causes the acquired signal to produce a slight flutter, resulting in a decrease in signal smoothness; on the other hand, the sampling rate change during the testing process causes the signal to show a jagged characteristic.

2.2. Signal Processing

In view of the negative features presented in the sEMG and IMU signal acquisition, filtering and noise reduction processes are implemented here to enhance the quality and reliability of the signals.

2.2.1. Noise Reduction of sEMG Signals

The original signal undergoes preprocessing, which involves applying a band-pass filter to isolate signals within the 20–50 Hz frequency range, capturing the main sEMG information. A trap filter is then used to remove any industrial frequency interference. Following this, the pre-processed signals undergo further processing using the full-wave rectification method to enhance the amplitude variation.
The mathematical expression for full wave rectification is
s E M G p o s t n = s E M G p r e n
where s E M G p r e ( n ) denotes the preprocessed signal and s E M G p o s t n is the full-wave rectified signal.
In order to visualize the active values of the sEMG signal, a second-order Butterworth filter is then used to filter out individual peaks in the signal, which, in turn, creates a smooth linear envelope that is normalized.
At this point, the transfer function is
G 2 ω = H ( j ω ) 2 = G 0 2 1 + ω 5 4
where G 0 denotes the DC gain.
Figure 4 shows the noise reduction process and results of the sEMG signal. The processed signal, which filters out some of the peaks, produces a smooth linear envelope reflecting the sEMG signal’s activity amplitude.

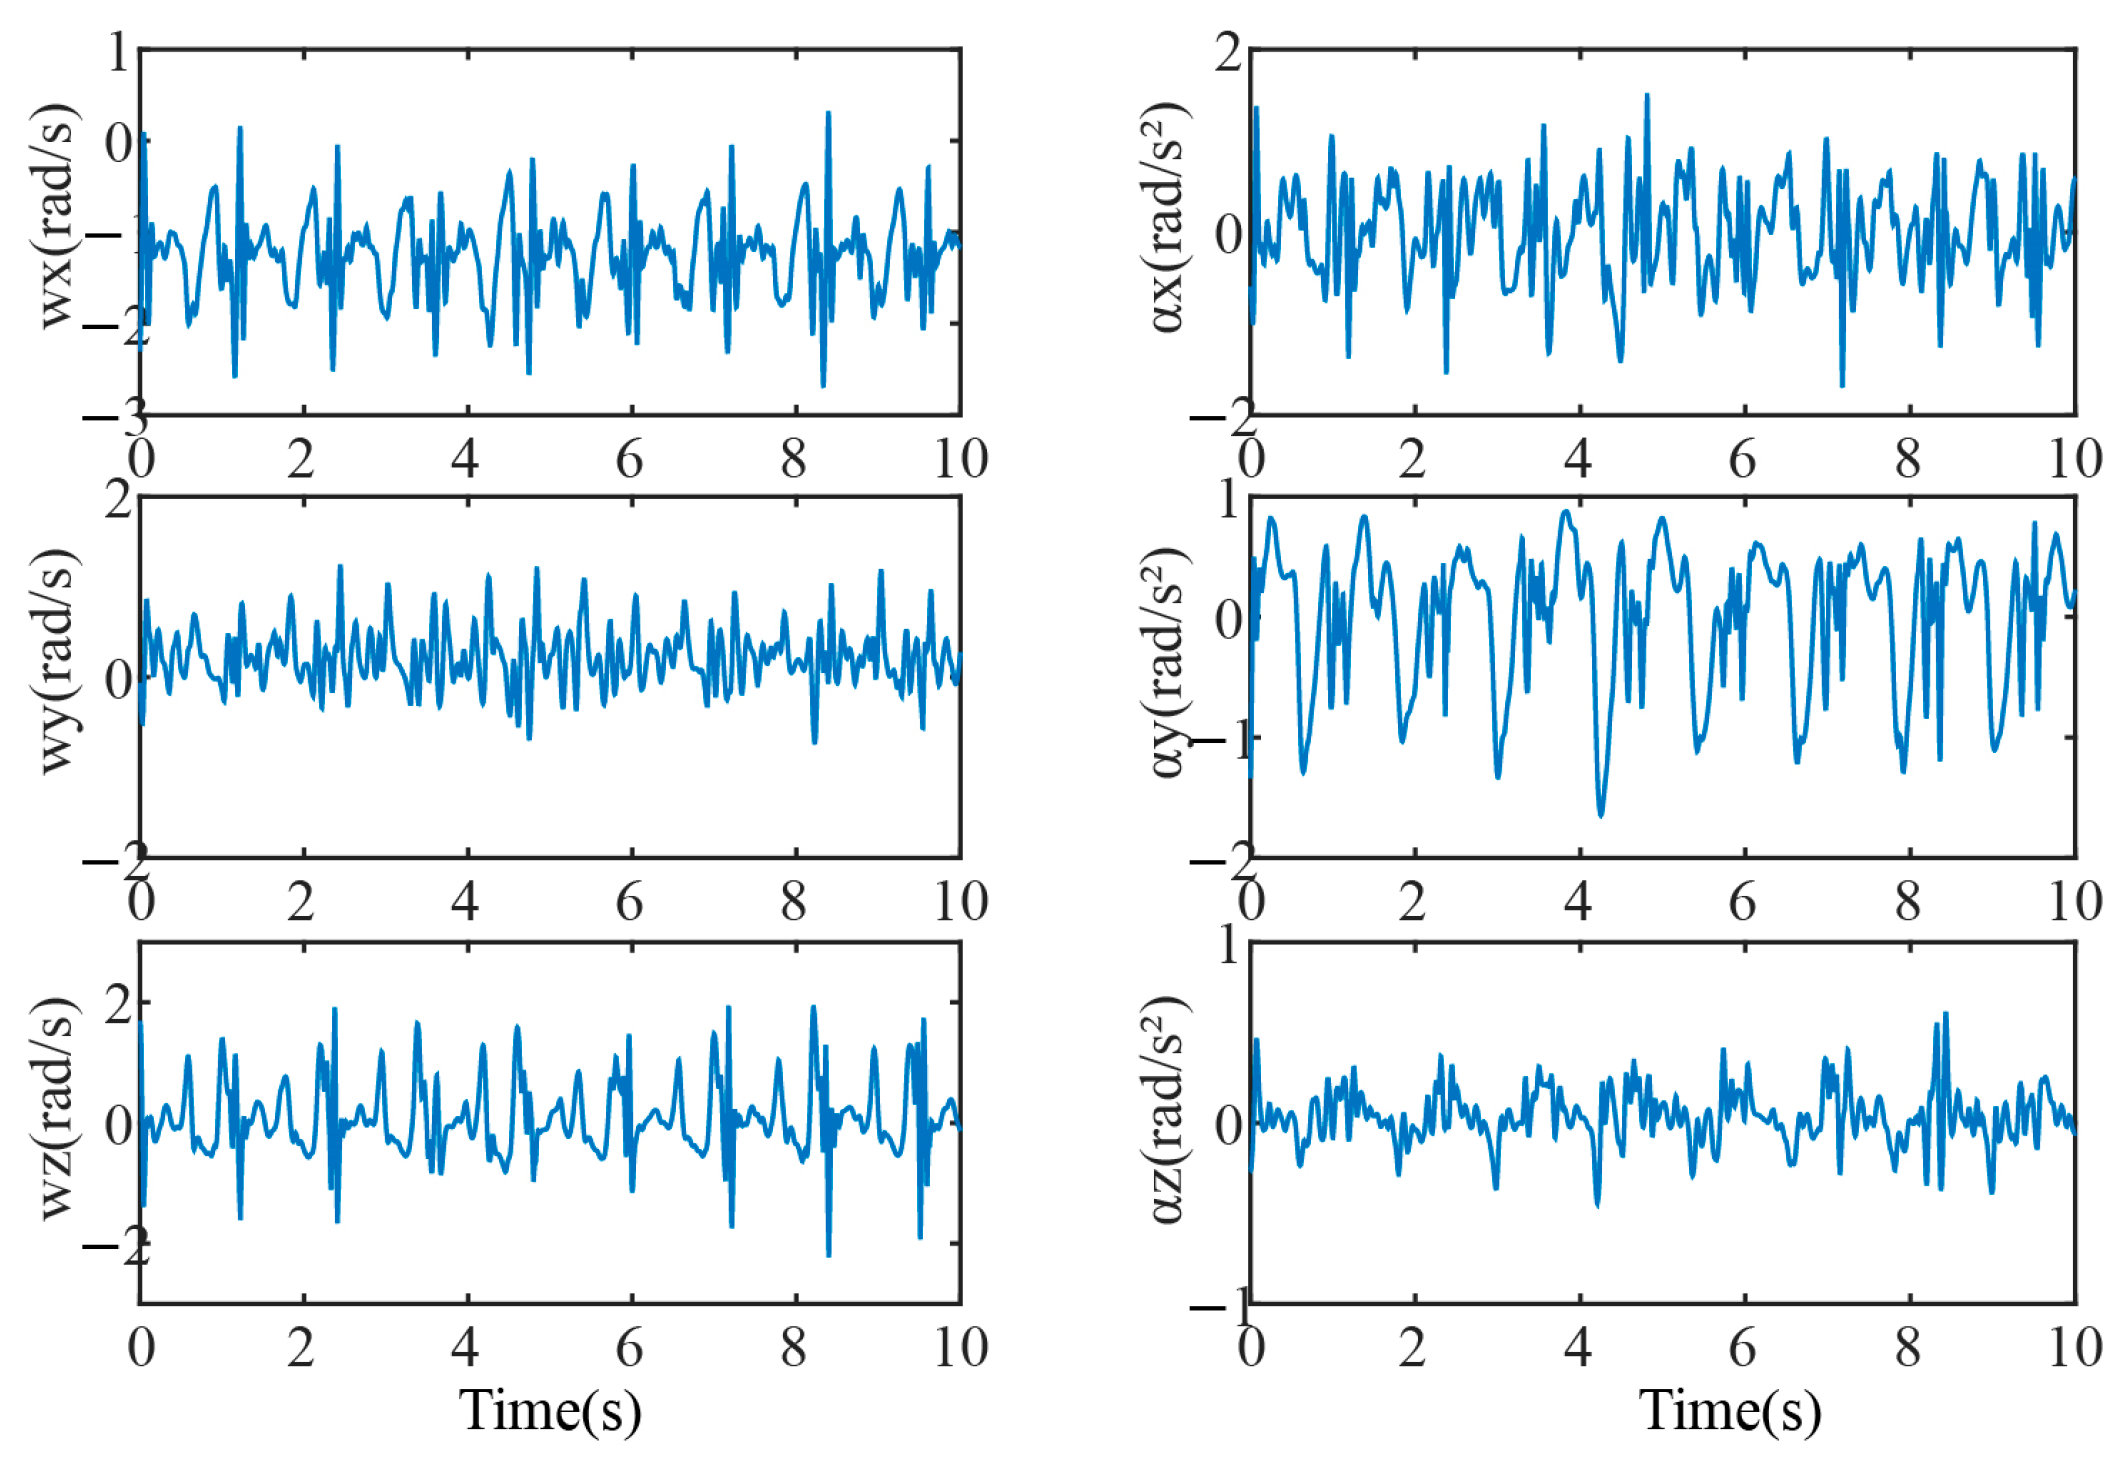
2.2.2. IMU Signal Noise Reduction

Wavelet noise reduction theory demonstrates significant advantages for IMU signal reduction [30,31]. As a time–frequency analysis method, the wavelet transform can localize the signal in both time and frequency domains simultaneously, effectively capturing the mutations and singularities in the signal to achieve the separation and removal of noise.
This paper processes the IMU signals collected from the test experiments using a threshold of 12 dB. The noise-canceled signal is obtained by wavelet reconstruction, as shown in Figure 5. The processed data effectively suppress the noise while retaining the useful information of the IMU signal, providing more accurate input data for the subsequent prediction of the lower limb joint angle.

2.3. Neural Network Construction

2.3.1. Quantile Regression

This paper uses quantile regression to achieve interval prediction. Compared with traditional interval prediction methods, quantile regression requires no a priori assumptions. It can obtain the upper and lower bounds of the model simply by using its regression model. It determines the regression model by exploring the conditional quantile relationship between the independent and dependent variables. It can achieve conditional quantile calculation that estimates the response variable based on the explanatory variable.
Suppose that a c explanatory variable U = { U 1 , U 2 , , U c } acts on a random variable S, whose distribution function can be expressed as
F s = P S s
For any quantile τ , τ 0 , 1 , there are
F 1 τ = inf s : F s τ
where F 1 τ is the τ th quantile of S and inf s is the lower bound of the set S .
The τ th conditional quantile Q S τ | U of the response variable S under the explanatory variable U in the linear quantile regression model is
Q S τ | U = β 0 τ + i = 1 c β i τ U i = U β τ
where β τ is the vector of regression coefficients under the τ quantile.
The β τ is different under different quantile points, so the determination of β τ also determines this regression model. In addition, the parameters associated with β τ can be solved by the loss function of the following equation, i.e.,
min β i = 1 N ρ τ S i U i β = min β i | S i U i β τ S i U i β + i | S i < U i β ( 1 τ ) S i U i β
where ρ τ μ is the test function that solves for the model regression coefficient β τ by minimization. The checking function ρ τ μ is
ρ τ ( μ ) = μ ( τ I ( μ ) )
I μ = 1 , μ < 0 0 , μ 0

2.3.2. Temporal Convolutional Network (TCN)

Data features can be intensely mined with the help of temporal convolutional networks (TCNs). TCNs are commonly used to process time series and can extract features from time series data more efficiently. A typical TCN architecture consists of causal convolution, residual concatenation, and inflationary convolution. Inflated convolution expands the sense field of the convolutional layer to better capture long-term dependencies in the time series, and the introduction of residual concatenation avoids the problem of vanishing gradients and performance degradation.
The network structure diagram of TCN is shown in Figure 6.

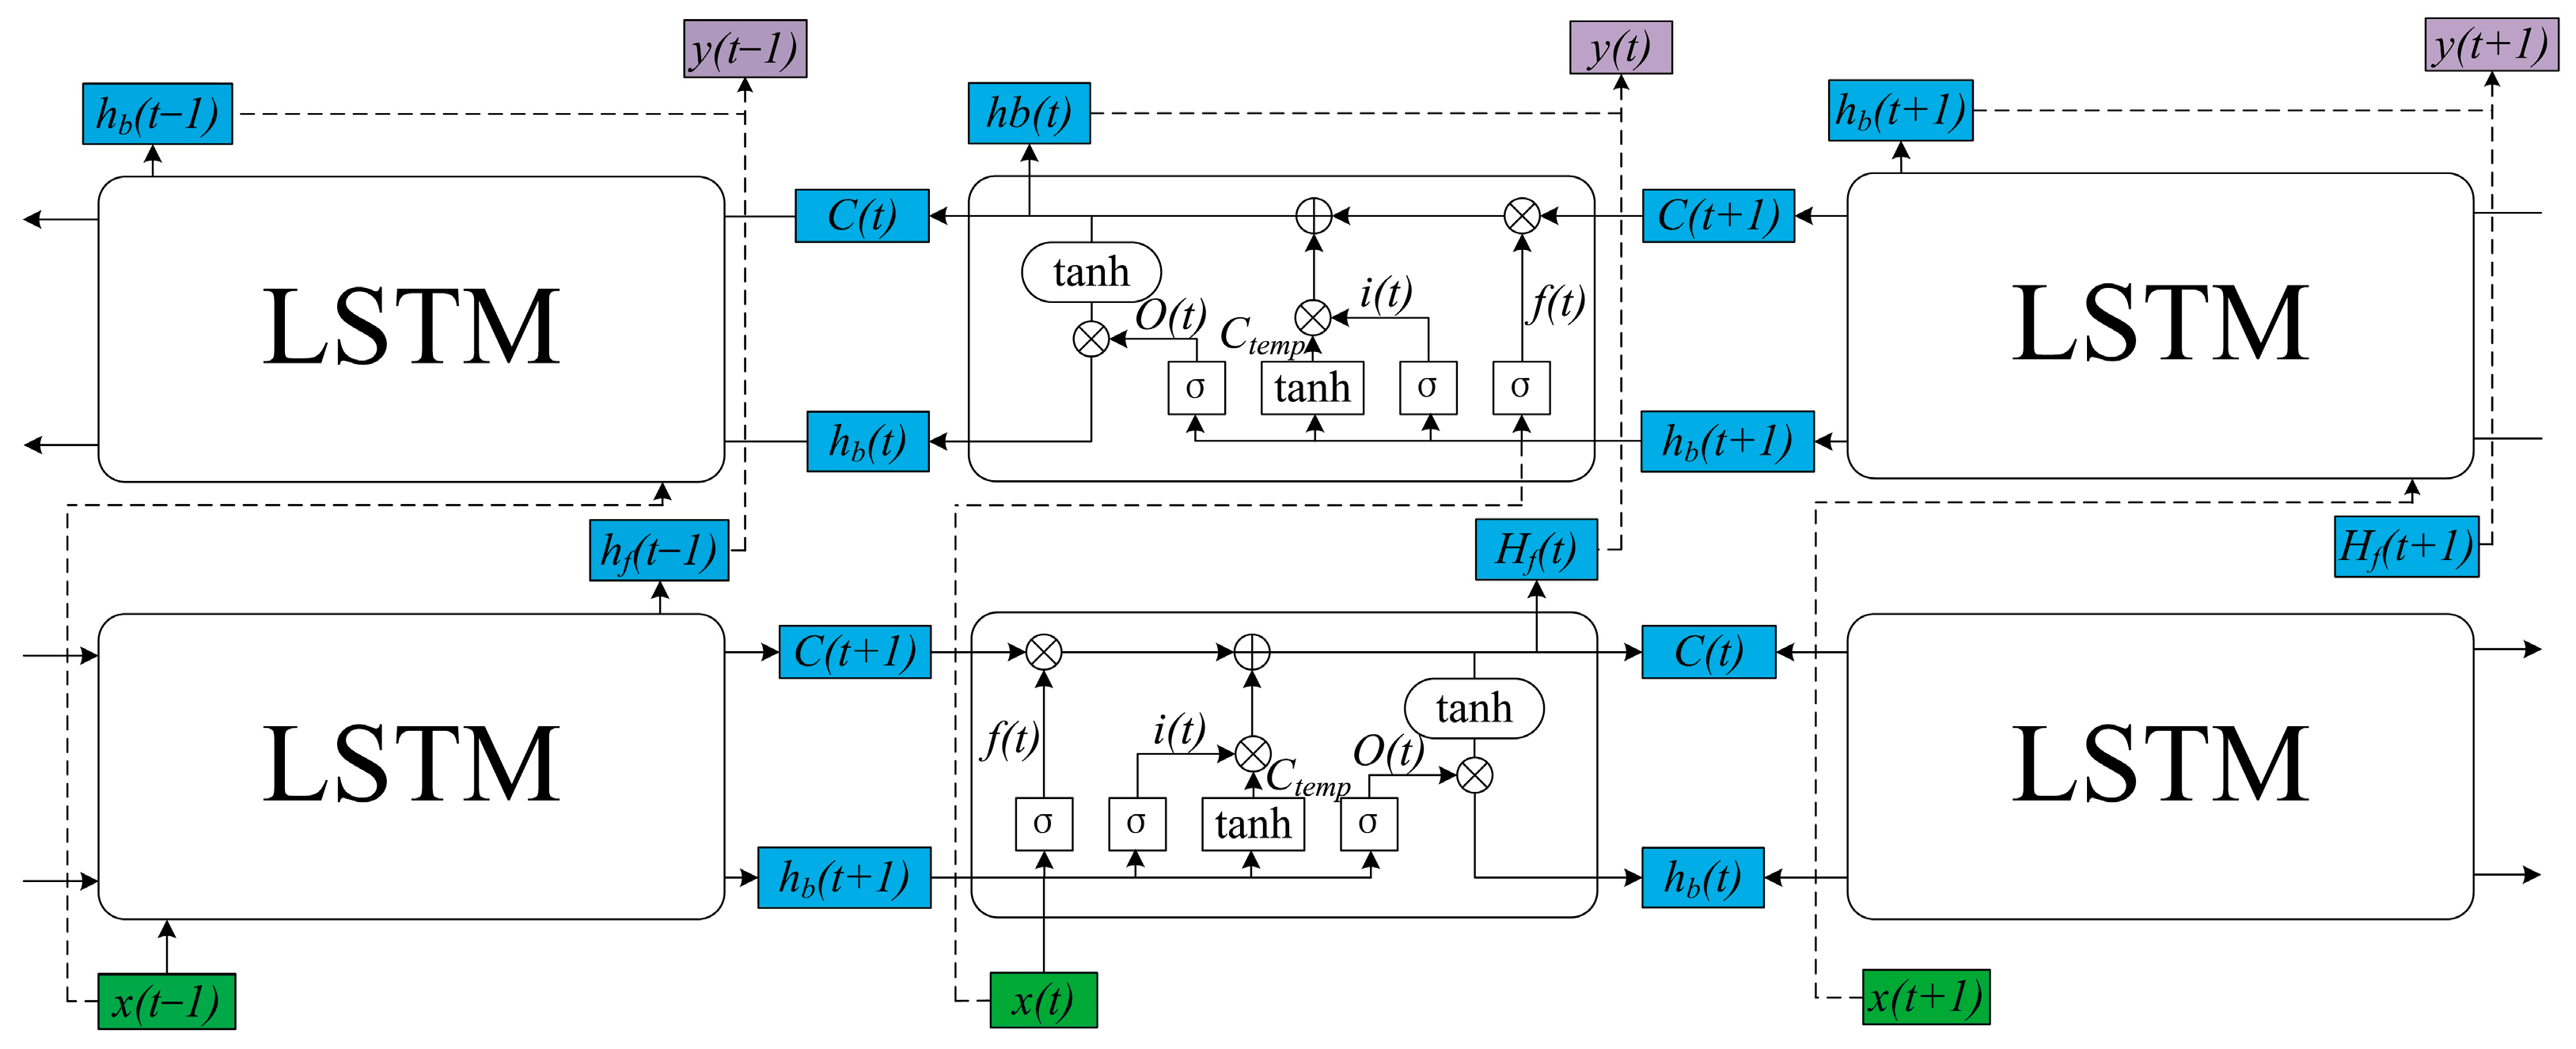
2.3.3. Bidirectional Long Short-Term Memory(BiLSTM)

BiLSTM is closely related to LSTM, consisting mainly of memory and gating units (i.e., input, forget, and output gates) [32,33,34]. The memory unit stores and updates state information, the input gate decides which information in the input sequence can be passed into the unit, the forgetting gate selectively forgets part of the information of the hidden state of the previous unit, and the output gate filters the information that is passed into the next unit.
BiLSTM is based on a two-layer anisotropic LSTM network (Figure 7 shows the principle of its structural composition), which takes into account the interactions between the temporal data at different moments before and after and can overcome the limitation of the unidirectional flow of data in LSTM.

2.4. Construction of Neural Network Prediction Model (QRTCN-BiLSTM)

In this paper, we combine the advantages of quantile regression, TCN, and BiLSTM to construct a neural network interval prediction model based on QRTCN-BiLSTM:
First, the TCN residual modules are stacked by three layers in order to obtain a wider sensory field of the input sequence while effectively circumventing problems such as gradient explosion and gradient vanishing. Each residual block possesses the same kernel size k, and its expansion factor D is set to 1, 2, and 4, respectively.
Then, BiLSTM receives the processed data sequences from TCN, which connects the LSTM layers in both forward and reverse directions, and processes the input sequences in a front-to-back order (forward) and reverse order, respectively. Thus, BiLSTM can more comprehensively explore the features’ dependencies and obtain contextual relevance.
Finally, the quantile regression module is used to carry out regression prediction. The prediction results and their upper and lower ranges are obtained based on the range of confidence intervals, and then the evaluation indicators are plotted and calculated.
The network structure of QRTCN-BiLSTM is shown in Figure 8.

3. Results

To verify the accuracy of the QRTCN-BiLSTM prediction results, this study combined the detection and data acquisition processes of the previous leg muscle electrical information to carry out a comparative experiment with QRBiLSTM.
In this study, five subjects were used and five sets of data were collected for each. The collected data included 7 sets of sEMG signals, 12 sets of IMU signals, and 2 sets of joint angle data. After all the data were spliced and integrated, the training set and test set were divided in a ratio of 7:3. The processed data were then input into the QRBiLSTM and QRTCN-BiLSTM neural networks for training.
The experiment was carried out in the following software and hardware environments: Matlab version R2024a, graphics card (3060ti with 8G video memory; NVIDIA, CA, USA), central processing unit (i5-10400F; intel, CA, USA), and operating system Windows 10.
There, the prediction accuracy of the QRBiLSTM and QRTCN-BiLSTM models was calculated using the root mean square error (RMSE), mean absolute error (MAE), R-Square (R2), mean absolute percentage error (MAPE), and interval coverage, with a 95% confidence interval.
These are expressed as follows:
R M S E = 1 N i = 1 n ( y exp ( i ) y pre ( i ) ) 2
M A E = 1 n i = 1 n y exp ( i ) y p r e ( i )
R 2 = 1 i = 0 n y exp ( i ) y p r e ( i ) 2 i = 0 n y exp ( i ) y ¯ exp ( i ) 2
MAPE = 100 % i i = 1 n y p r e ( i ) y exp ( i ) y exp ( i )
where y exp ( i ) is the i-th actual value of the prediction target and y p r e ( i ) is the i-th prediction value.
The calculation results of the above four evaluation indicators are shown in Table 2. Anglehip and Anglehip refer to the joint angles of the hip and knee joints. QB represents the value calculated by QRBiLSTM, and QTB represents the value calculated by QRTCN-BiLSTM. For the evaluation index R2, the closer the value is to 1, the better the model’s estimation performance; for RMSE, MAE, and MAPE, the closer the value is to 0, the better the model’s prediction performance; and the greater the interval coverage, the more reliable and stable the prediction results.
After rigorous and sufficient training, the final training results for hip and knee joints under QRBiLSTM and QRTCN-BiLSTM are shown in Figure 9. The horizontal coordinates represent the time series, and the vertical coordinates represent the joint angles. The angular error is shown in Figure 10. The horizontal coordinates represent the time series, and the vertical coordinates represent the angular error. The prediction results of QRBiLSTM and QRTCN-BiLSTM have fluctuations in the peaks and valleys, and compared with them, the prediction results of QRBiLSTM fluctuate more, especially during 2–3 s in the lower part of Figure 9a.

4. Discussion

4.1. Comparison of Precision Evaluation Indexes

According to the data in Table 2, it can be found that among all the evaluation metrics of the training set, the RMSE of the QRTCN-BiLSTM model is significantly lower than that of the QRBiLSTM model, with a difference of 0.026 in the calculation results of the hip joint and 0.019 in the calculation results of the knee joint. This indicates that the QRTCN-BiLSTM model fits the data more accurately during training and can more effectively capture the subtle features of changes in lower limb joint angles, thereby reducing the deviation between the predicted value and the actual value.
For the MAE, the results of the QRTCN-BiLSTM and QRBiLSTM models differ by 0.021 for the hip joint and 0.002 for the knee joint, which further demonstrates the advantage of QRTCN-BiLSTM in terms of prediction accuracy.
A higher coefficient of determination R2 value indicates that the model can extract more valuable information from complex data, which provides strong support for accurately predicting the angle of the lower extremity joints. From the calculation results of the two tables, the R2 value of the QRTCN-BiLSTM model is closer to 1 (the hip joint difference is 6.04%, and the knee joint difference is 5.12%), which means that the model has a stronger ability to interpret the training data and can better reflect the intrinsic relationship between the input sEMG signal and IMU signal and the lower extremity joint angle.
For MAPE, the QRTCN-BiLSTM model reduced it by 0.87% and 0.09%, respectively. Similarly, the QRTCN-BiLSTM results were better.
In terms of interval coverage, the QRTCN-BiLSTM model also performed better.
The QRTCN-BiLSTM model also has a significant advantage when looking at the evaluation metrics of the test set. The lower RMSE and MAE once again show that the model can maintain an excellent prediction accuracy when faced with new, untrained data, and it has good generalization capabilities. The good performance of the R2 value also reflects the model’s ability to effectively capture data characteristics and patterns on the test set. And the stable and reasonable interval coverage further verifies the reliability of the model in different data environments.

4.2. Evaluation of Training Result Curves

The superiority of the QRTCN-BiLSTM model can also be seen by comparing the prediction results of the hip and knee joints in Figure 9a–d, respectively. In Figure 9a,c, the prediction curves of the QRBiLSTM model deviate from the true value curves to a certain extent, especially in the region where the joint angle changes are more drastic, the prediction results are not accurate enough, and the maximum deviation can be up to 5.94%. In Figure 9b,d, the prediction curves of the QRTCN-BiLSTM model fit the real value curves better, and the maximum deviation is only 2.34%. From the prediction results, the prediction curves of the QRTCN-BiLSTM model can more accurately track the trend of the lower limb joint angles.
The QRTCN-BiLSTM model outperforms the QRBiLSTM model in terms of all evaluation metrics and prediction curves owing to its integration of quantile regression, TCN, and BiLSTM features. Quantile regression provides the model with more robust interval prediction capabilities; TCN can effectively extract the features of time series data and expand the receptive field of the input sequence; and BiLSTM can fully explore the contextual associations of data and better handle long sequence data. The synergistic effect of the three makes the QRTCN-BiLSTM model show excellent performance in the lower limb joint angle prediction task.

5. Conclusions

  • A signal acquisition system for physiological muscle signals and inertial measurement unit (IMU) data was designed to collect sEMG data during human walking and IMU data at both hip and knee joints. Theoretical tools such as wavelet noise reduction, filtering, and noise reduction processing can be applied to the above data to improve the quality and reliability of the signals.
  • A neural network prediction model (QRTCN-BiLSTM) was constructed to predict the motion angles of human lower limb joints. This model was analyzed by quantile regression, and it integrates the fast feature extraction property of a temporal convolutional network (TCN) with the efficient temporal analysis performance of a bidirectional long and short-term memory network (BiLSTM). It is expected to present good learning and prediction performance.
  • Combining human leg EMG information detection and the data acquisition process, a comparative experimental analysis of QRTCN-BiLSTM and the original QRBiLSTM model was carried out. Both the accuracy and the evaluation of the training result curves indicated that the QRTCN-BiLSTM model can more accurately infer the human motion intention in the task of the joint angle prediction of the lower limb, which provides a theoretical support for the human–machine interaction of rehabilitation robots.

Author Contributions

Conceptualization, L.W. and F.G.; methodology, Y.W.; software, Y.W.; validation, F.G. and H.Y.; formal analysis, F.Z.; data curation, L.W.; writing—original draft preparation, Y.W.; writing—review and editing, F.G.; project administration, L.W.; funding acquisition, F.Z. All authors have read and agreed to the published version of the manuscript.

Funding

This research was funded by Natural Science Foundation of Hebei Province (E2022402059, H2023402014) and Colleges and Universities in Hebei Province Science and Technology Research Project (QN2023122).

Institutional Review Board Statement

This study was conducted according to the guidelines of the Declaration of Helsinki and approved by the Biomedical Ethics Committee, Medical College, Hebei University of Engineering (BER-YXY-2024001).

Informed Consent Statement

Written informed consent was obtained from all subjects involved in this study.

Data Availability Statement

The data presented in this study are available on request from the corresponding author. The data are not publicly available due to the human subject-derived nature of the dataset.

Acknowledgments

The authors would like to thank Dongliang Wang and Changao Hou for their help in the experimentation.

Conflicts of Interest

The authors declare no conflicts of interest.

References

  1. Gao, Y.; Wang, Y.; Zheng, H.; Wei, Z.; Tan, J. Gait Interaction Design of Lower Limb Rehabilitation Exoskeletons: A Review. J. Mech. Eng. 2023, 59, 175–188. [Google Scholar]
  2. Li, L.-L.; Cao, G.-Z.; Liang, H.-J.; Zhang, Y.-P.; Cui, F. Human lower limb motion intention recognition for exoskeletons: A review. IEEE Sens. J. 2023, 23, 30007–30036. [Google Scholar] [CrossRef]
  3. Yang, J.; He, Y.; Shi, P.; Yu, H. A review on human intent understanding and compliance control strategies for lower limb exoskeletons. Proc. Inst. Mech. Eng. Part I J. Syst. Control Eng. 2022, 236, 1067–1086. [Google Scholar] [CrossRef]
  4. Nanqiang, S.; Gangfeng, L.; Tianjiao, Z.; Wensheng, L.; Xiaoming, M.; Yanhe, Z.; Jie, Z. Research progress and clinical application of lower limb rehabilitation robot. Inf. Control 2021, 50, 43–53. [Google Scholar]
  5. Seo, K.; Lee, J.; Park, Y.J. Autonomous hip exoskeleton saves metabolic cost of walking uphill. In Proceedings of the 2017 International Conference on Rehabilitation Robotics (ICORR), London, UK, 17–20 July 2017; pp. 246–251. [Google Scholar]
  6. Steele, K.M.; Rozumalski, A.; Schwartz, M.H. Muscle synergies and complexity of neuromuscular control during gait in cerebral palsy. Dev. Med. Child Neurol. 2015, 57, 1176–1182. [Google Scholar] [CrossRef]
  7. Emery, A.E. Population frequencies of inherited neuromuscular diseases—A world survey. Neuromuscul. Disord. 1991, 1, 19–29. [Google Scholar] [CrossRef]
  8. Cao, Y.; Chen, X.; Zhang, M.; Huang, J. Adaptive position constrained assist-as-needed control for rehabilitation robots. IEEE Trans. Ind. Electron. 2023, 71, 4059–4068. [Google Scholar] [CrossRef]
  9. Lang, X.; Wang, W.; Su, T.; Hou, Z.; He, G.; Ren, S.; Shi, W. Active Compliant and Adaptive Interaction Control for a Lower Limb Rehabilitation Robot. Robot 2021, 43, 547–556. [Google Scholar] [CrossRef]
  10. Martinez, A.; Lawson, B.; Durrough, C.; Goldfarb, M. A velocity-field-based controller for assisting leg movement during walking with a bilateral hip and knee lower limb exoskeleton. IEEE Trans. Robot. 2018, 35, 307–316. [Google Scholar] [CrossRef]
  11. Lu, H.; Wang, H.; Feng, Y. Human-machine coupling dynamics modeling and active compliance control of lower limb rehabilitation robot. J. Mech. Eng. 2022, 58, 32–43. [Google Scholar]
  12. Kyeong, S.; Feng, J.; Ryu, J.K.; Park, J.J.; Lee, K.H.; Kim, J. Surface electromyography characteristics for motion intention recognition and implementation issues in lower-limb exoskeletons. Int. J. Control Autom. Syst. 2022, 20, 1018–1028. [Google Scholar] [CrossRef]
  13. Qin, P.; Shi, X. A novel method for lower limb joint angle estimation based on sEMG signal. IEEE Trans. Instrum. Meas. 2021, 70, 2511909. [Google Scholar] [CrossRef]
  14. Nazmi, N.; Abdul Rahman, M.A.; Yamamoto, S.-I.; Ahmad, S.A.; Zamzuri, H.; Mazlan, S.A. A review of classification techniques of EMG signals during isotonic and isometric contractions. Sensors 2016, 16, 1304. [Google Scholar] [CrossRef] [PubMed]
  15. Farina, D.; Negro, F. Accessing the neural drive to muscle and translation to neurorehabilitation technologies. IEEE Rev. Biomed. Eng. 2012, 5, 3–14. [Google Scholar] [CrossRef] [PubMed]
  16. Vijayvargiya, A.; Khimraj; Kumar, R.; Dey, N. Voting-based 1D CNN model for human lower limb activity recognition using sEMG signal. Phys. Eng. Sci. Med. 2021, 44, 1297–1309. [Google Scholar] [CrossRef]
  17. Gao, B.; Wei, C.; Ma, H.; Yang, S.; Ma, X.; Zhang, S. Real-Time Evaluation of the Signal Processing of sEMG Used in Limb Exoskeleton Rehabilitation System. Appl. Bionics Biomech. 2018, 2018, 1391032. [Google Scholar] [CrossRef]
  18. Chai, Y.; Liu, K.; Li, C.; Sun, Z.; Jin, L.; Shi, T. A novel method based on long short term memory network and discrete-time zeroing neural algorithm for upper-limb continuous estimation using sEMG signals. Biomed. Signal Process. Control 2021, 67, 102416. [Google Scholar] [CrossRef]
  19. Zhang, F.; Li, P.; Hou, Z.-G.; Lu, Z.; Chen, Y.; Li, Q.; Tan, M. sEMG-based continuous estimation of joint angles of human legs by using BP neural network. Neurocomputing 2012, 78, 139–148. [Google Scholar] [CrossRef]
  20. Song, Q.; Ma, X.; Liu, Y. Continuous online prediction of lower limb joints angles based on sEMG signals by deep learning approach. Comput. Biol. Med. 2023, 163, 107124. [Google Scholar] [CrossRef]
  21. Yi, C.; Jiang, F.; Zhang, S.; Guo, H.; Yang, C.; Ding, Z.; Wei, B.; Lan, X.; Zhou, H. Continuous prediction of lower-limb kinematics from multi-modal biomedical signals. IEEE Trans. Circuits Syst. Video Technol. 2021, 32, 2592–2602. [Google Scholar] [CrossRef]
  22. Zhang, Y.-P.; Cao, G.-Z.; Ling, Z.-Q.; He, B.-B.; Cheng, H.-R.; Li, W.-Z.; Cao, S.-B. A real-time gait phase recognition method based on multi-information fusion. In Proceedings of the 2021 18th International Conference on Ubiquitous Robots (UR), Gangneung, Republic of Korea, 12–14 July 2021; pp. 249–255. [Google Scholar]
  23. Coker, J.; Chen, H.; Schall Jr, M.C.; Gallagher, S.; Zabala, M. EMG and joint angle-based machine learning to predict future joint angles at the knee. Sensors 2021, 21, 3622. [Google Scholar] [CrossRef] [PubMed]
  24. Baby Jephil, P.; Acharaya, P.; Xu, L.; Guo, K.; Yu, H.; Watsford, M.; Rong, S.; Su, S. Estimation of ankle joint torque and angle based on S-EMG signal for assistive rehabilitation robots. In Biomedical Signal Processing: Advances in Theory, Algorithms and Applications; Springer: Singapore, 2020; pp. 31–47. [Google Scholar]
  25. Goh, G.L.; Huang, X.; Toh, W.; Li, Z.; Lee, S.; Yeong, W.Y.; Han, B.S.; Ng, T.Y. Joint angle prediction for a cable-driven gripper with variable joint stiffness through numerical modeling and machine learning. Int. J. AI Mater. Des. 2024, 1, 62–74. [Google Scholar] [CrossRef]
  26. Li, W.; Liu, K.; Sun, Z.; Li, C.; Chai, Y.; Gu, J. A neural network-based model for lower limb continuous estimation against the disturbance of uncertainty. Biomed. Signal Process. Control 2022, 71, 103115. [Google Scholar] [CrossRef]
  27. Zhu, M.; Guan, X.; Li, Z.; He, L.; Wang, Z.; Cai, K. sEMG-based lower limb motion prediction using CNN-LSTM with improved PCA optimization algorithm. J. Bionic Eng. 2023, 20, 612–627. [Google Scholar] [CrossRef]
  28. Astudillo, F.; Charry, J.; Minchala, I.; Wong, S. Lower limbs motion intention detection by using pattern recognition. In Proceedings of the 2018 IEEE Third Ecuador Technical Chapters Meeting (ETCM), Cuenca, Ecuador, 15–19 October 2018; pp. 1–6. [Google Scholar]
  29. Khairuddin, I.M.; Sidek, S.N.; Majeed, A.P.A.; Razman, M.A.M.; Puzi, A.A.; Yusof, H.M. The classification of movement intention through machine learning models: The identification of significant time-domain EMG features. PeerJ Comput. Sci. 2021, 7, e379. [Google Scholar] [CrossRef]
  30. Srivastava, M.; Anderson, C.L.; Freed, J.H. A new wavelet denoising method for selecting decomposition levels and noise thresholds. IEEE Access 2016, 4, 3862–3877. [Google Scholar] [CrossRef]
  31. Messer, S.R.; Agzarian, J.; Abbott, D. Optimal wavelet denoising for phonocardiograms. Microelectron. J. 2001, 32, 931–941. [Google Scholar] [CrossRef]
  32. Van Houdt, G.; Mosquera, C.; Nápoles, G. A review on the long short-term memory model. Artif. Intell. Rev. 2020, 53, 5929–5955. [Google Scholar] [CrossRef]
  33. Su, Y.; Kuo, C.-C.J. On extended long short-term memory and dependent bidirectional recurrent neural network. Neurocomputing 2019, 356, 151–161. [Google Scholar] [CrossRef]
  34. Hochreiter, S. Long Short-Term Memory; Neural Computation MIT-Press: Cambridge, MA, USA, 1997. [Google Scholar]
Figure 1. Experimental scenario. It includes the position of the IMU sensor and the myoelectric electrodes.
Machines 12 00901 g001
Figure 2. Raw signals are captured by the sEMG sensor. The figure includes signals for seven channels.
Machines 12 00901 g002
Figure 3. The raw signal is collected by the IMU sensor. The figure shows the three-axis angular velocity and angular acceleration.
Machines 12 00901 g003
Figure 4. The processed sEMG signal. Shown from top to bottom are the raw signal, the band-pass filter processing, full-wave rectification, and the envelope signal.
Machines 12 00901 g004
Figure 5. The processed IMU signal has the three-axis angular velocity on the left and the three-axis angular acceleration on the right.
Machines 12 00901 g005
Figure 6. Detailed TCN network structure.
Machines 12 00901 g006
Figure 7. The connections of BiLSTM and the internal structure of its cells.
Machines 12 00901 g007
Figure 8. The network structure of QRTCN-BiLSTM.
Machines 12 00901 g008
Figure 9. The training results, where (a,b) are the training results of the hip joint, (c,d) are the training results of the knee joint, (a,c) are the training results of the QRBiLSTM, and (b,d) are the training results of the QRTCN-BiLSTM.
Machines 12 00901 g009
Figure 10. The angle errors of the two estimation models. The left side shows the result for the hip joint, the right side for the knee joint.
Machines 12 00901 g010
Table 1. Basic information of the subjects.
Serial NumberSexesAgeWeight/kgHeight/cm
1male2775175
2male2666175
3male2664170
4male2480185
5male2460172
Table 2. Calculation results for the evaluation metrics of the training and test sets.
JointRMSEMAER2MAPEArea Coverage
QBQTBQBQTBQBQTBQBQTBQBQTB
Training setAnglehip
(rad)
0.0620.0360.0470.0260.9110.9662.04%1.17%95.13%97.68%
Angleknee
(rad)
0.0420.0230.0190.0170.8980.9440.92%0.83%94.27%98.13%
Test setAnglehip
(rad)
0.0790.0460.0590.0330.8580.9472.56%1.46%94.86%95.78%
Angleknee
(rad)
0.0450.0290.0220.0160.8740.9321.08%0.80%92.85%96.86%
Disclaimer/Publisher’s Note: The statements, opinions and data contained in all publications are solely those of the individual author(s) and contributor(s) and not of MDPI and/or the editor(s). MDPI and/or the editor(s) disclaim responsibility for any injury to people or property resulting from any ideas, methods, instructions or products referred to in the content.

