Article

Development of Tools for the Automatic Processing of Advanced Driver Assistance System Test Data

by
Pasquale Licci
1,*,
Nicola Ivan Giannoccaro
1,*,
Davide Palermo
2,
Matteo Dollorenzo
2,
Salvatore Lomartire
2 and
Vincenzo Dodde
2
1
Department of Engineering Innovation, University of Salento, 73100 Lecce, Italy
2
Nardò Technical Center S.r.l., 73048 Nardò, Italy
*
Authors to whom correspondence should be addressed.
Machines 2024, 12(12), 896; https://doi.org/10.3390/machines12120896
Submission received: 31 October 2024 / Revised: 27 November 2024 / Accepted: 4 December 2024 / Published: 6 December 2024
(This article belongs to the Section Automation and Control Systems)

Abstract

:
Advanced driver assistance system (ADAS) technologies are key to improving road safety and promoting innovation in the automotive sector. The approval and analysis of ADAS systems, especially automatic emergency braking (AEB) tests, require complex procedures and in-depth data management. This work presents innovative tools developed to facilitate the post-processing of ADAS AEB test data, created in collaboration with Nardò Technical Center. The tool, called Autonomous Code Generation Intelligence (ACGI), introduces an intuitive and intelligent user interface that helps analyze and interpret ADAS test approval regulations. ACGI automates the generation of code sections within a data analytics framework, streamlining the compliance process and significantly reducing the time and programming skills required. This tool allows engineers to focus on high-value tasks, improving overall process efficiency. To achieve this objective, the tool encodes the DAART code framework (Data Analysis and Automated Report Tool) which allows users to carry out real post-processing of the tests conducted on the track. The results demonstrate that both tools simplify and automate critical steps in the ADAS automatic emergency braking test data analysis process. In fact, the tool not only improves the accuracy and efficiency of the analyses but also offers a high degree of customization, making it a flexible and adaptable tool to meet the specific needs of users. In future developments, ACGI could be extended to cover additional ADAS tests and could be equipped with artificial intelligence to suggest configurations based on new regulations.

1. Introduction

The recent widespread use of vehicles equipped with an advanced driver assistance system, designed to improve both the convenience and safety of drivers [1], has also caused an increase in regulations, often of a local–national nature, to regulate the different types of tests carried out in this field. ADAS technologies are key to improving road safety and driving innovation in the automotive sector, but the approval and analysis of ADAS systems require complex processes and extensive data management (e.g., [2] shows a procedure for the data management of a specific test, the Coast down test performed on a track using a sports car with specific regulations and American and European standards). The need to carry out numerous, systematic, and specific preliminary tests on vehicles equipped with ADAS systems is due to the need to prevent possible legal action in the event of crashes caused by malfunctions of the devices (an overview of the current situation of failure that may occur in automotive components showing their distribution in the vehicle and the causes that make them happen is shown in [3,4], along with an in-depth analysis of the crash reports filed by different manufacturers that are testing autonomous vehicles), along with actual restrictive environmental standards related to emissions (e.g., [5] carries out an investigation of the on-road emissions of NOx, NO2, CO, particle number (PN), and CO2 from vehicles tested under different on-road driving conditions, and [6] analyzes the emissions of hydrocarbon, nitrogen, and carbon monoxide, comparing vehicles running on biodiesel with vehicles running on fossil diesel) that make necessary preliminary extensive car tests before the final production (e.g., [7] analyzes the production vehicle evaluation testing regulation in China), the possibility of analyzing the safety of the vehicle components (e.g., [8] proposes a real-time vehicle safety system tested with several experimental tests), and so on.
Among the various functions of the ADAS, Autonomous Emergency Braking (AEB) is an important function that is most relevant for crash analysis [9]. AEB automatically activates the braking system in an emergency to avoid collisions with other vehicles or with other vehicles or pedestrians or to reduce the potential damage resulting from such collisions. This active safety system begins to control the car’s braking system to generate braking force if it detects that the car is in a dangerous situation in which a collision must be avoided. In relation to the AEB function, it is necessary to carry out numerous preliminary tests on suitable tracks (i.e., the Nardò (Lecce, Italy) track managed by Nardò Technical Center (NTC)—Porsche Engineering). Usually, the post-processing phase for these tests was managed entirely on Excel, manually managing the entire collection of signals generated during the test. This type of workflow was time-consuming and did not implement any checking mechanism to detect errors in relation to the relative regulations. The automation of the entire process would lead to many benefits, including reduced workload, ease of operation, and savings in economic resources, while reducing the likelihood of errors in the post-processing phase. The primary objective of this paper is to enable the automatic and intelligent analysis and post-processing of data from experimental campaigns for AEB tests. By leveraging advanced automation tools, this approach aims to streamline the analysis process, eliminate manual interventions, and ensure more efficient and accurate results. The proposed solution not only enhances operational efficiency but also improves the overall reliability and consistency of the interpretation of the test data. To achieve this goal, this paper presents two innovative tools developed in collaboration with the NTC company to facilitate the post-processing of AEB test data. The first tool, the Data Analysis and Report Tool (DAART), is designed to analyze AEB test data excerpts from the on-track analysis. DAART automatically processes recorded test triggers and produces detailed reports with graphical output. The second tool, Autonomous Code Generation Intelligence (ACGI), presents an intuitive and intelligent user interface that supports the analysis and interpretation of ADAS test certification rules. ACGI automates the generation of code sections within a data analysis framework, streamlining the compliance process and significantly reducing the time and programming skills required. This tool allows engineers to focus on high-value tasks, improving the overall process efficiency. This automated process improves operational efficiency and enables the rapid assessment of ADAS performance in real-world driving conditions. In addition, the ability to generate reports without programming skills makes the tool accessible to many users. The results show that both tools simplify and automate critical steps in the ADAS AEB test data analysis process. The tools not only improve the accuracy and efficiency of analysis but also offer a high degree of customization, making them flexible and adaptable tools to meet the specific needs of users. In future developments, ACGI could be extended to include additional ADAS tests and be equipped with artificial intelligence to suggest configurations based on new regulations.
The following sections are organized as follows: Section 2 provides a general overview of AEB, outlining its key features and the various phases of test execution, which are essential for understanding the data post-processing. This section also includes a classification of the most important tests analyzed, crucial for addressing the regulatory challenges and differences between them. Additionally, the description of the two tools is presented in dedicated subsections. Section 3 focuses solely on the results obtained from the analysis of a specific test, KMVSS CCRm, which is coded using ACGI and analyzed with DAART. Section 4 discusses the findings from this analysis, while Section 5 concludes with the research outcomes and future developments.

2. Materials and Methods
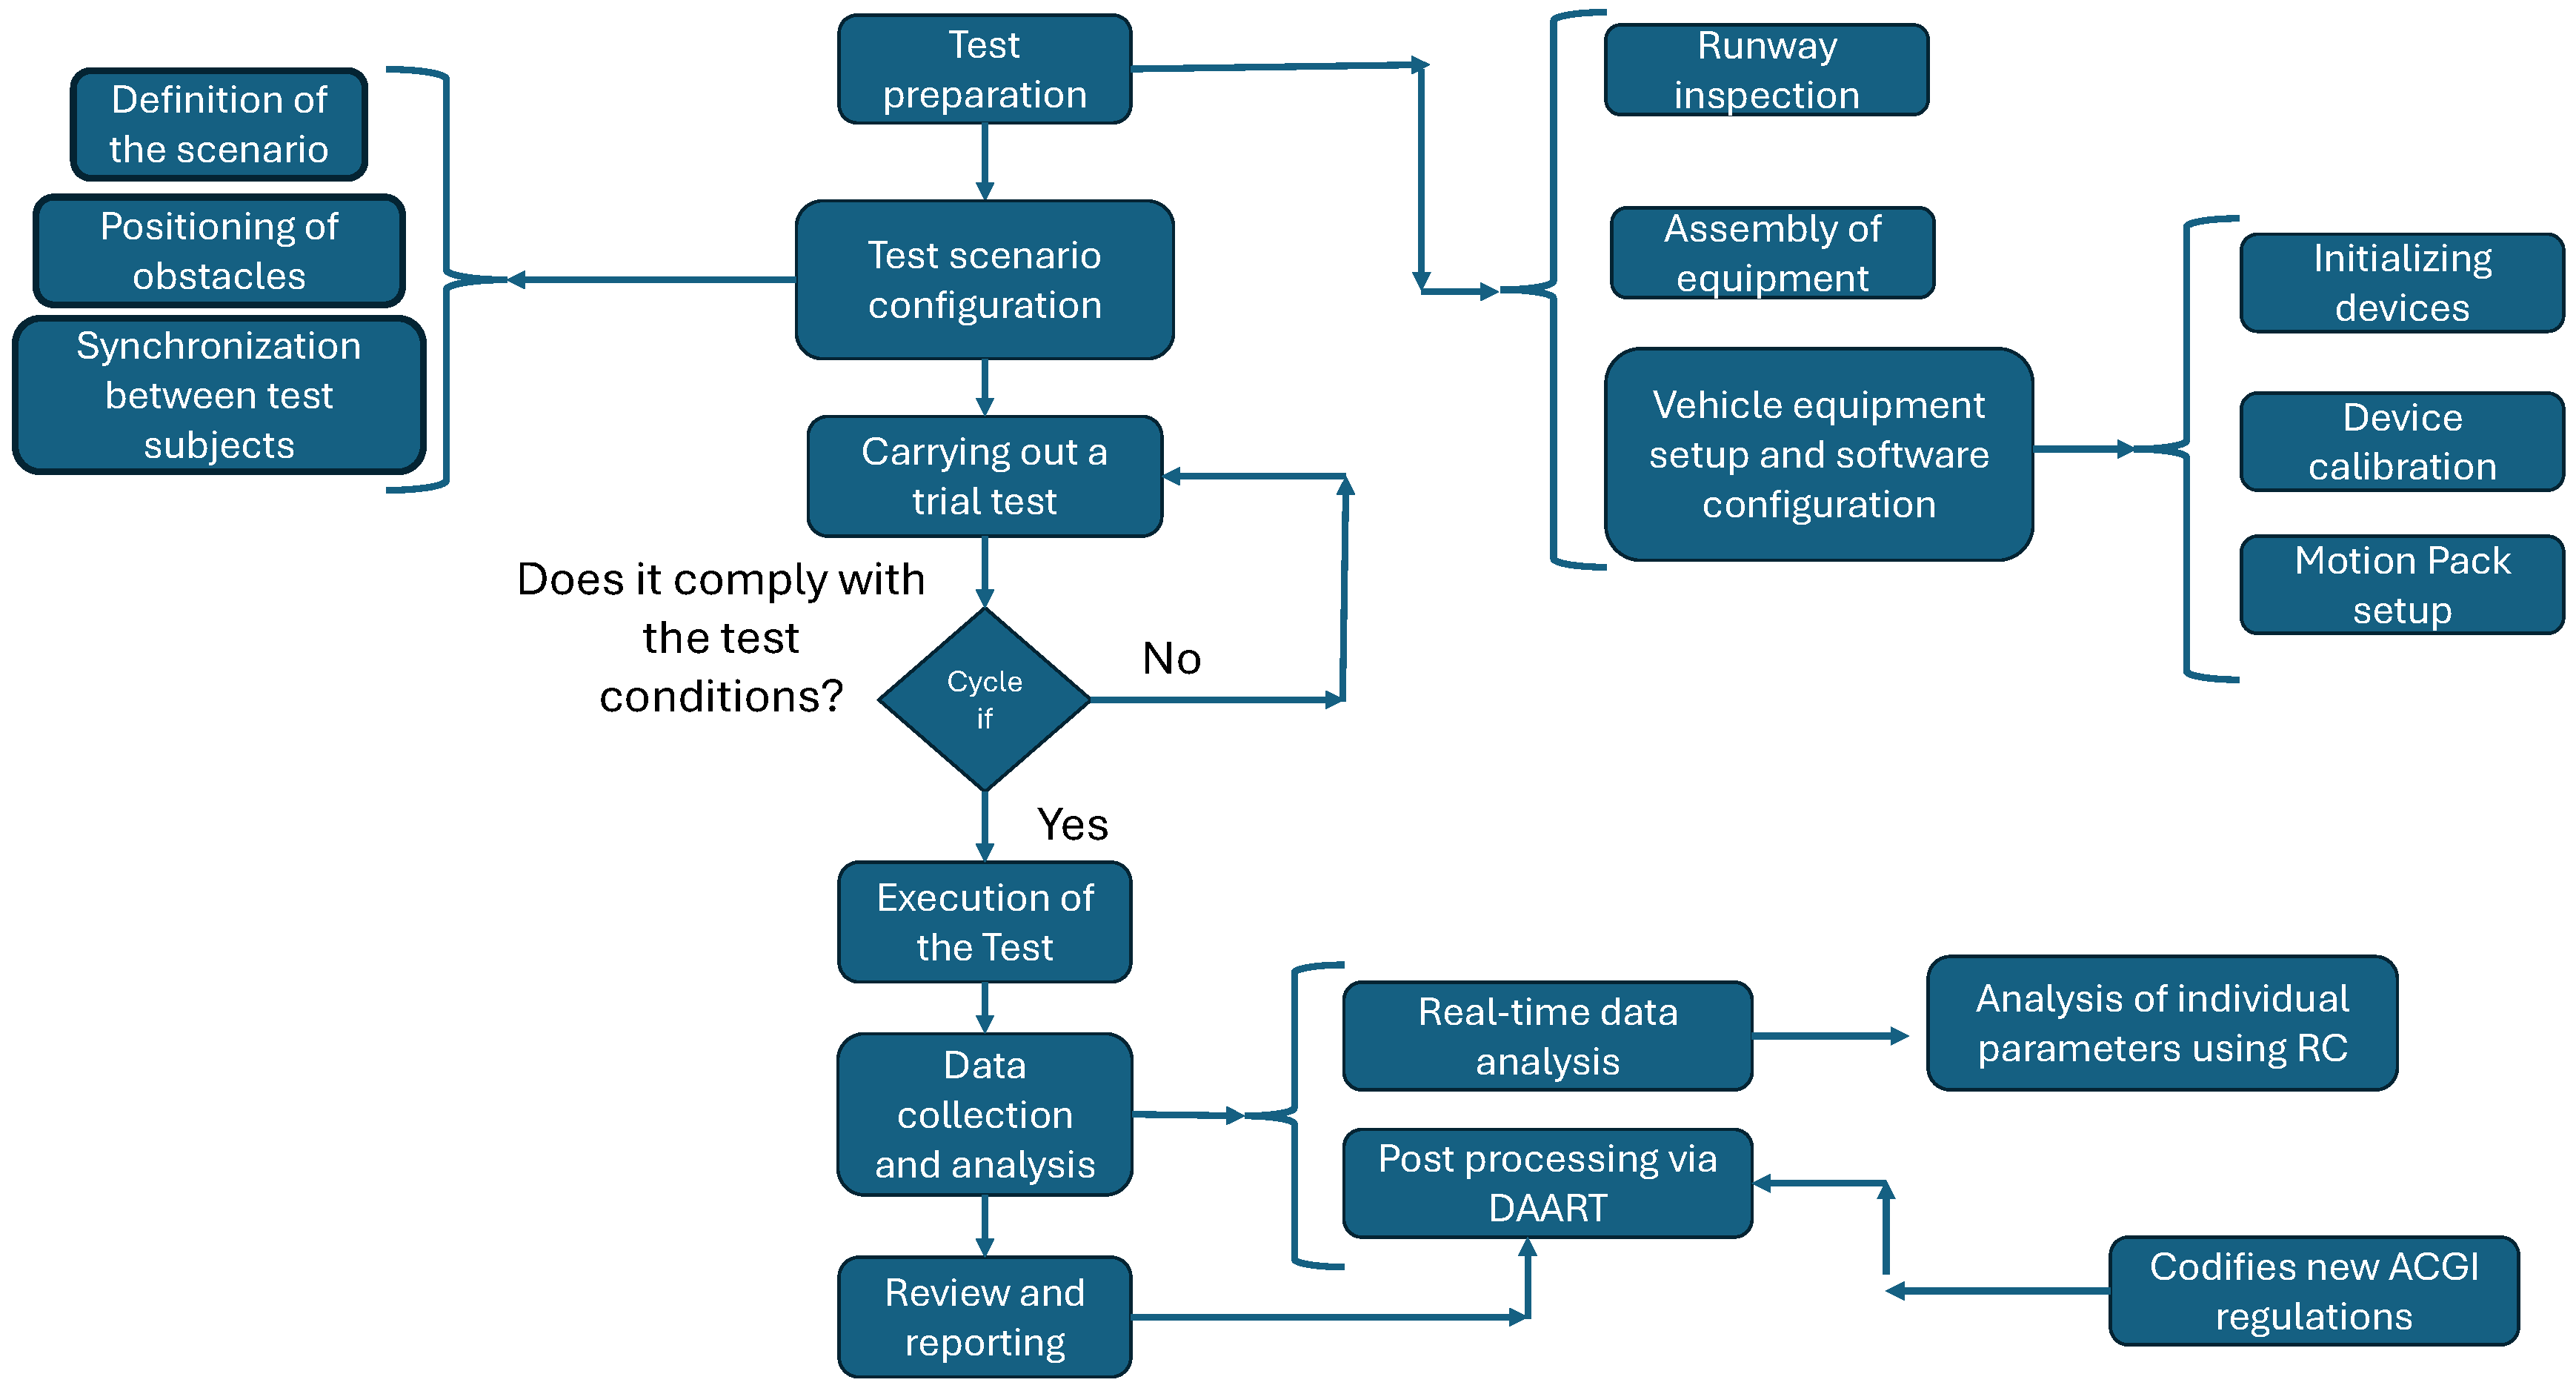
The entire testing and validation process of Advanced Driver Assistance Systems (ADASs) is strictly regulated by homologation standards [10,11,12,13], which ensure both safety and compliance with international norms. These regulations not only define the technical and operational parameters of the tests but also influence every stage of the process, from vehicle preparation to the evaluation of results. Thr proper implementation of these regulations is crucial for obtaining outcomes that are recognized as valid by the relevant authorities and testing organizations. For this reason, every step, from vehicle instrumentation to the generation of final reports, must be carried out in strict adherence to these standards. Specifically, an ADAS testing campaign can be described through four fundamental aspects:
  • Vehicle Instrumentation:
    The initial phase of the data analysis process involves setting up the vehicle with sensors and mechatronic devices to monitor parameters such as speed, acceleration, braking distance, and the responsiveness of the automatic emergency braking (AEB) system. Automating the driving maneuver is crucial to ensure repeatability and reliability of the tests, as human driving cannot achieve this. The setup must comply with specific technical standards for both sensors and data collection methods, as detailed in Section 2.2.
  • Test Scenario Preparation:
    The next step is the preparation of the test scenario, which simulates real-world driving situations. The test track must replicate potential road crash scenarios, such as sudden obstacles or abrupt braking, in strict accordance with applicable regulations. The correct setup of obstacles and simulated vehicles is essential for ensuring the reproducibility and reliability of the collected data.
  • Test Execution and Data Collection:
    The test is then conducted according to the prepared track, simulating emergency situations that activate the AEB system. During the trial, data are recorded in real time, including the approach speed, AEB activation time, vehicle reaction time, and braking distance. Data collection must be precise and synchronized, as errors or inaccuracies could compromise the test interpretation. The raw data are later processed in the post-processing phase, as detailed in Section 2.3.4.
  • Data Analysis using DAART and ACGI Tools:
    After data collection, the post-processing phase is managed by the DAART (Data Analysis and Automated Report Tool) (Figure 1) and ACGI (Automatic Code Generation Intelligence) (Figure 2) tools, two innovative systems introduced and explored in this study. The two tools were developed by the authors using the Matlab R2022b software (sourced by MathWorks Inc., Natick, MA, USA) [14].
    These tools represent a significant breakthrough in the field of automated data analysis, offering cutting-edge solutions to improve efficiency and reliability in AEB testing. The interaction between these two applications provides an advanced solution for the automated analysis of AEB test data. These tools, developed in collaboration with NTC Porsche Engineering, enable the efficient processing of large volumes of raw data, transforming them into useful information by encoding the relevant regulations and test parameters. Thanks to their modular architecture, they allow for the integration of new functionalities and updates, ensuring the necessary flexibility to adapt to regulatory changes.
    One of the main features is the ability to perform in-depth analysis of test parameters and generate detailed final reports in a short time, ensuring efficient and organized data management. This allows engineers to easily monitor AEB system performance, identify potential issues or areas for improvement, and verify compliance with regulatory requirements.
    Specifically, the two tools serve different functions, and through their integration, they ensure a completely immediate, innovative, and automated analysis.
    The development of these two applications forms the core of the present research project and will be thoroughly examined in Section 2.3.4 and Section 2.3.5.
All the phases described above represent the analysis of an AEB test and are graphically summarized in Figure 3. It is important to note that this document focuses on the research work conducted during the final phase, specifically related to data post-processing. However, only through a thorough analysis of the previous individual phases can one fully understand the significant contribution offered by the development of the two proposed applications.

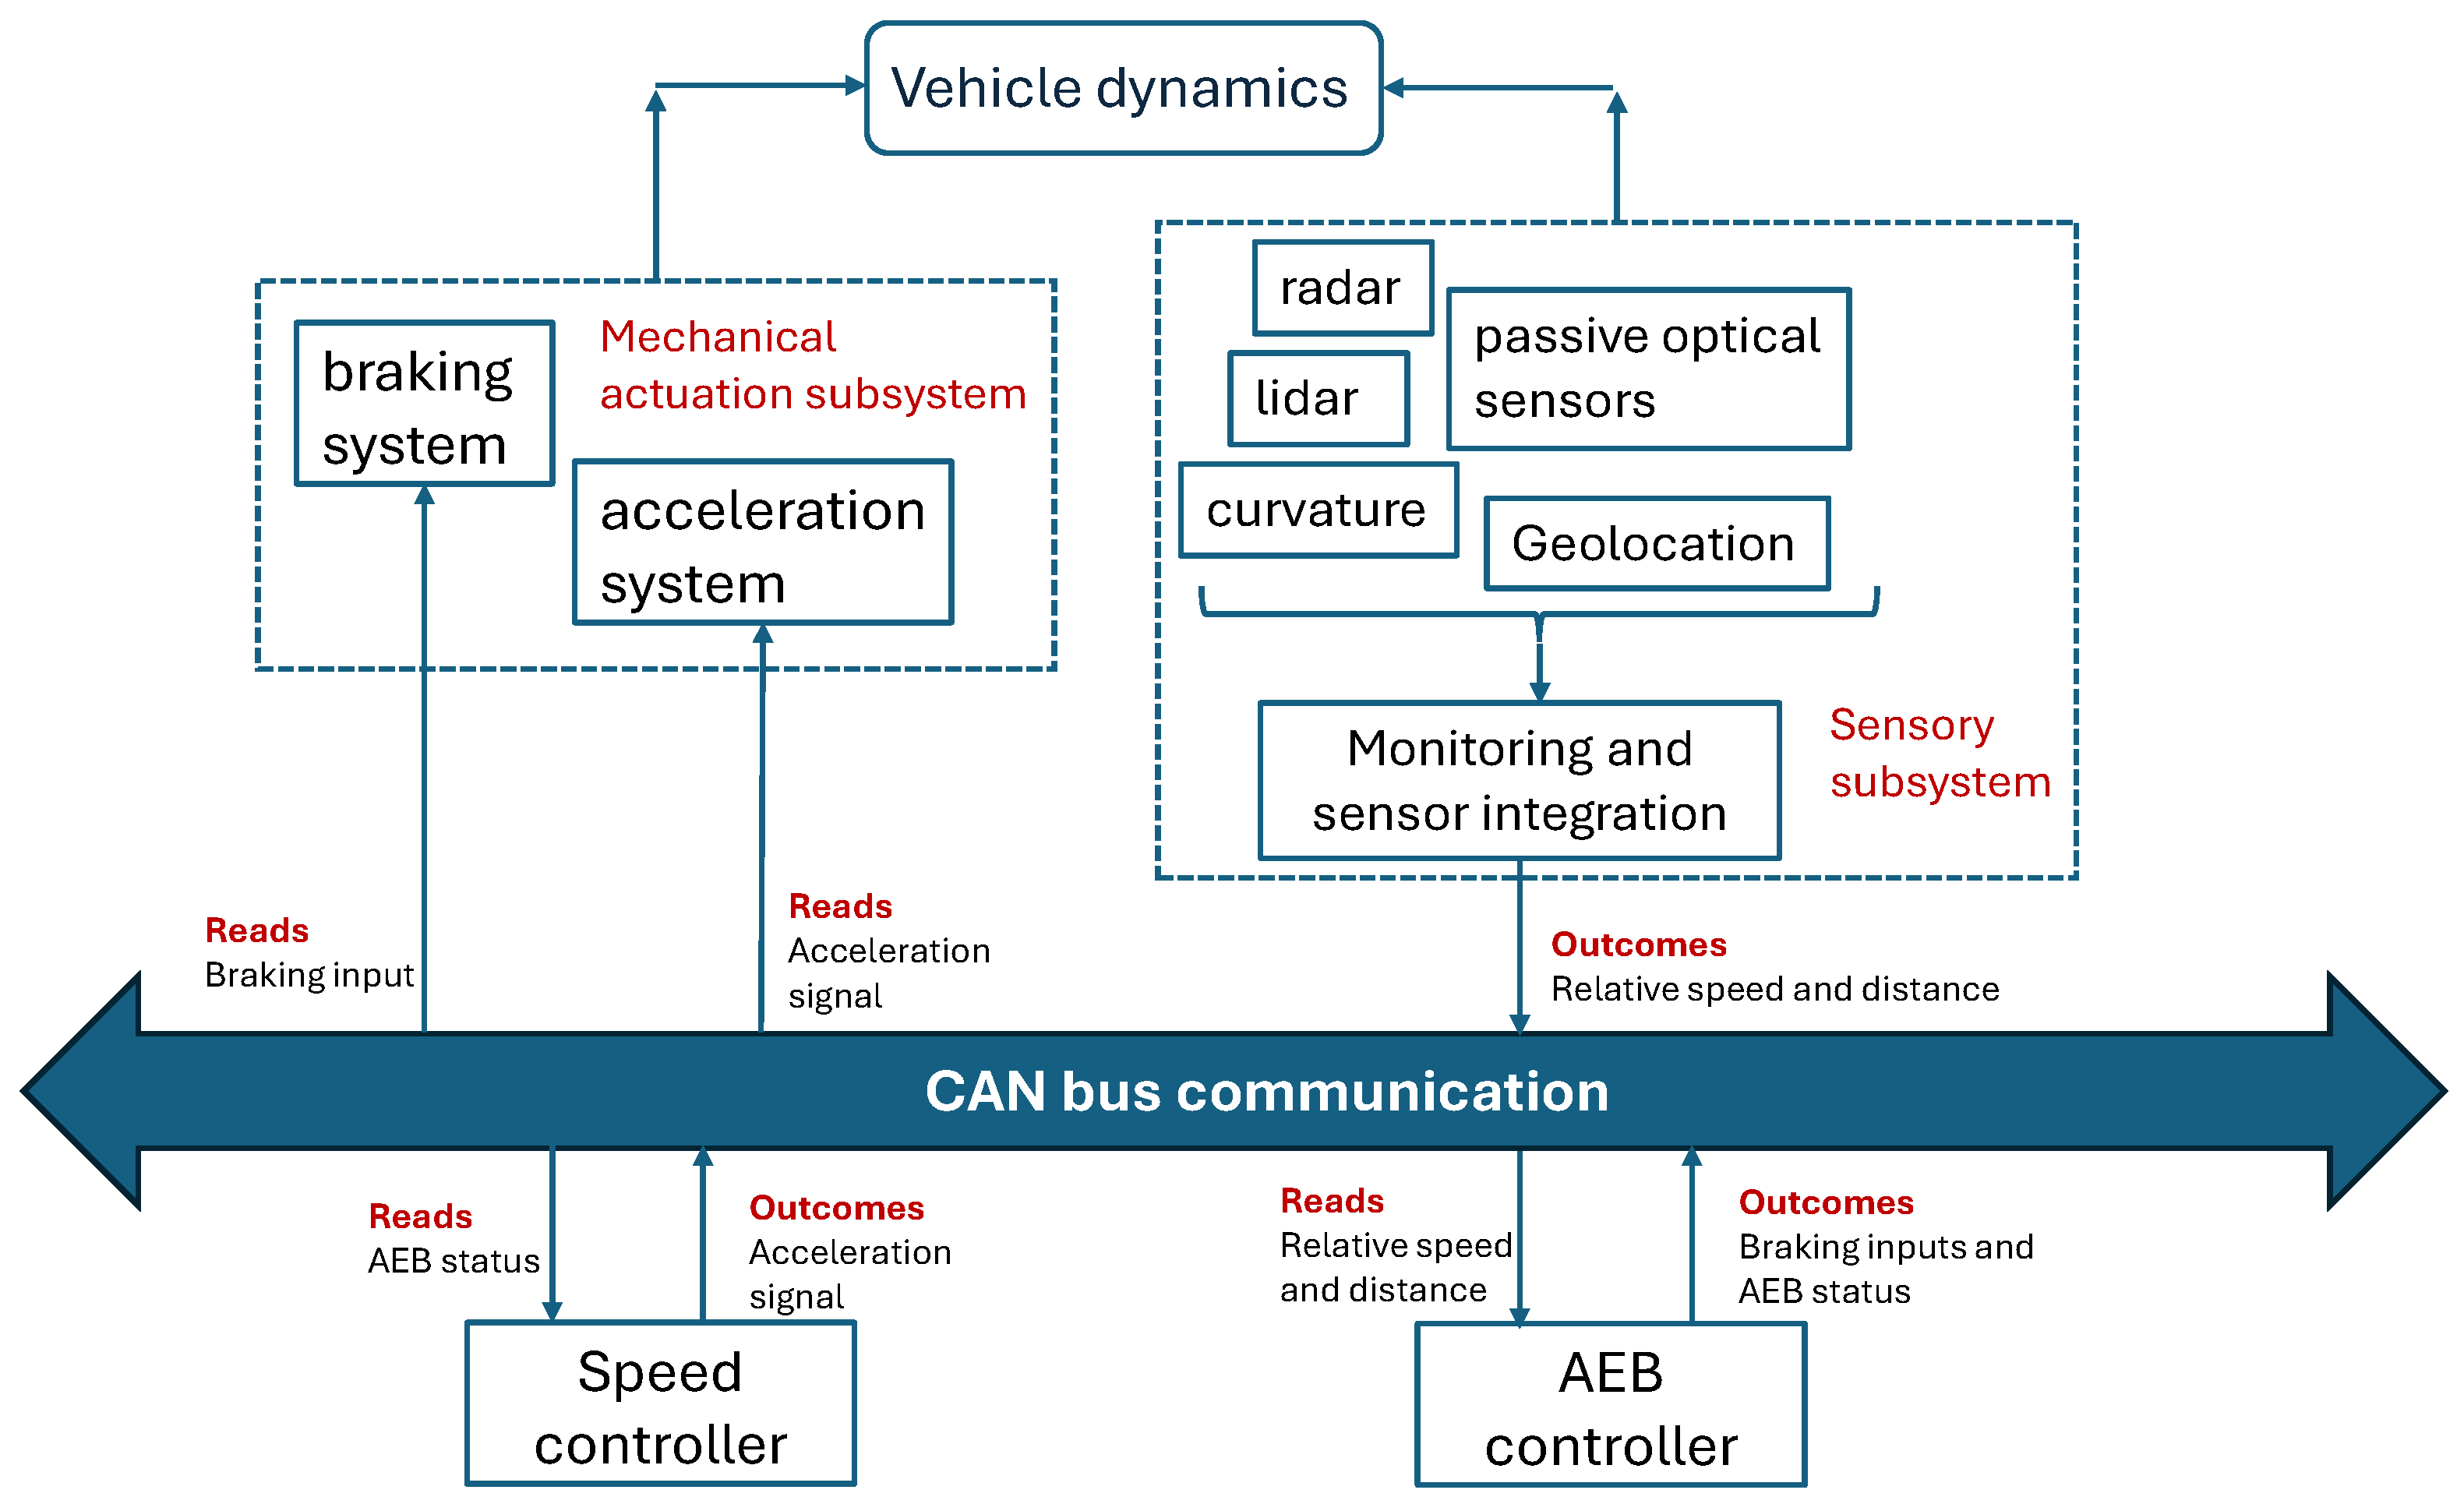
2.1. Autonomous Emergency Braking (AEB) System

To understand the execution of the tests and the subsequent data post-processing, it is essential to provide a complete and detailed description of the analyzed driving safety system. The AEB system is an ADAS designed to eliminate or at least mitigate vehicle collisions. This safety function represents an indispensable legal requirement for vehicular traffic, and as such, various regulations are defined to verify the validity of this safety function.
The architecture of the AEB system primarily consists of three states that define the logical framework of the function [15]:
  • Perception State:
    The vehicle uses sensors (radar, cameras, etc.) to detect the surrounding environment, identify obstacles, and measure their distance. The use of multiple sensor types helps reduce false alarms and improves obstacle detection.
  • Decision-Making State:
    The system processes the sensor data to calculate the Time To Collision (TTC), which measures the time remaining before impact (Equation (1)). This parameter is crucial in determining when the system must intervene. A low TTC value indicates an imminent impact, requiring quick action.
    T T C = ( x s u b j e c t x o b j e c t ) / ( v s u b j e c t v o b j e c t )
    Based on the instantaneous calculation of this parameter, a vehicle management logic is defined; specifically, if the value is low, the impact is imminent, requiring rapid intervention. The formula represents the generic calculation of the AEB function. However, during the execution of the tests, depending on the type of test and the applicable regulations, different versions of the calculation will be used. This requires the introduction of specific codes in the post-processing, which will be automated by the ACGI system through a dedicated page in the GUI (Figure 4). This page will display all the equations required by the current regulations and will also allow the insertion of new equations to fully automate the process.
  • Execution State:
    If a collision risk is confirmed, the AEB system activates the brakes. The braking can be partial or full, depending on the severity of the situation and the deceleration can reach up to −10 m/s².
To understand how the regulations influence and define the execution of the test and its validation, it is important to comprehend the activation sequence of the safety function. Understanding this aspect is crucial, as the regulations stipulate various checks at different time instances of function activation [10,11,12,13]. Specifically, the AEB system follows a sequence known as the “AEB Cascade”, which is divided into three main phases:
  • Forward Collision Warning (FCW):
    This function continuously monitors the area in front of the vehicle and alerts the driver of a potential frontal collision. The alerts can be auditory, visual, or tactile.
  • Moderate Deceleration:
    If the driver does not respond, the system initiates moderate deceleration to further attract the driver’s attention, avoiding immediate emergency braking.
  • Automatic Braking:
    When a collision is imminent and the driver has not responded, the system applies automatic braking in three stages:
    • Partial Braking (AEB-P1): Moderate braking action.
    • Intermediate Braking (AEB-P2): Increased braking force.
    • Full Braking (AEB-FB): Full braking to prevent impact.
Futhermore, after describing the logic of the safety function, it is also essential to provide an overview of the mechatronic processes involved in the logical data communication onboard the vehicle during the activation of the AEB system summarized in the Figure 5.

2.2. Vehicle Equipment for Performing an AEB Test

As detailed in Section 2, the AEB testing process is divided into several phases, with accurate reproduction being crucial for proper validation. The first phase involves equipping the vehicle with the necessary sensors and mechatronic systems for data acquisition and control, ensuring automated driving during the tests. These systems are essential not only for monitoring vehicle parameters but also for ensuring safety and precision throughout the testing process. Below is a brief description of the key sensor components and technologies used in the testing vehicles for advanced driver assistance systems. It is important to understand not only each component individually but also how they work together within the vehicle, as their coordination is vital for executing the driving maneuvers according to regulations and accurately collecting all relevant data [16].
  • Automotive Dynamic Motion Analyzer (ADMA):
    The ADMA is a high-precision inertial system used to monitor the vehicle’s movements in real time, measuring accelerations, velocities, positions, and angles. It employs fiber-optic gyroscopes and accelerometers, supported by a GPS receiver for position updates [17]. It interfaces with the Robot Controller, power supply, GPS antenna, and RTK modem.
  • Global Positioning System (GPS):
    The GPS antenna provides precise positioning by receiving satellite signals. The trilateration technique is used to calculate the vehicle’s location, which is essential for monitoring AEB tests. The GPS system is integrated with the ADMA to synchronize movement data with geographical coordinates.
  • Radio Modem (Real-Time Kinematic (RTK):
    RTK enhances GPS accuracy to centimeter-level precision by using a fixed reference station and GPS receiver on the vehicle, crucial for advanced testing such as autonomous braking and trajectory management.
  • Robot Controller (RC):
    The Robot Controller manages all steering, braking, and acceleration actuators, ensuring repeatable and reproducible maneuvers. It also provides real-time feedback to engineers, enabling the monitoring and adjustment of the vehicle’s behavior during testing.
  • Steering Robot (SR) and Combined Brake and Accelerator Robot (CBAR):
    These mechatronic devices control steering and the combination of braking and acceleration, respectively, ensuring the precise and consistent execution of test maneuvers, particularly for complex traffic scenarios.

2.3. Type of AEB Test to Be Performed According to the Regulations

The complexity of autonomous driving tests varies significantly depending on the test configuration, including the involved subjects and simulated conditions. This section provides a detailed analysis of the different approaches used in AEB ADAS testing, classifying them based on two main criteria: the type of subjects (e.g., vehicles, pedestrians, or bicycles) and whether these subjects are static or dynamic. By examining these configurations, the challenges and considerations for each test scenario become evident. Regulations outline the specific procedures to be followed and the limits for determining the success or failure of each test [10,11,12,13]. While the parameters regulated for the same type of test are generally consistent, the differences lie in the values and tolerances associated with them. Engineers must organize the preparation, execution, and validation of tests not only based on the test type but also according to the relevant regulations. This can make timely analysis challenging. To address this, the DAART and ACGI applications were developed, which will be discussed in Section 2.3.4 and Section 2.3.5. This section aims to provide a comprehensive understanding of the work and challenges involved in executing and validating tests according to different regulations while also laying the theoretical foundation for the development of these tools. The main test execution procedures for AEB systems will be examined, focusing on the different actors and environmental checks. While the document will not explore every difference in test execution in detail, it will highlight key metrics that differentiate the regulations, which are essential for the development of the applications. It should also be noted that this document will focus on describing the most significant tests in the following subsections, as a complete analysis of all those required by the regulations would make the discussion too long and complex. However, it should be emphasized that both developed applications include the analysis and completion of all tests required by the applicable regulations.

2.3.1. Car-to-Car AEB Test

Car-to-Car tests involve two vehicles: the VUT (Vehicle Under Test) and the GVT (Global Vehicle Target). The latter is used instead of a real car as actual vehicles pose safety risks to occupants and may result in significant damage during a collision. Designed to appear realistic to radar, camera, and lidar sensors, the GVT is mounted on a low-profile robotic vehicle (LPRV), which serves as a mobile platform (Figure 6). This setup minimizes safety risks and reduces the costs and downtime associated with vehicle repairs. The LPRV design ensures that the target separates upon impact, preventing damage to both the SV (Subject Vehicle) and the test target during the AEB test [18]. The dynamics of the target vehicle help determine the type of test. In a CCRS (Car-to-Car Static) test, the GVT remains stationary, while in a CCRm (Car-to-Car Moving) test, it moves in coordination with the VUT according to regulatory requirements, as shown in Figure 6. In both cases, the target simulates an obstacle, static in the first scenario and moving in the second, while the subject vehicle travels on a straight path at a speed greater than the target’s. During the test, the AEB system in the SV should detect the target and activate the brakes to prevent or reduce the impact of a collision.
The test for both CCRS and CCRm configurations involves the following key points:
  • Trajectory and Initial Positioning:
    The subject vehicle must travel in a straight line, with the GVT either stationary (CCRS) or moving (CCRm) in the same direction. Regulations define the correct initial positioning and timing, which may vary across standards. Some regulations also require the monitoring of the vehicle deviation from the target axis.
  • Test Start and Execution:
    Upon test initiation, both the SV and GVT must move at constant speeds within regulation-defined tolerances. The SV’s speed must exceed the GVT’s to simulate collision risk, with speed values and tolerances differing between regulations.
  • Test Outcome:
    The test concludes when one of the following occurs: the SV collides with the GVT and stops shortly after impact; the SV avoids the collision by stopping in time before impact; or the SV fails to correctly detect the GVT and collides, requiring manual intervention to stop the vehicle.
Although the test may seem straightforward, differing regulatory requirements introduce significant complexity in both execution and validation. Key parameters such as test start time, speeds, and tolerances vary widely across regulations. For example, the Korean KMVSS regulation provides detailed speed requirements for various vehicle types, including heavy-duty vehicles, and defines asymmetric error tolerances [13]. In contrast, the UNR152 regulation is simpler, specifying only two speed values for all vehicles with the same tolerance limits [11]. The Euro NCAP regulation adds further complexity by combining different speed values with overlap percentages, which represent the portion of the VUT’s width that overlaps with the GVT, relative to the vehicle’s centerline [10]. This not only makes the test more complex but also demands greater precision in the result validation process. The NHTSA regulation, on the other hand, does not specify exact speed values but allows engineers to choose from a range, introducing flexibility in test execution. Additionally, while most regulations set a fixed 4-second start time for the functional phase of the test, the NHTSA standard calculates this based on the headway variable, which factors in the relative distance between the vehicles, their speed, and a fixed T T C 0 of 5 s [12]. For a detailed analysis of these specifications, the reader is encouraged to consult the relevant tables in the KMVSS, UNR152, Euro NCAP, and NHTSA regulations [10,11,12,13].

2.3.2. Car-to-Pedestrian AEB Test

The AEB Pedestrian testing procedure evaluates the effectiveness of safety systems in preventing pedestrian collisions. These tests are more complex than previous ones due to the various factors involved in simulating realistic pedestrian interactions. They are classified based on several criteria:
  • State of the Pedestrian: The pedestrian may be static (stationary) or dynamic (moving across the road), with speed and initial position specified.
  • Crossing Side: The pedestrian may cross from the near side or far side or move along the vehicle’s axis.
  • Age of the Pedestrian: Tests use dummies representing adults (A) or children (C).
  • Percentage of Vehicle Width Impacted: Tests assess impacts at 25%, 50%, or 75% of the vehicle’s width. The Euro NCAP standard defines the reference points for impact speed based on a virtual box around the pedestrian target (EPT) and a corresponding reference line across the front of the vehicle (Figure 7).
The test is divided into phases: the pre-functional phase, where the vehicle moves in a straight line and the pedestrian is static in the designated position; the functional phase, where the vehicle moves at a constant speed, maintaining a specific distance from the pedestrian; the continuous movement phase, where both must maintain constant speeds and synchronize; and finally, the conclusion of the test, which occurs when the same conditions defined for the end of the Car-to-Car test are met. Due to the numerous combinations of parameters, regulatory differences are more pronounced in this type of test. These variations make the execution and validation process more complex. The tools developed in this study aim to automate the validation of these tests, allowing engineers to focus on performing the tests rather than managing the validation logic. In this way, the engineer only needs to focus on executing the test.
For detailed specifications and test setups, readers are referred to the relevant tables in the specific regulations [10,11,12,13].

2.3.3. Car-to-Cyclist AEB Test

In the context of AEB tests, particular attention is given to interactions between vehicles and cyclists, as crashes involving bicycles pose significant risks. These tests, required by regulations like Euro NCAP and KMVSS, assess the ability of AEB systems to prevent or mitigate collisions with cyclists. The cyclist is represented by a system consisting of a frame with a mannequin, designed to simulate realistic scenarios. The frame includes rotating wheels and an adjustable torso to represent different cycling positions. The system can be struck at speeds of up to 60 km/h (37.7 mph) in crossing scenarios and 45 km/h (27.96 mph) in longitudinal scenarios [18]. The test procedure includes several phases: initially, both the vehicle and the mannequin with the bicycle are positioned in designated starting locations, with the mannequin static and the vehicle moving along a straight path. The functional phase begins when the TTC between the vehicle and bicycle reaches a predetermined value. During the test, both the vehicle and the bicycle move in synchronized perpendicular directions, simulating an urban crossing, with speeds defined by the regulations. The test concludes when either a collision occurs or the vehicle’s AEB system successfully avoids the impact. While the basic procedure is consistent across tests, specific parameters, such as speed and tolerance ranges, vary depending on the regulations.

2.3.4. Post Processing of AEB Tests (DAART)

The DAART (Data Analysis and Report Tool), developed in collaboration with the Nardò Technical Center, is an advanced tool dedicated to analyzing data from AEB tests. This article presents an update and enhancement of the application previously discussed in its preliminary version in [16]. Once raw data are collected from the instrumented vehicle, DAART automates the entire data processing workflow, significantly reducing the risk of errors and improving overall operational efficiency. Its ability to generate detailed and customized reports in compliance with selected regulations is essential to ensure the validity and accuracy of test results. Before the introduction of this tool, data analysis was conducted separately for each test using RC software immediately after each trial. At the end of each individual test, the data were recorded and analyzed by an onboard computer, operated by the track engineer. The engineer had to manually review each graph corresponding to the validation parameters, selecting it from the software’s graphical interface. This process was inefficient, requiring long analysis times and fragmenting the experimental campaign, which increased the risk of errors during test execution. With DAART, however, users can manage data processing and report generation at the end of the experimental campaign, significantly reducing analysis times. Specifically, raw test data are initially saved by the RC system and then processed through a graphical interface developed in MATLAB [14] (Figure 8).
This interface automatically processes the collected data by leveraging a series of interconnected MATLAB scripts that evaluate each parameter required by the applicable regulations. The approach not only speeds up the validation process but also optimizes resource usage and ensures greater consistency in the analysis of results. While this application provides many advantages to engineers, it has also highlighted the need for a highly skilled programming team. Each time a new regulation needs to be analyzed, every piece of code used in the analysis must be updated accordingly. To address this requirement, the ACGI tool has been developed, which will be described in Section 2.3.5. The overall structure of the tool comprises various code groups, each with specific functions (Figure 9).
These groups interact with each other during code execution following a logical sequence, facilitating the final analysis. The main groups are summarized as follows:
  • Common File Group:
    This group contains 22 MATLAB function files referenced by the regulatory codes. These files are used for analyzing any regulation, as they form the foundational structure for analysis. They contain control parameters, formulas, calculations, and checks necessary to establish the validity of the test.
  • Utility File Group:
    This group consists of 33 functions called within the main interface and primary file group. These functions support the extraction of final results or define crucial steps in calculations through utility functions.
  • Regulation File Group:
    The Regulation File Group includes distinctive codes for various regulations, each of which calls the codes present in the Common File Group to perform a detailed analysis following each individual step. The application includes the encoding of a regulation file for the UNR152, EURO NCAP, KMVSS, NHTSA, GBT, and IIHS standards. Each standard is integrated into the application, including updates and specific versions of each current regulation. The functions contained in this group are, in turn, called by a specific code within the Main File Group, which provides all the necessary information for data analysis.
  • Plot File Group:
    This group contains functions dedicated to defining the layout of the final PDF report. The number of associated plot files depends on the number of encoded standards. Each regulation typically has a separate plot file that includes the characteristic data required by the protocol.
  • Main File Group:
    The Main File Group is responsible for the final processing of results and managing the entire post-processing procedure by invoking each regulatory function and plot. It includes a total of 30 function files, generally activated from the main interface.
Once coded, these functions are not launched individually by the operator. Instead, following a cascading scheme (Figure 9), they are all called from the main interface, which is the only tool the operator interacts with. This approach ensures ease, speed, and order in the execution of data post-processing. However, an error in one function that does not connect properly with others can halt code execution, which can be challenging for a novice user. This problem prompted the development of the ACGI tool. Before delving into the details of the individual codes, the use of the interface for analyzing a single test will now be described, assuming that all the previously discussed code has been properly implemented. Once launched, the MATLAB interface appears, as shown in Figure 8, with a drop-down menu on the left that allows users to navigate through various analyses via the corresponding tabs. Additionally, at the bottom of the interface, buttons are provided to access other useful tools for result analysis. To perform data analysis and post-processing, the following inputs must be provided to the graphical interface:
  • The run file extracted from the robot controller, containing all the data from the executed test;
  • The final directory for saving the analysis results and the final report.
Once these two files are input, the graphical interface will display
  • A display showing the ID of the executed test;
  • A display showing the name of the test, which allows the identification of the relevant standard and scenario used;
  • A display listing the vehicles for analysis present in the database, with their respective geometric measurements. A button is also available to add a new vehicle with all its associated geometric information.
After selecting and verifying all test settings, the entire validation process is executed automatically with a single button, triggering each individual function of the code as per the relevant test standards. Upon completion, an auxiliary graphical interface provides a summary of the test displaying the main test data, as shown in Figure 10.
The auxiliary graphical interface allows the user to view this information concisely, either closing the summary view to proceed with the analysis of another test or delving deeper into the signal data and test conditions by opening the generated PDF report. Additionally, a graphical report summarizing all significant parameters, coded according to the relevant standards, will be generated in the associated plot file. It is important to note that before reaching this final analysis stage, an experienced programmer must develop all necessary code for actual data analysis. Almost all scripts belonging to the various previously described code groups must be individually coded to integrate new regulations into the existing analysis system. To better understand the analysis process and the complexity involved in coding the DAART system, it is necessary to examine the “constParam.m” code whenever a new regulation is introduced.
This function defines all control parameters related to the regulation and test execution. It is called within each file related to the regulation and takes as input the test code name (provided through the execution file assigned by the graphical interface), returning a set of control data organized into a structure called “Data”. Specifically, the code performs the following operations:
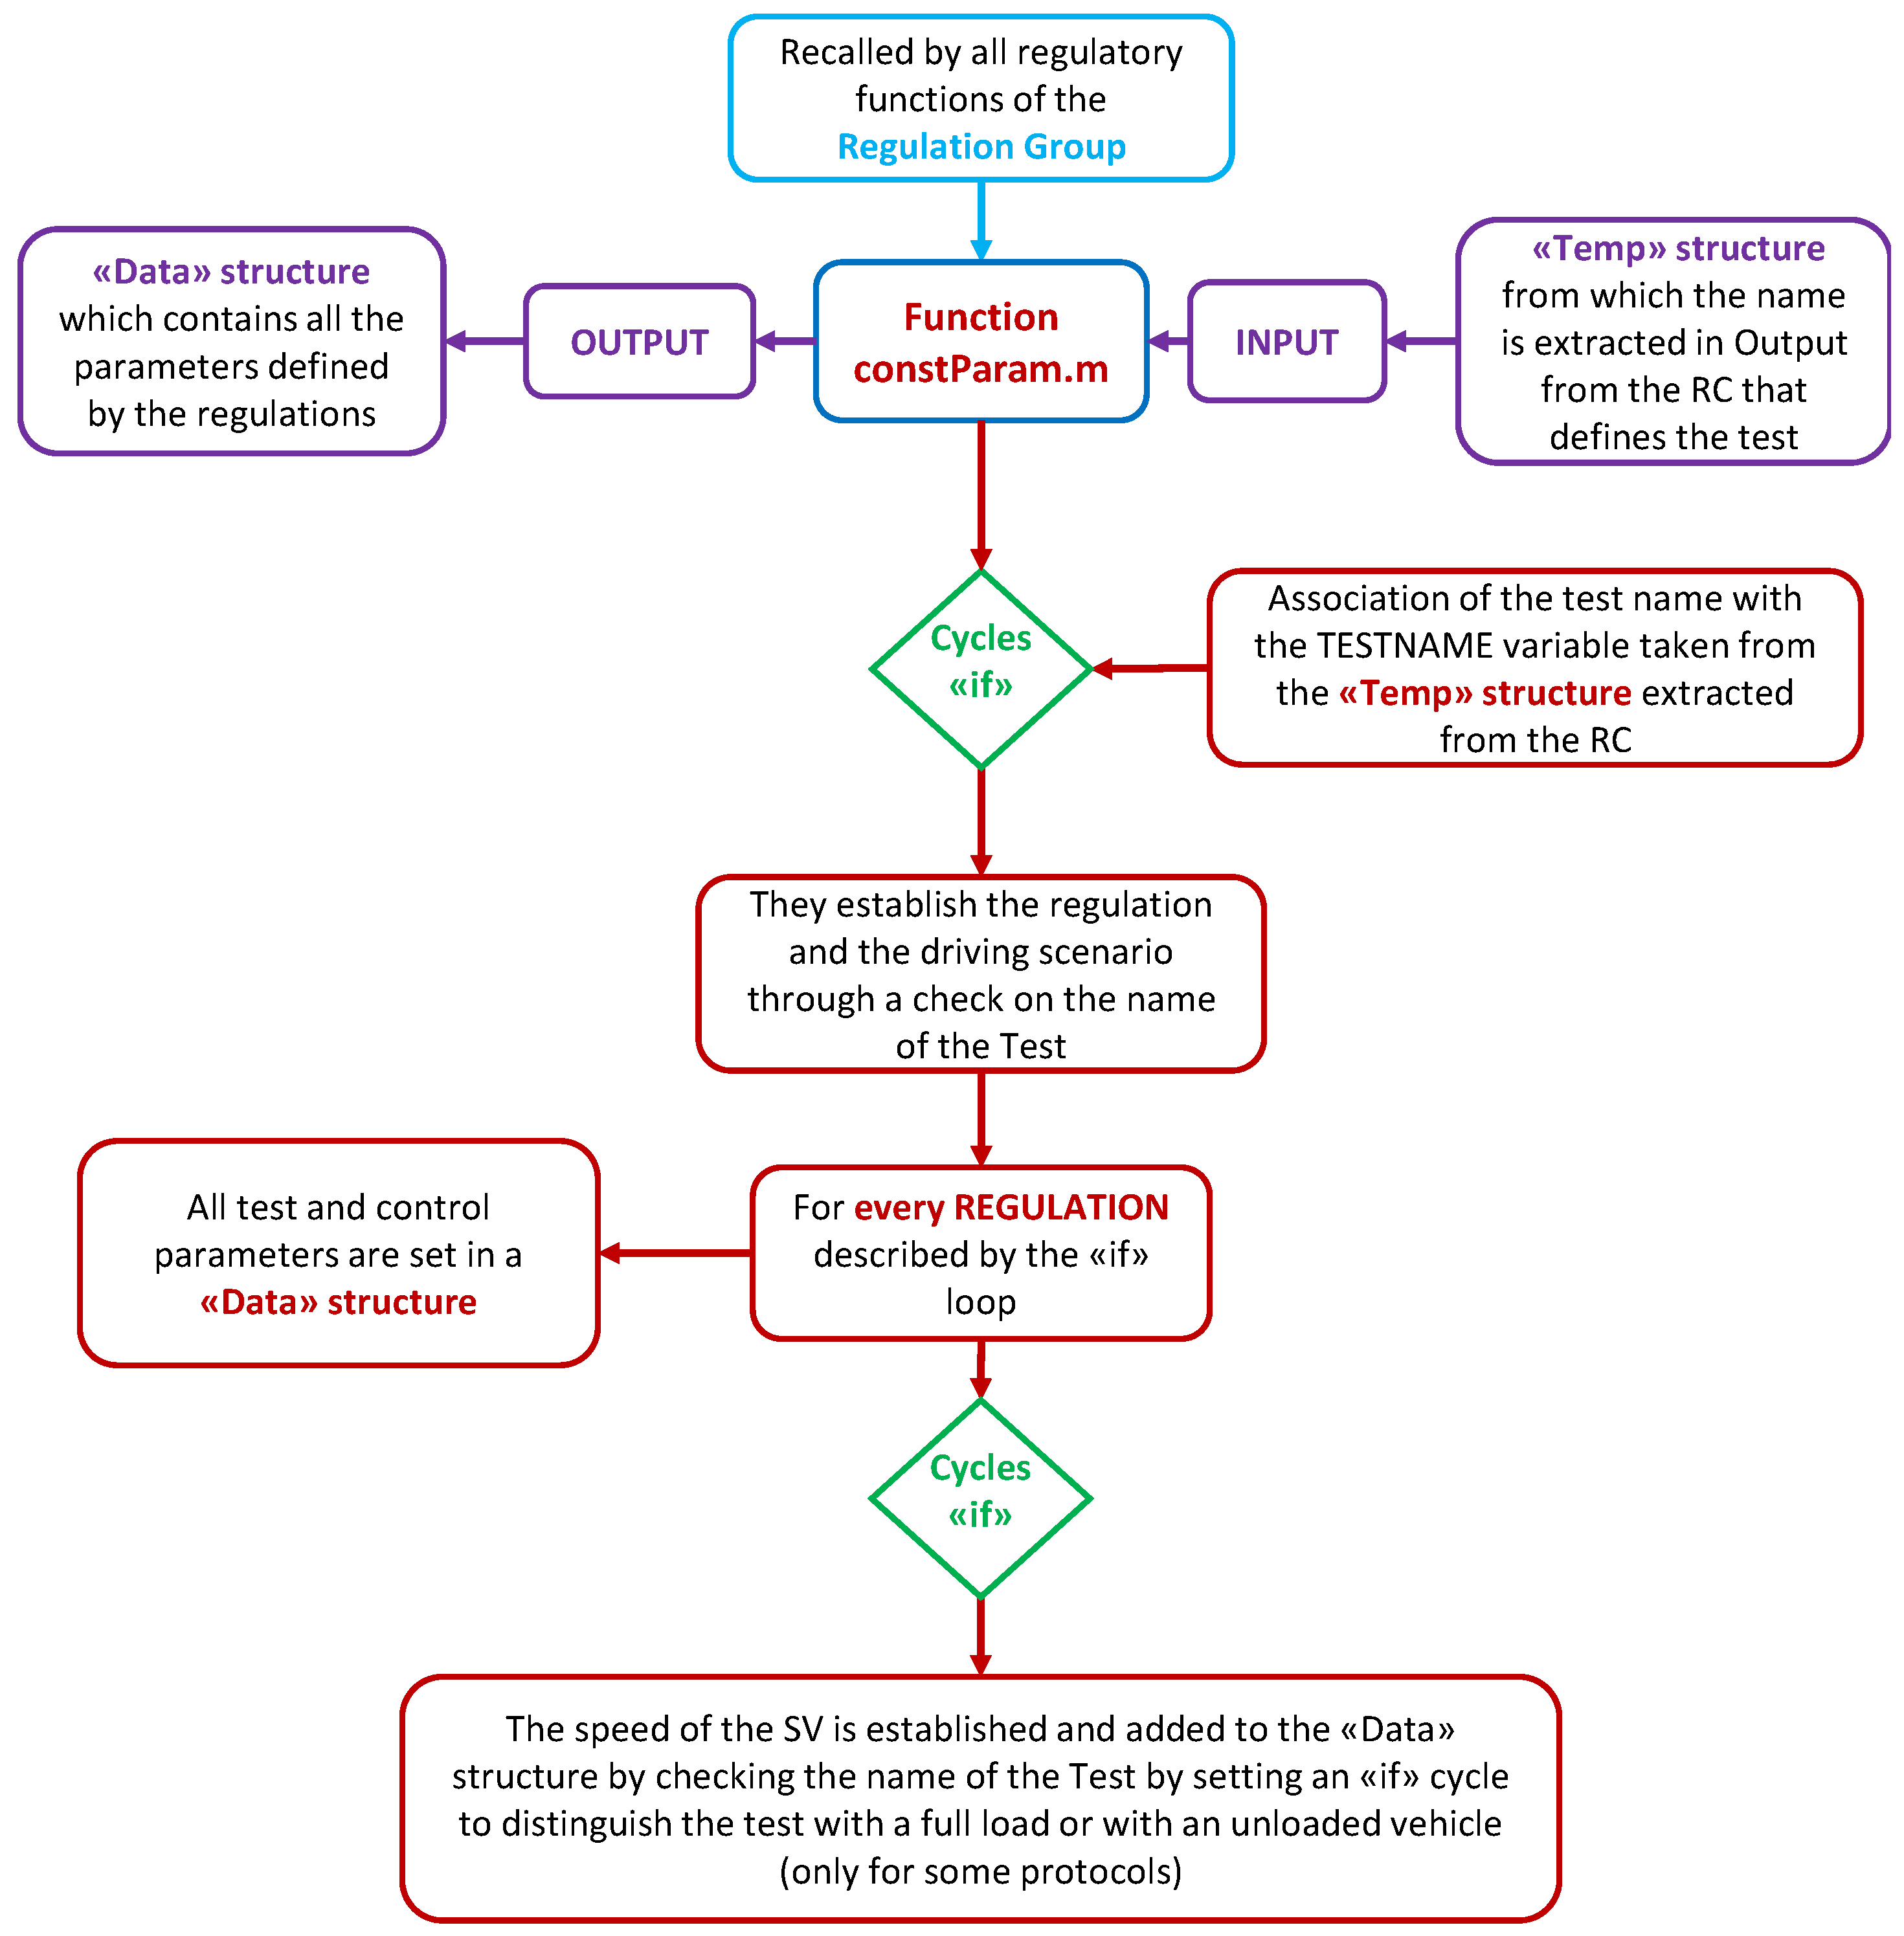
  • Sets a variable to which the test name and driving scenario are assigned;
  • Defines a series of conditional instructions to identify the various regulations and executed tests. The code uses these loops to determine the type of regulation by analyzing the test code and searching for specific keywords in the protocol name;
  • For each conditional loop, the code extracts the subject vehicle (SV) speed from the test name using a basic MATLAB function;
  • Within each regulatory loop, it establishes all fundamental properties by providing a list of relevant test parameters, each associated with the value specified by the regulation.
For clarity, a logical diagram of the code is provided in Figure 11. In the logical diagram, different colors represent the types of various files; blue represents the analyzed code, light blue represents the group of functions that called the analyzed function, violet indicates the input and output parameters imported and extracted, red represents the various steps defined, and green blocks indicate the conditional instructions. It is important to note that during code execution, regulations with equivalent parameters (e.g., UNR 152 CCRs and KMVSS CCRs) will not be handled through separate code blocks but will be included in a single block. This approach ensures a more streamlined and efficient code. This feature is essential for the development of the compilation code described in subsequent sections. In the code, only the constant parameters that define regulatory verifications are specified, while other modules are responsible for the specific calculations related to regulatory checks or environmental control parameters. Correctly coding all these modules is a complex and delicate task for every engineer, requiring not only a deep understanding of the specific regulation but also familiarity with all the regulations already implemented in the code. Over time, this process has led to a high level of dissatisfaction due to the complexity of the coding procedure and the significant time loss associated with it. To address these issues, the ACGI application has been developed, allowing any user, even without prior experience in coding or regulatory knowledge, to perform automatic code compilation in a quick, efficient, and innovative manner.

2.3.5. Automatic and Intelligent Compilation of Codes (ACGI)

To facilitate the integration of regulations within the DAART system and make the tool even more adaptable to frequent regulatory updates, the ACGI (Automatic Code Generation Intelligence) has been developed. This tool enables both traditional and simplified compilation of DAART through an intelligent code editing management system. By automating the interaction between various regulatory codes, ACGI allows the integration of new regulations without overburdening the existing code, thus optimizing the system’s efficiency.
This approach prevents the creation of redundancies or fragmentation, ensuring that the entire update process is fast, efficient, and error-free. A key advantage of ACGI is that the user does not need advanced programming skills. Thanks to its intuitive graphical interface, it completely bypasses the need for manual code writing, reducing implementation time and simplifying the entire process. In practice, ACGI allows engineers and technicians to integrate new regulations into DAART in just a few steps, making the platform accessible even to those without specific coding knowledge.
The Tool was developed following the logical model used in the DAART code, which is based on a main graphical interface that calls various functions depending on the selected commands. This approach ensures flexibility and speed in implementing changes. The Tool’s code is organized into four main components:
  • Main File Group:
    A group of 15 primary functions called by the graphical interface to introduce new regulations or test scenarios.
  • Utility File Group:
    A group comprising 22 utility functions that enhance efficiency by reducing code redundancy.
  • Main Graphical Interface:
    The component with which users interact to introduce new regulations, guiding them through the necessary steps without requiring programming skills.
  • Auxiliary Graphical Interfaces:
    A set of 9 interfaces that support specific functions without overwhelming the main graphical display, also offering customizations for reports.
This modular structure enhances the Tool’s efficiency and adaptability to regulatory changes, ensuring the effective management of both regulations and tests. To demonstrate the overall functionality of ACGI, a case study on the integration of the Korean KMVSS CCRm regulation into the DAART code will be presented in the following sections.
As highlighted, the interface features various selection tabs, organized in a drop-down menu located at the top. These tabs sequentially open a series of pages that guide the user through the essential steps for coding the scripts needed to introduce or update a new regulation. In the initial screen, shown in Figure 12, the interface prompts the user to input the following information:
  • Specifications related to the regulation to be coded. To facilitate input, the interface offers several TextBoxes where the user can enter the name of the regulation, the speed associated with the subject vehicle, the vehicle load conditions (distinguishing between tests conducted with a fully loaded or unloaded vehicle), and the type of test (differentiated according to the actors involved, as described in the previous sections).
  • The directory containing all the functions from the Common File of the DAART code, which need to be modified to implement the new regulation.
The interface also includes support tools to ensure that the regulation compilation is complete, including
  • A light indicator (LED) located at the bottom right of the interface. This LED is red if the compilation is incomplete and gradually changes color to green when all fields have been filled out and the code has been correctly compiled.
  • A text box, situated next to the LED, that provides detailed information about the status of the compilation.
  • A button marked with a question mark, which leads to an auxiliary interface. This interface asks the user whether they would like guidance that explains the interface in Italian or English. Once the language is selected, a PowerPoint presentation will automatically open, explaining step by step how to complete the interface.
These additional elements assist the user, especially those using the tool for the first time, by guiding them through every phase of the process. Once all fields are completed, the code allows the definition of the variable “TESTNAME”, which represents the name of the test to be associated with the RC software for regulatory analysis via the central arrow. Once this tab is filled out with the specifics of the case study in question, the interface will save the name of the test considered and use it as a reference for the compilation of all subsequent codes. One of the reference codes that must be compiled to ensure the validation of the test is the “constantParam.m” code described in Section 2.3.4. The compilation of this code is managed through the second tab of the graphical interface, labeled “Set Parameters” (Figure 13).
The interface has been designed to automate the compilation process as much as possible, guiding the user through each step. The main objective is to allow the user to autonomously compile the DAART code without direct intervention, with the process being managed by the ACGI code. The user interacts with the interface following these steps:
  • Select the relevant parameters from the pre-set CheckBoxes corresponding to the regulation being coded, and input their values into the associated TextBoxes.
  • Next, two conditions may arise:
    2.1
    All required variables are available: If all parameters are pre-configured, the user can simply click the “compile” button to generate the code.
    2.2
    Some parameters are missing: If the regulation requires additional variables not present in the CheckBoxes, the user can add them via the “automatic insertion” feature at the bottom left of the interface. The process is intuitive, even for users without prior Matlab experience, and follows these steps:
    2.2.1
    Write the names of the new variables, which must be filled in a column, in the TextBox of the display;
    2.2.2
    Select the SET button, which allows all the newly introduced variables to appear on the right side of the interface;
    2.2.3
    Select the new variables, and for each, input their associated values in the provided TextBoxes.
    2.2.4
    Once all variables are selected and values entered, the user can proceed to compile the code.
In the case of the KMVSS CCRm regulation, all the required parameters are already available in the CheckBoxes. The system recognizes that this regulation is distinct from others and, after compilation, updates the status with an appropriate message (Figure 13). Once the user selects and enters all required parameters, the compilation process for the “constParam.m” function proceeds. Clicking the compile button triggers the “modifyconstParam.m” function, which receives the parameters and their values from the interface. The function performs a cross-check between the selected parameters and those defined in the existing regulations. This check includes verifying both the presence of parameters and their corresponding values. It ensures accuracy by reading the “constParam.m” file line-by-line and cross-referencing the parameters with a database of already coded regulations. During the compilation of a new regulation, the function follows a cascading process to compare the new parameters and values with those in the database. Based on this comparison, the function can
  • Add new code sections if the regulation introduces parameters not present in any previous regulation. The new sections are integrated at appropriate positions in the code using utility functions.
  • Associate the new regulation with an existing one if a match is found between the new parameters and those already coded.
This entire process is automated, making the compilation both intelligent and autonomous, without requiring the user to interact with the code directly. As a result, the system not only compiles the code instantly but also automatically updates the DAART base function to accommodate new regulations.
This coding logic will be applied to all subsequent tabs that will interact with different codes within the DAART framework in order to ensure complete compliance with the new regulations. Specifically, the following tabs will be available:
  • Parameter Extraction Tab: This tab will allow for the extraction of parameters to be verified.
  • Parameter Selection Tab: In this tab, it will be possible to select the parameters extracted and coded in the previous tab on which a filtering action is desired. It will also be possible to define the parameters associated with the selected digital filter, such as the cut-off frequency and the number of poles of the filter.
  • Equation Definition Tab: This tab will allow for the definition of the equation useful for calculating the TTC. In Section 2.1, the general formula of the TTC was defined, but each regulation provides a specific one that can be selected from the GUI, if equal to one already codified, or codified from scratch via an auxiliary interface (Figure 4).
  • Temporal Values Selection Tab: Users will be able to choose the values of the parameters necessary to define the start time of the test, the activation time of the FCW (Forward Collision Warning) function, and the activation time of the safety function.
  • Regulatory Technical Verifications Tab: This tab will allow for the selection of the technical regulatory verifications to be performed and to associate the relevant limits with each of them.
  • Weather Verifications Tab: Users will be able to define the weather verifications imposed by the reference regulations and specify the associated value for each.
  • Final Report Modeling Tab: Finally, this tab will allow for the generation of a final graphic report that summarizes the results. It will be possible not only to generate the report including all necessary graphs for analysis but also to model each of them individually by calling auxiliary development interfaces. This allows for the completion of the coding process, enabling a thorough customization of the final report.
For clarity and to avoid overwhelming the discussion, detailed descriptions of each of these graphs will not be provided. It is emphasized that the user should only be required to provide the requested specifications without ever intervening in the actual coding process. Similar to what has been described for the “constParameters.m” function, intelligent coding will always be performed for each coded function, examining the existing file and implementing suitable coding based on the specifications associated with the values or formulas contained in the file.
In this way, the user will be able to compile their regulations in a matter of minutes and proceed to analyze the test, directly invoking the DAART code from the interface.

3. Results

Once all sections of the graphical interface related to the introduction of the new regulation have been completed, the code associated with each button integrates all the functions necessary to perform data analysis according to the new protocol. This approach has allowed users to rapidly encode the various functionalities, minimizing the risk of compilation errors that could delay regulatory analysis. Additionally, it was possible to ensure a high level of customization for the final report.
To examine the case study, which pertains to the KMVSS CCRm regulation, it is sufficient to complete the DAART interface by selecting the “run.” file, the results directory, and specifying the primary vehicle dimensions. Subsequently, the tool invokes the code blocks embedded in the DAART functions, generating a summary page with the test results (Figure 10). From this screen, the user can quickly identify key test parameters and assess the overall validity of the test.
Although this information may seem superfluous compared to the direct review of the final report, it is in fact critical, as experimental campaigns often include a large number of tests, each requiring individual verification. In many cases, the analysis focuses on the summarized results, consulting the graphical report only to examine tests with uncertain outcomes, as in the specific case under study.
For further details, the complete report can be accessed by selecting the “View PDF” button, which will open the document shown in Figure 14.
This report offers a high degree of customization, both in the graphs and in the marker plot legend, thanks to the flexibility of the code managing the creation of the graphs, shaped by the respective tab of the ACGI. Specifically, the use of ACGI enables the generation of final reports with varying degrees of customization across different protocols in a quick and efficient manner. In any case, for each protocol, the generated report contains a summary of all relevant information for validating the test.

4. Discussion

Once the DAART data post-processing begins, the track engineer’s role is limited to analyzing the results. In the case study, the interface shown in Figure 10 provides the test ID and regulation acronym. The summary highlights key technical and meteorological test results with color coding to identify critical parameters. For example, red indicates parameters nearing regulatory limits, suggesting the need for further investigation. The interface allows users to focus on uncertain parameters by selecting an information button, which opens a detailed analysis interface. The interface also highlights key test parameters such as TTC at FCW signal activation and the relative distance between the vehicles at critical moments (e.g., the end of the test and activation of the safety function). The results confirm that no collision occurred, which is crucial for test validity. Additionally, parameters like “delta time”—which tracks the timing of auditory and visual signals—provide insights into the system’s responsiveness.
As seen in the report (Figure 14), the legend summarizes the key parameters selected by the user in the ACGI interface. The graphs show that the test did not result in collisions, as indicated on the summary page. Note that all graphs in the article are dimensionless, with technical parameters expressed as variables to ensure corporate confidentiality. The report includes detailed analyses of the following key parameters:
  • Graph Event:
    This displays the activation sequence of the FCW audio and video signals, followed by the AEB function. The graph clearly shows that the auditory signal is triggered first, followed by the visual signal and then the AEB activation.
  • Time to Collision:
    This graph shows the evolution of the time to collision between the subject vehicle and the target vehicle during the test. The TTC value decreases continuously until the activation of the safety function, at which point the vehicles begin to distance from each other following the braking of the SV. TTC is crucial for assessing the effectiveness of the safety system and the correct execution of the test. The T0 marker, highlighted in green, indicates the start of the test’s functional phase, characterized by the definition of the TTC.
  • Yaw Rate of the Vehicle:
    This validates the vehicle’s stability during braking. Yaw is controlled by the regulation and is shown to be within acceptable limits during the functional phase, as indicated by the green boundary box.
  • Axial Alignment Between Vehicles:
    This ensures that the subject vehicle and target vehicle remain aligned during the test. The graph confirms perfect alignment, as indicated by the boundary box.
  • SV Acceleration:
    This shows the acceleration variation during braking. The graph illustrates stable deceleration until AEB activation, after which acceleration decreases rapidly.
  • Deceleration Requested by the System:
    This graph shows the deceleration requested by the AEB system, which is crucial for understanding the system’s effectiveness, though not specifically regulated.
  • Steering Velocity:
    The graph shows that steering velocity remains stable until AEB activation, at which point it increases. A green boundary box confirms that it remains within the acceptable range.
  • Relative Distance Between Vehicles:
    Similar to TTC, this graph tracks the distance between the vehicles, showing a continuous decrease, indicating the vehicles were approaching each other during the test.
  • Target Vehicle (POV) Speed:
    This graph tracks the target vehicle’s speed, which is required to stay within regulatory limits. The results show the speed approaching the upper limit of the acceptable range, with some critical deviations at certain points. Adjustments to the POV speed regulation could improve test execution.
  • Subject Vehicle (SV) Speed:
    The graph representing the speed of the subject vehicle shows the speed trend of the VUT throughout the test. This parameter is essential for test evaluation and is required by all regulations, albeit with varying tolerances depending on the protocol applied. In this specific case, an issue is observed in the test execution: the SV speed is below the minimum limit established by the boundary box. This result indicates a test setup error, resulting in a speed outside the regulatory limits. Unlike the POV parameter, where acceptable deviation margins were present, in this case, the excessive deviation cannot be corrected by adjusting the regulation PID but requires direct intervention with respect to the speed. Therefore, the test cannot be considered valid and must be excluded from the final evaluation.
The report also includes meteorological data, where each parameter is color-coded: green indicates a positive result, red highlights issues, and blue denotes user-selected parameters with no regulatory verification requirements. In this case, the absence of negative results in the meteorological checks aligns with the summary page findings. Key metrics on the right side of the report offer further insights, summarizing critical values at specific moments of the trial. The left side contains a legend for the marker plots, ensuring clear the identification of important time points during the test. This case study provides a practical example of the system’s application, where the test was configured through ACGI and analyzed using DAART. While the data confirm compliance with non-collision requirements and adherence to key technological parameters, the speeds of both the subject and target vehicles deviate from the regulatory limits, leading to the test being invalidated. This example highlights how, in addition to automating the analysis, the system ensures rigorous regulatory checks, delivering reliable results that are fully compliant with standards.

5. Conclusions

This study has demonstrated how the DAART and ACGI tools have significantly improved the ADAS testing and approval process, with a particular focus on AEB test data analysis. The automation of experimental data post-processing through DAART has eliminated the need for the manual analysis of individual test parameters, optimizing the workflow and significantly reducing the time required to generate reports. The automatically generated final report has also provided a concise and clear overview of the results, facilitating rapid interpretation and further improving operational efficiency. This work is part of a broader research context, such as that of [16], which explored automation in the analysis of test data for ADAS systems but did not fully address the continuous variability of regulatory updates and the need to rapidly adapt the code. In contrast, the approach presented in this study directly tackles these challenges by offering a solution for the automatic generation of code and the seamless integration of new regulations. Despite these advancements, some limitations remain. The variability of regulations, which are continuously updated, introduces additional complexity in managing the codes, which must be rapidly updated to remain compliant. Furthermore, although automation simplifies test generation, users still need an in-depth understanding of the applicable regulations, which can limit the system’s accessibility. To overcome these obstacles, a promising future development is the integration of a neural network that would allow for the automatic analysis of PDF documents containing regulatory specifications. This would enable even faster and more precise management of updates, reducing the need for manual intervention and increasing accessibility for a broader audience. The main objective of this study was the automation of AEB test post-processing, and the results have shown that this approach improves the speed and accuracy of analysis, contributing to the more effective management of regulatory compliance. The practical applications of this innovation are evident, as they allow for agile and scalable test management, facilitating result interpretation and the adoption of new standards. Looking to the future, the analysis of patterns in experimental data represents an interesting direction for further improving the reliability and precision of tests. Moreover, extending the code to include non-AEB ADAS functions could broaden the scope of DAART and ACGI tools, making them even more versatile and useful in a wider range of scenarios. Future challenges include managing the complexity arising from the constant updating of regulations and integrating new automatic analysis tools, which will require continuous advancements in automation technologies. However, the developments described lay the foundation for an increasingly robust ADAS testing system capable of quickly adapting to regulatory changes and meeting the needs of an ever-evolving industry.

Author Contributions

Conceptualization, P.L. and M.D.; methodology, M.D., V.D. and S.L.; software, P.L. and M.D.; validation, P.L.; formal analysis, M.D.; investigation, P.L.; resources, P.L.; data curation, P.L.; writing—original draft preparation, P.L. and N.I.G.; writing—review and editing, N.I.G.; visualization, P.L.; supervision, N.I.G., M.D. and D.P.; project administration, D.P. and N.I.G. All authors have read and agreed to the published version of the manuscript.

Funding

This research received no external funding.

Institutional Review Board Statement

Not applicable.

Data Availability Statement

Data are contained within the article.

Conflicts of Interest

Authors Davide Palermo, Matteo Dollorenzo, Salvatore Lomartire and Vicenzo Dodde were employed by the company Nardò Technical Center S.r.l. The remaining authors declare that the research was conducted in the absence of any commercial or financial relationships that could be construed as a potential conflict of interest.

References

  1. Wang, J.; Zhang, L.; Huang, Y.; Zhao, J. Safety of autonomous vehicle. J. Adv. Transp. 2020, 2020, 8867757. [Google Scholar] [CrossRef]
  2. Lomartire, S.; Giannoccaro, N.I.; Toma, A. A smart procedure for data analysis relative to a vehicle ‘Coast-down’ test. Int. J. Veh. Syst. Model. Test. 2021, 10, 122–140. [Google Scholar] [CrossRef]
  3. Colosio, M.; de Andrade, A.; dos Santos, J. Overview of Automotive Component Failures; SAE Technical Paper; Society of Automotive Engineers: Warrendale, PA, USA, 2000. [Google Scholar] [CrossRef]
  4. Favarò, F.M.; Nader, N.; Eurich, S.O.; Tripp, M.; Varadaraju, N. Examining accident reports involving autonomous vehicles in California. PLoS ONE 2000, 12, e0184952. [Google Scholar] [CrossRef] [PubMed]
  5. Suarez-Bertoa, R.; Valverde, V.; Clairotte, M.; Pavlovic, J.; Gieckaskiel, B.; Franco, V.; Kregar, Z.; Astorga, C. On-road emissions of passenger cars beyond the boundary conditions of the real-driving emissions test. Environ. Res. 2019, 176, 108572. [Google Scholar] [CrossRef] [PubMed]
  6. Mandpe, S.; Kadlaskar, S.; Degen, W.; Keppeler, S. On Road Testing of Advanced Common Rail Diesel Vehicles with Biodiesel from the Jatropha Curcas Plant; SAE Technical Paper; Society of Automotive Engineers: Warrendale, PA, USA, 2005. [Google Scholar] [CrossRef]
  7. Ling, J.; Li, Y.; Li, J.; Yan, Y. Research on production vehicle evaluation method of China VI OBD for ligth-duty vehicles. In Proceedings of the 4th International Conference on Material Science and Technology, Wuhan, China, 22–23 January 2020; Volume 774, pp. 1–8. [Google Scholar]
  8. Chen, Y.; Sun, Y.; Ding, N.; Chung, W.K.; Qian, H.; Xu, G.; Xu, Y. A real-time vehicle safety system. In Proceedings of the 2012 IEEE/SICE International Symposium on System Integration, Fukuoka, Japan, 16–18 December 2012; pp. 957–962. [Google Scholar]
  9. Kim, J.J.H.; Lee, J.H.; Choi, J.H.; Jeon, W.J. AEB Simulation Method Based on Vehicle Test Data for Accident Analysis of ADAS Vehicles. Int. J. Automot. Technol. 2024, 25, 261–277. [Google Scholar] [CrossRef]
  10. European NEW CAR ASSESSMENT PROGRAMME (Euro NCAP) TEST PROTOCOL—AEB Car-to-Car Systems. Available online: https://www.euroncap.com/media/79864/euro-ncap-aeb-c2c-test-protocol-v43.pdf (accessed on 8 September 2024).
  11. UN Regulation No 152—Uniform Provisions Concerning the Approval of Motor Vehicles with Regard to the Advanced Emergency Braking System (AEBS) for M1 and N1 Vehicles. Available online: http://data.europa.eu/eli/reg/2020/1597/oj (accessed on 1 September 2024).
  12. Department of Transportation, National Highway Traffic Safety Administration. Available online: https://www.nhtsa.gov/sites/nhtsa.gov/files/2024-04/final-rule-automatic-emergency-braking-systems-light-vehicles_web-version.pdf (accessed on 20 June 2024).
  13. Korean Vehicle Framework Regulation (KMVSS), KMVSS Regulations to Require Vehicle Category M1/N1 to be Equipped with Aebs (2023). Available online: https://www.safetywissen.com/object/B04/B04.1bb738181qddmw5yymi37488w50eux63778789488/safetywissen?prev=%2Fnews%2FSAFETYNEWS%2F (accessed on 10 October 2024).
  14. The MathWorks Inc. Optimization Toolbox; Version 9.4 (R2022b); The MathWorks Inc.: Natick, MA, USA, 2024; Available online: https://www.mathworks.com (accessed on 3 May 2024).
  15. Zhang, S.; Lei, B.; Chen, S.; Sha, L. Research on subjective evaluation method of automatic emergency braking (AEB) for passenger car. E3S Web Conf. 2021, 268, 01037. [Google Scholar] [CrossRef]
  16. Dollorenzo, M.; Vincenzo, D.; Giannoccaro, N.I.; Palermo, D. Simulation and Post-Processing for Advanced Driver Assistance System (ADAS). Machines 2022, 10, 867. [Google Scholar] [CrossRef]
  17. AB Dynamics. Available online: https://www.abdynamics.com/en/products/tracktesting/adas-targets/synchro (accessed on 3 May 2024).
  18. Albrecht, H.; Barickman, F.; Schnelle, S. Advanced Test Tools for ADAS and ADS (Report No. DOT HS 813 083); National Highway Traffic Safety Administration: Washington, DC, USA, 2021.
  19. Euro NCAP AEB Car-to-Car. Available online: https://www.euroncap.com/en/car-safety/the-ratings-explained/safety-assist/aeb-car-to-car/ (accessed on 23 August 2024).
  20. Automobile Sot. Available online: https://automobilesoft.net/mycar/automobile-safety/active-safety/aeb/ (accessed on 29 August 2024).
Figure 1. DAART logo.
Machines 12 00896 g001
Figure 2. ACGI logo.
Machines 12 00896 g002
Figure 3. Phase sequence diagram of an AEB test.
Machines 12 00896 g003
Figure 4. ACGI Eval TTC page compiled for KMVSS CCRm regulation codification.
Machines 12 00896 g004
Figure 5. AEB function monitoring.
Machines 12 00896 g005
Figure 6. CCR Test (a) and CCRm Test (b); images extracted from the reference [19,20].
Machines 12 00896 g006
Figure 7. Profiles for determining the impact speed of the vehicle and dimension of the pedestrian target according to Euro regulations.
Machines 12 00896 g007
Figure 8. DAART graphical interface.
Machines 12 00896 g008
Figure 9. DAART codes link diagram.
Machines 12 00896 g009
Figure 10. Graphical interface summarizing the results of a KMVSS CCRm test.
Machines 12 00896 g010
Figure 11. Logic diagram function “constantParam.m”.
Machines 12 00896 g011
Figure 12. ACGI home page compiled for KMVSS CCRm regulation codification.
Machines 12 00896 g012
Figure 13. ACGI Set parameters page compiled for KMVSS CCRm regulation codification.
Machines 12 00896 g013
Figure 14. Final report on the CCRm KMVSS test.
Machines 12 00896 g014
Disclaimer/Publisher’s Note: The statements, opinions and data contained in all publications are solely those of the individual author(s) and contributor(s) and not of MDPI and/or the editor(s). MDPI and/or the editor(s) disclaim responsibility for any injury to people or property resulting from any ideas, methods, instructions or products referred to in the content.

