1. Introduction
In metal-cutting processes, the surface of the cutting tool is subjected to wear, which significantly impacts precision, efficiency, and production costs in industrial machining. Monitoring the state of the tool is essential for maintaining production quality and reducing operational costs. Several techniques have been developed for tool-condition monitoring, each with advantages and limitations. Traditional direct wear measurements, such as optical or electrical sensors, are often impractical for online measurements due to their invasive nature and high cost.
Indirect methods like vibration and cutting force analysis have shown promise but face challenges in real-world implementation. Vibration analysis relies on sensors such as accelerometers, which can be mounted on the workpiece or spindle during milling operations or on the tool holder during turning operations [
1,
2,
3,
4]. However, these methods require additional experimental modal testing to distinguish between vibration sources. Cutting force measurements provide valuable insights but are highly sensitive to cutting conditions, requiring expensive equipment and advanced data-processing techniques [
5,
6]. Similarly, acoustic-emission (AE) analysis monitors the high-frequency sound waves generated during cutting, which can reveal tool wear through changes in frequency and amplitude [
6,
7,
8]. Despite their promise, AE methods face challenges from sensor placement, environmental noise, and temperature variations [
9].
The research methodology undertaken in this study comprises several key stages, starting with a preliminary test with only microphones, followed by design, additional measurements and selection of components, and fabrication of the printed circuit board (PCB) that ends with additional tests and measurements, which are needed for signal analysis in MATLAB R2019a and machine learning, as shown in
Figure 1. Recent approaches have explored combining multiple sensor types, such as temperature and force sensors, or integrating advanced techniques like machine vision and artificial intelligence to enhance accuracy and practicality. Current and power sensors embedded in machining systems have also been investigated, while novel methods, such as analyzing odorants using an electronic nose, provide innovative yet experimental solutions for tool-condition monitoring [
10,
11,
12].
Among indirect methods, sound signal analysis has emerged as a particularly viable approach. Audible sound emission analysis offers non-invasive monitoring and captures the richness of information in acoustic emissions during cutting. Recent studies have demonstrated its potential for tool-wear estimation, with applications ranging from audible sound monitoring to ultrasonic acoustic-emission analysis. Audio signals have also been used to monitor other manufacturing processes, such as laser cutting, where sound analysis detected cutting interruptions with promising accuracy using advanced classifiers like the RandOm Convolutional Kernel Transform (ROCKET) [
13,
14,
15]. However, sound signals are not without limitations, as their correlation with tool wear can vary under certain conditions.
Conventional tool-wear monitoring methods typically evaluate cutting-tool life based on gradual and predictable wear progression, often referred to as normal tool-wear. These methods focus on steady-state wear patterns, such as tool flank wear or crater wear, which develop over extended cutting operations. While effective in many cases, they are inadequate for detecting abrupt tool wear that can occur at the onset of machining operations. This study addresses this gap by introducing a novel system that combines sound signal analysis and advanced machine learning techniques to assess tool wear in real time.
The proposed system utilizes low-cost, high-frequency microphones and a custom signal processing framework to capture acoustic emissions from cutting operations. Key features include optimized microphone placement, analog and discrete filters to enhance signal quality, and a custom PCB for efficient data transfer to MATLAB for analysis. Tested on a CNC lathe machining EN 1.4307 (AISI/ASTM 304L) [
16] stainless steel, the system accurately identifies wear patterns and predicts tool-wear rates, enabling real-time adjustments to optimize machining parameters, reduce tool change frequency, and improve productivity.
This work is structured as follows:
Section 2 presents the microphone used and analyses the role of the shield in obtaining clean signals.
Section 3 addresses the design and fabrication of the PCB measurement system. The results of the completed measurements are presented in
Section 4. In
Section 5, the features used for classification are derived. Finally, the conclusions are summarized in
Section 6.
2. Microphones and Shields
In this work, we utilized a Beyerdynamic MM1, a precision measurement microphone designed for accurate acoustic analysis. The MM1 features an omnidirectional polar pattern and a flat frequency response ranging from 20 Hz to 20 kHz, ensuring unbiased sound capture. It is equipped with an electret condenser capsule and operates on a power supply of 12 to 48 V.
To protect the microphones from potential damage caused by flying metal chips and cutting fluids during CNC operations, effective shielding was necessary. Two types of shields were fabricated and tested: a metal shield with a 30 mm diameter and 1.5 mm grid and a custom 3D-printed ABS plastic shield with a 15 mm diameter. To evaluate the impact of these shields on the frequency response, frequency sweeps from 1 kHz to 24 kHz were conducted using a loudspeaker. The baseline measurement, taken without any shield, was followed by tests using the different shields and the lathe’s glass door,
Figure 2 where the transmitted audio signals were verified using a TES 1350 sound level meter. These measurements were conducted at various distances to examine the effects of signal attenuation and reflections.
Tool wear occurs in distinct zones, as established in metal-cutting theory. The primary zones include flank wear on the clearance face, rake wear on the rake face, and notching near the cutting edge [
15]. Each zone corresponds to specific wear mechanisms, such as abrasive wear, adhesive wear, or thermal fatigue. For austenitic stainless steel, notching is particularly prevalent due to its work-hardening properties, which create high-stress concentrations near the cutting edge, see
Figure 3. These unique wear characteristics were central to the observations in this study, where notching served as a critical indicator for tool-wear monitoring.
The results from the measurement taken at a distance of 100 cm are presented in
Figure 4. The analysis revealed that both the plastic screen and the lathe’s glass door (represented by the yellow and purple curves, respectively) attenuated the signal significantly more than the metal screen (red curve) and the reference measurement without any screen (blue curve). It should be noted that the frequency response of the glass shield in
Figure 4 specifically corresponds to the lathe’s glass door, as it was used to simulate the shielding properties of a glass barrier. The pronounced attenuation observed with the plastic screen and glass door can be attributed to their material properties, which tend to absorb and reflect sound waves to a greater extent than the metal screen. In contrast, the metal screen, with its grid structure, exhibited less signal loss, indicating that its design allows for better transmission of acoustic signals.
When analyzing the spectrum of the audio signal, an oscillatory pattern is observed, characterized by periodic variations in amplitude. This behavior may result from interference effects, resonances, or other acoustic phenomena influencing the frequency response of the sound within the given environment. Further investigation is required to identify the underlying mechanisms contributing to these variations.
Additional measurements of both the reference and the metal screen were conducted inside an anechoic chamber with a high-end full-range loudspeaker to enable a more detailed analysis of the frequency responses. The chamber, designed to minimize sound reflections and reverberation, allowed us to investigate signal transmission under optimal conditions with minimized external interference. The sweep time was extended to improve measurement accuracy and capture more details across the frequency spectrum. This approach enhanced the precision in analyzing how the metal screen affects signal transmission while reducing measurement uncertainties. The enhanced precision allowed for an improved frequency analysis using Short Time Fourier analysis.
The analysis results, as seen in
Figure 5, show the generated audio signal (diagonal line) and the harmonic distortions of the recording system due to reduced sampling rate and lack of analog filtering commonly used in musical applications. The timbre effects caused by harmonic distortion are desired when listening to music but interfere with audio measurements when frequency analysis is performed. This result emphasized the necessity of proper Analog-to-Digital Converter (ADC) settings and analog filters to analyze audio signals for industrial applications. Hence, the decision was made to include an analog filter even though ADC manufacturers generally state that additional analog filtering is not required for specialized audio ADCs.
3. PCB Measurement System
We have designed and manufactured the entire measurement system on a custom-printed circuit board (PCB). During development, extensive analyses were conducted on the critical parameters influencing the system’s performance and accuracy. Each system component was carefully evaluated to ensure it met the requirements for accuracy and reliability in real-time measurements.
3.1. Signal Gain
The differential analog signal generated by the microphone has a low amplitude of 15 mV/Pa. Even at the microphones’ maximum measurable sound pressure level (SPL) of 122 dB (approximately 25 Pa), the resulting electrical signal reaches only 378 mV. To optimize the dynamic range of the ADC, the input signal amplitude and the ADC reference voltage were carefully adjusted. This was achieved by amplifying the differential signal with a predefined, fixed gain in the Analog Front-End (AFE). The amplification ensures that the signals fall within the ADC’s optimal range, improving the dynamic range, precision, and accuracy. This method also optimizes the signal-to-noise ratio, which is critical for ensuring high-quality real-time measurements.
A voltage supply DC high-pass filter and the cascaded low-pass edge smoothing filter have been configured to eliminate unwanted signals while preserving signal integrity within the passband. Attenuation and phase shift were carefully considered during the filter design. The microphone’s load impedance is specified at a minimum of 2.2 kΩ, and the high-pass DC blocking filter has been designed with a minimum impedance of 3.3 kΩ, followed by an active low-pass filter to maintain signal strength.
The low-pass filter is a third-order design, combining a second-order MFB filter with a cutoff frequency of 100 kHz and a gain of 9 dB and a first-order passive RC filter with a cutoff frequency of 240 kHz,
Figure 6. This configuration ensures minimal phase shift at 20 kHz and effectively attenuates high-frequency signals without introducing distortion into the passband. The filter response is flat between 20 Hz and 20 kHz, and the phase shift remains negligible across the audible frequency range indicated in green. To minimize signal distortion due to component tolerances, precision resistor networks have been employed.
3.2. ADC Settings
In this work, the ADC settings were configured to minimize aliasing and ensure accurate signal processing. The Nyquist frequency of 24 kHz, determined by the software-defined sampling rate of 48 kHz, is sufficiently higher than the maximum desired input frequency of 20 kHz. However, frequencies between 20 kHz and 24 kHz that are not adequately filtered by the Analog Front-End (AFE) can still introduce aliasing effects in the ADC, potentially compromising the integrity of the digitized signal. To prevent this, the ADC was configured to perform oversampling in combination with a discrete filter. Both oversampling and discrete filtering are managed internally by the ADC, which utilizes a Phase Locked Loop (PLL) to maintain precise timing control.
The ADC requires a clock frequency that is an integer multiple of the sampling rate, such as 6.144 MHz or 12.288 MHz. Generating these frequencies directly from the microcontroller’s (MCU) internal 240 MHz clock is inefficient, as it cannot be evenly divided. To address this, the ADC was operated in master mode, allowing the necessary timing signals to be generated via a dedicated 12.288 MHz audio oscillator directly connected to the AD’s PLL. In addition to providing timing control for the ADC, the PLL also generates clock signals for the Inter-IC Sound (I2S) interface, which are adapted by the MCU for audio data transfer.
3.3. Audio Acquisition
The analog region of the printed circuit board (PCB) is carefully shielded with a Faraday cage to effectively protect the analog signals from high-frequency noise, which can be superimposed by the surrounding digital electronics. This shielding is crucial to ensure high signal quality and minimize interference during analog signal processing. The ADC discretizes the analog signals and serves as a bridge between the analog and digital sections of the PCB. The digital portion of the ADC manages clock generation, PLL filtering to maintain correct timing during the sampling process, and time synchronization via the I2S protocol for audio data transfer.
To minimize electromagnetic interference and ensure signal integrity, the I2S traces between the ADC and the microcontroller (MCU) are kept as short as possible. Additionally, the signal lines are carefully length-matched to prevent timing errors and skew between individual signals, which is critical for accurate data transmission in real-time systems. The configuration of the ADC is handled via an Inter-Integrated Circuit (I2C) connection to the MCU, which is responsible for setting sampling rates, filter settings, and signal gain. This integrated configuration ensures adaptability to various measurement environments while maintaining high accuracy in signal processing.
The MCU in this system includes a built-in transceiver for wireless communication. An external antenna was selected over a PCB track antenna due to the PC’s placement in an ABS plastic casing, which attenuates wireless signals and increases path loss. This results in reduced transmit power and sensitivity to incoming signals. The external antenna, with a 6 dBi gain, improves transmission distance and signal-to-noise ratio (SNR). The systems must comply with the IEC 61000 EMC standard [
17], which requires handling higher noise levels in industrial environments. The external antenna’s increased signal gain helps maintain a higher SNR and improves the resistance to electromagnetic interference.
The system’s user interface display is connected via Serial Peripheral Interface (SPI) to minimize MCU pin usage and enable future expansions., such as adding an SD card. The SD card may require the full 80 MHz SPI speed for future expansions, and the SPI signal lines have been length-matched for accurate timing. Additionally, the system features a USB 2.0 port supporting data rates up to 480 Mbps, designed with 90 Ω impedance and 100 ps length matching. To meet European sustainability standards, the system is equipped with a USB-C connector for power supply and data transfer.
Transient protection in the system is achieved using TVS diodes, capacitors, filters, and current limiters on external electrical connections. To protect the push button and LED from electrostatic discharge (ESD), a push rod and light guide are employed. Unused pins, including I2C and some power pins, are routed to a pin header to facilitate future system expansion. By default, the system is configured to be reprogrammable only via a Universal Asynchronous Receiver/Transmitter (UART) programmer, preventing inadvertent software modifications by the end user.
A prototype of the system was produced using development boards as a ‘step A’ in the development process. Prototype version A was used to test the system’s various functions and to gather the necessary data for creating the schematic and layout for version B. After system assembly, version B was tested using a signal generator and oscilloscope (Keysight DSOX2002A), as well as a speaker to generate and measure sound at specified frequencies. For this work, Version B was utilized for the development of the printed circuit board (PCB).
The printed circuit board (PCB) is a critical component of the system that must be handled carefully to prevent damage from mechanical stress and ESD transients. Connecting and disconnecting the cables would have subjected the PCB to mechanical strain, but a custom housing has been employed to mitigate most of these stresses. The housing not only protects the system from damage but also facilitates the integration of other components, such as the screen and antenna, into a single cohesive system, as shown in
Figure 7 and
Figure 8.
3.4. Data Process System
When the ADC operates at maximum capacity (four microphone data streams at 192 kHz, 32 bits per sample), it generates 24.5 Mbit/s, leaving only 40 ns between bits. While the MCU, running at 240 MHz, can handle this load, it leaves no room for other tasks. To address this, the tasks were divided into three simultaneous processes. The first task is responsible for continuously capturing the audio stream via the I2S interface and storing it in MCU memory using Direct Memory Access (DMA), therefore freeing the CPU for other operations. The second task, running on core 0, processes and transfers audio data to the network client while handling incoming data. The audio data are split into bytes and transmitted via WiFi. The third task, running on core 1, manages system control and user interface functions, including display and input management. This task division ensures that system control and interface operations do not interfere with continuous audio acquisition and data transmission.
3.5. Wifi Data Transmission
WiFi was chosen for data transmission, and both Transmission Control Protocol (TCP) and User Datagram Protocol (UDP) were tested. TCP introduced significant latency, with the transfer of 10 ms of raw data taking approximately 2000 ms, resulting in a real-time data loss of 99.5%. In contrast, UDP exhibited no significant delay, with transfer times matching the 10 ms sample rate stored in the DMA buffer.
Further testing with multiple audio sources confirmed that UDP could transfer data within 5 ms, making it a suitable solution for real-time data transfer. However, a disadvantage of UDP is that lost packets cannot be recovered, potentially causing errors in source matching when multiple microphones are used. This desynchronization issue was resolved using the unused 8 bits of the 32-bit data stream to encode the source of each sample. The data acquisition process is outlined in the following pseudo-code, which is implemented on the microcontroller.
![Machines 12 00892 i001]()
4. Measurements
To effectively monitor tool wear during machining operations, an experimental process was designed to capture and analyze acoustic emissions. The process involved setting up a dual-microphone system to record sound under various machining conditions. Noise levels were measured during both stationary and spindle-rotating phases, enabling the characterization of baseline acoustic profiles. Continuous audio recordings were taken, capturing both cutting and non-cutting phases. The data analysis focused on distinguishing cutting activity using specific metrics, such as Root Mean Square (RMS) and Zero Crossing Rate (ZCR), to optimize feature extraction. The following paragraphs describe the implementation of this experimental process in detail.
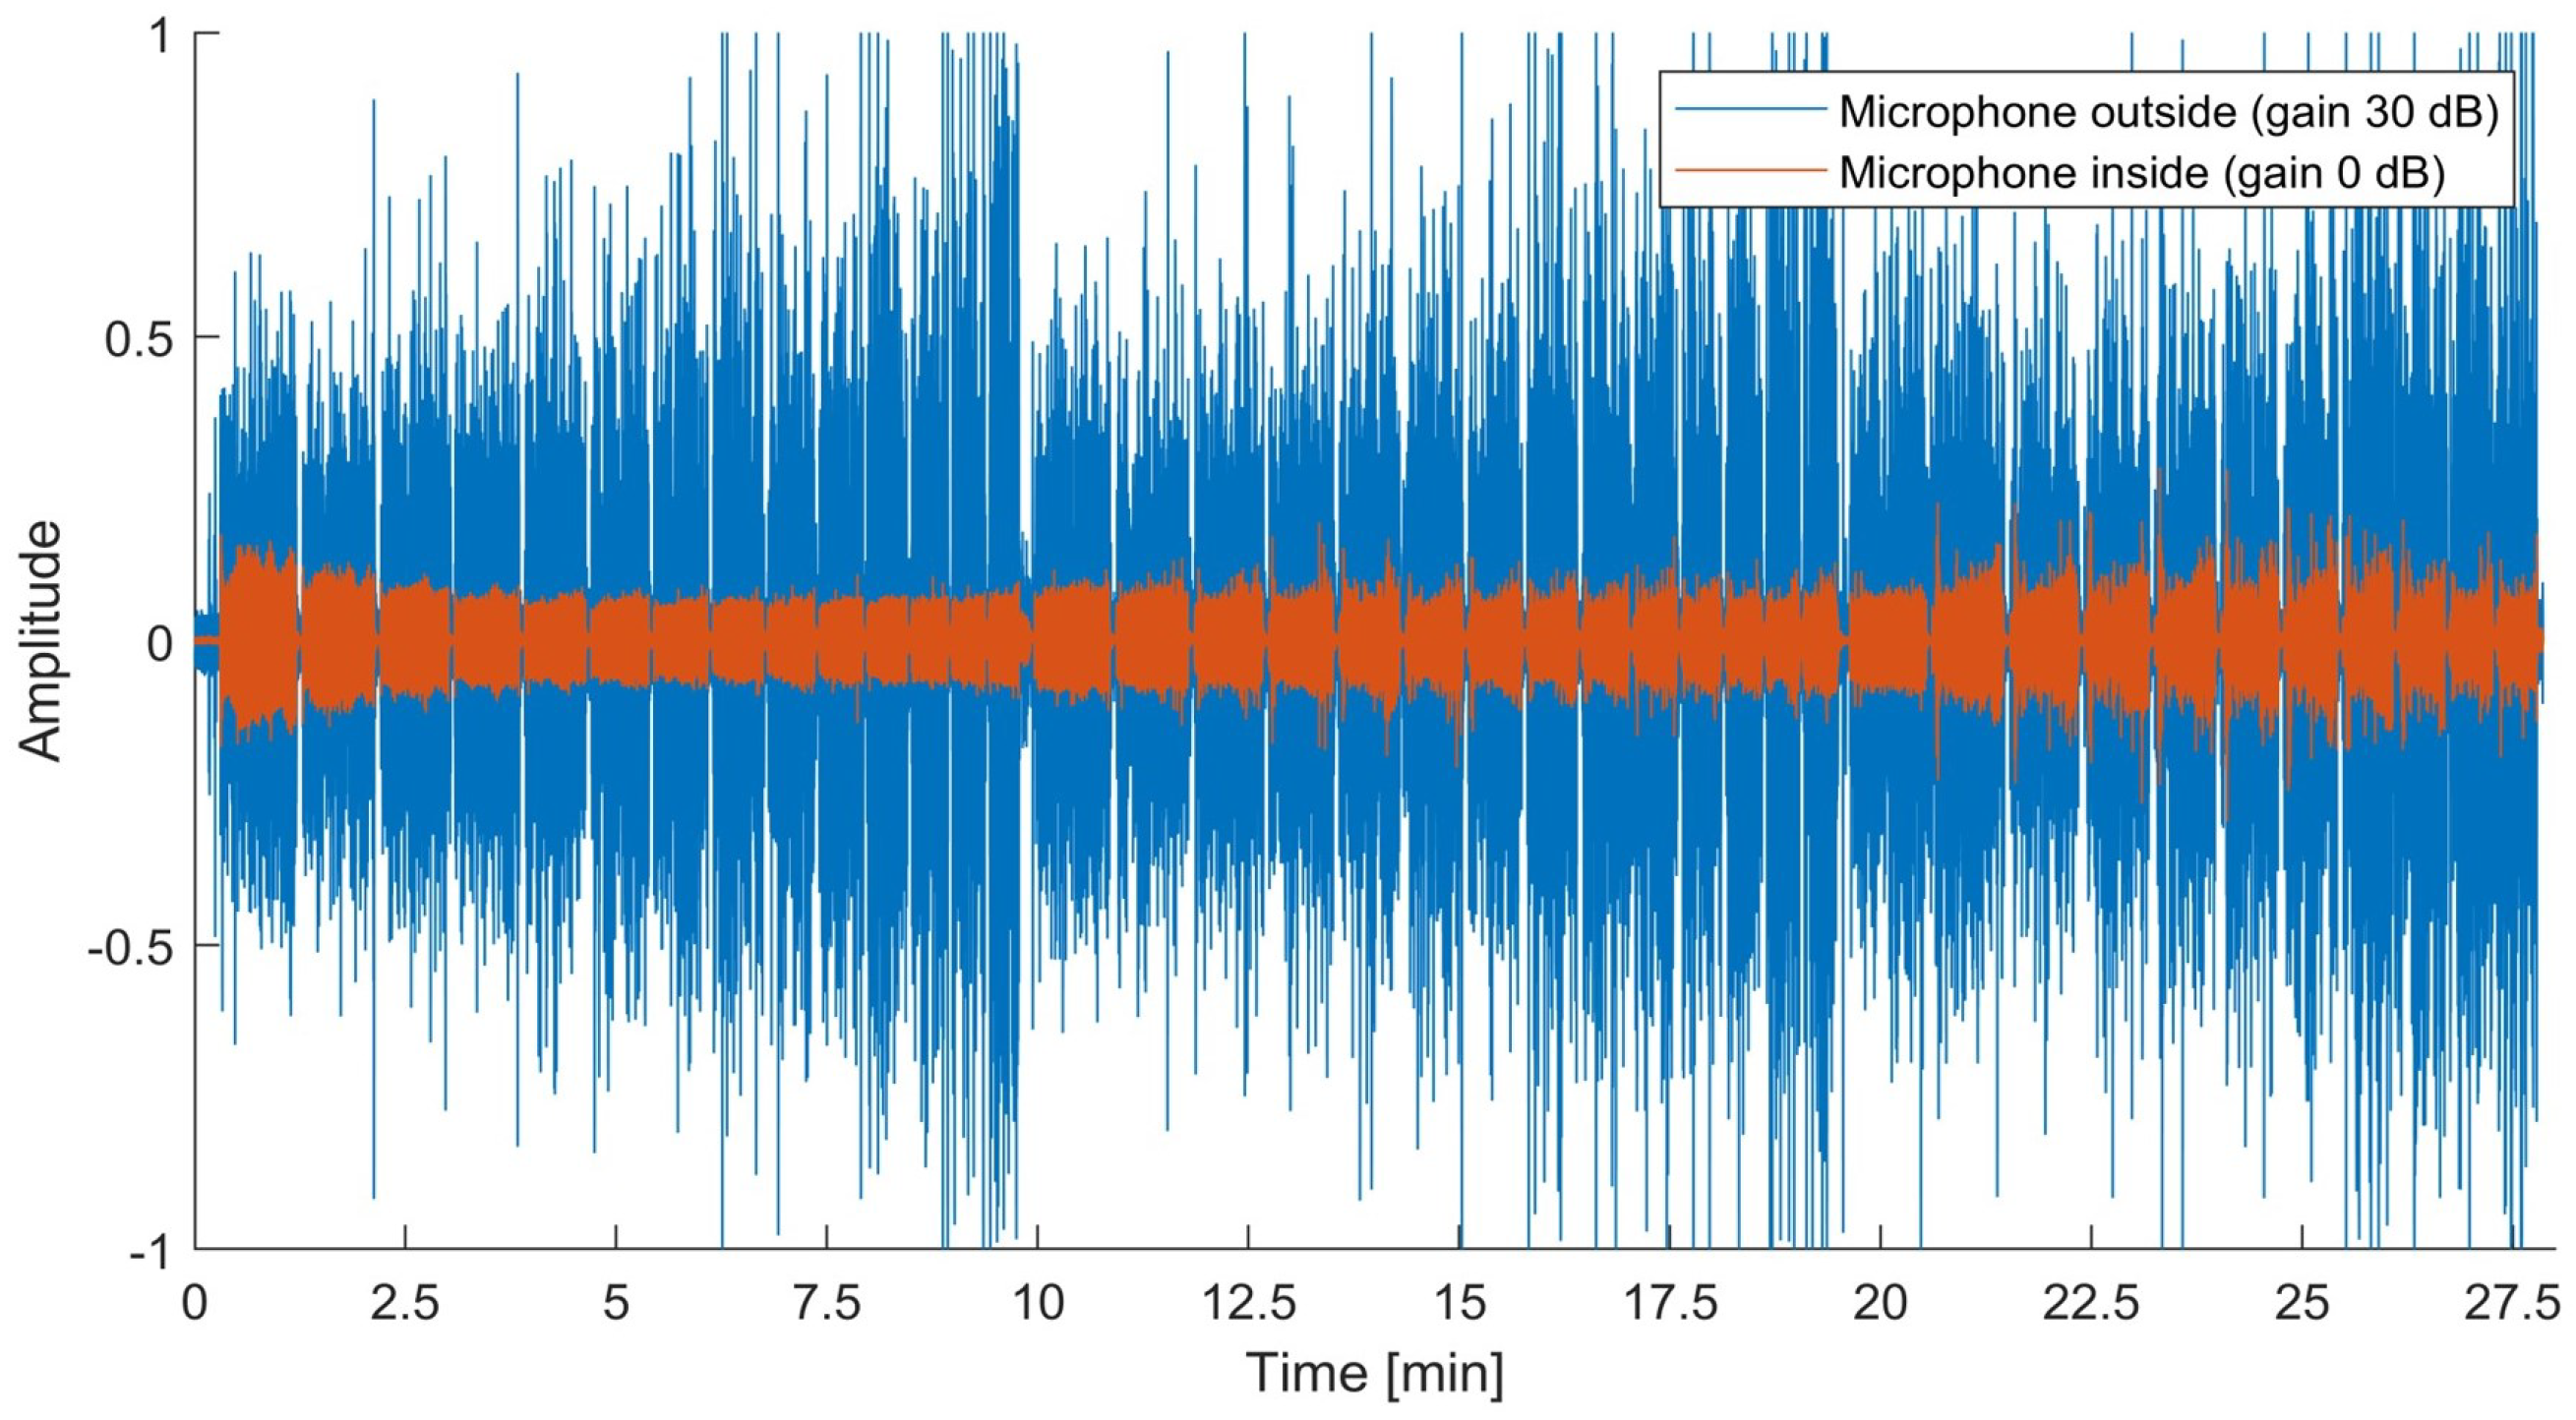
The experimental setup utilized two Beyerdynamic MM1 microphones as shown in
Figure 9, strategically placed to ensure reliable data collection. The internal microphone was positioned 6 cm inside the lathe, protected by a metal shield, while the external microphone was placed 60 cm outside the lathe. The internal microphone was left unamplified due to significant internal noise levels (−36 dBFS), while the external microphone signal was amplified to compensate for attenuation caused by the lathe’s glass door. Noise levels were measured with post-ADC gain settings of 0 dB and 30 dB under both stationary and spindle-rotating conditions. Spindle speeds varied between 700 RPM and 1650 RPM, reflecting changes in the workpiece diameter from 95 mm to 39 mm.
Audio recordings were continuous, capturing both cutting and non-cutting phases. To prevent processing unnecessary data during non-cutting intervals, RMS and ZCR metrics were analyzed. ZCR proved to be the most reliable metric for detecting cutting activity, offering a clear distinction between cutting and non-cutting phases. A ZCR threshold of 0.01 and a cutting threshold of 0.1 were established for effective cut detection. These settings were validated through multiple experimental runs, ensuring consistent and accurate detection of cutting activity.
Figure 10 and
Figure 11 illustrate the initial 180 seconds and complete recordings, respectively, while
Figure 12 demonstrates the detected cutting intervals.
The proposed system achieves a total response time of 15 ms, encompassing the entire process from data acquisition to tool-wear state prediction. This rapid response is enabled by optimized hardware and software configurations. The system utilizes a 240 MHz microcontroller unit (MCU) with a dedicated audio oscillator to ensure low-latency processing. Data acquisition is enhanced through optimized analog-to-digital converter (ADC) settings and DMA-based data buffering, which reduce CPU load and minimize data transfer delays. Additionally, UDP-based wireless transmission facilitates efficient data transfer to the processing computer. These configurations enable real-time predictions with minimal delay, demonstrating the system’s suitability for industrial machining applications.
5. Event Classification
In the current study, it was observed that the highest intensity of the emitted cutting sound, with the materials and settings used, occurred around 15 kHz. When a new cutting tool was employed, the peak at 15 kHz was narrow and symmetrical. As the tool began to wear, the peak broadened, and its shape became less symmetrical. To capture relevant cutting characteristics, both the shape and frequency content of the peak were analyzed within a defined frequency window. This analysis allowed for the extraction of several features to track changes in the cutting process and tool condition, see
Table 1.
These features have been used as input for the machine-learning algorithm. In the frequency window, visualized in
Figure 13, the relationships and threshold values of the features are clearly presented, providing an overview of their influence on the signal’s amplitude and frequency behavior. By incorporating features such as the sample mean, threshold values at 3 dB, bandwidth, and peak values, accurate modeling of the signal’s characteristics is achieved, enhancing the algorithm’s predictive capability.
The extracted features vary depending on the tool’s state, and a machine-learning algorithm was used to estimate this based on those features. In the preliminary study, Naïve Bayes, logistic regression, and TreeBagger algorithms were evaluated for their suitability. Naïve Bayes and logistic regression demonstrated lower accuracy due to feature dependencies. In contrast, the TreeBagger algorithm, which accounts for correlated features, achieved 92% accuracy in predicting the tool’s status (usable/not usable). TreeBagger constructs decision trees to improve accuracy, and through bagging, it reduces the risk of overfitting and decreases variance. In this study, the TreeBagger algorithm was adapted to perform real-time analysis from multiple sources and output an integer time value instead of a binary classification.
During the training phase, raw audio data were recorded alongside the corresponding tool time. Data were collected from 13 tools by processing 31 workpieces, with the tool condition determined using four methods. First, an experienced operator assessed tool wear by listening to the emitted sound. Second, surface roughness was measured using a Mitutoyo SJ-210 meter, where worn tools produced rougher surfaces. Third, chip size and shape were analyzed for additional insights into the tool’s condition. Finally, the tools’ usability was confirmed through microscopic inspection.
The features of each sample were determined, with the addition of ZCR as the ninth feature. The dataset was divided into two parts: 80% for training and 20% for validation.
An accuracy of approximately 82% was achieved, which can be attributed to increased variance in the measurements (
Figure 14). The variance was caused by inconsistencies in tool geometry, the cutting program, and the workpiece edge shape. Tool hammering and irregular tool wear occurred when the workpiece face was rough or angled, and the tool impacted the shoulder of the workpiece at the end of each cut. By flattening the front face and adjusting the shoulder geometry, wear variation was significantly reduced, and surface quality improved. These adjustments also resulted in more consistent sound emissions, as verified by surface roughness measurements between runs (
Figure 15), which now display a clear trend despite previous variations. Tool wear is influenced by several factors, some of which are uncontrollable (e.g., workpiece material), while others can be adjusted (e.g., cutting speed, tool geometry). Although sonic analysis can be used to measure tool wear, the accuracy of the measurement depends on the setup parameters, making it crucial to verify the suitability of a specific setup for wear analysis with the desired precision.
6. Discussion
Tool-wear monitoring is a critical aspect of machining process optimization, with direct and indirect methods providing complementary insights. According to [
15], direct methods involve physical measurements of wear features, such as flank wear or crater wear, while indirect methods correlate tool wear to other cutting parameters, including surface roughness, cutting forces, motor power, acoustic emissions, and vibration. Among these, flank wear is widely recognized as a reliable metric for tool-wear monitoring due to its predictable progression during cutting.
While ISO 8688-2 [
18] provides standardized approaches for tool life testing and wear measurement, the challenges associated with machining austenitic stainless steel, such as EN 1.4307, necessitate adaptations to these methodologies. Traditional tool life tests require significant cutting time—up to 40 h—and rely on materials like 1045 steel to establish tool life curves. However, in work-hardening materials like austenitic stainless steel, notching is a frequent failure mode that introduces substantial scatter in tool life data, making standardized tests less effective. In this work, tool wear progressed predominantly through notching rather than gradual flank wear, necessitating specialized tests tailored to capture the dynamic wear characteristics unique to this material.
To address these challenges, the proposed system employs real-time monitoring of high-frequency acoustic emissions from the cutting zone, which are analyzed and correlated with tool wear using machine-learning techniques. Studies such as [
19,
20,
21] have demonstrated the efficacy of acoustic and audible signals for tool-wear prediction. Building on this foundation, our system achieved an 82% accuracy in distinguishing usable and non-usable tools, validated against physical measurements of flank wear and microscopic inspection of worn tools. This level of accuracy demonstrates the system’s reliability in assessing tool-wear conditions and predicting usability under challenging machining conditions.
The machined surface roughness was also evaluated using a Mitutoyo SJ-210 roughness meter to validate the correlation between acoustic signal changes and tool wear. By integrating these measurements, the proposed system complements traditional methods by providing actionable insights into tool replacement schedules, enhancing productivity while reducing downtime. Future work will involve refining the system’s accuracy and integrating additional metrics, such as direct wear measurements, to further align with ISO standards and ensure robust industrial applicability.
7. Conclusions
In this study, we developed a novel acoustic measurement system for real-time tool-wear monitoring, utilizing low-cost, high-frequency microphones and advanced signal processing techniques to capture and analyze acoustic emissions during machining operations. The system demonstrated an 82% accuracy in distinguishing usable and non-usable tools, validated against physical wear measurements and microscopic inspections, highlighting its reliability in assessing tool conditions under challenging machining scenarios such as those involving EN 1.4307 (AISI/ASTM 304L) stainless steel. With a rapid response time of 15 ms, achieved through optimized hardware configurations—including a 240 MHz microcontroller, analog-to-digital converter (ADC) settings, DMA-based buffering, and UDP wireless communication—the system enables actionable insights for optimizing machining parameters, reducing tool change frequency, and enhancing productivity. By addressing limitations in traditional methods, particularly the detection of abrupt wear, this system offers a robust, scalable, and cost-effective solution for industrial applications, paving the way for seamless integration into CNC machines and more efficient production processes. Future work will aim to refine the system’s accuracy further and align it with standardized methodologies to broaden its industrial applicability.


