Article

Advanced Fault Detection and Severity Analysis of Broken Rotor Bars in Induction Motors: Comparative Classification and Feature Study Using Dimensionality Reduction Techniques

1
School of Information Technology, Engineering, Mathematics and Physics, University of the South Pacific, Suva, Fiji
2
Department of Industrial Engineering, University of Padova, 35122 Padova, Italy
3
Laboratory MIS UR4290, University of Picardie “Jules Verne”, 33 rue St Leu, 80039 Amiens, France
*
Author to whom correspondence should be addressed.
Machines 2024, 12(12), 890; https://doi.org/10.3390/machines12120890
Submission received: 27 September 2024 / Revised: 25 November 2024 / Accepted: 2 December 2024 / Published: 6 December 2024

Abstract

This paper presents an experimental investigation into the detection and classification of broken rotor bar (BRB) faults in a 1.1 kW squirrel cage induction motor (IM) across various load conditions and fault severities: 1.5 BRBs, 2 BRBs, 2.5 BRBs, and 3 BRBs. Motor current signature analysis (MCSA), fast Fourier transform (FFT), and the extended Park’s vector approach (EPVA) were used to explore the frequency spectra and identify characteristic fault frequencies (CFFs) associated with BRB faults. Following these exploration, the extended Park’s vector (EPV) current was used to calculate 15 statistical time-domain features, which underwent exploratory data analysis using principal component analysis (PCA), curvilinear component analysis (CCA), and independent component analysis (ICA), deducing the intrinsic dimensionality to 3. Thereafter, classification was carried out using both neural and non-neural approaches to assess healthy signature as well as BRB fault severities. The PCA-SDNN model achieved the highest accuracy, showcasing its suitability for accurate, real-time fault detection in industrial IMs. This study demonstrates the effectiveness of integrating MCSA, EPVA, dimensionality reduction, and machine learning for robust IM fault diagnosis.

1. Introduction

1.1. Related Works

Three-phase induction motors (IMs) are essential in industrial sectors for electromechanical energy conversion due to their durability and reliability. However, they can fail prematurely from excessive thermal, mechanical, or electrical stress, making early identification of faults like broken rotor bar (BRB) faults crucial to prevent unexpected breakdowns and production halts. Industries often invest in routine maintenance to detect faults and implement preventive measures, but reliance on physical inspections can cause BRB faults to be overlooked [1]. Faults typically manifest as deviations from normal operation patterns detectable by sensors; however, appropriate analyses are required to perform early fault detection. Generally, fault diagnosis (FD) methods are classified into three categories: process history-based methods, quantitative methods, and qualitative methods [2].
Process history-based methods rely heavily on data analysis techniques, particularly through multivariate statistical methods (MSM) and neural networks (NN). MSM approaches, such as principal component analysis (PCA), inverse least squares (ILS), principal component regression (PCR), and partial least squares (PLS), analyze patterns within large datasets to detect anomalies that may indicate faults [3]. Neural networks, consisting of layers of interconnected nodes, are trained to process inputs by synthesizing contributions from previous layers and generating signals through nonlinear transformations [4]. Advanced versions of these techniques have emerged in recent years, including nonlinear PCA based on NN, multiblock PLS, wavelet filtering followed by nonlinear reconstruction, recursive PLS, and PCA with signed digraphs, enhancing the robustness and precision of FD systems.
Quantitative methods, primarily model-based, use dynamic models to facilitate FD and isolate specific faults. These models, such as diagnostic observers, parameter estimation techniques, and Kalman filters, help generate estimators for both measured and unmeasured parameters, ultimately producing residuals that are used for FD in induction motors (IM) [5]. Qualitative methods, on the other hand, are often knowledge-based and rely on reasoning systems. Techniques include rule-based approaches, which use signed directed graphs to predict the effect of faults on various variables, fault trees that back-trace fault effects to probable causes (though limited in cause identification), and failure propagation networks, which model fault effects as they spread through machinery components using failure probabilities and propagation time digraphs [6]. The methods mentioned above represent a non-exhaustive list of techniques that can be used to produce some sort of signature useful for FD. In this regard, one of the most important signal-based approaches is the motor current signature analysis (MCSA). The MCSA is one of the methods specifically devoted to detecting electrical and mechanical faults in AC electric IM. An accurate diagnosis generally requires an adequate signal preprocessing of the stator current signals and their spectral analysis in the frequency domain, enabled to detect anomalies corresponding to specific electrical faults. Traditionally, fault detection for BRBs relies on the analysis of sideband harmonics around the fundamental supply frequency, 1 ± 2 s f s . This technique is related to the amplitude modulation (AM) of the stator current caused by rotor structure modification. The FFT technique is used to transform time-domain discrete data into the frequency domain to effectively analyze faults in the stator current [7].
The frequency spectrum of a signal is fundamental for diagnosing faults in electrical machines, often starting with the fast Fourier transform (FFT), which converts time-domain data into the frequency domain to analyze faults based on frequency and amplitude. However, FFT lacks time resolution, limiting its ability to capture transient, non-stationary signals. To address this, the short time Fourier transform (STFT) adds time-frequency analysis, providing better fault tracking over time. Despite this improvement, STFT’s fixed resolution struggles to differentiate broken rotor bar (BRB) harmonics from fundamental harmonics, particularly under varying load conditions [8]. The adaptive slope transform (AST) [9] further refines this by accurately monitoring BRB frequency components during induction motor startup, offering better isolation of the left-side Harmonic (LSH) in the time-frequency domain, although it still suffers from spectral leakage and limited frequency resolution. For higher accuracy, high-resolution techniques like multiple signal classification (MUSIC) and estimation of signal parameters via rotational invariance techniques (ESPRIT) provide enhanced resolution by isolating closely spaced frequencies, which is crucial for early BRB fault detection. However, these methods demand significant computational resources and highly accurate sensor data, especially for three-phase stator current analysis [7].
Typically, BRBFs are detected using stator current signals, while bearing failures are identified through vibration signals and specialized signal processing techniques. Demodulation techniques use BRB fault information to deliver one or multiphase stator current signals to convert the fundamental frequency to a DC component. In [10], the fault harmonics are represented exactly in their characteristic frequency by the Teager–Kaiser energy operator (TKEO) and third order energy operator (TOEO) approaches. The authors used this method to diagnose BRB faults in line-fed IM under stationary conditions. The limitation of TKEO is that the fault of the IM provided by control drive systems cannot be detected correctly due to the low fault frequencies of the main supply under low loads and slip; this is somewhat alleviated via TOEO. On the other hand, Hilbert envelope analysis, introduced in [11], offers an alternative to traditional vibration signals for fault detection by distinguishing between BRB and bearing fault harmonics, especially in the low-frequency spectrum, thereby reducing overlap with inner-race bearing fault components. During IM operation, various limitations, such as electromagnetic forces and environmental stressors, can lead to faults like eccentricity, BRB, and inter-turn short circuits. In IM drives with direct torque control, BRBs can also be detected using a combination of Artificial Neural Networks (ANN) and the Hilbert Transform (HT) [12]. The HT method extracts stator current data to identify high-frequency components associated with BRB faults, as well as low-frequency variations, improving fault detection accuracy. This approach enables both single and multiple BRB fault conditions to be assessed under dynamic operating conditions. The study suggests that HT, along with fast Fourier transform (FFT) and discrete wavelet transform (DWT), can effectively process stator current signals for BRB fault detection, allowing for comprehensive monitoring across both healthy and faulty states in IMs [13].
The wavelet transform (WT) techniques can be helpful as well to extract fault features that match failure symptoms using time-frequency analysis methods [14]. In particular, DWT, which decomposes a signal into different frequency components, allowing analysis of both frequency and time information, is quite instrumental for detecting changes or irregularities in signals. This strategy has proven to be quite useful in BRB FDs [15]. In [16], DWT is suggested for both transient and steady circumstances identification and severity estimation of broken bars. Even though many academics have been working on BRB diagnosis for many years, there are still significant challenges in diagnosing broken bars and determining specific sub-bands with limited bandwidth without the presence of other flaws [17].
Over the past few decades, AI has become a powerful tool for detecting faults in IMs and is recognized for its high accuracy in diagnostics. AI-based methods can indicate fault severity and improve overall detection accuracy. For example, ref. [18] investigated two commonly used AI techniques, artificial neural networks (ANN) and support vector machines (SVM), for diagnosing broken rotor bar faults (BRBF) in IMs. Both techniques use supervised learning algorithms, but to effectively train an AI-based system, critical BRB features must be provided. As part of this research, an advanced IM model was developed using a magnetically coupled multiple circuits (MCMC) technique, selecting key BRB feature components from simulated motor current and speed data to enhance BRB detection accuracy and quantification of fault severity [18].
Another type of classification technique is based on support vector machines (SVMs) [19]. Such a cutting-edge machine learning technique is currently widely used to solve various real-world issues, including machine condition monitoring belonging to the kernel-based algorithm family. A kernel is a mapping function that converts linearly inseparable data into a high-dimensional feature space where the data can be separated linearly. This technique enhances the learning process aimed at the IM fault diagnosis. However, in [20], ANNs generally demonstrated higher accuracy in BRBF detection compared to SVM.
Moreover, condition monitoring for IMs involves steps such as feature extraction, data gathering, fault identification using machine learning algorithms, and predictive analysis. Feature extraction is especially critical for classical AI models, as it enables these models to identify and focus on the most relevant signal characteristics, improving diagnostic accuracy. The authors of [21] proposed a classification strategy that incorporates data mining and an evolutionary algorithm, developing an AI-based technique that uses component vectors as inputs for fault identification. Timely detection of BRB faults is essential to avoid significant machine damage, as bar splits can seriously impact IM integrity. According to [22], a hybrid wavelet-SVM classifier detects BRB in IM considering the system’s higher harmonics. Enhancing the algorithm reliability, the overlapping frequencies generated due to BRBs can be discriminated by cleaning them at a very early stage.
Convolutional neural networks (CNNs), which are commonly used in the image processing field, have also penetrated the area of FD of rotating machines. Their ability to perform feature extraction within hidden layers has now eliminated the need for some common feature extraction techniques. In [23], the states in each layer of convolutional neural networks are organized according to a spatial grid pattern. Since each feature value is confined to a narrow location in the previous layer, these spatial associations are passed down from one layer to the next. Therefore, the convolution operation and the transformation to the next layer are heavily dependent on learning more intricate patterns within the stack layers of convolutions together. It is critical to maintain these spatial correlations among the grid cells. Moreover, the CNN works similarly to a standard feed-forward neural network, except that the operations in its levels are spatially structured and the connections between the layers are few (and carefully planned). Convolution, pooling, and rectified linear unit (ReLU) layers are the three types of layers that are usually seen in CNNs [24]. As shown in [25], the shallow convolutional neural network (SCNN) requires fewer trainable parameters, provides high accuracy and sensitivity, and is computationally efficient during real-time recall. What is more, SCNN also yields probabilities without any additional calculations, and its computational complexity is linear during the recall phase (when the samples are categorized in real-time).
Transfer learning (TL) has also been used to improve the deep neural network training process for fault diagnosis in IMs [26]. The pretrained model presented in [27] provides the lower-level weights for the target neural network, while the higher-level weights are fine-tuned for the specific fault diagnosis task. In this approach, the TL provides an appropriate initialization for the target model and decreases the number of parameters that must be adjusted. As a result, TL significantly enhances the deep neural network training process.

1.2. Summary of Open Problems and Paper Objective

Diagnosing BRB faults in IMs remains a significant challenge, especially under varying operating conditions and in motors with high rotor bar counts. Traditional fault detection methods that rely on current signatures face limitations when applied to variable-speed drives because current harmonics can interfere with detection; low load and low slip conditions further complicate this process, as fault frequency components are often masked by the power supply frequency, and the large amplitude of normal signals can obscure early-stage faults [10,11,12]. Techniques like the TKEO struggle under low-frequency conditions [10], and distinguishing specific sub-bands with limited bandwidth, particularly in the absence of other faults, is an ongoing challenge [10], making timely fault detection critical to prevent severe machine damage and costly repairs. While advanced MCSA techniques show promise, they often miss immediate detection of BRB faults due to reliance on frequency-domain data alone, which can be insufficient for early diagnosis [28]; neural networks (NNs), despite their potential, are resource-intensive, require extensive datasets, which are often limited, and demand significant preprocessing, slowing down deployment [21]. Moreover, using too many features in classification models, often derived from standard time-frequency representations (TFRs), risks reducing classification performance by smoothing relevant signal characteristics [28], and identifying specific parametric features associated with BRBs remains complex due to variations in rotor resistance and inductance related to rotor position [29].
AI and ML technologies offer promising solutions by enabling more sophisticated, adaptive fault detection methods [7]: AI-driven models can learn patterns in large and diverse datasets, making them effective in distinguishing subtle fault signatures under varying load and slip conditions; deep learning methods like CNNs and recurrent neural networks (RNNs) can automatically identify key features in time-series data, which is particularly useful when current harmonics complicate traditional fault detection; transfer learning techniques can reduce dependency on large training datasets by leveraging pre-trained models for faster deployment in fault diagnosis; and hybrid AI models that integrate techniques like HT or WTwith NNs enhance detection capabilities by analyzing both the time and frequency domains, enabling a comprehensive approach to fault identification, thereby addressing issues related to feature extraction, computational complexity, and real-time processing, and becoming instrumental in advancing reliable, efficient BRB fault detection in IMs.
This study introduces a comparative diagnostic approach for identifying BRB faults in IMs under variable load and operational conditions. Unlike traditional methods, which often rely heavily on frequency-domain analyses, our approach leverages linear and non-linear dimensionality reduction techniques alongside advanced classification models, including long short-term memory (LSTM) and shallow dense neural networks (SDNN). This combination enables enhanced classification accuracy, particularly in conditions where traditional methods are challenged by low-slip or variable load scenarios. This paper investigates various levels of BRB faults (1.5, 2, 2.5, and 3 BRBs) IM, encompassing both partial and complete perforations applied experimentally to the rotor bars to represent different fault severity levels. Timely detection of BRB faults is important as they can cause significant damage to the IM and result in financial losses and production delays. The fault component is often difficult to detect due to its large amplitude, and faults at the early stages are often missed [30]. Causes of BRB faults include residual stresses from fatigued parts and loose laminations, dynamic stresses from voltage fluctuations and pulsating mechanical loads, environmental stresses from moisture exposure and abrasive wear on the rotor material, magnetic stresses from vibrations and electromagnetic forces, and overload that can cause overheating of the rotor cage [31]. Moreover, experimentation for healthy and faulty (BRBs) with a grid connected 1.1 kW squirrel cage IM is considered for analysis.
This paper is organized as follows: Section 2 outlines the general methodology for BRB fault classification and provides details on the experimental test rig. Section 3 presents the results and discussion, and Section 4 concludes the study.

2. Materials and Methods
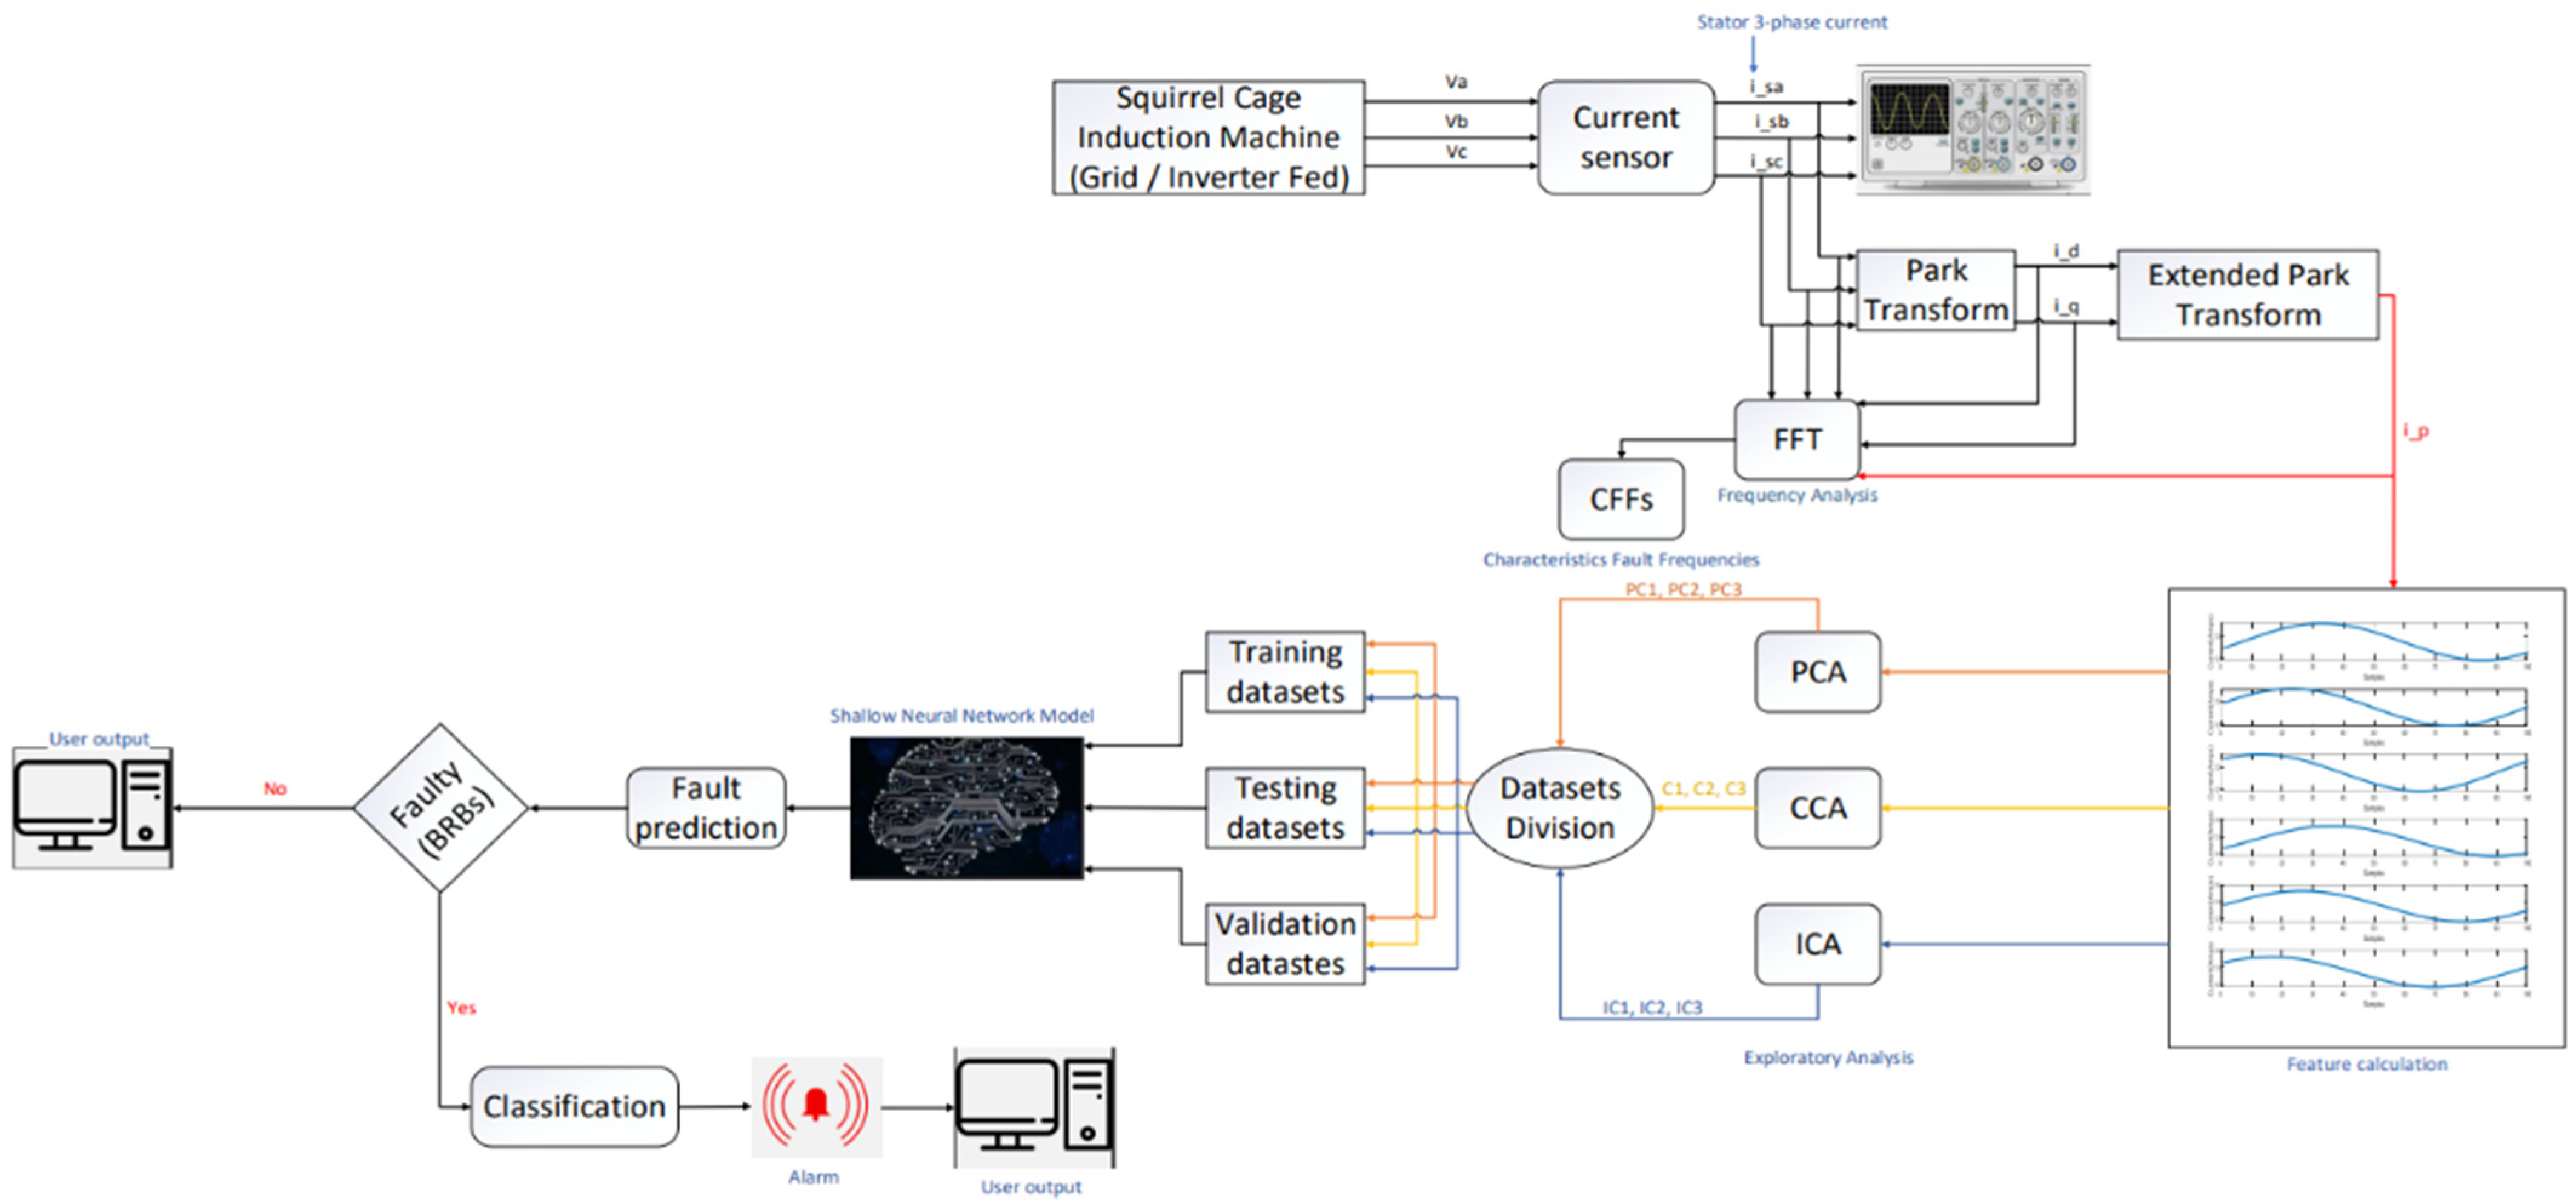
2.1. Methodology

This section lists the systematic approach for successfully performing the detection and severity analysis for BRBFs that is summarized in Figure 1:
(a)
Problem Definition (BRBs): One of the most common IM faults is the broken rotor bar fault. If not detected in a timely manner, this fault can cause significant financial losses and production delays for industries. According to statistics presented in [32], BRB faults contribute to 8–9% of IM faults. Therefore, early identification and precise determination of this fault is crucial to prevent such setbacks.
(b)
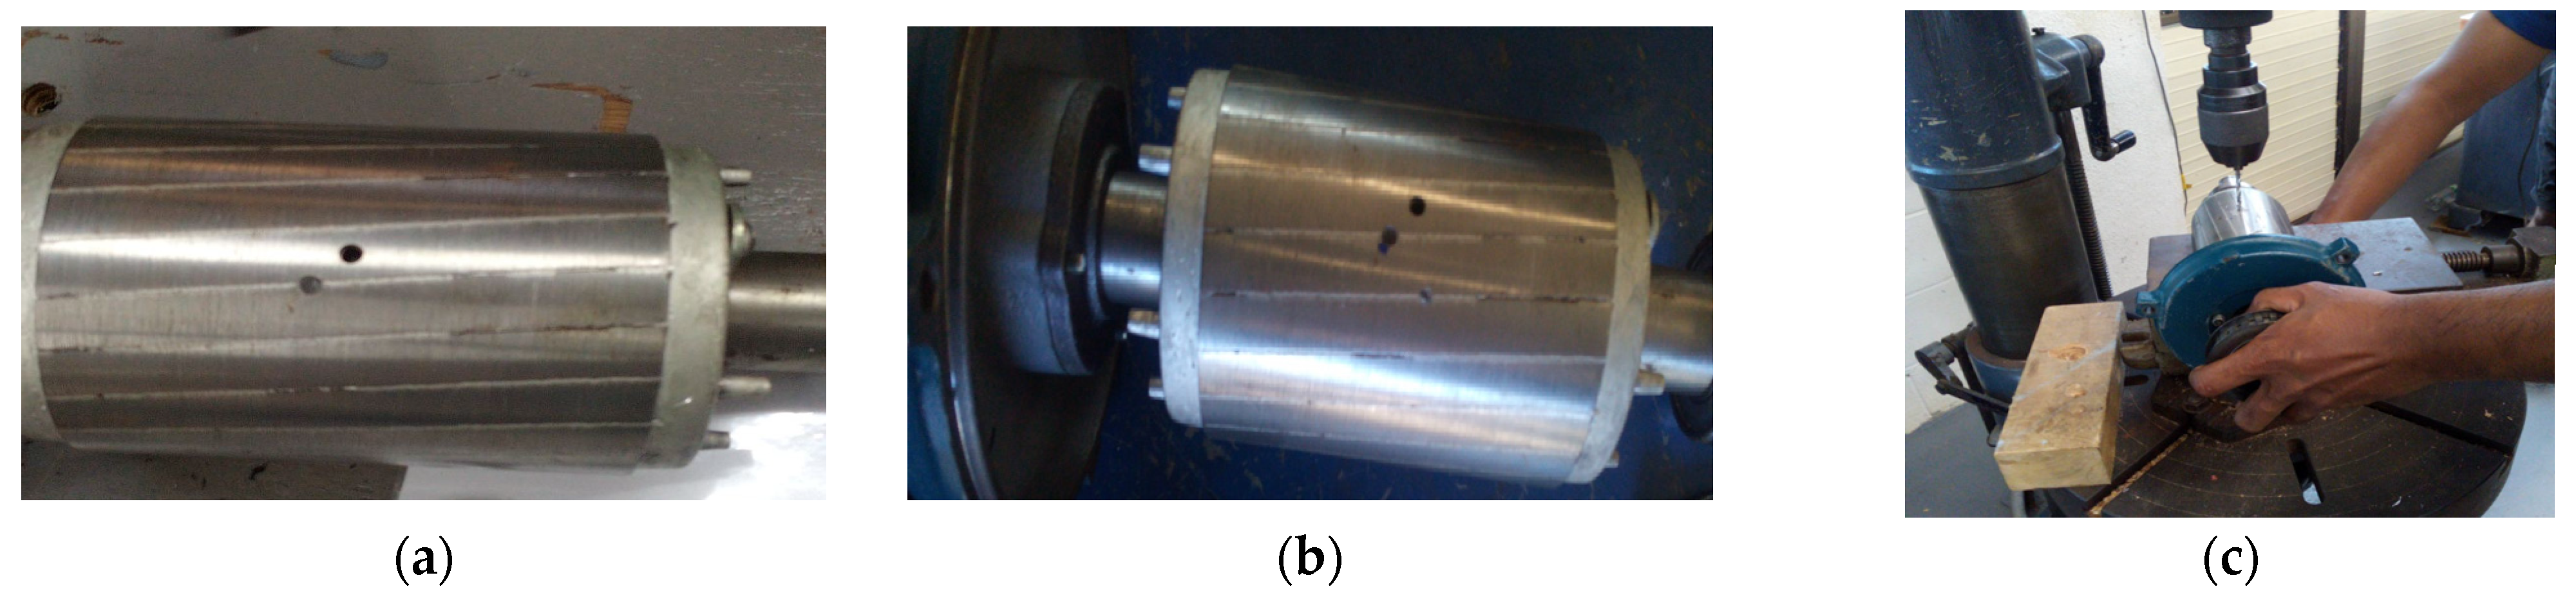
Fault generation: Experimentation on BRBs was performed with a grid-connected three-phase faulty IM. To induce a fault on the IM, holes were drilled into the rotor bar to determine the fault severity. The motor was then run under the specified configuration, and the corresponding current signatures were recorded. Severity levels created included 1.5 BRBs, 2 BRBs, 2.5 BRBs, and 3 BRBs.
(c)
Data acquisition: Three current sensors were used to display the three-phase current signatures on an oscilloscope and then stored on a hard drive. The stator-current signal was acquired at a sampling frequency of 250 Hz, selected to ensure an efficient balance between data volume and computational demands for the proposed machine learning model training. Multiple trials were conducted for each test scenario, with 10 s of data collected per trial, yielding a robust dataset for analysis. This sampling rate was found to be sufficient for capturing the fundamental frequency and primary CFFs associated with BRB faults. While a higher sampling frequency may have improved the resolution of fault indicators, especially for higher-order harmonics, the current sampling rate proved to be effective for the intended quick-detection application and avoided computational delays during processing of the signals.
(d)
Data Handling: Stator current signals were processed through several data handling steps to ensure high-quality input for feature extraction and classification. First, the signals were segmented into fixed-length frames, allowing for efficient feature extraction from discrete intervals. Normalization was then applied to each frame to maintain consistent amplitude across samples, which enhanced model accuracy by reducing variance due to signal amplitude changes. This preprocessing pipeline effectively prepared the data for dimensionality reduction and classification, ensuring that fault-specific characteristics were accurately captured and used in the diagnostic model.
(e)
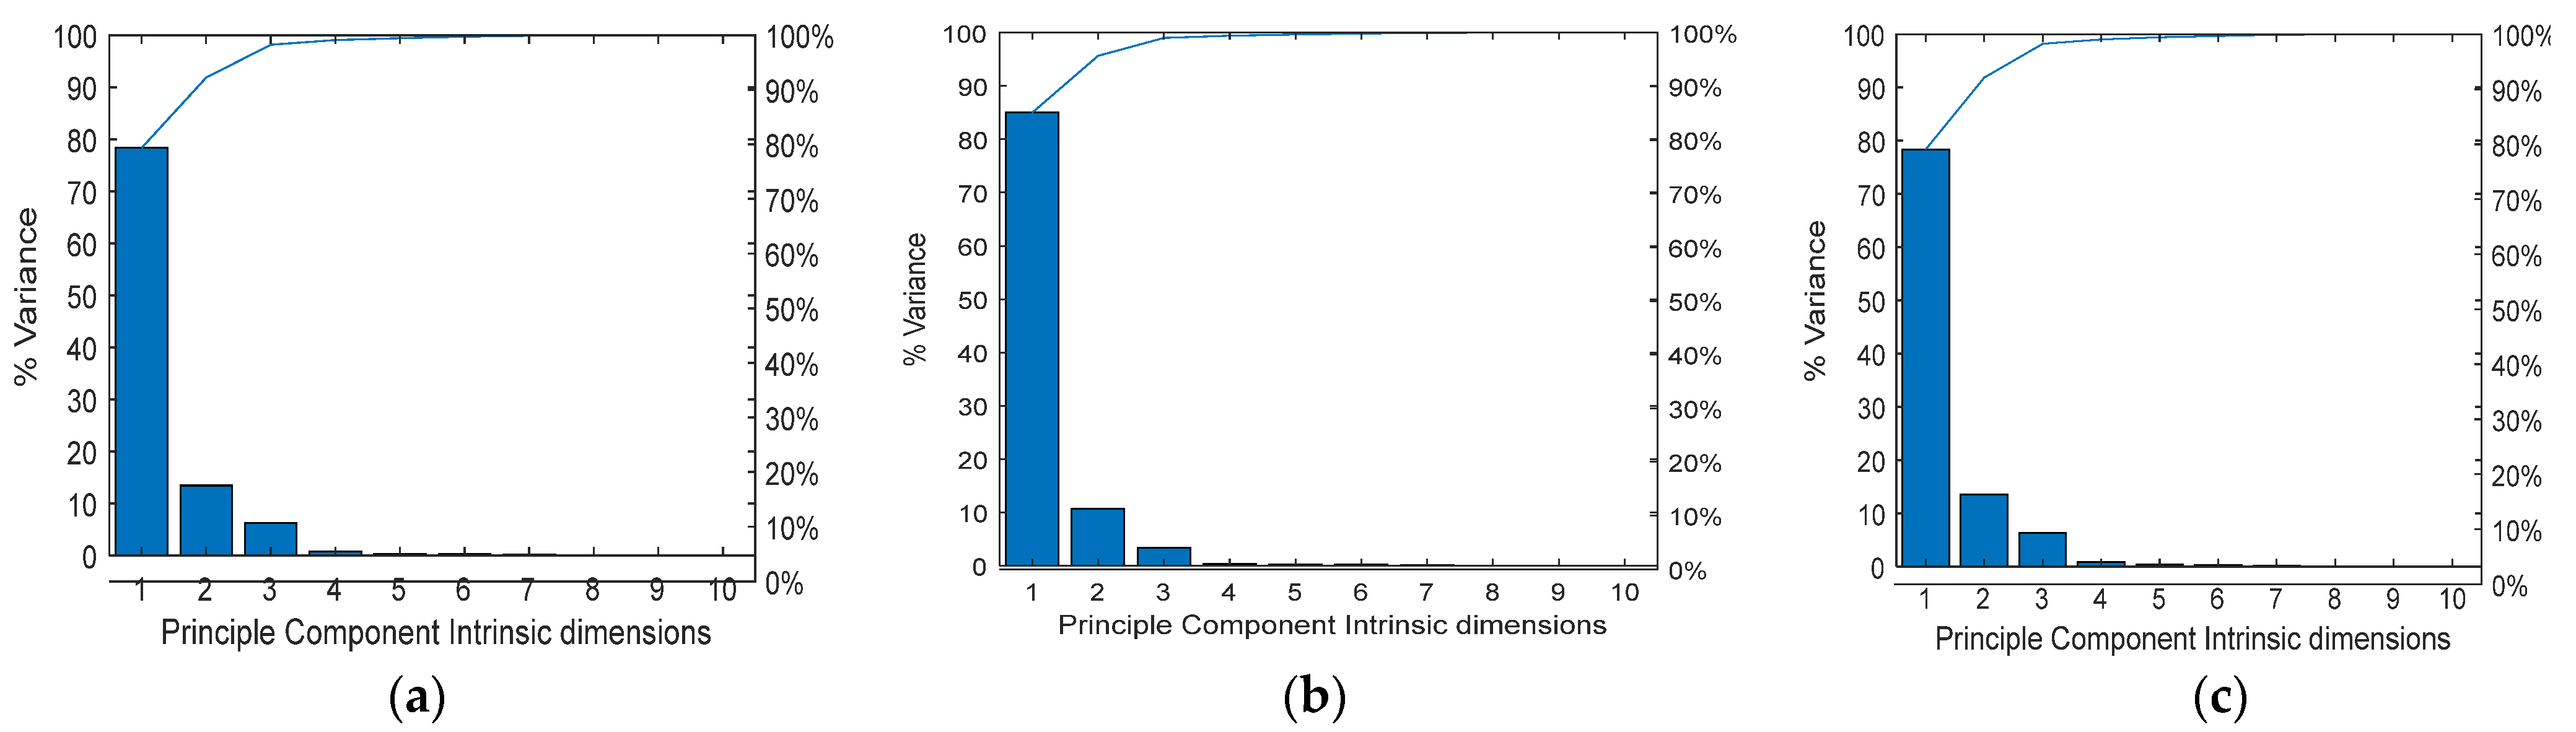
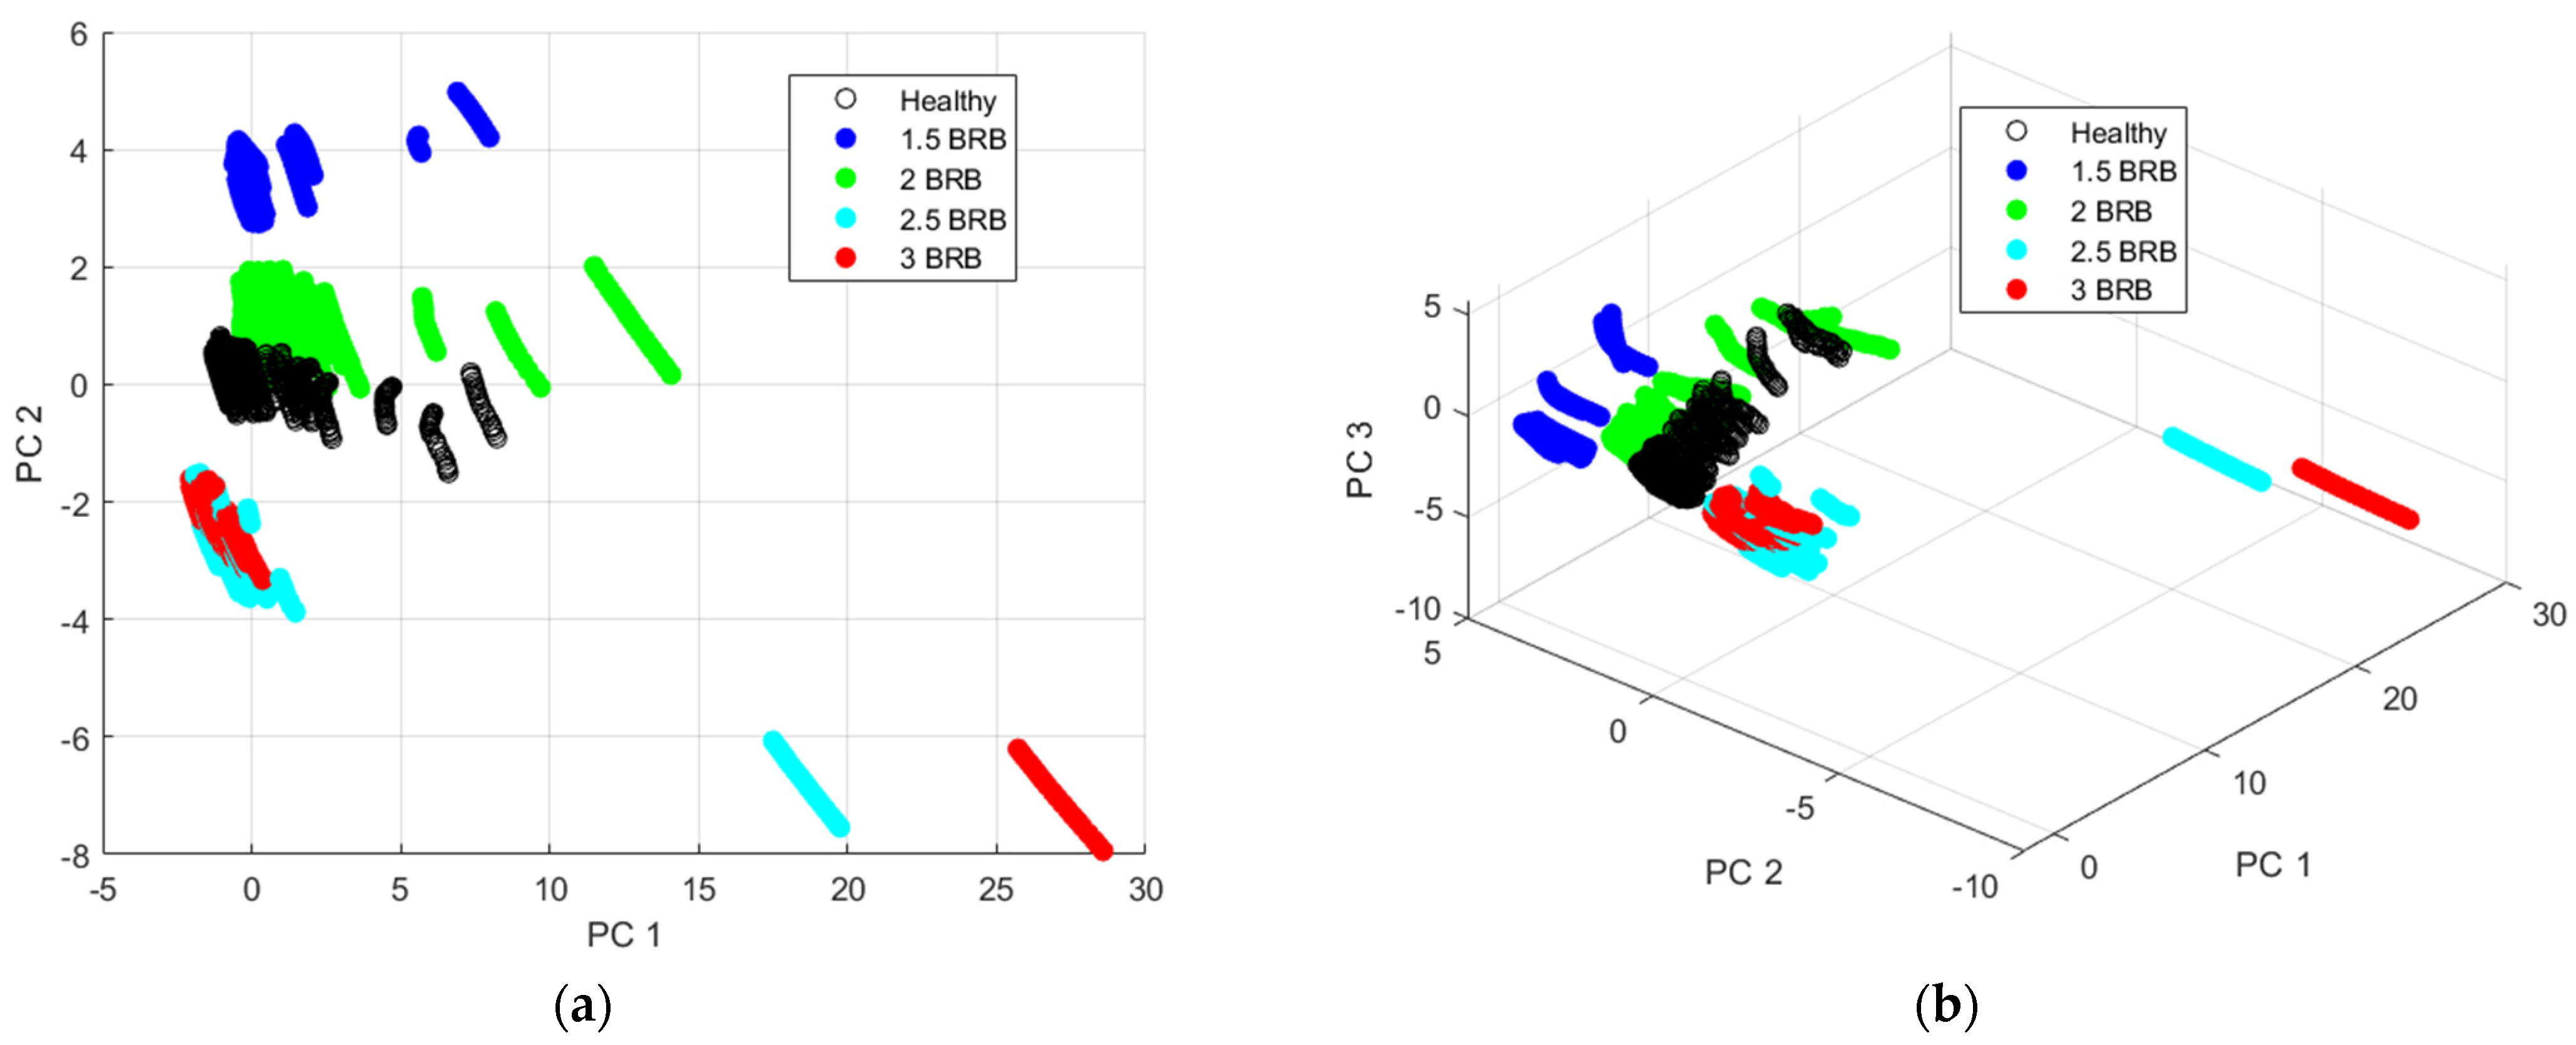
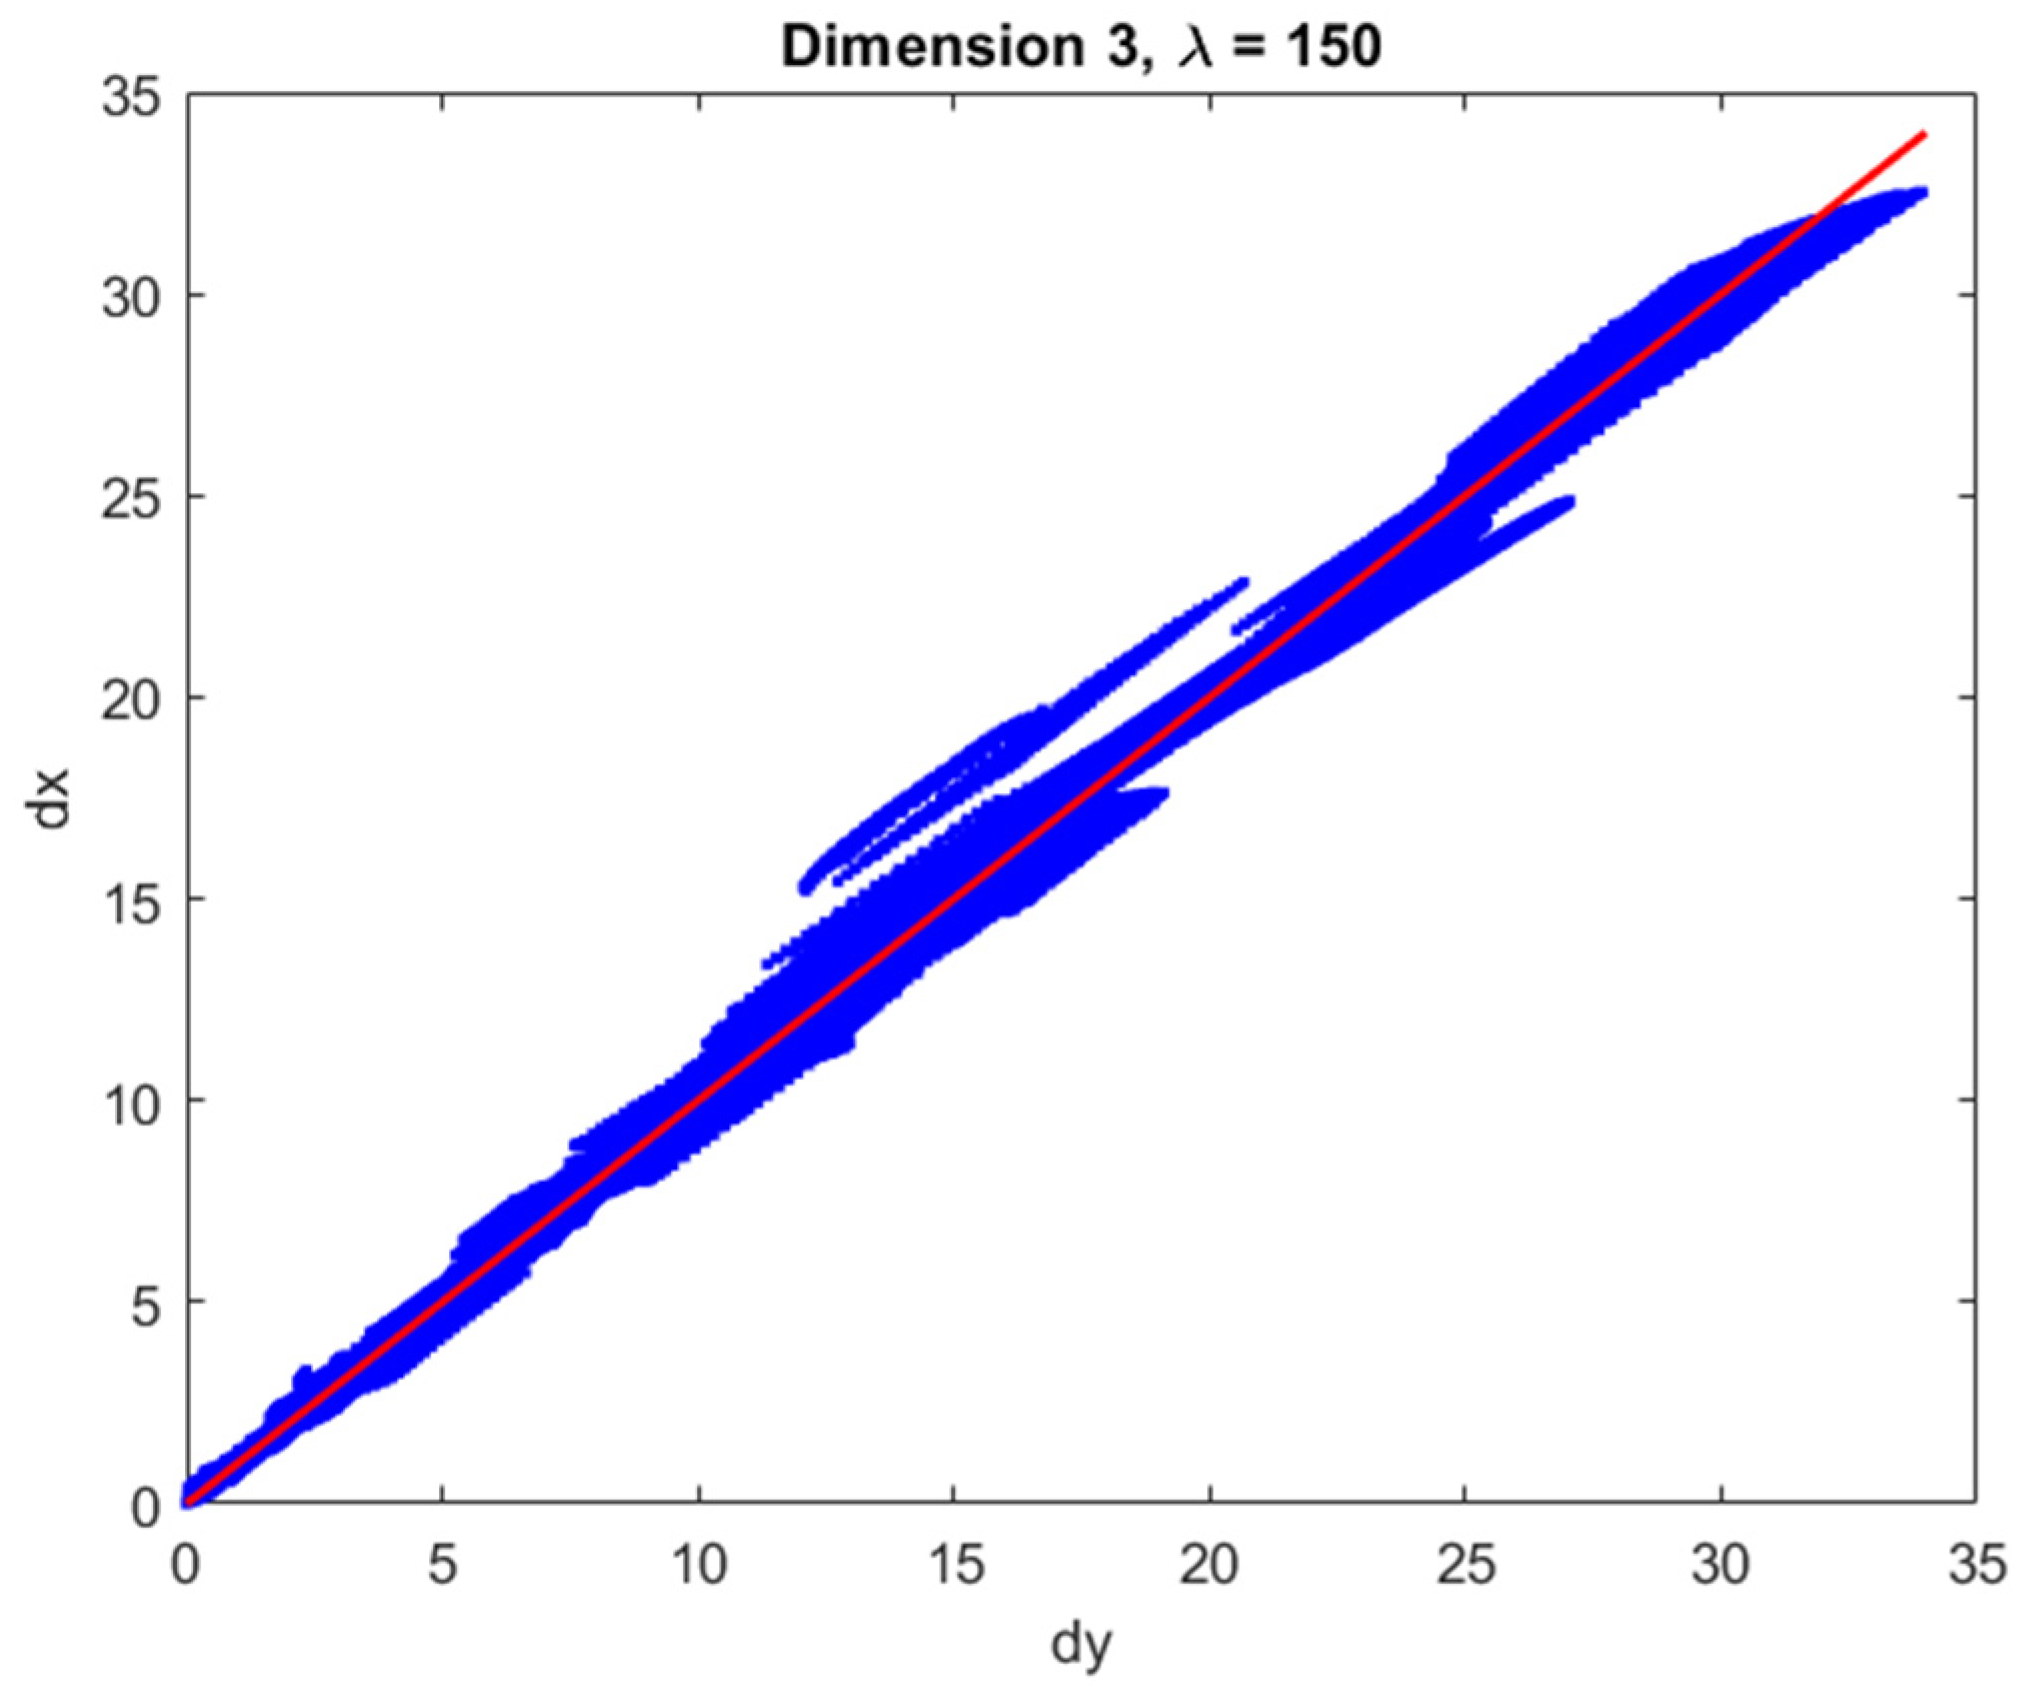
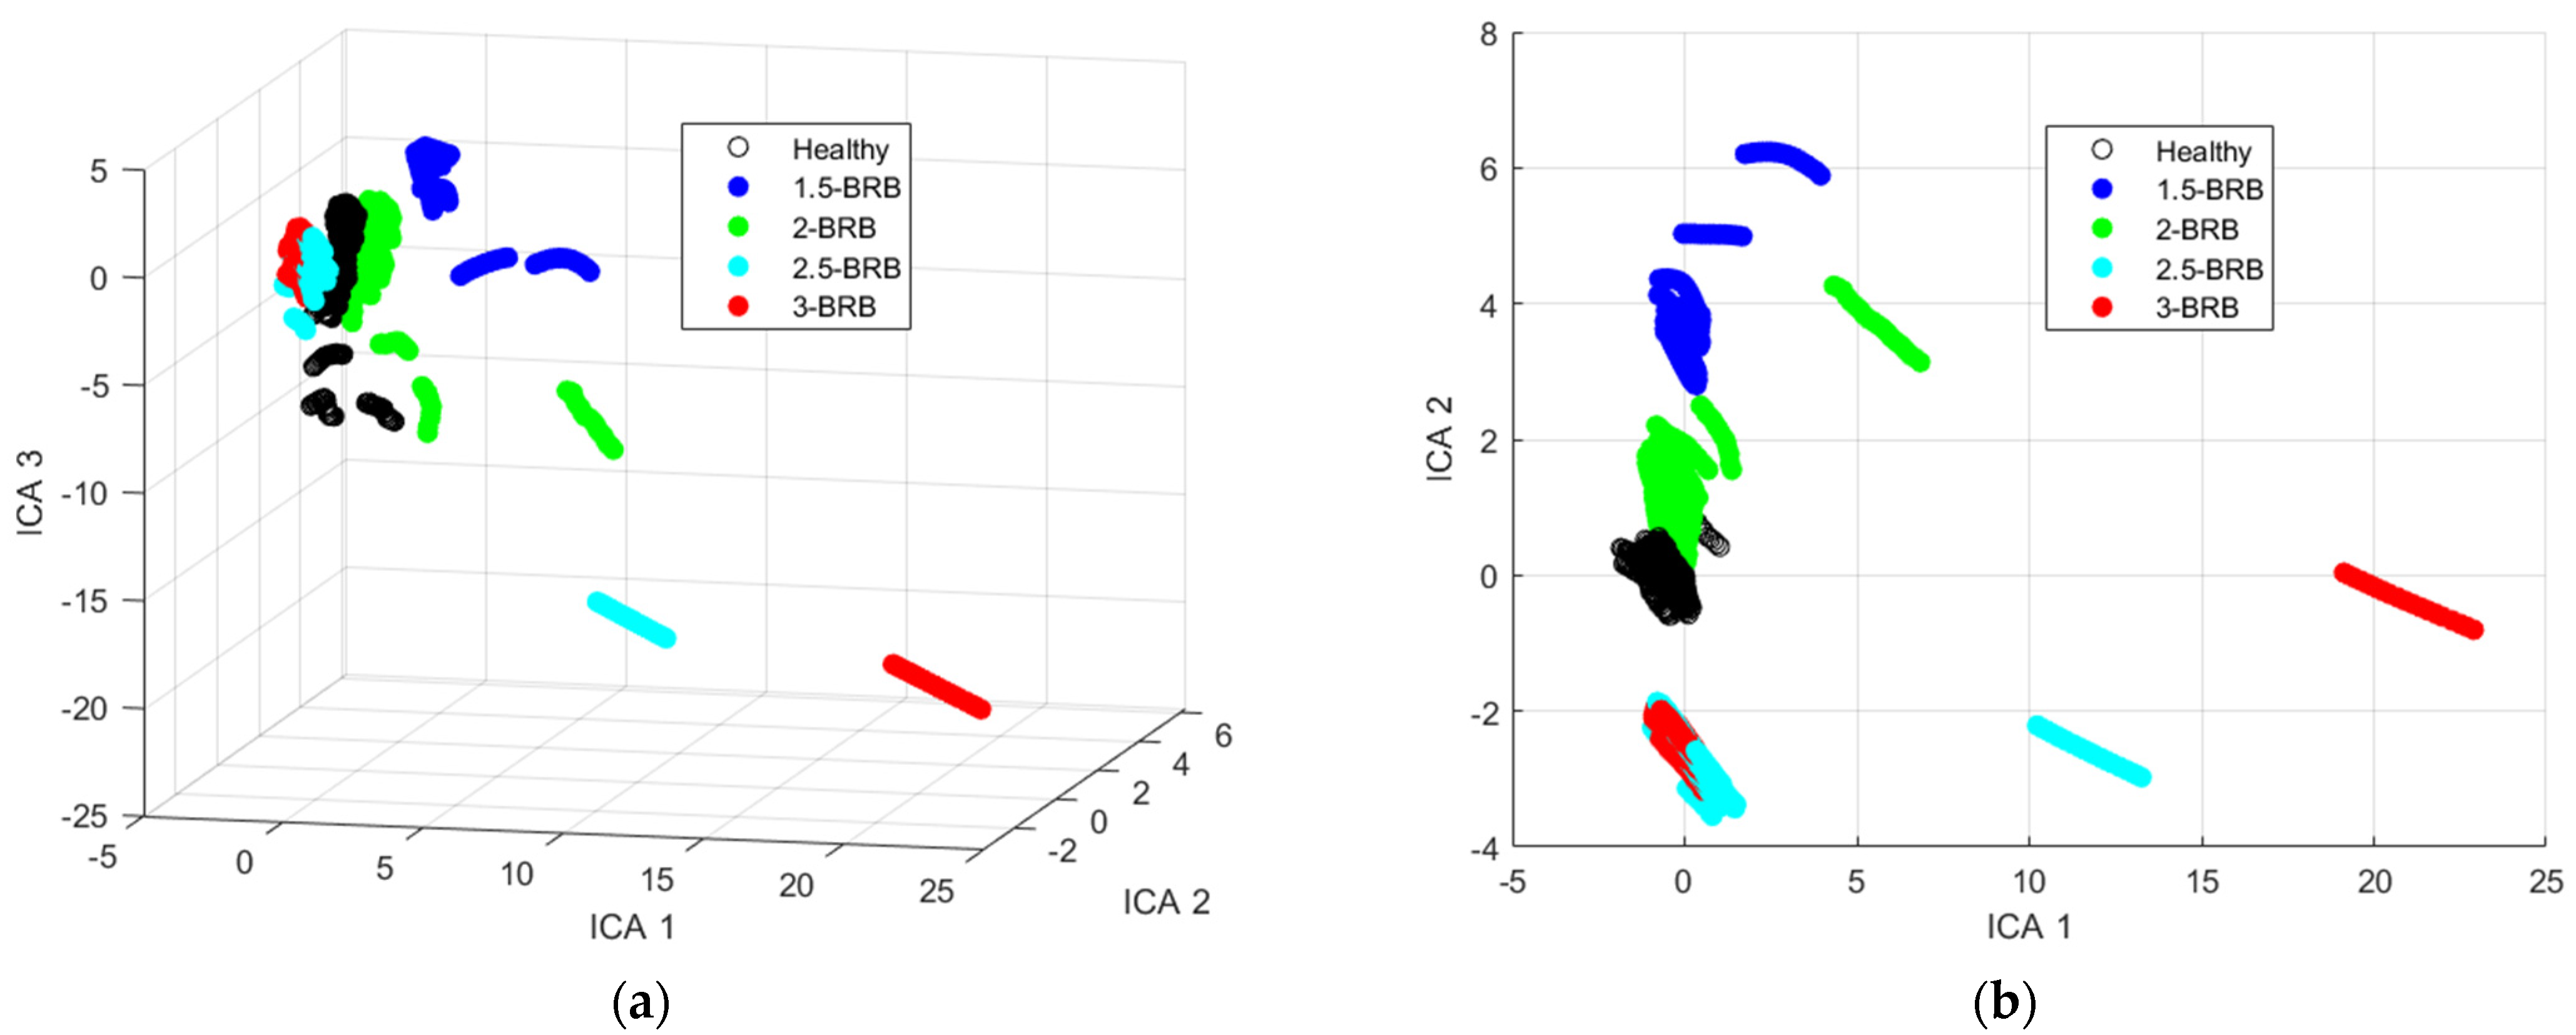
Exploratory analysis of data: From the raw data, Parks and extended Parks quantity were calculated, followed by the calculation of the fifteen statistical time-domain features. The data were analyzed using frequency analysis by performing the FFT technique to view the CFFs. The data were further analyzed using exploratory analysis tools like PCA, CCA, and ICA.
(f)
Model development and training: After going through the exploratory analysis of data, neural and non-neural-based models were designed using MATLAB® software (r2021b). Feature inputs included fifteen time-domain statistical features and transformed PCA, CCA, and ICA features. Standard procedures for partitioning the dataset into training, validation, and test sets were adopted.
(g)
Classification of test dataset: Using the test-sets (full features and reduced feature-sets), neural network models, and a few non-neural techniques like decision trees, SVM, and ensemble bagged trees, the BRB faults were analyzed. Furthermore, the accuracies were compared for performance evaluation.
Figure 1. Flowchart of the proposed methodology for broken rotor bar fault diagnosis in IM.
Machines 12 00890 g001

2.2. Experimental Test Rig

Figure 2 presents the hardware setup for the IM fault diagnosis of healthy and faulty (four classes) motors with a grid-fed system. A 1.1 kW rated IM with a star winding connection and a squirrel cage rotor was used to acquire data. The parameters of the IM are stated in Table 1.
In this study, a combination of perforations was implemented in the IM rotor to simulate BRB faults under both direct and complex fault conditions. Specifically, two perforations were made directly through the rotor bars, while an additional perforation was positioned between adjacent rotor bars. The primary goal of perforations directly on the rotor bars was to replicate the physical breakdown of rotor bars, resulting in an interruption to the current paths, which in turn leads to rotor magnetic field asymmetry. This asymmetry is the principal driver of modulated current components in the stator, which manifest as sidebands at frequencies 1 ± 2 s f s for i d ,     i q and at 2 s f s for the EPV current, i P . These harmonics are a critical diagnostic feature used to detect BRB faults and assess fault severity.
Additionally, it is recognized that rotor faults in practical applications often originate in a more distributed manner, rather than occurring exclusively at the rotor bars themselves. Real-world rotor faults can arise from a variety of factors, such as localized overheating, mechanical fatigue, or manufacturing defects, which might lead to damage that spans beyond the rotor bar to include areas between bars. To account for such non-ideal, practical fault scenarios, an additional perforation was made in the space between rotor bars. This perforation aimed to represent the influence of altered magnetic reluctance in the rotor core, adding complexity to the magnetic flux paths and contributing to the electromagnetic characteristics of the rotor. This approach allowed the analysis to extend beyond idealized faults, offering insights into the dynamic effects of distributed rotor damage.
The combination of direct rotor bar perforations and the inter-bar perforation allowed for a more holistic understanding of the electromagnetic impact of rotor faults. The results demonstrate the presence of the expected sideband frequencies, even under varying load conditions, thus validating the robustness of the fault simulation approach. By capturing both direct electromagnetic disturbances and effects resulting from altered magnetic reluctance, the experimental method effectively replicates real-world fault conditions that are typically observed in operating IMs.
It should be noted that stator current signatures were obtained at varying loads (0%, 21%, and 42%) under healthy and faulty conditions. The faulty IM classes were: 1.5 BRBs, 2 BRBs, 2.5 BRBs, and 3 BRBs. The minimum damage level was set at 1.5 BRBs due to limitations in detectable signal changes for lower damage levels. Preliminary testing showed that 1 BRB did not yield distinct signal characteristics with the current feature extraction and classification methods. Thus, 1.5 BRB was selected as the baseline for effective model training and classification. The data for healthy and faulty scenarios at each load condition were acquired at a sampling rate of 250 Hz over five trials, with each trial lasting 10 s.
For the partial perforations made to the rotor bar, approximately 3 mm was drilled using a CNC milling machine, while for the full perforations, the rotor bar was drilled approximately 6 mm deep. Figure 3 shows the different severity levels (Figure 3a,b) and the fault generation (Figure 3c) of the rotor bars, which indicate BRB fault conditions. Throughout the experimentation on both healthy and faulty motors, three-phase stator currents were obtained using current sensors connected to an oscilloscope and later saved to a hard drive, as shown in Figure 2.

3. Results and Discussion

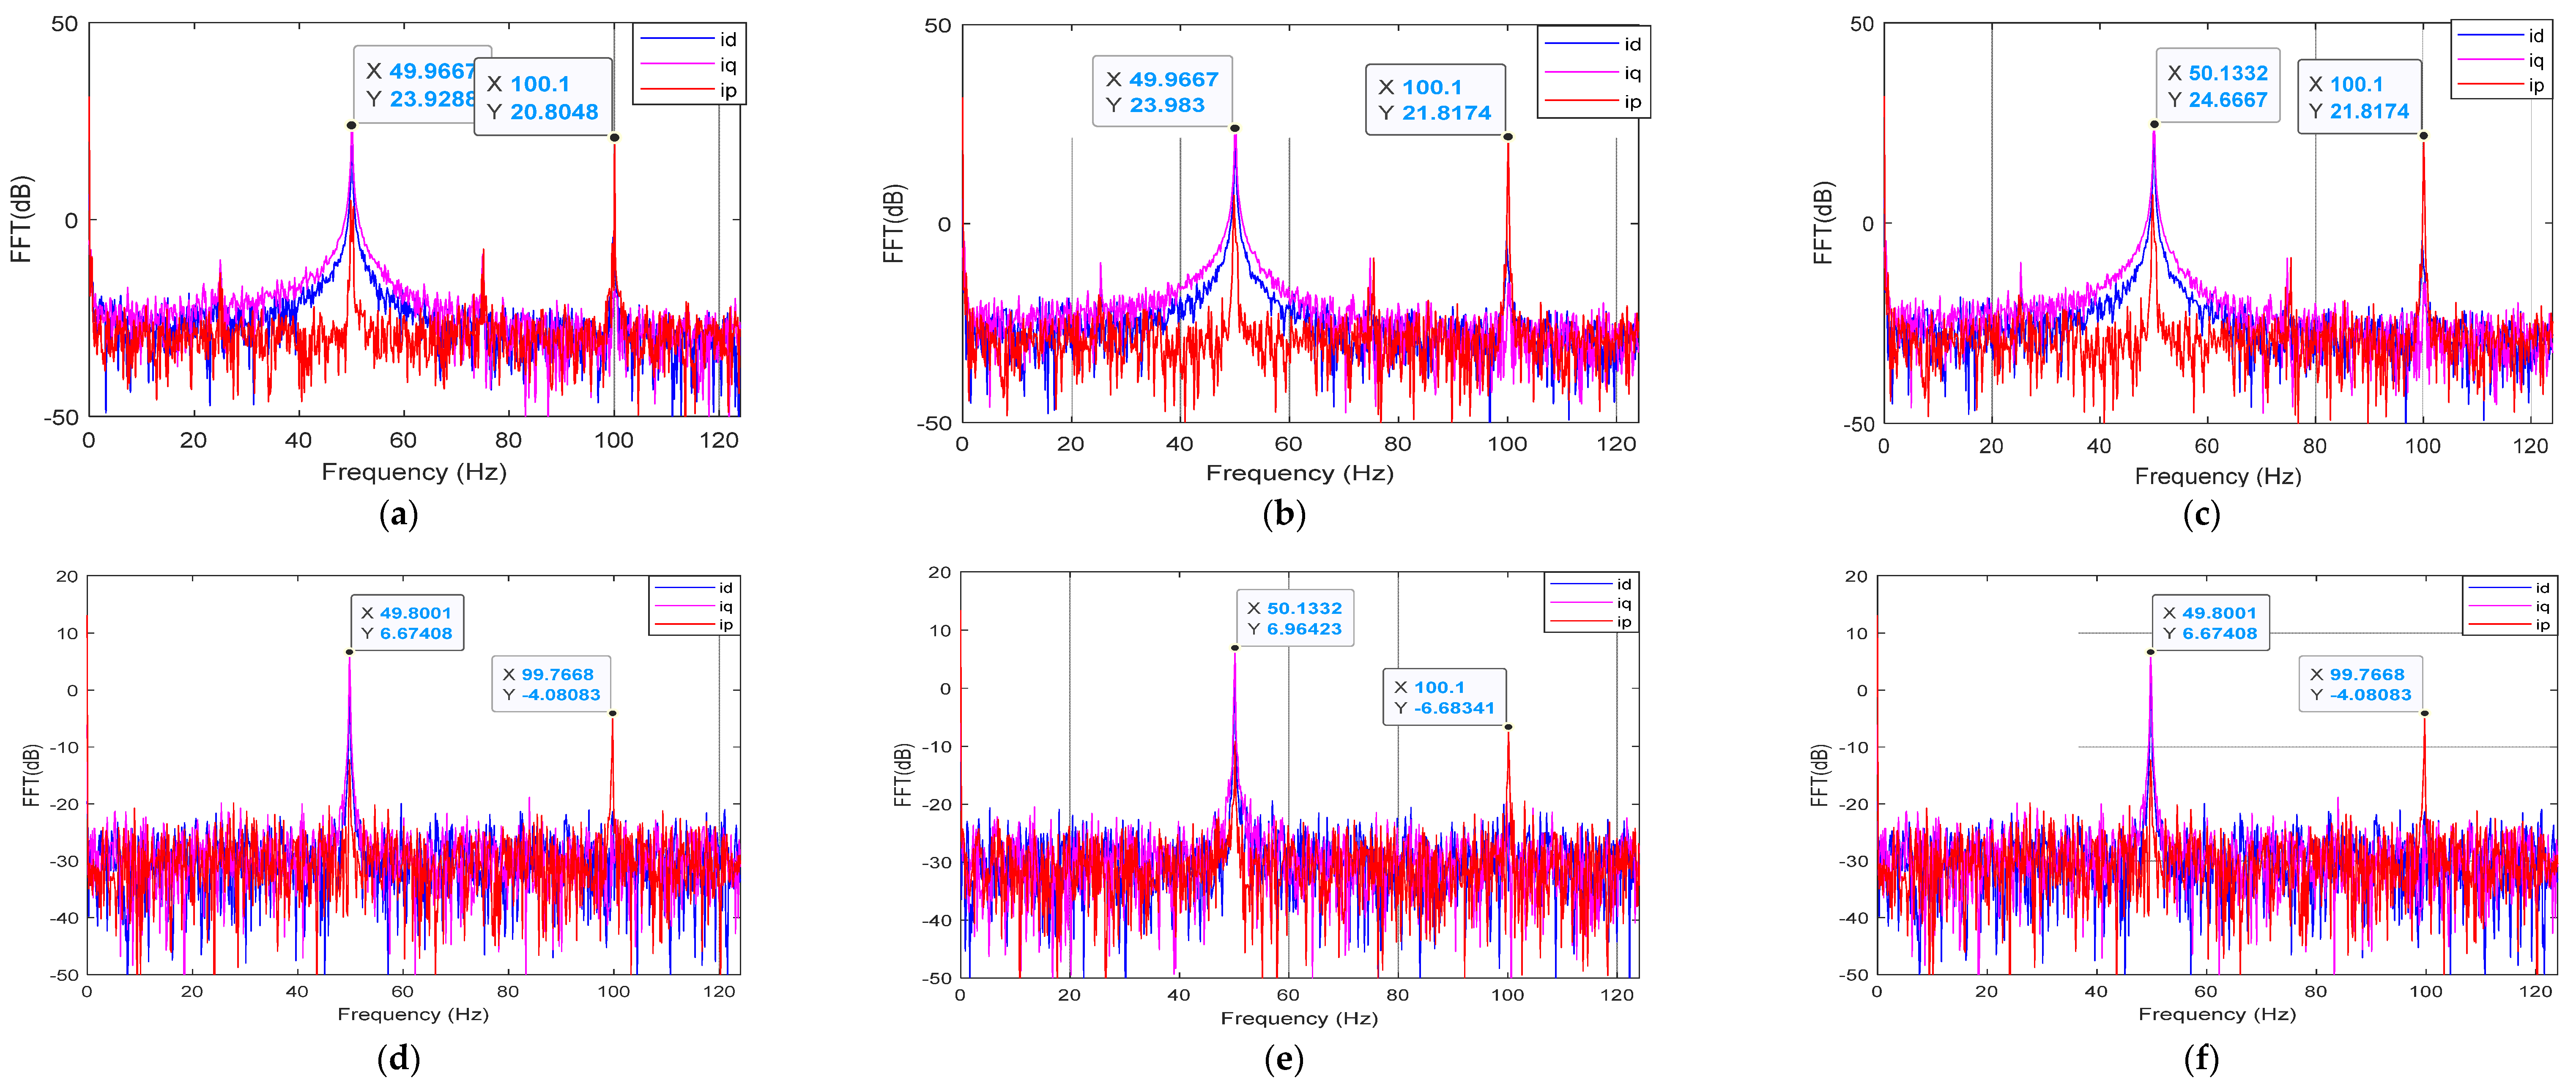
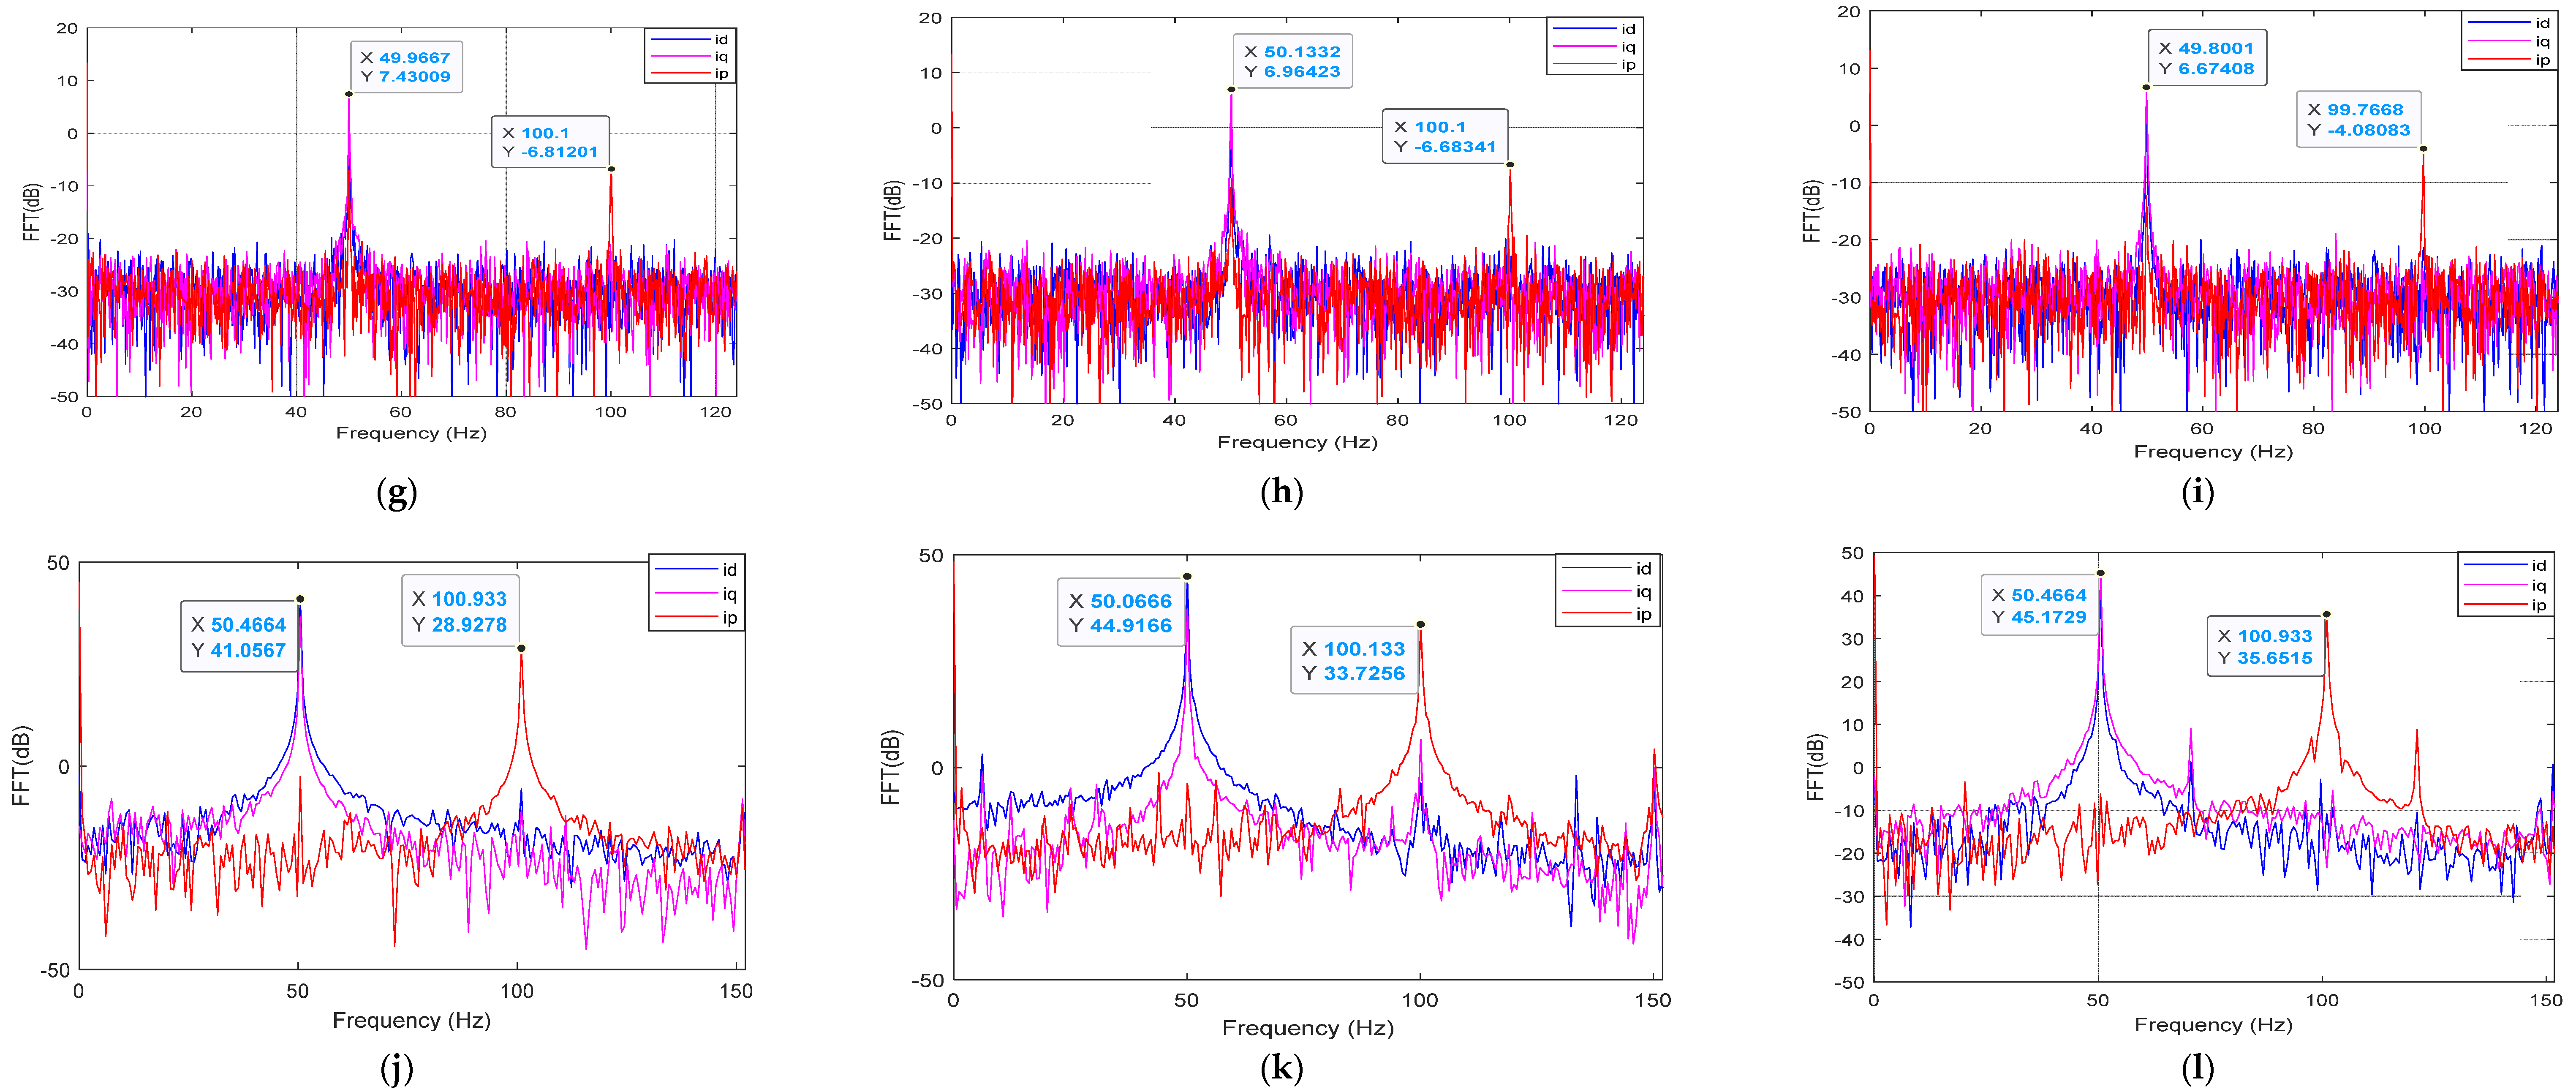
3.1. Frequency Analysis: Fast Fourier Transform

The FFT is a frequency analysis approach used to determine faults in an IM. It transforms time-domain signals into frequency-domain signals. The three-phase current signals were extracted and simulated using the FFT function, and the CFFs for the IM were determined using the formula 1 ± 2 s f s . The FFT plots were compared and discussed. Additionally, FFT was tested for different slips as shown in Equation (1), which is the difference between the synchronous speed w s y n and rotor speed ( w r ) . The CFFs components for the BRBs (1.5 BRBs, 2 BRBs, 2.5 BRBs, and 3 BRBs) IM were calculated using Equation (1) below.
f B R B = f s   1 ± 2 k s

3.1.1. Faulty IM: Different Severity Levels at Different Load Conditions

The presence of frequencies associated with BRBs at varying loading conditions (0%, 21%, and 42%) is shown in Figure 4. By extracting the three-phase current ( i s a ,   i s b ,   a n d   i s c ), the faulty IM at various severity levels (1.5 BRBs, 2 BRBs, 2.5 BRBs, and 3 BRBs) was analyzed using FFT, while varying the load condition for the grid-connected system.
As the load increased, distinct sideband frequencies around the fundamental frequency—indicative of BRB faults—became progressively more prominent. In Figure 4a (no load), sidebands are either absent or have low amplitudes, reflecting the challenge of detecting faults under low-slip conditions where fault indicators are less pronounced. At 21% load (Figure 4b), sideband frequencies emerged more clearly, and their moderate amplitude increase suggested the onset of detectable fault characteristics. By 42% load (Figure 4c), sidebands were highly pronounced with significantly increased amplitude, indicating a strong BRB fault signature due to the higher slip associated with increased load. This progression enhances the load dependency of BRB fault detection, i.e., higher loads enhance both the visibility and amplitude of fault-related sidebands, making fault characteristics more distinct and less susceptible to noise interference. Thus, Figure 4a–c demonstrate that BRB fault detection is most effective under higher loads, where increased slip produces clearer diagnostic indicators in the frequency spectrum. As such, for cases where low loads and high level of noise are concerned, the proposed strategy (feature extraction via statistical time features + PCA + neural network) that utilizes the temporal characteristics of the signal could be instrumental in generating significant features for the machine learning models to detect BRBFs.
Moreover, the rotor slot count significantly affects the manifestation of BRB faults, as it directly influences the harmonic content in the stator current signals. In motors with a lower slot count, such as this one, certain fault-related sideband frequencies may appear more prominently due to the interactions between the rotor’s magnetic field and the slot harmonics. Specifically, the number of slots determines the spacing and intensity of the sideband frequencies around the fundamental supply frequency, which are key indicators of BRB fault. For motors with higher rotor slot counts, fault-related harmonics may distribute differently, potentially making early-stage BRB detection more challenging, as fault-specific harmonics can be masked by other frequency components. The slot count also impacts the amplitude of specific sideband frequencies, particularly those related to the f s   1 ± 2 s component. In this study, the 28-slot configuration has been found to provide clear differentiation in fault versus no-fault conditions.

3.1.2. Park’s and Extended Park Quantity–Frequency Spectrum

The EPVA is one of the most accurate approaches used to identify faults in an IM. The EPVA method works by converting the three-phase currents ( i s a ,   i s b ,   a n d   i s c ) into direct and quadrature axes i d ,   i q and finding the modulus of i d + j i q   i P as follows [28]:
i d = 2 3 i s a 1 6 i s b 1 6 i s c
i q = 1 2 i s b 1 2 i s c
i P = i d + j i q
IMs with BRB faults generate harmonic components in the right and left sidebands of the fundamental frequency. The CFFs for i d and i q currents are observed at 1 ± 2 k s f s . For the EPV i P , the CFFs are observed at 2 s f s , and its dominant peak is observed at 2 f s . By using the above equations, the data gathered (three-phase current signatures) were transformed into the direct and quadrature axes i d , i q , finding the norm of Equations (2) and (4) to obtain the EPV current ( i P ) components. Using these components, the FFT was plotted to determine the CFF spikes of the faulty (1.5 BRBs, 2 BRBs, 2.5 BRBs, and 3 BRBs) IM under 0%, 21%, and 42% loads as follows.
Figure 5 illustrates the frequency spectra of i d , i q , and i P stator current components under varying load conditions, highlighting key fault-specific harmonics for each BRBF severity level. The spectra reveal that, as fault severity increased, distinct sidebands appeared around the fundamental frequency, with higher-amplitude harmonics corresponding to more severe rotor damage. Specifically, the left-side harmonic (LSH) and right-side harmonic (RSH) frequencies shifted in response to rotor bar degradation, offering a quantifiable indicator of fault progression. This analysis supports the diagnostic effectiveness of our model, as it captures these frequency shifts, allowing for accurate classification across fault severities and load conditions. The figure demonstrates the reliability of the fault indicators in isolating fault-related harmonics, a significant advantage over traditional methods with limited resolution under variable operating conditions.
The figures above depict the EPV quantities for different levels of BRBs under varying load conditions. It is interesting to observe that as the load torque increased in the IM, the thickness of the Parks vector pattern also increased. As the load torque increased, the amplitude of 1 ± 2 k s f s for the i d and i q components also increased and became more visible. However, at low frequency ranges, the CFF is visible when the waveform is zoomed in, and at high frequency ranges, the CFF is clearly visible at 100 Hz, as shown in the figures above. In the case of the no-load condition, the 2 s f s spectral component due to rotor faults has a smaller magnitude compared to higher loading conditions [33]. The figures above clearly indicate a BRB fault since there are spikes identified at the lower sideband of the i P component, as expected by the equation 2 s f s . This is because the DC offset was removed from the signal prior to its transformation into the frequency domain [28].
As a final remark, it is worth noting that different levels of BRBF severity affect the separability of features captured by PCA (demonstrated in subsequent sections), influencing the classification accuracies of most classifiers. The whole point of analyzing the stator current spectrum in frequency domain in this section is to point out the effectiveness of the EPV current which is able to present important BRBF harmonics, namely, 2 s f s and 2 f s . Through this analysis, the authors are able to utilize the i P current spectrum and calculate its dynamic features to be used for training the classification models. As fault severity increases, specific frequency signatures become more prominent, enhancing model performance in detecting high-severity faults.

3.2. Feature Extraction and Exploratory Analysis

Feature extraction reduces the number of attributes in the dataset, allowing a large set of data to be effectively summarized. Prior to feature extraction, the dataset underwent signal conditioning, where it was cleaned and pre-processed. Additionally, the transient part of the signal was removed to ensure data consistency during feature extraction. Feature extraction enhances the interpretability of the dataset and improves classification performance for EPV current signals. Fifteen statistical time-domain features (adapted from [20]) were calculated from the EPV current ( i P ) which were then used for exploratory analysis and subsequently for training neural and non-neural classifiers.
The geometry of the data was studied using linear and non-linear techniques (PCA, CCA, and ICA). Subsequent figures illustrate the techniques used to study the geometry structure of the dataset and feature maps after reducing the dimensionality of the feature-sets so it can be ready for classification.
Principal component analysis (PCA) is a dimensionality reduction technique that has been used in two ways: first, to determine the proper intrinsic dimensionality by examining the geometry of the data and the differences between the healthy and faulty classes, and second, to make the features more class-discriminative by reducing their dimensionality based on the data’s variability.
Furthermore, Pareto charts are used to evaluate the intrinsic dimensionality of the dataset by ranking dimensions in descending order of variance. Based on the PCA analysis, the Pareto charts in Figure 6 demonstrate that at least three principal components (PCs) are sufficient to capture the majority of variance within the entire feature set. Additionally, the number of PCs required to represent the feature set’s intrinsic dimensionality remains consistent across different loading conditions (Figure 6a–c), highlighting the robustness of the dimensionality reduction process.
The 2D and 3D PCA plots in Figure 7 provide a visual representation of the feature space for healthy and faulty rotor bar conditions, reduced to the first three principal components (PC1, PC2, and PC3). The plots (Figure 7a,b) demonstrate clear clustering patterns for each fault severity level, with black representing healthy data and colors progressing from blue (1.5 BRB) to red (3 BRB) for increasing fault severity (note that similar color coding is adapted for visualization of all dimensionality reduction techniques discussed in this paper). The healthy condition forms a compact cluster near the origin, while faulty conditions show distinct separation along the principal components, reflecting increased variability introduced by each level of rotor damage. This separation across principal components highlights the discriminative power of the statistical features extracted, as the clusters become increasingly separated as fault severity escalates. The ordered progression of clusters from healthy to severe fault conditions indicates that the PCA-transformed feature space captures the underlying structure and variance associated with each fault level, making it suitable for classification and exploratory analysis of broken rotor bar faults. The results validate that a reduced dimensionality representation using PCA preserves key patterns in the data, facilitating effective differentiation between healthy and faulty conditions based on BRB severity.
Further analysis of the 15 statistical time-domain features was conducted and its topology was explored using the CCA technique. CCA is a non-linear dimensionality reduction technique that projects high-dimensional data onto a lower-dimensional space while preserving the local and global structure of the data. Unlike linear methods such as PCA, CCA can capture complex, non-linear relationships, making it well-suited for visualizing and analyzing datasets with non-linear patterns. CCA is often used for exploratory data analysis to reveal intrinsic data structures in cases where traditional methods may fall short.
The dy-dx plot, which is an inbuilt tool within CCA, is useful for evaluating how well a dimensionality reduction technique like CCA preserves the original data structure, showing if distances are maintained or distorted. It provides insight into whether local and global relationships in the high-dimensional space are accurately represented in the reduced space. The dy-dx plot in Figure 8 illustrates the relationship between distances in the high-dimensional space (dy) and their corresponding distances in the reduced three-dimensional space (dx) after applying CCA, with a parameter λ = 150. The points generally follow a trend close to the 45-degree red line (bisector), indicating that CCA has preserved the original distances fairly well. The slight deviations above and below the line suggest minor distortions, where some distances are slightly overestimated or underestimated in the reduced space. Overall, this plot indicates that CCA has effectively captured the original data structure for intrinsic dimensionality of 3 with minimal distortion, retaining both local and global relationships in the transformation.
Moreover, the 3D and 2D CCA plots (Figure 9) illustrate the transformed feature space for healthy and BRB fault scenarios, with each fault condition represented by distinct colors: black for healthy data, blue for 1.5 BRB, green for 2 BRB, cyan for 2.5 BRB, and red for 3 BRB. In both plots, the healthy data forms a compact cluster, while faulty conditions are increasingly separated as fault severity progresses, with the 3 BRB condition exhibiting the greatest displacement from the healthy cluster. However, there is noticeable overlap between some clusters, particularly at some fault severities (1.5 BRB and 2 BRB), where the faulty data-points partially overlap with each other and with the healthy data. This overlap suggests that in the early stages of rotor bar damage, the signal characteristics are less distinct, likely due to minimal disruptions in the rotor’s magnetic field, resulting in non-linear features that are harder to distinguish. This partial overlap highlights the challenge in distinguishing early-stage faults but reinforces the effectiveness of CCA in capturing non-linear relationships, allowing for clear differentiation at higher fault severities.
Independent component analysis (ICA) is a technique for decomposing multivariate signals into statistically independent components, making it especially useful for fault detection and severity analysis in broken rotor bar faults (BRBFs). Unlike PCA, which focuses on maximizing variance, ICA maximizes statistical independence, enabling the separation of non-Gaussian sources. In BRBF analysis, ICA helps isolate independent fault-related features, enhancing detection accuracy and allowing for a detailed assessment of fault severity.
The 2D and 3D ICA plots (Figure 10) illustrate the reduced feature space, where the 15 original statistical features have been transformed into the first three independent components (ICA1, ICA2, and ICA3) based on the intrinsic dimensionality inferred via Pareto charts.
Using similar color coding from PCA and CCA, in the 3D plot, each fault condition forms a distinct cluster, with healthy data tightly grouped near the origin and progressively more severe faults, particularly 3 BRB (red), located further away, indicating that ICA effectively separates the independent features associated with each fault level. The 2D plot (ICA1 vs. ICA2) also reveals clear differentiation, though minor overlaps exist between the 1.5 BRB and 2 BRB conditions, highlighting a constraint of ICA in handling subtle, early-stage fault separations. Despite this, the distinct clusters for higher fault severities suggest that ICA is highly effective in isolating independent components that reflect fault progression, making it a valuable tool for exploratory analysis. However, the technique’s reliance on statistical independence as a constraint can sometimes limit its ability to capture overlapping or dependent features, especially at lower fault severities, which requires consideration when interpreting results.

3.3. Dataset Partitioning

The calculated dataset of 15 statistical time domain features was then partitioned and trained using neural and non-neural based classification methods. Each neural and non-neural based model was trained using the outputs of the exploratory analysis mentioned above along with the original 15 statistical time domain features. The different accuracy levels given out by each neural and non-neural based model were then compared to indicate which feature-set best suited the diagnosis of the BRB fault. Table 2 describes the five classes in terms of fault severity and class labels.
  • Training dataset (3500 samples): 70%;
  • Validation dataset (750 samples): 15%;
  • Test dataset (750 samples): 15%.

One-Hot Encoding

One-hot encoding is a method for converting categorical variables into a binary format, where each unique category is represented by a separate binary column. In this approach, each category is assigned a 1 in its respective column and 0 in all others, creating a clear, mutually exclusive representation for machine learning models to interpret.
In this study, one-hot encoding is used to represent the five fault conditions—healthy IM, 1.5 BRBs, 2 BRBs, 2.5 BRBs, and 3 BRBs—as separate binary columns. This transformation enables the model to treat each fault condition as a distinct class, ensuring accurate representation during the training, testing, and validation processes, ultimately improving the classification performance.

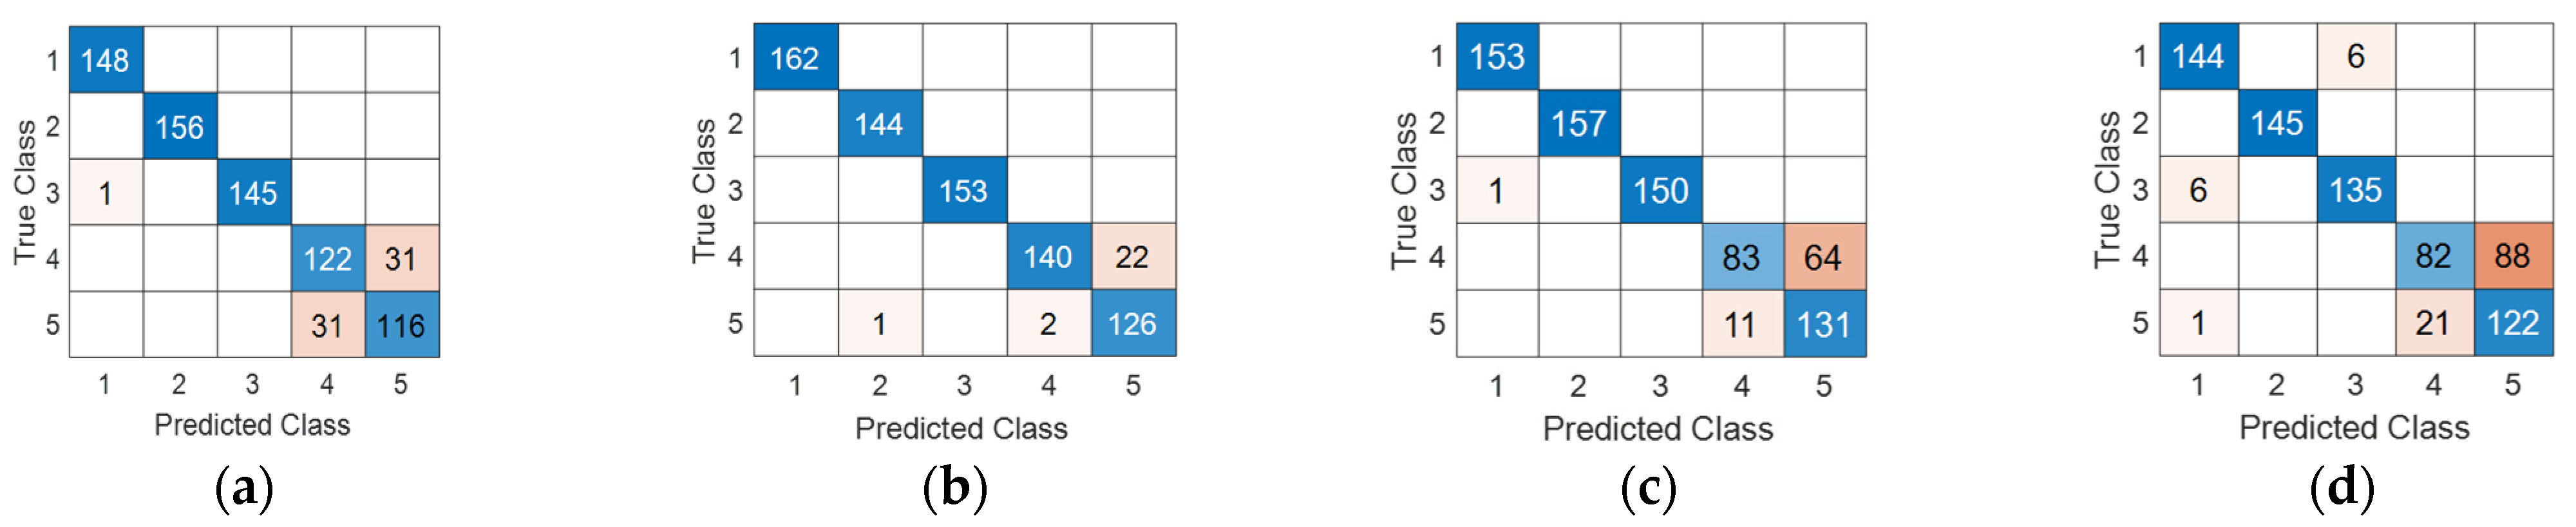
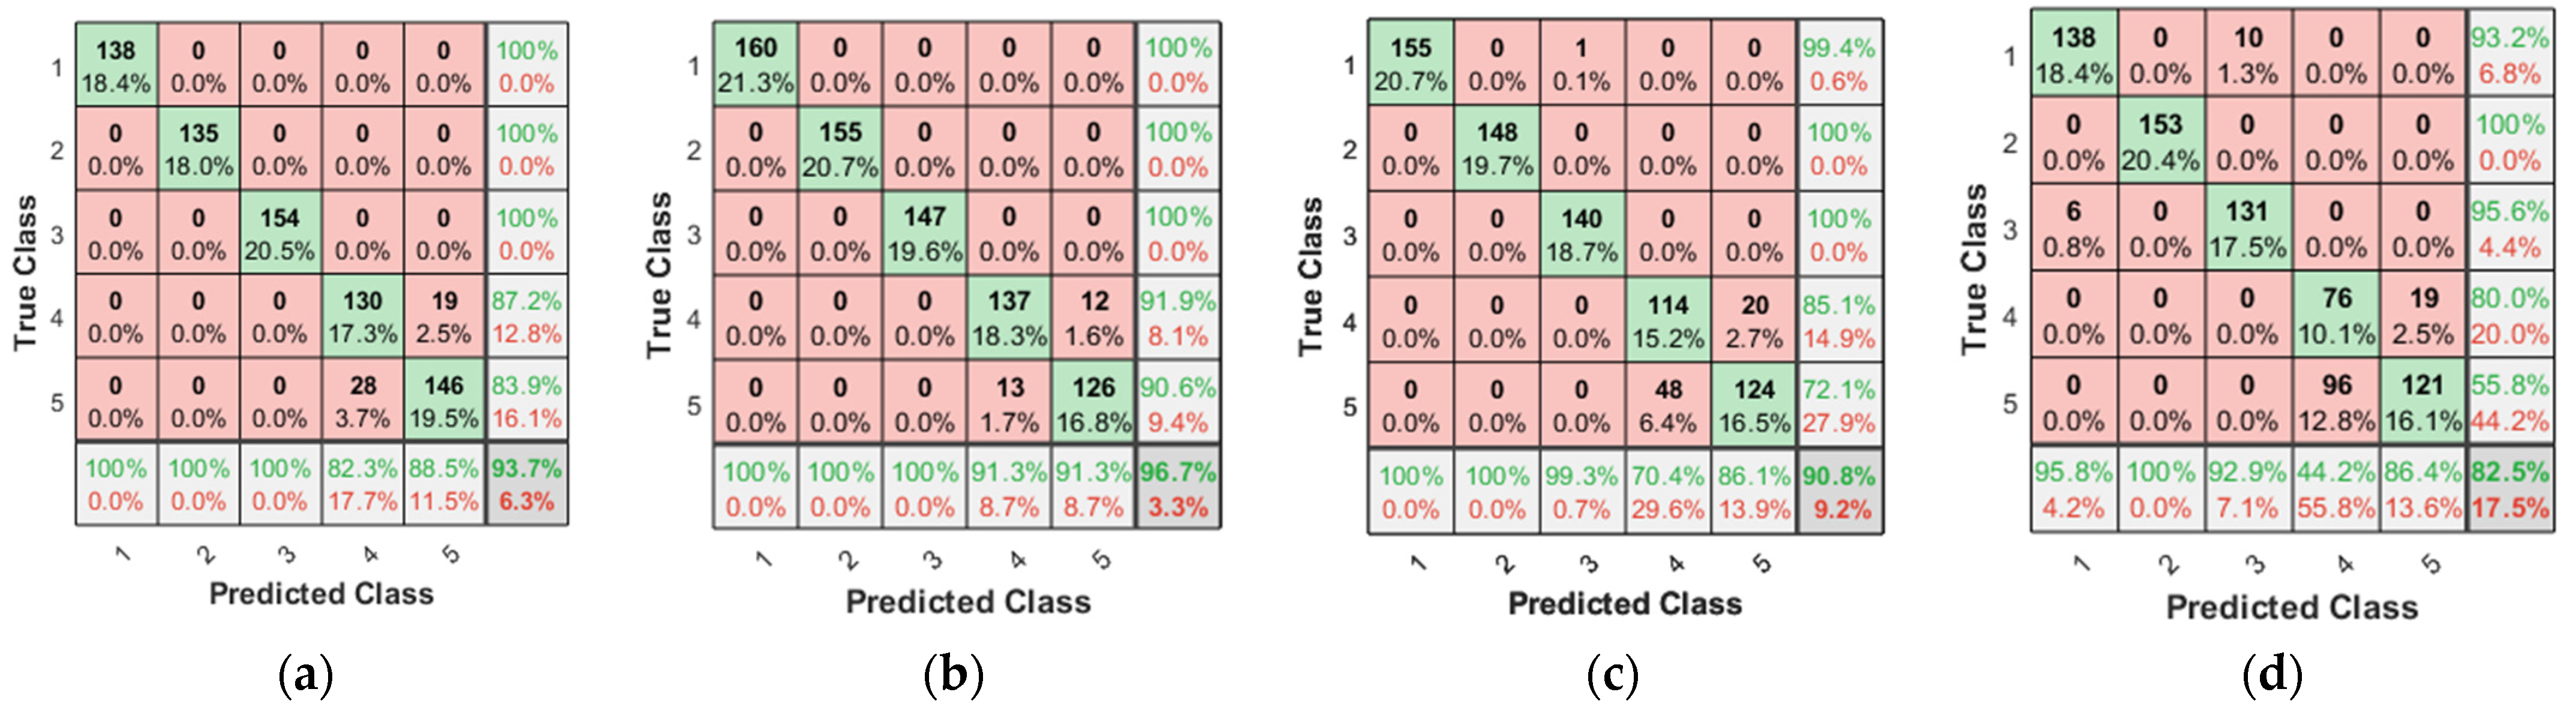
3.4. Classification Using Neural and Non-Neural Based Techniques

Long short-term memory (LSTM) is a type of artificial neural network (ANN) commonly used for deep learning and artificial intelligence (AI) tasks, particularly to address the problems of vanishing and exploding gradients. LSTM is a special kind of recurrent neural network (RNN) with feedback connections that enable it to process entire sequences of data effectively. The LSTM architecture is designed to provide RNNs with the ability to retain information over long periods, allowing the network to maintain short-term memory that can span thousands of time steps. This reveals that LSTM models, which are designed for time-series analysis, are particularly effective in capturing the temporal variations associated with fault progression, showing higher accuracy in low-severity fault detection compared to SDNN. However, referring to classes 4 and 5 (faulty cases), it appears that the fault severities are quite close in proximity, which explains the misclassifications within the fault.
The confusion matrices in Figure 11 illustrate the predicted class versus the true class for a classification trial using an LSTM model. Figure 11a–d show the classification performance of the four feature sets: normalized 15 features, PCA-reduced features, CCA-reduced features, and ICA-reduced features. The classification accuracies observed for the LSTM model are as follows: normalized 15 features, 91.60%; PCA-reduced features, 96.67%; CCA-reduced features, 89.87%; and ICA-reduced features, 83.73%. These results indicate that the feature set reduced by PCA achieved the highest accuracy among the four, demonstrating its effectiveness for BRB fault classification. Conversely, the model trained with the ICA-reduced feature set yielded the lowest test-set accuracy at 83.73%.
The confusion matrices in Figure 12a–d illustrate the classification performance of the shallow dense neural network (SDNN) model on the dataset using four different feature sets: normalized 15 features, PCA-reduced features, CCA-reduced features, and ICA-reduced features. The observed classification accuracies are as follows: normalized 15 features, 93.70%; PCA-reduced features, 96.70%; CCA-reduced features, 90.80%; and ICA-reduced features, 82.50%. The results indicate that the PCA-reduced feature set achieved the highest accuracy at 96.70%, making it the most effective representation for BRB fault classification with SDNN. Although the class separability is similar across the PCA, CCA, and ICA transformations, PCA yielded the best accuracy, suggesting it retains the most discriminative features in a way that enhances SDNN performance. On the other hand, the ICA-reduced feature set resulted in the lowest accuracy (82.50%), which aligns with similar trends observed in the LSTM model, where ICA also performed comparatively lower. This suggests that while ICA captures independent features effectively, it may not retain features in a format as conducive to classification accuracy with SDNN.
In this study, the EPV current ( i P )   was calculated by transforming three-phase stator current signals into a single vector. Using i P , 15 statistical features were extracted to capture fault-specific characteristics within the signal. Data dimensionality was then reduced using CCA, PCA, and ICA, and these transformed features were used to train both neural and non-neural machine learning (ML) models. For comparison, models were also trained using the full set of all 15 features without dimensionality reduction.
Table 3 presents a comparative analysis of test accuracies across neural and non-neural classification models, highlighting the diagnostic advantages of the proposed neural approaches. The PCA-LSTM model achieved significantly higher test accuracy than non-neural models, with approximately a 5% improvement over traditional methods. Similarly, the SDNN model demonstrated comparable diagnostic precision to the LSTM, especially in detecting subtle fault characteristics under low-slip and variable load conditions. Overall, the proposed PCA-LSTM and SDNN-based approaches outperformed the non-neural methods, which typically achieve 85–90% accuracy and are often limited by noise sensitivity and extensive preprocessing requirements. In contrast, the proposed models reached an average fault detection accuracy of 100% (when evaluating between healthy and all levels of BRBFs), showcasing robustness to variable load conditions and enhanced performance in early fault detection.
Based on the performance metrics shown in Table 3, it is evident that the neural models, particularly those using PCA-reduced features, outperform non-neural models in terms of classification accuracy under varying load conditions. While non-neural models, such as the decision trees and SVMs, are computationally efficient, their fault classification accuracy remains lower, likely due to limited feature extraction capabilities and sensitivity to noise. Among the neural models, both PCA-LSTM and PCA-SDNN demonstrate superior accuracy, with PCA-SDNN achieving the highest test accuracy at 96.70%.
Not only does PCA-SDNN achieve the highest test accuracy at 96.70%, but it also benefits from lower computational complexity compared to other models, as it uses only nine neurons in its hidden layer. This efficiency makes PCA-SDNN particularly suitable for real-time industrial applications, where both speed and accuracy are critical for effective fault detection. The detailed key performance metrics (Table 4) further reinforce its effectiveness: classes 1, 2, and 3 achieved perfect sensitivity, specificity, precision, and F1 scores, demonstrating flawless classification. Classes 4 and 5 showed slightly lower but still high scores, with F1 scores of 0.919 and 0.906, respectively; thus, the model maintained robust accuracy across all fault categories. While the PCA-LSTM model also performed well with an accuracy of 96.67%, it had a higher computational load due to its more complex architecture, with 30 neurons. Thus, PCA-SDNN stands out as the preferred model, balancing high diagnostic accuracy and reduced computational requirements, making it highly applicable in practical, real-time scenarios where both precision and efficiency are essential.

4. Conclusions

In this study, FFT analysis was initially used to identify frequency anomalies in grid-connected IMs, targeting CFFs associated with BRB faults. Spectral analysis across different BRB severity levels and various loading conditions revealed CFFs consistent with the existing literature, though frequency-based techniques alone faced limitations, particularly under no-load conditions where fault detection was challenging. To enhance diagnostic accuracy, machine learning-based strategies were adopted.
After calculating the EPV current ( i P ), the 15 statistical time-domain features were extracted. Data exploration was then performed using PCA, CCA, and ICA to examine the intrinsic data structure and class separability. Although PCA, CCA, and ICA produced similar results in exploratory data analysis, PCA’s linear approach proved most effective for classification, while the nonlinear techniques ICA and CCA offered valuable insights into complex data patterns, improving class separability for BRB severity visualization.
Neural and non-neural classification models were then applied, with PCA-SDNN achieving the highest accuracy at 96.70%, highlighting its effectiveness in fault detection and severity classification. Although CCA and ICA showed strong class separability in exploratory analysis, PCA with SDNN proved most reliable for classification due to its balance of high diagnostic accuracy and computational efficiency. Consequently, PCA-SDNN is recommended for real-time industrial applications, offering rapid, accurate fault detection critical for operational reliability. However, since the study was conducted under controlled laboratory conditions, further validation in diverse industrial environments is necessary to confirm the generalizability and robustness of the proposed method. This will be an object of investigation in future work.

Author Contributions

Conceptualization, R.R.K.; methodology, R.R.K. and L.O.W.; software, L.O.W.; validation, L.O.W. and J.L.T.; formal analysis, L.O.W. and J.L.T.; investigation, A.T. and M.A.; resources, R.R.K., A.T. and M.A.; data curation, L.O.W. and J.L.T.; writing—original draft preparation, R.R.K., L.O.W. and J.L.T.; writing—review and editing, A.T., S.H.K. and M.A.; visualization, R.R.K.; supervision, R.R.K., A.T. and M.A.; project administration, R.R.K. and S.H.K.; funding acquisition, S.H.K. All authors have read and agreed to the published version of the manuscript.

Funding

This research received no external funding.

Data Availability Statement

Data are contained within the article.

Conflicts of Interest

The authors declare no conflicts of interest.

References

  1. Ram, S.; Upadhyay, M. A Review on Different Types of Faults in Induction Motor and Methods to Control Speed of Induction Motors. Res. J. Eng. Technol. Med. Sci. 2022, 5, 192–199. [Google Scholar]
  2. Venkatasubramanian, V.; Rengaswamy, R.; Yin, K.; Kavuri, S.N. A review of process fault detection and diagnosis: Part I: Quantitative model-based methods. Comput. Chem. Eng. 2003, 27, 293–311. [Google Scholar] [CrossRef]
  3. Zhu, Y.; Zhao, S.; Zhang, Y.; Zhang, C.; Wu, J. A Review of Statistical-Based Fault Detection and Diagnosis with Probabilistic Models. Symmetry 2024, 16, 455. [Google Scholar] [CrossRef]
  4. Bishop, C.M. Pattern Recognition and Machine Learning; Information Science and Statistics; Springer: New York, NY, USA, 2016. [Google Scholar]
  5. Zhang, X.; Foo, G.; Don Vilathgamuwa, M.; Tseng, K.J.; Bhangu, B.S.; Gajanayake, C. Sensor fault detection, isolation and system reconfiguration based on extended Kalman filter for induction motor drives. IET Electr. Power Appl. 2013, 7, 607–617. [Google Scholar] [CrossRef]
  6. Zhou, Z.; Dong, C.; Zhang, Q. Dynamic Fault Tree Analysis Based on Dynamic Uncertain Causality Graph. In Proceedings of the ICONE26, Volume 2: Plant Systems, Structures, Components, and Materials; Risk Assessments and Management, London, UK, 22–26 July 2018. [Google Scholar] [CrossRef]
  7. Kumar, R.R.; Andriollo, M.; Cirrincione, G.; Cirrincione, M.; Tortella, A. A Comprehensive Review of Conventional and Intelligence-Based Approaches for the Fault Diagnosis and Condition Monitoring of Induction Motors. Energies 2022, 15, 8938. [Google Scholar] [CrossRef]
  8. Fernandez-Cavero, V.; Pons-Llinares, J.; Duque-Perez, O.; Morinigo-Sotelo, D. Detection of broken rotor bars in nonlinear startups of inverter-fed induction motors. IEEE Trans. Ind. Appl. 2021, 57, 2559–2568. [Google Scholar] [CrossRef]
  9. Pons-Llinares, J.; Antonino-Daviu, J.; Roger-Folch, J.; Moríñigo-Sotelo, D.; Duque-Pérez, O. Mixed eccentricity diagnosis in Inverter-Fed Induction Motors via the Adaptive Slope Transform of transient stator currents. Mech. Syst. Signal Process. 2014, 48, 423–435. [Google Scholar] [CrossRef]
  10. Wang, W.; Song, X.; Liu, G.; Chen, Q.; Zhao, W.; Zhu, H. Induction Motor Broken Rotor Bar Fault Diagnosis Based on Third-Order Energy Operator Demodulated Current Signal. IEEE Trans. Energy Convers. 2022, 37, 1052–1059. [Google Scholar] [CrossRef]
  11. Kabul, A.; Ünsal, A. An alternative approach for the detection of broken rotor bars and bearing faults of induction motor based on vibration signals. In Proceedings of the 2021 8th International Conference on Electrical and Electronics Engineering (ICEEE), Antalya, Turkey, 9–11 April 2021; pp. 126–131. [Google Scholar]
  12. Ramu, S.K.; Irudayaraj, G.C.R.; Subramani, S.; Subramaniam, U. Broken rotor bar fault detection using Hilbert transform and neural networks applied to direct torque control of induction motor drive. IET Power Electron. 2020, 13, 3328–3338. [Google Scholar] [CrossRef]
  13. Dehina, W.; Boumehraz, M.; Kratz, F. Diagnosis and detection of rotor bars faults in induction motor using HT and DWT techniques. In Proceedings of the 2021 18th International Multi-Conference on Systems, Signals & Devices (SSD), Monastir, Tunisia, 22–25 March 2021; pp. 109–115. [Google Scholar]
  14. Cherif, B.D.E.; Bendiabdellah, A.; Seninete, S. Induction Motor Diagnosis with Broken Rotor Bar Faults Using DWT Technique. In Proceedings of the 2021 International Conference on Electrical, Communication, and Computer Engineering (ICECCE), Kuala Lumpur, Malaysia, 12–13 June 2021; pp. 1–5. [Google Scholar]
  15. Ameid, T.; Ammar, A.; Talhaoui, H.; Azzoug, Y.; Chebaani, M. An automatic rotor bar fault diagnosis using fuzzy logic and DWT-energy for backstepping control driven induction motor in low-speed operation. Soft Comput. 2023, 27, 10411–10426. [Google Scholar] [CrossRef]
  16. Shi, P.; Chen, Z.; Vagapov, Y.; Zouaoui, Z. A new diagnosis of broken rotor bar fault extent in three phase squirrel cage induction motor. Mech. Syst. Signal Process. 2014, 42, 388–403. [Google Scholar] [CrossRef]
  17. Jimenez, G.A.; Munoz, A.O.; Duarte-Mermoud, M.A. Fault detection in induction motors using Hilbert and Wavelet transforms. Electr. Eng. 2007, 89, 205–220. [Google Scholar] [CrossRef]
  18. Reljič, D.; Jerkan, D.; Kanovič, Ž. Broken rotor bar fault detection using advanced IM model and artificial intelligence approach. In Proceedings of the IEEE EUROCON 2019-18th International Conference on Smart Technologies, Novi Sad, Serbia, 1–4 July 2019; pp. 1–6. [Google Scholar]
  19. Djalel, D.; Yahia, K.; Mostefa Mohamed, T.; Hichem, M.; Khouloud, B. Detection and SVM classification of Broken Rotor bars Fault in induction motor using WPA. In Proceedings of the 2019 6th International Conference on Control, Decision and Information Technologies (CoDIT), Paris, France, 23–26 April 2019; pp. 1001–1005. [Google Scholar] [CrossRef]
  20. Kumar, S.; Buksh, N.; Raj, K.K.; Kumar, R.R. A Comparative Classification Study for Broken Rotor Bar Fault and its Severity Analysis using Machine Learning Approaches in Rotating Machines. In Proceedings of the 2023 IEEE International Conference on Energy Technologies for Future Grids (ETFG), Wollongong, Australia, 3–6 December 2023; pp. 1–6. [Google Scholar] [CrossRef]
  21. Preethi, I.; Suryaprakash, S.; Mathankumar, M. A State-of-Art Approach on Fault Detection in Three Phase Induction Motor using AI Techniques. In Proceedings of the 2021 5th International Conference on Computing Methodologies and Communication (ICCMC), Erode, India, 8–10 April 2021; pp. 567–573. [Google Scholar] [CrossRef]
  22. Ghasemi, S.; Sadeghian, A. Application of Hybrid Wavelet-SVM Algorithm to Detect Broken Rotor Bars in Induction Motors. In Proceedings of the 2021 IEEE 30th International Symposium on Industrial Electronics (ISIE), Kyoto, Japan, 20–23 June 2021; pp. 01–06. [Google Scholar]
  23. Veit, A.; Belongie, S. Convolutional networks with adaptive inference graphs. In Proceedings of the European Conference on Computer Vision (ECCV), Munich, Germany, 8–14 September 2018; pp. 3–18. [Google Scholar]
  24. Aggarwal, C.C. Neural Networks and Deep Learning; Springer: Cham, Switzerland, 2018; Volume 10, pp. 978–983. [Google Scholar]
  25. Kumar, R.R.; Cirrincione, G.; Cirrincione, M.; Tortella, A.; Andriollo, M. A Topological Neural-Based Scheme for Classification of Faults in Induction Machines. IEEE Trans. Ind. Appl. 2020, 57, 272–283. [Google Scholar] [CrossRef]
  26. Kumar, P.; Hati, A.S. Transfer learning-based deep CNN model for multiple faults detection in SCIM. Neural Comput. Appl. 2021, 33, 15851–15862. [Google Scholar] [CrossRef]
  27. Shao, S.; McAleer, S.; Yan, R.; Baldi, P. Highly accurate machine fault diagnosis using deep transfer learning. IEEE Trans. Ind. Inform. 2018, 15, 2446–2455. [Google Scholar] [CrossRef]
  28. Kumar, R.R.; Cirrincione, G.; Cirrincione, M.; Andriollo, M.; Tortella, A. Accurate Fault Diagnosis and Classification Scheme Based on Non-Parametric, Statistical-Frequency Features and Neural Networks. In Proceedings of the 2018 XIII International Conference on Electrical Machines (ICEM), Alexandroupoli, Greece, 3–6 September 2018; pp. 1747–1753. [Google Scholar] [CrossRef]
  29. Makuc, D.; Drobnič, K.; Ambrožič, V.; Miljavec, D.; Fišer, R.; Nemec, M. Parameters estimation of induction motor with faulty rotor. Prz. Elektrotech. 2012, 88, 41–46. [Google Scholar]
  30. Grande-Barreto, J.; Morales-Perez, C.; Rangel-Magdaleno, J.; Peregrina-Barreto, H. Half-broken bar detection using MCSA and statistical analysis. In Proceedings of the 2017 IEEE International Autumn Meeting on Power, Electronics and Computing (ROPEC), Ixtapa, Mexico, 8–10 November 2017; pp. 1–5. [Google Scholar]
  31. Li, H.; Feng, G.; Zhen, D.; Gu, F.; Ball, A.D. A normalized frequency-domain energy operator for broken rotor bar fault diagnosis. IEEE Trans. Instrum. Meas. 2020, 70, 1–10. [Google Scholar] [CrossRef]
  32. Agah, G.R.; Rahideh, A.; Khodadadzadeh, H.; Khoshnazar, S.M.; Hedayatikia, S. Broken rotor bar and rotor eccentricity fault detection in induction motors using a combination of discrete wavelet transform and Teager–Kaiser energy operator. IEEE Trans. Energy Convers. 2022, 37, 2199–2206. [Google Scholar]
  33. Zarei, J.; Hassani, H.; Wei, Z.; Karimi, H.R. Broken rotor bars detection via Park’s vector approach based on ANFIS. In Proceedings of the 2014 IEEE 23rd International Symposium on Industrial Electronics (ISIE), Istanbul, Turkey, 1–4 June 2014; pp. 2422–2426. [Google Scholar]
Figure 2. Experimental rig (IM with 1.1 kW rating).
Machines 12 00890 g002
Figure 3. Faulty IM with different severities: (a) 1.5 BRBs, (b) 2 BRBs, and (c) drilling to create 2.5 and 3 BRBs.
Machines 12 00890 g003
Figure 4. Frequency spectrum on the three-phase current signatures: (a) no load, (b) 21% load, and (c) 42% load.
Machines 12 00890 g004
Figure 5. Frequency spectrum on the i d , i q , and i p quantities at different severities and load conditions: (a) 1.5 BRBs at no load, (b) 1.5 BRBs at 21% load, (c) 1.5 BRBs at 42% load, (d) 2 BRBs at no load, (e) 2 BRBs at 21% load, (f) 2 BRBs at 42% load, (g) 2.5 BRBs at no load, (h) 2.5 BRBs at 21% load, (i) 2.5 BRBs at 42% load, (j) 3 BRBs at no load, (k) 3 BRBs at 21% load, and (l) 3 BRBs at 42% load.
Machines 12 00890 g005aMachines 12 00890 g005b
Figure 6. Pareto charts explained: (a) no load, (b) 21% load, and (c) 42% load.
Machines 12 00890 g006
Figure 7. PCA plots: (a) 2D view, (b) 3D view.
Machines 12 00890 g007
Figure 8. dy-dx CCA plot for the full feature-set.
Machines 12 00890 g008
Figure 9. CCA plots for the feature-set: (a) 2D view, (b) 3D view.
Machines 12 00890 g009
Figure 10. ICA plots for the feature-set: (a) 2D view, (b) 3D view.
Machines 12 00890 g010
Figure 11. Confusion matrix (LSTM test dataset): (a) normalized 15 features output, (b) PCA output, (c) CCA output, and (d) ICA output.
Machines 12 00890 g011
Figure 12. Confusion matrix (SDNN test dataset): (a) normalized 15 features output, (b) PCA output, (c) CCA output, and (d) ICA output.
Machines 12 00890 g012
Table 1. IM Parameters.
Motor TypeSquirrel Cage
Power 1.1   k W
Speed 1500   r p m
Frequency 50   H z
Rated Voltage 415   V
Rated Current 2.7   A
Number of pair poles2
Number of rotor slots28
Number of stator slots36
Class TypeB
Table 2. BRB fault data class labels.
Fault ClassFault SeverityBroken Rotor Bars
1Healthy0
22 BRBs (50% severity)1.5
32 BRBs (100% severity)2
43 BRBs (50% severity)2.5
53 BRBs (100% severity)3
Table 3. Test accuracies comparison analysis for neural and non-neural based classification models.
ClassifierNormalized 15 FeaturesPCACCAICAComments
Shallow Dense NN93.7096.7090.8082.50Number of neurons = 9, Architecture: * IN|FC|5OUT, Activation-SoftMax layer
LSTM NN91.6096.6789.8783.73Number of neurons = 30, Architecture: * IN|FC|5OUT, Activation-SoftMax layer
Fine Tree86.176.070.367.5Max. Number of Splits = 100, Split Criterion: Gini’s Diversity index
Medium Tree86.977.366.172.0Max. Number of Splits = 20, Split Criterion: Gini’s Diversity index
Course Tree84.168.068.370.3Max. Number of Splits = 4, Split Criterion: Gini’s Diversity index
Quadratic Discriminant94.994.494.970.3Full Covariance Structure
Quadratic SVM91.292.094.168.5Kernel Function: Quadratic
Cubic SVM90.589.380.774.7Kernel Function: Cubic
Fine Gaussian SVM83.950.575.976.8Kernel Function: Gaussian
* FC neurons in a fully connected layer: (neurons), * IN: input layer (note that number of inputs vary for full feature-set and reduced feature-set), * OUT: output layer.
Table 4. Key performance metrics of SDNN model.
ClassSensitivity (Recall)SpecificityPrecisionF1 Score
11111
21111
31111
40.9190.9740.9190.919
50.9060.9810.9060.906
Disclaimer/Publisher’s Note: The statements, opinions and data contained in all publications are solely those of the individual author(s) and contributor(s) and not of MDPI and/or the editor(s). MDPI and/or the editor(s) disclaim responsibility for any injury to people or property resulting from any ideas, methods, instructions or products referred to in the content.

