Abstract
Improving the accuracy and detection speed of bolt recognition under the complex background of the train underframe is crucial for the safety of train operation. To achieve efficient detection, a lightweight detection method based on SFCA-YOLOv8s is proposed. The underframe bolt images are captured by a self-designed track-based inspection robot, and a dataset is constructed by mixing simulated platform images with real train underframe bolt images. By combining the C2f module with ScConv lightweight convolution and replacing the Bottleneck structure with the Faster_Block structure, the SFC2f module is designed for feature extraction to improve detection accuracy and speed. It is compared with FasterNet, GhostNet, and MobileNetV3. Additionally, the CA attention mechanism is introduced, and MPDIoU is used as the loss function of YOLOv8s. LAMP scores are used to rank the model weight parameters, and unimportant weight parameters are pruned to achieve model compression. The compressed SFCA-YOLOv8s model is compared with models such as YOLOv5s, YOLOv7, and YOLOX-s in comparative experiments. The results indicate that the final model achieves an average detection accuracy of 93.3% on the mixed dataset, with a detection speed of 261 FPS. Compared with other classical deep learning models, the improved model demonstrates superior performance in detection effectiveness, robustness, and generalization. Even in the absence of sufficient real underframe bolt images, the algorithm enables the trained network to better adapt to real environments, improving bolt recognition accuracy and detection speed, thus providing technical references and theoretical support for subsequent related research.
1. Introduction
As railways rapidly develop, the load capacity of trains has also increased [1]. With the increase in train speed and load capacity, the forces acting on trains have correspondingly increased, leading to growing concerns about safety. Bolts, as one of the main fasteners on railway trains, secure components through clamping force, but the forces endured during train operation can easily cause bolts to fail or loosen [2]. If bolt failures are not detected in time, they can affect the normal operation of trains, making the detection of underframe bolts crucial.
Traditional bolt detection methods involve workers inspecting bolts by entering trenches, a process that is not only labor-intensive and inefficient but also prone to errors and omissions. With the development of machine vision technology, deep learning-based object detection techniques have been widely applied in railway inspections, particularly in rail defect detection, and have also seen preliminary research and application in the detection and positioning of underframe bolts and the improvement of detection speed [3]. Yang et al. [4] proposed a deep learning-based method for detecting subway car body bolts, utilizing the YOLOV3 network for bolt recognition, which reduced the workload of manual inspection and improved detection efficiency. Wang et al. [5] increased the diversity of image data by capturing images of bolts in different loosening states at the same position under the train underframe, and used a convolutional network to identify the bolt positions. While the accuracy in determining bolt loosening was high, the overall performance for bolt recognition was relatively average. He et al. [6] improved the YOLOX network to create the YOLOX-X network, which could accurately recognize bolts under the train underframe. However, due to the high number of network layers and excessive parameters, the detection time was significantly prolonged. Song et al. [7] proposed a YOLOv5s-based object detection algorithm that introduced a dual-cone feature fusion structure, improving the algorithm’s accuracy in detecting small objects. Yang et al. [8] proposed a Bo-YOLOv5-based object detection method that introduced the CBAM (Convolutional Block Attention Module) attention mechanism and employed weight multiplication and maximum weight strategies to build deeper positional feature relationships, significantly improving detection performance. Wang et al. [9] proposed a small object detection method that improved the accuracy of small object recognition through four-scale feature detection, re-anchoring, and increasing shallow detection scales. Cao et al. [10] proposed a lightweight YOLO network that constructed a backbone network with fewer parameters based on GhostNet, reducing network complexity and improving operational speed. Sun et al. [11] proposed a lightweight object detection method based on MCA-YOLOv5s, employing the FPGM (Filter Pruning by Geometric Median) pruning algorithm to prune convolution kernels near the geometric median within the same layer, generating feature maps with reduced depth, thereby enhancing model loading and operational speed.
The aforementioned methods improved the accuracy of object detection by adding attention mechanisms and optimizing loss functions in the network, and reduced model complexity through lightweight backbone network models and pruning techniques. However, for the relatively complex and efficiency-demanding task of detecting underframe bolts, the aforementioned methods have yet to achieve the optimal balance between detection accuracy and speed, and further improvements are needed to enhance the overall performance of object detection.
To further improve the accuracy and speed of bolt detection, this paper uses a train underframe inspection robot to capture bolt images and employs the more advanced YOLOv8s as the base model with subsequent improvements. The original C2 (CSP Bottleneck with 2 Convolutions) module of the YOLOv8 network’s neck is replaced with a newly designed feature interaction SC2f module. By suppressing redundant information in the spatial and channel dimensions, the network’s detection accuracy is enhanced. The coordinate attention (CA) mechanism module is added to the network, and the target regression loss function is replaced with the more bolt-specific MPDIoU (Multi-Perspective Distance Intersection over Union) loss function. The network’s focus on the surrounding environment is reduced, and attention to bolts is increased, thereby improving bolt recognition accuracy. The LAMP (Layer-wise Adaptive Model Pruning) score pruning method is used to prune the improved model. By reducing model redundancy due to excessive parameters, the network’s detection speed is improved. Finally, the effectiveness of all the proposed improvements is validated through experiments.
2. YOLOv8s Model
YOLOv8 is the culmination of the YOLO series algorithms, released by Ultralytics in 2023, with multiple innovations and improvements built upon the success of the previous YOLO series [12]. Its main improvements include: the development of a new backbone network, replacing the C3 (CSP Bottleneck with 3 Convolutions) structure in YOLOv5 with a more gradient-rich C2f module, improving the efficiency and accuracy of feature extraction; secondly, a new anchor-free detection head was adopted, utilizing a decoupled head structure to separate classification and detection, enhancing the model’s flexibility and adaptability [13]; additionally, Distribution Focal Loss was integrated as the loss function, and the dynamic positive sample assignment strategy of TaskAlignedAssigner was introduced, further improving the detection accuracy and stability.
YOLOv8 offers five different model sizes: Nano, Small, Medium, Large, and Extra-Large [14]. To balance detection accuracy and speed, YOLOv8s was selected as the base model for underframe bolt detection in this paper. This network consists of four parts: the input, backbone, neck, and prediction networks, responsible for feature input, feature extraction, feature fusion, and prediction output, respectively. This structural design not only ensures efficient feature extraction and fusion but also enhances the model’s robustness and accuracy in handling complex tasks.
3. Improved SFCA-YOLOv8s Model
For bolt object detection, this paper initially used the four YOLOv5 network models (n~x) for detection, but neither detection accuracy nor speed was satisfactory; subsequently, the YOLOv8 model was used for detection, which yielded results more in line with expectations. To achieve a network model with higher accuracy and detection speed for underframe bolt detection, the YOLOv8s network structure was improved. The specific improvements are as follows:
- The Bottleneck in the C2f structure was replaced with a Faster_Block to design the FC2f module, which improves computational speed by reducing memory access;
- The FC2f module was combined with ScConv (Spatial and Channel Reconstruction Convolution) lightweight convolution to design the final SFC2f module, replacing all C2f modules in YOLOv8s, and improving network detection accuracy by suppressing redundant information in spatial and channel dimensions;
- The CA attention mechanism module was added to the original network, and the target regression loss function was replaced with the more bolt-specific MPDIoU loss function to improve the accuracy of target detection;
- Finally, the LAMP score pruning method was used to prune the improved model, thereby increasing the network’s detection speed.
The improved network model is shown in Figure 1.
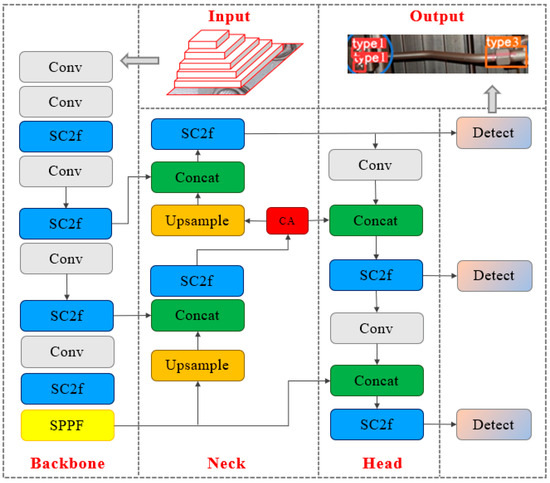
Figure 1.
The improved SFCA-YOLOv8s network model.
3.1. SFC2f Module
The C2f module is a crucial component in the YOLOv8 algorithm, achieving richness and accuracy in feature extraction through two convolutional layers and feature fusion. It consists of convolutional layers, feature fusion, activation functions, and normalization layers. Its workflow includes initial convolution, intermediate feature map splitting, second convolution, and feature map concatenation. The C2f module enhances feature richness and computational efficiency and is designed with modularity for easy integration. However, for underframe bolt detection, its complexity, high memory usage, and parameter redundancy increase the difficulty of training and inference. Therefore, by altering the module structure, reducing memory usage, and improving parameter utilization, its performance in underframe bolt detection can be further enhanced.
Faster_Block [15] is a new module structure designed for object detection, which performs feature extraction and transformation through a series of convolutional layers that help the network learn more discriminative features. Although the Bottleneck module in the C2f structure of YOLOv8 has a similar function, it performs less efficiently. Their specific structures are shown in Figure 2.
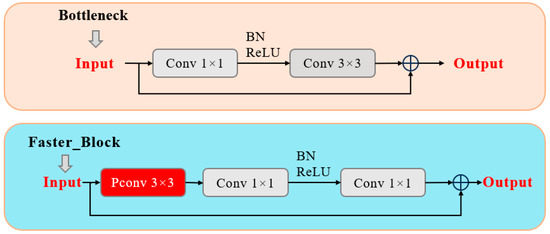
Figure 2.
Structural differences between the two modules.
The Faster_Block module replaces the 3 × 3 convolution with a 1 × 1 convolution while incorporating the design of a 3 × 3 partial convolution (PConv). PConv applies conventional convolution to only a portion of the input channels for spatial feature extraction, thereby reducing memory access and computational redundancy, which improves computational speed. The memory access of conventional convolution and partial convolution can be expressed by Equations (1) and (2):
where and are the height and width of the feature map, is the size of the convolution kernel, is the number of channels for conventional convolution, and is the number of channels for partial convolution. In practical applications, 1/4, so the memory access of PConv is only 1/4 that of conventional convolution, with the remaining () channels not involved in computation, thus requiring no memory access.
As discussed above, replacing the Bottleneck module in the C2f structure with the Faster_Block module reduces memory access and improves target detection speed. In this paper, we replaced the Bottleneck in the C2f structure of the YOLOv8s model with a Faster_Block to create the FC2f module, optimizing feature extraction while minimizing the computational overhead. The structural comparison of the two modules is shown in Figure 3.
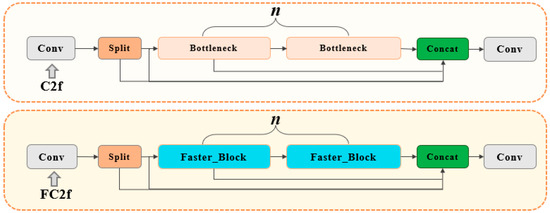
Figure 3.
C2f and FC2f network structures.
Secondly, the Spatial and Channel Reconstruction Convolution (ScConv) proposed by Li et al. [16] was integrated into the FC2f module to design the SFC2f module, which captures spatial relationships at different positions through localized convolution operations and adjusts channel weights to reconstruct information, thereby better capturing the correlation of different positions and channels, further suppressing redundant information, and improving its detection capabilities. At the same time, the SFC2f module adopts lightweight operations and feature reconstruction methods, reducing computational complexity and making model training and inference faster. The ScConv and SFC2f structures are shown in Figure 4.
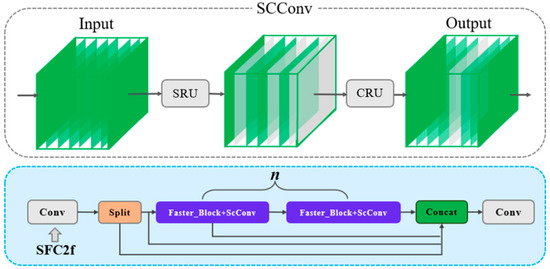
Figure 4.
ScConv and SFC2f network structures.
ScConv mainly consists of two structures: the Spatial Reconstruction Unit (SRU) and the Channel Reconstruction Unit (CRU). The SRU enhances the network’s representation capabilities through separation and reconstruction operations. The SRU processes the input feature map through the following steps:
- The separation process uses Group Normalization (GN) to evaluate the information content in different feature maps. GN scales the input features based on the mean and standard deviation , followed by control through threshold gating. This process can be mathematically represented as:where γ and β are learnable parameters, optimized during the training process. These parameters are typically initialized randomly and adjusted through backpropagation. Specifically, the optimization process involves minimizing the loss function using a gradient-based optimizer, such as SGD (stochastic gradient descent) or Adam. As the network iteratively processes the training data, γ and β are updated at each step based on the gradients of the loss with respect to these parameters, allowing them to learn the best values for capturing the relationships between input features and the target output, and ϵ is a small constant used for numerical stability. The information evaluation of the feature map is shown in Equations (4) and (5):
- After the separation operation, the feature maps are divided into with greater information and with less redundant information. The reconstruction process combines these features to reduce spatial redundancy and enhance relevant features. The reconstruction process is mathematically represented as:
The CRU aims to optimize redundant features in the channel dimension through lightweight convolution operations, enhancing representative features while maintaining computational efficiency. The CRU adopts a split-transform-fuse strategy, detailed as follows:
- The spatially refined features generated by the SRU are split into two parts, with channel numbers and , where is the split ratio (0 ≤ ≤1). Both parts are compressed using a 1 × 1 convolution kernel, resulting in and .This process can be mathematically described as:
- The compressed features and are subjected to Global Weighted Consolidation (GWC) and Partial Weighted Consolidation (PWC), respectively. The output results are then combined to form the transformed features and . Mathematically, the transformation process is expressed as:where and are the learnable matrices of GWC and PWC, respectively.
The final step uses a simplified SKNet method to adaptively merge and . Global average pooling is used to obtain the pooled features and , followed by Softmax operations to generate feature weight vectors and . Finally, under the guidance of the weights, and are merged along the channel direction to obtain the refined channel features . This process is represented as:
Therefore, replacing the Bottleneck module in the C2f module with the Faster_Block module can reduce memory access and improve target detection speed. At the same time, by introducing ScConv into the FC2f module, not only is the model’s computational efficiency and feature extraction capability enhanced, but redundant information is also effectively suppressed, making the designed SFC2f model perform better in target detection tasks compared to the traditional C2f module. These improvements provide a new pathway for enhancing model performance and lay the foundation for further optimization and application.
3.2. Coordinate Attention Mechanism
During neural network training, attention mechanisms are often added to optimize the network model [17]. They work by autonomously learning to reduce the learning weights of less important parts of the input data while enhancing the weights of more important parts. This paper adopts the coordinate attention (CA) mechanism [18,19], which can accurately capture the positional information of the target within the overall image data. The specific network model structure is shown in Figure 5 [20].
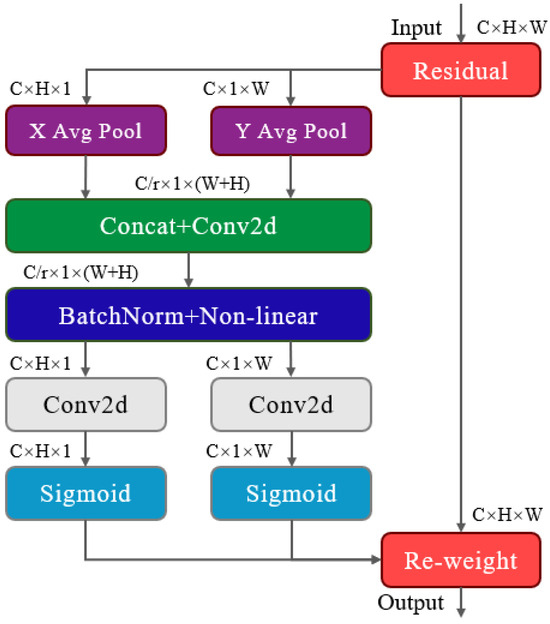
Figure 5.
Schematic diagram of the CA network model.
The X Avg Pool and Y Avg Pool function as coordinate information embedding mechanisms, addressing the issue of global pooling’s inability to preserve positional information, thereby enabling the attention module to capture spatial long-range dependencies with precise positional information. Specifically, a pooling kernel of size (H,1) is used to encode each channel along the x-axis, followed by a pooling kernel of size (1,W) to encode each channel along the y-axis. These two transformations aggregate features along two spatial directions, returning a pair of direction-aware attention maps that provide accurate positional information for regions of interest [21]. This process can be expressed by Equations (15) and (16).
Coordinate attention generation involves concatenating the feature maps generated in two directions, followed by a shared 1 × 1 convolution to transform the feature maps as expressed in Equation (17), and splitting the generated feature map into two separate tensors along the spatial dimension. Then, two 1 × 1 convolutional kernels, and , are used to transform the two tensors to the same number of channels as the input, as shown in Equations (18) and (19). Finally, they are expanded to obtain the form expressed in Equation (20), which serves as the final output attention weights [22].
Here, is the intermediate feature map of spatial information in the horizontal and vertical directions, while and are the two separate tensors obtained by splitting along the spatial dimension. and are the feature maps of the same channel as the input, obtained through feature transformation from and , respectively. Finally, represents the attention weight obtained.
3.3. MPDIoU Loss Function Improvement
YOLOv8 employs the CIoU loss function and adds DFL loss to enable the network to more quickly focus on the target location and the distribution of neighboring areas. This approach enhances the model’s generalization in object detection under complex conditions. However, because the aspect ratio of the detection box is a relative value, it can cause the predicted box to increase in size, affecting the precise localization of some small bolt targets. To address this issue, this paper improves the loss function by adopting the MPDIoU loss function.
MPDIoU can more accurately measure the matching degree of bounding boxes, fully utilizing the geometric features of horizontal rectangles, and combines factors such as overlapping or non-overlapping regions, center point distance, and width and height deviations to comprehensively compare the similarity between the predicted bounding box and the ground truth bounding box.
As shown in Figure 6, the process demonstrates that the blue box represents the ground truth box, the red box represents the initial predicted box, and d1 and d2 are the distances between the top-left and bottom-right corners of the ground truth and predicted boxes, respectively. By iteratively reducing the values of d1 and d2, the predicted box gradually approaches the ground truth box, ultimately achieving better detection results. The specific expressions of the MPDIoU loss function are shown in Equations (21)–(23).
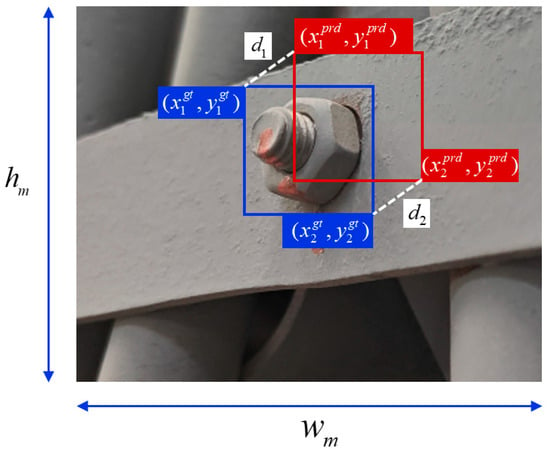
Figure 6.
Specific illustration of MPDIoU bounding box processing.
The core improvement of the MPDIoU loss function lies in its comprehensive assessment of the matching degree between bounding boxes. It considers the intersection over union (IoU) of the predicted and ground truth boxes, measuring their overlapping area. Additionally, by calculating the distance between the center points of the predicted and ground truth boxes, it ensures precise positional matching. Considering the differences in width and height between the predicted and ground truth boxes further enhances the accuracy of matching. With these improvements, MPDIoU performs better in handling small bolt targets, allowing the computation process to converge faster and making detection more efficient, while addressing the issue of identical loss values for the same aspect ratio.
3.4. LAMP Score-Based Pruning Algorithm
LAMP (Layer-Adaptive Magnitude-based Pruning) is a pruning algorithm used for deep neural networks. It selects and removes redundant weights in the network, reducing the model’s computational load and storage requirements while maintaining performance as much as possible [23]. The specific scoring formula is shown in Equation (24).
In the equation, represents the weight, and represent the terms mapped by indices and , respectively, with and corresponding to the indices of the weights sorted in ascending order. The LAMP score measures the relative importance of target connections among all “surviving” connections in the same layer, and prunes the weights with the lowest LAMP scores in each layer until the pruning requirement is met. This pruning method ensures that at least one weight is retained in each layer, and the retained weights are the most important ones in each layer. The pruning method is shown in Figure 7.
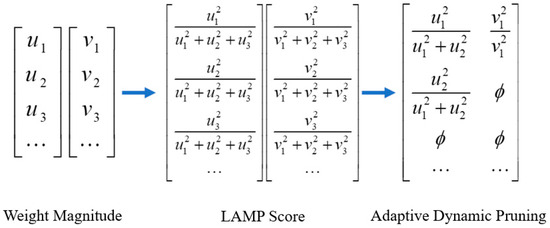
Figure 7.
LAMP pruning process flowchart.
The main process of LAMP score pruning is as follows: (1) Obtain the weight file trained with YOLOv8s and perform initialization; (2) Calculate the square of the magnitude of the connection weights and normalize it to the sum of the squared magnitudes of all “surviving weights” in the same layer to obtain the LAMP score; (3) Based on the LAMP scores, select the connections with lower scores and prune the corresponding number of connections according to the pre-set global sparsity requirement; (4) Remove the selected connections from the model by setting their weights to zero; (5) Retrain the pruned model to recover any potential performance loss during pruning; and (6) Evaluate the performance of the pruned model to ensure that the pruning operation has not significantly reduced the model’s accuracy.
Through the LAMP score pruning algorithm, SFCA-YOLOv8s can effectively remove redundant weights in the network, thereby reducing the model’s computational load. Although the LAMP pruning algorithm removes some weights, its adaptive selection mechanism ensures that the retained weights are the ones that contribute the most to the model’s performance. Therefore, after introducing the LAMP pruning algorithm, SFCA-YOLOv8s can further optimize while maintaining its original accuracy.
4. Testing Platform and Dataset Construction
4.1. Testing Platform
Before bolt localization and detection, images of the underframe need to be collected. In this study, a self-designed tracked robot is used to inspect the train underframe. The main structural components are shown in Figure 8a, where the six-axis robotic arm is an EPSON VT6L, and the high-speed area scan camera is an MV-CH120-10GC. As illustrated in Figure 8b, the lens is equipped with additional lighting to address varying lighting conditions during image capture, particularly in darker environments. The lens model is MVL-KF0618M-12MPE.
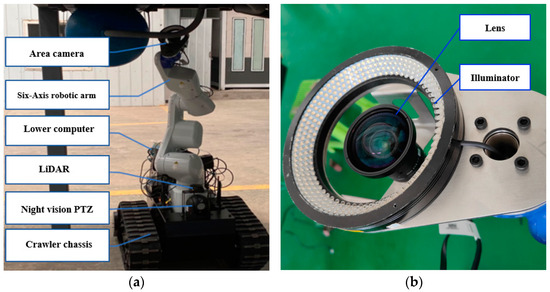
Figure 8.
Underframe detection robot: (a) Robot structure; (b) Lens module.
There are two main methods for collecting bolt images using the robot: manual control and fully automated shooting. Manual control is used to capture a large number of bolt images, especially when different angles of bolts need to be photographed to build a dataset. The robot is moved to the appropriate position using a remote control, and the robotic arm is controlled by a computer to photograph bolts from different angles. The captured images are stored in the onboard system and transferred to a computer for processing and training after shooting is completed.
Fully automated shooting is used for actual underframe detection in the workshop. Each position to be photographed is calibrated in the inspection pit, and the robot’s shooting posture is pre-adjusted. The LiDAR system controls the tracked chassis to reach the calibrated positions for shooting. Before each image capture session, the robot traverses the inspection pit or testing platform, and the laser radar is used to manually adjust the focus of the camera by remotely controlling the robotic arm. This ensures that the entire underframe is clearly visible in the captured images. Once the camera is properly focused, the robot proceeds to capture the images, which are later processed for bolt localization and detection by a separate object detection algorithm.
Since the robot has not yet been deployed in railway maintenance facilities, it is challenging to obtain real underframe images, and it is not feasible to conduct prolonged shooting to acquire a sufficient bolt dataset. To address this issue, we built a simulated train underframe testing platform. The tracked robot operates in a 1.4-m-deep inspection pit, designed to move around the pit and capture images of the entire train underframe. The height of the simulated platform matches that of the real inspection pit, ensuring that the robot’s operation in the test environment closely replicates real-world conditions. As shown in Figure 9a, the testing platform is modeled after the real underframe environment, with the height from the ground matching the actual distance from the train underframe to the bottom of the inspection pit, simulating the robot’s operation in the pit. Figure 9b shows the actual train underframe environment. Signals are transmitted to the computer via WiFi, and the captured images are sent to a computer, where algorithms are used to perform bolt detection and identification.

Figure 9.
Experimental platform and actual train underframe: (a) Simulated underframe environment; (b) Actual underframe environment.
4.2. Bolt Dataset Construction
Under the train’s underframe, bolts can be roughly categorized into three types: nut-and-bolts, pipe-connection bolts, and regular bolts, as shown in Figure 10. The simulated underframe testing platform also uses the three types of bolts illustrated in Figure 11. Nut-and-bolt types are typically used to connect key mechanical components, such as drive systems and suspension systems. Their design allows them to withstand higher stress and loads, ensuring a tight connection between important components. Pipe-connection bolts are used to connect and secure various piping systems in the train, such as braking systems, air systems, and hydraulic systems, ensuring a secure connection without leaks. Regular bolts are mainly used to secure the connection points of various underframe components, such as brackets and shields, ensuring these parts remain stable during train operation.

Figure 10.
Images of different types of bolts on an actual train underframe: (a) Nut-and-bolt type; (b) Pipe-connection bolt; (c) Regular bolt.

Figure 11.
Bolt images from the experimental platform: (a) Nut-and-bolt type; (b) Pipe-connection bolt; (c) Regular bolt.
Using the manually controlled robot, 400 bolt images were collected on the testing platform. Additionally, 200 real underframe images, as shown in Figure 10, were provided by maintenance personnel at the Shenyang Railway Bureau’s Dalian locomotive inspection facility. The three types of bolts in the images were annotated using the LabelImg tool, where nut-and-bolt types were labeled as “type1”, pipe-connection bolts as “type2”, and regular bolts as “type3”.
To further improve the diversity and quality of the dataset, several data augmentation techniques were carefully applied. For affine transformations, translation, scaling, and rotation were used to simulate varying bolt positions and perspectives in the images. Geometric transformations such as cropping and jittering were employed to create new variations of the original images by randomly cropping sections and slightly altering the geometric structure of the bolts. Flipping was used to mirror the images and provide additional angular diversity. At the pixel level, Gaussian noise, Gaussian blur, and salt noise were added to simulate real-world image distortions such as lighting variations, motion blur, and environmental noise. These transformations help the model become more robust against noise and variations that may be encountered in actual working environments.
Additionally, Mosaic data augmentation was utilized to further enhance data diversity by combining four or nine randomly cropped images into a single composite image. This technique alters the spatial relationships between objects in the image, providing the model with more challenging scenarios for object detection. The effect of Mosaic augmentation is shown in Figure 12. By changing the feature maps during detection, Mosaic augmentation significantly improves the network’s ability to generalize across different bolt configurations and backgrounds.
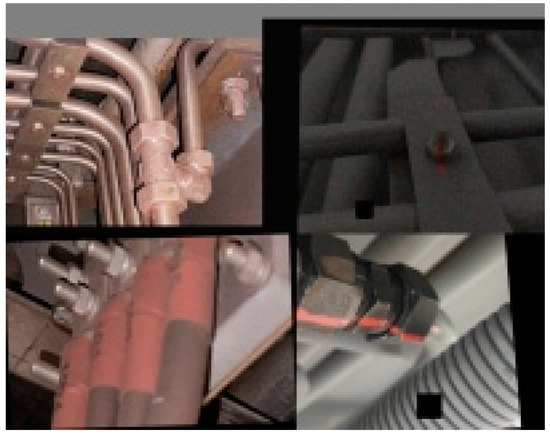
Figure 12.
Results of Mosaic data augmentation.
The use of these comprehensive augmentation techniques not only increases the size of the dataset but also enhances the network’s generalization capability, allowing it to better adapt to real train underframe conditions and avoid overfitting during training.
For network training, the dataset was divided into training, validation, and test sets in a 7:2:1 ratio. Therefore, before data augmentation, 10% of the images, a total of 60, were selected as the test set. Considering the limited number of real underframe images and the higher number of bolt targets per image compared to the testing platform, 40 images from the testing platform and 20 real underframe images were included in the test set, with a total of 183 labels. The remaining 540 images were then augmented, resulting in 2930 images and 7442 labels.
To better enable the trained network to recognize bolts under real underframes, the validation set included 540 real underframe images enhanced by standard data augmentation, 192 images enhanced by Mosaic data augmentation that contain both real underframe and testing platform bolts, and 145 testing platform bolt images enhanced by standard data augmentation. The remaining 2053 images were used as the training set.
5. Experimental Results and Analysis
5.1. Experimental Environment and Basic Configuration
The prepared dataset was placed in the corresponding folders, and the YOLOv8 network training parameters were set. The computer was equipped with an NVIDIA GeForce RTX 4090 GPU with 24 GB of memory and an Intel Core i9-13900KF processor. During training, the improved SFCA-YOLOv8s.yaml was set as the configuration file; the batch size was set to 32; epochs were set to 300; input image resolution was set to 640 × 640; label smoothing was set to 0.1 to reduce the impact of overfitting; learning rate was set to 0.001; and weight decay was set to 5e-4.
5.2. Evaluation Metrics
This study used precision (), recall (), and mean average precision () to evaluate the performance of the trained model in bolt region localization. Precision () refers to the proportion of true positives among the results predicted as positive by the model. The higher the , the lower the model’s false positive rate. Recall () refers to the proportion of true positive samples predicted by the model among all actual positive samples. The higher the , the lower the model’s false negative rate. Average precision () refers to the model’s average detection precision for a single target, denoted as . Mean average precision () is the average of across all targets, and the higher the , the better the model’s detection performance, denoted as . In addition to training accuracy, the image recognition speed of the object detection network, denoted as FPS, can be represented by the number of images processed per second, denoted as . Equations (25)–(29) represent the forms of the evaluation metrics [24].
In the formulas, represents the number of true positives, represents the number of true negatives, represents the number of false positives, and represents the number of false negatives. , is the number of samples, and represents the time taken to process one image.
5.3. Detailed Experimental Analysis
5.3.1. SFC2f Module Experiment
The SRU weights used in the improved SFC2f module need to be selected through actual experiments. Although default values can be theoretically set, actual experiments help determine the optimal weights to achieve the best performance [25]. Using the previously constructed bolt dataset, experiments were conducted to validate 9 different split ratios of α (0.1~0.9), and the results are shown in Table 1.

Table 1.
Experimental results for different SRU weight thresholds.
From the results in Table 1, it can be seen that when the SRU unit’s weight split ratio is between (0, 1), the computational overhead in all 9 cases is consistent, reducing by 0.8 M and 1.6 G compared to the baseline model, indicating that the SRU unit can effectively suppress redundant information in the spatial dimension. Additionally, the values also improved, with = 0.4 yielding the best result at 91.7%. This represents a 1.2% improvement over the original model and is superior to other threshold selection scenarios. The value also increased by 4.3 frames over the original model. In summary, when the split ratio is set to 0.4, the SRU unit contributes optimally to the network.
5.3.2. Lightweighting Effect Analysis
To explore the effect of network lightweighting after replacing C2f with SFC2f, this study used three lightweight model structures: FasterNet [26], GhostNet [27], and Mobilenetv3 [28] to replace the backbone of YOLOv8s as lightweight YOLOv8s models and compared them with the improved SFC2f model. The experimental results are shown in Table 2. The CSPNet baseline model is the initial YOLOv8s network model. FLOPs represent the number of floating-point operations, and the larger the FLOPs, the more complex the model.

Table 2.
Comparison between lightweight networks and the initial network.
As shown in Table 2, SFC2f-Net has FLOPs of 14.2 G, lower than the 15.8 G of the CSPNet baseline, indicating an improvement in lightweighting, while also performing well in maintaining high precision (92.1%) and recall (86.3%). In contrast, although GhostNet has the lowest FLOPs (8.3 G), its precision and recall are relatively lower at 88.6% and 85.1%, respectively, indicating a sacrifice in feature extraction capability during lightweighting. SFC2f-Net has an of 91.7%, higher than the 90.5% of the CSPNet baseline, demonstrating its stability and accuracy in overall detection performance. Additionally, SFC2f-Net achieved 225 FPS, demonstrating good real-time performance. SFC2f-Net, through the optimization of ScConv and Faster_Block, successfully achieved a balance between lightweighting and performance, maintaining high precision and real-time performance with a slight increase in computational complexity, yet still providing excellent overall performance.
To further improve the training accuracy of the network, the CA attention mechanism module was added to the improved network, and the loss function was upgraded to MPDIoU. To eliminate the impact of the increased network layers and parameters caused by adding the CA module on training accuracy, the CA module was replaced with SE and CBAM modules, respectively, under the same conditions, and ablation experiments were conducted. The results are shown in Table 3.

Table 3.
Ablation experiment for the CA attention module.
According to the ablation comparison experiments in Table 3, it can be seen that compared to other attention mechanism modules, the CA module did not significantly increase the number of network layers, parameters, or computational load during its introduction. Specifically, compared to the network without the CA module and MPDIoU, the introduction of the CA module improved precision by 2.7%, recall by 2.9%, and by 2.2%, demonstrating the best improvement. This significant improvement is mainly attributed to the CA attention mechanism’s advantage in feature channel weighting. The CA module weights the feature channels, enabling the model to focus more on important feature channels, thereby learning the relationships between bolt features more effectively. This mechanism helps reduce the model’s attention to the surrounding complex environment, minimizing interference and thereby improving the network’s bolt recognition performance.
During the training of the dataset, overfitting can occur, and the degree of overfitting can be assessed by the difference in target regression loss between the training set and validation set. To verify whether the overfitting issue has been mitigated in the improved network, the target regression loss comparison is shown in Figure 13, where (a) represents the original YOLOv8s target regression loss and (b) represents the improved SFCA-YOLOv8s target regression loss.

Figure 13.
Target loss comparison diagram: (a) YOLOv8s target regression loss; (b) SFCA-YOLOv8s target regression loss.
After training for 300 epochs, the difference in target regression loss between the training set and validation set for the original YOLOv8s network is 0.014, while the difference for the improved SFCA-YOLOv8s network is reduced to 0.011. This indicates that the overfitting issue has been alleviated, and the generalization ability of the network has been improved.
5.3.3. Pruning Effect Analysis
The model’s precision was improved through network enhancements while also reducing the computational load. To further enhance the detection speed, the improved network was pruned using the LAMP score method [29]. Before pruning, certain structures that cannot be pruned need to be skipped. The output layer of the backbone network, responsible for output classification after detection, cannot be pruned; otherwise, it would result in missing output classes, so it must be skipped. Additionally, the experiments found that the Faster_Block module cannot be pruned, so this layer must be skipped as well. For the CA attention module, due to its small number of parameters and the presence of slicing operations that cannot be pruned, the entire module must also be skipped.
After completing these preparations, the network was pruned to varying degrees by adjusting the Speed-up parameter. Speed-up (acceleration ratio) indicates the speed increase of the pruned model compared to the unpruned model; a Speed-up of 1 indicates no pruning was applied. Table 4 shows the effects of pruning.

Table 4.
Pruning effects for different acceleration ratios.
As seen in Table 4, when Speed-up was set to 1.5, the speed only increased by 0.9 FPS, which is not significant enough to achieve the goal of speed improvement. When Speed-up was set to 2.5 and 3, the speed increased by 50.3 FPS and 66.8 FPS, respectively, and the number of parameters was significantly reduced, but the decreased by 6.5% and 9.7%, respectively, significantly affecting the detection accuracy. When Speed-up was set to 2, the speed increased by 36 FPS, the number of parameters decreased by 3.8 M, and the only decreased by 0.6%, providing a clear speed improvement while maintaining detection accuracy. Therefore, the pruning operation corresponding to a Speed-up of 2 was ultimately chosen.
5.3.4. Ablation Experiments
This study used YOLOv8s as the baseline model and made three improvements to construct the SFCA-YOLOv8s model, which was evaluated using mAP, FPS, and GFLOPs to verify the effectiveness of each module. First, the C2f module in the neck of the YOLOv8s network was replaced with the SFC2f module; then, the MPDIoU loss function and CA attention mechanism were added to this network, and their detection effects were tested; finally, the LAMP pruning method with a Speed-up of 2 was used for pruning, and the pruned model’s detection performance was tested. The experimental results are shown in Table 5.

Table 5.
Ablation experiment of the algorithm.
As shown in Table 5, after adding the newly designed SFC2f to the original YOLOv8s network, the speed increased by 4.3 FPS, the model complexity decreased by 1.6 GFLOPs, and the mAP increased by 1.2%, achieving the goal of lightweighting. After adding the MPDIoU and CA modules, the model’s mAP increased by 3.4%, improving detection accuracy and preparing for subsequent pruning. After applying the LAMP pruning method to the model, the final SFCA-YOLOv8s lightweight model reduced the model complexity by 8.5 GFLOPs, increased the speed by 40.3 FPS, and improved the by 2.8% compared to the initial YOLOv8s network.
5.3.5. Comparative Experiment Analysis
To validate the superiority of the proposed algorithm, the improved SFCA-YOLOv8s algorithm was compared with other algorithms under the same experimental conditions, including Mask R-CNN, RetinaNet, YOLOv4, YOLOv5s, YOLOX-s, and YOLOv7. The comparison results are shown in Table 6.

Table 6.
Comparative experiment of various common object detection algorithms.
As seen from the experimental results in Table 6, under the same experimental conditions, SFCA-YOLOv8s demonstrated significant advantages in several key metrics. SFCA-YOLOv8s achieved a precision of 93.5%, the highest among all the compared models, demonstrating extremely high accuracy in the object detection task. Additionally, it achieved a recall of 87.8% and an of 93.3%, also outperforming other algorithms in these two metrics. Particularly in comparison with YOLOv5 and YOLOv7, SFCA-YOLOv8s demonstrated better overall detection performance. In terms of computational efficiency, SFCA-YOLOv8s has 7.7 M parameters, indicating that the model can enhance performance while maintaining a small model size. SFCA-YOLOv8s achieved 261 FPS, far exceeding other algorithms, particularly in comparison with Mask R-CNN (71.2 FPS) and RetinaNet (85.5 FPS), demonstrating superior real-time performance. By incorporating the SFC2f module, CA attention mechanism, and appropriate pruning, SFCA-YOLOv8s successfully achieved a good balance between precision, recall, and computational efficiency, making it highly versatile and practical.
5.3.6. Visualization Comparative Analysis
To visually compare the detection performance of the proposed algorithm with the original YOLOv8s algorithm for underframe bolts, SFCA-YOLOv8s and YOLOv8s models were used for the qualitative analysis on the dataset established in this study, and the detection results were visualized (as shown in Figure 14). As seen in the figure, the proposed algorithm detects more critical bolts without false detections compared to the original model. The visualization results indicate that the proposed SFCA-YOLOv8s algorithm has stronger bolt detection capabilities, can avoid missed detections, and offers certain advantages in detection performance.

Figure 14.
Comparison of detection effects on the actual train underframe: (a) Detection results of the original YOLOv8s model; (b) Detection results of the proposed model.
6. Conclusions
To address the issues of insufficient localization accuracy and slow recognition speed in train underframe bolt detection, a lightweight improved algorithm, SFCA-YOLOv8s, was proposed. Data collection was conducted using a self-developed underframe detection robot, and an image dataset containing various bolt types was constructed. The conclusions drawn from the experiments are as follows:
- The original C2f module of YOLOv8s was improved and replaced with the newly designed SFC2f module, reducing the model’s complexity by 1.6 GFLOPs, while the mAP increased by 1.6%. Additionally, the CA attention mechanism and MPDIoU loss function were introduced, resulting in an improvement in accuracy by 2.8%, recall by 3.7%, and mAP by 3.4%, compared to the original network. This improved the accuracy of bolt localization in complex backgrounds.
- SE and CBAM attention modules were added to the YOLOv8s network for comparison. The results showed that the network with the CA attention module performed better in bolt recognition without significantly increasing the number of parameters and computational complexity. The addition of the CA module also mitigated the impact of increased network layers and parameters on training accuracy.
- LAMP score-based pruning algorithm was introduced. Through experiments, a Speed-up of 2 was selected for pruning, resulting in a 36 FPS increase in detection speed and a reduction of parameters by 3.8M compared to the original network. The final network achieved a 2.8% improvement in mAP. Compared to the original model, the SFCA-YOLOv8s model achieved higher precision, a faster detection speed, lower computational cost, and better balancing detection accuracy, speed, and lightweighting.
Author Contributions
Conceptualization, Z.L.; methodology, Z.L.; software, Z.L.; validation, Z.L. and J.L.; formal analysis, Z.L.; investigation, C.Z.; resources, H.D.; data curation, Z.L.; writing—original draft preparation, Z.L.; writing—review and editing, J.L.; visualization, C.Z.; supervision, H.D.; project administration, H.D. All authors have read and agreed to the published version of the manuscript.
Funding
This study was funded by the Natural Science Foundation of Liaoning Province, grant number 2024-BS-200 and the Fundamental Research Funds for the Provincial Universities of Liaoning, grant number LJ212410150060.
Data Availability Statement
The original contributions presented in this study are included in the article; further inquiries can be directed to the lead author.
Conflicts of Interest
The authors declare no conflicts of interest.
References
- Liu, L.; Gou, J. Research on detection method of railway encroachment obstacles based on YOLOv4. J. Railw. Sci. Eng. 2022, 19, 528–536. [Google Scholar] [CrossRef]
- Junzhi, Z.; Jianxi, Y.; Hao, L. Bridge apparent disease recognition based on improved YOLOv3 algorithm in complex background. J. Railw. Sci. Eng. 2021, 18, 3257–3266. [Google Scholar] [CrossRef]
- Guo, Z.; Zhang, B.; Wang, H. Application of deep learning object detection algorithm in freight train coupler recognition. J. Railw. Sci. Eng. 2020, 17, 2479–2484. [Google Scholar] [CrossRef]
- Yang, P.; Wang, H.; Zhang, Y. A deep learning-based method for detecting bolt loosening of subway car body. J. Rail Transit Equip. Technol. 2021, 288, 38–41. [Google Scholar] [CrossRef]
- Wang, C.; Wang, N.; Ho, S.C.; Chen, X.; Song, G. Design of a new vision-based method for the bolts looseness detection in flange connections. J. IEEE Trans. Ind. Electron. 2020, 67, 1366–1375. [Google Scholar] [CrossRef]
- Sun, J.; Xie, Y.; Cheng, X. A fast bolt-loosening detection method of running train’s key components based on binocular vision. J. IEEE Access 2019, 7, 32227–32239. [Google Scholar] [CrossRef]
- Chang, C.; Yen, C.; Chang, H.; Chen, Y.; Hsu, M.; Wang, W.; Yang, D. An Integrated YOLOv5 and Hierarchical Human-Weight-First Path Planning Approach for Efficient UAV Searching Systems. Machines 2024, 12, 65. [Google Scholar] [CrossRef]
- Yang, R.; Hu, Y.; Yao, Y. Fruit target detection based on BCo-YOLOv5 model. Mob. Inf. Syst. 2022, 20, 1–8. [Google Scholar] [CrossRef]
- Han, G.; Wang, R.; Yuan, Q.; Li, S.; Zhao, L.; He, M.; Yang, S.; Qin, L. Detection of Bird Nests on Transmission Towers in Aerial Images Based on Improved YOLOv5s. Machines 2023, 11, 257. [Google Scholar] [CrossRef]
- Cao, J.; Bao, W.; Shang, H. GCL-YOLO: A ghost conv-based lightweight YOLO network for UAV small object detection. Remote Sens. 2023, 15, 4932. [Google Scholar] [CrossRef]
- Sun, T.; Liu, G.; Tang, Z. Pedestrian detection in lightweight subway station based on MCA-YOLOv5s. Comput. Syst. Appl. 2023, 32, 120–130. [Google Scholar] [CrossRef]
- Hussain, M. YOLO-v1 to YOLO-v8, the Rise of YOLO and Its Complementary Nature toward Digital Manufacturing and Industrial Defect Detection. Machines 2023, 11, 677. [Google Scholar] [CrossRef]
- Wang, J.; Yuan, J.; Zhu, Y. Surface defect detection algorithm for drum rollers based on improved YOLOv8s. J. Zhejiang Univ. (Eng. Ed.) 2024, 58, 370–380+387. [Google Scholar]
- Wang, C.; Liu, H. YOLOv8-VSC: Lightweight algorithm for strip surface defect detection. J. Front. Comput. Sci. Technol. 2024, 18, 151. [Google Scholar]
- Yang, Y.; Kuang, X.; Tang, B. YOLOv5 mask wear detection algorithm based on attention mechanism. Digit. Technol. Appl. 2023, 41, 113–115. [Google Scholar] [CrossRef]
- Li, J.; Wen, Y.; He, L. SCConv: Spatial and channel reconstruction convolution for feature redundancy. In Proceedings of the IEEE/CVF Conference on Computer Vision and Pattern Recognition, Vancouver, BC, Canada, 17–24 June 2023; pp. 6153–6162. [Google Scholar]
- Gu, G.; Jia, Y.; Wen, B. Fault identification algorithm of catenary string and current carrier ring based on YOLOv5s. J. Railw. Sci. Eng. 2023, 20, 1066–1076. [Google Scholar] [CrossRef]
- Wu, S.; Liu, L.; Zhang, H. Research on defect pattern detection algorithm of railway fasteners based on transfer learning. J. Railw. Sci. Eng. 2022, 19, 3612–3624. [Google Scholar] [CrossRef]
- Zhang, J.; Feng, Y.; Wang, S. Image detection algorithm of core bolt based on WLD-LPQ feature. J. Railw. Sci. Eng. 2018, 15, 2349–2358. [Google Scholar] [CrossRef]
- Ai, Q.; Zhang, J.; Wu, F. AF-ICNet unstructured scene semantic segmentation method based on small target category attention mechanism and feature fusion. Acta Photonica Sin. 2023, 52, 189–202. [Google Scholar]
- Zhang, Y.; Ren, W. Focal and efficient IOU loss for accurate bounding box regression. Neurocomputing 2022, 506, 146–157. [Google Scholar] [CrossRef]
- Ma, S.; Xu, Y. MPDIoU: A loss for efficient and accurate bounding box regression. arXiv 2023. arXiv:2307.07662. [Google Scholar]
- Shen, C.; Ma, C.; Gao, W. Multiple attention mechanism enhanced YOLOX for remote sensing object detection. Sensors 2023, 23, 1261. [Google Scholar] [CrossRef] [PubMed]
- Yao, Z.; Yang, H.; Hu, J. Track surface defect detection method based on machine vision and convolutional neural network. J. China Railw. Soc. 2021, 43, 101–107. [Google Scholar]
- Liu, Y.; Liu, Y.; Zhang, Y. Video anomaly detection method integrating SCConv and attention mechanism. Control. Eng. 2024, 1–9. [Google Scholar] [CrossRef]
- Wu, K.; Xu, Z.; Shan, H. Rapid detection method of glass insulator self-explosion defect based on FasterNet and YOLOv5. High Volt. Technol. 2024, 50, 1865–1876. [Google Scholar] [CrossRef]
- Zou, Y.; Gao, Y.; Zhao, N. Research on crack detection of concrete dam based on improved Yolov5s. Autom. Instrum. 2023, 289, 1–5+15. [Google Scholar]
- Huo, Y.; Zhang, J.; Chen, T. Dynamic gesture recognition method based on improved YOLOv5+Mobile Net. Software 2023, 44, 47–52. [Google Scholar]
- Liu, L.; Zhang, S.; Bai, Y. Lightweight military aircraft detection algorithm based on improved YOLOv8. Comput. Eng. Appl. 2024, 1–15. Available online: http://kns.cnki.net/kcms/detail/11.2127.TP.20240624.1509.008.html (accessed on 10 August 2024).
Disclaimer/Publisher’s Note: The statements, opinions and data contained in all publications are solely those of the individual author(s) and contributor(s) and not of MDPI and/or the editor(s). MDPI and/or the editor(s) disclaim responsibility for any injury to people or property resulting from any ideas, methods, instructions or products referred to in the content. |
© 2024 by the authors. Licensee MDPI, Basel, Switzerland. This article is an open access article distributed under the terms and conditions of the Creative Commons Attribution (CC BY) license (https://creativecommons.org/licenses/by/4.0/).