Article

End-of-Life Prediction for Milling Cutters Based on an Online Vibro-Acoustic System

Department of Mechanical, Energy and Management Engineering, University of Calabria, 87036 Rende, Italy
*
Author to whom correspondence should be addressed.
Machines 2024, 12(10), 703; https://doi.org/10.3390/machines12100703
Submission received: 16 August 2024 / Revised: 18 September 2024 / Accepted: 2 October 2024 / Published: 3 October 2024
(This article belongs to the Section Machines Testing and Maintenance)

Abstract

:
Improving the capabilities of online condition monitoring systems, able to detect arising of catastrophic wear on cutting tools, has been an important target to be pursued for the metal cutting industry. Currently, different systems have been proposed, moved by the rising need of part quality improvements and production cost control. Despite this, cutter wear development, being related to several process variables and conditions, is still really difficult to be predicted accurately. This paper presents a detection wear method based on the time-domain analysis of vibro-acoustic signals. Specifically, cutter wear monitoring, using sound signals of a milling process, was performed at a laboratory level in a well-isolated working room. Sound signals were recorded at fixed main machining parameters, i.e., cutting speed, feed rate and depth of cut. The tests were carried out starting with a new set of inserts with significant wear conditions for the investigated process configuration. Results showed a consistent overlapping between the beginning of the catastrophic wear and an evident increment in the trend of the root mean square of the monitored acoustic signal, showing the potential of the methodology in detecting a suitable time to stop the milling process and to change the worn-out cutters.

1. Introduction

In the context of the manufacturing industry, monitoring of cutting tools’ wear represents a key aspect to be considered for such companies, which deal with cutting operations on a daily basis. Operators and various online systems allow the cutting tools to be continuously inspected, with the aim of preventing breakage and of guaranteeing high accuracy and surface quality of the final product. As a matter of fact, wear impacts inserts’ quality and the precision of machining operations since the shape of the cutting-edge changes gradually, owing to thermo-mechanical factors, during the execution of the process [1]. Furthermore, inserts’ wear can result in process damping, since, due to it, the dynamic properties of the process change [2]. Therefore, proper monitoring methods and the prediction of tools’ lives is becoming an important factor to take into account for lowering maintenance costs, extending tools’ lives and making timely decisions. Indeed, the failure or damage of a cutting tool has important consequences on productivity, since it can result not only in production losses but also in the rejection of produced components. It is worth pointing out that the prediction of machining tools’ wear is truly difficult owing to the several process conditions that may be set, to the worked materials and to the specific operations that have to be performed on the workpiece [3,4]. Usually, process parameters are optimized in order to minimize tool wear. Furthermore, when sensors are used, signals are influenced by the effects related to various inserts, making monitoring more challenging [1]. Two main methods can be used to measure tool wear. The first one consists of a direct measurement through microscopes, for instance, or by using optical, laser and ultrasonic methods [5]. This is an accurate method, but the tool often has to be removed from the machine and, therefore, the working operations have to be stopped. The advantage of this method is related to its high accuracy; however, on the other hand, it is considered not so convenient from a technical and economical point of view. The second is an indirect method and, in line with the Industry 4.0 context [6,7], which also includes the development of digital twin machine tools [8] and artificial intelligence techniques [9], employs sensors measuring, for instance, vibrations, forces, temperatures and images [10], without interfering with the machining process. Nonetheless, signals monitored by sensors can be affected by boundary process conditions, making monitoring more challenging [11]. Furthermore, the stochastic and nonstationary nature of the acquired signals has to be taken into account [12]. According to this second method, the most widely applied solutions are based on the analysis of cutting force [13], thermal imaging [14], vibration signals [15] and acoustic emissions [16].

1.1. Indirect Methods for Measuring Tool Wear

Lin and Lin [17] trained a neural network using force signals and used a regression model to obtain information about the tool wear conditions during the processing of aluminium. Cutting forces are dependent on tool conditions. Indeed, higher cutting forces are required when flank wear increases. This is due to a wider contact area between a tool’s cutting edge and the workpiece [18]. Cutting forces, however, are measured by dynamometers, equipment that is not only expensive but, above all, difficult to install. Concerning thermal imaging, the frictional heat generated at the interface between a tool and the workpiece causes an increase in tool temperature. Monitoring the temperature history can provide information about the tool itself. The thermal camera is a common device used for temperature monitoring because of its accuracy, even if its position on the workpiece may represent a problem [19,20]. Vibrations, if well monitored and analysed, can provide interesting information about the tool condition since the frequency level changes according to the tool wear status [21]. Furthermore, the chip formation instability also increases [22,23,24]. The friction between the cutter and the workpiece also causes chatter, which represents, together with the tool wear, a crucial aspect to consider and monitor for ensuring a high surface quality of the machined part [25,26]. Experimental studies proposed vibration-based models and machine learning techniques for wear detection, with an accuracy ranging from 94% to 98% [12,27,28], and for tool damage progression monitoring [29]. For vibration measurements, piezoelectric accelerometers have been used, in frequencies usually up to 50 kHz [6], but innovative and wireless devices represent a cost-effective alternative for tool wear condition monitoring [30,31]. Even though the analysis of vibrations is considered a non-destructive technique, its main drawback is related to the presence of noise. Xue et al. [32] carried out an experiment with a tool condition monitoring system based on a homemade intelligent ring, able to collect vibrations signals, which was conveniently denoised and achieved an accuracy of around 99%. Finally, Yang et al. [2] presented an online method for analysing the dumping behaviour of cutting vibrations and their influence on tool wear, demonstrating that the local mean damping ratio of milling vibration increases with tool wear.

Acoustic Emissions’ Monitoring

Several researchers studied the acoustic signals generated during the milling process in a multi-sensory approach, using force, sound, vibration and acoustic emission sensors for developing a wear model detection, finding an optimal combination of sensors [33,34]. Recently, Gong and Huo [35] proposed an indirect tool monitoring system for a micro-milling process, which employed a dynamometer and acoustic emission sensors for creating a subsystem for collecting all the acquired data. Brittle and ductile materials were investigated, and a back propagation neural network was chosen to build the tool wear prediction models. However, analysing acoustic emissions may become very challenging owing to external noise; therefore, a system characterised by a very high acquisition rate is required [36]. Liu and Liang [37] recorded acoustic emissions during the plastic deformation of a material processed by peripheral milling, considering an energy measurement for predicting tool wear and for monitoring the process. Sundaram et al. [38] employed acoustic emission sensors for detecting breakage, chatter vibration and for monitoring the general status of cutters. They highlighted that signals above a frequency of 200 kHz are interesting for monitoring the flank tool condition and allow to foresee its wear. Shi et al. [39] considered the cutting sound signal for detecting tool breakage. The proposed methods allowed us to clearly distinguish the sound generated by a new tool and by a worn-out one, as well as from all the other sounds recorded during the execution of a milling process. Ferrisi et al. [40] created a dataset based on registrations of acoustic emissions acquired during an experimental milling campaign and registered by using an industrial microphone, aiming at investigating and implementing a convolutional neural network for predicting the tool wear status, achieving an accuracy of 90%. Summing up what is described above, the scientific literature offers several methodologies, which are focused on the correlation between signals and the tool wear status.

1.2. Aim of This Study

In the proposed research, the trend of the root mean square (RMS) of acoustic signals was correlated with a cutting tool’s wear progress during a milling process, aiming at providing a direct and efficient means for monitoring the tool degradation. Regarding the RMS, it is included among the parameters extracted by acoustic emissions (AEs) or vibration systems, allowing us to study related signals by analysing their features. Furthermore, the RSM is not dependent on signal duration; hence, it can be used both for transient and continuous signals [41]. The RMS was analysed, for instance, from the vibration signal velocity, together with other criteria, to evaluate the wear in the spindle bearings of machining centres [42]. Indeed, Zhao [43] and Kim et al. [44] conducted measurements of noise and vibration during bearing rotations. Their findings demonstrated that damage to the component could be identified through both the signal amplitude spectrum and the RMS value of the vibration signal. The RMS was already used for correlating raw acoustic emission signals and wear conditions in the context of drilling and turning processes. Klocke et al. [45] investigated the flank wear of drilling tools and analysed the recorded acoustic emission signals with the k-means algorithm. In the frequency range of 150–250 kHz, an accuracy of 100% was found. Patra [46] determined RMS values of AE signals during the drilling of mild steel. The analysis showed an increasing trend of the RSM linked to an increasing trend of drilling tool wear. Leng et al. [47] analysed AE signals, aiming at monitoring and predicting drilling tool wear in case of CFRP/TC4 stacks. The study focused on the calculation of the RMS, mean, skewness and kurtosis values. The recorded RMS values oscillated according to the holes, but displayed periodical behaviour, while the skewness and kurtosis did not show regularity, highlighting the difficulties in diagnosing tool wear when such kinds of materials are processed. Bhuiyan et al. [48] monitored cutting tool conditions during turning using the RMS signals and the fast Fourier transformation. For this particular investigation, the experiment showed that the AE and vibration components can effectively respond to the tool state and the different occurrences in turning. However, this study is focused on monitoring wear growth at constant time intervals during the milling process and by using five inserts simultaneously. The selection of this process configuration is related to a real case study, since there was a need to investigate an easy-to-use approach for estimating tool wear. Therefore, comprehensive experiments were conducted, and the RMS values of the signals were analysed. The RMS selection was related to the efficiency highlighted in the above-cited studies during the analysis of other machining processes. To validate the efficacy of the proposed approach, new sets of inserts was employed at specific process configurations. Microscopical pictures of the inserts were taken, with the worn-out ones being measured, and correlated with the RMS values. A more detailed outline of this paper is as follows. Section 2 illustrates the experimental setup and discusses the methodology. Section 3 discusses the results and the effectiveness of the proposed method. Section 4 provides concluding remarks and an overview of future developments.

2. Methods

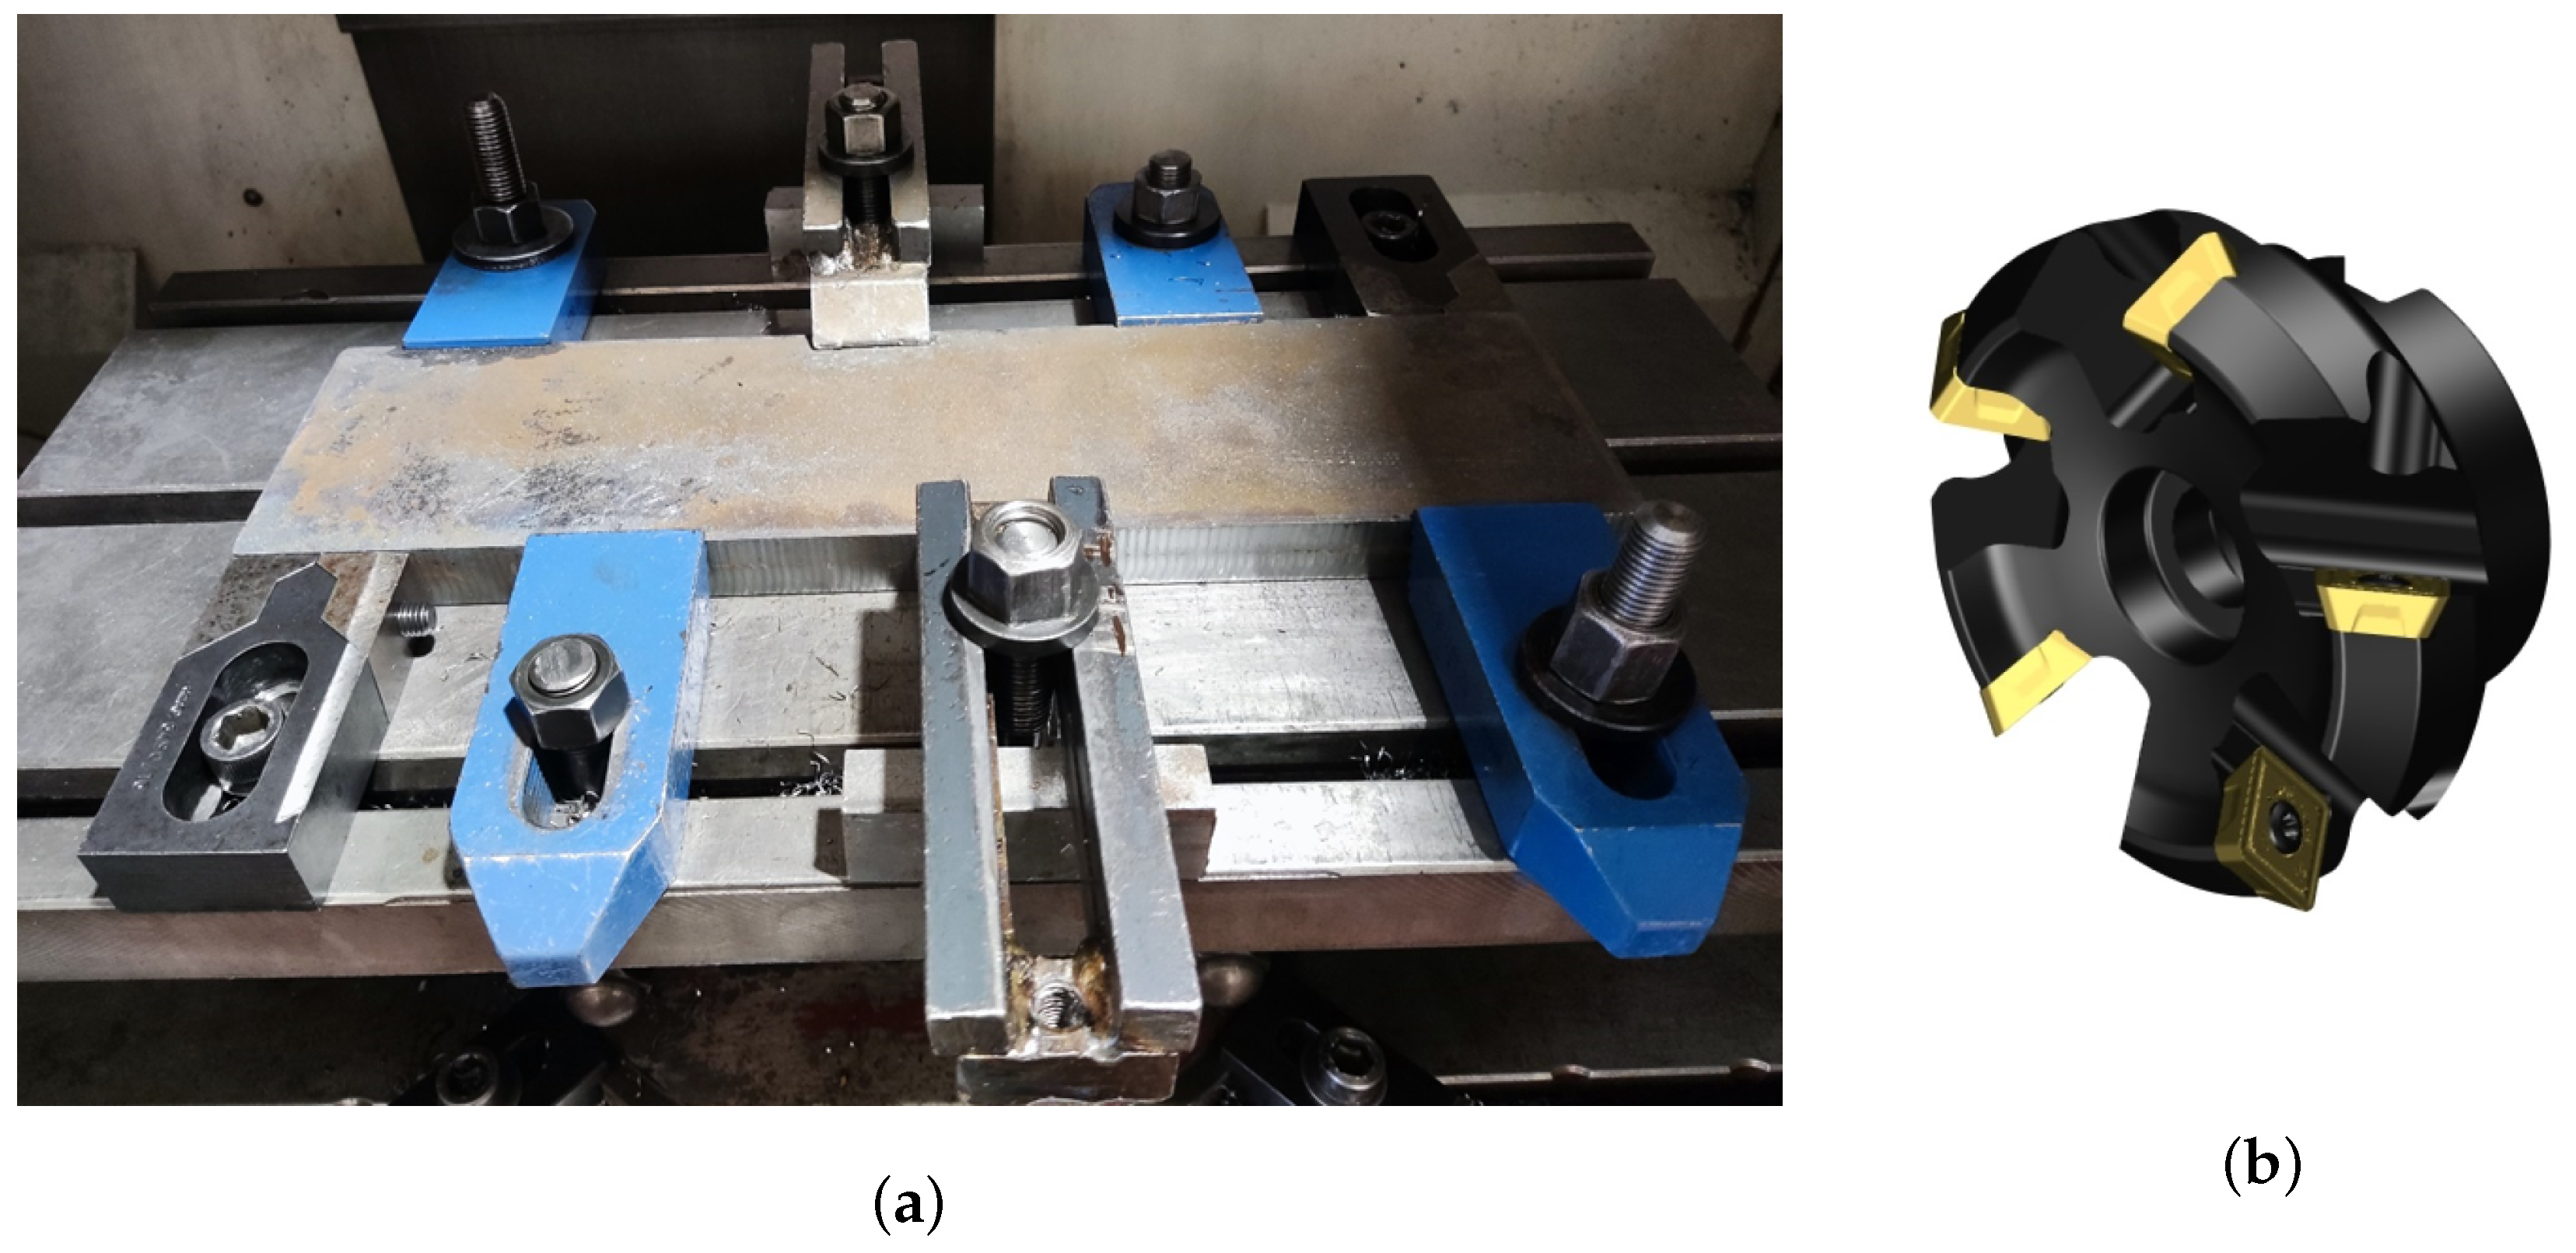
The experimental campaign was based on a series of tests executed by a Mazak Nexus Model 410A CNC Vertical Machining Center and using CoroMill 245 face milling cutters, produced by Sandvik Italia SpA—Div. Coromant—Via A. Raimondi, 13 Milan. The CoroMill 245 was designed for high-productivity processes. The diameter of the cutter was 63 mm, while the inserts were characterised by a lead angle of 45 degrees. This angle affects the cutting forces during the machining phase. The experimental campaign started with five new milling cutters. The experimental campaign was planned, fixing some of the main process variables. Specifically, a feed rate ( f v ) of 1600 mm/min and a spindle speed (S) of 1400 rpm were set, taking into account the working ranges provided by the producer. Two depths of cut ( a p ) of 3 and 4.5 mm were, instead, analysed to highlight the effect on the acoustic signal trend due to a different interaction between cutters and machined plates. The dimensions of the plates are shown in Figure 1, Figure 2a illustrates the employed clamping system, and Figure 2b displays the face milling cutters.
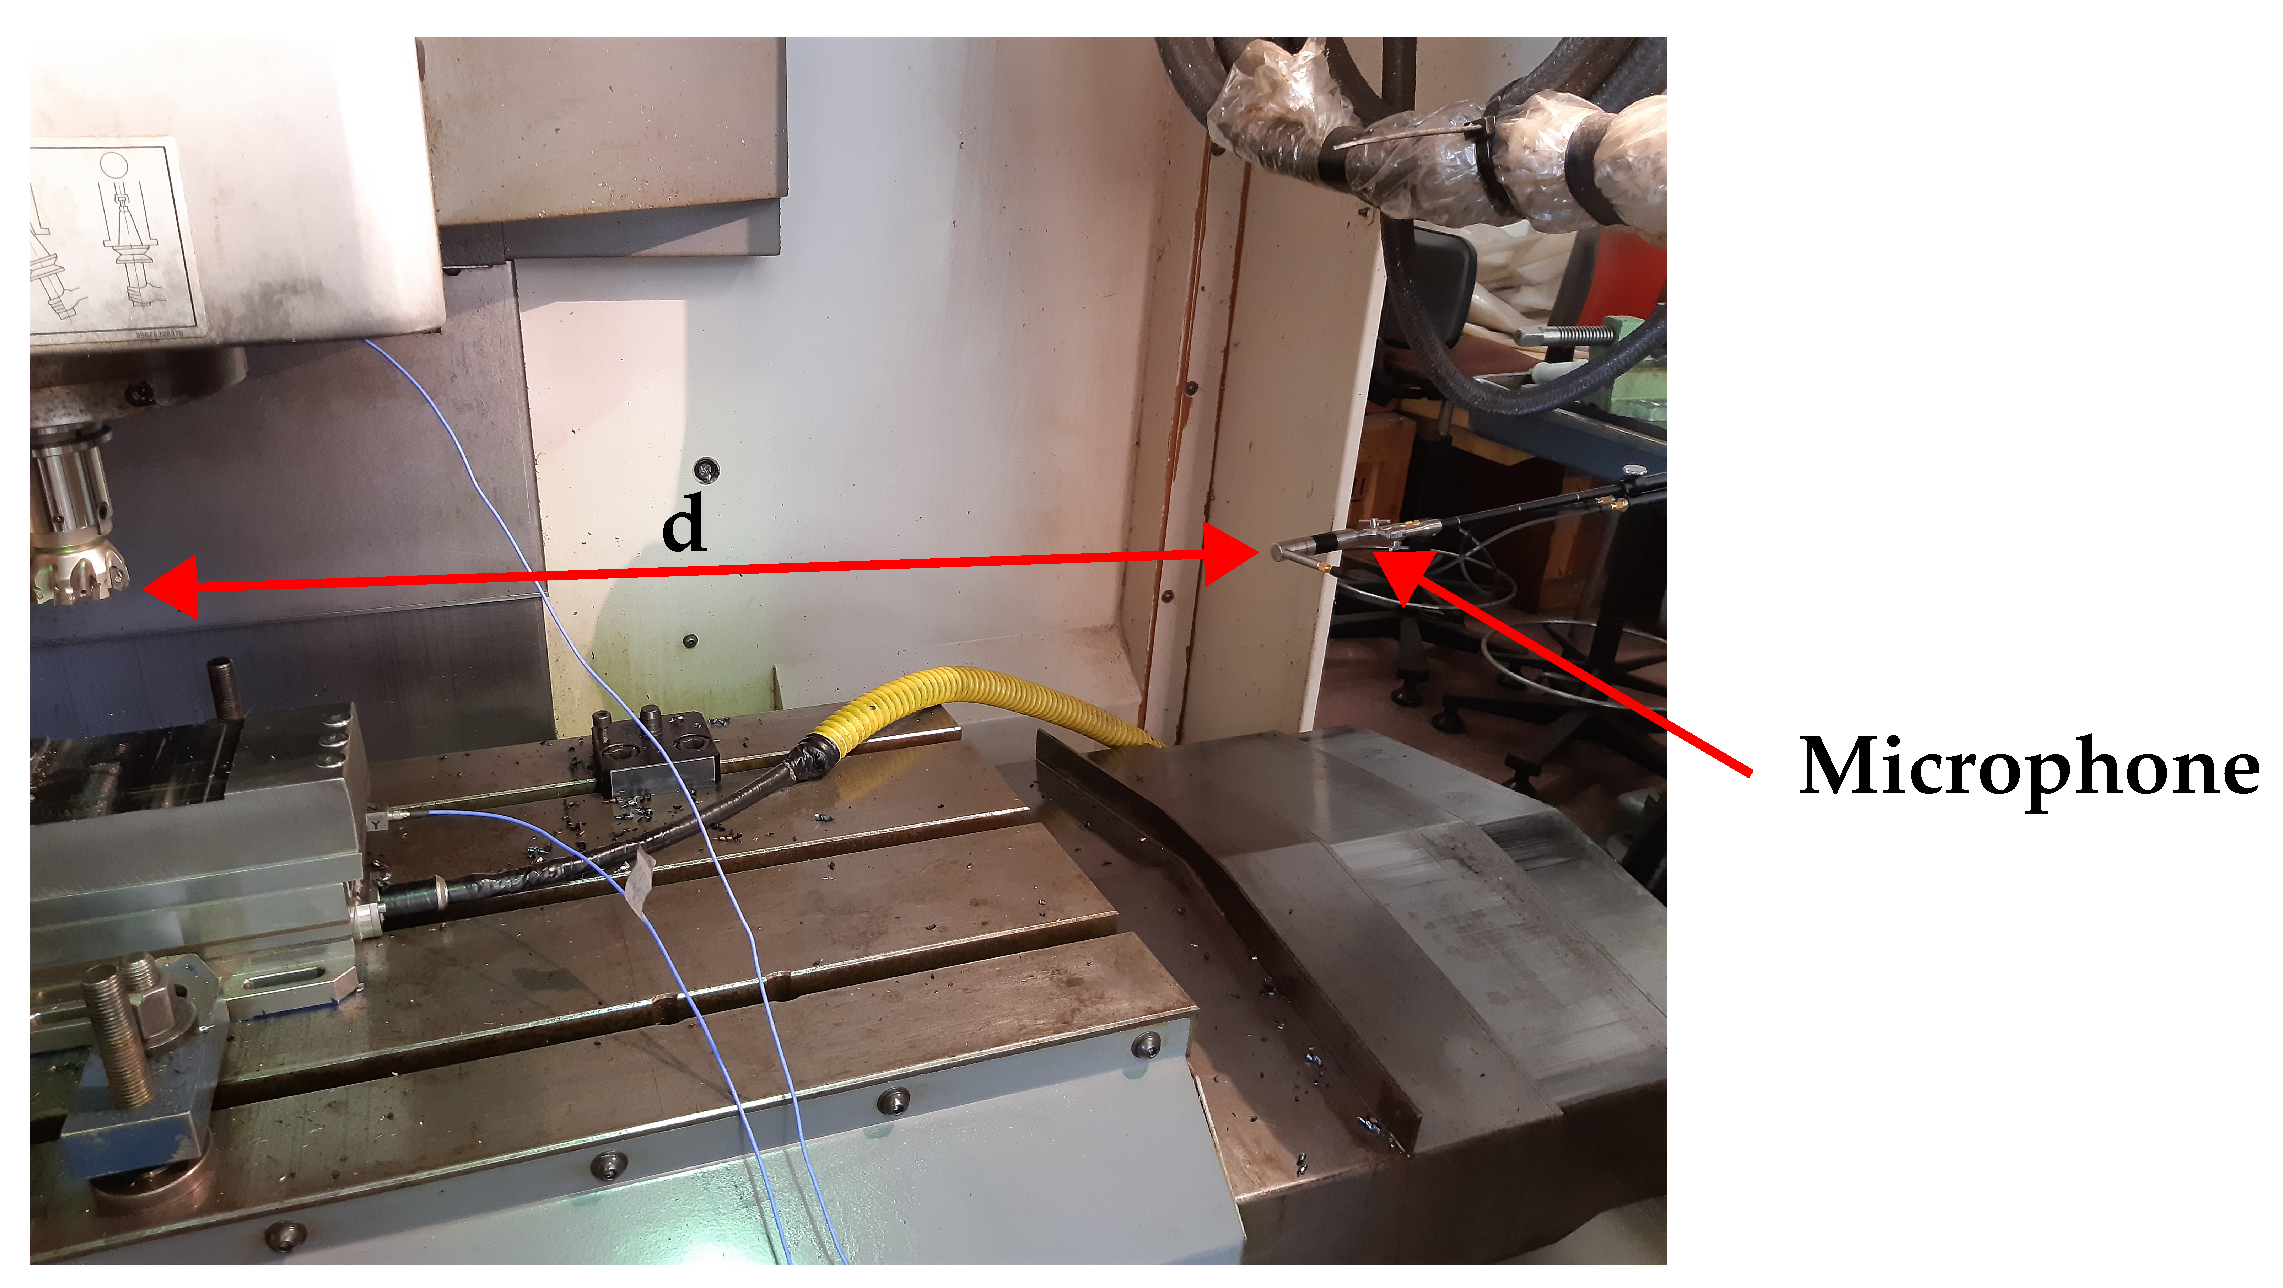
The used workpiece, depicted in Figure 2, comprised a single plate of medium carbon steel C40 that was machined by a single full immersion movement of the milling cutter to achieve a residual thickness of 2 mm. At the end of each plate’s processing, the milling cutter was unhooked from the spindle of the machining centre and the shape of the inserts was measured, acquiring micrographs with a Leica DM400M optical microscope produced by Leica Microsystems Srl All Microscopy and Histology, Via Emilia, 26 Buccinasco (MI), I-20090 Italy. The camera captured the images, obtaining micrographs different working times. The area of the cutters, where wear is expected, was observed. The measurements extracted from these micrographs for the all five cutters were used as a key indicator of the tool’s wear state and to determine the wear rate as well as when the cutters should be replaced [49]. As visible in Figure 3, during the experimental campaign, the acoustic signal of processing was recorded, with a sample frequency (Fs) equal to 44,800 Hz—through a 40 GI GRAS microphone with a sensitivity of 12.5 mV/Pa and a frequency range from 30 Hz to 10 kHz. The microphone was placed inside the milling working area at a distance “d” of about 1 m from the cutting tool. A Matlab code was developed to process and analyse the RMS of the vibro-acoustic signals using a time window length of one second without window overlapping. In particular, the RMS value of the signal ( X r m s ) was calculated as
X r m s = i = N F s N x i 2 F s
where N is the index of the last acquired signal sample. The RMS use of vibro-acoustic signals for the tool’s wear development analysis is justified by the fact that the RMS value of a signal is straightforward, involving simple mathematical operations, which makes it computationally efficient and suitable for real-time signal processing applications.

3. Results

The wear progress, V B m a x , of one of the five inserts for the configuration with a p of 3.0 mm at the milling machining progress is illustrated in Figure 4, where the average values and the confidence intervals are reported.
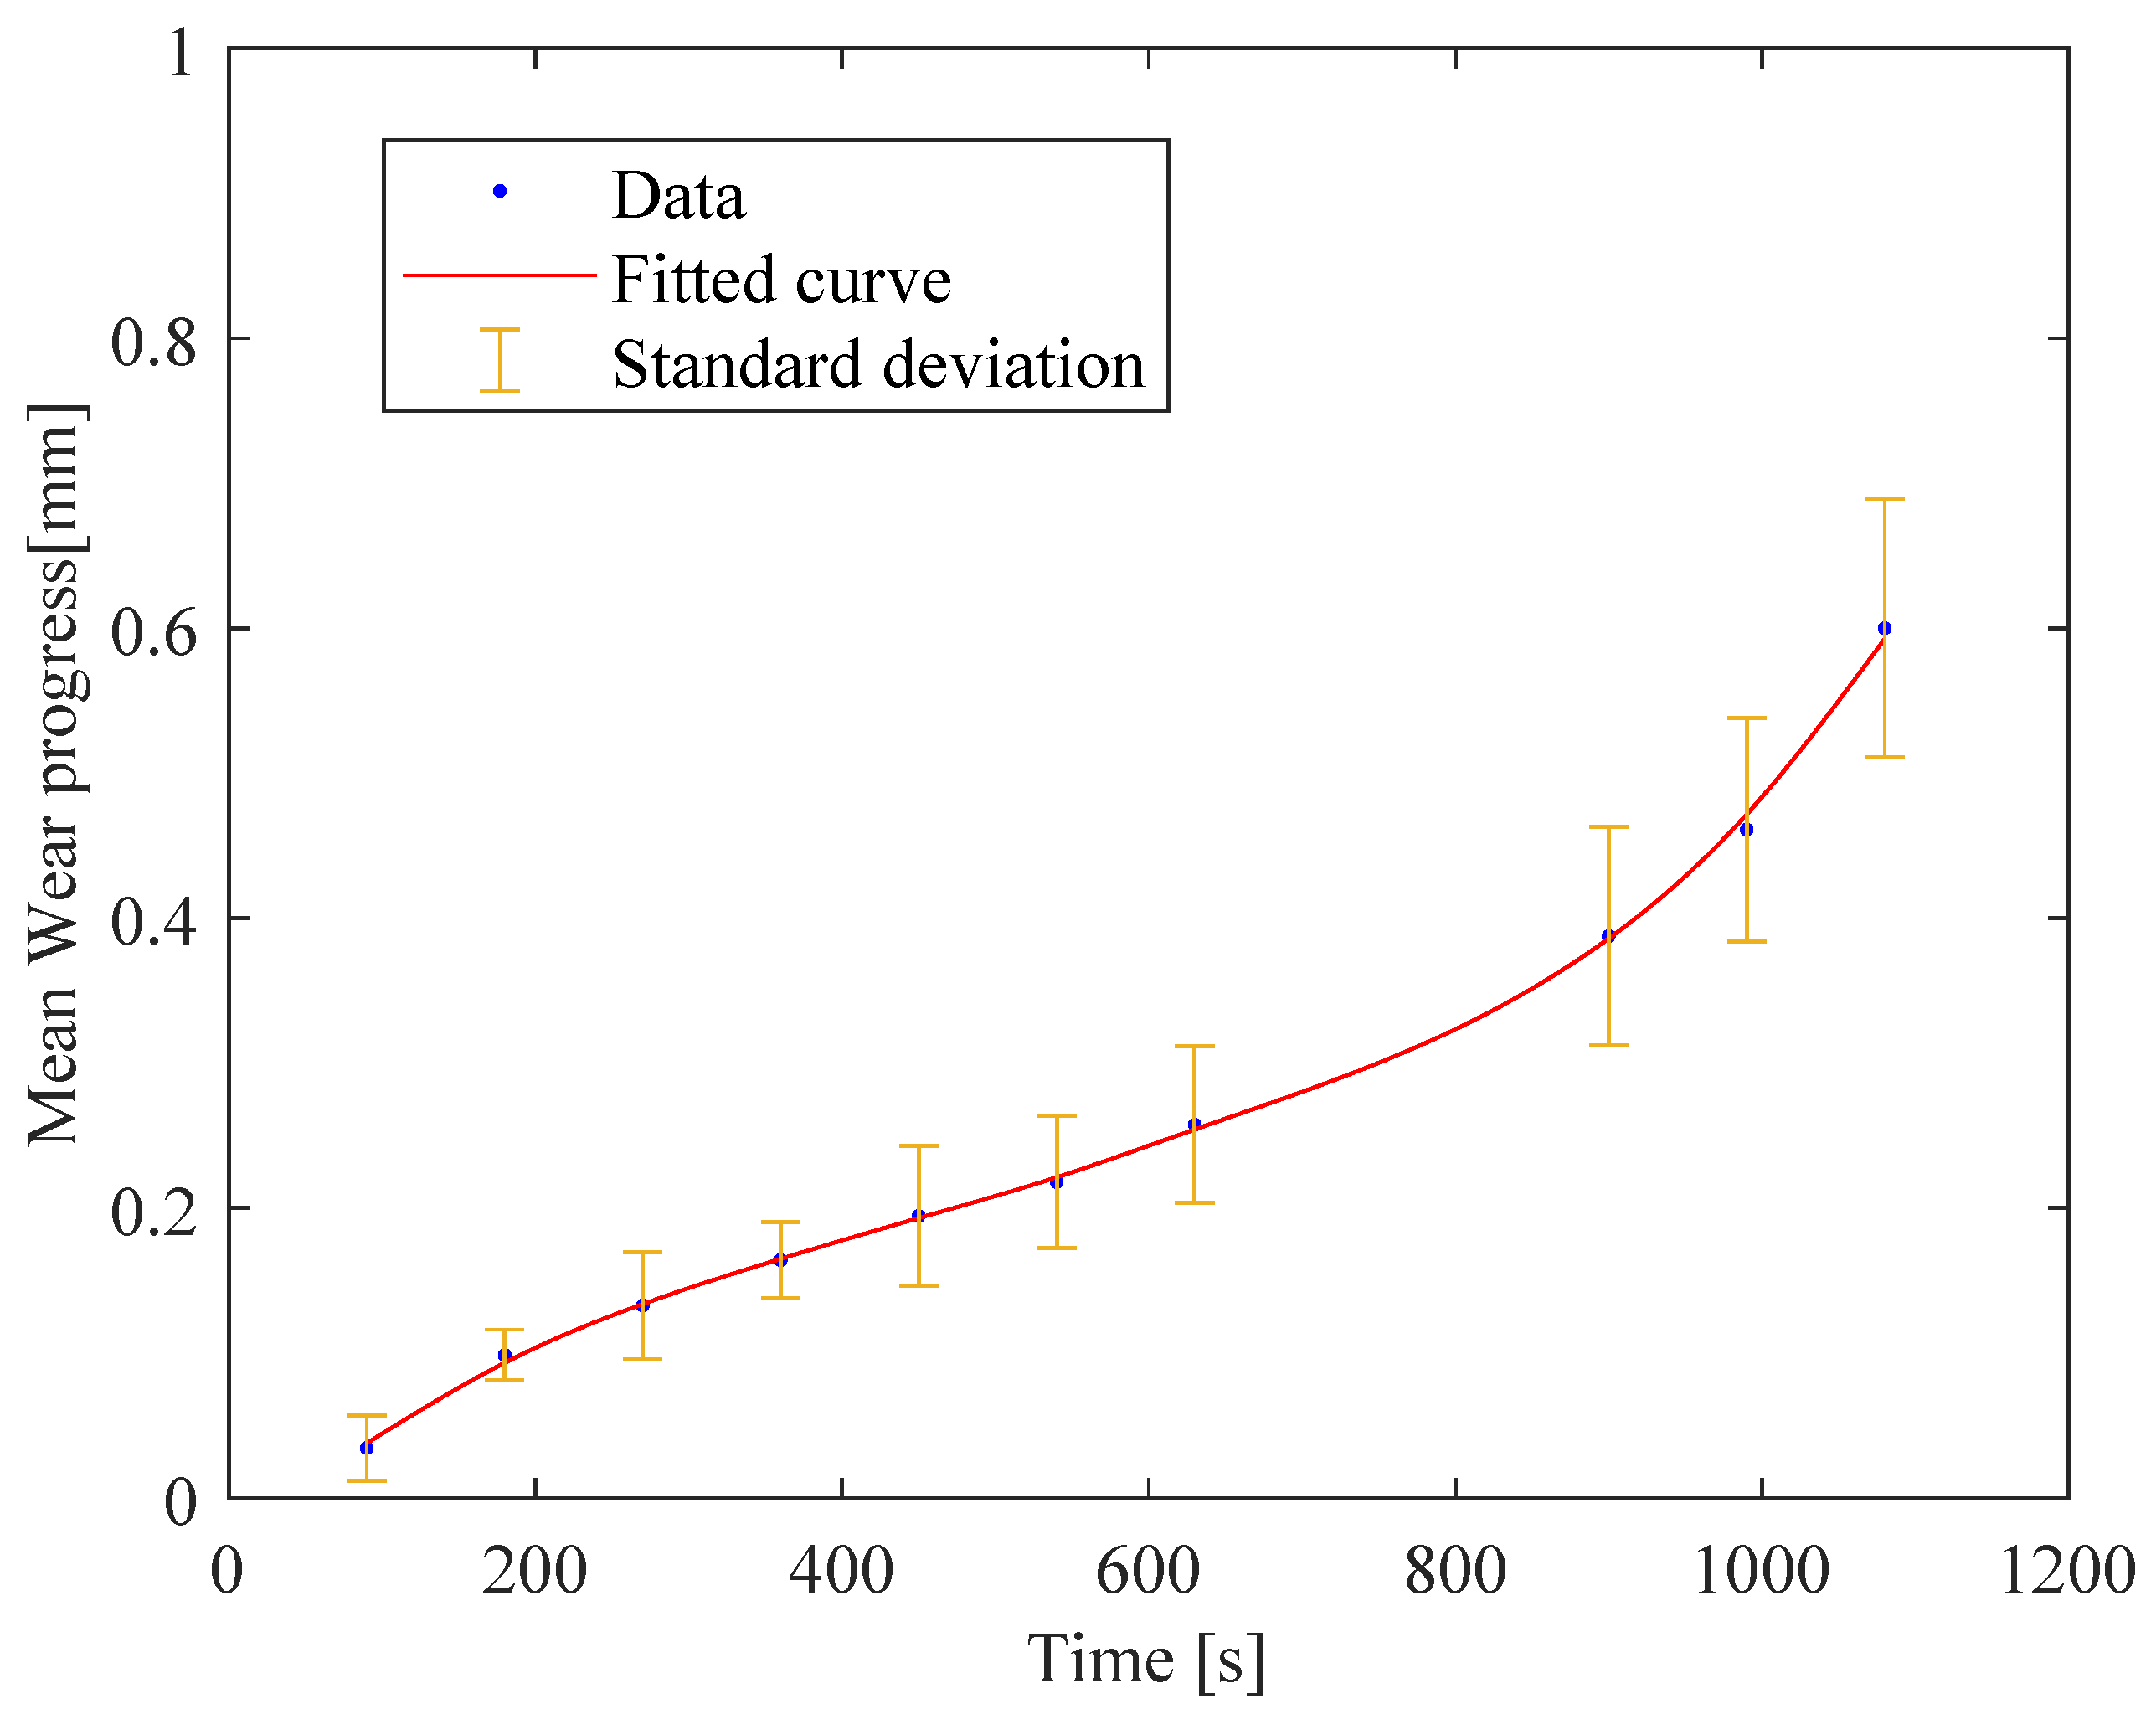
After the first machining process, the cutting tool appeared to be in a relatively new or good condition with no visible signs of wear or damage. A slight change in the tool’s appearance, possibly due to the beginning of wear or the accumulation of material on the cutting edge, was observed from the end of the second plate to the end of the fourth plate. As the machining process continued, the wear became more noticeable at the insert’s surface, showing signs of abrasion. The cutting edge started to show rounding or small notches, indicating that the tool was gradually degrading after the machining of the fifth plate. The wear was more noticeable at the end of the ninth plate, where the edge of the tool showed significant signs of wear, such as a larger rounded area and potential chipping. The surface finish of the tool became increasingly rough, and discolouration suggested the presence of high temperatures or oxidation. Twelve plates were machined to reach severe wear conditions, numbered from 1 to 12 in Figure 4. The graph reported in Figure 5 shows a plot of the mean values of wear progress of the five inserts against time (t) in seconds. The standard deviation is also illustrated.
The overall trend illustrated by the graph is a clear increase in tool wear as time progresses, which is typical in machining operations due to the continuous contact and friction between the tool and workpiece. The rate of wear acceleration increased over time, as indicated by the curvature in the plotted line. This confirms that wear is not occurring linearly but accelerates as the insert degrades, which is often the case when the wear significantly impacts the tool’s performance. It has to be highlighted that all five inserts were characterised by a continuous wear increment even at different progress rates. The RMS values of the acoustic signals, recorded for each performed experimental test, were calculated using a monitoring time window of one second without overlapping. The mobile window was set considering the same investigated range time for each processed plate. This choice was made to enable the comparison of acoustic signals from areas with the same clamping conditions. The obtained RMS values were compared with the measured tool wear at the same processing time. Figure 6 shows the trend of the RMS value as a function of the mean value of wear progress for all the inserts for the configuration with an a p of 3.0 mm.
Looking at this curve, it is possible to identify the first phase of the process, in which the wear progress is strictly connected to a gradual increment in the RMS values of the acoustic signals. This phase can be justified by the decrease in the initial sharpness of the cutting edges, which has an effect on how they adapt their shape with respect to the machined plate. After that, a second phase is clearly recognisable, in which the wear is characterised by a regular and linear trend without affecting the RMS values, which remain approximately constant. Finally, once the wear reaches a value of around 0.4 mm, the RMS values rise suddenly because of a sharp increase in wear. The value of 0.4 mm has to be highlighted because, as is visible by looking at Figure 5, the wear starts growing exponentially at this value. This is the point at which severe wear rapidly progresses to catastrophic conditions, necessitating the stoppage of the machining process to prevent and avoid tool fracture and product damage. The same consideration can be extracted by looking at the second process configuration performed with an a p of 4.5 mm (Figure 7). Herein, a catastrophic cutter condition occurred at the same mean wear progress value even when higher RMS values were monitored due to a higher interaction between the cutters and machined plates.
Taking into account the highlighted experimental evidence, it can be stated that the RMS values of acoustic signals, measured at constant boundary process conditions, are valuable indicators for detecting the milling conditions at which the substitution of inserts starts to be strongly recommended.

4. Conclusions

Acoustic monitoring of milling processes can be an easy-to-apply detection method for preliminary wear monitoring, at least at a laboratory level, where background noises can be controlled. The use of acoustic signals to determine the level of tool wear can be promising because it allows us to apply this type of monitoring logic on already existing milling machines without the need of invasive interventions for the installation of additional sensors. The results confirmed that it is possible to identify the beginning of catastrophic wear condition for a milling cutter made using five inserts by looking at the RMS values of the acoustic signals detected during the process, paving the way for the implementation of in-process monitoring and alerting strategies. The results, for an a p equal to 0.3 mm, demonstrated that the sensitivity of the proposed method fluctuates around a value of 1.22 ± 0.3 [Pa/mm] when the progress of the wear level is below 0.3 mm. After this level of wear, the sensitivity increases up to a value close to 11 [Pa/mm] when the progress of wear exceeds 0.5 mm. In case of an a p equal to 4.5 mm, the sensitivity of the proposed method is around a value of 1.74 ± 0.24 [Pa/mm] when the progress of the wear level is below 0.25 mm. Once this level of wear is exceeded, the sensitivity value rises linearly to a maximum value of 5 [Pa/mm]. The next step of our research will be a deeper analysis of the acoustic signals, focusing on an energy measurement of the monitored sound waves to determine wear progress. This approach aims to reduce the influence on the results, which are currently heavily dependent on the effective isolation of the working room from external noises, as well as to achieve homogeneous boundary process conditions, which can be challenging to establish in industrial applications.

Author Contributions

Conceptualization, F.G. and M.P.; methodology, F.G. and M.P.; software, M.P.; validation, R.C., F.G. and G.Z.; data curation, M.P., R.C. and G.Z.; writing—original draft preparation, R.C. and F.G.; writing—review and editing, M.P. and F.G.; supervision, F.G. All authors have read and agreed to the published version of the manuscript.

Funding

This research received no external funding.

Data Availability Statement

Data are available upon request.

Conflicts of Interest

The authors declare no conflicts of interest.

References

  1. Alswede, F.A.J. Study of Vibration for CNC Machine at Difference Feed. Int. J. Adv. Res. Technol. 2014, 3, 21–29. [Google Scholar]
  2. Yang, B.; Wang, M.; Liu, Z.; Che, C.; Zan, T.; Gao, X.; Gao, P. Tool wear process monitoring by damping behavior of cutting vibration for milling process. J. Manuf. Process. 2023, 102, 1069–1084. [Google Scholar] [CrossRef]
  3. Yang, Q.; Mishra, D.; Awasthi, U.; Bollas, G.M.; Pattipati, K.R. Tool wear and remaining useful life estimation in precision machining using interacting multiple model. J. Manuf. Syst. 2024, 74, 367–386. [Google Scholar] [CrossRef]
  4. Mirad, M.M.; Das, B. Machine learning coupled with acoustic emission signal features for tool wear estimation during ultrasonic machining of Inconel 718. Mach. Sci. Technol. 2024, 28, 119–142. [Google Scholar] [CrossRef]
  5. Sharma, D.; Hiremath, S.S. Review on tools and tool wear in EDM. Mach. Sci. Technol. 2021, 25, 802–873. [Google Scholar] [CrossRef]
  6. Pimenov, D.Y.; Kumar Gupta, M.; da Silva, L.R.; Kiran, M.; Khanna, N.; Krolczyk, G.M. Application of measurement systems in tool condition monitoring of Milling: A review of measurement science approach. Measurement 2022, 199, 111503. [Google Scholar] [CrossRef]
  7. Cheng, W.; Outeiro, J.; Costes, J.P.; Karouni, H.; Dorlin, T.; Saoubi, R.M. 3D modeling of turning of Ti-6Al-4V titanium alloy using a constitutive model considering the state of stress. Mach. Sci. Technol. 2023, 27, 422–451. [Google Scholar] [CrossRef]
  8. Gururaja, S.; Singh, K.K. Development of smart manufacturing framework for micromilling of thin-walled Ti6Al4V. Mach. Sci. Technol. 2024, 28, 459–488. [Google Scholar] [CrossRef]
  9. Shaban, Y.; Yacout, S.; Balazinski, M.; Jemielniak, K. Cutting tool wear detection using multiclass logical analysis of data. Mach. Sci. Technol. 2017, 21, 526–541. [Google Scholar] [CrossRef]
  10. Mohanraj, T.; Shankar, S.; Rajasekar, R.; Sakthivel, N.; Pramanik, A. Tool condition monitoring techniques in milling process—A review. J. Mater. Res. Technol. 2020, 9, 1032–1042. [Google Scholar] [CrossRef]
  11. Abhilash, P.M.; Chakradhar, D. Performance monitoring and failure prediction system for wire electric discharge machining process through multiple sensor signals. Mach. Sci. Technol. 2022, 26, 245–275. [Google Scholar] [CrossRef]
  12. Madhusudana, C.; Kumar, H.; Narendranath, S. Condition monitoring of face milling tool using K-star algorithm and histogram features of vibration signal. Eng. Sci. Technol. Int. J. 2016, 19, 1543–1551. [Google Scholar] [CrossRef]
  13. Elbestawi, M.; Papazafiriou, T.; Du, R. In-process monitoring of tool wear in milling using cutting force signature. Int. J. Mach. Tools Manuf. 1991, 31, 55–73. [Google Scholar] [CrossRef]
  14. Bagavathiappan, S.; Lahiri, B.B.; Suresh, S.; Philip, J.; Jayakumar, T. Online monitoring of cutting tool temperature during micro-end milling using infrared thermography. Insight Non-Destr. Test. Cond. Monit. 2015, 57, 9–17. [Google Scholar] [CrossRef]
  15. Zhou, Y.; Sun, W. Tool Wear Condition Monitoring in Milling Process Based on Current Sensors. IEEE Access 2020, 8, 95491–95502. [Google Scholar] [CrossRef]
  16. Uekita, M.; Takaya, Y. Tool condition monitoring for form milling of large parts by combining spindle motor current and acoustic emission signals. Int. J. Adv. Manuf. Technol. 2017, 89, 65–75. [Google Scholar] [CrossRef]
  17. Lin, S.; Lin, R. Tool wear monitoring in face milling using force signals. Wear 1996, 198, 136–142. [Google Scholar] [CrossRef]
  18. Shankar, S.; Mohanraj, T.; Rajasekar, R. Prediction of cutting tool wear during milling process using artificial intelligence techniques. Int. J. Comput. Integr. Manuf. 2019, 32, 174–182. [Google Scholar] [CrossRef]
  19. Bagavathiappan, S.; Lahiri, B.; Saravanan, T.; Philip, J.; Jayakumar, T. Infrared thermography for condition monitoring—A review. Infrared Phys. Technol. 2013, 60, 35–55. [Google Scholar] [CrossRef]
  20. Lauro, C.; Brandão, L.; Ribeiro Filho, S.L. Monitoring the temperature of the milling process using infrared camera. Sci. Res. Essays 2013, 8, 1112–1120. [Google Scholar]
  21. Cheng, Y.; Zhou, S.; Xue, J.; Lu, M.; Gai, X.; Guan, R. Research on tool wear prediction based on the random forest optimized by NGO algorithm. Mach. Sci. Technol. 2024, 1, 1–24. [Google Scholar] [CrossRef]
  22. Yesilyurt, I.; Ozturk, H. Tool condition monitoring in milling using vibration analysis. Int. J. Prod. Res. 2007, 45, 1013–1028. [Google Scholar] [CrossRef]
  23. Alonso, F.; Salgado, D. Analysis of the structure of vibration signals for tool wear detection. Mech. Syst. Signal Process. 2008, 22, 735–748. [Google Scholar] [CrossRef]
  24. Wang, G.; Yang, Y.; Zhang, Y.; Xie, Q. Vibration sensor based tool condition monitoring using support vector machine and locality preserving projection. Sens. Actuators A Phys. 2014, 209, 24–32. [Google Scholar] [CrossRef]
  25. Bai, Q.; Wang, P.; Cheng, K.; Zhao, L.; Zhang, Y. Machining dynamics and chatters in micro-milling: A critical review on the state-of-the-art and future perspectives. Chin. J. Aeronaut. 2024, 37, 59–80. [Google Scholar] [CrossRef]
  26. Lin, C.Y.; Yeh, S.S. Integration of cutting force control and chatter suppression control into automatic cutting feed adjustment system design. Mach. Sci. Technol. 2020, 24, 65–95. [Google Scholar] [CrossRef]
  27. Zhang, P.; Gao, D.; Lu, Y.; Ma, Z.; Wang, X.; Song, X. Cutting tool wear monitoring based on a smart toolholder with embedded force and vibration sensors and an improved residual network. Measurement 2022, 199, 111520. [Google Scholar] [CrossRef]
  28. Czyżycki, J.; Twardowski, P.; Felusiak-Czyryca, A.; Tabaszewski, M.; Wiciak, M. Monitoring and forecasting of tool wear based on measurements of vibration accelerations during cast iron milling. J. Manuf. Process. 2023, 95, 342–350. [Google Scholar] [CrossRef]
  29. Gomathi, K.; Balaji, A. Tool condition monitoring of PCB milling machine based on vibration analysis. Mater. Today Proc. 2021, 45, 3386–3397. [Google Scholar] [CrossRef]
  30. Hesser, D.F.; Markert, B. Tool wear monitoring of a retrofitted CNC milling machine using artificial neural networks. Manuf. Lett. 2019, 19, 1–4. [Google Scholar] [CrossRef]
  31. Zhou, C.; Guo, K.; Sun, J. An integrated wireless vibration sensing tool holder for milling tool condition monitoring with singularity analysis. Measurement 2021, 174, 109038. [Google Scholar] [CrossRef]
  32. Xue, Z.; Li, L.; Wu, Y.; Yang, Y.; Wu, W.; Zou, Y.; Chen, N. Study on tool wear state recognition algorithm based on spindle vibration signals collected by homemade tool condition monitoring ring. Measurement 2023, 223, 113787. [Google Scholar] [CrossRef]
  33. Nasir, V.; Dibaji, S.; Alaswad, K.; Cool, J. Tool wear monitoring by ensemble learning and sensor fusion using power, sound, vibration, and AE signals. Manuf. Lett. 2021, 30, 32–38. [Google Scholar] [CrossRef]
  34. Niu, B.; Sun, J.; Yang, B. Multisensory based tool wear monitoring for practical applications in milling of titanium alloy. Mater. Today Proc. 2020, 22, 1209–1217. [Google Scholar] [CrossRef]
  35. Gong, Z.; Huo, D. Tool condition monitoring in micro milling of brittle materials. Precis. Eng. 2024, 87, 11–22. [Google Scholar] [CrossRef]
  36. Kuntoğlu, M.; Sağlam, H. ANOVA and fuzzy rule based evaluation and estimation of flank wear, temperature and acoustic emission in turning. CIRP J. Manuf. Sci. Technol. 2021, 35, 589–603. [Google Scholar] [CrossRef]
  37. Liu, M.; Liang, S.Y. Analytical modeling of acoustic emission for monitoring of peripheral milling process. Int. J. Mach. Tools Manuf. 1991, 31, 589–606. [Google Scholar] [CrossRef]
  38. Sundaram, S.; Senthilkumar, P.; Kumaravel, A.; Manoharan, N. Study of flank wear in single point cutting tool using acoustic emission sensor techniques. J. Eng. Appl. Sci. 2008, 3, 32–36. [Google Scholar]
  39. Shi, X.; Wang, R.; Chen, Q.; Shao, H. Cutting sound signal processing for tool breakage detection in face milling based on empirical mode decomposition and independent component analysis. J. Vib. Control 2015, 21, 3348–3358. [Google Scholar] [CrossRef]
  40. Ferrisi, S.; Zangara, G.; Izquierdo, D.R.; Lofaro, D.; Guido, R.; Conforti, D.; Ambrogio, G. Tool Condition Monitoring for milling process using Convolutional Neural Networks. Procedia Comput. Sci. 2024, 232, 1607–1616. [Google Scholar] [CrossRef]
  41. Gómez, M.; Hey, A.; D’Attelis, C.; Ruzzante, J. Assessment of Cutting Tool Condition by Acoustic Emission. Procedia Mater. Sci. 2012, 1, 321–328. [Google Scholar] [CrossRef]
  42. Nawrocki, W.; Stryjski, R.; Kostrzewski, M.; Woźniak, W.; Jachowicz, T. Application of the vibro-acoustic signal to evaluate wear in the spindle bearings of machining centres. In-service diagnostics in the automotive industry. J. Manuf. Process. 2023, 92, 165–178. [Google Scholar] [CrossRef]
  43. Zhao, S.; Zhang, Y.; Wang, S.; Zhou, B.; Cheng, C. A recurrent neural network approach for remaining useful life prediction utilizing a novel trend features construction method. Measurement 2019, 146, 279–288. [Google Scholar] [CrossRef]
  44. Kim, J.; Kwon, S.; Ryu, S.; Lee, S.; Jeong, J.; Chung, J. Noise Identification for an Automotive Wheel Bearing. Appl. Sci. 2022, 12, 5515. [Google Scholar] [CrossRef]
  45. Klocke, F.; Döbbeler, B.; Pullen, T.; Bergs, T. Acoustic emission signal source separation for a flank wear estimation of drilling tools. Procedia CIRP 2019, 79, 57–62. [Google Scholar] [CrossRef]
  46. Patra, K. Acoustic emission based tool condition monitoring system in drilling. Proc. World Congr. Eng. 2011, 3, 6–8. [Google Scholar]
  47. Leng, S.; Wang, Z.; Min, T.; Dai, Z.; Chen, G. Detection of Tool Wear in Drilling CFRP/TC4 Stacks by Acoustic Emission. J. Vib. Eng. Technol. 2020, 8, 463–470. [Google Scholar] [CrossRef]
  48. Bhuiyan, M.S.H.; Choudhury, I.A.; Nukman, Y. Tool Condition Monitoring using Acoustic Emission and Vibration Signature in Turning. In Proceedings of the World Congress on Engineering, London, UK, 4–6 July 2012; Volume III. [Google Scholar]
  49. Denkena, B.; Klemme, H.; Stiehl, T.H. Multivariate time series data of milling processes with varying tool wear and machine tools. Data Brief 2023, 50, 109574. [Google Scholar] [CrossRef]
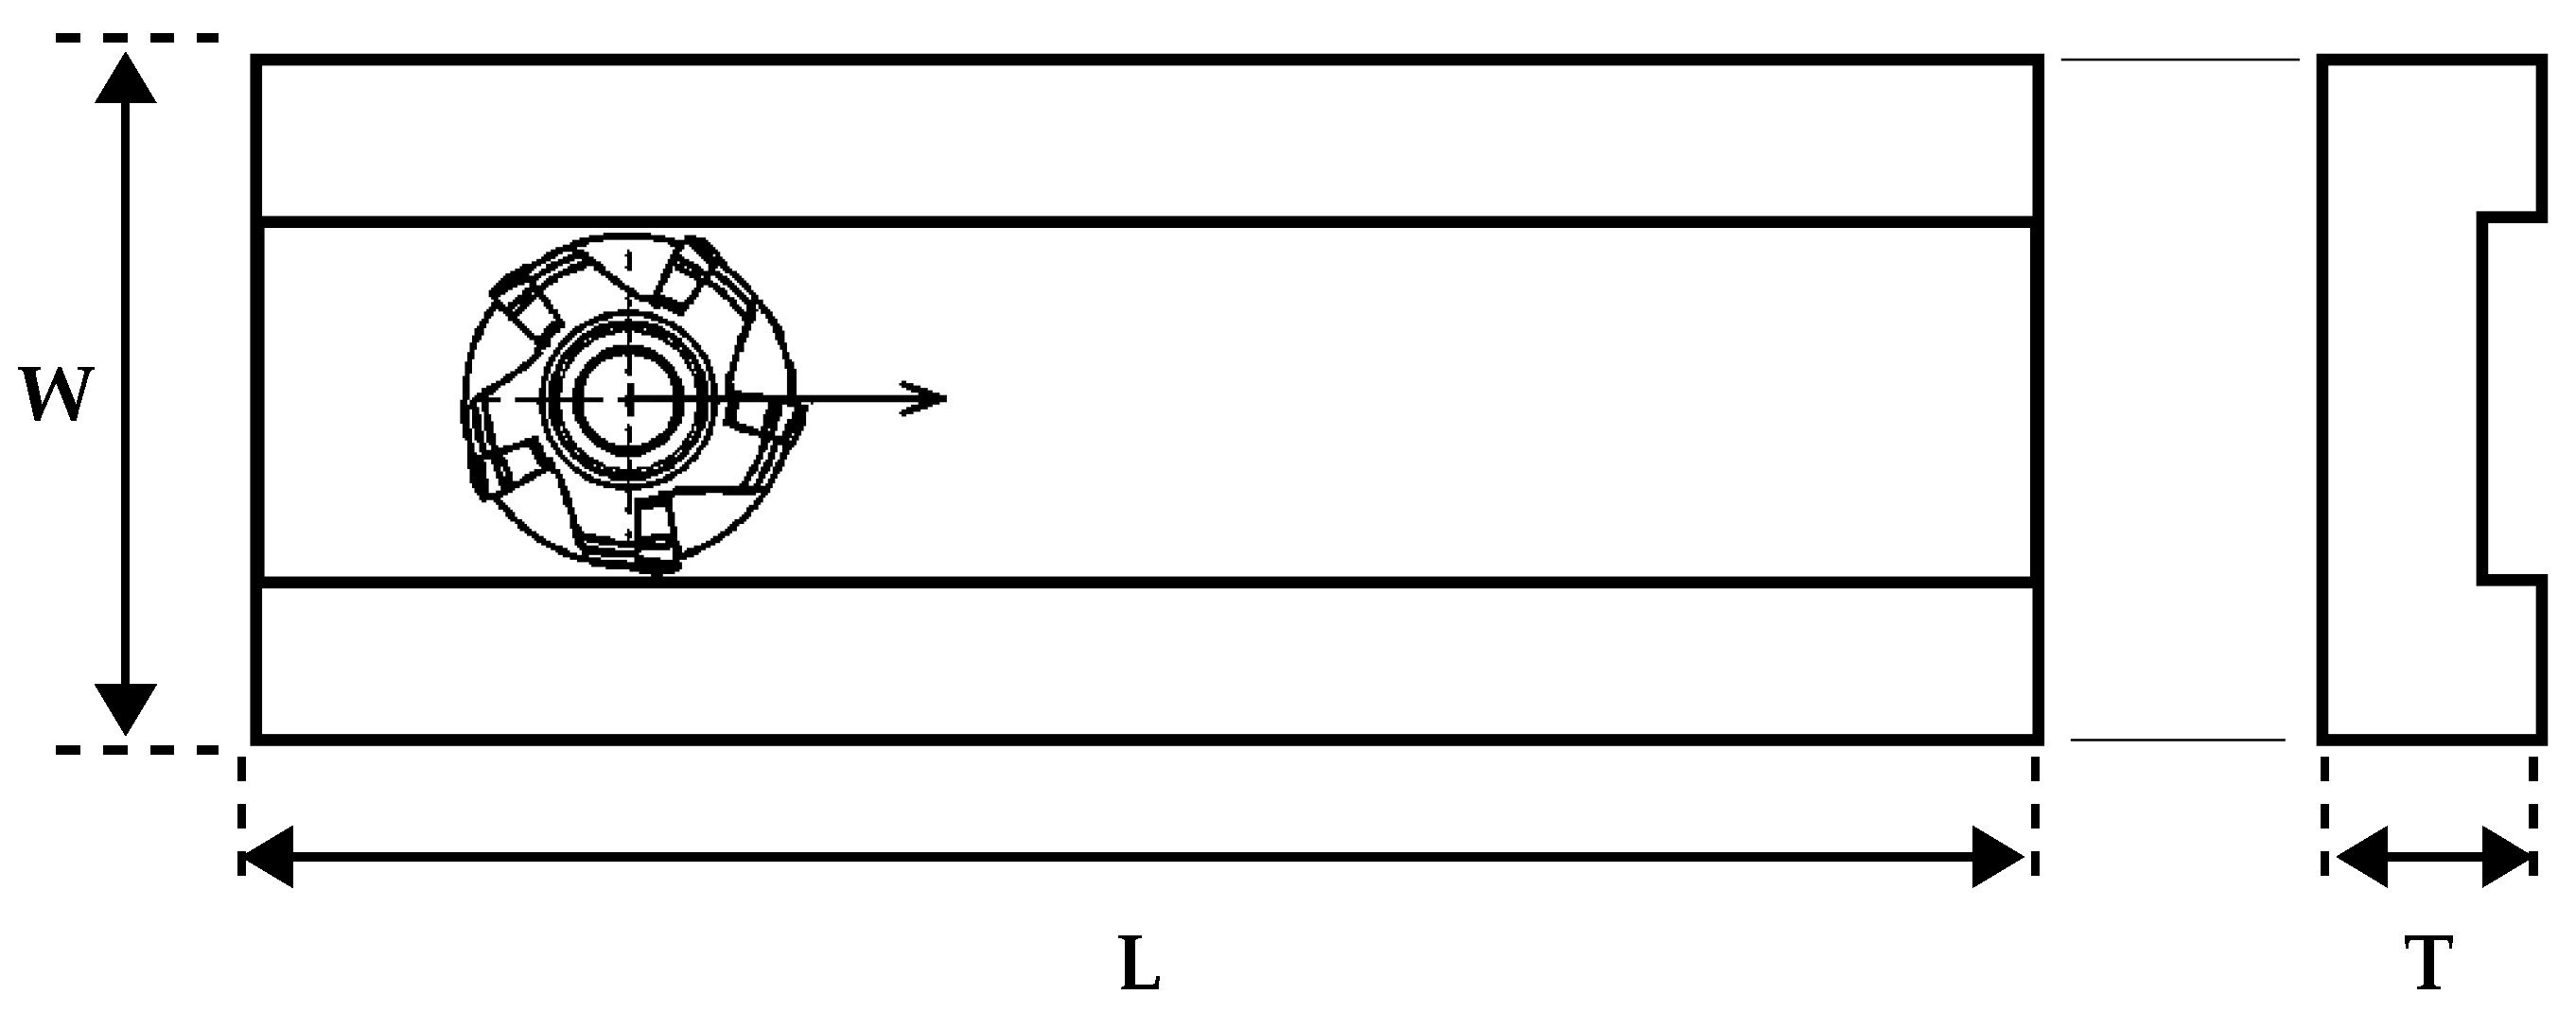
Figure 1. Workpiece dimensions: L = 400 mm; W = 100 mm; T = 20 mm.
Machines 12 00703 g001
Figure 2. Clamping system (a) and CoroMill 245 face milling cutters (b).
Machines 12 00703 g002
Figure 3. Recording setup of acoustic signal.
Machines 12 00703 g003
Figure 4. Wear progress at the end of each plate, numbered from 1 to 12, of one of the inserts for one of the analysed process configurations.
Machines 12 00703 g004
Figure 5. The trend of the insert’s wear progress as a function of the process time for an a p of 3.0 mm.
Machines 12 00703 g005
Figure 6. The trend of the RMS as a function of the wear progress for an a p of 3.0 mm.
Machines 12 00703 g006
Figure 7. The trend of the RMS as a function of the wear progress for an a p of 4.5 mm.
Machines 12 00703 g007
Disclaimer/Publisher’s Note: The statements, opinions and data contained in all publications are solely those of the individual author(s) and contributor(s) and not of MDPI and/or the editor(s). MDPI and/or the editor(s) disclaim responsibility for any injury to people or property resulting from any ideas, methods, instructions or products referred to in the content.