Abstract
The primary objective of this study is to develop a simulation model for a liquid cooling plate (LCP) for insulated-gate bipolar transistor (IGBT) modules, with the aim of reducing the operating temperature of wind power converters (WPCs). The initial impetus for this study was the observation that the energy conversion efficiency of a WPC declines when the operating temperature of the IGBT module exceeds a critical threshold. Three LCPs, with and without heat sinks, were modelled under extreme conditions using the finite element simulation method. The effect of the number and height of the fins on the cooling efficacy was evaluated through the simulation and analysis of the LCP model with heat sinks. The results demonstrate that the optimal configuration, comprising five 10 mm fins and 13 10 mm struts, can achieve the following reductions: maximum temperature by 11.4 K, heat dissipation efficiency by 3.33%, pressure drop by 10.6 KPa, and pump power by 31.00%. Moreover, the findings suggest that the number of fins has a significant impact on temperature fluctuations, whereas the height of the fins exerts a markedly significant influence on pressure drop.
1. Introduction
As environmental, climate and energy issues assume greater urgency, global attention is increasingly directed towards clean energy and environmental protection. Solar and wind energy have attracted considerable attention due to their sustainability and cleanliness, and are regarded as pivotal solutions for the energy transition, given that they diminish reliance on fossil fuels [1,2]. In the context of global initiatives to reduce carbon emissions, substantial resources have been allocated to the promotion of electric vehicles and the development of renewable energy sources [3,4], including solar [5] and wind energy [6]. Insulated-gate bipolar transistor (IGBT) modules are indispensable for interconnecting wind turbines with the fluctuating voltage systems of the power grid [7]. The functionality of these components directly affects the performance and reliability of wind power converters (WPCs), which in turn has a profound influence on the quality of the electrical energy generated by wind turbines. In high-power-density IGBTs, the junction temperature may exceed critical thresholds, which can result in a range of failures [8,9,10], including heel cracking [11], debonding [12] and even delamination [13]. V. D’Alessandro et al. [14] and others have conducted research into the simulation of non-thermal effects in bipolar transistors under static conditions. They have analysed and modelled these effects using finite element simulations, resulting in various implementations of more accurate single semiconductor theories. It is therefore imperative to extend the operational lifetime of IGBT modules as much as possible in order to reduce the downtime of wind turbines and the associated maintenance costs.
The thermal management system design of high-power-density IGBT modules represents a significant challenge, primarily due to the elevated thermal flux density, which serves as a pivotal parameter for guaranteeing the optimal functionality of wind power generation systems. The primary source of heat in IGBT modules is power loss. In the study by Górecki, P. et al. [15], the impact of component and circuit parasitic parameters associated with the switching of wide band gap transistors in power converter applications on energy losses was investigated. The findings of the study enabled each parameter to be evaluated independently in terms of its significance. Advances in cooling technology represent a crucial step in reducing peak operating temperatures [16]. Forced liquid cooling is particularly efficacious due to its high efficiency, lack of vibration and low noise. Forced liquid cooling systems have a cooling capacity that is five to ten times greater than that of forced air cooling systems, making them the optimal choice for high heat flow environments [17,18]. Moreover, Antonio Pio Catalano et al. [19] initially proposed single-sided cooling technology (SSC) based on a multi-chip power module (PM) and subsequently proposed double-sided cooling technology (DSC). They proceeded to compare and analyse the two cooling technologies, ultimately concluding that DSC technology is only applicable in conjunction with an optimal cooling system. In wind power generation systems, IGBT modules frequently operate at elevated temperatures and high power densities, rendering traditional air cooling systems inadequate. The utilisation of forced liquid cooling technology has been demonstrated to enhance efficiency, diminish vibration and noise, and guarantee stable system operation [20]. The adaptability of liquid cooling technology allows it to be tailored to specific applications, thereby optimising performance. Consequently, forced liquid cooling technology serves not only to reduce the temperature of IGBT modules but also to enhance the efficiency and reliability of wind power generation systems. It represents a significant avenue for future development of thermal management systems.
The accelerated evolution of wind power generation technology has underscored the significance of battery thermal management systems. Liquid cooling plates (LCPs) are renowned for their high efficiency, compactness, affordability, and light weight, and have become indispensable components in the thermal management of IGBT modules in wind power converters (WPCs) [21]. In a study conducted by Pan et al. [22], the heat dissipation performance of a multi-channel water cooling plate was investigated. The findings demonstrate that optimising the coolant flow rate can markedly enhance the efficacy of thermal management while concurrently reducing energy consumption. In a study by Zhang et al. [23], the impact of the geometric design of the cooling channels on performance was investigated. The findings revealed that specific channel designs can effectively enhance cooling, thereby improving the overall energy efficiency of the system. In order to further investigate the influence of diverse cooling plate configurations on thermal management performance, Imran et al. [24] examined the impact of varying channel widths, embedded obstacles, and channel ripples. The findings indicate that particular channel configurations can markedly enhance the efficiency of heat transfer. Furthermore, Jarrett et al. [25] investigated cooling plates with serpentine channels, defining the objective functions of pressure drop, average temperature, and temperature uniformity. In conclusion, Çetin et al. [26] conducted a comprehensive performance evaluation of cooling plates and proposed an optimisation strategy to enhance cooling efficiency and system reliability.
In a study conducted by Liang et al. [27], the impact of varying fin thicknesses and channel gaps on the thermal resistance of liquid-cooled heat sinks was investigated. The findings indicated that the temperature increase in the multi-channel structure with fins was 14 °C lower than that of a single-channel structure. Zheng et al. [28] incorporated rectangular and cylindrical column structures into the S-shaped flow channel LCP, and conducted a comparative analysis of the heat dissipation performance, cooling water flowability, and pressure drop. The findings indicate that the LCP incorporating cylindrical pillars exhibits superior overall performance. In order to address the thermal management challenges of high-power-density IGBTs, Li et al. [29] developed an LCP with a hybrid structure comprising foam metal and fins. The findings indicate that the hybrid structure is more efficacious in reducing thermal resistance than the foam metal or fin structures in isolation.
The preceding research in the field of wind energy using computational fluid dynamics (CFD) furnished a robust theoretical foundation for this study, exemplifying the general applicability of these methods. Snake-like flow channel cold plates are a common feature in many applications due to their excellent heat dissipation properties, uniform flow distribution and reduced coolant usage. However, the smooth flow channel structure, which is a distinctive feature of the snake-like design, has been demonstrated to result in a certain degree of reduced heat dissipation efficiency. The aim of this study is to reduce the operating temperature of the IGBT module and thereby enhance the energy conversion efficiency. The majority of existing studies concentrate on the impact of channel geometry and the structural characteristics of liquid coolers on cooling performance and pressure drop in traditional high-power electronic devices. However, there is a dearth of studies that have examined the impact of the structural parameters of components (such as heat sinks and spoilers) in different LCPs. In this instance, the cooling effect of the IGBT module was enhanced by integrating the heat sink and spoiler into the serpentine channel of the liquid cooler. In addition to a single model with a heat sink, a finite element simulation was employed to analyse three models with smooth cooling channels devoid of heat sinks. The simulation results demonstrate that the cooling performance of the cooling channel with a heat sink is superior to that of the smooth cooling channel model without a heat sink. Moreover, the thermal performance of various fin configurations (labelled 1 to 5, with heights of 4, 6, 8 and 10 mm, respectively) and spoiler configurations (labelled 10, 11, 12 and 13, with heights of 4, 6, 8 and 10 mm, respectively) was examined. The findings were validated through laboratory experiments conducted under extreme conditions. The objective of this approach is to enhance the cooling efficiency of the IGBT module liquid cooler and reduce the operating load by combining the fins and baffles. The integration of fins and baffles optimises the energy conversion of the IGBT module in wind power generation systems and enhances cooling, thereby extending the durability of the cooling system and reducing energy consumption. It is of paramount importance that the heat generated by the IGBT module in wind power generation systems is dissipated rapidly, as this can result in accelerated ageing and premature failure.
2. Materials and Methods
2.1. Physical Model
In this section, three 80 mm × 80 mm × 10 mm IGBT modules are selected for arrangement on the LCP. The distribution of the IGBT modules on the heat-conducting substrate results in incomplete coverage of the LCP surface, which gives rise to uneven heat transfer, particularly in the direct-contact areas characterised by high heat flow density. The detailed layout is as follows: as illustrated in Figure 1, the yellow area at the top represents a simplified IGBT module, with a heat-conducting substrate directly below it, in close proximity to the LCP. The area situated between the heat-conducting substrate and the base of the LCP functions as the conduit for this model. The overall dimensions have been set at 350 mm × 300 mm × 20 mm, as detailed in Table 1. Figure 2 illustrates the various configurations of runners, including the tandem runner model, the dual tandem runner model, the parallel runner model, and the runner with fins model. This novel model incorporates fins and spoiler columns, thereby optimising the heat sink’s cooling performance. The fins and spoiler columns are arranged in a staggered pattern to ensure a more uniform coolant flow, thereby enhancing the efficiency of the heat exchange and further improving the cooling performance of the LCP. The specific dimensions are provided in Table 2 for reference.
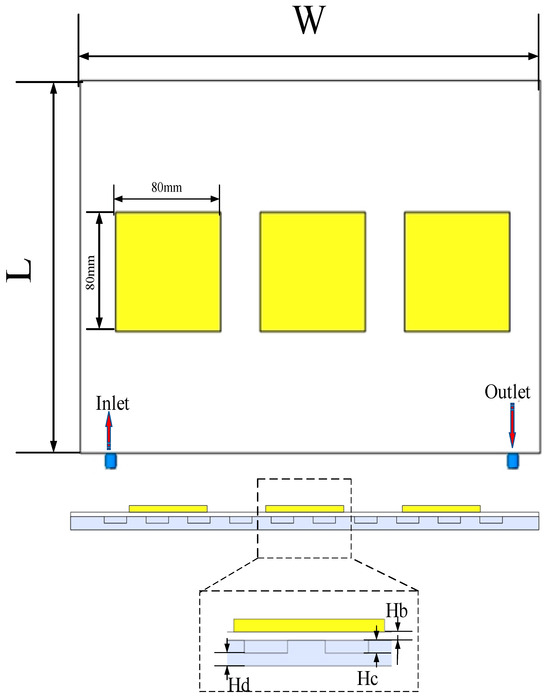
Figure 1.
Global layout of IGBT module LCP.

Table 1.
Global structural parameters of IGBT module LCP.
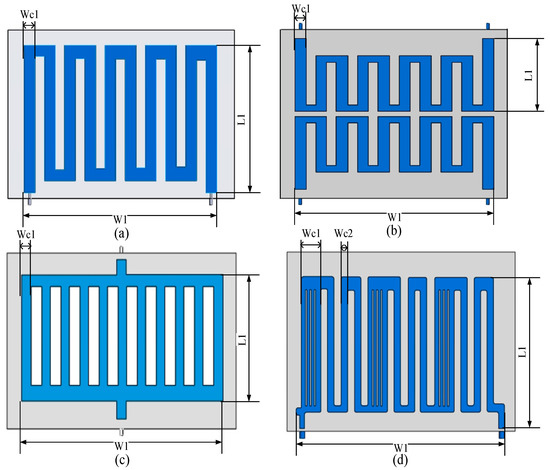
Figure 2.
Four IGBT module LCPs structures: (a) Series; (b) D-series; (c) Parallel; (d) Finned.

Table 2.
Structural parameters of four IGBT module LCPs.
2.2. Simulation Model
2.2.1. Assumptions Prior to Model Simulation
In order to guarantee a specific degree of stability with regard to the transfer and flow of heat in the radiator model during the simulation, the following conditions are assumed with respect to the external factors.
- The coolant selected for the LCP is an incompressible non-Newtonian liquid, and its properties are consistent in all directions.
- The effect of heat radiation is not included in the analysis, and only the heat exchange due to convection and conduction is considered.
- A no-slip boundary condition is imposed between the coolant and the wall in contact.
- In the calculation, a uniform distribution of power density is employed.
2.2.2. Calculation of Thermal Resistance
Equivalent thermal resistance network model for IGBT modules:
According to the references, the heat loss generated by the internal chip of the IGBT module is mostly conducted downwards, and the thickness of each material layer is extremely thin and basically does not exchange heat with the external environment. As shown in the IGBT module heat dissipation model in Figure 3, this section establishes an equivalent thermal resistance circuit for the IGBT module based on this heat dissipation model to solve for the module junction temperature.
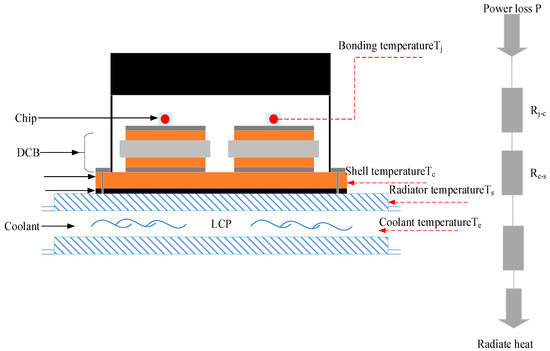
Figure 3.
Heat dissipation model of IGBT module.
IGBT module pass-state losses [30]:
This equation describes the conduction losses of an IGBT, where VCE,on is the collector-emitter voltage in the on state, IC is the collector current and r is the internal resistance of the device. The equation is derived from the fundamental principle of power dissipation in semiconductors (due to the resistive component), which is a well-understood phenomenon in power electronics.
IGBT module switching losses [30]:
where Eon is the energy loss during the switching process; Eoff is the energy loss during the switch-off process in each switch; f is the switching frequency, which indicates the number of switching cycles per second.
This study uses the 1.5 MW wind turbine of the Goldwind Technology Daban City experimental wind farm that is currently in use as the research object. The IGBT module used is Infineon FF1200R17KE3_B2. For detailed parameters, see Table 3, Table 4 and Table 5.

Table 3.
Characteristic parameters of IGBT module.

Table 4.
Converter-specific control parameter values.

Table 5.
IGBT module power loss calculation result.
The 1.5 MW wind power converter power cabinet inverter test at the Dabancheng wind farm in Xinjiang comprises a total of three sets of indirect liquid-cooled radiators, with three parallel IGBT modules installed on each radiator. This configuration results in a total loss of 4083 W on each radiator.
The conservation laws during heat dissipation from an LCP are as follows:
Average Flow Continuity Equation:
Momentum equation:
The energy equations for the coolant and the radiator are, respectively, defined as follows:
where V is the velocity vector of the velocity-averaged flow, is the fluid density, μ is the fluid dynamic viscosity, is the pressure, is the specific constant-pressure heat capacity of the coolant, is the Kelvin temperature, and and are the thermal conductivity of the coolant and the LCP, respectively.
The heat transfer between the IGBT module and the LCP is a form of heat conduction and can thus be simplified into a heat conduction model. The calculation of the heat transfer volume through conduction is based on Fourier’s law, as expressed by the following formula:
where Q is the heat flow density, λ is the thermal conductivity of the material of the heat transfer object, A is the heat transfer area, and is the rate of temperature change in the direction of heat transfer.
The heat transfer between the LCP and the coolant belongs to thermal convection, so it can be simplified as a thermal convection model; convective heat transfer usually uses Newton’s cooling formula, publicized as follows:
where is the convective heat transfer coefficient, A is the total convective heat transfer area, is the wall temperature, and is the fluid temperature.
2.3. Numerical Simulation
2.3.1. Simulation Conditions and Boundary Settings
The selection of an LCP material is dependent upon a number of factors, including thermal conductivity, toughness, density, weight and cost. In consideration of the potential for the water-cooled medium to freeze in low winter temperatures, coolant is a more suitable choice. For LCPs manufactured by die casting, the most suitable material is ADC12 aluminium alloy. Table 6 illustrates the thermophysical properties of coolant and ADC12.

Table 6.
Thermophysical parameters of aluminium ADC12, antifreeze and IGBT modules.
2.3.2. Boundary Condition
As illustrated in Table 7, the inlet and outlet boundary conditions were defined as mass flow inlet and pressure outlet, respectively, with the mass flow rate set to 0.15 kg/s. The temperature was set to 45 °C (318.15 K) in order to simulate extreme conditions that closely match the research test scenario. The interface between the LCP and the simulated heat source of the IGBT module was identified as the heat source surface, specifically the thermally conductive substrate surface. The surface exhibits a thermal conductivity of 326.39 W/(m2·K) and a conductive heat flux of 100.71 W. To simulate the heat source, three IGBT modules were employed, each providing a constant heat flow of 1361 W to heat the surface. The heat flux was maintained at a constant value over the entire upper surface of the plate in order to simulate the transfer of heat from the IGBT modules. The remaining boundary conditions of the plate were set as adiabatic, whereby no heat transfer was permitted through the four edges and the bottom. This configuration guarantees that the heat flux is concentrated on the upper surface, thereby more accurately reflecting the actual operational conditions of the module.

Table 7.
Simulated boundary conditions.
The performance of the heat sink is significantly influenced by the temperature of the cooling fluid, as its thermal conductivity and specific heat, among other thermal properties, are subject to variation with temperature. Thermal conduction plays a pivotal role in the transfer of heat in cooling materials. Typically, an increase in temperature results in a reduction in thermal conductivity. It is of paramount importance to accurately simulate this temperature-dependent behaviour in order to maintain the effectiveness of the heat sink in different thermal environments. The thermal convection between the cooling fluid and the IGBT modules has a significant impact on the performance of the heat sink. An increase in temperature reduces the viscosity of the fluid, which may enhance the efficiency of the convective heat exchange.
In order to guarantee the precision of the thermal simulation, the energy balance of the system was taken into account. The energy is transferred to the coolant via the thermally conductive substrate. The quantity of heat removed by the coolant can be calculated by subtracting the enthalpy of the coolant at the inlet from that at the outlet, expressed as:
where is the mass flow rate of the coolant, is the specific heat capacity of the coolant, and Toutlet and Tinlet are the temperatures of the coolant at the outlet and inlet, respectively.
2.3.3. Evaluation Indicators
In order to evaluate the flow and heat transfer performance of the LCP in the working process, it is necessary to establish a unified performance evaluation index. The maximum temperature of the LCP (Tmax) and the coolant inlet and outlet pressure drop (Δp) have been selected as the performance evaluation indexes of the LCP.
where is the inlet and outlet pressure drop, is the average coolant inlet pressure and is the average coolant outlet pressure.
The maximum operating temperature of the LCP has a significant impact on the efficiency and lifetime of the IGBT module. Therefore, reducing the maximum temperature of the LCP becomes a key objective when designing its structure. In order to quantitatively assess the temperature uniformity of the contact surface between the LCP and the IGBT module, a dimensionless uniformity coefficient, which becomes the coefficient of variation (CVT), is used and can be calculated by the following equation.
where is the average temperature of the LCP contact surface and denotes the standard deviation of the LCP contact surface, which can be calculated by the following equation.
A smaller CVT means better heat transfer and less thermal stress on the LCP, which helps to improve the efficiency and lifetime of the IGBT module.
In this study, the model was numerically simulated using the computational fluid dynamics (CFD) software ANSYS Fluent. The fluid flow is usually characterized by a dimensionless Reynolds number, which can be calculated by the following equation:
where is the coolant density; is the coolant flow rate; is the coolant dynamic viscosity coefficient; is the characteristic length of the pipe through which the coolant flows; and for a rectangular flow channel, the characteristic length is four times the hydraulic radius, r.
The hydraulic radius can be calculated by the following formula:
where is the cross-sectional area of the coolant over water and is the length of the boundary wetted by the coolant.
This study presents a synthesis of the thermophysical parameters of the coolant employed. The flow rate of the coolant and the relevant dimensions of the pipeline can be calculated. The Reynolds number of the coolant in the rectangular pipe near the inlet and outlet is 11,623, and the Reynolds number of the internal pipeline is 4285. Both values are greater than 4000, indicating that the flow of the coolant in the pipeline is turbulent. Therefore, the computational model is selected as the standard k-ε turbulence model. The momentum and energy equations are formulated in the second-order upwind format, and a coupled algorithm is employed for their solution due to the coupled nature of the operations involved.
2.3.4. Gridding and Independence Testing
Given the complex configuration of the LCP, an unconventional tetrahedral grid was employed, as depicted in Figure 4. To ascertain the grid’s reliability, a grid independence test was conducted using a tandem-type runner as a case study. In order to achieve an appropriate balance between computation time and accuracy, five grids with varying numbers of cells were designed. The grid independence was evaluated by comparing the pressure drop at the coolant inlet and outlet, as well as the highest temperature on the LCP. The number of cells for each grid is provided in Table 8, and the results of the grid independence study are presented in Figure 5. It was observed that once the number of grid cells exceeded 1,490,000, the pressure drop at the coolant inlet and outlet remained essentially unchanged, while the temperature at the runner outlet exhibited a slight increase. It can therefore be concluded that increasing the number of grid cells beyond this point has a minimal impact on the simulation results. Accordingly, the grid cell count was determined to be 1,490,000. It can be reasonably assumed that this grid parameter setting is applicable to other LCP models.
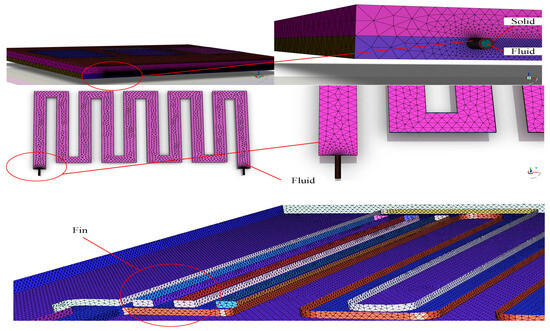
Figure 4.
Computational domains and grids of the liquid cooling plate.

Table 8.
Grids and corresponding cell numbers.
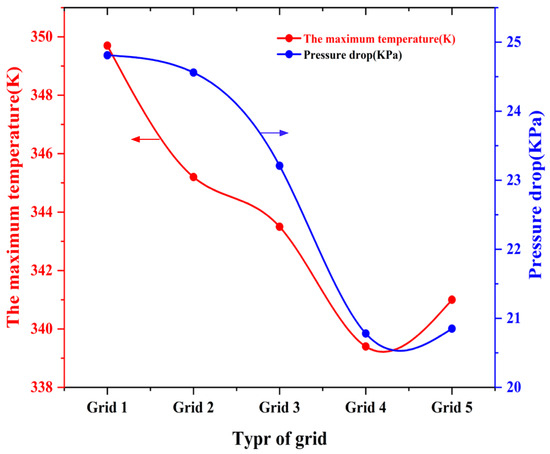
Figure 5.
Effect of number of grids on coolant pressure drop and outlet temperature.
In consideration of the mesh independence validation previously outlined, an accuracy of 1.5 mm was determined to be an appropriate mesh specification. Subsequently, the model was subdivided using ANSYS Fluent into a tetrahedral mesh configuration. This refined meshing approach was subsequently applied to a variety of structural models, including single-series, double-series, parallel, and new-series configurations. This strategy ensures that each model is evaluated consistently under uniform mesh conditions, thus enabling accurate comparisons across different structural variations.
3. Results
3.1. Simulation Results Analysis
Once the mesh has been divided and the boundary conditions have been established, the computation is ready to be carried out. Upon completion of the computation, the convergence residuals in the x, y, and z directions are observed to converge to a value of less than 10−3, and the convergence value of the energy is less than 10−6. This indicates that the convergence criterion has been fulfilled, and thus the iterative computation is complete.
3.1.1. Comparison of Temperature Clouds for Four Types of LCPs
Figure 6 illustrates the surface temperature distributions of the LCPs for four distinct models at an inlet mass flow rate of 0.15 kg/s. It can be observed that in all channel configurations, the highest temperature on the LCPs is consistently located in the downstream area, in proximity to the outlet, and in alignment with the direction of flow. This phenomenon can be attributed to the rise in temperature of the coolant as it flows, which subsequently diminishes the temperature gradient relative to the channel wall and consequently increases the temperature of the LCPs.

Figure 6.
Surface temperature distribution cloud of four different runner structures.
As illustrated in Table 9, a comparative analysis of the data illustrates that the IGBT modules in the parallel structure model have the highest temperatures, while those in the series and dual series models have temperatures slightly lower than those in the parallel structure. The finned model illustrates better thermal efficiency compared to the first three finless models. This analysis facilitates the identification of the most effective cooling configuration for optimising the performance of IGBT modules.

Table 9.
Maximum chip temperatures for the four runner structure models.
3.1.2. Comparison of Pressure Clouds at the Same Mass Flow Rate for Four Types of Runner LCPs
Figure 7 and Table 10 illustrates the pressure distributions within the flow paths of four different models at an inlet mass flow rate of 0.15 kg/s. In all models, the pressure is highest at the coolant inlet and progressively decreases toward the outlet, reaching its lowest point there. The pressure distribution along the flow channel is relatively uniform, indicating consistent flow dynamics.

Figure 7.
Cloud view of runner pressure distribution for four different runner structures.

Table 10.
Coolant inlet and outlet pressure drop for four runner structure models.
Cross-sectional analysis reveals that the double series model experiences the smallest pressure drop between the inlet and outlet, suggesting it has the lowest energy loss. Following closely is the parallel model, which also illustrates a lower pressure drop compared to others. In contrast, the finned model exhibits higher pressure drops at both the inlet and outlet than the double series and parallel models, but lower than the single series model. This comparative evaluation highlights the efficiency of the double series model in minimizing hydraulic resistance and enhancing overall system energy efficiency.
Figure 8 illustrates that the new tandem flow channel structure model, while not as effective in heat dissipation as the tandem and double tandem models, ranks second only to the parallel model in terms of flow channel pressure. This indicates high cost-effectiveness and potential for the new tandem model. The model’s advantages originate from the low initial fluid temperature combined with high kinetic energy and turbulence intensity. However, as the flow channel lengthens, there is a gradual loss of energy, which results in an increase in the internal temperature of the LCP.
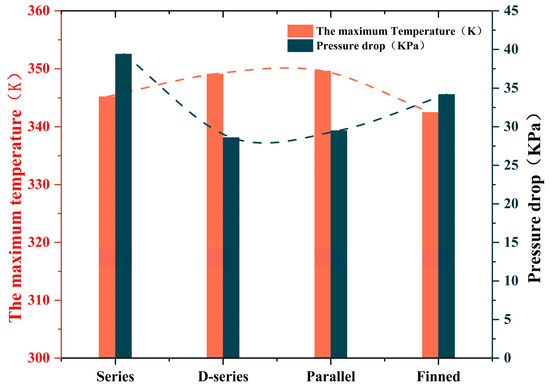
Figure 8.
Maximum temperature of IGBT with coolant inlet and outlet pressure drop for four runner structures.
To enhance efficiency, options include reducing the cross-sectional area of the flow path or increasing the number of flow paths. Implementing fins and turbulence columns to decrease the cross-sectional area of the flow path can effectively reduce pressure loss and energy consumption, thereby optimizing the system’s performance.
3.2. Model Validation
In order to ascertain the veracity of the simulation model, an experimental test platform was designed and constructed. The platform comprises a number of components, including a liquid cooling radiator, heating module, temperature measurement module, pressure sensor, flowmeter, pump and controller, as illustrated in Figure 9. In the experimental procedure, the coolant temperature was maintained at 45 °C at room temperature, and the coolant inlet mass flow rate was gradually adjusted from 0.1 kg/s to 0.45 kg/s, with a mass flow rate increment of 0.05 kg/s. Furthermore, the pressure drop at the inlet and outlet of the LCP was recorded, as well as the temperature at each measurement point on the simulated heat source and the liquid cooling radiator.
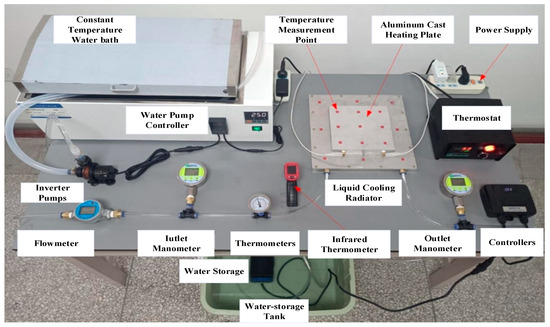
Figure 9.
Liquid cooling radiator test bench.
The following test is designed to verify the LCP:
- Preliminary checks:
- (1)
- Power supply activation: First, ensure that the power connections are secure and power up the system. All safety procedures should be followed during this process.
- (2)
- Pump activation: Activate the cooling pump to facilitate coolant circulation. This step is critical for detecting the presence of inherent defects within the system, including leaks, blockages, or other abnormalities.
- (3)
- Leak check: While the pump is running, carefully check all connections and components to ensure there are no leaks. This can be confirmed using a combination of pressure sensors and visual inspection.
- (4)
- Thermostatic bath start-up: Once no leaks are confirmed, start the thermostatic bath unit to stabilise the coolant temperature at 45 °C. Allow sufficient time for the system to reach thermal equilibrium to ensure the accuracy of the test.
- Heating plate setting:
- (1)
- Thermostat activation: Activates the thermostat to control the heating process of the cast aluminium heating plate.
- (2)
- Power setting: Adjusts the input power to the cast aluminium heating plate to 4083 W. This setting is critical to achieving the desired heating effect to maintain the operating parameters of the system.
- Coolant flow adjustment:
- (1)
- Mass flow control: Use a variable frequency pump controller to gradually adjust the coolant mass flow rate to the design test rate. During this process, the flow rate should be increased gradually to prevent thermal shock or pressure fluctuations in the system.
- (2)
- Data stability: Continuously monitor the system during the adjustment process to ensure that a thermodynamic and hydrodynamic equilibrium is achieved. Observe the system response and record any anomalies.
- (3)
- Data logging: Once equilibrium is reached, accurately record temperature and pressure readings at each point in time. It is recommended that data be recorded systematically for subsequent analysis.
- End of the experiment:
- (1)
- System deactivation: Deactivate the thermostat and thermostatic bath immediately after the experiment to prevent overheating and system damage.
- (2)
- Pump continues to run: Keep the pump running until the coolant emitter reaches a safe temperature to ensure adequate circulation of the coolant and to avoid localised overheating.
- (3)
- Power termination: Finally, after all components have cooled to a safe temperature, terminate the system power supply. The final temperature and pressure readings are recorded for subsequent experimental analysis.
The accuracy of the finned structure, with parameters Hc = 10 mm, Hb = 4 mm, Hd = 6 mm, Wc1 = 35 mm, and Wc2 = 15 mm, is validated by comparison with experimental data (Figure 10). Overall, the simulation and experimental results demonstrate a consistent trend. The relative errors in maximum IGBT module temperature and coolant inlet/outlet pressure drop are within 10%, thus meeting the engineering application standards and affirming the reliability of the model.
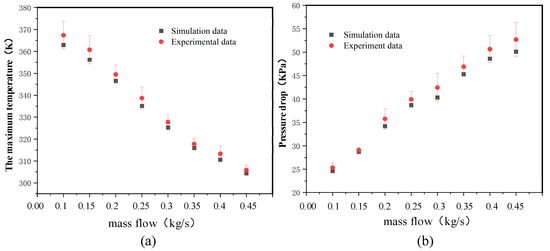
Figure 10.
Comparison of simulation data and experimental data errors: (a) maximum IGBT temperature; (b) coolant inlet and outlet pressure drop.
4. Discussion
This study introduces an innovative serpentine liquid cooling radiator structure. It primarily focuses on two aspects: firstly, it investigates how adjusting the number and height of fins in finned flow channels affects the LCP’s thermal performance. Secondly, it explores the impact of the number and height of spoiler columns on enhancing thermal efficiency. This research enhances the understanding of how each parameter affects the performance of liquid cooling radiators and provides valuable guidance for designing more efficient cooling systems.
4.1. Influence of Fin Parameters
As seen in Figure 11, the fins and spoiler columns are distributed in a staggered arrangement, with the fins occupying three wide channels and the spoiler columns occupying nine narrow channels. The relevant parameters of the fins are shown in Figure 12.
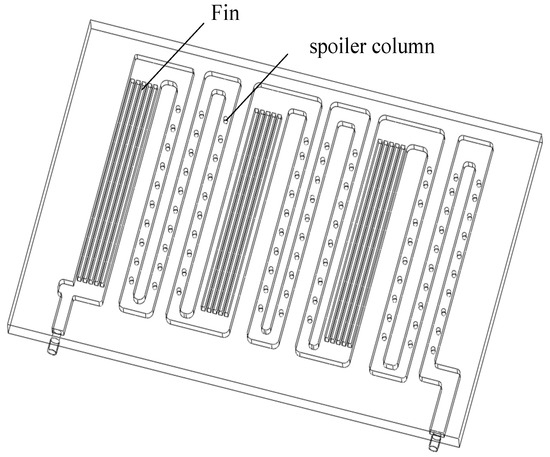
Figure 11.
Fin and spoiler column layout diagram.

Figure 12.
Definition of main structural parameters of fin.
4.1.1. Effect of Number of Fins
Figure 13 illustrates the effect of the number of fins on LCP performance. Four control models were designed with fin counts n = 2, 3, 4, and 5, fin width of 2 mm, and fin height of 3 mm.
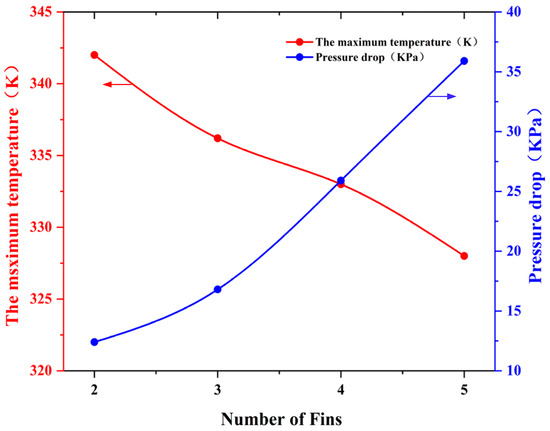
Figure 13.
Exploration of the law of number of fins on the performance of LCP.
Figure 13 illustrates that augmenting the number of fins diminishes the maximum temperature of the LCP from 342.0 K to 328.0 K, concomitant with an increase in the pressure difference in the coolant system from 12.4 KPa to 35.9 KPa. The increase in fins improves heat transfer by increasing the contact area, although this also leads to an increase in system resistance. The results demonstrate that increasing the number of fins from two to five increases the pressure difference to 35.9 KPa, which increases the pumping power by approximately 1.5 times. Therefore, although increasing the number of fins can enhance thermal performance, it also increases energy consumption, which is a pivotal factor in optimising the design.
Figure 14 illustrates the temperature distribution on the surface of the LCP heat source as a function of the number of fins. Table 11 presents the data pertaining to temperature uniformity. The increase in the number of fins has a marked effect on the cooling efficiency. In comparison, the maximum temperature on the LCP surface is 342.0 K for two fins, 335.8 K for three fins, 332.8 K for four fins, and 328.0 K for five fins, indicating a reduction of 14 K in the maximum temperature and a notable enhancement in cooling performance.

Figure 14.
Temperature distribution cloud of heat source surface of LCP with different number of fins.

Table 11.
Surface temperature uniformity coefficients of LCP with different numbers of fins.
Figure 15 illustrates the simulated pressure drop clouds at the inlet and outlet of the LCP. The pressure drop is 12.4 KPa with two fins, indicating a low resistance to flow. This increases to 16.5 KPa with three fins, 26.1 KPa with four fins, and 35.9 KPa when the number of fins is increased to five. This trend indicates a trade-off between the enhancement of cooling performance and the escalation of pump power as the number of fins increases.

Figure 15.
Pressure distribution cloud of LCP runner with different number of fins.
Figure 16 illustrates a cloud diagram of the coolant flow rate distribution for different fin configurations. Table 12 presents the data on the uniformity of velocity. When the number of fins is limited to two or three, the flow velocity distribution in the flow channel is significantly uneven, which is especially noticeable in the curved section. However, when the number of fins is increased to four or five, the high-velocity region is significantly enlarged.

Figure 16.
Cloud view of coolant flow rate distribution at the interface of the middle thickness of the LCP with different numbers of fins.

Table 12.
Velocity uniformity coefficients of coolant in the middle height plane for different numbers of fins.
4.1.2. Effect of Height of Fins
Figure 17 illustrates the impact of varying fin heights on the thermal performance and pressure drop of the liquid-cooled heat exchanger, with the number of fins held constant at five. Four models with fin heights of 4 mm, 6 mm, 8 mm and 10 mm were subjected to evaluation. The findings demonstrated that the maximum temperature of the liquid-cooled heat exchanger exhibited a gradual decline with an increase in fin height, from 331.9 K to 325.8 K. Conversely, the inlet and outlet pressure drop demonstrated a consistent and uniform increase, from 21.2 KPa to 46.7 KPa. This trend can be attributed to the fact that the higher fins occupied a greater volume within the runner, which in turn resulted in a reduction in the flow rate of the coolant. The reduction in flow rate results in an increase in the residence time of the coolant within the flow channel, which in turn leads to a decrease in the maximum temperature and an improvement in temperature uniformity.
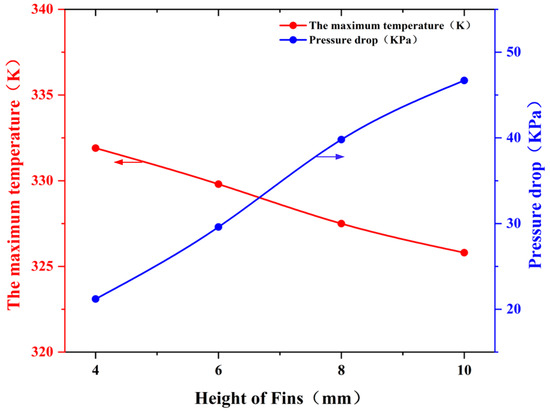
Figure 17.
Exploration of the law of fin height on the performance of liquid-cooled plate.
Figure 18 illustrates the temperature distribution on the surface of the LCP heat source for varying fin heights. Table 13 presents the data pertaining to temperature uniformity. The data indicate that the maximum temperature on the surface of the IGBT module is 331.9 K when the fin height is 4 mm, decreases to 329.8 K when the fin height is increased to 6 mm, decreases to 326.7 K when the fin height is increased to 8 mm, and decreases to 325.8 K when the fin height is increased to 10 mm. This represents a decrease of 6.1 K in comparison to the maximum temperature.

Figure 18.
Temperature distribution cloud of heat source surface of LCP at different fin heights.

Table 13.
Surface temperature uniformity coefficients of LCP at different fin heights.
Figure 19 illustrates the correlation between coolant inlet and outlet pressures at varying fin heights. At a fin height of 4 mm, the measured value is 21.2 KPa. An increase in fin height to 6 mm results in a pressure drop of 27.6 KPa. Upon further increasing the fin height to 8 mm and 10 mm, the pressure drop was observed to be 40.6 KPa and 46.7 KPa, respectively. This demonstrates that an increase in fin height will result in a corresponding increase in the pump power required by the cooling system.

Figure 19.
Cloud view of LCP runner pressure distribution at different fin heights.
Figure 20 illustrates the distribution of coolant flow rate across the LCP cross-section for varying fin heights. An increase in fin height results in a reduction in the coolant flow rate. Table 14 presents the data on the uniformity of velocity. In particular, the flow rate is significantly higher in the specific runners with fin heights of 4 mm and 6 mm. Conversely, an increase in fin height to 8 mm and 10 mm has been observed to result in a notable reduction in the flow rate.

Figure 20.
Cloud view of coolant flow rate distribution at the interface of the middle thickness of the LCP for different fin heights.

Table 14.
Velocity uniformity coefficients of coolant in the middle height plane for different fin heights.
4.2. Influence of Spoiler Column Parameters
Based on the study in the previous section, the number and height of fins in the IGBT LCP are determined, and based on this, a certain number of spoiler columns continue to be added in the tandem flow channel. The configuration of the spoiler column is illustrated in Figure 21.

Figure 21.
Definition of main structural parameters of spoiler columns.
4.2.1. Effect of Number of Spoiler Columns
Figure 22 illustrates the effect of the number of spoiler columns on the performance of liquid-cooled hot gas. Four control models were designed with the number of spoiler columns n = 10, 11, 12, 13, the diameter of the spoiler columns was 2 mm and the height of the spoiler columns was 3 mm.
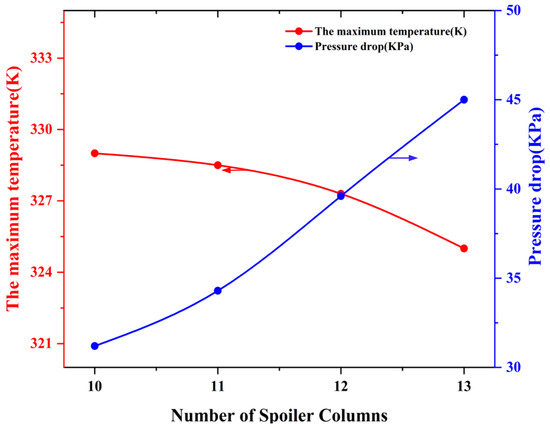
Figure 22.
Exploration of the law of the number of spoiler columns on the performance of the liquid-cooled plate.
Figure 22 illustrates the impact of varying the number of spoiler columns on LCP performance. The model with 10, 11, 12 and 13 scrambler columns was evaluated for a fin number of 5, a height of 10 mm and a scrambler column height of 3 mm. As the number of scrambling columns increases, a notable reduction in the maximum temperature is observed from 329.0 K for 10 columns to 328.5 K for 11 columns, 327.3 K for 12 columns, and finally 325.0 K for 13 columns.
An increase in the number of spoiler columns resulted in an enlargement of the heat transfer area and a corresponding increase in the heat transfer coefficient. This effectively reduced the maximum temperature and improved the temperature uniformity across the LCP. However, these benefits are accompanied by an increased pressure drop, which results in a 47% increase in pump power consumption. In conclusion, while the incorporation of a spoiler can markedly enhance the cooling efficacy of an LCP, it can also precipitate an escalation in pump power consumption, thereby establishing a trade-off between thermal efficiency and energy utilisation.
Figure 23 illustrates the temperature distribution on the heat source surface of the LCP for a range of scrambler columns, from 10 to 13. Table 15 presents the data pertaining to temperature uniformity. As the number of columns increases, the maximum temperature observed decreases significantly. This is evidenced by the fact that the maximum temperature observed is 329.0 K for 10 columns, 328.5 K for 11 columns, 327.3 K for 12 columns, and finally 325.0 K for 13 columns. This indicates that increasing the number of columns is an effective method of improving the heat dissipation efficiency.

Figure 23.
Cloud view of temperature distribution at the heat source surface of the LCP with different numbers of spoiler columns.

Table 15.
Temperature uniformity coefficients of the LCP surface for different numbers of spoiler columns.
Figure 24 illustrates the pressure distribution within the LCP flow path as the number of scrambler columns is varied from 10 to 13. With a configuration of 10 columns, the pressure drop is observed to be 31.2 KPa. An increase in the number of columns to 11 resulted in a rise in pressure drop to 34.3 KPa. Upon further increasing the number of columns to 12, the pressure drop increased to 39.2 KPa. Upon reaching 13 columns, the pressure drop increased to 45 KPa, representing an increase of 13.8 KPa in comparison to the 10-column setup.

Figure 24.
Cloud view of LCP runner pressure distribution for different number of spoiler columns.
Figure 25 illustrates the distribution of flow velocities in the LCP flow channel as the number of scrambler columns varies from 10 to 13. Table 16 presents the data on the uniformity of velocity. As the number of spoiler columns is increased, the flow velocity rises in a gradual manner. The velocity of the flow was found to be 1.83 m/s for a configuration of 10 spoiler columns, exhibiting a slight increase to 1.87 m/s for 11 columns, a further increase to 1.93 m/s for 12 columns, and a peak of 1.96 m/s for 13 columns. This trend suggests that an increase in the number of columns results in a corresponding increase in the fluid flow velocity within the flow channel.

Figure 25.
Cloud view of flow velocity distribution in LCP flow channel with different numbers of spoiler columns.

Table 16.
Velocity uniformity coefficients of coolant in the middle height plane for different numbers of spoiler columns.
4.2.2. Effect of Height of Spoiler Columns
Figure 26 illustrates the effect of spoiler column height on the performance of the LCP. Based on the study in the previous section, the number of spoiler columns n = 13 was chosen and four control models with fin heights of h = 4 mm, 6 mm, 8 mm and 10 mm were designed.
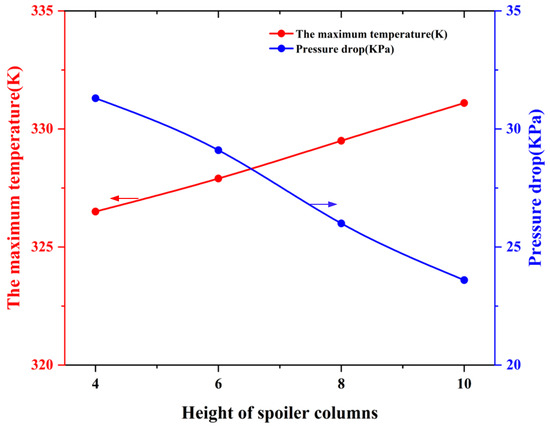
Figure 26.
Exploration of the law of spoiler height on the performance of liquid-cooled plate.
Figure 26 illustrates the impact of spoiler height on LCP performance. The model maintains a fixed number of 13 spoiler columns and analyses four groups of spoiler columns with varying heights (4 mm, 6 mm, 8 mm and 10 mm). The findings indicate that the maximum temperature (Tmax) of the LCP increases in conjunction with the height of the spoiler columns. The temperatures were found to be 326.5 K for 4 mm, 327.9 K for 6 mm, 329.5 K for 8 mm and 331.1 K for 10 mm.
Concurrently, the pressure drop (ΔP) between the coolant inlet and outlet decreases with increasing tower height, from 31.3 KPa at 4 mm to 23.6 KPa at 10 mm. This contributes to a reduction in the required pump power. This trend demonstrates that as the height of the spoiler column increases, the hydraulic resistance and the required pump power both decrease. However, there is a slight increase in temperature, which may impact the thermal performance of the LCP.
Figure 27 illustrates the temperature distribution on the surface of the LCP heat source for varying spoiler heights. Table 17 presents the data pertaining to temperature uniformity. The maximum temperature of the LCP is 326.5 K for a spoiler height of 4 mm; when the spoiler height is increased to 6 mm, the maximum temperature rises to 327.9 K; when the spoiler height is further increased to 8 mm, the maximum temperature rises further to 329.5 K; and when the height of the spoiler column is increased to 10 mm, the maximum temperature rises to 331 K.

Figure 27.
Cloud view of the temperature distribution at the heat source surface of the LCP for different heights of the spoiler columns.

Table 17.
Temperature uniformity coefficients of LCP surface at different heights of spoiler columns.
Figure 28 illustrates the impact of varying spoiler heights (4 mm to 10 mm) on the pressure distribution within the LCP runner. As the height of the spoiler increases, the pressure distribution within the flow channel becomes markedly more uniform. This alteration suggests an enhancement in the fluid dynamics within the system. Furthermore, the overall pressure drop across the flow path is observed to decrease significantly with an increase in spoiler height. In particular, the pressure drop was found to be 31.3 KPa for a spoiler height of 4 mm and 23.6 KPa for a spoiler height of 10 mm. This trend indicates that modifying the spoiler height not only influences the fluid flow characteristics but also enhances the efficiency of the cooling system by reducing the hydraulic resistance. This observation may have implications for the optimisation of thermal management in systems utilising LCP runners, as a more uniform pressure distribution can facilitate the attainment of more consistent cooling performance across disparate regions of the runner.

Figure 28.
Cloud view of LCP runner pressure distribution for different heights of spoiler columns.
Figure 29 illustrates the impact of varying spoiler column heights on the distribution of coolant flow velocity within the cross-section of the LCP. Table 18 presents the data on the uniformity of velocity. As the height of the spoiler column increases, the distribution of the coolant flow rate tends to become significantly more homogeneous, while the flow velocity in the different channels gradually decreases from 1.96 m/s to 1.75 m/s when the height of the spoiler column is increased from 4 mm to 10 mm.

Figure 29.
Cloud view of flow velocity distribution in LCP flow channel with different heights of spoiler columns.

Table 18.
Velocity uniformity coefficients of coolant in the middle height plane for different heights of spoiler columns.
4.3. Optimized Solution Selection for LCP Structures
The objective of this study was to optimise the LCP in order to ensure that the pressure drop did not exceed 35 KPa while simultaneously minimising the maximum temperature of the LCP. The optimised design, resulting from the analysis, comprised five fins with a height of 10 mm and thirteen spoiler columns with a height of 10 mm. The configuration demonstrated a maximum LCP temperature of 331.1 K and a pressure drop of 23.6 KPa, which resulted in a 10.6 KPa reduction in the coolant inlet and outlet pressure drop, a reduction in pump power of approximately 31.00%, and a reduction in the maximum LCP temperature of 11.4 K. Furthermore, the thermal performance was enhanced by 3.33%. This optimisation fulfils the fundamental design criteria and markedly enhances the thermal performance. This structural design optimisation strikes a balance between thermal efficiency and pressure loss, thereby ensuring the stability and reliability of the LCP. It is anticipated that this solution will contribute to enhanced cooling performance, particularly in contexts where precise temperature control is necessary.
4.4. Sensitivity Analysis of the Main Design Parameters of LCP Structures
In this study, an investigation was conducted into the sensitivity of four key design parameters on the performance of LCPs based on an analysis of their effects. By establishing the upper and lower limits of the parameters, the engineering application value of the sensitivity analysis is guaranteed. The performance indicators of the control model under different parameters were compared, and the preliminary study demonstrated that the indicators exhibited a consistent trend in response to parameter changes. Ultimately, the sensitivity of each design parameter to the performance of the LCP was visualised through the ranking of performance indexes.
Figure 30 illustrates the impact of the four design parameters on the thermal performance of the LCP. Table 19 provides a comprehensive illustration of the extent to which specific parameters exert influence. An increase in the number of fins has a notable impact on the maximum temperature, as evidenced by an 18.3 K decrease in maximum temperature when the number of fins is increased from n = 2 to n = 5. Similarly, an increase in fin height from h = 4 mm to h = 10 mm results in a 25.5 KPa reduction in pressure drop. Accordingly, when optimising the structure of the LCP, it is crucial to prioritise the increase in the number of fins, which can markedly enhance the heat dissipation efficiency. The impact on the pressure drop and flow rate is comparatively minimal. Accordingly, when optimising the LCP structure, it is recommended that the number of fins be increased as a priority, as this can markedly enhance heat dissipation efficiency, with a relatively minor impact on pressure drop and flow rate.
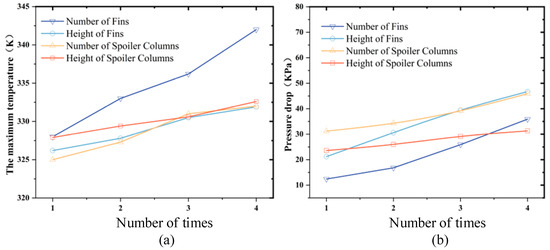
Figure 30.
Effect of four design parameters on the thermal performance of the LCP: (a) maximum temperature; (b) pressure drop.

Table 19.
Effect of four design parameters on the thermal performance of the LCP.
5. Conclusions
This study addresses the challenges posed by the high power density and inhomogeneous heat generation characteristics of IGBT modules in wind power systems by exploring liquid-cooled thermal solutions. The researchers initially compared and analysed four different LCP runner designs, and finally selected a new tandem structure with superior performance. Subsequently, the effects of different fin counts, fin heights, spoiler column counts and spoiler column heights on LCP cooling efficiency and pressure drop were investigated. The principal findings of this pioneering investigation are presented as follows:
- A comparison and analysis of water-cooled plates with series, double-series, parallel and finned runner structures revealed that the new runner structure exhibited the best overall performance among the four structures. The structure achieves enhanced heat dissipation and reduced energy consumption through the optimisation of the cooling efficiency and pressure drop equilibrium.
- In this study, the impact of varying fin and spoiler column numbers and heights on thermal performance was assessed. The findings indicate that augmenting the number of fins or spoiler columns can markedly diminish the maximum temperature of the LCP and the mean temperature of the heat source surface. Nevertheless, an increase in fin and scrambler column height has been observed to result in a slight elevation in temperature values. With regard to the cooling pressure drop, an increase in the number of fins and scrambler columns results in a greater pressure drop, whereas an increase in height helps to reduce the pressure drop. The configuration of the LCP that was identified as the optimal solution, based on considerations of efficiency and performance, comprised five fins, with a height of 10 mm, and 13 spoiler columns, with a height of 10 mm. In comparison to the base model, this configuration resulted in a reduction of 11.4 K in maximum temperature, an improvement in cooling performance of approximately 3.33%, a reduction in pressure drop of 10.6 KPa and a reduction in pumping power of approximately 31.00%. The results demonstrate excellent overall performance.
- A comparative analysis of the factors affecting the maximum temperature of the LCP indicates that the number of fins exerts the greatest influence, followed by fin height, then the height of spoiler columns. The number of spoiler columns exerts the least influence. With regard to the pressure drop of cooling pressure water in the LCP, the greatest effect is exerted by fin height, followed by the number of fins, the number of spoiler columns and the height of spoiler columns in that order. Furthermore, the effect of spoiler height on the maximum flow velocity in the cross-sectional flow path of the LCP is the most critical, followed by the number of spoiler columns, fin height, and number of fins. This sensitivity ranking not only reveals the specific degree of influence of each design parameter on the LCP performance but also provides an important reference point for future optimisation.
While this study offers valuable insights, it also identifies several limitations that provide avenues for future research. The sample size employed in this study was relatively modest. It would be beneficial for future studies to increase the sample size in order to enhance the generalisability of the findings. Secondly, the utilisation of an analogue heat source to simulate the heat generation of the IGBT module may not fully reflect the complexity of real-world conditions. It would be beneficial for future research to focus on experimental validation under conditions that closely resemble real-world operating environments. This will facilitate a more precise evaluation and optimisation of the cooling system for IGBT modules in wind power applications. By addressing these issues, future research can build on our initial findings, deepen our understanding, and further advance the science in this critical technology area. Furthermore, improvements to the LCP are closely associated with the configuration and performance of other cooling components within the converter, including heat sinks and fans. For instance, the implementation of more efficient localised cooling techniques may permit the utilisation of smaller heatsinks or the operation of fans at lower speeds, thereby reducing the energy consumption and noise output of the system. Concurrently, this synergistic effect may also diminish the weight and cost of the overall cooling system, thereby conferring greater flexibility and economy in the overall design.
It is therefore essential that the design of a thermal management system for a wind turbine converter takes into account the potential synergies between LCP optimisation and other cooling technologies. This approach ensures that each technology can operate at its optimal level without adding unnecessary burden and that the collective effect is an efficient and reliable cooling solution.
Author Contributions
Conceptualization, X.Z. (Xinyu Zhu). and L.Z.; Methodology, X.H. and W.L.; Software, X.Z. (Xinyu Zhu).; Validation, X.Z. (Xinwang Zhang). and F.C.; Writing—original draft preparation, X.Z. (Xinyu Zhu).; Supervision, X.Z. (Xinyu Zhu). and L.G.; Project management, W.Y. and H.W.; Obtaining of funding, X.H. and L.Z. All authors have read and agreed to the published version of the manuscript.
Funding
This study was supported by the National Natural Science Foundation of China (Project No. 52406267), the ‘Tianshan Talents’ Science and Technology Innovation Team Project (Project No. KZ619701) and the Corps Talent (Youth) Program Project (Project No. CZ001320), and the National Natural Science Foundation of China (Project No. 51665052).
Data Availability Statement
The original contributions presented in the study are included in the article, further inquiries can be directed to the corresponding authors.
Conflicts of Interest
Wenchun Li was employed by the company Xinjiang Yinfeng Modern Agricultural Equipment Co., Ltd. Xinwang Zhang was employed by the company Urumqi Jinfeng Tianyi Wind Power Co., Ltd. The remaining authors declare that the research was conducted in the absence of any commercial or financial relationships that could be construed as a potential conflict of interest.
Nomenclature
| Variables | Greek letters | ||
| A | Area (mm2) | ρ | Density (kg/m3) |
| T | Temperature (°C) | μ | Viscosity (Pa·s) |
| Q | Heat Flux Density (W/m2) | λ | Thermal Conductivity (W/(m·K)) |
| R | Thermal Resistance (K/W) | σ | Standard deviation |
| k | Constant (ranging from 0.3 to 0.5) | ε | Dissipation rate (m2/s3) |
| ΔP | Pressure Drop (KPa) | ||
| M | Geometric Shape Definition Constant | ||
| d | Hydraulic Diameter (mm) | Subscripts | |
| v | Flow Velocity (m/s) | Avg | Average |
| n | Number of Fins/Spolier | Max | Maximum |
| h | Height of Fins/Spolier | T | Temperature |
| m | Mass Flow Rate (kg/s) | In | Inlet |
| Re | Reynolds Number | Out | Outlet |
| CV | Dimensionless Coefficient of Uniformity | tw | Wall Temperature |
| Re | Reynolds number | tf | Fluid Temperature |
| w | Width, mm | P | Pressure |
| Abbreviations | |||
| IGBT | Insulated Gate Bipolar Transistor | ||
| CFD | Computational fluid dynamics | ||
| LCP | Liquid Cooling Plate | ||
| WPC | Wind Power Converters |
References
- Alptekin, E. Emission, injection and combustion characteristics of biodiesel and oxygenated fuel blends in a common rail diesel engine. Energy 2017, 119, 44–52. [Google Scholar] [CrossRef]
- El-Sebaey, M.S. Proposing novel approach for indirect solar dryer integrated with active-fan and passive-chimney: An experimental and analytical investigation. Energy 2024, 304, 132215. [Google Scholar] [CrossRef]
- Zhou, Q.; Li, Y.; Zhao, D.; Li, J.; Williams, H.; Xu, H.; Yan, F. Transferable representation modelling for real-time energy management of the plug-in hybrid vehicle based on k-fold fuzzy learning and Gaussian process regression. Appl. Energy 2022, 305, 117853. [Google Scholar] [CrossRef]
- Zhou, Q.; Zhao, D.; Shuai, B.; Li, Y.; Williams, H.; Xu, H. Knowledge Implementation and Transfer with an Adaptive Learning Network for Real-Time Power Management of the Plug-in Hybrid Vehicle. IEEE Trans. Neural Netw. Learn. Syst. 2021, 32, 5298–5308. [Google Scholar] [CrossRef] [PubMed]
- Wang, B.; Yu, X.; Chang, J.; Huang, R.; Li, Z.; Wang, H. Techno-economic analysis and optimization of a novel hybrid solar-wind-bioethanol hydrogen production system via membrane reactor. Energy Convers. Manag. 2022, 252, 115088. [Google Scholar] [CrossRef]
- Wang, B.; Yu, X.; Xu, H.; Wu, Q.; Wang, L.; Huang, R.; Li, Z.; Zhou, Q. Scenario analysis, management, and optimization of a new Vehicle-to-Micro-Grid (V2μG) network based on off-grid renewable building energy systems. Appl. Energy 2022, 325, 119873. [Google Scholar] [CrossRef]
- Chen, Y.; Li, B.; Wang, X.; Yan, Y.; Wang, Y.; Qi, F. Investigation of heat transfer and thermal stresses of novel thermal management system integrated with vapour chamber for IGBT power module. Therm. Sci. Eng. Prog. 2019, 10, 73–81. [Google Scholar] [CrossRef]
- Carroll, J.; Alasdair, M.D.; David, M.M. Failure rate, repair time and unscheduled O&M cost analysis of offshore wind turbines. Wind Energy 2016, 19, 1107–1119. [Google Scholar]
- Fischer, K.; Wenske, J. Towards reliable power converters for wind turbines: Field-data based identification of weak points and cost drivers. In Proceedings of the EWEA Conference & Exhibition, Paris, France, 17–20 November 2015. [Google Scholar]
- Bartschat, A. Reliability of power converters in wind turbines: Results of a comprehensive field study. In Proceedings of the Wind Europe Summit, Hamburg, Germany, 27–29 September 2016. [Google Scholar]
- Ramminger, S.; Seliger, N.; Wachutka, G. Reliability model for Al wire bonds subjected to heel crack failures. Microelectron. Reliab. 2000, 40, 1521–1525. [Google Scholar] [CrossRef]
- Smet, V.; Forest, F.; Huselstein, J.-J.; Richardeau, F.; Khatir, Z.; Lefebvre, S.; Berkani, M. Ageing and failure modes of IGBT modules in high-temperature power cycling. IEEE Trans. Ind. Electron. 2011, 58, 4931–4941. [Google Scholar] [CrossRef]
- Pedersen, K.B.; Pedersen, K. Bond wire lift-off in IGBT modules due to thermomechanical induced stress. In Proceedings of the 2012 IEEE 3rd International Symposium Power Electronics for Distributed Generation Systems (PEDG), Aalborg, Denmark, 25-28 June 2012; pp. 519–526. [Google Scholar]
- D’Alessandro, V.; Scognamillo, C.; Catalano, A.P.; Muller, M.; Schroter, M.; Zampardi, P.J.; Codecasa, L. Analytical modeling and numerical simulation of nonlinear thermal effects in bipolar transistors. In Proceedings of the 2022 28th International Workshop on Thermal Investigations of ICs and Systems (THERMINIC), Dublin, Ireland, 28–30 September 2022; pp. 1–7. [Google Scholar]
- Górecki, P.; Górecki, K.; Detka, K.; D’alessandro, V. Influence of parasitics of components and circuit on switching losses of power SiC and GaN transistors in power converter applications. In Proceedings of the 2023 25th European Conference on Power Electronics and Applications (EPE’23 ECCE Europe), Aalborg, Denmark, 4–8 September 2023; pp. 1–7. [Google Scholar]
- Kang, S.S. Advanced cooling for power electronics. In Proceedings of the 2012 7th international conference on integrated power electronics systems (CIPS), Nuremberg, Germany, 6–8 March 2012; pp. 1–8. [Google Scholar]
- Khalaj, A.H.; Halgamuge, S.K. A Review on efficient thermal management of air-and liquid-cooled data centers: From chip to the cooling system. Appl. Energy 2017, 205, 1165–1188. [Google Scholar] [CrossRef]
- Akbarzadeh, M.; Kalogiannis, T.; Jaguemont, J.; Jin, L.; Karimi, D.; Beheshti, H.; Van Mierlo, J.; Berecibar, M. A comparative study between air cooling and liquid cooling thermal management systems for a high-energy lithium-ion battery module. Appl. Therm. Eng. 2021, 198, 117503. [Google Scholar] [CrossRef]
- Catalano, A.P.; Scognamillo, C.; d’Alessandro, V.; Castellazzi, A. Numerical simulation and analytical modeling of the thermal behavior of single-and double-sided cooled power modules. IEEE Trans. Compon. Packag. Manuf. Technol. 2020, 10, 1446–1453. [Google Scholar] [CrossRef]
- Kandlikar, S.G.; Hayner, C.N. Liquid cooled cold plates for industrial high-power electronic devices—Thermal design and manufacturing considerations. Heat Transf. Eng. 2009, 30, 918–930. [Google Scholar] [CrossRef]
- Zhang, J.; Du, X.; Qian, C.; Du, R.; Hu, X.; Tai, H. -M. Thermal management of IGBT module in the wind power converter based on the ROI. IEEE Trans. Ind. Electron. 2021, 69, 8513–8523. [Google Scholar] [CrossRef]
- Pan, C.; Tang, Q.; He, Z.; Wang, L.; Chen, L. Structure optimization of battery module with a parallel multi-channel liquid cooling plate based on orthogonal test. J. Electrochem. Energy Convers. Storage 2020, 17, 021104. [Google Scholar] [CrossRef]
- Zhang, F.; He, Y.; Wang, C.; Liang, B.; Zhu, Y.; Gou, H.; Xiao, K.; Lu, F. A new type of liquid-cooled channel thermal characteristics analysis and optimization based on the optimal characteristics of 24 types of channels. Int. J. Heat Mass Transf. 2023, 202, 123734. [Google Scholar] [CrossRef]
- Imran, A.A.; Mahmoud, N.S.; Jaffal, H.M. Analysis of channel configuration effects on heat transfer enhancement in streamline-shaped cold plates used in battery cooling system: A comparative study. Int. Commun. Heat Mass Transf. 2024, 155, 107570. [Google Scholar] [CrossRef]
- Jarrett, A.; Kim, I.Y. Design optimization of electric vehicle battery cooling plates for thermal performance. J. Power Sources 2011, 196, 10359–10368. [Google Scholar] [CrossRef]
- Çetin, I.; Sezici, E.; Karabulut, M.; Avci, E.; Polat, F. A comprehensive review of battery thermal management systems for electric vehicles. Proc. Inst. Mech. Eng. Part E J. Process Mech. Eng. 2023, 237, 989–1004. [Google Scholar] [CrossRef]
- Liang, J.; Xu, H.; Yuan, Z.; Zhou, P. High efficiency liquid cooling system of power electronic converter. In Proceedings of the 2020 5th Asia Conference on Power and Electrical Engineering (ACPEE), Chengdu, China, 4–7 June 2020; pp. 1270–1275. [Google Scholar]
- Zheng, X.; Hu, X.; Zhang, L.; Zhang, X.; Chen, F.; Mai, C. Study on the Effect of Spoiler Columns on the Heat Dissipation Performance of S-Type Runner Water-Cooling Plates. Energies 2022, 15, 3085. [Google Scholar] [CrossRef]
- Lee, J.; Ki, S.; Nam, Y. Compact liquid cooling module incorporating metal foam and fin hybrid structures for high power IGBTs. In Proceedings of the 2019 18th IEEE Intersociety Conference on Thermal and Thermomechanical Phenomena in Electronic Systems (ITherm), Las Vegas, NV, USA, 28–31 May 2019; pp. 559–565. [Google Scholar]
- Xu, P.; Liu, P.; Yan, L.; Zhang, Z. Effect of Solder Layer Void Damage on the Temperature of IGBT Modules. Micromachines 2023, 14, 1344. [Google Scholar] [CrossRef] [PubMed]
Disclaimer/Publisher’s Note: The statements, opinions and data contained in all publications are solely those of the individual author(s) and contributor(s) and not of MDPI and/or the editor(s). MDPI and/or the editor(s) disclaim responsibility for any injury to people or property resulting from any ideas, methods, instructions or products referred to in the content. |
© 2024 by the authors. Licensee MDPI, Basel, Switzerland. This article is an open access article distributed under the terms and conditions of the Creative Commons Attribution (CC BY) license (https://creativecommons.org/licenses/by/4.0/).