Abstract
The curvic coupling, as one of the common connecting structures for gas turbine combined rotors, is more susceptible to various dynamic and static loads at extreme operating conditions. But, traditional combined rotor models tend to neglect the influence of the connection structure, especially failing to consider the contribution of the curvic coupling interfaces. To address this problem, this paper establishes a solid geometric model of the combined rotor with curvic couplings considering the rough three-dimensional interfaces. The effectiveness of the proposed model method is indirectly verified through the compression tests and modal tests. Subsequently, combined with finite element calculations, the mechanical properties of the rotor with curvic couplings considering the rough interface are analyzed under static and dynamic load conditions. The results indicate that the roughness of the interface significantly affects the deformation of the contact surface under static load, but its impact on the overall deformation of the rotor is relatively insignificant. The dynamic stress at the interface exhibits periodic variations at the resonance speed. At the maximum operating speed, the dynamic stress is influenced by the magnitude of imbalance. The aforementioned methods and conclusions provide a reference for the design research and engineering application of combined rotors.
1. Introduction
A curvic coupling is the primary form of connection for modern gas turbine combined rotors, and its mechanical modeling and characteristic analysis are key and cutting-edge areas in the design and research of gas turbine combined rotor systems.
Previous studies on the mechanical properties of curvic couplings were mostly based on finite element models [1,2,3,4,5]. In recent years, with in-depth research on discontinuous structures in gas turbine combined rotors, some scholars have proposed analytical methods to reveal the connection stiffness and other discontinuous characteristics of curvic couplings, which have complex joint interfaces. Subsequently, research has been conducted on their mechanical properties under static and dynamic conditions. Liu et al. [6,7] described the equivalent stiffness of a pair of curvic couplings using an equivalent spring model and subsequently established a dynamic model of a simply supported discontinuous beam influenced by axial force. Zhang et al. [8] developed a parametric model that considered the details of the manufacturing process of double row curvic couplings, and based on this, proposed an improved stress analytical method for curvic couplings that considered the effects of deep beam bending, which provided a more accurate results than the classic method, Heng et al. [9] established an analytical model for the contact stiffness of three-dimensional curvic couplings, considering their complex geometric characteristics, based on Hertzian contact theory and elastic-plastic contact theory. They investigated the stiffness loss patterns of curvic couplings under bending vibrations. Subsequently, they proposed a finite element model for rotor systems and analyzed the dynamic characteristics of the rotor systems. Wang et al. [10] proposed a new nonlinear analytical model of the combined rotors with curvic coupling to characterize their mechanical behavior in the presence of bolted connections.
The above research employs the finite element method and analytical methods, focusing on the discontinuous characteristics of the curvic couplings (loss of connection stiffness), while ignoring the influence of the microscopic contact characteristics of the rough interface in both static and dynamic load analyses.
In recent years, some scholars often employed methods such as the virtual material method, thin-layer element method, and stiffness-damping method to model the main connecting structures of modern gas turbine combined rotors. These methods were used to establish equivalent models, simplifying the complex contact characteristics and geometric features of the joint surfaces. Zhao et al. [11] introduced a virtual material layer during the modeling of gas turbine rod rotors to characterize the contact effects at the wheel disk contact surfaces. By combining mathematical–statistical models with Gaussian distribution functions, they constructed a contact mechanics model for the contact surfaces, thoroughly analyzing the contact characteristics under different parameters. Rimpel et al. [12] introduced thin layer elements between the contact surfaces of the butt joints model to study the mechanical properties of the connection structure. Yu et al. [13] started with the axial tensile and compressive mechanical analysis of the bolted joint structure with a spigot, proposed a sector model capable of simulating the nonlinear stiffness and damping dissipation of the connection, and subsequently constructed a nonlinear analytical model under bending moment loads. Liu et al. [14] modeled the interface of the curvic couplings as a combination of nonlinear springs in the normal and tangential directions, thereby establishing the piecewise stiffness of the curvic couplings. Croccol et al. [15] investigated the influence of tooth profile parameters and friction coefficients on interfacial bending stress based on Hirth joint mechanical parametric models. Gao et al. [16] simplified the contact surfaces in the curvic couplings as bending springs with stiffness and proposed a method for calculating the contact stiffness under both overall loading and local separation when the bending moment is significant.
For the complex curvic couplings, relevant scholars have attempted to incorporate the contact characteristics of rough interfaces indirectly into the modeling framework of the combined rotor with curvic couplings based on analytical methods. Jin et al. [17] proposed a micro-asperity contact model that considers elasticity, elastoplasticity, and plasticity stages based on the GW model and Hertz theory. They derived a revised model for the bending stiffness of the curvic couplings and deduced the relationship between force and deformation of the curvic couplings under preload. Kim et al. [18] proposed an approach to modeling the curvic couplings that combines a GW contact model with a 3D solid element model of flexible teeth and coupling rings. The resulting high-fidelity flexible tooth model shows significant changes in critical speeds compared to the previous models.
In summary, the existing modeling methods simplify curvic couplings to varying degrees. Some omit the complex micro-geometric features of the interfaces, others treat non-continuous curvic couplings as equivalent continuous shaft segments, and some even completely ignore curvic couplings, directly treating them as a single integral rotor. It is a fact that the previous research lacks direct characterization of mesoscopic properties at rough interfaces, so it is difficult to intuitively describe the static and dynamic stresses at the interfaces. Therefore, the previous methods have significant limitations in the mechanical analysis of actual rotor structures.
Therefore, it is necessary to construct a new model of the combined rotors with curvic couplings that considers the rough interfaces, which can be used to analyze the stress distribution at the curvic coupling interfaces under static and dynamic extreme conditions. This approach aims to compensate for the shortcomings of previous equivalent modeling methods for combined rotors with curvic couplings, which neglected the mechanical characteristics of the curvic couplings interfaces, and to improve and effectively analyze and evaluate the connection performance and strength.
This paper constructs a solid geometric model of a combined rotor with curvic couplings that considers the rough interface, based on the theory of three-dimensional solid parametric modeling. Combined with finite element calculations, the mechanical properties of this structure under static and dynamic extreme conditions are analyzed. The research results can provide a theoretical basis and provide theoretical guidance for the design and research of combined rotor systems in gas turbines.
2. Rotor Modeling with Curvic Couplings Considering Rough Three-Dimensional Interfaces
2.1. Rough Three-Dimensional Fractal Surface Modeling of Curvic Couplings Interfaces
According to references [19,20,21], the face of the curvic couplings is formed by the rotation of a cup-shaped grinding wheel, resulting in a conical surface. As shown in Figure 1, a grinding wheel coordinate system Ogxgygzg is established based on the cone where the tooth surface is located, and a curvic couplings ring coordinate system Oxyz is established based on the hollow cylinder where the curvic coupling blank is located.
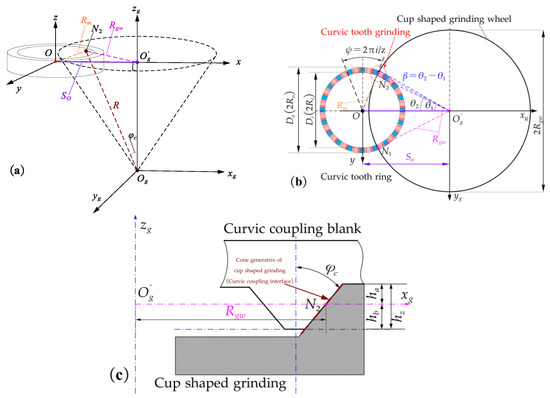
Figure 1.
Geometric forming principle of curvic couplings. (a) The conical body of curvic tooth grinding wheel and shaft body. (b) The formation principle of curvic tooth. (c) Cup-shaped grinding wheel for grinding the curvic coupling blank.
The polar coordinate expression of the smooth curvic tooth surface on a conical surface is Equation (1).
As shown in Figure 1a, if the coordinates of point N2 on the conical surface in the coordinate system Ogxgygzg are (xg, yg, zg), then , where R is the distance of line segment N2Og. The projection of N2Og on the plane Ogxgyg is N2O’g, and the angle between N2O’g and the x-axis is θ. φc is the pressure angle, typically taken as π/6. The ideal smooth curvic teeth can be considered as the intersection of a cone and a hollow cylinder, forming a partial conical surface on the hollow cylinder, thus allowing for the derivation of the corresponding tooth surface equation. The equation for the outer surface of the i-th convex tooth is Equation (2), and the equation for the outer surface of the i-th concave tooth is Equation (3).
where Rgw is the radius of the grinding wheel and So is the distance between the center of rotation of the grinding wheel and the curvic coupling blank as shown in Figure 1. hz is the cutting depth of the curvic coupling blank (height of the truncated cone), hz ∈[−hb, ha]. Therefore, as shown in Figure 1b,c, the cup-shaped grinding wheel can form two tooth surfaces by rotating and grinding the curvic coupling blank ring at the same station, within the ranges [θ1, θ2] and [−θ2, −θ1]. Let β = θ2 − θ1, and for the values of β and other specific symbols and expressions, please refer to the literature [10]. And ψ represents the coordinate transformation angle of the i-th curvic tooth surface, ψ = 2πi/z.
This paper generates a rough curvic coupling interface based on three-dimensional fractal theory. The interface is a conical surface, and earlier scholars have conducted limited research on the characterization methods of rough three-dimensional fractal conical surfaces. Therefore, it is advisable to draw inspiration from the fractal geometric modeling method in the literatures [22,23,24], and innovatively establish a characterization method for rough three-dimensional fractal conical surfaces, as shown in the expression below:
Among them, R(φ, θ) is as shown in Equation (1), representing the expression of a smooth conical surface, ρ is the base radius, ρ and θ denote the polar coordinates of any point at height z on the rough surface, and there is
L is the sampling length; M is the number of overlapping raised parts; D is the fractal dimension of the profile; γn represents the spatial frequency of the profile curve, where γ is a constant greater than 1; for surfaces that follow a normal distribution, γ is taken as 1.5; and ψm,n is a random phase uniformly distributed within the range (0, 2π).
The above Equation (4) characterizes the rough three-dimensional fractal interface in the curvic couplings, thereby laying the foundation for parametric modeling of the combined rotor with curvic couplings considering the rough interface.
Based on the characterization method of the rough three-dimensional fractal conical surface, it is evident from the literature [25,26] that different roughness values correspond to specific three-dimensional fractal parameter values (see Table 1). This allows for the generation of a series of curvic teeth that incorporate the characteristics of rough fractal interfaces.

Table 1.
The relationship between surface roughness and three-dimensional fractal parameters.
As shown in Figure 2, these interfaces are composed of the cumulative distribution of uneven rough peaks. In Figure 2a, this new geometric model can be parameterized and characterized using COMSOL Multiphysics 6.0 Build 318 and MATLAB R2022a (9.12.0) software. Finally, the rough three-dimensional fractal interface in the curvic couplings with different roughness is obtained as shown in Figure 2b–d.
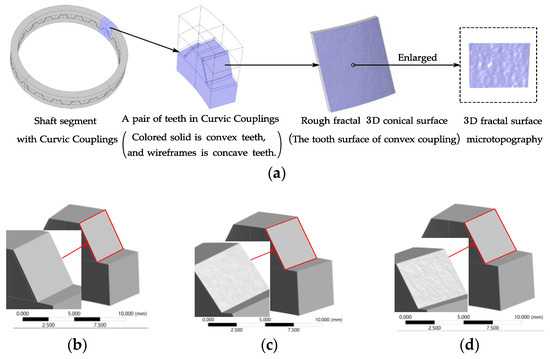
Figure 2.
Solid model of curvic couplings considering the rough three-dimensional fractal conical interfaces. (a) Rough three-dimensional fractal interfaces in the curvic couplings. (b) Ra 0.04 μm. (c) Ra 1.60 μm. (d) Ra 3.20 μm.
2.2. Combined Rotor Model with Curvic Couplings Considering Rough Interfaces
Subsequently, based on the principles of three-dimensional geometric modeling, a solid model of a three-disk rotor with a rough interface can be established in SpaceClaim 2022 R1 Software, which includes two sets of the curvic couplings. The model is preloaded using a central sleeve and nuts. The dimensions of the rotor are shown in Figure 3.
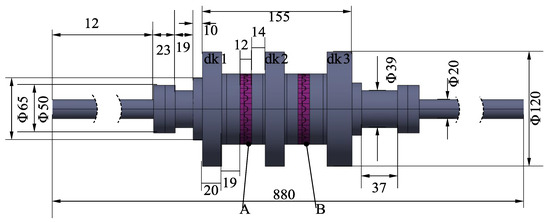
Figure 3.
Physical dimensions of the rotor with curvic couplings.
The parameters of the curvic couplings are listed in Table 2.

Table 2.
Main structural parameters of the curvic couplings.
The material for the rotor is structural steel (such as AISI 1030), density ρ = 7850 kg/m3, elastic modulus E = 201 GPa, and Poisson’s ratio ν = 0.3.
Subsequently, based on the above rotor model, a finite element model of the rotor with curvic couplings considering the rough interfaces can be constructed in ANSYS Products 2022 R1. This model employs eight-node hexahedral solid elements (SOLID185) [27] and adopts a multi-region and sweeping meshing method, dividing the curvic couplings into a finer mesh and the remaining structures into a coarser mesh.
Given the complex geometric characteristics of the curvic couplings, local mesh refinement is performed on the curvic couplings interfaces, resulting in a larger number of local meshes and nodes. The mesh division results are shown in Figure 4. To reduce the computational time, the shaft section with curvic couplings in the rotor can be defined as a cyclic symmetric substructure. The overall degree of freedom of the simplified curvic teeth pairs’ finite element model is 1659018. If structural cyclic symmetry is not used for simplification, the degree of freedom would be twenty times that of this model.
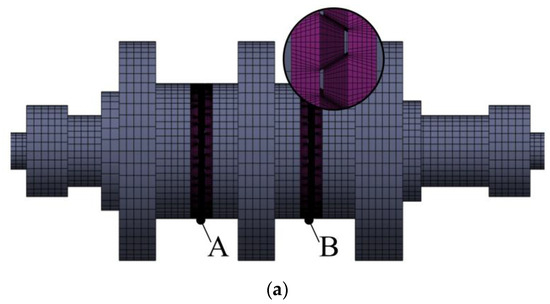
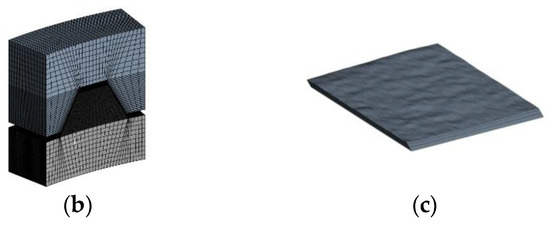
Figure 4.
The finite element model of the combined rotor with curvic couplings considering the rough interface. (a) The finite element model of the rotor with curvic couplings. (b) A pair of teeth meshing. (c) Interface meshing.
3. Static Analysis of Curvic Couplings Considering Rough Interfaces
This section focuses on the deformation and stress analysis of the three-disk rotor model with curvic couplings under static saturated preload, aiming to explore the contact state of the curvic couplings. This serves as a foundation for investigating the dynamic stress variation patterns at the interfaces.
Specifically, to investigate the static stress at the curvic coupling interface under the extreme condition of preload oversaturation, the axial displacement load is set to 0.05 mm in the analysis, which is more than twice the measured saturated displacement load (about 0.02 mm).
3.1. Boundary Conditions for Static Analysis
Boundary conditions are shown in Figure 5. To simplify the calculation process, the Curvic Couplings B among the three rotor discs, shown in Figure 4a, is selected for the preload analysis. A pair of curvic teeth is set as a cyclic symmetric substructure, shown in Figure 5a. The faces (A) and (C) in red color are the high boundary of cyclic region, and the faces (B) and (D) in blue color are the low boundary of cyclic region. The substructure can be constructed as a curvic couplings ring after cyclic symmetric expansion, shown in Figure 5c. Both tooth surface contact pairs (A) and (B) are shown in Figure 5b, and the which are set as frictionless contact (Frictionless) and used the augmented Lagrangian contact algorithm for solving. An axial displacement loading of 0.05 mm is applied on the curvic couplings ring in the positive Z-axis direction. If necessary, fixed constraints and frictionless constraints are set to simplify the boundary conditions.
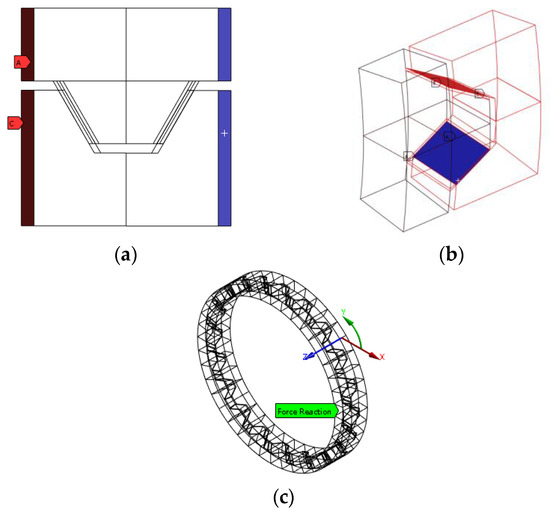
Figure 5.
Boundary condition of static analysis. (a) Cyclic symmetry. (b) Contact pairs. (c) Curvic couplings ring.
3.2. Static Analysis Results
3.2.1. Contact Characteristics of the Curvic Couplings Interface with Different Roughness
The contact area and normal contact stiffness of the curvic couplings interface with different roughness vary with the displacement load, as shown in Figure 6.
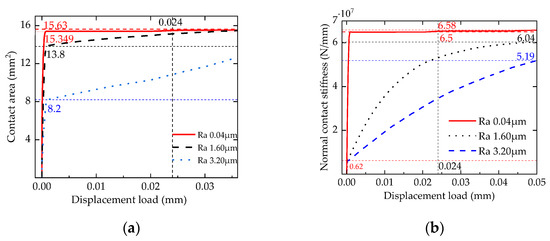
Figure 6.
Contact characteristics of the curvic couplings interface with different roughness. (a) The relationship between displacement load and contact area. (b) The relationship between displacement load and normal contact stiffness.
As shown in Figure 6a, when the roughness Ra is 0.04 μm, the contact area of the contact surface suddenly increases to 15.349 mm2 immediately after the displacement load is applied and quickly approaches the maximum value of 15.6 mm2; when the roughness Ra is 1.60 μm, the contact area of the contact surface suddenly increases to 13.8 mm2 immediately after the displacement load is applied and approaches the maximum value of 15.6 mm2 more gradually; when the roughness Ra is 3.20 μm, the contact area of the contact surface suddenly increases to 8.2 mm2 immediately after the displacement load is applied and shows a slow upward trend.
The analysis results indicate that the contact area of the curvic coupling interfaces under three roughness conditions increases with the increase in displacement load. When the contact surface is smoother, it tends to reach a fully contacted state more quickly. Conversely, when the contact surface roughness is higher, the speed at which it approaches a fully contracted state is slower. Compared to the Ra 0.04 μm rough surface, the maximum contact area of the Ra 1.60 μm rough surface shows almost no change, while the reduction rate of the Ra 3.20 μm rough surface is half that of the former. Since surface roughness represents machining precision and the peak height of micro-protrusions, lower roughness indicates higher machining precision, a surface closer to smoothness, and lower peak heights of micro-protrusions, which are closer to a planar state. Therefore, as the displacement load increases, the contact surface tends to reach a fully contacted state more quickly. Conversely, the rougher the surface, the higher the peak height of the micro-protrusions. According to Hertzian contact theory, the real contact area formed by micro-protrusion contact is smaller than the nominal contact area, so the contact surface reaches a fully contacted state more slowly.
As shown in Figure 6b, when the roughness Ra is 0.04 μm, the normal contact stiffness of the contact surface suddenly increases to 6.5 × 10⁷ N/mm upon the application of the displacement load and quickly approaches the maximum value of 6.58 × 10⁷ N/mm; when the roughness Ra is 1.60 μm, the normal contact stiffness of the contact surface suddenly increases to 6.2 × 10⁶ N/mm upon the application of the displacement load and slowly approaches the maximum value of 6.04 × 10⁷ N/mm; when the roughness Ra is 3.20 μm, the normal contact stiffness of the contact surface suddenly increases to 0.62 × 10⁷ N/mm upon the application of the displacement load and slowly approaches the maximum value of 5.19 × 10⁷ N/mm.
The analysis results indicate that the normal contact stiffness of the curvic coupling contact surfaces under three roughness conditions increases with the increase in displacement load. When the roughness of the curvic coupling contact surface is lower (0.04 μm), it tends to quickly approach the maximum normal contact stiffness value. Conversely, when the roughness of the contact surface is higher (1.60 μm, 3.20 μm), the growth of the normal contact stiffness value is slower, and the maximum normal contact stiffness value decreases. Compared to the Ra 0.04 μm rough surface, the maximum normal contact stiffness of the Ra 1.60 μm rough surface decreases by 8.21%, and that of the Ra 3.20 μm rough surface decreases by 21.12%. The normal contact stiffness of the curvic tooth is positively correlated with the contact area, and as the contact area increases, the contact stiffness also increases. However, the maximum normal contact stiffness values achievable under different roughness conditions vary, because rougher contact surfaces have more and higher micro-asperities, which reduces the actual contact area and leads to differences in the normal contact stiffness of the curvic coupling rough surfaces.
3.2.2. Deformation of Curvic Couplings with Different Roughness
Under the same preload displacement, the deformation results of the Curvic Couplings with different roughness are shown in Figure 7.
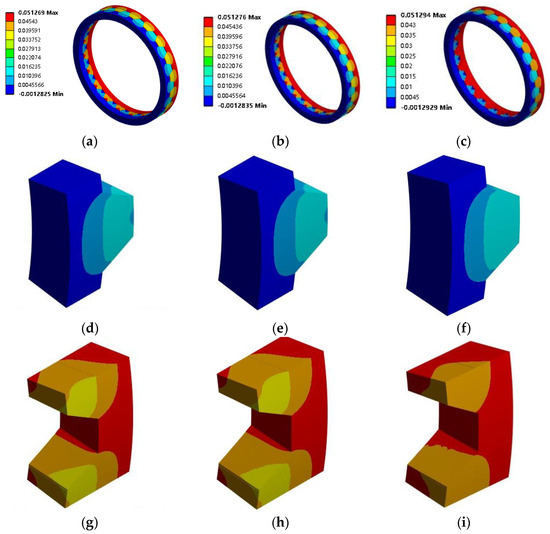
Figure 7.
Deformation of curvic couplings with different roughness (Unit: mm). (a) Ra 0.04 μm deformation, model. (b) Ra 0.16 μm deformation, model. (c) Ra 0.32 μm deformation, model. (d) Ra 0.04 μm deformation, convex tooth. (e) Ra 0.16 μm deformation, convex tooth. (f) Ra 0.32 μm deformation, convex tooth. (g) Ra 0.04 μm deformation, concave tooth. (h) Ra 0.16 μm deformation, concave tooth. (i) Ra 0.32 μm deformation, concave tooth.
Figure 7ac, respectively, shows the total deformation of Curvic Couplings B with roughness Ra values of 0.04 μm, 1.60 μm, and 3.20 μm. When the roughness of the contact surface is 0.04 μm, the maximum value of total deformation is 5.1269 × 10⁻² mm; when the roughness is 1.60 μm, the maximum value is 5.1276 × 10⁻² mm; and when the roughness is 3.20 μm, the maximum value is 5.1294 × 10⁻² mm.
It is noteworthy that the axial displacement load shown in Figure 7 exceeds 0.05 mm, and all minimum values in the figure are negative. This is due to the consistency with the actual preload application method, where the axial displacement load applied to the substructure is in the form of a concentrated load. Therefore, in ANSYS, the nodes on both ends of the curvic couplings ring are coupled to two remote points on the central axis, and displacement loads and fixed constraints are applied to these two remote points.
However, since the radial displacement and rotation of the substructure were not restricted, this resulted in an inward bending moment on the curvic couplings ring, causing it to displace radially toward the central axis.
As a result, in this scenario, the maximum total deformation occurs on the loaded side, exceeding an axial displacement load of 0.05 mm, while the minimum total deformation occurs on the other side, with a negative value.
Figure 7d–f illustrates the deformation of convex teeth in Curvic Couplings B with three different roughness levels. The deformation patterns of the convex teeth are generally similar across the three roughness conditions, with the deformation decreasing from the tooth top to the tooth base. Specifically, when the roughness Ra is 3.20 μm, the deformation in the contact area of the rough interface increases.
Figure 7g–i illustrates the deformation of concave teeth in Curvic Couplings B with three different roughness levels. The distribution pattern of concave tooth deformation is opposite to that of the concave teeth, with the deformation decreasing gradually from the tooth base to the tooth top.
The above results indicate that as the roughness of the curvic couplings interface increases, the overall deformation of the curvic couplings also increases, although this trend is not significant. This suggests that the overall deformation of the curvic couplings is primarily influenced by the applied displacement load, while the roughness of the curvic couplings has a relatively minor effect on the overall deformation.
3.2.3. Von Mises Stress of Curvic Couplings with Different Roughness
Under the same preload displacement, the Von Mises stress distribution results of the curvic couplings with different roughness are shown in Figure 8.

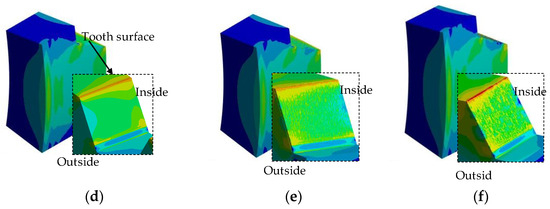
Figure 8.
Von Mises Stress of curvic couplings with different roughness (Unit: MPa). (a) Ra 0.04 μm stress, model. (b) Ra 0.16 μm stress, model. (c) Ra 0.32 μm stress, model. (d) Ra 0.04 μm stress, convex tooth. (e) Ra 0.16 μm stress, convex tooth. (f) Ra 0.32 μm stress, convex tooth.
Figure 8a–c, respectively, show the Von Mises stress results of the curvic couplings with roughness Ra values of 0.04 μm, 1.60 μm, and 3.20 μm. When the roughness Ra of the interface is 0.04 μm, the maximum equivalent stress of the curvic couplings is 1521.6 MPa; when the roughness Ra is 1.60 μm, the maximum equivalent stress of the curvic couplings is 1515.5 MPa; and when the roughness Ra is 3.20 μm, the maximum equivalent stress of the curvic couplings is 1563.5MPa.
Figure 8d–f illustrates the convex teeth of Curvic Couplings B with three different roughness levels and their corresponding tooth surface stress distributions. It can be observed that the Von Mises stress distribution on individual teeth is uneven, with higher stress in the inner diameter region compared to the outer diameter region. When the roughness Ra is 3.20 μm, the rough surface characteristics are notably evident. The concave teeth of Curvic Couplings B and their surface stress distributions exhibit the same stress distribution pattern as the convex teeth. Therefore, the stress map of concave teeth is no longer displayed.
Due to the stress concentration phenomenon being prone to occur at sections or locations with sudden changes in shape, this paper has simplified the fillet and chamfer features of the curvic couplings. Consequently, the locations where stress concentration occurs in Figure 8 are at the tooth tops and the edges of the contact surfaces, where the surfaces intersect.
The results indicate that the overall Von Mises stress distribution in the curvic couplings is uniform, consistent with material mechanics hypothesis. However, the Von Mises stress distribution on individual curvic couplings is uneven, with higher stress concentrations in the inner diameter region compared to the outer diameter region. When the roughness Ra is 0.04 μm, the interfaces of the curvic couplings appear smooth, with no significant roughness peaks. When the roughness Ra is 1.60 μm, the rough surface is more pronounced, with large areas of roughness peaks distributed across the contact surface, and stress values ranging from 800 MPa to 1000 MPa. When the roughness Ra is 3.20 μm, the rough surface is even more evident, exhibiting a few higher stress values (1200 MPa to 1500 MPa) compared to the previous condition.
4. Dynamic Analysis of Curvic Couplings Considering Rough Interfaces
This section focuses on a three-disk combined rotor with curvic coupling preload saturation and roughness of the interface of Ra 0.04 μm. It simulates actual operating conditions to explore the dynamic stress variation patterns of the rotor under the influence of imbalance at both the resonance speed and the maximum operating speed.
After preliminary calculation, the first-order critical speed of the rotor is 5557.1 rpm. The maximum operating speed of the rotor is 80% of the resonance speed. Therefore, the maximum operating speed of the rotor is 4445.7 rpm. For the purpose of facilitating calculations, the resonance speed is taken as 5500 rpm, resulting in a maximum operating speed of 4400 rpm. Research will subsequently be conducted under these two-speed conditions.
From the balance grade standards of ISO 1940 and API, it is known that the allowable residual imbalances of the three-disk combined rotor with curvic couplings should not exceed 5 g mm. The actual measured maximum residual imbalance of the rotor is typically 30 g mm. Additionally, according to the literature [28], the actual measured prototype rotor can be as high as 80 g mm or more.
In summary, the following investigations will be conducted:
- (1)
- The dynamic stress conditions after balance deterioration under extreme conditions of 80 g mm and 160 g mm at the resonance speed (5500 rpm);
- (2)
- The change in dynamic stress as the residual imbalance increases from 5 g mm to 30 g mm under the maximum operating speed limit (4400 rpm).
4.1. Boundary Conditions for Dynamic Analysis
The tooth surface contact pairs are set as frictionless contact (Frictionless) and the augmented Lagrangian contact algorithm is used for solving as shown in Figure 5b, while the disc and shaft are set to bonded contact. Additionally, parameters such as support stiffness, rotational speed, imbalance, and preload are also included.
As shown in Figure 9a, a saturated preload with a displacement of 0.2 mm is applied to the central connecting sleeve. As shown in Figure 9b, at a position 1 mm in the positive x-axis direction (radial direction) on the intermediate rotor disk, the corresponding test imbalance is applied using the lumped mass method. As shown in Figure 9c, the support stiffness is 25,000 N/mm, with both support points 100 mm from the end of the shaft.
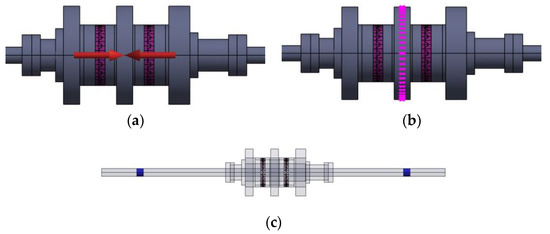
Figure 9.
Boundary conditions of the rotor model. (a) Bolt preload applied position. (b) Rotor imbalance applied position. (c) Rotor support applied position.
The curvic couplings are complex, with as many as 40 interfaces, making it quite challenging to describe the dynamic stresses of all interfaces, and the computational workload is large. Therefore, leveraging the cyclic symmetry of the structure, it is feasible to select a typical interface for study.
As shown in Figure 10a, this paper chooses the convex tooth ring of the Curvic Couplings B in the rotor as the analysis object. Due to the gyroscopic effect of the rotor, the rotor system exhibits whirl phenomena during operation, resulting in eccentricity after being subjected to imbalanced forces and rotating (see Figure 10b).
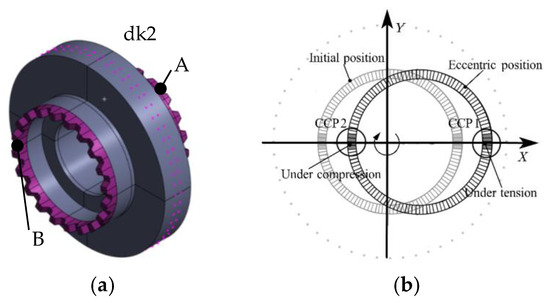
Figure 10.
Measured part in the rotor with curvic couplings. (a) The middle disk(dk2) with Curvic Couplings A, B. (b) CCP1 and CCP2 in the Curvic Couplings B.
Taking the two convex teeth (a total of four contact surfaces) in the positive and negative directions orthogonal to the initial position X-axis as the main research objects, the positive direction of the x-axis corresponds to the teeth pairs CCP1, and the negative direction corresponds to the teeth pairs CCP2, with the teeth pairs CCP1 being closer to the rotation axis and the teeth pairs CCP2 being farther from it.
4.2. Dynamic Analysis Results
4.2.1. Resonance Speed 5500 rpm with Different Imbalance Values
Under extreme conditions with resonance speeds of 5500 rpm and two different imbalance values of 80 g·mm and 160 g·mm, the dynamic stress variation and distribution of the rotor with curvic couplings and the contact state of the interface, pressure, and sliding distance, were simulated and calculated. Quantitative and qualitative analyses were conducted.
The dynamic stress variation results of the interfaces on the CCP1 and CCP2 are shown in Figure 11. According to the boundary conditions set by preload and rotational speed loading, the period from 0 to 1.5 s is the rotor preload stage, from 1.5 to 2.5 s is the acceleration stage, and from 2.5 to 10 s is the stable rotational speed stage. During this period, the dynamic stress on the contact surface is in the stress fluctuation stage. Therefore, the following conclusions will primarily analyze the fluctuating stage of dynamic stress.
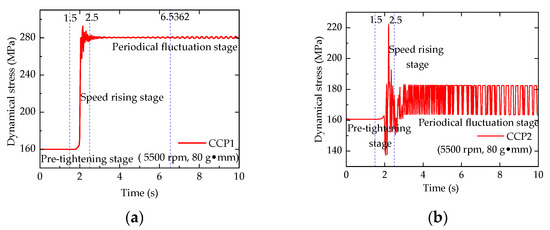
Figure 11.
Dynamic stress of CCP1 and CCP2 contact surface (5500 rpm, 80 g·mm). (a) Dynamical stress of CCP1. (b) Dynamical stress of CCP2.
As shown in Figure 11a, when the rotor operates at a constant working speed of 5500 rpm, the contact surface equivalent stress of the CCP1 dynamically changes over time from 2.5 s to 3.8534 s. During the period from 3.8534 s to 6.5362 s, the contact surface equivalent stress of the CCP1 exhibits periodic cyclic characteristics, with the stress cycle period remaining constant and the amplitude gradually increasing until it stabilizes at 6.5362 s. The contact surface equivalent stress is a stable variable stress, with a stress cycle period of 0.186 s, a mean stress of 280.365 MPa, and a stress amplitude of 1.77 MPa. Similarly, as shown in Figure 11b, the contact surface equivalent stress of the CCP2 exhibits periodic cyclic characteristics at 7.7847 s, with a stress cycle period of 0.2391 s, a mean stress of 173.055 MPa, and a stress amplitude of 19.01 MPa.
Therefore, it can be concluded that the stress variation pattern for CCP1 during the fluctuation phase is as follows: the stress cycle remains stable, while the stress amplitude gradually increases; for CCP2, the stress variation pattern is the stress cycle gradually increases, while the stress amplitude remains stable.
The contact state, pressure, and sliding distance variations between CCP1 and CCP2 are shown in Figure 12. Figure 12a,b illustrate the contact states of CCP1 and CCP2, respectively. CCP1 is in a sliding state, while most of the CCP2 is also in a sliding state, except for the root portion, which is slightly in a distant (Far) state. Figure 12c,d shows the contact surface pressure results for the CCP1 and CCP2. The results indicate that the maximum and minimum pressures do not occur at CCP1 or CCP2. Figure 12e,f represents the contact surface sliding distances, where the sliding distance for CCP1 is zero, indicating no slippage, while the sliding distance for CCP2 is mostly 0.17829 mm, showing a noticeable slippage.
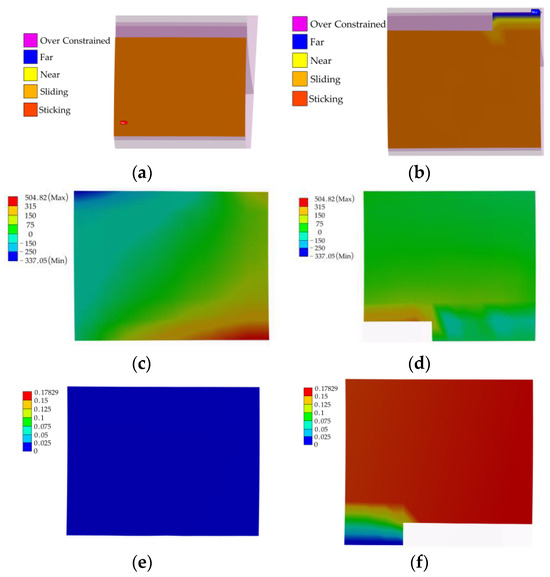
Figure 12.
Contact characteristics of CCP1 and CCP2 interfaces (5500 rpm, 80 g·mm). (a) Contact state, CCP1. (b) Contact state, CCP2. (c) Pressure, CCP1 (Unit: MPa). (d) Pressure, CCP1 (Unit: MPa). (e) Sliding distance, CCP1 (Unit: mm). (f) Sliding distance, CCP2 (Unit: mm).
Figure 13 shows that when the operating speed is 5500 rpm and the imbalance value is 160 g mm, during the stable speed region, from 2.5 s to 5.0487 s, the equivalent stress on the contact surface of the CCP1 changes dynamically over time; from 5.0487 s to 10 s, the equivalent stress on the contact surface of the CCP1 exhibits periodic cyclic characteristics, with the stress cycle period remaining constant, but the stress amplitude gradually increases, stabilizing by 5.0487 s. The equivalent stress on the contact surface of the CCP1 is a stable variable stress, with a stress cycle period of 0.2125 s, an average equivalent stress of 309.795 MPa, and a stress amplitude of 20.19 MPa.
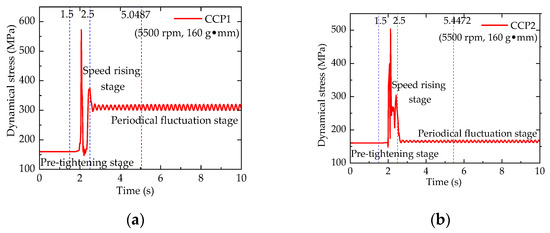
Figure 13.
Dynamic stress of CCP1 and CCP2 contact surface (5500 rpm, 160 g·mm). (a) Dynamical stress of CCP1. (b) Dynamical stress of CCP2.
From Figure 13, the equivalent stress of the CCP2 exhibits a periodic cyclic characteristic. After 5.4472 s, the stress cycle period is 0.2125 s, the mean equivalent stress is 164.8444 MPa, and the stress amplitude is 7.05 MPa.
Based on the above analysis, the stress variation pattern during the fluctuating phase of the contact surfaces of CCP1 and CCP2 is as follows: the stress cycle remains stable, while the stress amplitude gradually increases. After 5.0487 s and 5.4472 s, both the stress cycle and amplitude stabilize.
Figure 14a,b represents the contact state results for CCP1 and CCP2. The CCP1 is in a sliding state, while the majority of the CCP2 is also in a sliding state, with the root in a far (Far) position.

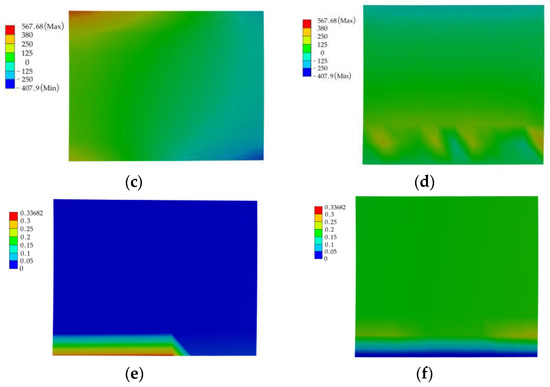
Figure 14.
Contact characteristics of CCP1 and CCP2 interfaces (5500 rpm, 160 g·mm). (a) Contact state, CCP1. (b) Contact state, CCP2. (c) Pressure, CCP1 (Unit: MPa). (d) Pressure, CCP1 (Unit: MPa). (e) Sliding distance, CCP1 (Unit: mm). (f) Sliding distance, CCP2 (Unit: mm).
Figure 14c,d presents the results of contact surface pressure between the CCP1 and CCP2. The contact surface pressure on the left side of CCP1 reaches its maximum at the tooth top and gradually decreases with the reduction in tooth height, with a maximum value of 567.68 MPa. The pressure in the middle of the contact surface is relatively small, and the pressure on the right side is negative, which is due to the preload effect, causing the curvic couplings to experience both compressive and tensile stresses.
Figure 14e,f illustrates the sliding distances of the contact surfaces. For the CCP1, the sliding distance increases gradually from the tooth top to the root, with the maximum sliding distance occurring on the left side of the root, reaching 0.00682 mm. In contrast, the sliding distance of the CCP2 decreases gradually from the tooth tip to the root until there is no sliding, and the average sliding distance of the CCP2 is greater than that of the CCP1.
When the rotor reaches the resonant speed, an increase in imbalance may lead to failure of the curvic couplings interfaces. At a resonant speed of 5500 rpm, if the imbalance increases from 80 g·mm to 160 g·mm, the mean dynamic stress of the curvic couplings decreases with the increase in imbalance.
4.2.2. Maximum Operating Speed 4400 rpm with Different Residual Imbalance Values
Investigating the variation patterns of dynamic stresses in a rotor under different residual imbalance conditions at a maximum operating speed of 4400 rpm.
According to the provisions on the permissible imbalance of rotors in the ISO 21940-11:2016, the residual maximum imbalance of this rotor is 30 g·mm. Taking the rotor with curvic couplings in Figure 3 as the research object, the residual imbalance is applied to the middle disk(dk2). Under the condition of the rotor’s maximum operating speed of 4400 rpm, simulations were conducted for six imbalance parameter values (5 g mm, 10 g mm, 15 g mm, 20 g mm, 25 g mm, and 30 g mm), and the dynamic stress variation results on the contact surfaces of the CCP1 and CCP2 are shown in Figure 15.
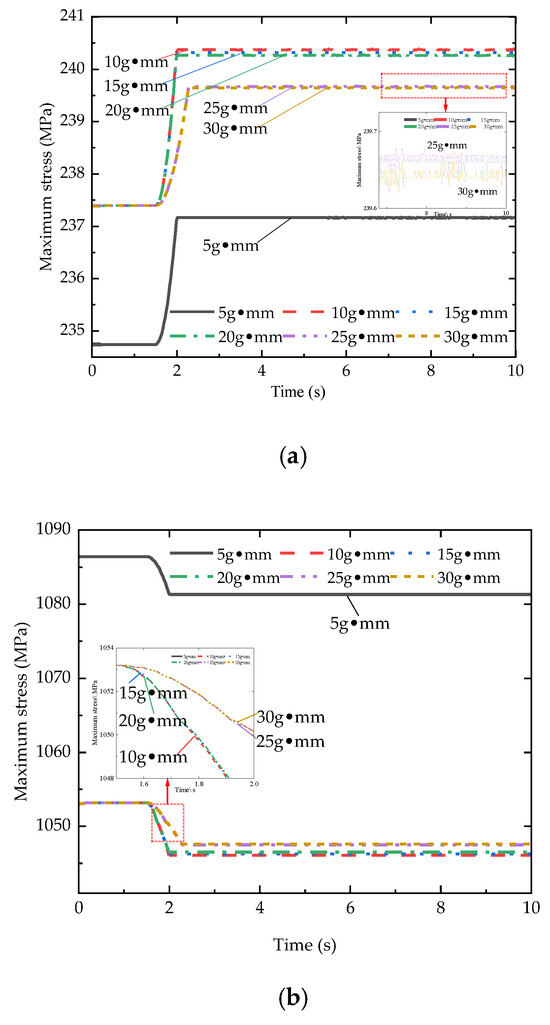
Figure 15.
The influence of residual imbalance on rotor dynamic stress (4400 rpm). (a) Dynamical stress of CCP2. (b) Dynamical stress of CCP2.
As shown in Figure 15 and Figure 16, at a working speed of 4400 rpm, the rotor operates smoothly with minimal vibration under an imbalance of 5 g·mm. The rotor is less affected by imbalanced forces, and the curvic couplings interface is primarily subjected to saturated preload forces. Therefore, at this point, the stress value at the CCP1 (under tension) is the smallest, at 237.17 MPa, while the stress value at the CCP2 (under compression) is the largest, at 1081.3 MPa.
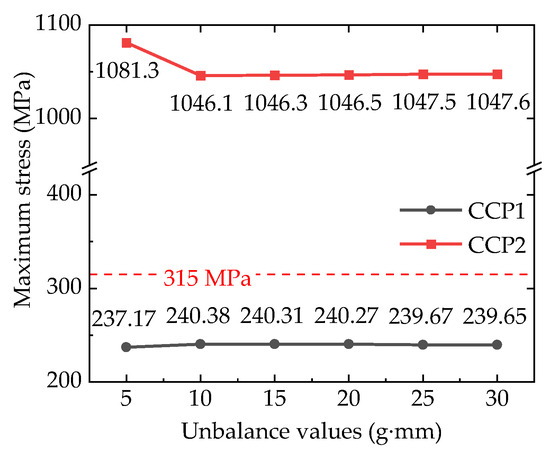
Figure 16.
Comparison of maximum stress values (4400 rpm).
As the imbalance increases to 10 g·mm or more, the influence of the imbalance force on the curvic couplings interface undergoes a sudden change. The stress value at the CCP1 (under tension) first increases dramatically and then gradually decreases as the imbalance increases. Conversely, the stress value at the CCP2 (under compression) first decreases sharply and then gradually increases with the increase in imbalance.
The material for the curvic couplings is structural steel, with a yield strength of 315 MPa. As shown in Figure 16, under the operating speed, the maximum stress on the contact surface of the CCP1 does not exceed the material’s yield strength, indicating that the curvic couplings are in a safe state under high-speed operating conditions. However, the maximum stress on the contact surface of the CCP2 is 243.27% of the yield strength, far exceeding the material’s yield limit, which will have a destructive impact on the structural strength of the curvic couplings.
Unfortunately, owing to time constraints, limited resources, and the length of the article, this paper did not conduct an in-depth analysis of the roughness factor. Instead, it adopted the roughness (Ra = 0.04 μm) of the curvic couplings interface in the prototype aero-engine rotor for research.
Future work may further explore the surface quality of the joint surface in relation to the dynamic stress of the combined rotor with curvic couplings by incorporating fretting wear, material elastic-plasticity, and other factors.
5. Experimental Verification
5.1. Compression Experiment
To verify the effectiveness of the model described in this paper, a curvic coupling specimen with a rough interface was designed for compression experiments.
The specimen was machined according to the curvic tooth profile mentioned above, with its physical dimensions shown in Figure 17a,b. The tooth parameters are listed in Table 2. The material used was structural steel. To simulate a rough tooth surface, the surface was machined into a conical shape with a roughness Ra of 3.20 μm.
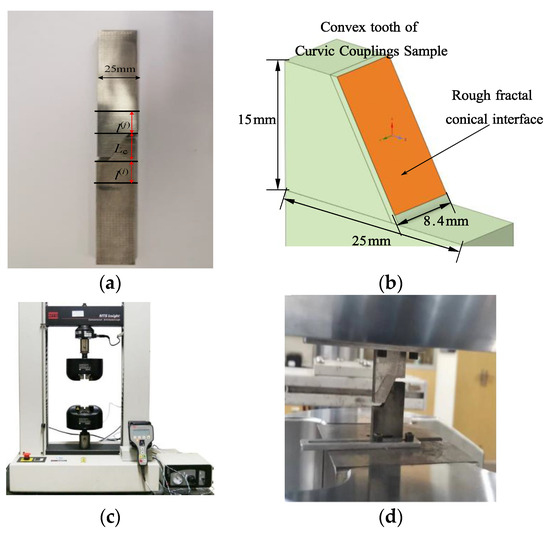
Figure 17.
Compression test of curvic couplings specimen. Considering rough interface. (a) Physical dimension of specimen. (b) Curvic couplings specimen considering rough interface. (c) MTS Insight 30 test systems. (d) Experimental installation and testing.
As shown in Figure 17c, the MTS Insight 30 test systems; MTS Systems Company, Eden Prairie, MN, USA. Web site: www.mts.com were used for the experiment. The machine has a load range of ±1 kN (small sensor) and ±30 kN (large sensor), with a load accuracy of ±0.5%. The control method involves adjusting displacement and load, with a maximum displacement of 1000 mm.
The experimental setup is shown in Figure 17d. The upper and lower extension areas of the test specimen are clamped using the upper and lower top plates of the testing machine in conjunction with the fixture to restrict lateral displacement. During the experiment, the upper top plate is set to apply a downward load at a speed of 0.005 mm/s. The force sensor on the lower top plate measures the reaction force, and the longitudinal compression displacement and load are recorded in real time.
As shown in Figure 18, in the initial elastic stage (before a displacement of 0.5 × 10⁻⁴ m), the experimental curve obtained from testing is to the right of the finite element calculation results, meaning that under the same preload, the experimental results show a larger displacement value than the finite element calculations. This discrepancy arises from the friction at the interface in actual tests, whereas the simulation contact surface is set to frictionless, creating a difference between the two. In the elastoplastic stage (after a displacement of 0.5 × 10⁻⁴ m), the finite element calculation results show a monotonic increase followed by a gradual flattening of the rate of increase, with the preload approaching saturation. The experimental results also exhibit a gradual flattening and a trend toward preload saturation but with significant fluctuations, possibly due to slippage at the sample interface and plastic yielding of the material.
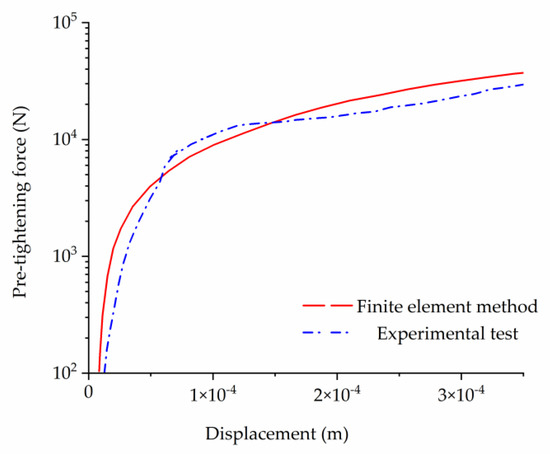
Figure 18.
Load–displacement relationship curve of pre-tightening force.
In summary, through the comparative analysis of calculations and experiments, it can be concluded that the relationship between the preload force and displacement deformation measured in the test matches the finite element calculation results. Therefore, the finite element model of the curvic couplings specimen established according to the method in this paper possesses certain validity and correctness.
5.2. Modal Experiment
The purpose of the modal hammer test is to evaluate the experimental specimen of the combined rotor with curvic couplings under preload saturation conditions and to compare and verify the results with the calculated modal properties of the rotor model shown in Figure 19.
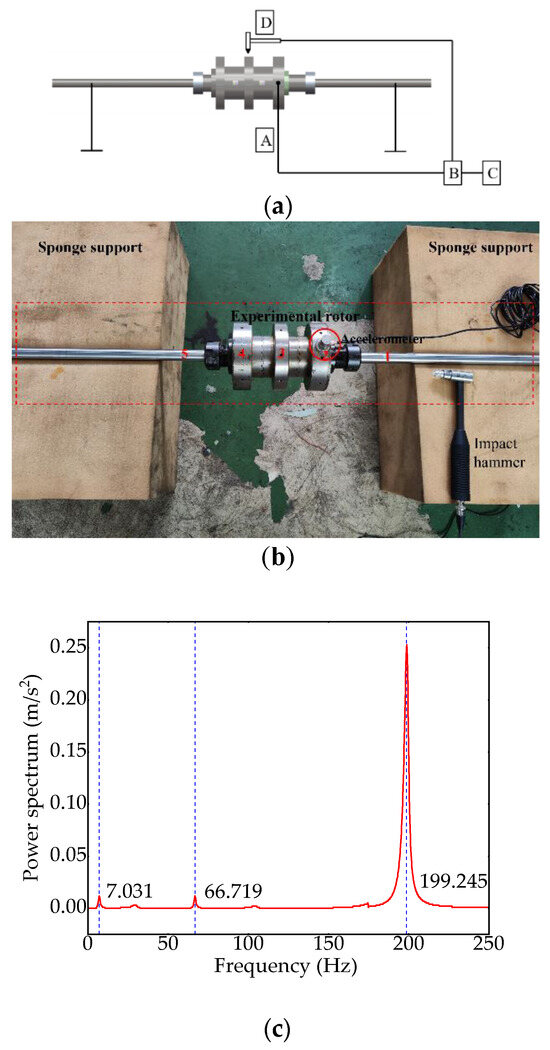
Figure 19.
Modal experiment of the rotor with curvic couplings. (a) Experiment scheme. (b) Modal experiment. (c) Frequency response results.
Apply a hammer impact excitation force to the test specimen, simultaneously measure the excitation and response signals, and repeat the process for different measurement points to obtain the frequency response function or power spectral density curve for each point. Based on the frequency response function or power spectral density curve, identify the modal parameters to determine the resonant frequencies under approximately free boundary conditions.
This experiment utilizes the Donghua DH5922D testing system Jiangsu Donghua Testing Technology Co., Ltd., Jingjiang, Taizhou, Jiangsu, China., which is primarily composed of an excitation system, a testing system, and a data acquisition and analysis system. The specific experimental equipment and setup are illustrated in Figure 19a, where A represents the accelerometer, B represents the charge amplifier, C represents the test and analysis system, and D represents the impact hammer.
This modal experiment utilizes a plastic impact pad hammer for testing. The performance parameters of the DH3A102 impact hammer; Jiangsu Donghua Testing Technology Co., Ltd., Jingjiang, Taizhou, Jiangsu, China; Web site: www.dhtest.com are as follows: reference sensitivity of 2.3 (mV/N), measurement range of 0~500 (N), natural frequency of the force sensor at 31 (kHz), and overload capacity of 120%. The micro piezoelectric accelerometer used is the CT1010LC accelerometer Shanghai Chengtec Electronics Technology Co., Ltd, Changning, Shanghai, China. Web site: www.sh-chengtec.com, with the following key performance parameters: voltage sensitivity of 98.1 mV/g, frequency range of 1~5000 Hz, lateral sensitivity of <5%, and maximum allowable acceleration of 100 m·s−2.
The experimental procedure is as follows. (a) Use a sponge pad as the support component for the rotor test piece, with the accelerometer installed on the rotor disk. The impact hammer and accelerometer are connected to the data acquisition and analysis system; (b) Set up the impact hammer channel, trigger level, bandwidth, window, and drive point in the DHDAS V6.22.6.18ZZr software. Configure other sensor types, such as the accelerometer, and calibrate the sensitivity of the accelerometer to ensure it is within the allowable range and accurate. (c) As shown in Figure 19b, during the experiment, use the impact hammer to test the five measurement points on the rotor test piece from right to left, with each point tested five times, and record the impact excitation signals in the testing system. (d) Use the signal acquisition system to process and analyze the data to obtain the power spectrum curve for the modal analysis of the rotor test piece and the effective resonant frequency of the rotor test piece.
The boundary conditions for free-modal experiments require that the highest rigid-body modal frequency of the actual support should be less than the lowest elastic frequency of the structure. Preliminary experiments have found that among the methods of elastic rope suspension, sponge pad support, and rubber pad support, the sponge pad support yields better experimental results, essentially meeting the requirement that the natural frequency of the test specimen does not exceed one-fifth of the elastic modal frequency.
As shown in Figure 19c, the power spectrum diagram of the rotor system can be obtained through the above experimental steps. It is also known that the first three natural frequencies of the experimental rotor are 7.031 Hz, 66.719 Hz, and 199.245 Hz, respectively. The natural frequencies measured in the experiment are close to the calculated natural frequencies.
As shown in Table 3, the relative error between the calculated and experimental natural frequencies of the rotor is within 5%, which is small and within the allowable error range of the experiment. Therefore, by comparing and analyzing the calculated free modal results of the rotor with the experimental results, it can be concluded that the rotor system model established in this paper has a certain degree of validity and rationality.

Table 3.
Comparison of finite element calculation and experimental natural frequency results.
6. Conclusions
This paper addresses the shortcomings of traditional combined rotor models that tend to neglect the influence of the connection structure, especially failing to consider the contribution of the curvic coupling interfaces. It proposes a novel model for the rotors with curvic couplings, considering the rough interface, and subsequently conducts a series of static and dynamic analyses under extreme loads. The effectiveness of the proposed modeling method for the rotors with curvic couplings is then verified through experiments. The main conclusions are as follows:
- (1)
- This paper proposes a modeling method for combined rotors with curvic couplings that consider rough interfaces. Combined with the finite element method, it can be used for mechanical analysis of the rotors with curvic couplings, providing a theoretical approach for studying the mechanical characteristics of the rotors’ curvic couplings in turboshaft engines in engineering applications;
- (2)
- By analyzing the static characteristics of the rough interface of curvic couplings, this study explores the effects of different roughness levels on the deformation and stress distribution patterns of the contact surface under static loads. The roughness of the interface significantly influences the deformation of the contact surface, but its impact on the overall deformation of the rotor is relatively minor. The static stress distribution across the interface is largely influenced by the geometric features of the teeth;
- (3)
- By analyzing the dynamic characteristics of the contact surface of the rotor with curvic couplings, this study explores the variation patterns of rotor dynamic stress at resonance speed and maximum operating speed. The dynamic stress results of curvic couplings interface exhibit periodic variation characteristics. Under the same rotational speed but different imbalance quantities, the variation period and amplitude of the dynamic stress fluctuation region of the curvic couplings interface both change over time. The dynamic stress amplitude typically appears during the acceleration region of the rotational speed and tends to stabilize at a certain moment. At the maximum operating speed, under the condition of allowable residual imbalance in the rotor system, the imbalance has a change rate of less than 5% on the dynamic stress of the contact surface of curvic couplings. The maximum stress on the contact surface of CCP2 is 243.27% of the yield strength, exceeding the material’s yield limit, which can cause damage to the strength of the curvic couplings interface.
Author Contributions
Y.Y. completed the simulation and wrote this paper; X.H. proposed the solutions method and the testing work; A.W. designed the research plan; X.H processed the data; and H.Z. established the model and proposed the testing work. All authors consented to its submission to the journal. All authors have read and agreed to the published version of the manuscript.
Funding
This project was supported in part by the State Key Laboratory of Precision Manufacturing for Extreme Service Performance Foundation Project (No. ZZYJKT2021-07).
Institutional Review Board Statement
Not applicable.
Informed Consent Statement
Not applicable.
Data Availability Statement
Data are contained within the article.
Acknowledgments
Yijun Yin and the co-authors would like to thank all the reviewers who participated in the review of this manuscript.
Conflicts of Interest
There are no conflicts to declare.
References
- Pisani, S.R.; Rencis, J.J. Investigating curvic coupling behavior by utilizing two- and three-dimensional boundary and finite element methods. Eng. Anal. Bound. Elem. 2000, 24, 271–275. [Google Scholar] [CrossRef]
- Richardson, I.J.; Hyde, T.H.; Becker, A.A.; Taylor, J.W. A validation of the three-dimensional finite element contact method for use with Curvic couplings. Proc. Inst. Mech. Eng. Part G J. Aerosp. Eng. 2002, 216, 63–75. [Google Scholar] [CrossRef]
- Jiang, X.J.; Zhang, Y.Y.; Yuan, S.X. Analysis of the contact stresses in curvic couplings of gas turbine in a blade-off event. Strength Mater. 2012, 44, 539–550. [Google Scholar] [CrossRef]
- Yuan, S.X.; Zhang, Y.Y.; Zhang, Y.C.; Jiang, X.J. Stress distribution and contact status analysis of a bolted rotor with curvic couplings. Proc. Inst. Mech. Eng. Part C J. Mech. Eng. Sci. 2010, 224, 1815–1829. [Google Scholar] [CrossRef]
- Efstathiou, C.; Tsormpatzoglou, I.; Tapoglou, N. Parametric Modeling of Curvic Couplings and Analysis of the Effect of Coupling Geometry on Contact Stresses in High-Speed Rotation Applications. Machines 2023, 11, 822. [Google Scholar] [CrossRef]
- Liu, H.; Hong, J.; Ruan, S.L.; Li, Z.; Cheng, G.D. A Model accounting for Stiffness Weakening of Curvic Couplings under Various Loading Conditions. Math. Probl. Eng. 2020, 2020, 1–17. [Google Scholar] [CrossRef]
- Liu, H.; Hong, J.; Zhang, D.Y. Bending and vibration of a discontinuous beam with a curvic coupling under different axial forces. Front. Mech. Eng. 2020, 15, 417–429. [Google Scholar] [CrossRef]
- Zhang, D.Y.; Yang, C.; He, T.A.; Liu, J.X.; Hong, J. Modelling and stress analysis for double row curvic couplings. Proc. Inst. Mech. Eng. Part C-J. Eng. Mech. Eng. Sci. 2021, 235, 4231–4243. [Google Scholar] [CrossRef]
- Heng, X.; Wang, A.L. Stiffness Loss of Curvic Coupling Under Bending Vibration and Its Effect on Dynamic Characteristics of Rotor Systems. IEEE Access 2024, 12, 102774–102783. [Google Scholar] [CrossRef]
- Wang, C.Y.; Li, Z.H.; Wang, H.Z.; Ji, X.L.; Yang, L.H. Nonlinear modeling and vibration response analysis of rod fastening rotor-bearing system with curvic coupling. Tribol. Int. 2024, 199, 109984. [Google Scholar] [CrossRef]
- Zhao, R.C.; Jiao, Y.H.; Qu, X.Q.; Zhang, S.; Wu, X.L. Modeling method of gas turbine rotor contact surface based on virtual material layer. J. Harbin Inst. Technol. 2021, 53, 117–123. [Google Scholar]
- Rimpel, A.M.; Leopard, M. Simple contact stiffness model validation for tie bolt rotor design with butt joints and pilot fits. J. Eng. Gas Turbines Power 2020, 142, 011014. [Google Scholar] [CrossRef]
- Yu, P.C.; Zhao, Z.M.; Hou, L.; Chen, G. Analysis on analytical modelling and damping characteristics of bolted joint structure with spigot. J. Aerosp. Power 2021, 36, 2490–2502. [Google Scholar]
- Liu, D.; Zhou, L.; Zhang, D.Y.; Wang, H. Modeling and dynamic analysis for rotors with curvic-coupling looseness. J. Vib. Control. 2023, 29, 1996–2009. [Google Scholar] [CrossRef]
- Croccolo, D.; De Agostinis, M.; Fini, S.; Olmi, G.; Robusto, F.; Vincenzi, N. On Hirth Ring Couplings: Design Principles Including the Effect of Friction. Actuators 2018, 7, 79. [Google Scholar] [CrossRef]
- Gao, J.; Yuan, Q.; Li, P.; Feng, Z.P.; Zhang, H.T.; Lv, Z.Q. Effects of Bending Moments and Pre-tightening Forces on the Flexural Stiffness of Contact Interfaces in Rod-Fastened Rotors. J. Eng. Gas. Turbines Power 2012, 134, 102503. [Google Scholar] [CrossRef]
- Jin, M. The nonlinear dynamic characteristics of the aero-turboshaft engine rotor blade casing rubbing system with the curvic couplings considering the elastoplastic stage. Eng. Anal. Bound. Elem. 2024, 161, 78–102. [Google Scholar] [CrossRef]
- Kim, B.J.; Oh, J.; Palazzolo, A. An improved preloaded Curvic coupling model for rotordynamic analyses. J. Sound Vib. 2023, 544, 117391. [Google Scholar] [CrossRef]
- Kim, B.J.; Oh, J.; Palazzolo, A. Beam based rotordynamics modelling for preloaded Hirth, Curvic and butt couplings. J. Sound Vib. 2023, 565, 117921. [Google Scholar] [CrossRef]
- Yuan, S.X. The Structure and Strength of Curvic Couplings; China Petrochemical Press: Beijing, China, 2022; pp. 19–24. [Google Scholar]
- Sun, H.B.; Liu, M.; Zhang, Y.Z.; Wei, C.L. Optimizing circumferential assembly angle of rotor parts connected by curvic couplings based on acquired tooth surface error data. Chin. J. Aeronaut 2024, 37, 404–441. [Google Scholar] [CrossRef]
- Komvopoulos, K.; Ye, N. Three-dimensional contact analysis of elastic-plastic layered media with fractal surface topographies. J. Trib. 2001, 123, 632–640. [Google Scholar] [CrossRef]
- Liou, J.L.; Tsai, C.M.; Lin, J.F. A microcontact model developed for sphere- and cylinder-based fractal bodies in contact with a rigid flat surface. Wear 2010, 268, 431–442. [Google Scholar] [CrossRef]
- Yuan, Y.; Zhang, J.; Cheng, Y. An elastoplastic fractal model for cylinder in contact with a smooth plane. Sci. Sin. Tech. 2017, 47, 502–513. [Google Scholar] [CrossRef]
- Zhang, B.; Zhou, L. Feature Analysis of Fractal Surface Roughness Based on Three-dimensional W-M Function. J. Phys. Conf. Ser. 2021, 1906, 012020. [Google Scholar] [CrossRef]
- Wu, D.G.; Gang, T.Q.; Fan, X.G.; Wu, J.L. Surface Roughness Measuring Based on the Theory of Fractal Geometry. Appl. Mech. Mater. 2014, 551, 434–438. [Google Scholar] [CrossRef]
- Reddy, J.N. Introduction to the Finite Element Method, 4th ed.; McGraw Hill Education: New York, NY, USA, 2019; pp. 759–764. [Google Scholar]
- Song, M.B.; Yan, P.; Wang, X.; Xiang, Y.Z.; Yang, Y.; Xie, R.H. Exploration of Maximum Unbalance of a Turboshaft Engine According to Airworthiness requirements. J. Aerosp. Power 2023, 38, 1467–1473. [Google Scholar]
Disclaimer/Publisher’s Note: The statements, opinions and data contained in all publications are solely those of the individual author(s) and contributor(s) and not of MDPI and/or the editor(s). MDPI and/or the editor(s) disclaim responsibility for any injury to people or property resulting from any ideas, methods, instructions or products referred to in the content. |
© 2024 by the authors. Licensee MDPI, Basel, Switzerland. This article is an open access article distributed under the terms and conditions of the Creative Commons Attribution (CC BY) license (https://creativecommons.org/licenses/by/4.0/).