Article

Test Stand for Microjet Engine Prototypes

by
Cornel Mihai Tărăbîc
1,2,
Grigore Cican
1,2,*,
Cristian Olariu
1,
Gabriel Dediu
1 and
Răzvan Marius Catană
1
1
National Research and Development Institute for Gas Turbines COMOTI, 061126 Bucharest, Romania
2
Faculty of Aerospace Engineering, National University of Science and Technology Politehnica Bucharest, 1-7 Polizu Street, 1, 011061 Bucharest, Romania
*
Author to whom correspondence should be addressed.
Machines 2024, 12(10), 688; https://doi.org/10.3390/machines12100688
Submission received: 25 August 2024 / Revised: 22 September 2024 / Accepted: 26 September 2024 / Published: 30 September 2024
(This article belongs to the Section Turbomachinery)

Abstract

:
To investigate the functionality and performance of a prototype microjet engine, we constructed a versatile test stand tailored to the specifications of a 400 N prototype. This test stand facilitated a comprehensive study by enabling real-time recording of 45 essential parameters for analysis, encompassing temperatures, pressures, speed, fuel flow, thrust, vibration, and various other monitored metrics. All parameters and control elements were seamlessly integrated via a data acquisition and control system, utilizing a compactDAQ (Data Acquisition) system from National Instruments and a custom Virtual Instrument programmed with graphical language. The test stand offers both manual and automated operation modes, with the flexibility for hybrid operation. For instance, following the idle regime, manual control using a potentiometer can seamlessly transition from automated control via a proportional control (P control) mechanism. Before the experimental campaign, rigorous verification and validation tests were conducted to ensure the reliability and accuracy of the setup. The experimental campaign comprised a series of manual tests focusing on the fuel system and automated tests covering starting, idle, working, and stopping regimes. This structured approach allowed for a comprehensive evaluation across different operational scenarios, providing insights into the engine’s behavior and performance under varying conditions.

1. Introduction

The emergence of microjet engines dates back to the period between 1950 and 1970, when applications were initially found in automotive fields [1]. However, their development initially targeted diverse purposes, such as serving as power generators in stationary rocket launchers, propulsion systems for buses, and other modes of transportation [2].
Presently, microjet engines have found prominent applications in aviation, particularly in the domain of unmanned aerial vehicles (UAVs) [3], electric hybrid vehicles, and small-scale electricity generators [4]. Additionally, micro gas turbines serve as auxiliary power units (APUs) in modern aircraft [5] and play a role as supplementary power units in experimental hybrid systems integrated with solid oxide fuel cells (SOFCs), facilitating cogeneration systems that provide electricity to buildings or residential areas [6]. The suitability of microjet engines for these applications stems from their high power-to-weight ratio, with the performance of individual components directly influencing overall engine performance.
One of the pivotal phases in the development of a microjet engine involves the experimental campaign, which serves to validate essential features and establish operational regimes and performance benchmarks [7]. Microjet engines are well-suited for the aforementioned applications owing to their impressive power-to-weight ratio, wherein the performance of core components governs overall engine effectiveness. The experimental campaign must meet stringent requirements, particularly when monitored under varying ambient conditions on the test bench. These conditions encompass atmospheric modifications and transient processes, including both normal and sudden accelerations [8,9]. Developing a testing procedure for a prototype engine differs from utilizing a manufactured engine, as it is not reliant on an engine manual and necessitates alternative approaches [10].
Designing a test stand for microjet engine prototypes requires meticulous consideration to accurately replicate the engine’s operating conditions for performance and reliability testing. Several critical components must be addressed in the design of such a test stand [11]:
Fuel System: The test stand necessitates a fuel system capable of delivering the requisite fuel flow rate and pressure to the engine, accommodating a spectrum of fuels designated for use with the microjet engine.
Instrumentation: Precise measurement of key engine parameters, including thrust, fuel flow, and temperature, is imperative for comprehensive engine performance assessment. The test stand must be outfitted with suitable instrumentation to capture and quantify these parameters accurately.
Control System: A sophisticated control system is indispensable for meticulously regulating various parameters impacting engine performance, such as fuel flow, air pressure, and temperature. This control mechanism should sustain desired conditions consistently over prolonged durations to facilitate thorough testing and performance analysis.
Safety Systems: Designing the test stand with safety at the forefront is paramount, given the inherent risks associated with jet engines. Incorporating emergency shut-off systems and other safety features into the design is imperative to mitigate potential hazards and ensure safe operation.
Data Acquisition and Analysis: Equipping the test stand with robust data acquisition and analysis systems is essential for gathering and scrutinizing data pertaining to engine performance. This capability empowers engineers to assess the engine’s efficacy comprehensively and pinpoint areas warranting enhancement.
Micro gas turbine test stands play a crucial role in real-time measurement of engine performance, facilitated by data acquisition and operational control mechanisms employing sensors, transducers, and specialized equipment for data acquisition, as well as relays, pressure reducers, and valves for operational control. These test stands offer avenues for expanding measurements through the integration of additional equipment into the data acquisition and control system, bolstered by relevant software. A body of scientific literature has documented test stands and methodologies for testing, leveraging various equipment and software [12,13,14,15]. Additionally, a methodology for testing microjet engines has been outlined in [16], encompassing instrumentation, data acquisition and control systems, and a graphical user interface.
Furthermore, research into the utilization of biofuels in different blends for aviation turbo-engines has garnered significant attention, with studies tailored to engine type and performance requirements. Some studies have culminated in demonstrative flights [17,18,19]. Beyond engine performance evaluation, research endeavors have delved into assessing combustion dynamics and gaseous pollutant emissions [20,21].
Other research papers have examined the use of biodiesel as a sustainable fuel for small turbojet engines in laboratory conditions. The studies explore different types of biodiesel and JET-A-1 mixtures and assess their impact on the fundamental parameters of these engines [22].
The use of bio-ethanol as fuel for aviation turbine engines was also studied. Different compositions, specifically 5%, 10%, and 15% concentrations of bio-ethanol blended with jet-A fuel, were subjected to testing using the JET CAT P80 micro-turbo-engine. Throughout the testing process, various parameters were meticulously monitored, including engine speed, thrust generated, temperature preceding the turbine, fuel volumetric flow rate, and vibration levels assessed in both axial and radial directions. The micro-turbo-engine was sustained at three distinct operational states: idle, cruise, and maximum speed, each lasting approximately 1 min. Furthermore, a comparative evaluation was conducted between fuels, scrutinizing the micro-turbo-engine’s performance from the idle to maximum positions. Upon completion of the tests, a comprehensive jet engine cycle analysis was carried out at the maximum operational state. This analysis involved the calculation of fuel-specific consumption, combustion chamber efficiency, and thermal efficiency of the engine for each fuel blend. It is pertinent to note that these assessments were executed without any alterations made to the engine components or the automation system [23]. In the field of power engineering, investigations into the impact of biofuels and alcohol-derived blends on gas turbines have been conducted. Elevated ethanol concentrations resulted in heightened carbon monoxide (CO) emissions. Conversely, nitrogen oxides (NOx) witnessed a substantial decrease of up to 70% in the presence of biofuels, and there was a concurrent reduction in particulate matter (PM10) [24]. An analysis of the possibility of using recycled pork fat-based biodiesel as a fuel for aviation turbo-engines is presented in [25]. The analysis consists of the assessment of four blends of Jet-A kerosene with 10%, 30%, 50%, and 100% biodiesel.
The comprehensive process of developing the experimental stand encompasses not only the mechanical structures supporting and housing the micro gas turbine but also the constructive solution for the data acquisition system, as detailed in [26]. Furthermore, the same work elucidated the design of an intake socket and the subsequent implementation and calibration processes essential for conducting tests in compliance with prevailing standards. Additionally, a dedicated study [27] investigated the injection of pressurized water into the engine intake, evaluating its impact on performance relative to operation without water injection across various regimes.
In essence, designing a test stand for prototypes of microjet engines demands a high level of proficiency in mechanical engineering, electrical engineering, and computer programming. It constitutes a complex endeavor necessitating meticulous planning and execution to ensure accurate simulation of engine operating conditions and the provision of precise data concerning performance and reliability.
The novelty of this research lies in the development and implementation of a highly versatile test stand specifically designed for evaluating the functionality and performance of a 400 N prototype microjet engine. Unlike existing studies, which often lack detailed documentation on the comprehensive testing of microjet engines, our setup integrates a robust data acquisition and control system capable of real-time monitoring and recording of 45 critical parameters, including temperatures, pressures, speed, fuel flow, thrust, and vibrations. The unique hybrid operation mode of the test stand, which allows for seamless transitions between manual and automated controls, offers unparalleled flexibility in testing. This innovative approach not only facilitates a more thorough understanding of the microjet engine’s performance across various operational regimes but also ensures precise and reliable data collection, significantly contributing to the field of microjet propulsion systems. To our knowledge, no previous studies have reported such a comprehensive and adaptable testing platform, underscoring the originality and significance of our work.
This paper presents the design of a test cell capable of accommodating diverse experimental campaigns for prototypes of micro gas turbines.

2. Instrumentation

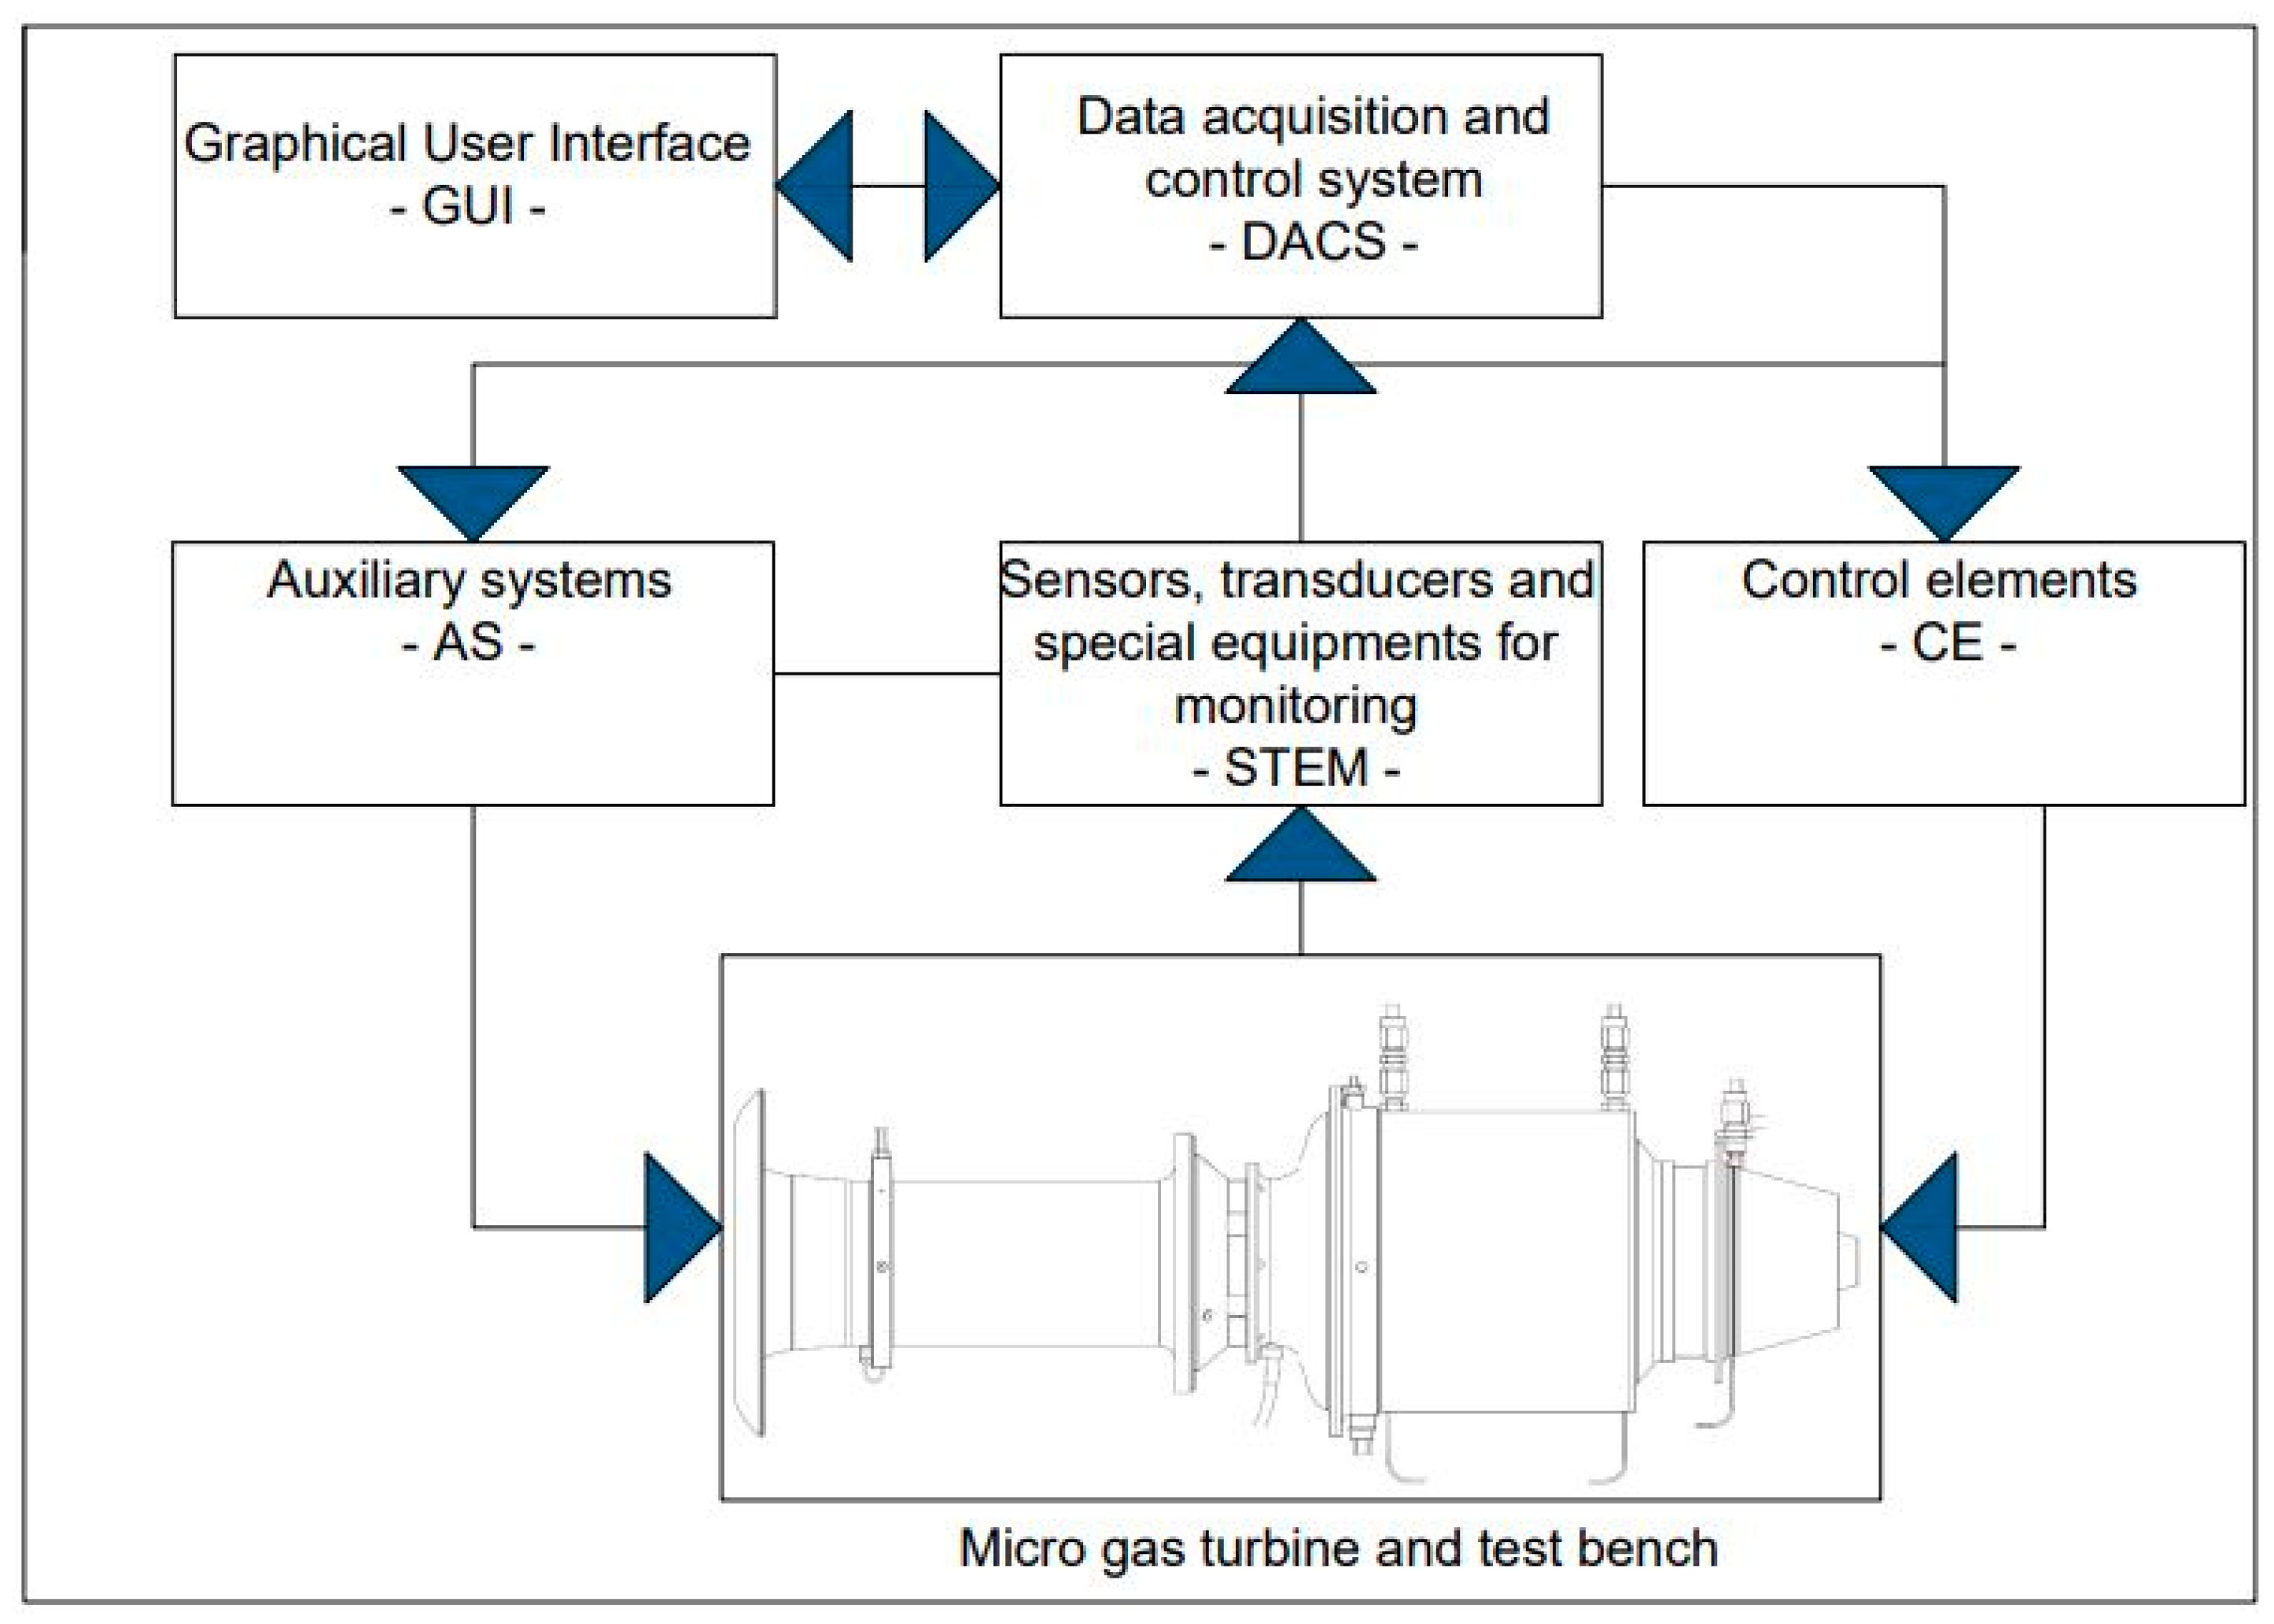
The overarching schematic was developed at the National Research and Development Institute for Gas Turbines (COMOTI), comprising a tailored test cell design for prototypes. The constituents of the test cell encompass a data acquisition and control system (DACS), auxiliary systems (AS), a suite of sensors, transducers, specialized equipment for monitoring (STEM), control elements (CE), and the test rig (metal structure). Figure 1 illustrates the intercommunication among these systems.
The instrumentation encompasses all elements ranging from sensors to the data acquisition and control system or module, delineated into three categories: the test cell instrumentation, the fuel system instrumentation, and the engine instrumentation.

2.1. Test Cell Instrumentation

In the test cell, a minimum of two parameters must be monitored to ascertain corrected values. Adjacent to the engine, temperature and pressure sensors are essential for determining ambient conditions. Considering technical specifications and compatibility with the DACS, a PT100 RTD (Resistance Temperature Detector) [28] was selected for temperature measurement, while a Druck Unik 5000 transducer [29] was chosen for pressure sensing.
Additionally, to oversee engine functionality and enable visualization of the combustion flame, a video monitoring system was essential. This system comprises three cameras positioned at different angles and operates continuously during the experimental campaign to capture unforeseen events, such as foreign objects entering the intake manifold, sensor malfunctions, or variations in the color of the combustion flame, given that butane gas exhibits a distinct hue from kerosene. The system also includes a storage setup with a DVR (Digital Video Recorder) for recording and archiving the footage, ensuring that all critical events are properly documented. The cameras feature a resolution of 2560 × 1920, recording at 15 frames per second (FPS) with a 2.8 mm fixed lens. They are also equipped with 3D digital noise reduction for enhanced audio recording quality.
Given the significant impact that ambient conditions can have on the engine’s performance, a pressure sensor (P0) and a temperature sensor (T0) were strategically installed near the engine’s intake, as shown in Figure 2. These sensors were positioned to accurately capture the ambient pressure and temperature, which are critical for assessing the engine’s overall functionality. By monitoring these parameters, we can better understand how variations in the surrounding environment influence the engine’s operation, such as air density and the efficiency of combustion, thus ensuring more precise control and optimization of the engine’s performance under different atmospheric conditions.

2.2. The Auxiliary System Instrumentation

The auxiliary system furnishes the requisite conditions for the starting, stopping, and working regimes of the engine. During the initial phase of the starting regime, or cold start, two lines of compressed air are indispensable to initiate the rotation of the compressor rotor. Subsequently, in the second phase of the starting regime, the gas system is engaged, introducing butane gas into the combustion chamber via a dedicated line to warm the injectors. Finally, in the concluding phase of the starting regime, the fuel system delivers kerosene into the combustion chamber, transitioning the engine into the idle regime. Figure 3 illustrates all the auxiliary systems connected to the test bench.
The fuel system comprises several components, including a fuel tank situated in a separate room, two fuel valves [30], a fuel pump [31], a filter, three fuel lines [32], a pressure transducer [29], and an RTD [28]. The kerosene circuit, serving both lubrication and combustion purposes, initiates from the fuel tank and proceeds through a pipeline to the first valve (stop valve).
The gas system facilitates the initial phase of the starting regime and consists of a gas tank, a conventional pressure regulator for butane gas, two fuel valves [30], a pressure transducer [29] near the engine, and an RTD [19] for monitoring conditions.
The air system is comprised of a compressor unit [33], an air tank with a design optimized for containing up to 15 bars of compressed air, a pressure regulator [34], a pressure transducer [29], and two solenoid valves [30]. These valves are connected to the compressor via hoses to generate momentum for the rotor.

2.3. The Engine Instrumentation

The key parameters are presented in Table 1, detailing both the parameter as it appears in the graphical user interface of the testing program and the corresponding name that describes its location. Additionally, a domain and unit were included to define the upper and lower limits of these parameters, in alignment with the engine specifications. Where feasible, the error was calculated based on the entire instrumentation chain. The maximum frequency response is determined by the sensor or the acquisition module, and it is adjusted accordingly in the test program. In addition to the core parameters, several other measurements were recorded to provide comprehensive data for the testing campaign. These included the intake bellmouth differential pressure (dPv), static pressure (P1st), and total temperature (T1t). For the compressor, the outlet total pressure (P2t), static pressure (P2st), and total temperature (T2t) were captured. At the turbine inlet, both total pressure (P3t), static pressure (P3st), and total temperature from three sections (T3.1t, T3.2t, T3.3t) were measured. Similarly, at the turbine outlet, total pressure (P4t), static pressure (P4st), and total temperature from three sections (T4.1t, T4.2t, T4.3t) were recorded. Additionally, the fuel temperature (Tcb), gas pressure (Pgas), and manual fuel pump control voltage (RuPC) were also monitored to ensure precise control and analysis of the system. There were nine digital outputs responsible for controlling the auxiliary systems and ensuring precise management of the engine’s operation.
The parameters were metrologically calibrated to achieve optimal accuracy during the testing phase. The corrected airflow is calculated by measuring the differential pressure at the engine’s air intake and applying it to a second-degree equation derived from specialized coefficients based on engine air intake geometry and simulations. This calculation is then further refined by adjusting for environmental parameters, specifically ambient temperature (T0) and pressure (P0), to ensure greater accuracy. By accounting for these external factors, the corrected airflow measurement provides a more accurate representation of the engine’s operational conditions, enabling precise performance evaluations and more reliable operational adjustments.

3. DACS and Working Regimes Procedures

The data acquisition and control unit comprise two essential elements. The first element pertains to the hardware, serving as the intermediary between sensors and the standardized signals transmitted to the modules from the PLC (Programmable Logic Controller). The second element concerns the software aspect, which is subdivided into parameters (analog, digital, input, and output) and an automated algorithm based on predefined procedures to delineate the engine’s operational regimes. Furthermore, within the software component, a set of limitations has been implemented to safeguard against potential engine damage.

3.1. Data Acquisition and Control System

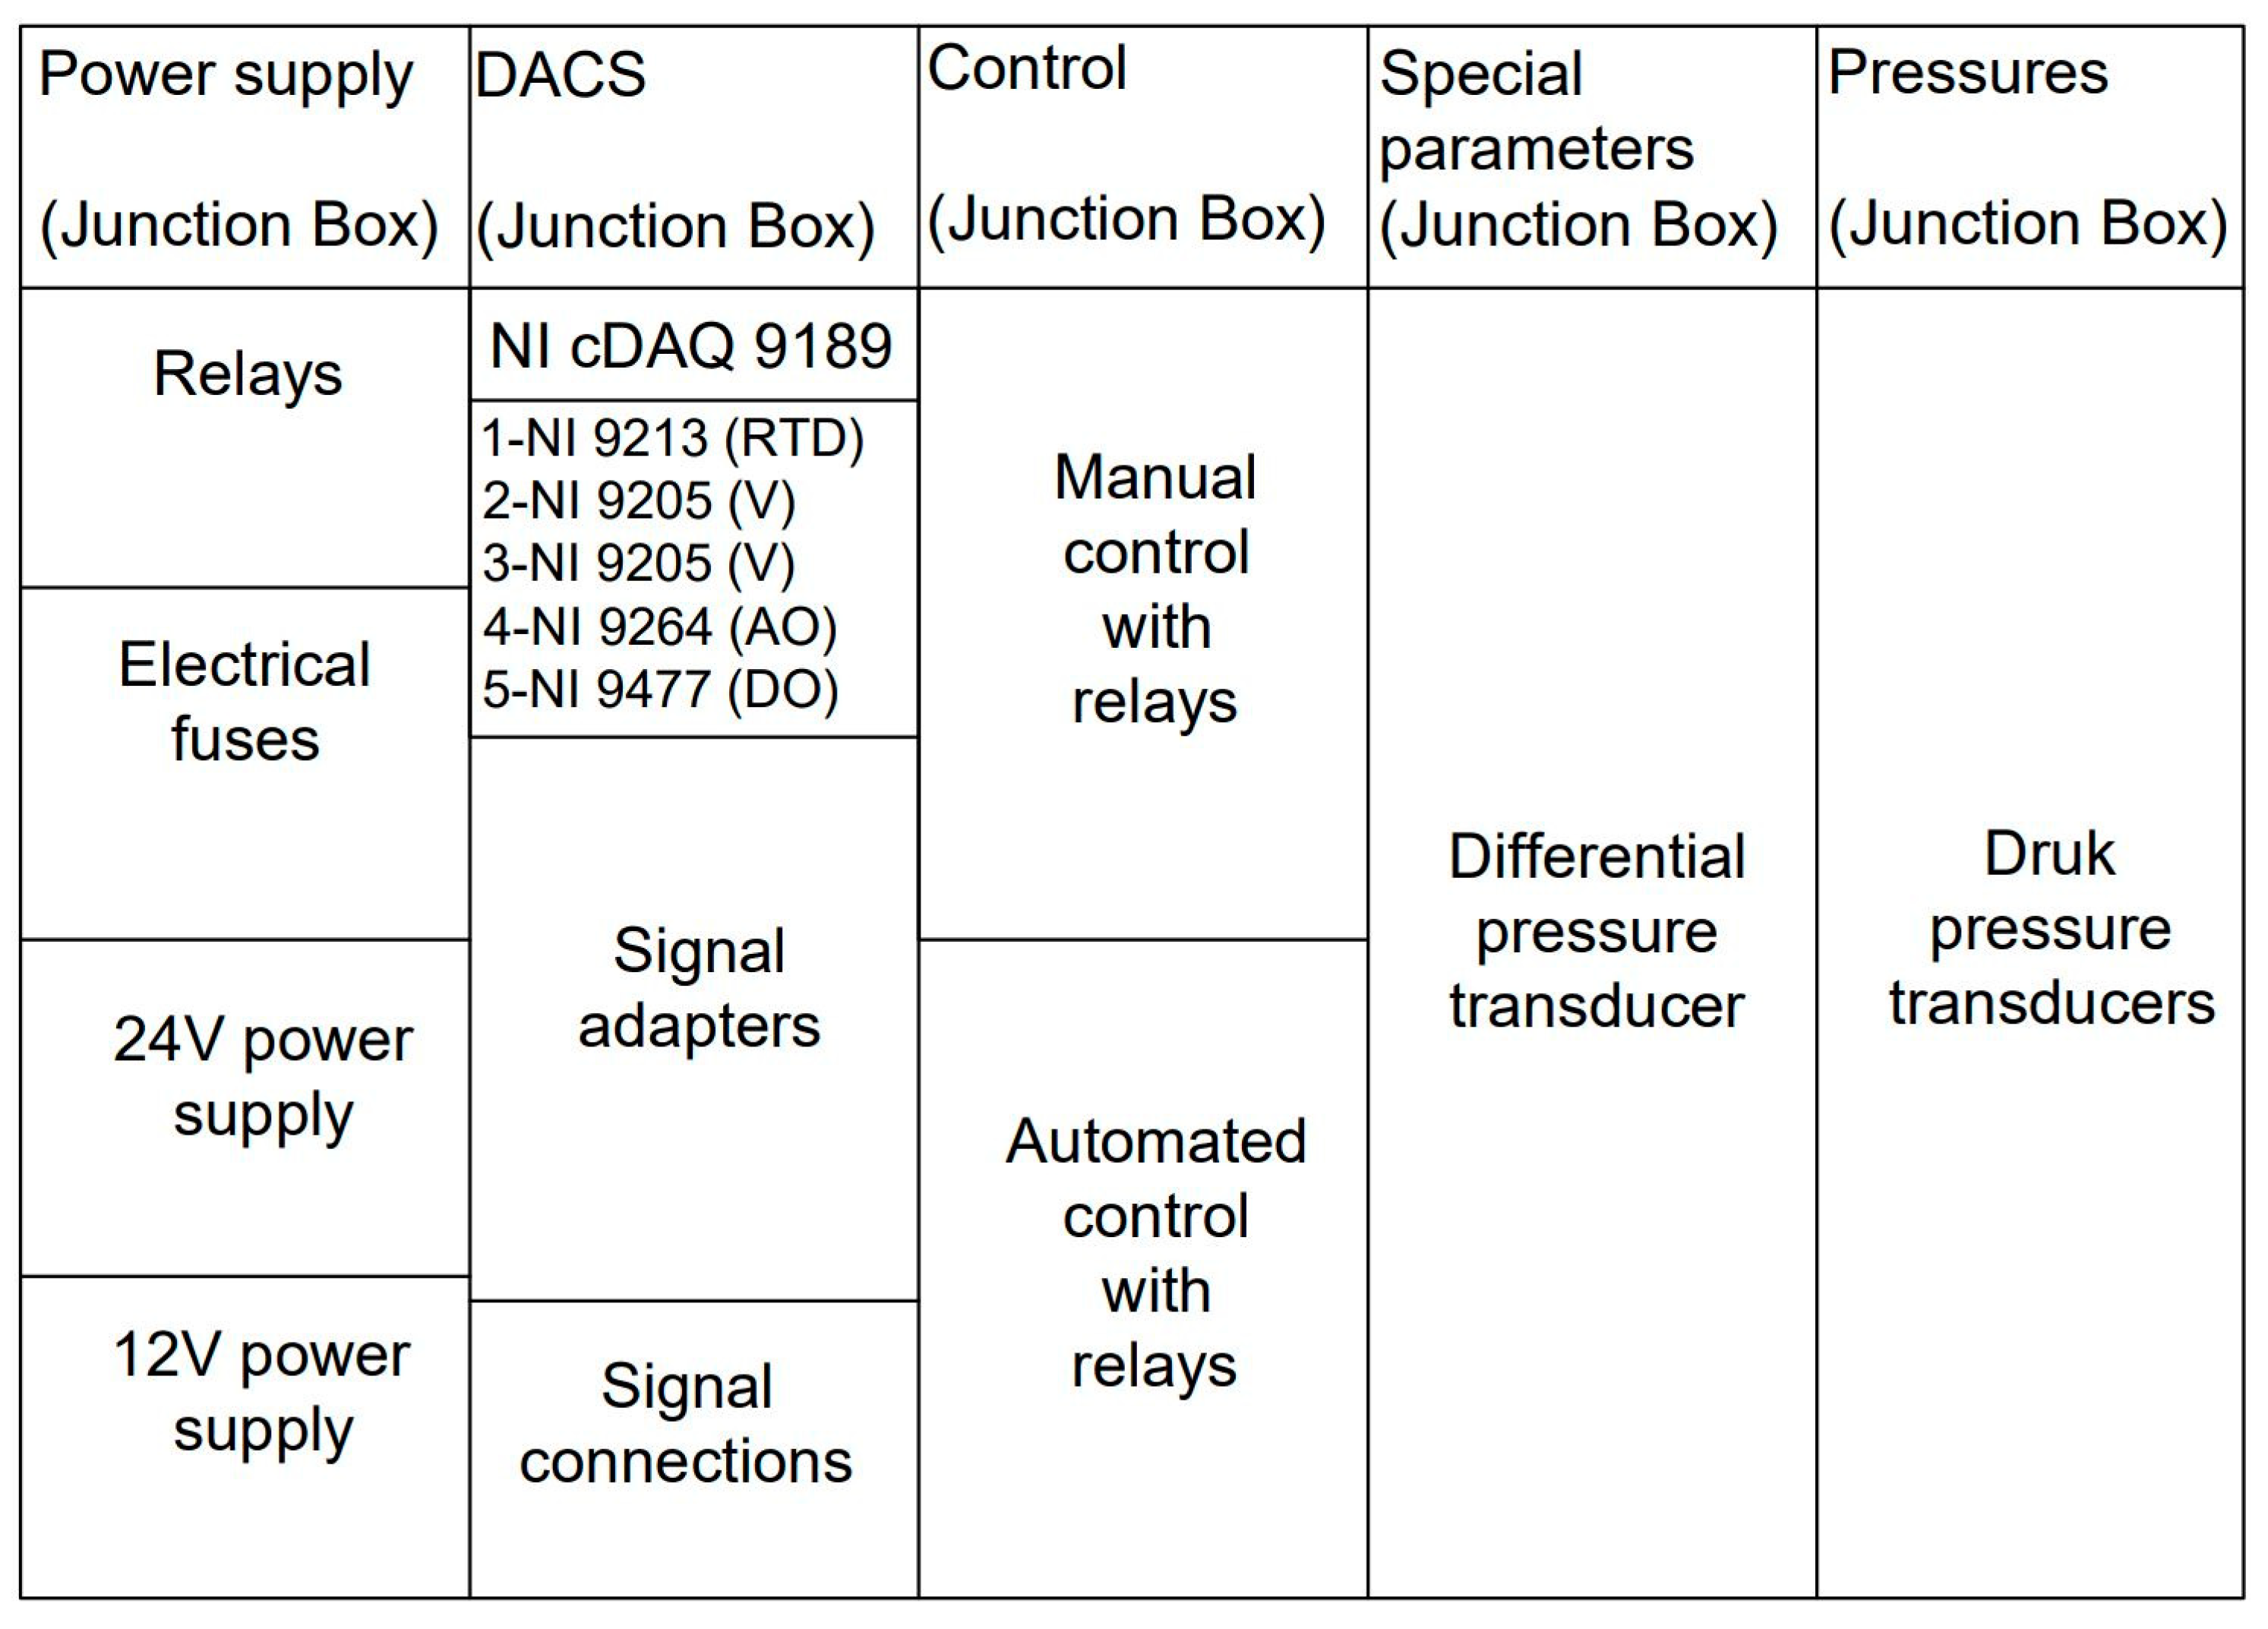
The DACS is a sophisticated system engineered to monitor and regulate the engine prototype via the auxiliary systems. To analyze and issue commands to these auxiliary systems, a test program was developed using National Instruments LabVIEW (version 2021). The DACS logic hinges on the number of parameters and control elements pertinent to the engine. Structurally, it comprises a power supply junction box (PS-JB), a main PLC junction box (PLC-JB), a control junction box (C-JB), and a pressure transducer junction box (PT-JB), as depicted in Figure 4.
The supply box interfaces with all equipment utilized for input parameters, the PLC, control elements, and certain transducers. On the other hand, the DACS box incorporates the main PLC (NI cDAQ 9189) along with six modules for input/output channels, signal adapters, and signal amplifiers. The DACS employs the main chassis, cDAQ 9189 (Compact Data Acquisition), which harnesses power data from the desktop unit to analyze and relay information to and from the system. The modules encompass one for thermocouples (NI 9213), two for voltage (NI 9205), one for analog output (NI 9264), and one for digital commands (NI 9232). Figure 4 illustrates the schematics of communication and connection concerning the DACS.
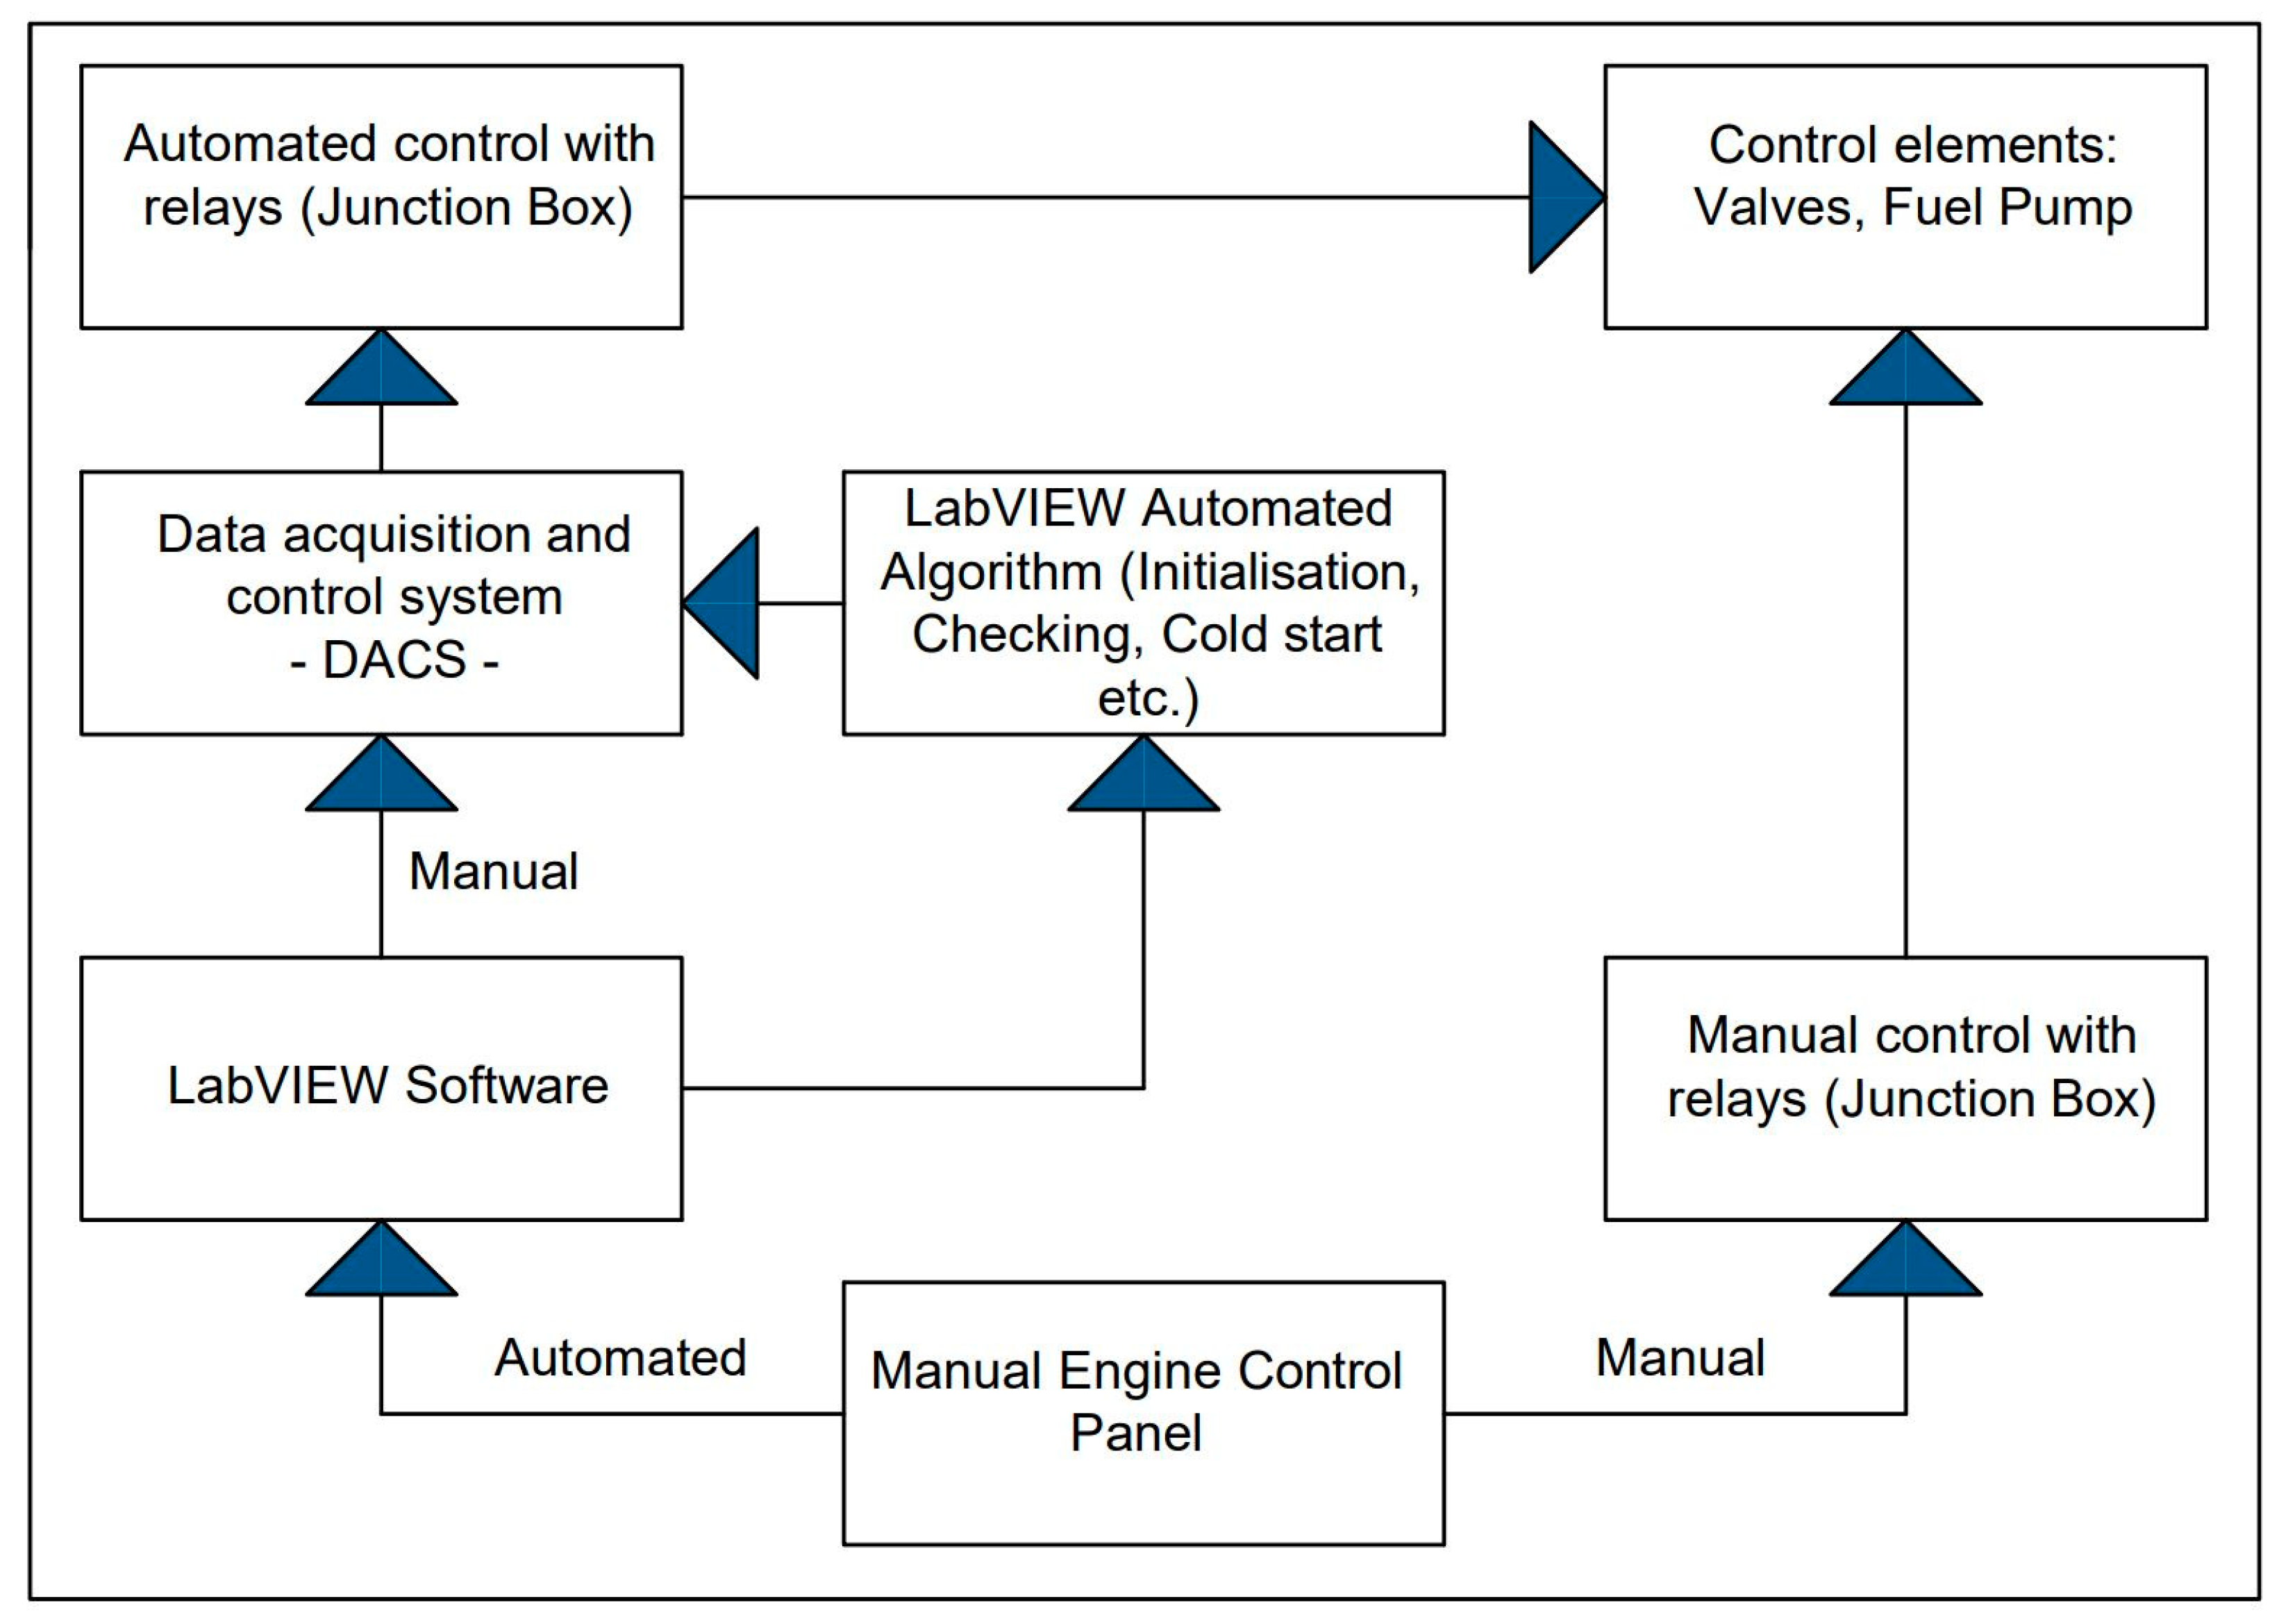
The control system is implemented in dual mode, encompassing manual and automated control functionalities. In manual control mode, all requisite elements for digital outputs and analog outputs are integrated. Here, engine control is facilitated via a command desk, with operational regimes defined using a potentiometer system. Conversely, automated control is facilitated through the digital command module from NI, with the fuel pump regulated via the analog output module from NI. These components are seamlessly integrated with LabVIEW to execute automated control procedures. The schematics for the control system are presented in Figure 5.

3.2. The Test Program Using LabVIEW

The test program serves as the software interface facilitating communication between the DACS, sensors, and auxiliary installations to conduct experimental tests on the engine. Developed using LabVIEW DAQmx logic, it incorporates an automated algorithm capable of issuing commands to the auxiliary installations. The logic for acquiring parameters follows a structured approach: channel definition, raw data acquisition, scaling of each channel based on sensor specifications, and subsequent storage in the test file.
For the automated algorithm, ten digital outputs are utilized to command the air, fuel, and gas installations based on speed and time parameters. Additionally, a single analog output is linked to the fuel pump to regulate the voltage, thereby controlling fuel pressure and flow. The graphical user interface, presented in Figure 6, serves as the front panel utilized by the testing engineer to conduct verifications and execute experimental tests.
The graphical user interface (GUI) is intricately linked to the acquired parameters in real-time, enabling seamless monitoring and control of the engine’s performance. Various push buttons are incorporated into the interface to execute different segments of the automated algorithm, facilitating efficient operation. Notably, the GUI features a dual control mechanism for the fuel pump: automated control implemented through LabVIEW and manual control via a potentiometer. This dual-control setup provides flexibility and versatility in managing the engine’s fuel system, catering to different testing scenarios and user preferences.

3.3. Scaling and Verifications of the Parameters

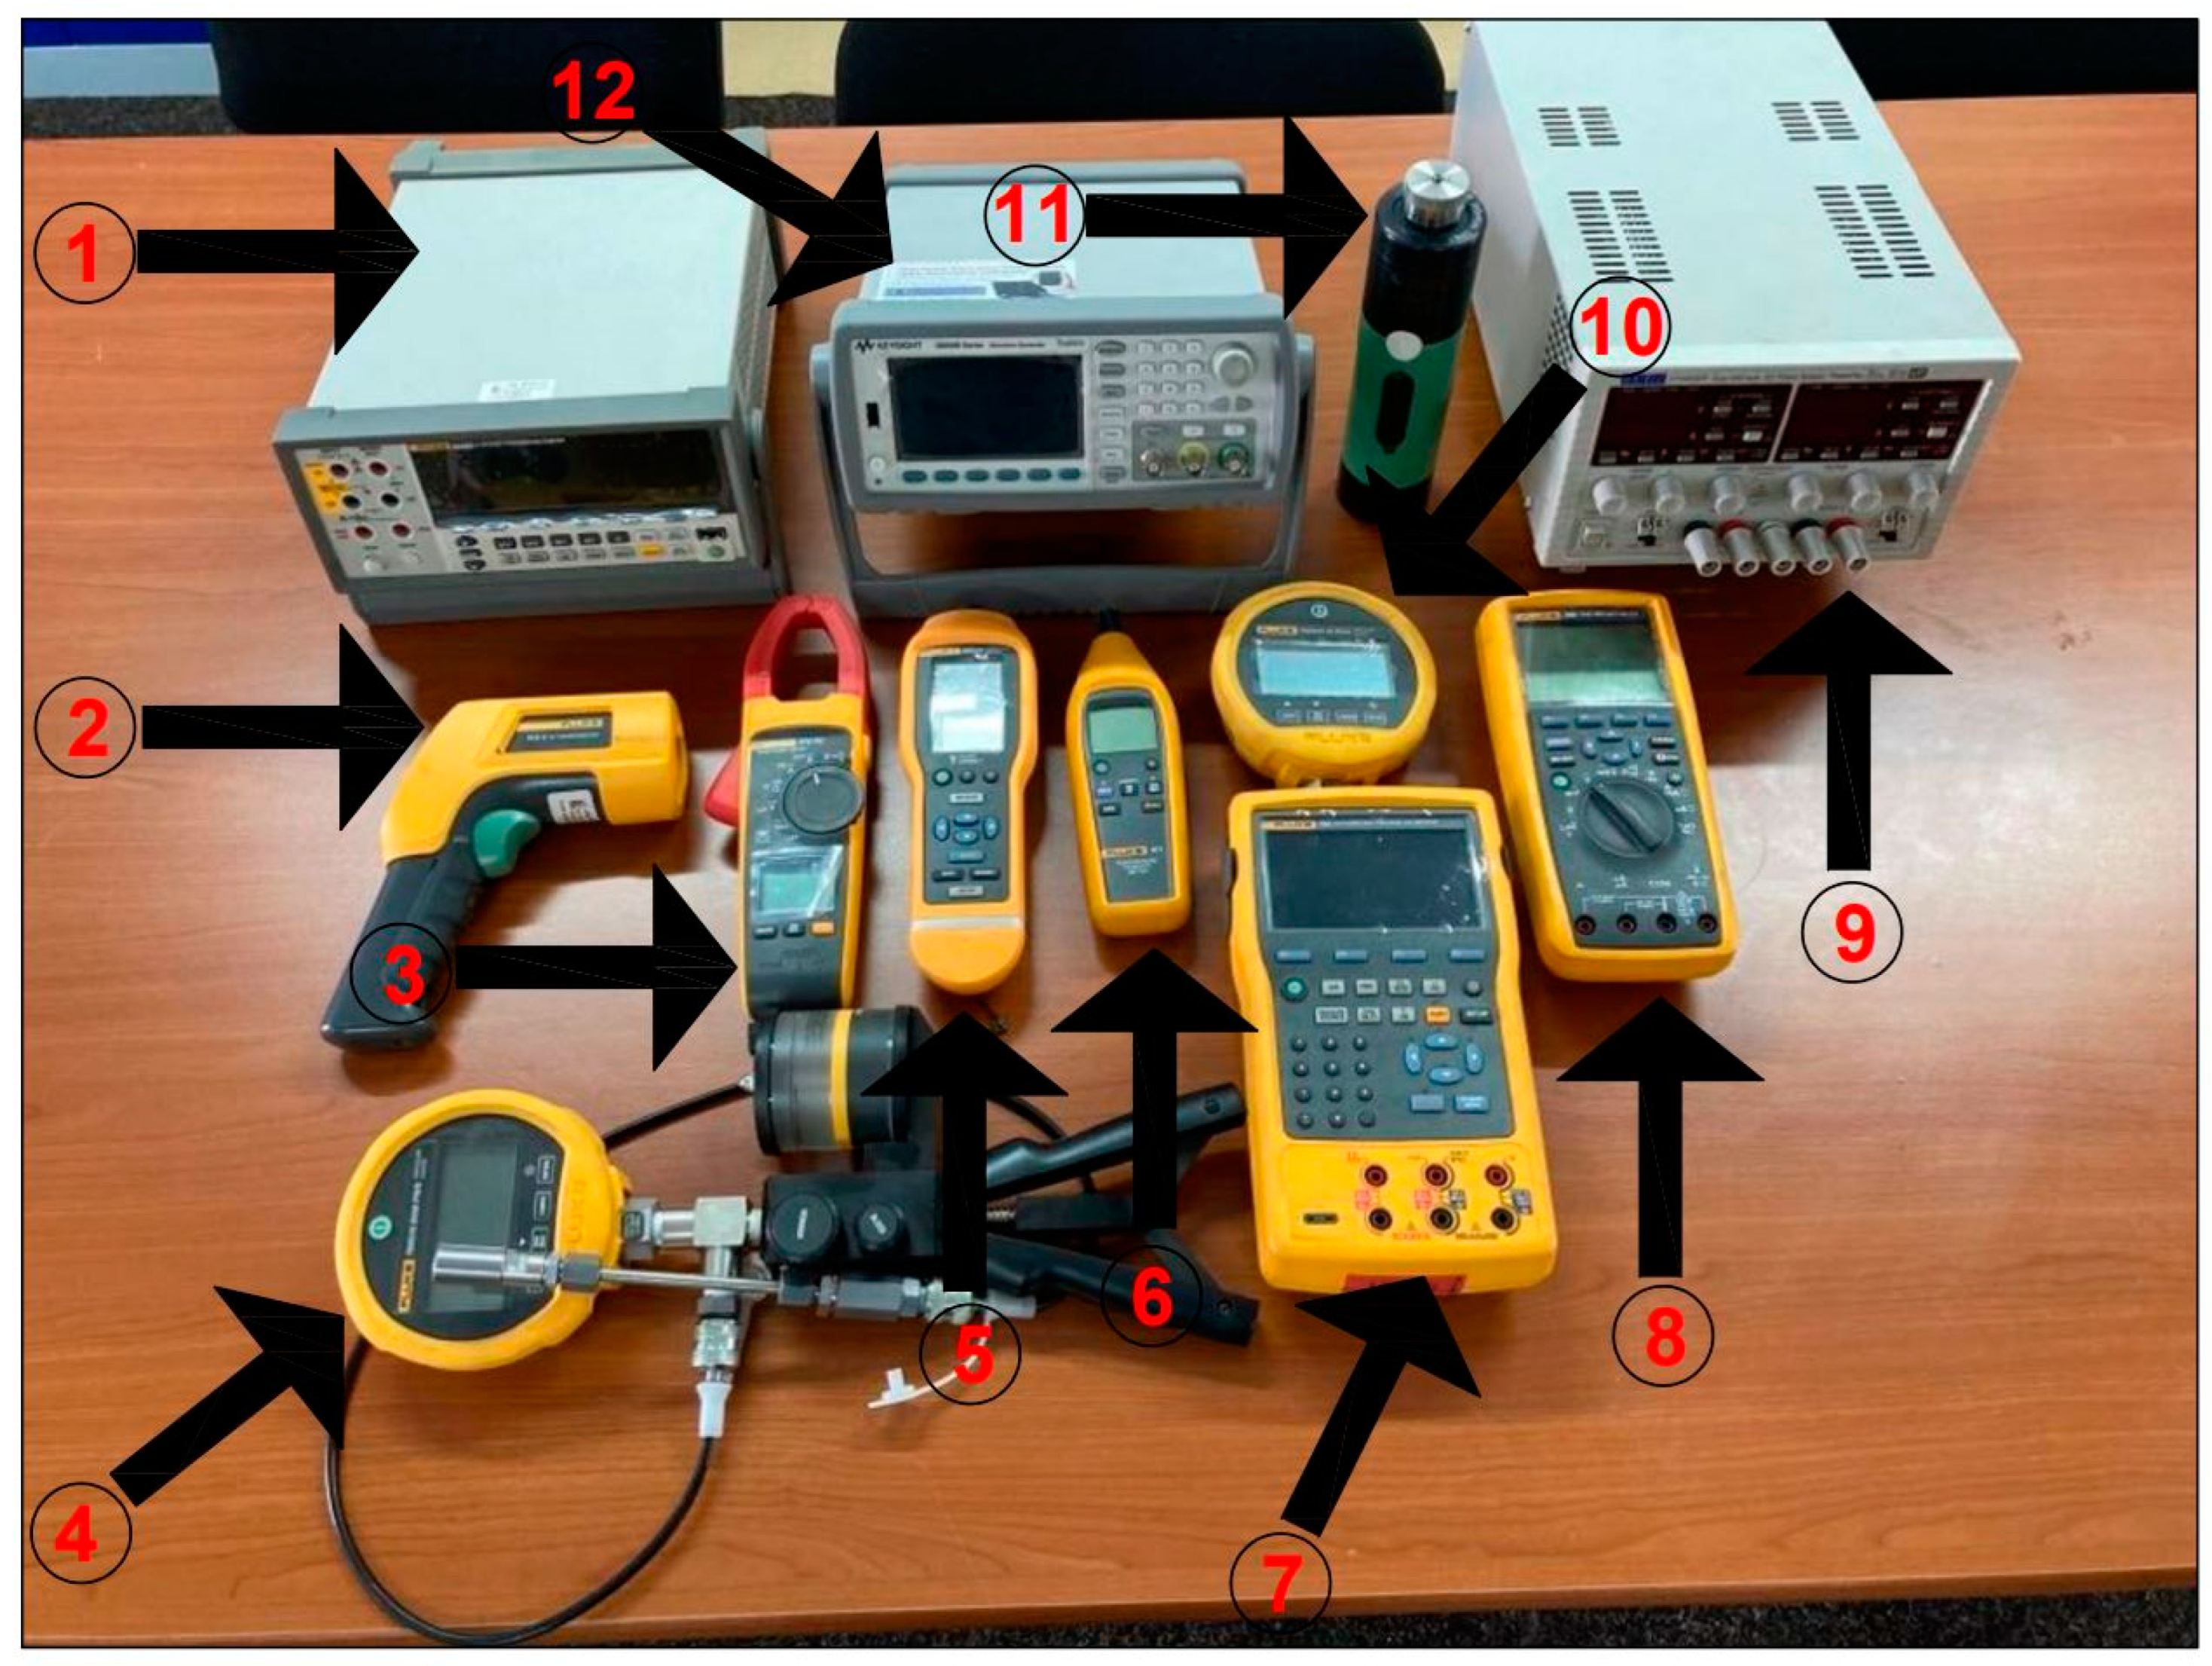
To initiate the experimentation process, thorough verification of each parameter was imperative, necessitating the utilization of specific equipment. Pre-tests employing Fluke equipment [35] were conducted to ensure accurate scaling. For pressure parameters, a pressure pump containing air was employed to establish precise scaling. The equipment roster, shown in Figure 7, includes:
  • A precision multimeter (Number 1) was utilized for voltage or current measurement, which is crucial for creating linear scaling for pressures.
  • An infrared thermometer (Number 2) was employed to measure temperature from a distance, ensuring thermocouple readings are accurate.
  • A current meter (Number 3) was used to measure current in cables, verifying electrical safety limits are not exceeded in the data acquisition system.
  • A pressure pump (Number 4) was employed to simulate timing and accuracy for pressure lines.
  • An ambient temperature and humidity reader (Number 5) was utilized to compare with test cell conditions obtained from the data acquisition system.
  • A vibration meter (Number 6) was utilized to measure vibration in contact with the engine’s surface during cold starts, facilitating comparison with acquired vibration data.
  • A calibrator (Number 7) was used to generate precise signals, simulating the entire electrical line.
  • A multimeter (Number 8) was employed to measure voltages and currents on control and command lines.
  • A power supply (Number 9) was utilized to verify each piece of equipment before installation on the test bench.
  • A pressure gauge (Number 10) was employed to measure fuel pressure for verification purposes.
  • A vibration calibrator (Number 11) was used before and after every test.
  • A signal generator (Number 12) was utilized to generate sinusoidal signals, simulating and verifying the fuel pump line.
Before initiating each test, a meticulous calibration procedure for the vibration line was executed, ensuring its accuracy and reliability during engine operation. Additionally, comprehensive verifications for each parameter were undertaken to guarantee their functionality and accuracy throughout the engine’s operational phase. This proactive approach to calibration and verification procedures aimed to enhance the integrity and consistency of the experimental results obtained during engine testing. These processes were conducted following the COMOTI Institute’s calibration procedures, overseen by the Metrological Department, and properly stored [36].

4. Results and Discussion

To showcase the functionality of both the prototype engine and the test bench, a post-processing campaign was undertaken. Several critical parameters were carefully selected and presented to illustrate the performance across different operational phases, including the starting regime, idle regime, working regime, and stopping regime. These parameters were compared across three distinct experiments to provide a comprehensive analysis.
Additionally, the flame front for both the starting and working regimes was visualized and depicted in Figure 8. This visual representation serves to elucidate the combustion process and highlights any variations or trends observed during different operational phases.
The flame front observed during the starting regime appears more pronounced, attributed to the properties of butane gas and the slower speed of the shaft, contrasting with the working regime where combustion primarily involves kerosene.
To effectively present the acquired data, three experiments were meticulously conducted under relatively similar conditions. This approach ensures consistency and facilitates meaningful comparisons across different operational scenarios, enabling a comprehensive analysis of engine performance and behavior. These specific test modes were chosen to simulate different phases of the engine’s operation, including startup, steady-state operation, and transient conditions, which are critical to assessing the engine’s overall stability, efficiency, and response under varying loads and inputs. By selecting these modes, the tests were designed to mimic realistic operational conditions that the prototype engine might encounter in practical applications, ensuring that the results are both applicable and valuable for further development.

4.1. Starting Regime

The starting regime consists of three-level algorithms. The first one is connected to the air start, where compressed air at a specific pressure enters the compressor, initiating rotation of the axial compressor rotor. This phase is reflected in parameters such as speed, thrust, and airflow, which demonstrate the initial activation of the engine’s components.
The second algorithm is linked to gas combustion, where gas enters the burning chamber at a specific pressure to heat the chamber. During this phase, parameters such as average turbine inlet temperature, fuel pressure, and control tension for the fuel pump may exhibit notable variations as the combustion process commences.
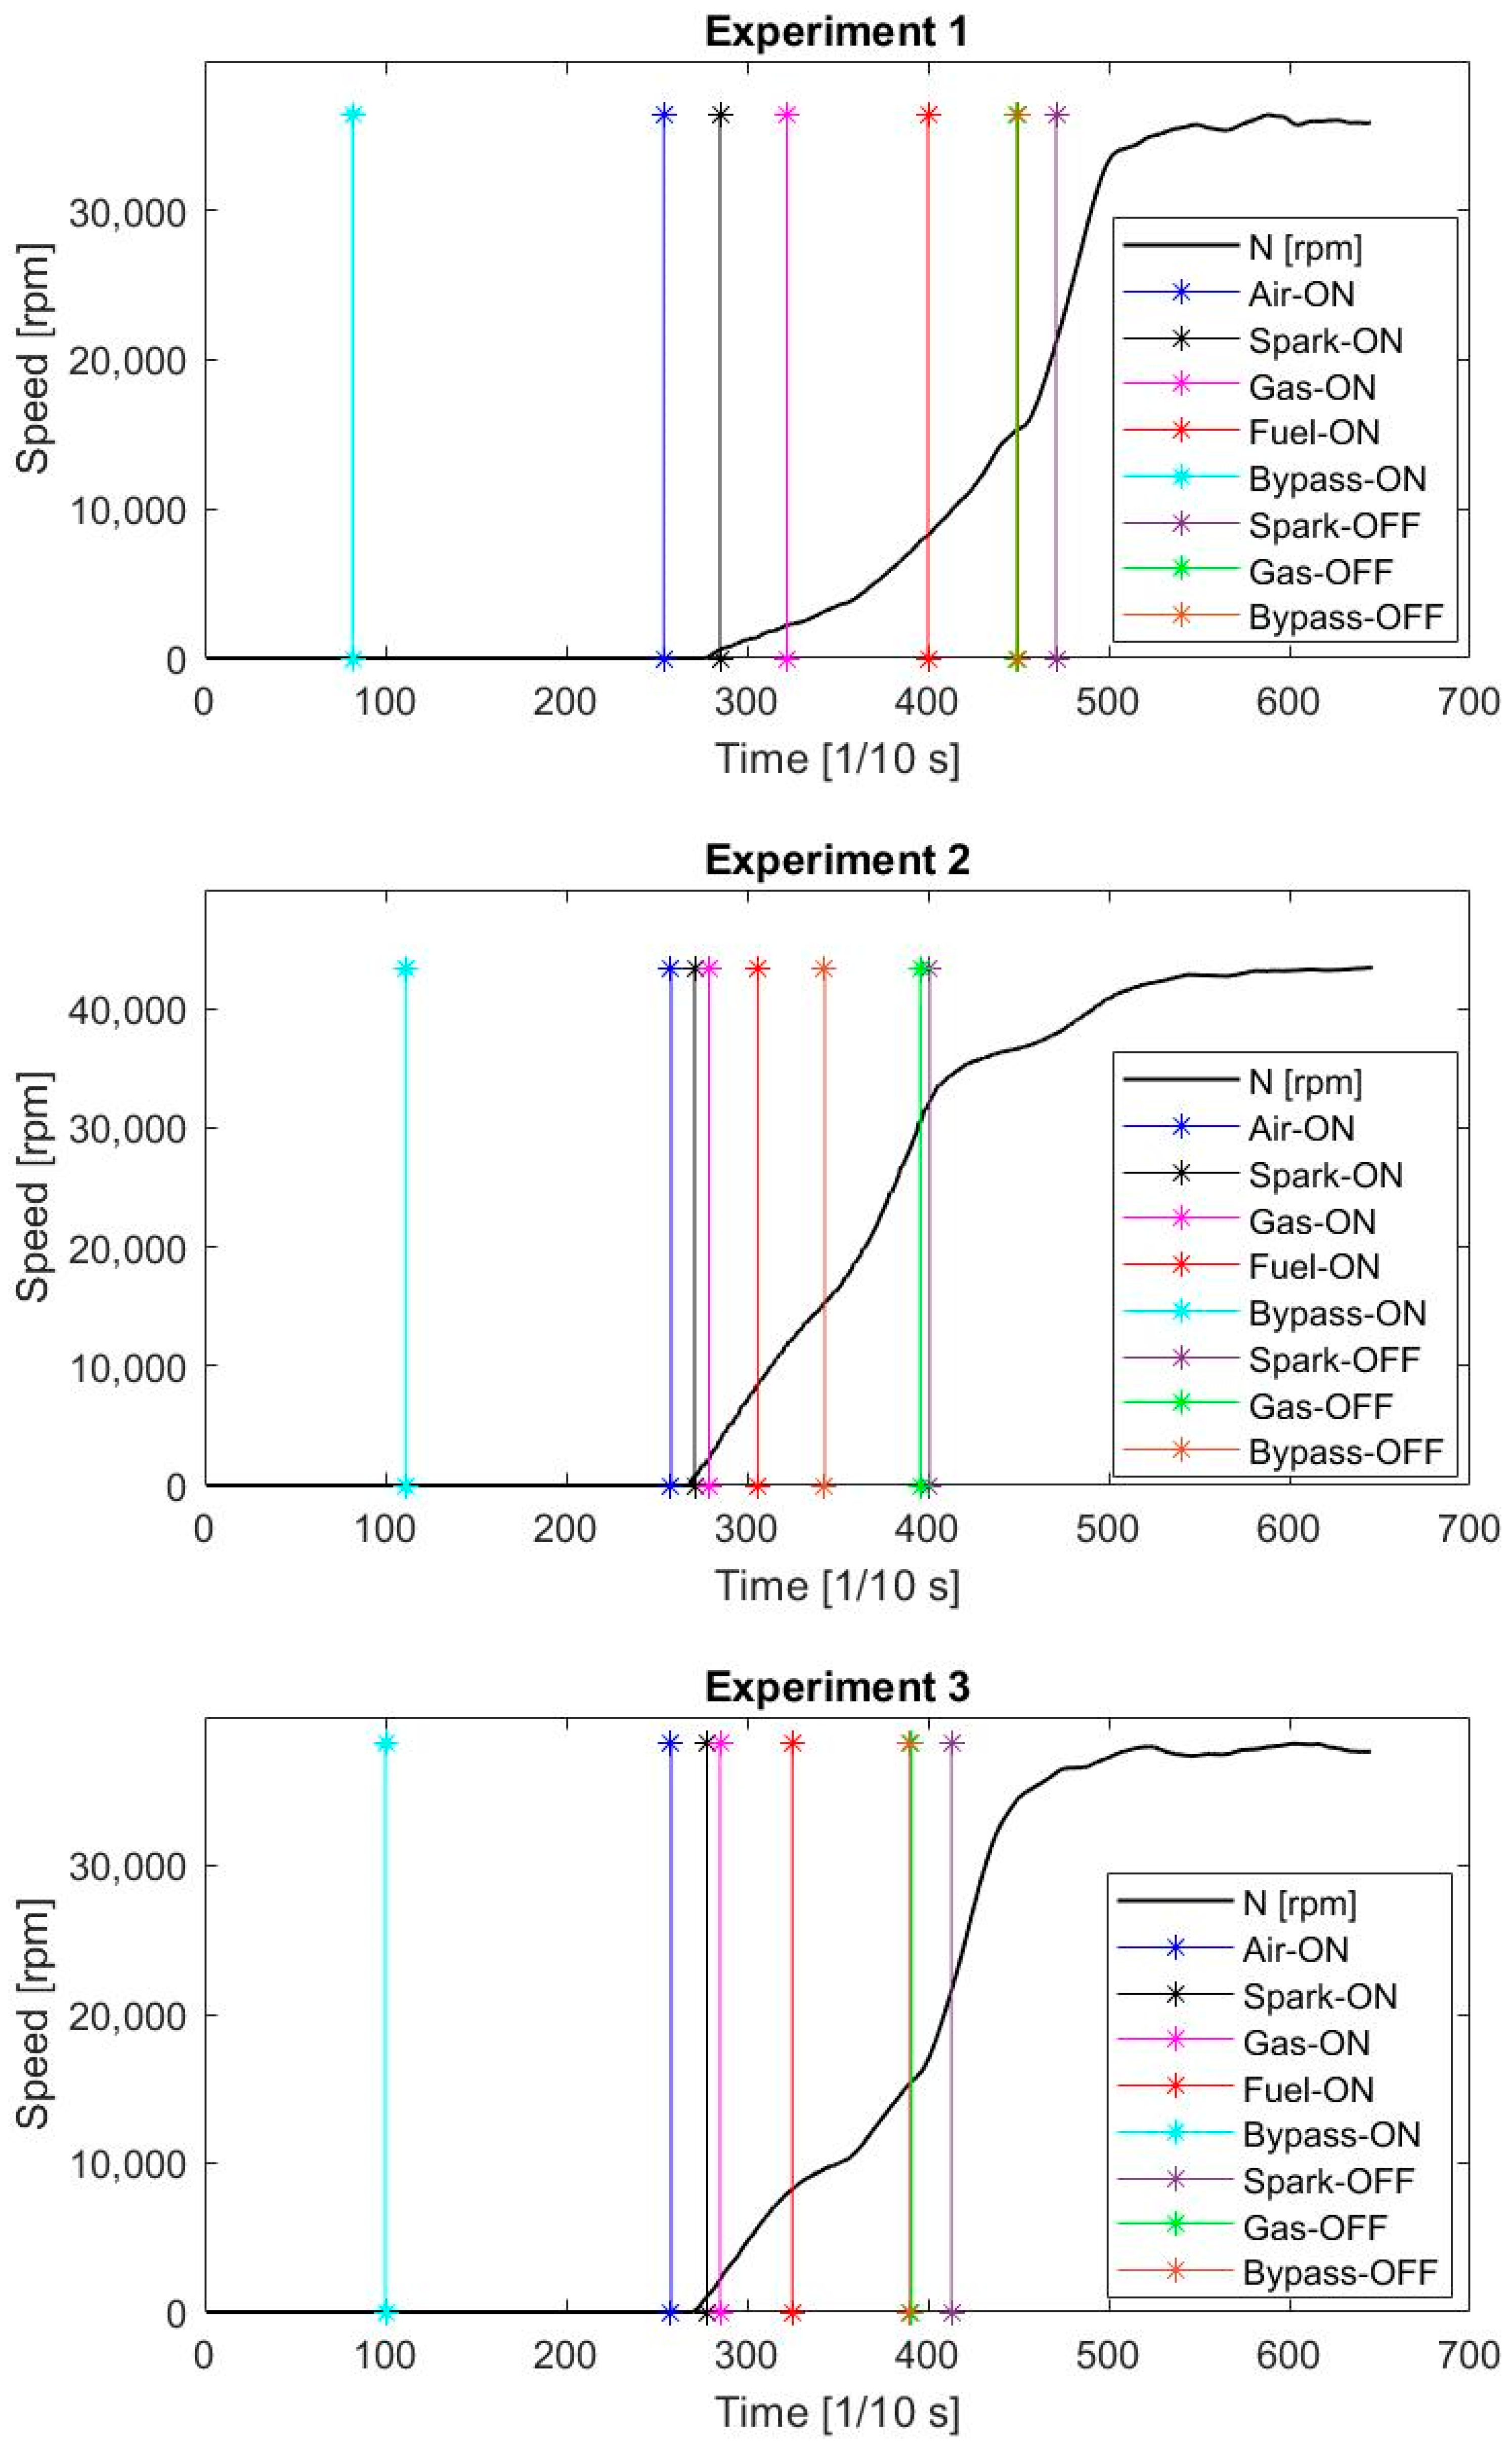
The third algorithm involves the introduction of kerosene into the burning chamber simultaneously with the gas. After a brief duration, the gas supply is halted, allowing the engine to function solely on kerosene. This transition is reflected in parameters such as total fuel flow, engine fuel flow, and lubrication fuel flow as the engine shifts from dual-fuel operation to kerosene-only operation. These algorithms are displayed in Figure 9, providing a visual representation of the engine’s startup sequence.
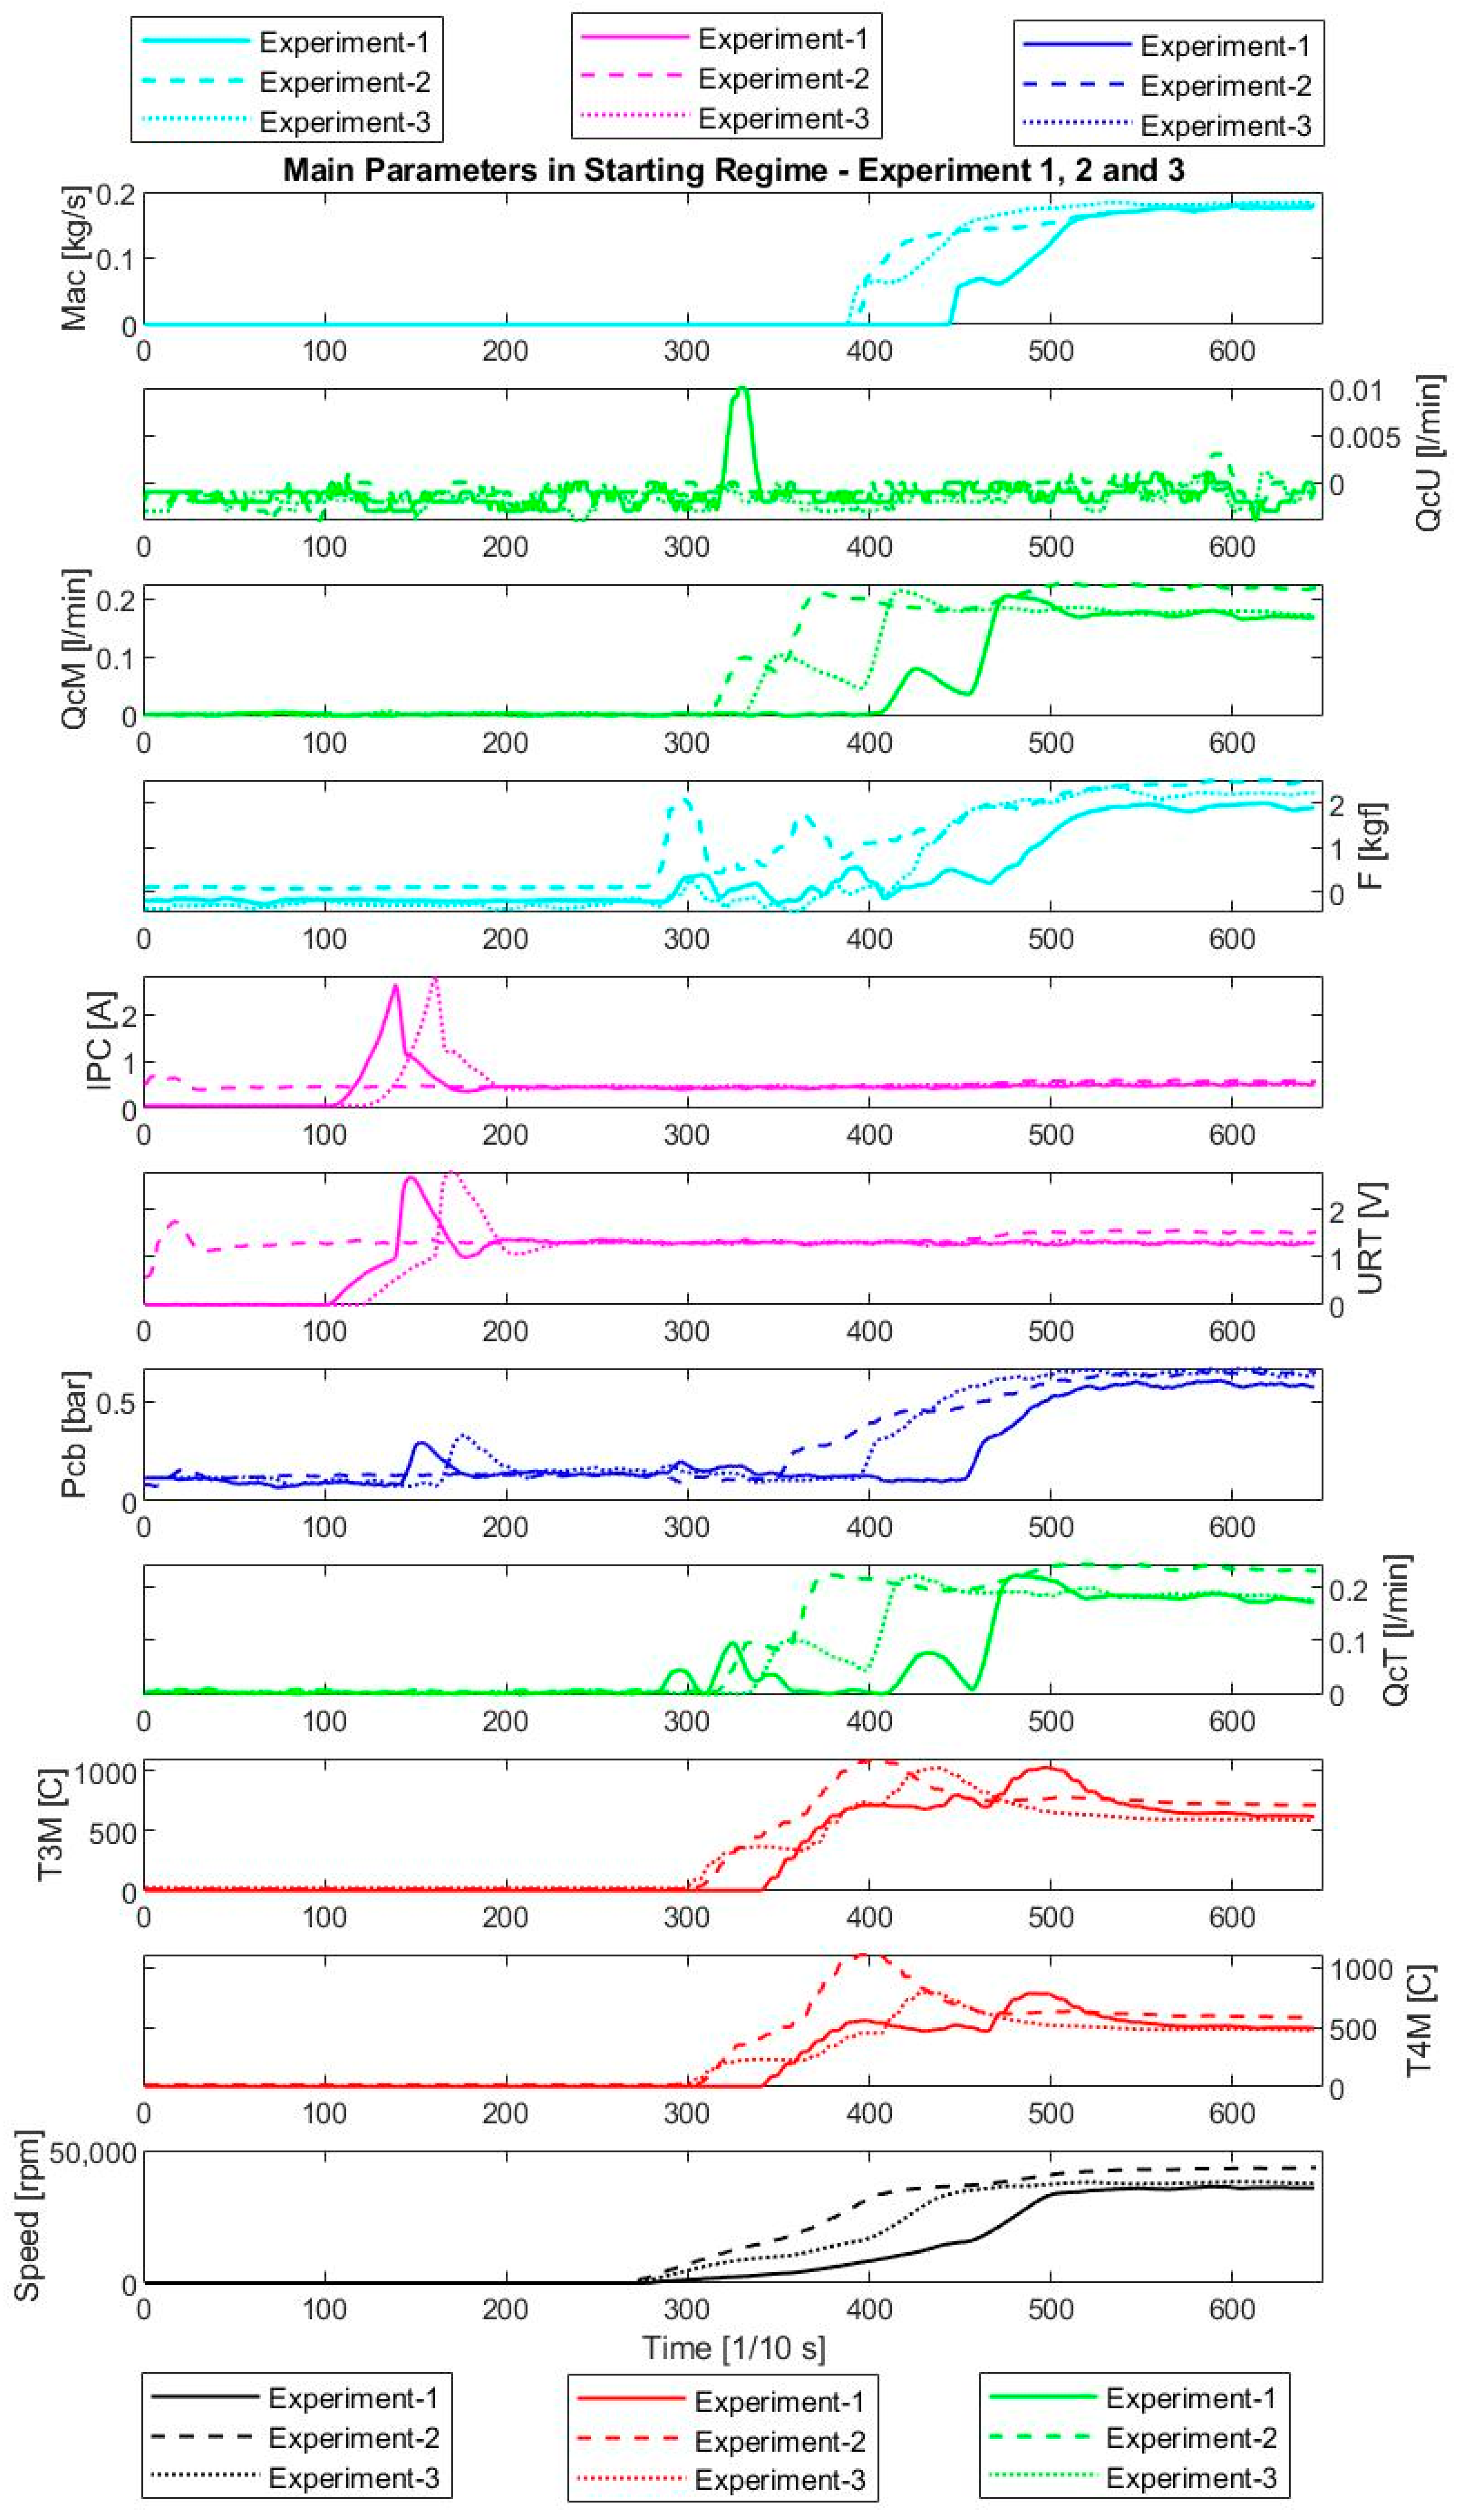
The starting regime was slightly modified to obtain different states of functionality. By analyzing parameters across these modified states, we can gain insights into the engine’s responsiveness, stability, and performance under varying conditions. The parameters presented in the following figure are recorded in the graphical interface of the LabVIEW program and represent important parameters of the engine and auxiliary installations.
In Figure 10, the starting phase for each experiment is divided into three parts: the first part involves preparing the conditions for the engine to start, lasting from 0 to 30 s approximately. The second part involves accelerating from 0 RPM to approximately 40,000 RPM over about 22 s. Finally, the third part stabilizes the engine at idle speed for 23 s. The airflow (Mac) starts with a minimal change and shows a significant increase around 40,000 RPM at around 0.2 kg/s as the engine approaches the idle regime.
The lubrification fuel flow (QcU) remains relatively stable throughout the entire period, with a notable spike around the start of the engine. The engine fuel flow (QcM) has an increase that signifies the activation of the fuel delivery system for the engine, indicating the system’s transition to operational mode. The thrust (F) exerted through the transducer reflects the system’s response to the increasing flow rates in the burning chamber and shows a gradual increase, with a noticeable rise starting around the idle regime, reaching a maximum thrust of approximately 2 kgf. There is an initial spike in the Fuel Pump Current (IPC) before the starting of the engine, then it stabilizes around a steady state with minor fluctuations as the engine is starting. The Fuel pump control tension (URT) mirrors the behavior of IPC with an initial spike before the starting of the engine and a steady state of control as the engine starts. The fuel pressure (Pcb) shows a minor increase as the fuel pump starts working and then, as the engine starts, stabilizes following the fuel flow. The Total fuel flow represents the sums of QcM and QcU; it mirrors the trends of these individual flows, indicating a substantial increase around the idle regime and then stabilizes as the speed becomes constant. The average turbine inlet temperature (T3M) and average turbine outlet temperature (T4M) show a significant increase starting at around 15,000 RPM when the butane gas is shut off and the kerosene is the main fuel.
During this entire starting regime, parameters such as airflow (Mac), fuel flow (QcM), and thrust (F) illustrate the engine’s dynamic response as it moves through preparations, acceleration, and stabilization. The electrical parameters (IPC and URT) and combustion pressure (Pcb) are critical for understanding the initial activation and subsequent stabilization of the engine’s components that dictate the overall regime. The temperature and fuel flow rates (T3M, T4M, and QcT, QcM, and QcU) provide insights into the thermal management required during these transitions.

4.2. Idle Regime

The idle regime consists of maintaining the engine at a specific speed using an automated control method, such as proportional (P), proportional-integrate (PI), or proportional-integrate-derivative (PID) control. In these experiments, the proportional method was utilized to determine the maximum variation of speed at a stationary regime. Specifically, in Figure 11, the idle regime was set at N = 40,000 RPM for Experiments 1 and 3 to compare the variation of speed and total turbine inlet temperature across each experiment. For Experiment 2, the idle regime was set at N = 41,000 RPM.
Across all three experiments, the airflow (Mac) remains relatively stable, with minor variations around 0.18–0.20 kg/s, indicating consistent engine operation. The stability in airflow is primarily due to the engine speed, which remains relatively constant with minimal fluctuations throughout the experiments, ensuring uniform performance and reducing the influence of external factors on the results. The lubrication fuel flow (QcU) exhibits slight fluctuations around zero, reflecting stable lubrication without significant changes. The engine fuel flow (QcM) shows consistent stabilization around 0.17–0.23 L/min, with Experiment 2 exhibiting a slightly higher demand, aligning with the overall fuel requirements during idle. The thrust (F) generally stabilizes around 2.2–2.8 kgf, with slight variations between experiments, reflecting a steady thrust output as the engine maintains the idle regime. Electrical parameters such as the fuel pump current (IPC) and fuel pump control tension (URT) remain stable, with minor fluctuations, indicating consistent electrical demands and control input across all experiments. The fuel pressure (Pcb) shows minor variations, typically stabilizing around 0.6–0.8 bar, reflecting consistent fuel delivery. The total fuel flow (QcT) mirrors the trends in individual fuel flows, stabilizing around 0.2–0.23 L/min. Temperature measurements, including turbine inlet temperature (T3M) and turbine outlet temperature (T4M), reveal consistent thermal management across the experiments. The inlet temperature typically stabilizes between 600–880 °C, with Experiment 2 showing a higher thermal load, while the outlet temperature stabilizes around 480–700 °C, corresponding to the variations in inlet temperatures. Throughout the idle regime, the engine speed remains steady at approximately 40,000 RPM, with slight variations across experiments, reflecting the effectiveness of the proportional control method in maintaining a stable idle condition.
The three experiments showcase the engine’s behavior under different idle regimes. Across all experiments, the airflow (Mac) consistently increases and stabilizes, reflecting effective air intake management. The fuel flows (QcM and QcU) remain stable with slight fluctuations, demonstrating consistent fuel supply and combustion processes. Thrust (F) increases steadily across the experiments, indicating a direct correlation between engine speed and thrust generation. The electrical parameters (IPC and URT) and combustion pressure (Pcb) remain stable, ensuring the engine’s operational stability. The temperatures (T3M and T4M) rise as expected, providing insights into the thermal management required during these working regimes. Each experiment highlights the engine’s ability to maintain stability and performance across varying speeds, contributing to a comprehensive understanding of its working characteristics.

4.3. Working Regime

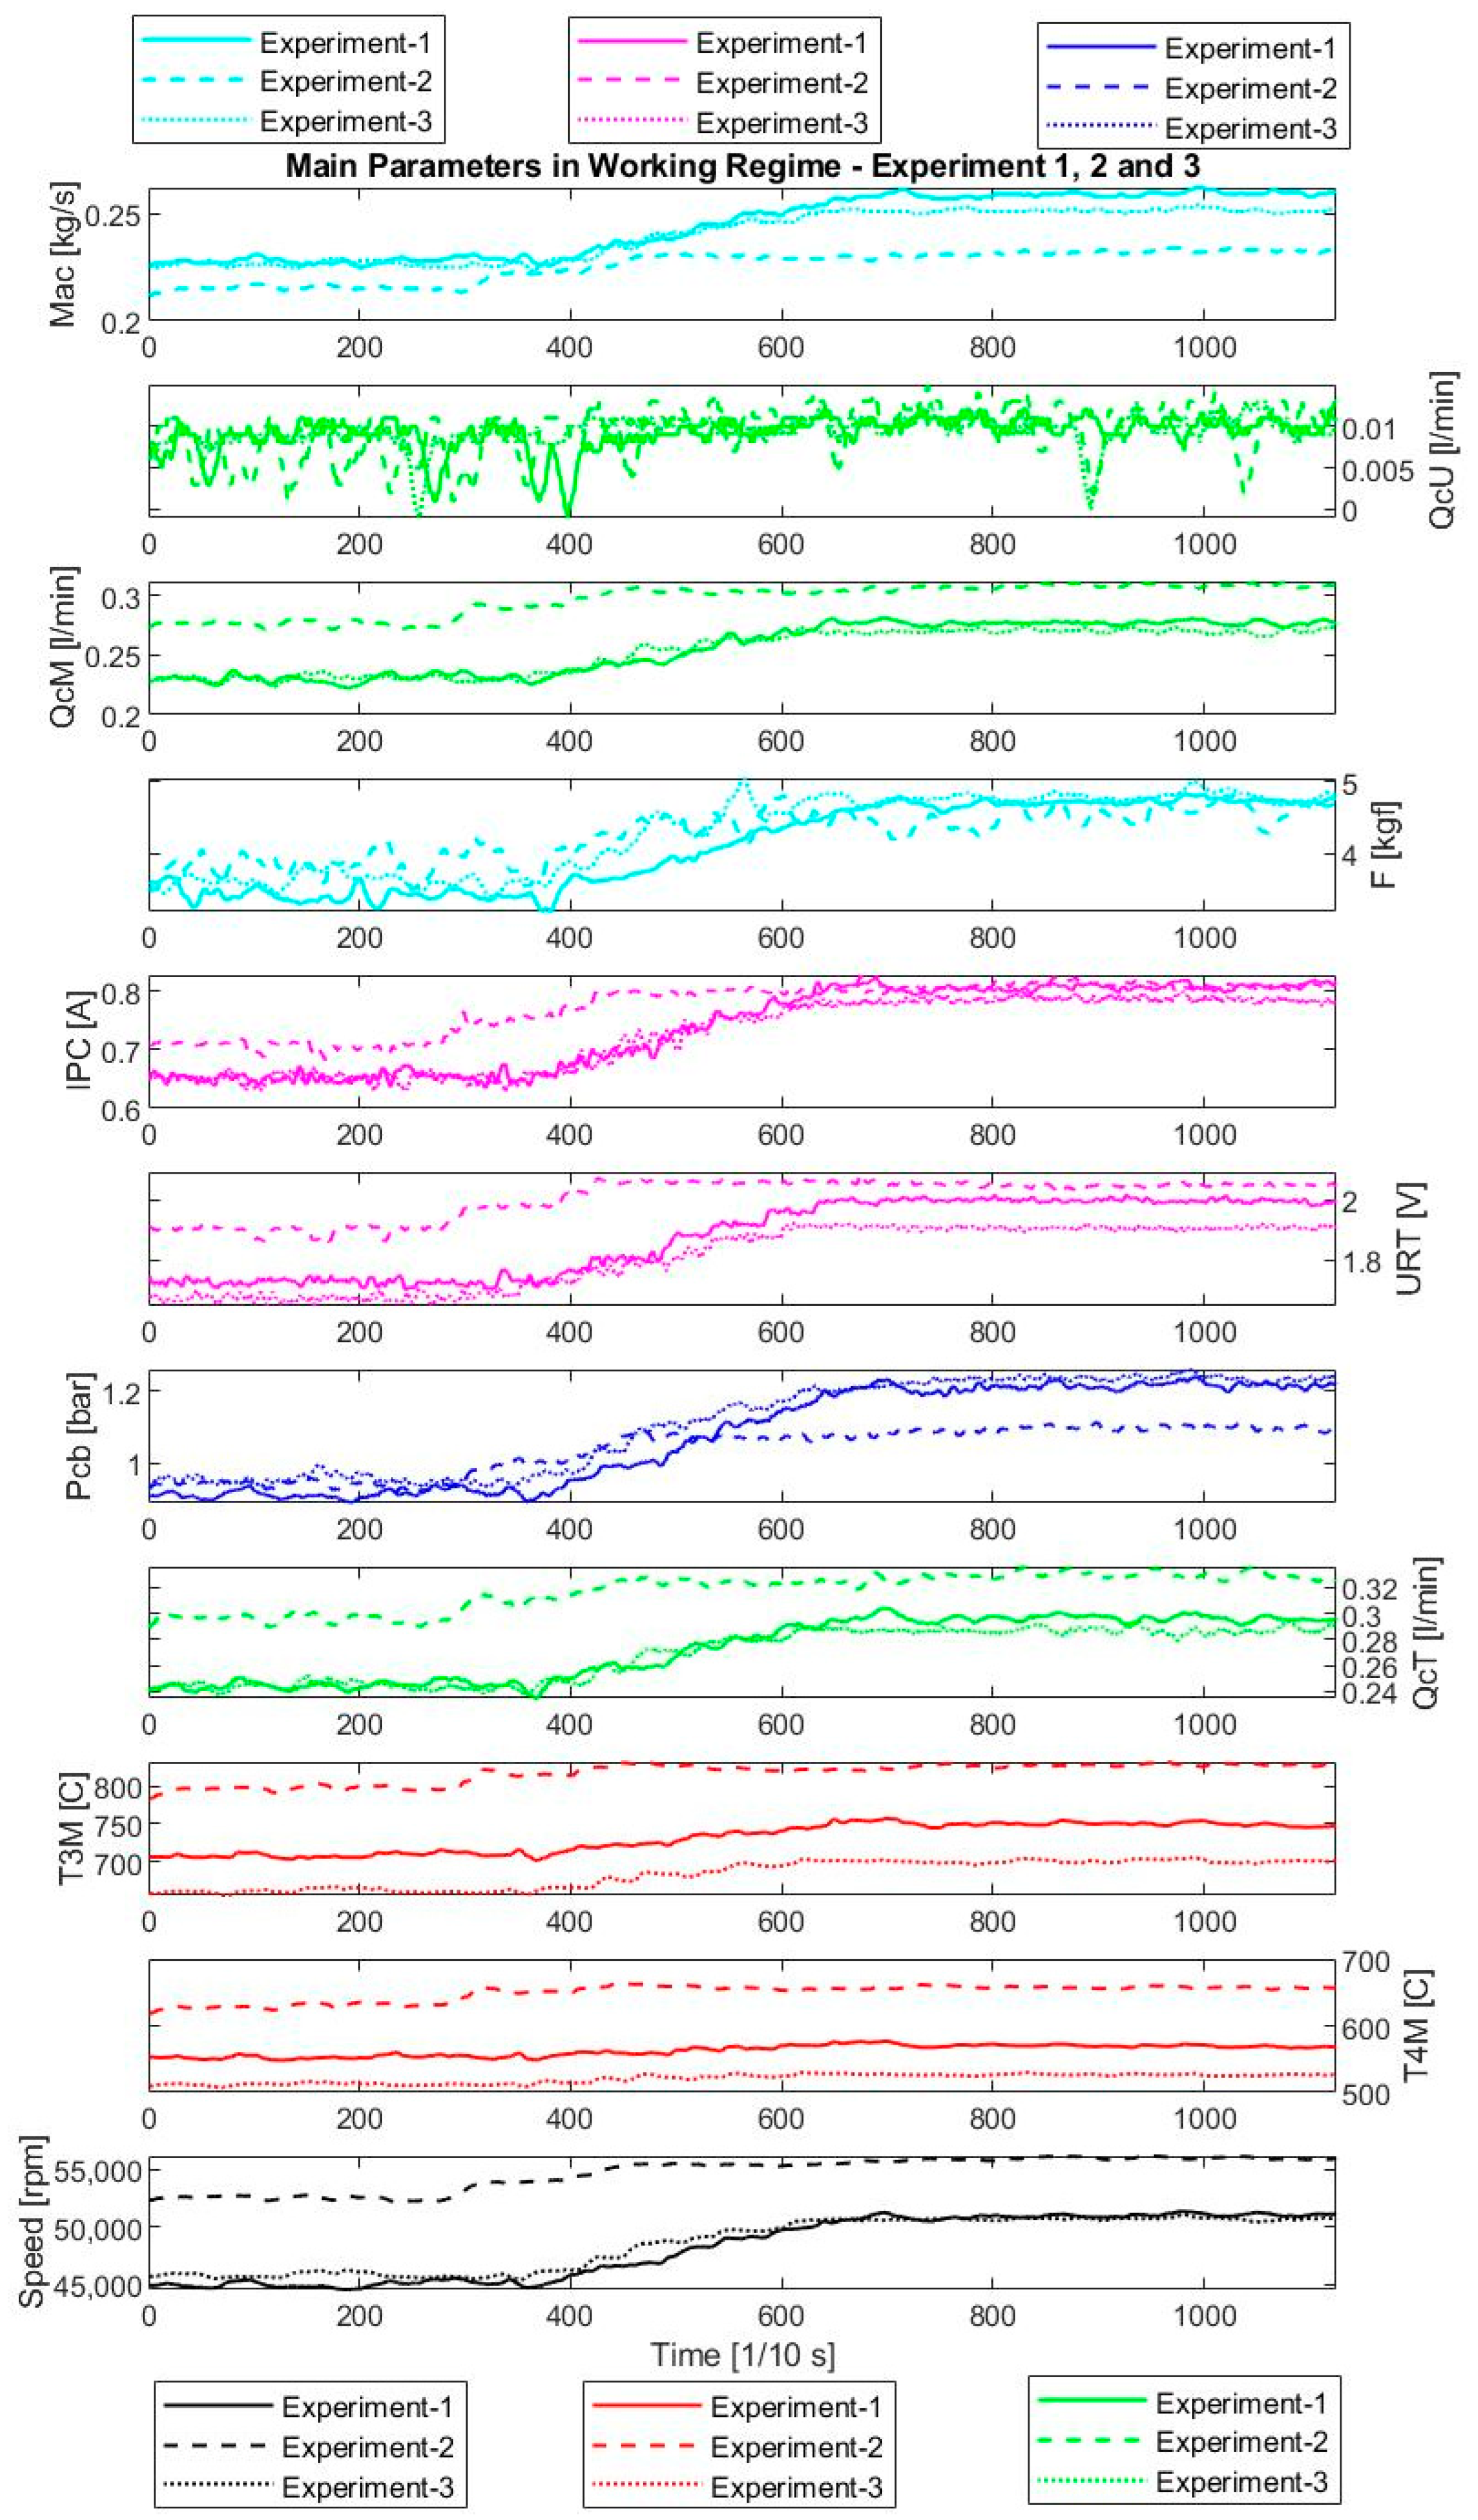
The figures illustrate key parameters during the engine’s working regimes across three different experiments, showcasing the engine’s performance under steady operational conditions. In Figure 12, Experiment 1, the engine operated at an approximate speed of 50,000 RPM, for Experiment 2 at around 54,000 RPM, and for Experiment 3 at approximately 45,000 RPM. Each figure shows how the engine responds as it transitions into and maintains these working regimes.
Across all three experiments, the airflow (Mac) increased steadily as the engine reached its working regime, reflecting the system’s effective control of air intake. The fuel flow rates (QcM and QcU) displayed a stable pattern with minor fluctuations, ensuring continuous fuel supply and lubrication as the engine maintained its operational speed. Notably, the thrust (F) produced by the engine gradually increased in line with the speed, stabilizing at different levels corresponding to the respective RPMs, with Experiment 1 reaching a peak thrust of approximately 5 kgf. The electrical parameters, including Fuel Pump Current (IPC) and Control Tension (URT), remained stable with minor fluctuations, indicating reliable electrical control during these working regimes. The combustion pressure (Pcb) showed a steady increase, signifying stable combustion processes under varying operational speeds. The total fuel flow (QcT) closely followed the trends of QcM and QcU, while the turbine inlet (T3M) and outlet temperatures (T4M) rose as expected, especially at higher RPMs, reflecting the engine’s thermal dynamics during sustained operation.
These figures provide comprehensive insights into the engine’s behavior under different working conditions. The stable patterns observed across key parameters—including airflow, fuel flow, thrust, electrical controls, combustion pressure, and temperature—underscore the engine’s ability to maintain consistent and reliable performance during its working regimes. These data are crucial for understanding the engine’s operational efficiency and thermal management during extended periods of use.

4.4. Stopping Regime

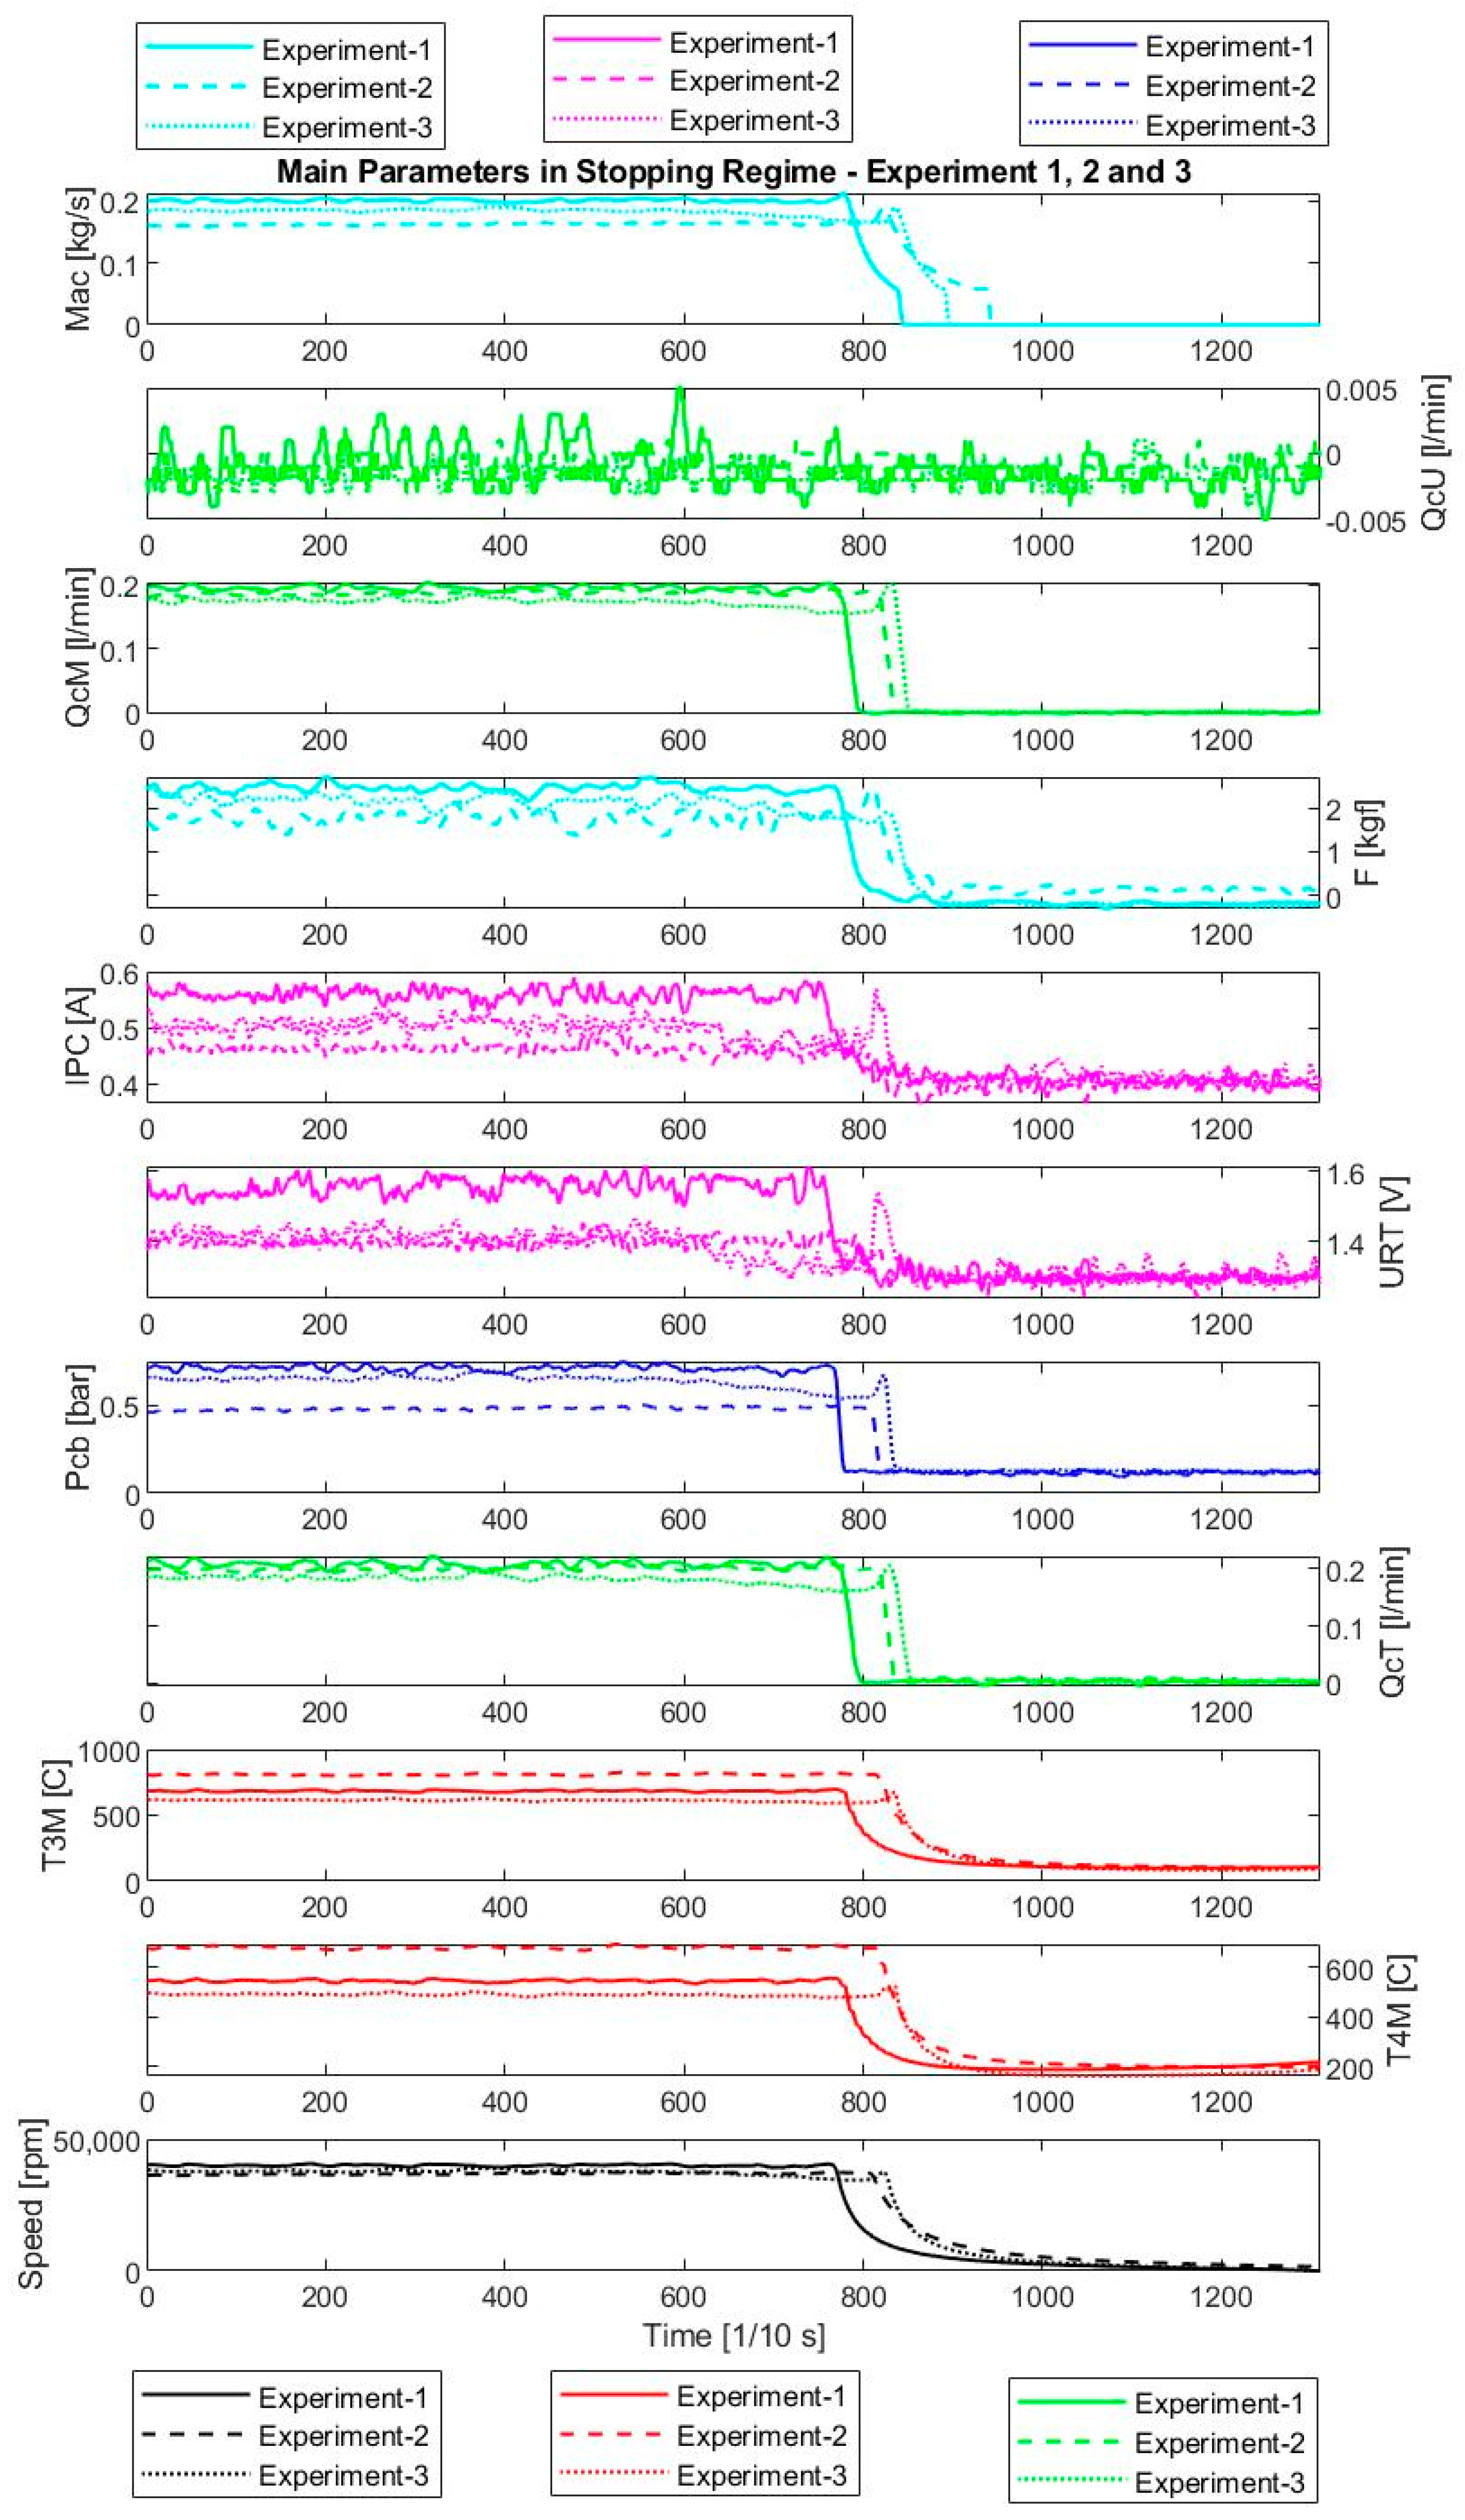
The stopping regime for Experiments 1, 2, and 3, as shown in Figure 13, is characterized by a consistent and marked decline in key operational parameters as the engine transitions from an active state to a complete stop. In each experiment, the mass flow rate (Mac), fuel consumption (QCM), and force (F) remain relatively stable during the initial phase before undergoing a rapid decrease, typically around 800 s. This sharp decline indicates the cessation of airflow and fuel supply, leading to the engine’s shutdown. Additionally, the temperatures (T3M, T4M) exhibit a steady decrease following the engine’s power-down, reflecting the reduction in combustion and heat generation. Across all three experiments, the patterns observed in the stopping regime are consistent, highlighting the reliability and predictability of the engine’s shutdown process, with minimal residual activity post-stop. These results confirm that the engine’s stopping behavior is well-controlled and exhibits minimal variation across different test conditions.
After the engine has stopped, the temperature will slightly increase due to the static heat of the burning chamber and will decrease only when the cold start takes place. Across all three experiments, the stopping regime is characterized by a significant decline in key parameters such as mass flow rate, fuel consumption, and temperatures. The consistent behavior across these experiments underscores the reliability of the stopping process in reducing engine activity effectively. The observed patterns suggest a uniform reduction in the engine’s operational parameters, culminating in a complete stop, with minimal residual fluctuations after the engine powers down.

5. Conclusions

To explore the functionality and assess the performance of a microjet engine prototype, a versatile test stand was developed, specifically tailored to the attributes of a 400 N prototype. To conduct a more streamlined investigation, a comprehensive array of 45 parameters was meticulously monitored and recorded in real-time throughout the experimental campaign. These parameters encompass measurements such as temperatures, pressures, velocity, fuel flow, thrust, vibration, and various other forms of monitoring equipment.
The integration of all parameters and control components was established through a data acquisition and control system. This system utilized a cDAQ (CompactDAQ) platform from National Instruments, complemented by a Virtual Instrument programmed using a graphical language. The test stand was engineered to operate in both manual and automated sequences, with a potential for a combined operation. This flexibility allows for a seamless transition from manual control to an automated sequence, as warranted. For instance, following the idle phase, the engine’s control can be switched from automated to manual mode, utilizing a potentiometer instead of the proportional control, ensuring adaptability to diverse operational conditions.
This research focuses on the development and implementation of a highly versatile test bench, specifically designed to evaluate the functionality and performance of a 400 N microjet engine prototype. Unlike previous studies, our setup integrates a robust data acquisition and control system capable of real-time monitoring and recording of 45 critical parameters, such as temperature, pressure, speed, fuel flow, thrust, and vibrations. The test bench’s unique hybrid operating mode, which allows seamless transitions between manual and automated control, provides unmatched flexibility in testing.
Author Contributions

Conceptualization, C.M.T. and G.C.; methodology, G.C.; software, C.M.T. and G.D.; validation, C.M.T., G.C., C.O., G.D. and R.M.C.; writing—original draft preparation, C.M.T. and G.C.; writing—review and editing, C.M.T., G.C., C.O., G.D. and R.M.C.; visualization, R.M.C.; supervision, C.M.T.; project administration, C.O. All authors have read and agreed to the published version of the manuscript.

Funding

This research was funded by the National Research and Development Institute for Gas Turbines, COMOTI, J/40/4880/1997-RO 445238, Bucharest, Romania. This work was carried out through the Core Program within the National Research, Development, and Innovation Plan 2022–2027, implemented with the support of MCID, project No. PN23.12.01.01.

Institutional Review Board Statement

Not applicable.

Informed Consent Statement

Not applicable.

Data Availability Statement

Data are contained within the article.

Acknowledgments

The preparation and experimental tests were carried out using the facilities of the Installations and Special Objectives of National Interest, IOSIN 1Gas turbine research stand—Gas Turbine Research Stand, National Research and Development Institute for Gas Turbines, COMOTI.

Conflicts of Interest

The authors declare no conflicts of interest.

References

  1. Shah, R.M.R.A.; McGordon, A.; Amor-Segan, M.; Jennings, P. Micro Gas Turbine Range Extender—Validation Techniques for Automotive Applications; University of Warwick: Warwick, UK, 2014. [Google Scholar]
  2. Micro Gas Turbine Technology Research and Development for European Collaboration, Technology Summary. Available online: https://etn.global/research-innovation/rd-reports/ (accessed on 12 September 2024).
  3. Dutczak, J. Micro turbine engines for drones’ propulsion. Scientific Conference on Automotive Vehicles and Combustion Engines (KONMOT 2016). IOP Conf. Ser. Mater. Sci. Eng. 2016, 148, 012063. [Google Scholar] [CrossRef]
  4. Simon, T.W.; Jiang, N. Micro- or Small- Gas Turbines. In Proceedings of the International Gas Turbine Congress 2003, Tokyo, Japan, 2–7 November 2003. [Google Scholar]
  5. Trebunskikh, T.V.; Ivanov, A.V.; Dumnov, G.E. FloEFD Simulation of Micro-Turbine Engine; Mentor Graphics: Moscow, Russia, 2012. [Google Scholar]
  6. Bohn, D. Micro Gas Turbine and Fuel Cell—A Hybrid Energy Conversion System with High Potential. Micro Gas Turbines 2005, 13, 1–46. [Google Scholar]
  7. Bakalis, D.P.; Stamatis, A.G. Data analysis and performance model calibration of a small turbojet engine. Proc. Inst. Mech. Eng. Part G J. Aerosp. Eng. 2012, 226, 1523–1533. [Google Scholar] [CrossRef]
  8. Cican, G. Experimental Transient Process Analysis of Micro-Turbojet Aviation Engines: Comparing the Effects of Diesel and Kerosene Fuels at Different Ambient Temperatures. Energies 2024, 17, 1366. [Google Scholar] [CrossRef]
  9. Weerakoon, A.S.; Assadi, M. Trends and advances in micro gas turbine technology for sustainable energy solutions: A detailed review. Energy Convers. Manag. X 2023, 20, 100483. [Google Scholar] [CrossRef]
  10. Catana, R.M.; Cican, G.; Dediu, G. Gas Turbine Engine Starting Applicated on TV2–117 Turboshaft. Eng. Technol. Appl. Sci. Res. 2017, 7, 2005–2009. [Google Scholar] [CrossRef]
  11. Ajraoui, Y. Experimental Characterization of Electric Motors and Jet Engines for Blended Wing Body Flight Test Models. Master’s Thesis, Polytechnic University of Turin, Turin, Italy, 2019. [Google Scholar]
  12. Krapp, V.; Levy, Y.; Mashiah, E. Computerized Micro Jet Engine Test Facility—Flexible test bed for experiments. Turbo and Jet Engine Laboratory Technion. In Proceedings of the 9th Israeli Symposium on Jet Engines and Gas Turbines, Tel-Aviv, Israel, 7 October 2010. [Google Scholar]
  13. Juste, G.L.; Montanes, J.L.; Velazquez, A. Micro-jet test facility for aerospace propulsion engineering education. Int. J. Eng. Educ. 2009, 25, 11–16. [Google Scholar]
  14. Gawron, B.; Białecki, T. The laboratory test rig with miniature jet engine to research aviation fuels combustion process. J. KONBiN 2015, 4, 1–12. [Google Scholar] [CrossRef]
  15. Montazeri-gh, M.; Fashandi, S.A.M.; Jafari, S. Theoretical and Experimental Study of a Micro Jet Engine Start-Up Behaviour. Teh. Vjesn. 2018, 3, 839–845. [Google Scholar] [CrossRef]
  16. Tărăbîc, C.M.; Olariu, C.; Cican, G.; Dediu, G.; Secăreanu, R.A.; Suciu, C.P.; Hank, A. Instrumentation and data acquisition system for microjet engines—Prototypes. Turbo 2023, X, 1. [Google Scholar]
  17. Agrisoma Biosciences Inc. Biojet Blend Fuels Transatlantic Flight. Biomass Magazine. 2018. Available online: http://biomassmagazine.com/articles/15596/biojet-blend-fuels-transatlantic-flight (accessed on 9 August 2022).
  18. Tracy Rucinski. United Airlines Targets 50 Percent Cut in Greenhouse Gas Emissions. 2018. Available online: https://www.reuters.com/article/us-ual-emissions-idUSKCN1LT32A (accessed on 9 August 2022).
  19. Chakraborty, D.; Kotoky, A. Oil from Seeds Helps Propel SpiceJet’s First. Bloomberg. 2018. Available online: https://www.bloomberg.com/news/articles/2018-08-27/india-s-spicejet-makes-maiden-flight-using-blended-bio-fuel (accessed on 9 August 2022).
  20. Sundararaj, R.H.; Kumar, R.D.; Raut, A.K.; Sekar, T.C.; Pandey, V.; Kushari, A.; Puri, S.K. Combustion and emission characteristics from biojet fuel blends in a gas turbine combustor. Energy 2019, 182, 689–705. [Google Scholar] [CrossRef]
  21. Suchocki, T.; Witanowski, Ł.; Lampart, P.; Kazimierski, P.; Januszewicz, K.; Gawron, B. Experimental investigation of performance and emission characteristics of a miniature gas turbine supplied by blends ofkerosene and waste tyre pyrolysis oil. Energy 2021, 215, 119125. [Google Scholar] [CrossRef]
  22. Oni, B.A.; Eshorame Sanni, S.; Ibegbu, A.J.; Tomomewo, O.S. Evaluation of engine characteristics of a micro-gas turbine powered with JETA1 fuel mixed with Afzelia biodiesel and dimethyl ether (DME). Renew. Energy 2023, 216, 119134. [Google Scholar] [CrossRef]
  23. Cican, G.; Deaconu, M.; Mirea, R.; Cucuruz, A.T. Influence of Bioethanol Blends on Performances of a Micro Turbojet Engine. Rev. Chim. 2020, 71, 229–238. [Google Scholar] [CrossRef]
  24. Chen, L.; Zhang, Z.; Lu, Y.; Zhang, C.; Zhang, X.; Zhang, C.; Roskilly, A.P. Experimental study of the gaseous and particulate matter emissions from a gas turbine combustor burning butyl butyrate and ethanol blends. Appl. Energy 2017, 195, 693–701. [Google Scholar] [CrossRef]
  25. Cican, G.; Deaconu, M.; Mirea, R.; Ceatra, L.; Cretu, M.; Dobre, T. Investigating the Use of Recycled Pork Fat-Based Biodiesel in Aviation Turbo Engines. Processes 2020, 8, 1196. [Google Scholar] [CrossRef]
  26. Rad, I.O. Test Rig Design for a Micro-Turbojet Engine. Bachelor’ Thesis, Universitat Politecnica de Catalunya, Barcelona, Spain, 2 September 2021. [Google Scholar]
  27. Markowski, J.; Olejniczak, B.; Wirkowski, P. Evaluation of turbine microjet engine operating parameters in conditions conducive to inlet freezing. MATEC Web Conf. 2017, 118, 31. [Google Scholar] [CrossRef]
  28. Caom-Automatizari. Available online: https://caom.ro/index.php?route=common/home (accessed on 12 August 2023).
  29. Bakerhughes. Available online: https://www.bakerhughes.com/druck-unik5000-pressure-sensing-platform-datasheet (accessed on 12 August 2023).
  30. SMC. Available online: https://www.smc.eu/en-eu/products/vt317-3-port-direct-operated-poppet-all-types~37760~cfg (accessed on 15 August 2023).
  31. Manual & Engine Log, Titan Gas Turbine. Available online: https://www.amtjets.com/pdf/Titan%20Manual%20V20B.pdf (accessed on 20 August 2023).
  32. Kem Kueppers. Available online: https://www.kem-kueppers.com/produktuebersicht/zahnrad-durchflussmesser (accessed on 20 August 2023).
  33. Champion. Available online: https://www.championairtech.com/en-gb/products/screw-compressors/fm-30-to-45kw (accessed on 24 August 2023).
  34. PMX. Available online: https://pmaxsolutions.com.au/wp-content/uploads/2021/04/GOETZE_Series_684_Pressure_Reducing_Valves.pdf (accessed on 22 August 2023).
  35. Fluke. Available online: https://eu.flukecal.com/products/new-products (accessed on 29 August 2023).
  36. Metrology Laboratory. Available online: https://comoti.ro/en/metrology-laboratory/ (accessed on 9 September 2024).
Figure 1. The general layout for the test bench.
Machines 12 00688 g001
Figure 2. Test cell instrumentation.
Machines 12 00688 g002
Figure 3. Auxiliary systems instrumentation.
Machines 12 00688 g003
Figure 4. Schematics for the DACS.
Machines 12 00688 g004
Figure 5. Schematics for the control system.
Machines 12 00688 g005
Figure 6. Graphical user interface used for experimental campaign.
Machines 12 00688 g006
Figure 7. The scaling and verification equipment.
Machines 12 00688 g007
Figure 8. (a) Flame front for starting regime with butane gas; (b) Flame front for working regime after idle with kerosene.
Machines 12 00688 g008
Figure 9. Comparison of engine initiation commands for Experiments 1, 2, and 3.
Machines 12 00688 g009
Figure 10. Initiation Dynamics of Microjet Engine: Experiments 1, 2, and 3 Analysis.
Machines 12 00688 g010
Figure 11. Idle State Characteristics of Microjet Engine: Experiments 1, 2, and 3 Analysis.
Machines 12 00688 g011
Figure 12. Operational Performance Analysis of Microjet Engine: Experiments 1, 2, and 3 Study.
Machines 12 00688 g012
Figure 13. Shutdown Process Investigation of Microjet Engine: Experiments 1, 2, and 3 Trends.
Machines 12 00688 g013
Table 1. Parameter list with domain, error, and maximum frequency response for key parameters.
Parameter—NameDomain & UnitError
[Unit/%FS]
Maximum Frequency Response
N —rotor speed 0 ÷ 100,000   [ r p m ] ± 1.00 % 20,000   H z
T 4 M —average turbine outlet temperature * 0 ÷ 1250   [ ° C ] ± 0.12 % 10   H z
T 3 M —average turbine inlet temperature * 0 ÷ 1250   [ ° C ] ± 0.11 % 10   H z
Q c T —total fuel flow 0 ÷ 7   [ L / m i n ] ± 0.811 %   492   H z
P c b —fuel pressure 0 ÷ 10   [ b a r ] ± 0.3 % 5000   H z
U R T —fuel pump control tension 0 ÷ 10   [ V ] ± 0.05 % 100   H z
I P C —fuel pump current 0 ÷ 10   [ A ] ± 0.05 % 3000   H z
F —thrust 0 ÷ 100   [ k g f ] ± 0.50 % 6000   H z
Q c M —combustion chamber fuel flow 0 ÷ 4   [ L / m i n ] ± 1.27 492   H z
Q c U —lubrification flow 0 ÷ 4   [ L / m i n ] ± 0.63 492   H z
M a c —corrected airflow *   [ k g / s ]
* These parameters are indirectly determined from other instrumented parameters.
Disclaimer/Publisher’s Note: The statements, opinions and data contained in all publications are solely those of the individual author(s) and contributor(s) and not of MDPI and/or the editor(s). MDPI and/or the editor(s) disclaim responsibility for any injury to people or property resulting from any ideas, methods, instructions or products referred to in the content.