Article

A Denoising Algorithm for Wear Debris Images Based on Discrete Wavelet Multi-Band Sparse Representation

1
Department of Mechanical Engineering, Kunsan National University, Gunsan 54150, Republic of Korea
2
School of Echanical Engineering, Shaanxi Institute of Technology, Xi’an 710000, China
*
Author to whom correspondence should be addressed.
Machines 2024, 12(10), 672; https://doi.org/10.3390/machines12100672
Submission received: 19 July 2024 / Revised: 22 September 2024 / Accepted: 23 September 2024 / Published: 26 September 2024
(This article belongs to the Section Machine Design and Theory)

Abstract

:
Wear debris image processing techniques are increasingly employed in health monitoring and fault diagnosis for mechanical equipment. However, during the acquisition and storage of wear debris images, substantial noise is often introduced, leading to significant errors in the subsequent feature extraction and health status assessment. Moreover, the denoising process frequently encounters algorithmic shortcomings, resulting in blurred boundary information, noise artifacts, and incomplete boundaries, greatly hindering further research on wear debris images. Thus, this paper proposes the wavelet-K-singular value decomposition-edge (W-KSVD-EDGE) algorithm, which initially performs two-dimensional discrete wavelet decomposition on noisy images through a multi-band decomposition module, dividing them into four sub-bands of high and low frequencies to enhance image denoising performance. Simultaneously, a second-order decomposition is performed, followed by reconstruction, which reduces high-frequency noise and lowers the complexity of subsequent image processing operations. Subsequently, the K-singular value decomposition (KSVD) algorithm is applied to denoise each sub-band of the initially reconstructed images. Applying the KSVD algorithm to images of different frequency bands, its complexity is mitigated, and the efficiency of image denoising is increased. Consequently, the boundaries of the reconstructed images are further optimized using an improved Canny algorithm for edge enhancement, incorporating edge detection coefficients, resulting in better boundary information restoration for wear debris images. Finally, by analyzing the wear debris information of oil samples collected by a ferrograph, the W-KSVD-EDGE algorithm is employed for denoising both ordinary and wear debris images. The results are evaluated using both subjective and objective methods. The effectiveness and versatility of the proposed algorithm are thereby demonstrated.

1. Introduction

Wear is one of the most common types of failures in mechanical equipment. According to statistics, approximately 80% of component failures in equipment are caused by wear, and over 50% of severe mechanical equipment accidents result from lubrication failure and excessive wear [1,2]. Monitoring the wear state of mechanical equipment has, thus, become a top priority to ensure its normal operation [3]. During the wear process, wear debris images are crucial signal sources commonly used in mechanical fault monitoring and diagnosis. By analyzing wear debris information in worn oil samples, the wear state of the entire equipment can be determined. Common analysis methods include spectroscopy, ferrography, magnetic plug analysis, and particle counting [4,5]. Compared to other oil analysis methods, ferrography can detect larger wear debris and analyze them qualitatively and quantitatively, determining wear and fault locations in the equipment. Ferrography is an important technique in oil analysis [6]. However, during the acquisition and storage of wear debris images using a ferrograph, noise signals are generated due to complex electromagnetic environments, prolonged high temperatures, long-distance transmission, and low light conditions [7,8,9]. This not only blurs the surface texture of the wear debris images but also significantly affects their boundary information, severely impacting the monitoring of mechanical wear states and fault diagnosis. Therefore, denoising wear debris images is crucial.
Image denoising is a crucial step in image preprocessing. Recently, with the advancement of computer technology, image denoising has rapidly developed and been applied in many fields. Hubel [10] introduced the concept of sparsity during his study of cat visual receptive cells. Sparse representation refers to expressing parts or all of the original signal using a linear combination of a few fundamental signals. Subsequently, Michal Aharon and colleagues proposed the KSVD algorithm based on the K-means algorithm. Using iterative methods, they trained an initially over-complete dictionary from the sample, making it a popular algorithm for over-complete dictionary design. They then progressively corrected atoms in the atomic library through decomposition coefficients, ultimately obtaining an over-complete atomic library capable of representing sample features, thus solving the problem of fixed dictionaries ignoring pixel information [11,12,13]. Reconstructing the original image in this manner avoids significant changes to original pixel values caused by pixel averaging in traditional methods, thereby separating sparse image structures from non-sparse noise. Consequently, compared to traditional low-pass filter denoising algorithms, algorithms based on sparse models perform exceptionally well in denoising. Subsequently, Farouk et al. [14] designed a KSVD image denoising algorithm based on log-Gabor wavelet adaptive dictionaries, utilizing orthogonal matching pursuit (OMP) and Discrete Cosine Transform (DCT) dictionaries. Chen et al. [15] proposed an image denoising algorithm based on improved KSVD and dictionary atom optimization. First, the correlation coefficient matching criterion is employed to obtain the sparse representation of the image dictionary. Dictionary noise atoms are detected and removed based on structural complexity and noise intensity, optimizing the dictionary. Subsequently, non-local regularity is introduced into the denoising model to further enhance image denoising performance. However, KSVD-based image denoising algorithms are computationally intensive, can produce false textures in weakly textured smooth areas, and do not always perform ideally in high-noise environments.
In response to the above scenario, this paper introduces the wavelet transform algorithm [16] (wavelet transform, WT) to decompose the image into various frequencies for further processing. Utilizing its multi-resolution analysis and time-frequency domain subdivision capabilities, feature maps can be decomposed into various frequencies for further processing. By separating high-frequency information from low-frequency information in the image, the performance of image denoising is enhanced, and the information loss caused by downsampling in the next step is significantly reduced [17]. For instance, the PCA (principal component analysis, PCA) algorithm [18,19] combined with the wavelet algorithm for image denoising reduces data dimensions during dictionary construction, thereby enhancing computational efficiency. Guhathakurta R [20] employed simple nonlinear techniques to process wavelet coefficients. Parameters below a given threshold were set to zero, followed by an inverse transform to achieve denoising. This method can improve denoising efficiency but may lose image detail features due to threshold selection and other factors. Therefore, Duan et al. [21] designed a convolutional wavelet neural network using dual-tree complex wavelet transform to suppress specific noise and preserve image structural features. However, their approach of directly mixing frequency information might pose challenges in preserving edge detail features of the image. Cao et al. [22] employed 2D-VMD for the decomposition of wear debris images, resulting in effective denoising outcomes. However, this approach is primarily suited for real-time denoising applications and has limited applicability for analyzing edge information in wear debris images. In the study of wear debris images, edge information directly influences the extraction of wear debris image features, thereby affecting the health monitoring of mechanical equipment, and potentially resulting in mechanical failures and significant economic losses.
Recently, deep learning algorithms have advanced the development of image denoising algorithms. Reference [23] introduced CVF-SID, a self-supervised training denoising method for real noise, which includes a self-supervised data augmentation strategy and decomposes noisy images into noise-free images, signal-related, and signal-unrelated noise, effectively increasing the number of training samples. Reference [24] introduced two masked training methods: input and attention masks. RSIDNet [25] is a visible light remote sensing image denoising network that uses multi-scale feature extraction modules to extract detailed texture information from the original noisy image and introduces an attention mechanism for global feature fusion and reconstruction of noisy images. This method can correct the loss of high-frequency signals in noisy images and has good denoising effects. However, the model is highly complex and demands significant computational power for training. InvDN [26] is a lightweight and reversible real image denoising network that converts noisy images into low-resolution clean images and latent representations containing noise, achieving clean image restoration and generating new noisy images. MIRNetv2 [27] preserves image details using multi-scale residual blocks, combined with dense connection blocks and global residual learning. However, these methods cannot finely preserve image edge details in areas with complex textures and structures, and they often require extensive datasets for preprocessing, potentially causing unintended biases during classification. Moreover, their complexity significantly restricts their practical application in engineering.
In image preprocessing, achieving both image denoising and accurate edge information is often challenging simultaneously. Traditional image edge detection algorithms have extensively developed and widely used the Canny operator (Canny, 1986) due to its high noise suppression ratio and detection accuracy [28]. Zhu et al. [29] enhanced the Canny operator for edge detection by incorporating adaptive median filtering and guided filtering, although the edge acquisition remained suboptimal. The rapid advancements in deep learning have led to numerous deep learning-based edge detection algorithms. For instance, PANG [30] introduced a data augmentation technique termed re-corrupt to mitigate overfitting due to the scarcity of real images, yielding effective results in edge detection. Schmid-Schickhardt [31] introduced an adaptive Canny edge detection method based on deep learning, employing a three-model pipeline with a proxy network for training, and the validation model optimizes the threshold for each image. Choi et al. [32] utilized pre-trained weights for extracting image edge network features, achieving relatively high performance. However, meeting the real-time response requirements of ferrographic images is challenging due to the extensive convolution operations required. Since the edge detection module of this algorithm operates after denoising, the Canny operator aims to achieve a balanced solution between image denoising and accurate edge information.
To address these challenges and effectively remove noise signals while preserving image edge information, this paper introduces the W-KSVD-EDGE algorithm. First, we introduce the two-dimensional discrete wavelet decomposition algorithm. By applying this technique, the algorithm decomposes the noisy image into four sub-bands of high and low frequencies, significantly enhancing image denoising performance and reducing information loss from downsampling. Additionally, secondary decomposition and reconstruction aim to reduce high-frequency noise and simplify subsequent image processing. Next, the KSVD algorithm denoises each sub-band of the reconstructed image, improving efficiency by simplifying complex calculations. Subsequently, the processed image undergoes reconstruction using discrete wavelets. However, the reconstructed image may still lack accurate boundary information. Therefore, the boundaries are refined using an enhanced Canny algorithm, incorporating edge detection coefficients to restore accurate boundaries in wear debris images. Lastly, wear debris information is collected from oil samples using ferrograph analysis. The W-KSVD-EDGE algorithm is applied to denoise both ordinary and wear debris image sets, with results evaluated using subjective and objective methods, demonstrating superior performance over current mainstream algorithms.

2. Principle of W-KSVD-EDGE Algorithm

This paper introduces a denoising algorithm for wear debris images based on discrete wavelet multi-band sparse representation. The algorithm initially decomposes the noisy image into low-frequency (LL), horizontal (HL), vertical (LH), and diagonal (HH) subbands using two-dimensional discrete wavelet transform. It then applies the KSVD algorithm to denoise each subband and enhances the edges of the denoised image post-reconstruction. Figure 1 illustrates the overall network structure of the denoising algorithm.
Figure 1 illustrates that the algorithm proposed in this paper includes an encoder, Subnetwork 1, Subnetwork 2, and the final decoder. The encoder decomposes the original image, after noise addition, into low-frequency, horizontal, vertical, and diagonal subbands using two-dimensional wavelet decomposition. Subnetwork 1 applies the KSVD algorithm to denoise each subband from the encoder, thereby significantly reducing processing time. Following wavelet reconstruction in Subnetwork 1, the algorithm generates the denoised image. Subnetwork 2 enhances the reconstructed image with edge information extracted using the Canny algorithm, based on the noisy image, to achieve edge-enhanced results after boundary perception. Finally, the decoder processes and displays the final image.
The algorithm proposed in this paper decomposes the noisy signal using a two-dimensional discrete wavelet transform (2D-DWT) into high and low subbands. After processing each subband, the image undergoes reconstruction using a 2D-DWT, followed by overlaying edge information. Therefore, the overall mathematical model of this algorithm can be represented as follows:
I 1 = f D W T 1 ( I i n )
I 2 = f D W T 2 ( f D W T 1 ( I i n ) ) = f D W T 2 ( I 1 )
I n = f D W T i ( I n 1 ) , i ( 1 , , n )
I o u t = I O U T P + λ I e d g e ( x , y )
where I i n represents the input noisy image, I o u t represents the final output image, F ( x , y ) represents the edge detection data matrix of the noisy image, I O U T P represents wavelet-reconstructed images after KSVD denoising of images in different frequency bands. I e d g e represents the edge image obtained from the Canny algorithm, λ denotes the weighting coefficient for edge detection, I i represents the output value after the ith wavelet decomposition, f d w t i denotes the function symbol following the ith wavelet decomposition, and i signifies the number of wavelet decompositions.

2.1. Multi-Scale Decomposition of Wavelet Transform

DWT is a multi-scale analysis method known for its excellent localization properties across different frequency components. It decomposes the signal through a series of low-pass and high-pass filters, generating approximation coefficients and detail coefficients.
DWT typically involves designing a pair of high-pass and low-pass filters with mirror characteristics for signal convolution. Subsequently, the signal’s sampling rate is reduced by retaining every other sample at regular intervals following the extraction of two sets of filtered signals. The filtered low-pass signal serves as the new input, continuing the process of filtering and downsampling until achieving the desired resolution or decomposition level. The resulting approximation and detail coefficients represent the original signal’s information across various frequencies and scales, effectively capturing its transient characteristics. This property also renders wavelet transform widely applicable across fields including image processing, audio processing, and communication.
In practical applications, when applying wavelet transform to process two-dimensional signals like images, employing 2D-DWT becomes necessary. Similar to DWT, 2D-DWT utilizes a pair of analysis filters to perform low-pass and high-pass decomposition on the signal. This process is akin to applying DWT vertically on the signal obtained from DWT. Subsequently, downsampling is carried out.
Multi-band wavelet decomposition occurs in the encoder stage of the process. During this stage, the input noisy image undergoes multi-band wavelet decomposition using 2D-DWT, as informed by experimental experience. Thus, its mathematical model can be represented by Equations (1), (2), and (5), as follows:
I W T o u t = P I D W T 1 ( f D W T 2 ( f D W T 1 ( I i n ) ) ) ,
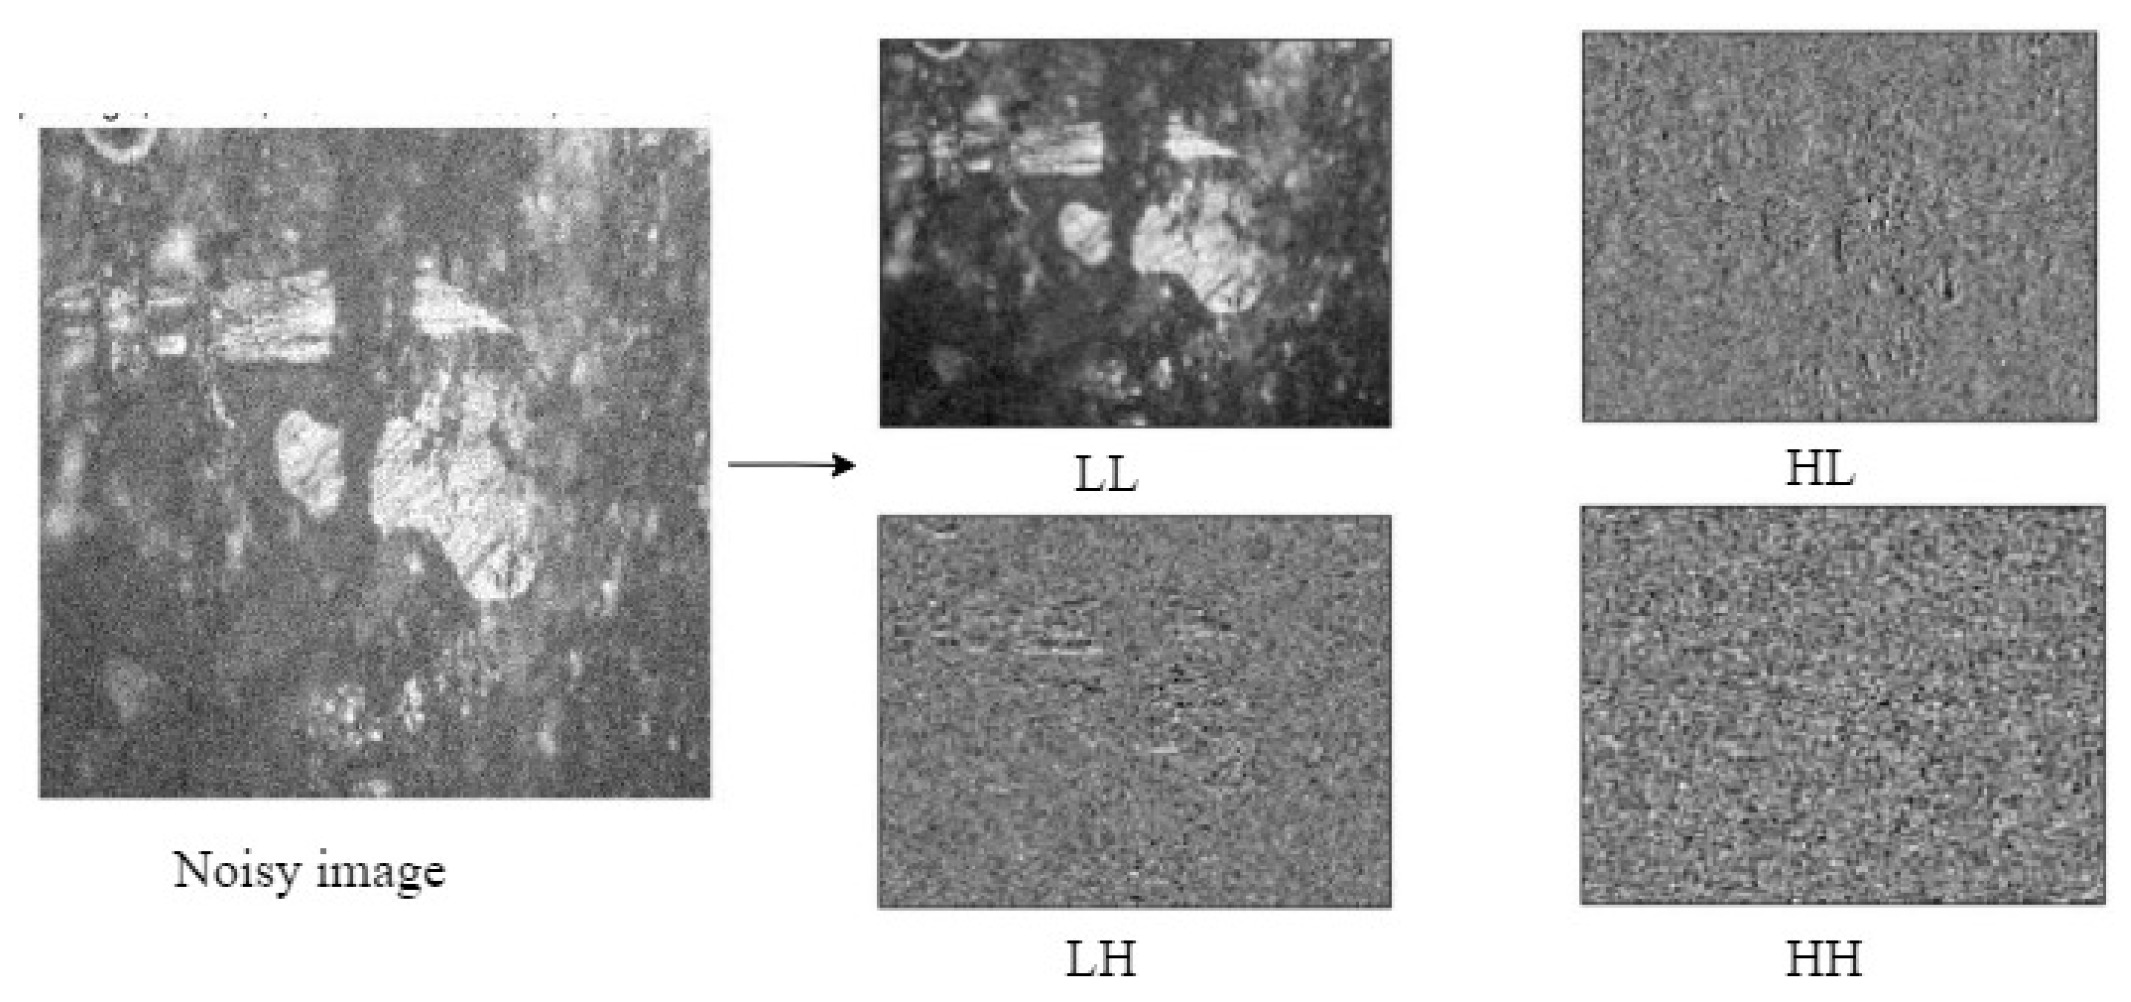
where in Formula (5), P I D W T 1 represents the use of wavelet inverse transform for one wavelet reconstruction, I W T o u t represents the output frequency band image after performing multi-band decomposition during the encoder stage. And I W T o u t represents a wavelet-decomposed image across four distinct frequency bands: LL1, LH1, HL1, and HH1, where LL1 represents the low-frequency subband obtained by convolving the image with low-pass wavelet filters in both horizontal and vertical directions. HL1 represents the horizontal subband obtained by convolving the image first with low-pass wavelet filters in the row direction and then with high-pass wavelet filters in the column direction, capturing the image’s horizontal directional singular characteristics. LH1 represents the vertical subband obtained by convolving the image first with high-pass wavelet filters in the row direction and then with low-pass wavelet filters in the column direction, capturing the image’s vertical directional singular characteristics. HH1 represents the diagonal subband obtained by convolving the image with high-pass wavelet filters in both directions, capturing the diagonal edge characteristics of the image. In wavelet reconstruction (using Formula (5)), HH1 sets the high-frequency information in the decomposed HH2 subband to zero, effectively reducing noise. The basic process is illustrated in Figure 2, where each row of the image undergoes DWT to obtain the horizontal low-frequency component (L) and high-frequency component (H). Subsequently, each column of the resulting processed image undergoes DWT to derive the LL, LH, HL, and HH subbands of the original image.
In the multi-frequency band decomposition process employed in this study, Haar wavelets utilize a combination of a low-pass filter (LL) and high-pass filters (LH, HL, HH) [16]. Haar wavelets are recognized for their intuitive filters that effectively capture local image changes, making them adept at handling image details and textures. Additionally, these wavelets are orthogonal, ensuring they do not introduce artifacts during image decomposition and reconstruction processes. This orthogonality also aids in preserving the energy of the image, thereby imparting favorable mathematical properties. Consequently, through hierarchical decomposition and reconstruction, information at various scales can be extracted, aligning well with the processing requirements of the algorithm proposed in this paper.
The input image undergoes decomposition using Haar wavelet filters, as depicted in Equation (6), and the resulting decomposed components are illustrated in Figure 3.
f L L = [ 1 1 1 1 ] f L H = [ 1 1 1 1 ] f H L = [ 1 1 1 1 ] f H H = [ 1 1 1 1 ] ,
where f L L represents low-pass filtering of I W T o u t and f L H ,   f H L ,   f H H represents high-pass filtering of I W T o u t .
Due to the orthogonality of the four filters, the original image signal is distributed across the four subbands without redundancy. Therefore, binary downsampling is employed during the process to prevent image information loss, reduce the number of sampling points, and consequently lower computational demands. The computational steps for 2D DWT and IDWT are as follows:
f D W T 1 ( I i n ) = [ ( f L L I i n ) 2 , ( f L H I i n ) 2 , ( f H L I i n ) 2 , ( f H H I i n ) 2 ]
where ( ) 2 represents binary downsampling.
Therefore, for denoising noisy images using the 2D-DWT, the noisy signal undergoes preprocessing, followed by decomposition into multiple scales using wavelet transform. At each scale, noise coefficients are removed while preserving and enhancing signal coefficients. Finally, the denoised image is reconstructed using the inverse wavelet transform. The advantage of 2D-DWT lies in its capability to perform comprehensive multi-scale analysis, capturing image features across horizontal, vertical, and diagonal directions simultaneously. Moreover, 2D-DWT filters independently in horizontal, vertical, and diagonal directions, thereby enhancing its directional sensitivity and aiding in the capture of directional features within the image.

2.2. Multi-Band KSVD Denoising Algorithm

The KSVD algorithm is a dictionary training method where in which the core process involves learning a set of bases from training images to form a dictionary capable of representing various images within the training set. This adaptability allows KSVD to handle different types of images, possessing a certain degree of generality. Meanwhile, the sparse model is a specific mathematical model for signal sources, which in the digital image processing domain can be used to denoise, separate, and compress images. Using the KSVD algorithm for image denoising addresses the non-stationarity issue present in wavelet transforms and effectively overcomes the loss of image texture details caused by noise.
Suppose one of the frequency bands resulting from multi-band decomposition is used as the training sample Y, as follows:
Y = { y i } i = 1 M ,
where M is the number of samples, y i R N is a single sample, which is an N-dimensional feature vector, and M atoms form a sample set matrix column-wise.
In order to find a set of overcomplete dictionaries, the following is necessary:
D = { d i } i = 1 K ,
where d i R N represents the base vector, forming a dictionary matrix with K columns, K = 256.
The sample set Y can be represented as a linear combination of several atoms in the overcomplete dictionary D: Y D A , where A = { a i } i = 1 M represents the coefficient of signal Y in the dictionary D. The ultimate goal is to find the most suitable dictionary D that yields the sparse representation X of the known training set Y, as shown in Equation (10):
s . t a i 0 k 0 , 1 i M min D , A Y D A F 2 ,
where F represents the Frobenius norm of the matrix.
Given that this paper addresses noisy images, the signal-to-noise ratio (SNR) of the image is predetermined. The value of k 0 is selected based on an empirical formula, as follows:
k 0 = α × S N R
The experiments conducted in this study leverage the known noise level, whereby the value of “ α ” is utilized to modulate the magnitude of the noise. An excessively large coefficient may yield inadequate denoising, whereas a smaller coefficient may compromise detail retention. Consequently, this study conducted comprehensive experiments across the dataset at various noise levels. By calculating the SNR values for each data point, we compared the impacts of varying “ α ” values on denoising performance and ultimately determined that when α = 0.5 , stable and effective denoising was achieved across diverse SNR conditions.
The primary objective of the denoising algorithm presented in this paper is to effectively denoise wear debris images for engineering applications. It is indicated that, in these practical engineering applications, the SNR values of the images are unknown, precluding the use of the aforementioned empirical formula for calculating the k0 value. To ensure the effectiveness of image denoising in practical engineering applications, this study excluded uncommon extreme noise levels, adopting σ = 5 and σ = 15 as representative noise levels for estimating the k0 value. The denoised images at these two noise levels were considered approximately noise-free images, facilitating the denoising of the wear debris images in the dataset. The SNR values were calculated for the wear debris images, leading to an estimated mean k0 value of 9.5 from the empirical formula.
The core of the KSVD algorithm lies in the alternating solution of sparse coefficient updating and dictionary updating to obtain the final result. The specific steps are as follows:
Assuming the dictionary D is fixed, this involves solving for the sparse coding matrix A, which corresponds to the sparse representation vector a i for each image patch y i . Equation (10) can be optimized as follows:
min A i = 1 M y i D a i F 2 s . t a i F k 0 , 1 i M ,
a i represents the i-th column of the sparse matrix A, which denotes the sparse coefficient vector corresponding to the i-th image patch. The algorithm used in this paper is the OMP algorithm for solving.
Assuming the sparse coefficient A is fixed, Equation (10) can be optimized as follows:
min D Y D A F 2 = min Y j = 1 K d j a T j F 2 , = min D [ Y j k d j a T i ] d k a T j F 2 = min D E k d k a T j F 2
where d k represents the column vector of dictionary D, and a T k represents the row vector of the sparse matrix A. In Equation (13), the residual E k = Y j k d j a T j is defined as the error between the un-updated base vector and the combination of other vectors with the sample set.
To minimize the residual, we have the following:
min d k , X T k E k d k a T k F 2 ,
Singular value decomposition (SVD) is a method of decomposing a matrix into the product of three matrices, which contain important structural information about the original matrix. In KSVD, the SVD algorithm effectively extracts structural information from data samples, thereby updating the dictionary. To maintain sparsity, KSVD retains only the non-zero elements in the sparse coding matrix A that correspond to dictionary atoms a T k and E k , denoted as E k , and then performs singular value decomposition on E k . The SVD algorithm is used in the following manner:
E k = U Σ V T ,
In matrix Σ , the singular values are arranged in ascending order. Therefore, the vector corresponding to the largest singular value needs to be selected as the optimal d k , a T k . This involves taking the first column vector of matrix U as d k , and updating the product of the first-row vector of matrix V and the first singular value to a T k . We repeat this process until all dictionary atoms have been updated.
Reconstruct the image I s using the updated dictionary D and the sparse coding matrix A, we have the following:
I s = D A ,
where I s represents the KSVD denoised image from one of the frequency bands following I W T o u t decomposition. Subsequently, we combine the reconstructed image patches to form the denoised image I s .
The mathematical model of the multi-band KSVD denoising module in subnetwork 1 is represented by Equation (17), as follows:
I O U T P = f I D W T 1 ( I s L L + I s L H + I s H L + I s H H ) ,
where I s L L , I s L H , I s H L , I s H H represent the residual images of the low-frequency subband and the three high-frequency subbands obtained after denoising with the KSVD algorithm following the wavelet multi-band decomposition.
The multi-band K-SVD denoising module process is illustrated in Figure 4.
The dictionary-update loop aims to gradually optimize each atom in the dictionary. Updating each atom involves computing the current residual, selecting, and updating the relevant atom until all atoms are updated. This loop stops when all dictionary atoms have been updated. The iteration-count loop controls the number of repetitions of the entire KSVD algorithm. It executes the entire dictionary-learning process, including dictionary updating and sparse coding, until the preset maximum iteration count (max_iter) is reached. During each iteration, the algorithm evaluates the reconstruction error of the denoised image. If the error falls below the convergence threshold, the algorithm assumes convergence, and the iteration stops. Alternatively, the iteration stops if the algorithm reaches the maximum iteration count (max_iter). In this study, fewer iterations may cause non-convergence, whereas too many iterations could lead to inefficient use of computational resources. After setting various combinations of iteration counts and convergence thresholds and conducting extensive testing on the wear debris image dataset, the trends in denoising performance were evaluated under different iteration and threshold combinations. Ultimately, the maximum number of iterations was set to max_iter = 100, with the convergence threshold fixed at ε = 1 × 10 4 .
The KSVD algorithm is a powerful dictionary learning method that effectively captures the structure and features of input data through iterative optimization of the dictionary and sparse representation coefficients. Utilizing frequency subbands also reduces the computational burden of each dictionary update, as each subband operates in a lower-dimensional space. This approach accelerates the dictionary learning process. Applying KSVD to each subband separately allows the dictionary learning to better adapt to specific frequency characteristics, thereby enhancing denoising performance.

2.3. Enhancement of Edge Information

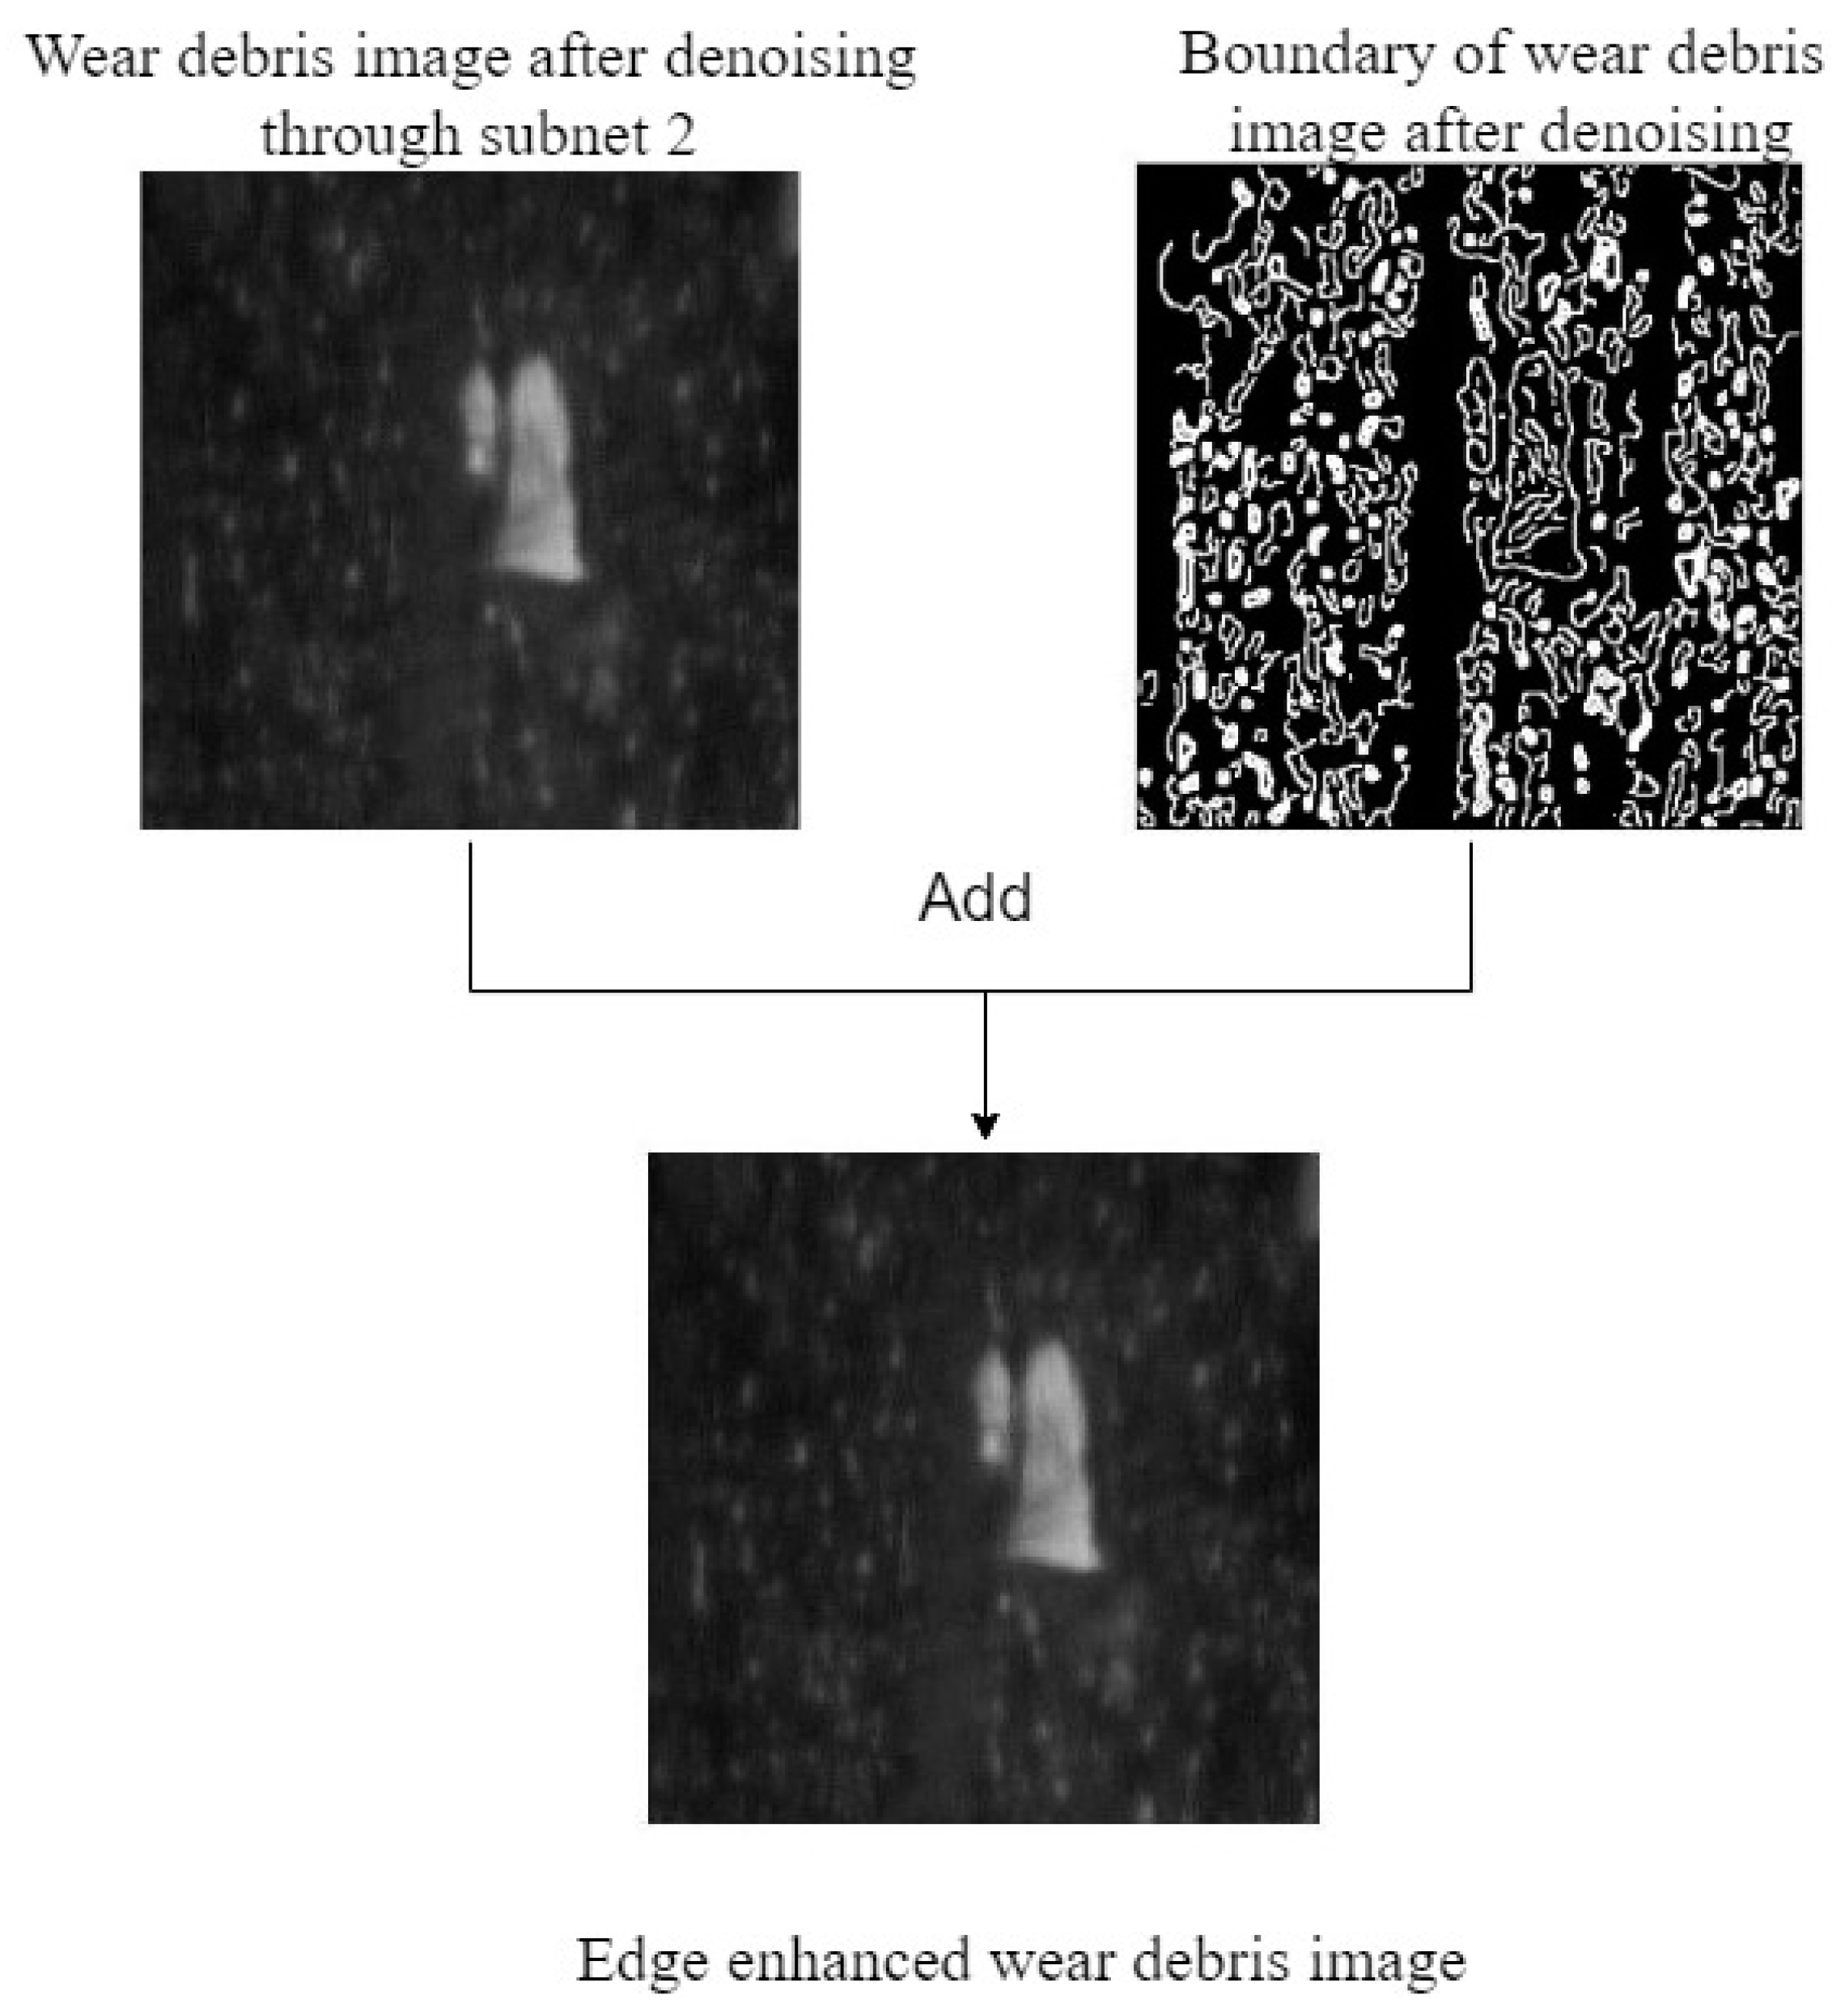
Edge information in textured images plays a crucial role in subsequent image processing tasks. Additionally, edge information is crucial for various other purposes. To enhance the image’s edge details, the Canny algorithm [28] is employed for edge detection within the edge-aware module. Subsequently, its edge information is fused with the denoised image information to strengthen the denoised image’s edge details.
Before edge detection, the image undergoes Gaussian smoothing, achieved through a linear filter derived from sampling and normalizing a two-dimensional Gaussian function, represented by the following equation:
G ( x , y ) = exp ( x 2 + y 2 2 σ 2 ) ,
S ( x , y ) = G ( x , y ) I O U T P ( x , y )
where G(x, y) denotes the Gaussian function’s value at position (x, y) in image I O U T P , which indicates the weight of that point. * signifies the convolution operation, and S(x, y) denotes the digital image smoothed by Gaussian filtering.
Subsequently, gradient calculation is performed assuming the normal direction of the image edge is θ. The gradient components gx and gy in the x and y directions of the edge can be obtained using the following formula:
{ g x = S ( x + 1 , y ) S ( x 1 , y ) 2 g y = S ( 1 , y + 1 ) S ( 1 , y 1 ) 2 ,
The gradient magnitude g θ and direction θ of the pixel point are respectively:
{ g θ = g x 2 + g y 2 θ = arctan ( g y g x ) ° ,
The subsequent step involves applying non-maximum suppression to the gradient magnitude image. This process retains only the maximum pixel value in each gradient direction and sets other pixel values to zero, thereby preserving fine lines and suppressing responses in non-edge areas. Pixels with gradient magnitudes above the high threshold are classified as strong edges, those below the low threshold as non-edges, and those in between as weak edges. Connecting weak edge pixels to strong edge pixels forms complete edges. Weak edge pixels connected to strong edges are considered part of the edge. This completes the entire process of image edge detection.
Finally, the procedure for overlaying the detected edge information onto the denoised image is articulated in Equation (4).
The value of λ is determined through experimental results and a comprehensive assessment of both subjective and objective evaluations, ensuring that when λ = 0.02 , the overlay of edge information in the image appears clear and natural.
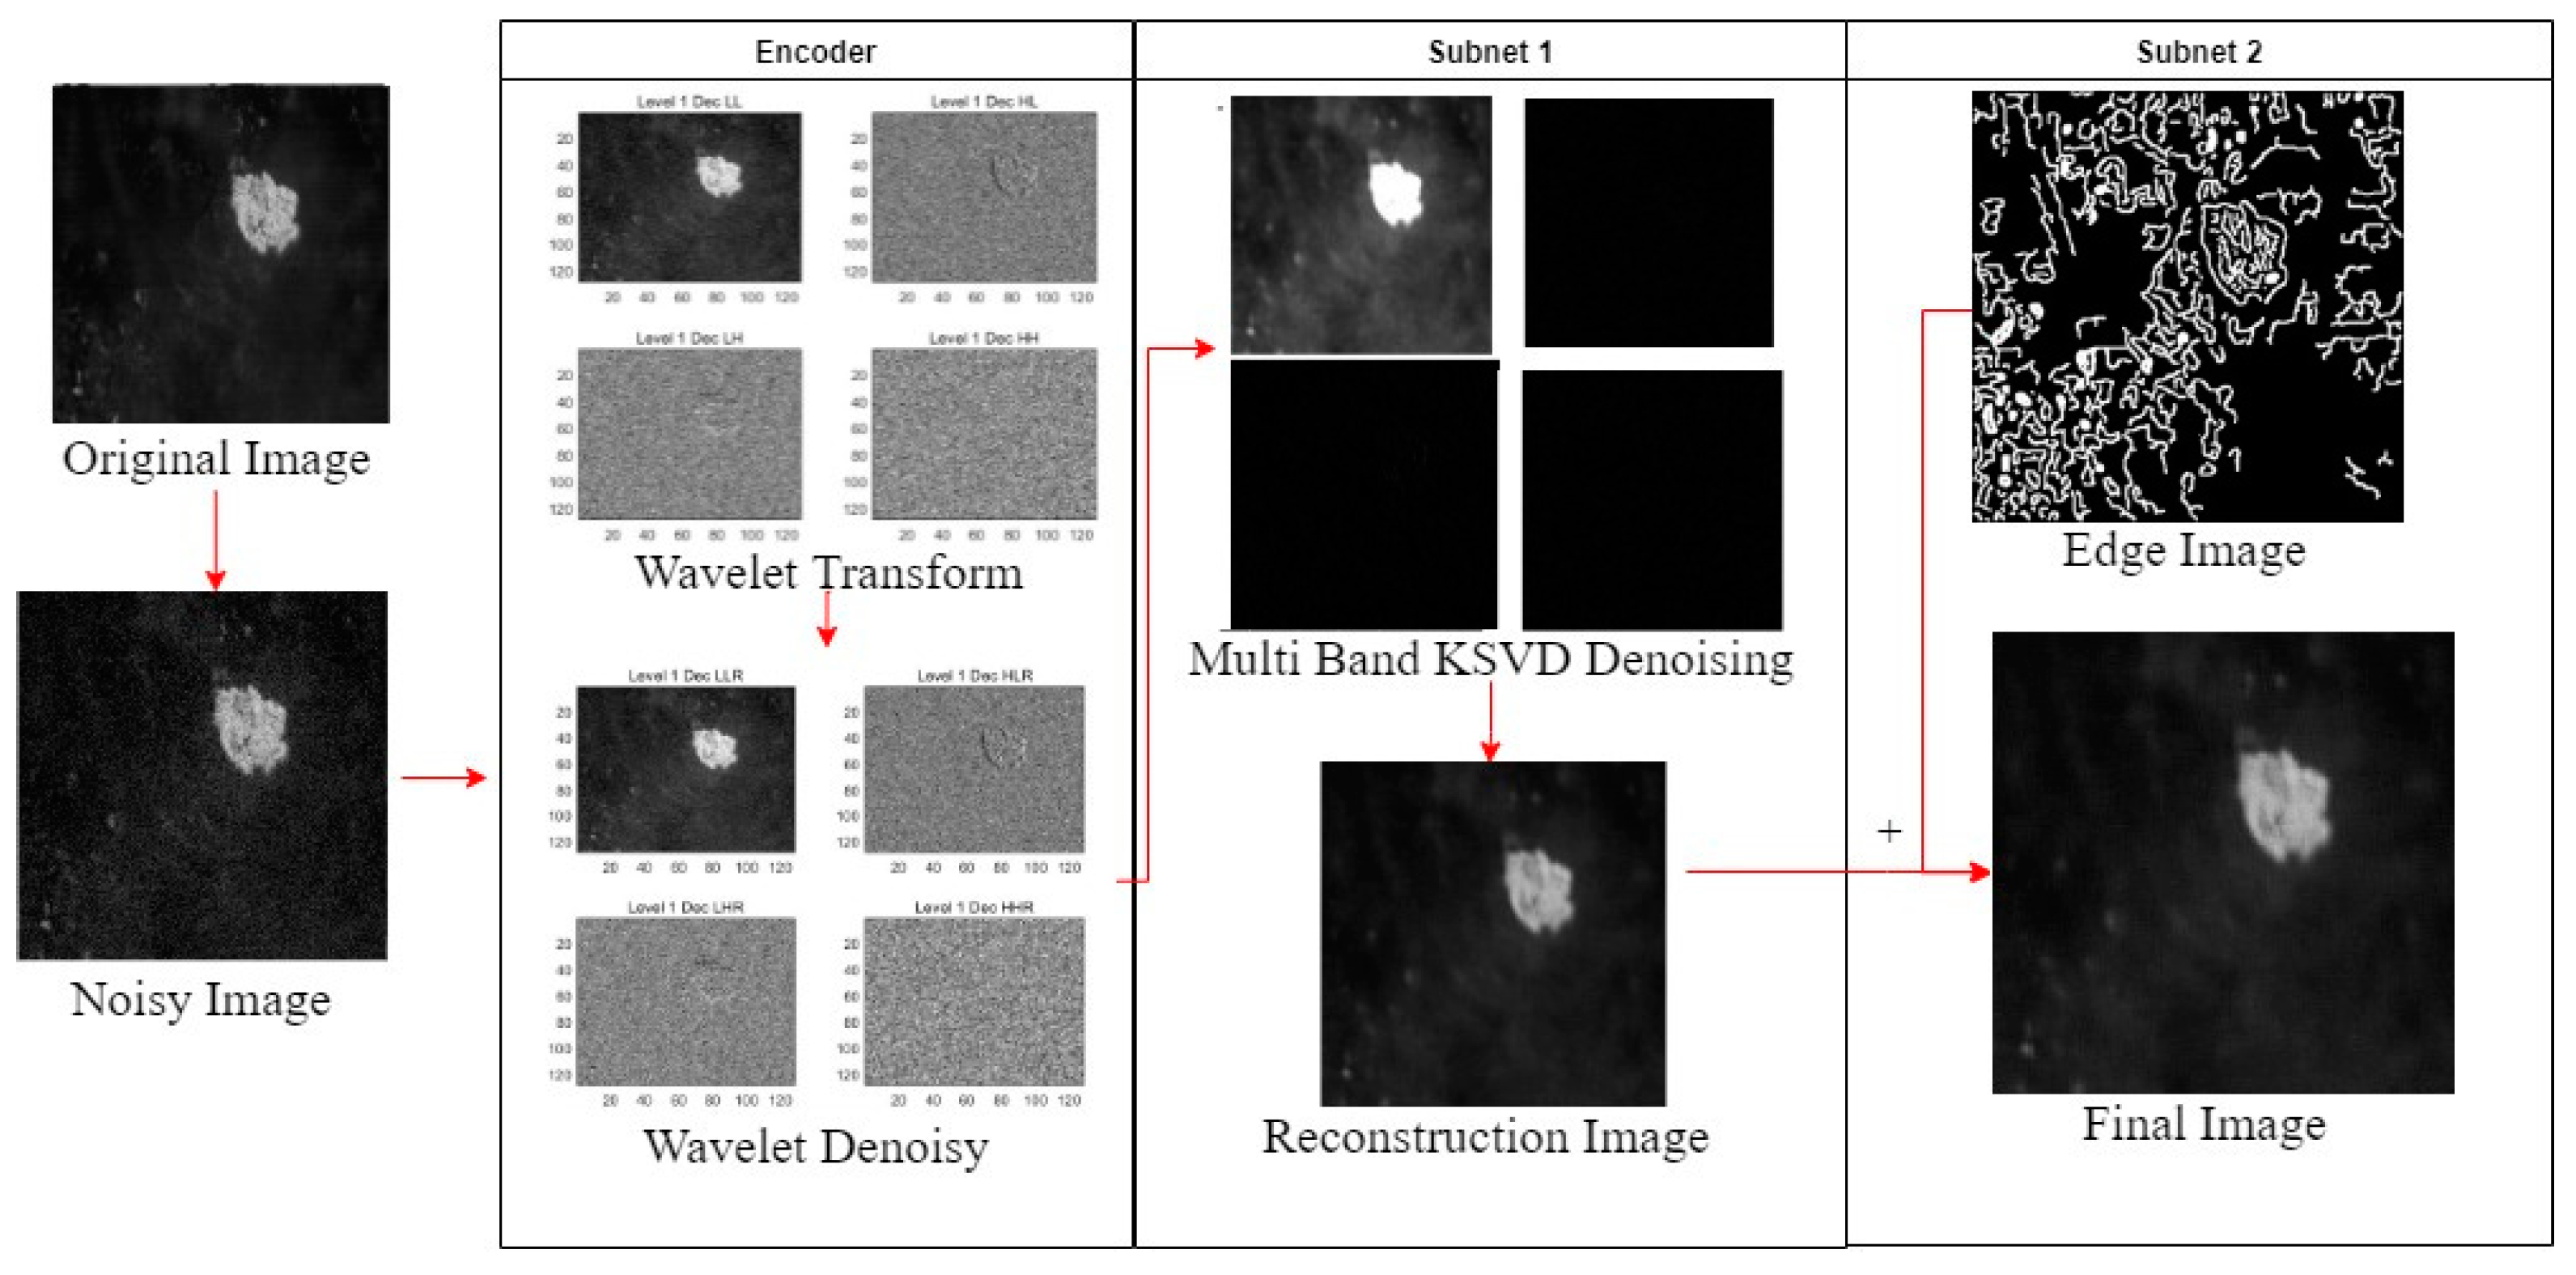
The process of image enhancement through edge perception is illustrated in Figure 5.

3. Experiment

3.1. Image Denoising Performance Evaluation Metrics

3.1.1. Visual Comparison Methods

Visual comparison in image processing analysis provides a straightforward, comprehensive, and practical assessment method that evaluates image quality through visual observation and subjective perception. Compared to objective evaluation metrics, visual comparison captures human perceptual factors that objective metrics cannot fully reflect, making it particularly important in some practical application scenarios.
Visual comparison can be conducted by providing a set of images processed with and without denoising, ensuring the comprehensiveness and practicality of the evaluation. Its strengths lie in capturing subtle changes in human perception, particularly crucial image features such as texture and color details, which make the evaluation results more comprehensive. Furthermore, the evaluation results align more closely with practical application scenarios, as the ultimate users are humans who prioritize the intuitive perception of images.
However, visual comparison methods have specific drawbacks. The results of visual comparison are influenced by individual differences and subjective factors. Different participants may have varying opinions on the same image, leading to diverse visual comparison outcomes. Additionally, conducting a visual comparison requires more time and human resources. Collecting, organizing, and analyzing evaluation data can be time-consuming and labor-intensive.

3.1.2. Objective Evaluation Methods

Visual comparison methods assess the denoising effect by comparing denoised images with original images, providing a comprehensive evaluation. However, due to its subjectivity, it is necessary to combine visual comparison with objective methods to further assess the denoising effect of images. Common objective evaluation metrics include the peak signal-to-noise ratio (PSNR) and structural similarity index (SSIM).
1.
PSNR.
PSNR is a classic metric in image quality assessment, primarily measuring the restoration quality of images. In the context of image denoising, PSNR quantifies image quality by comparing the peak signal-to-noise ratio between the original and denoised images.
PSNR provides a numerical measure by calculating the signal-to-noise ratio, allowing researchers to understand intuitively the improvement effect of denoising algorithms on images. A higher PSNR value indicates better image restoration.
Mean squared error (MSE) is a metric used to measure the average squared difference between the noisy image and the original image.
MSE = [ 1 M × N m = 0 M 1 n = 0 N 1 ( f ( m , n ) f ( m , n ) ) 2 ] ,
where M and N represent the number of rows and columns, f ( m , n ) represents the grayscale value of the point ( m , n ) in the original image, and f ^ ( m , n ) represents the grayscale value of the corresponding point in the denoised image.
Assuming that f max = max { f ( m , n ) , m = 0 , 1 , , M 1 ; n = 0 , 1 , , N 1 } ,
the PSNR of the denoised image is as follows:
PSNR = 10 log 10 [ f max 2 1 M × N m = 0 M 1 n = 0 N 1 ( f ( m , n ) f ( m , n ) ) 2 ] ,
PSNR is calculated based on the MSE and reflects the overall quality of the image by computing the average difference in pixel values. Its straightforward calculation and easy interpretation enable intuitive comparisons of results from different denoising algorithms. During the research and development process, PSNR is frequently used as a standard for preliminary screening standard for algorithm performance, and its wide applicability makes it a common tool for evaluating image denoising.
2.
SSIM.
SSIM is a full-reference image quality assessment metric that simulates human perception of images. In the field of image denoising, SSIM evaluates image quality by comprehensively considering factors such as brightness, contrast, and structure. SSIM is designed to mimic human visual perception, making its results more aligned with human judgment of image quality. A higher SSIM value typically indicates better image quality. SSIM is more sensitive to local structural changes in images, which is advantageous in applications requiring preserved image details. SSIM better reflects the uniformity and consistency of images, and for detailed images, it can provide a more accurate assessment.
The calculation formula for SSIM is as follows:
SSIM ( x , y ) = ( 2 μ x μ y + C 1 ) ( 2 σ x y + C 2 ) ( μ x 2 + μ y 2 + C 1 ) ( σ x 2 + σ y 2 + C 2 ) ,
where x and y represent the two images to be compared, typically the original image and the denoised image. μ and σ represent the mean and standard deviation respectively, σ x y represents the covariance, C 1 and C 2 are constants, and C 1 = 0.01 , C 2 = 0.02 . The higher the SSIM, the closer the value is to 1, indicating that the denoised image is closer to the ground truth and that the model exhibits a better denoising effect.
PSNR and SSIM each have their advantages and disadvantages in evaluating image denoising results. PSNR is commonly used for preliminary screening of algorithm performance due to its simplicity and ease of understanding, while SSIM comprehensively considers multiple image features and is more aligned with human visual perception, making it suitable for high-quality image scenarios. In practical applications, combining these two metrics can provide a more comprehensive and accurate evaluation of image-denoising algorithm performance.
3.
Edge preservation index (EPI) [33].
EPI = | p s ( i , j ) p s ( i 1 , i + 1 ) | | p o ( i , j ) p o ( i 1 , i + 1 ) | ,
where p s ( i , j ) is the value of the processed image pixel, p o ( i , j ) is the value of the original image pixel, the p s ( i , j ) and p o ( i , j ) are in edge areas where intensity sharply varies. i is the row number, and j is the column number. A higher EPI value indicates better preservation of the image’s edge features during the denoising process, reducing the loss of image details caused by smoothing. Thus, a higher EPI value reflects the superiority of the denoising algorithm in preserving image edge information.
Visual comparison is crucial for analyzing the effectiveness of image denoising. It provides intuitive feedback on the authenticity of denoising effects, particularly regarding detail preservation, color restoration, and overall perception. Additionally, visual comparison is critical for algorithm optimization by guiding practical applications through user feedback. As a comprehensive and intuitive method, visual comparison is irreplaceable in analyzing image processing results. By integrating objective metrics with visual comparison, we can assess image processing algorithms more comprehensively and accurately, strongly supporting the further development of image processing technology.

3.2. Experimental Details Information

Wear debris image processing technology is extensively employed for fault diagnosis and health monitoring in mechanical equipment. For instance, it can monitor wind turbine gearboxes to assess wear using wear debris image processing technology. Ferrographic testing is commonly used in fault diagnosis and health monitoring, involving the deposition of ferromagnetic particles on slides by magnetic fields for observation under a microscope. The advantage of offline ferrography lies in its ability to selectively observe ferromagnetic particles under a magnetic field, without interference from copper particles generated during wear. Moreover, wear debris forms chains under the magnetic field, aiding in the observation and study of large wear debris in oil samples. This paper analyzes experimental images collected by a ferrograph to validate the superiority of the proposed image processing algorithm over existing methods.
The wear debris image dataset used in this study comprises 30 images and was obtained from oil samples collected during the running-in, normal wear, and severe wear periods of gearboxes using the FM-III analyzer produced by PREDICT Corporation, Washington, DC, USA. Specific experimental data parameters are provided in the accompanying Table 1.
To demonstrate the universality of the proposed image denoising algorithm, experiments were conducted to compare its results with those of commonly used image denoising validation images, specifically processing wear debris images for denoising. This experiment was conducted using MATLAB 2023. Before experimenting, we ensured the installation of the “Wavelet Toolbox”, “Image Processing Toolbox”, and “Statistics and Machine Learning Toolbox”.

3.3. Visual Comparison of Image Denoising Effectiveness

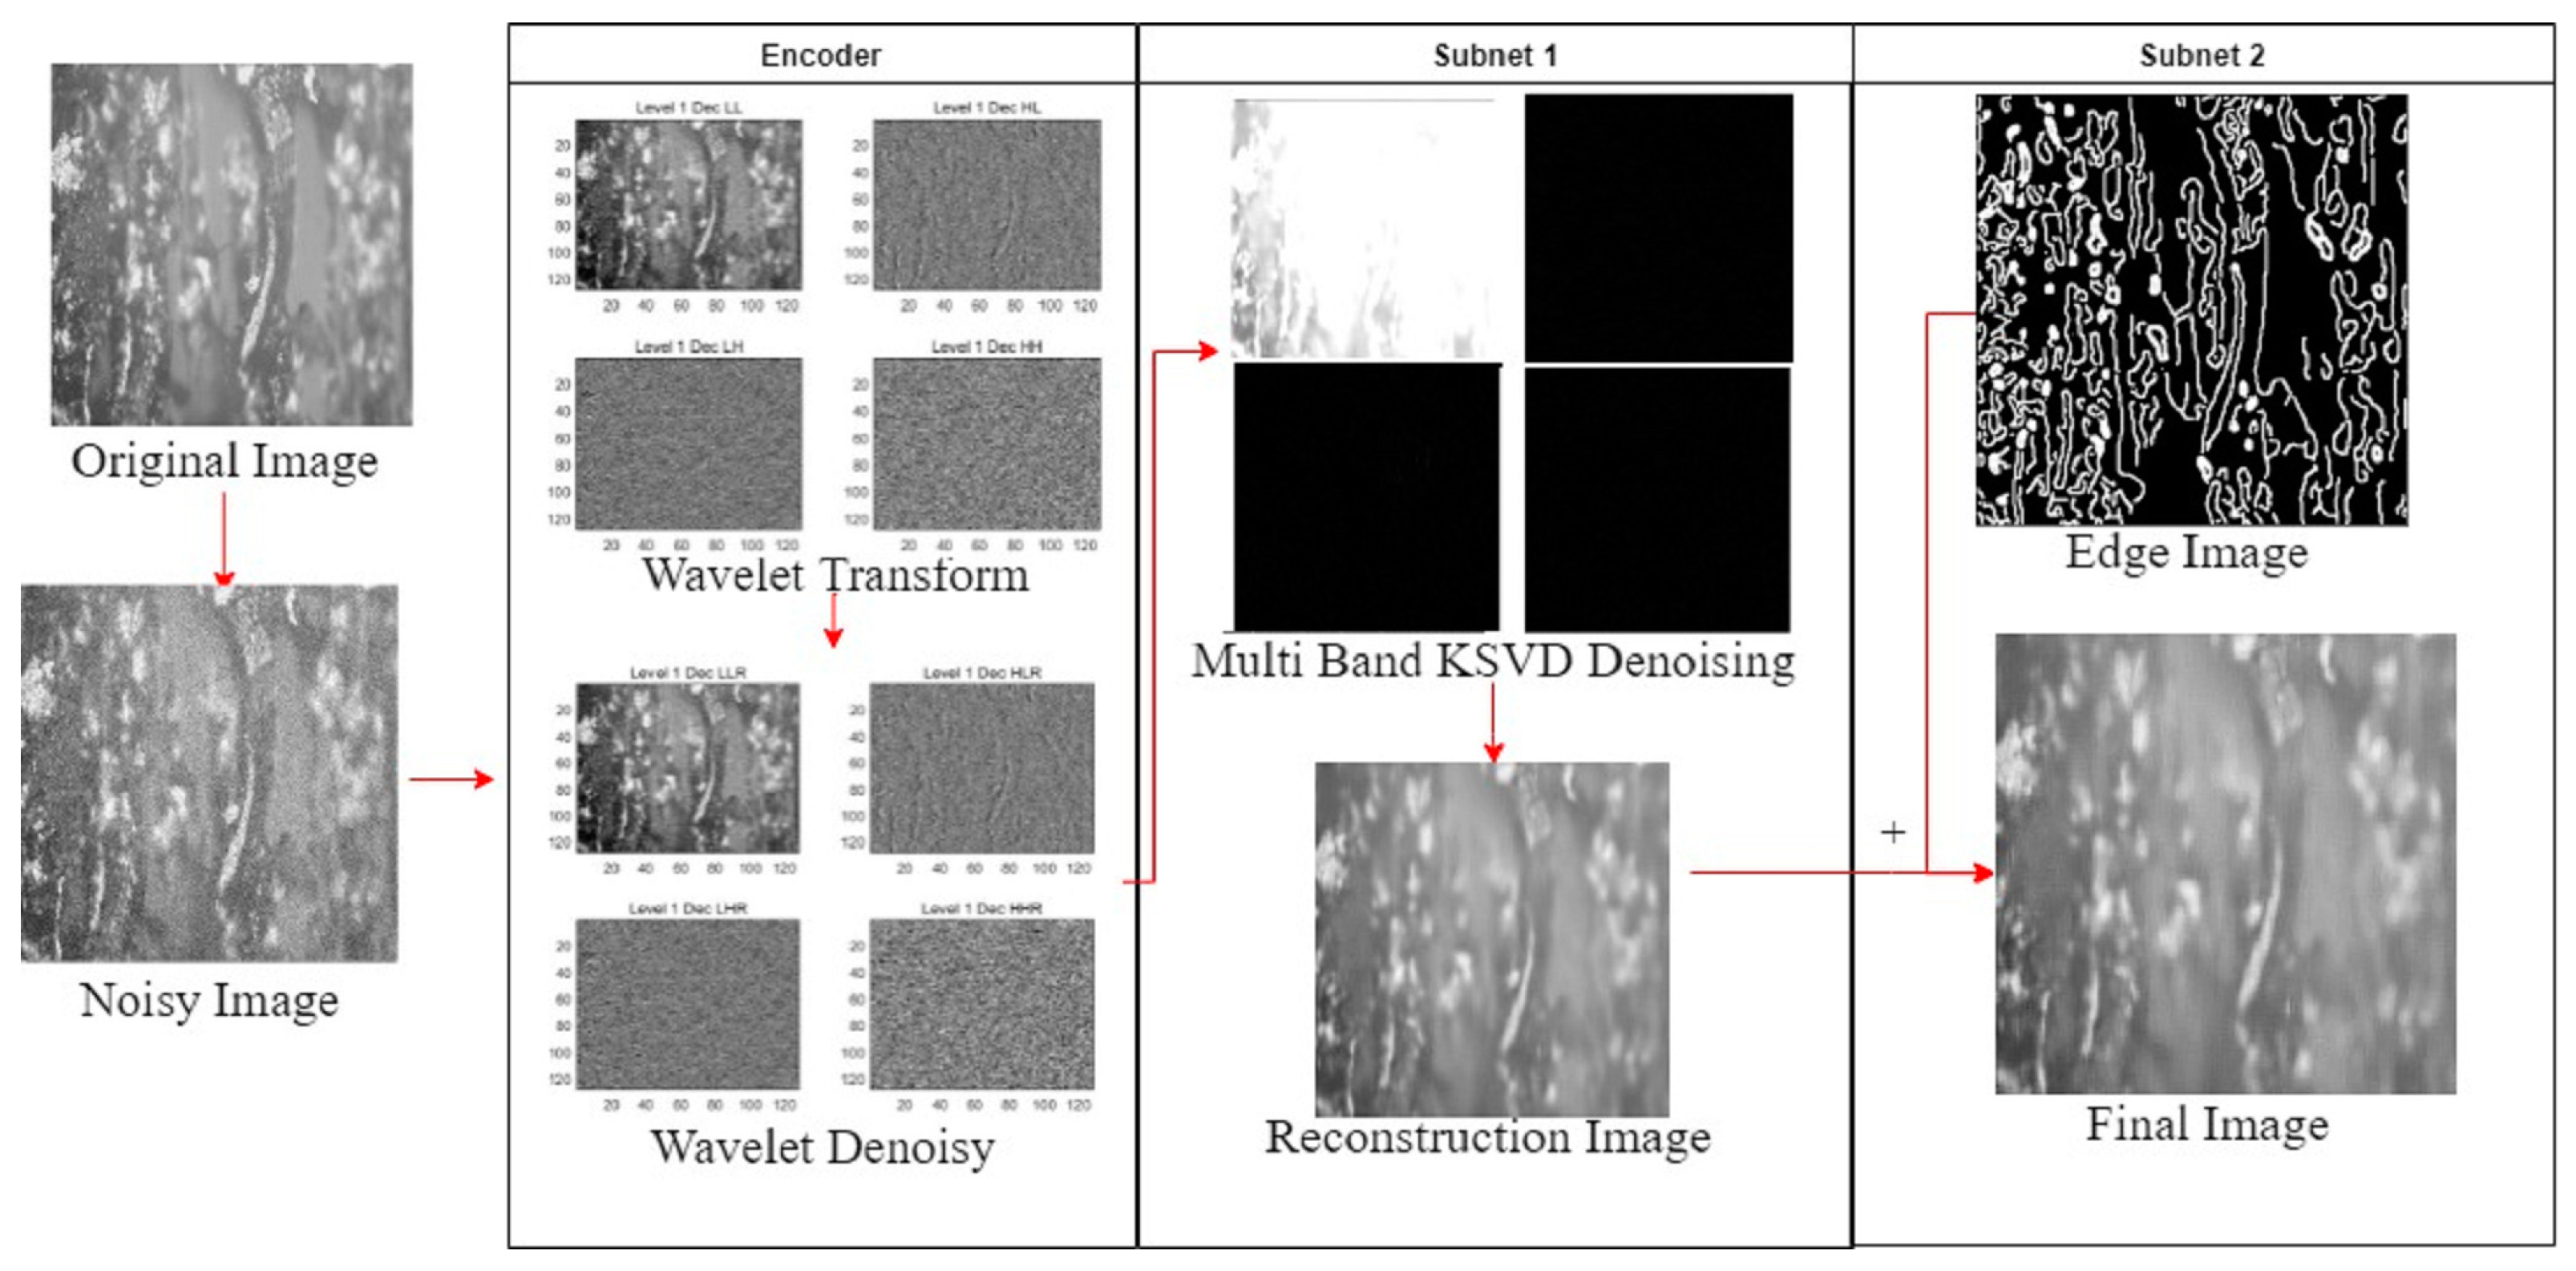
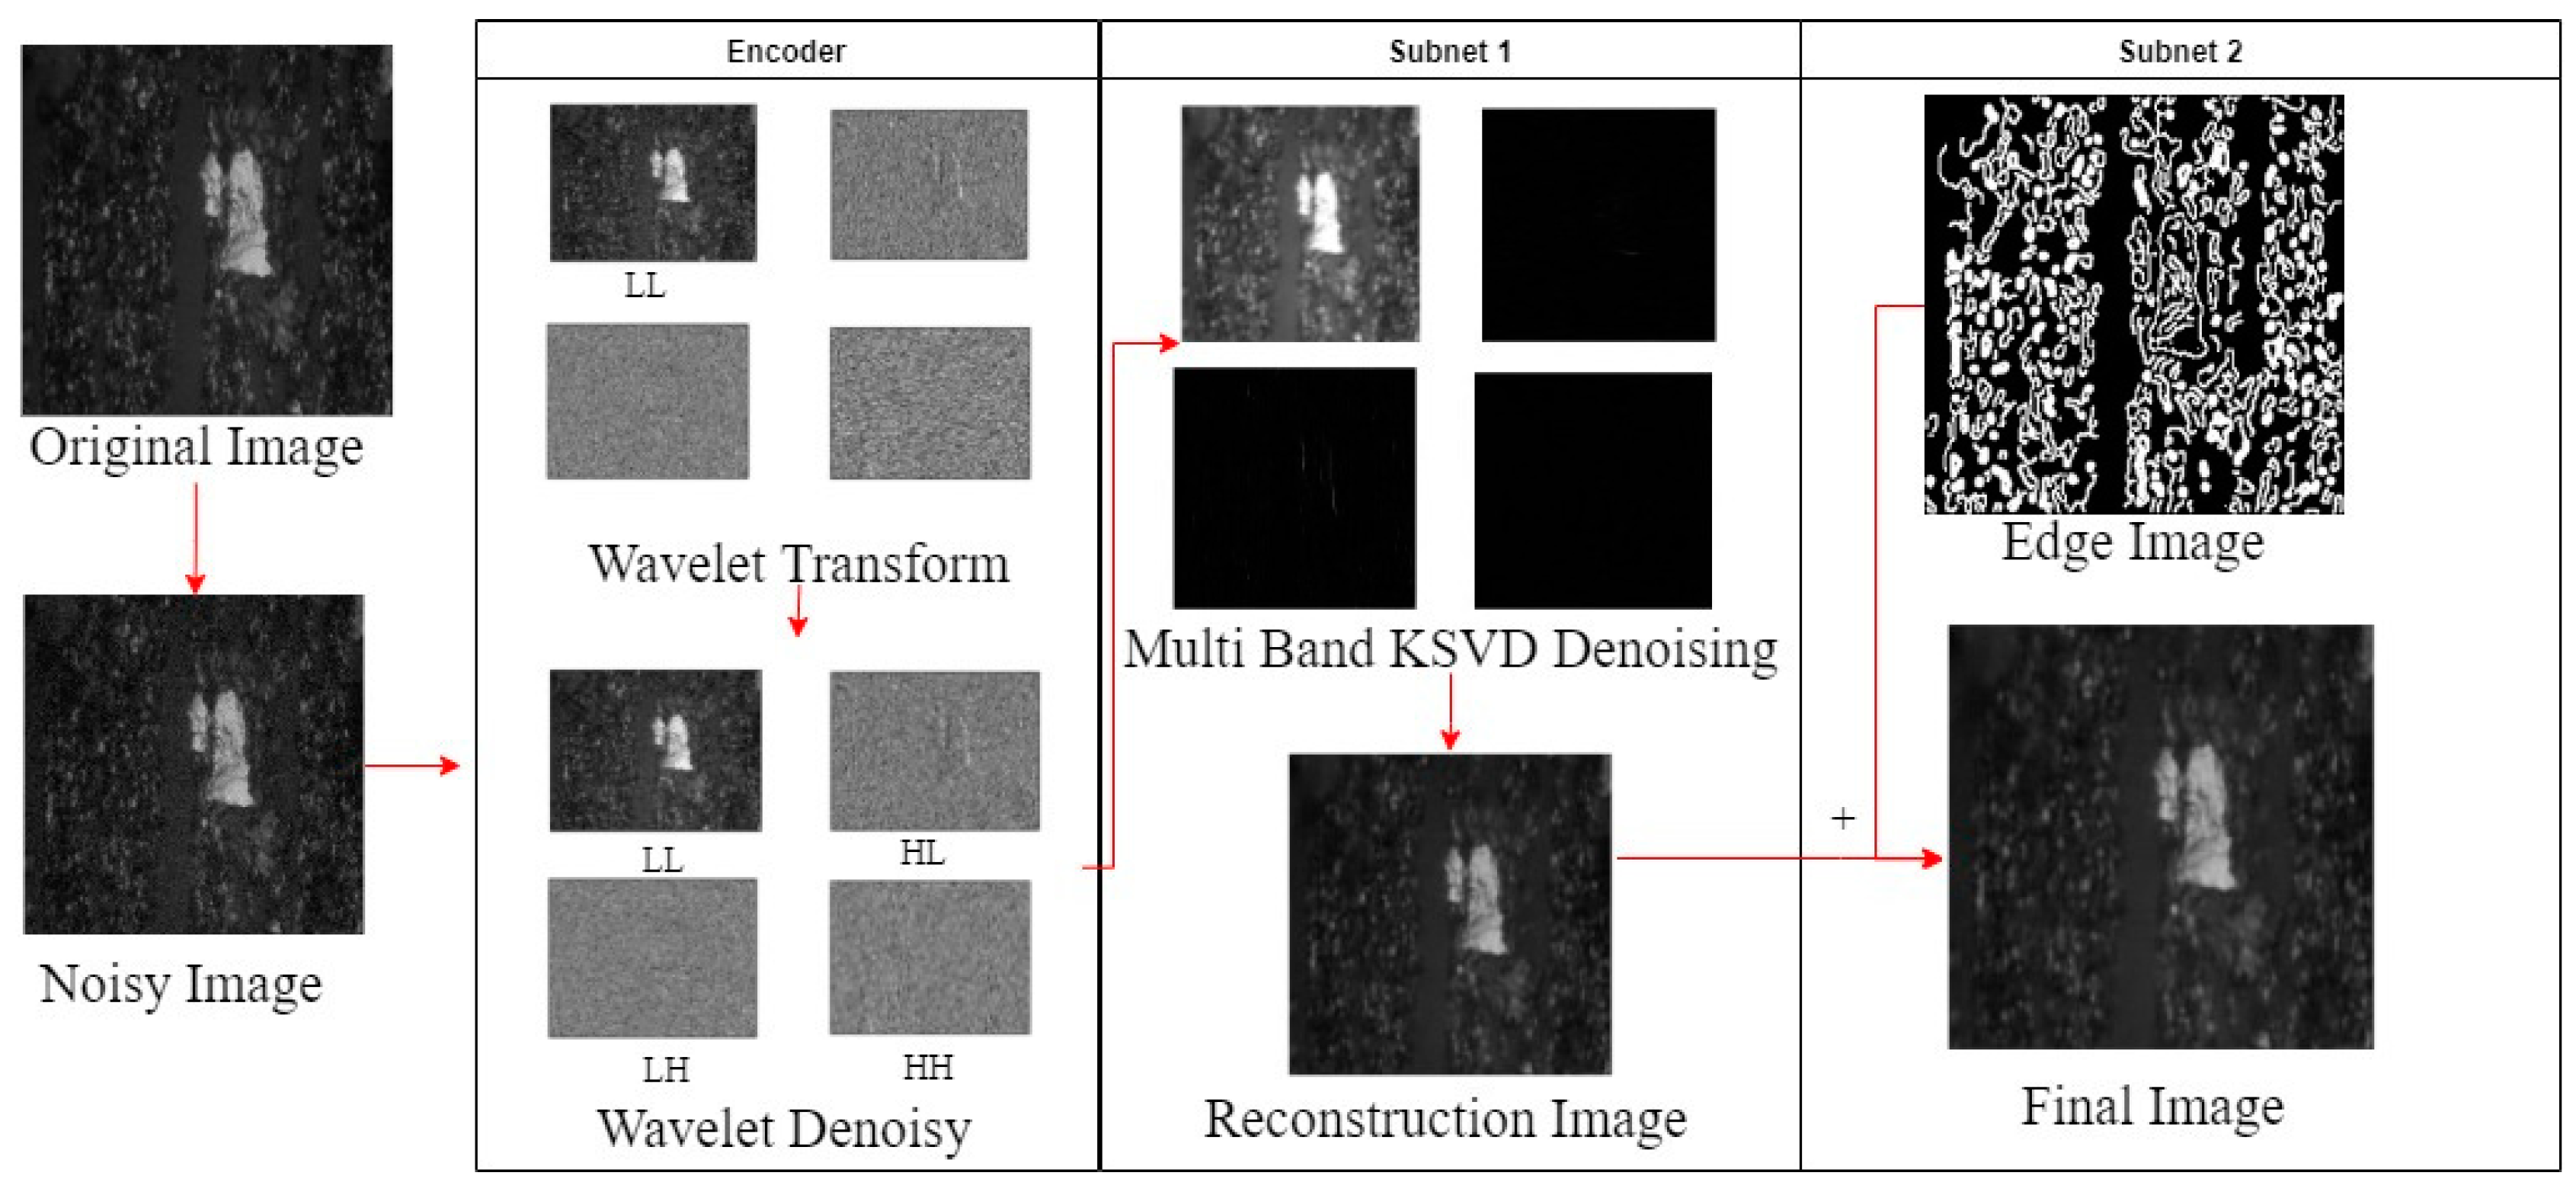
To facilitate quantitative analysis and comparison of image denoising algorithms, random noise must be initially added to the original image. During the encoding stage of this study, a specific level ( σ = 15 ) of additive Gaussian noise was introduced to a 256 × 256 wear debris image to evaluate its denoising performance against synthetic noise. The noisy image will undergo two-dimensional discrete wavelet decomposition, splitting it into four sub-bands of high and low frequencies, thereby separating high-frequency and low-frequency signals to enhance denoising performance. This process prevents information loss typically caused by downsampling. After second-order decomposition, reconstruction diminishes high-frequency noise and streamlines subsequent image processing operations. Next, the KSVD algorithm will denoise each sub-band of the initially reconstructed image, addressing the complexity of KSVD operations and enhancing denoising efficiency. The reconstructed image is derived using a discrete wavelet transform. However, this process compromises boundary information. Therefore, additional optimization was conducted on the reconstructed image’s boundaries, enhancing them using an improved Canny algorithm with edge detection coefficients. This results in a final denoised image with improved boundary information. Figure 6, Figure 7 and Figure 8 illustrate the specific outcomes of the image denoising process.
The results in Figure 6, Figure 7 and Figure 8 demonstrate that the denoising algorithm proposed in this paper shows significant denoising effects from a visual comparison. Furthermore, it effectively preserves image details and texture information, alongside maintaining edge details.
To validate the effectiveness of the proposed algorithm against others, this study compares it with four common image denoising algorithms: The wavelet and VMD-based optimization denoising model (WVBOD) [22], two-dimensional variational mode decomposition (2D-VMD) [34], BM3D [35], wavelet analysis [17], KSVD [14], adaptive clustering and progressive thresholding (ACPT) [36], a blind pixel-level non-local method (NLH) [37], and W-KSVD-EDGE algorithm. These results are depicted in Figure 9.
Wavelet analysis, another type of wavelet transform method, is widely utilized in image denoising. Figure 9b demonstrates the effect of the wavelet denoising algorithm. Wavelet analysis effectively reduces noise in the image while preserving its main structure, although it may lead to image blur and loss of some edge information.
Two-dimensional variational mode decomposition (2D-VMD) is an image denoising algorithm that utilizes variational mode decomposition. Figure 9c illustrates the denoising effect achieved by 2D-VMD. In comparison to wavelet denoising algorithms, 2D-VMD excels in capturing modal features in the image, thereby reducing noise influence, albeit potentially resulting in a slightly smoother appearance in some details. Consequently, when handling non-smooth image structures, 2D-VMD may sacrifice detailed information, leading to an overly smooth image appearance.
The block-matching and 3D filtering (BM3D) algorithm employs block processing and 3D transformation, exhibiting high computational efficiency, particularly effective under Gaussian noise and white noise, as demonstrated in Figure 9d. However, when handling images with complex structures or textures such as wear debris images, the BM3D algorithm often struggles to preserve details effectively or produces inferior results, exhibiting a notably weaker denoising effect compared to the algorithm proposed in this paper.
The ACPT algorithm can adaptively adjust denoising parameters based on image content, significantly improving image quality, especially in low signal-to-noise ratio conditions. However, for certain types of noise, such as periodic or structured noise, the ACPT algorithm’s denoising performance may be less effective compared to algorithms specifically designed for these types of noise. Figure 9e illustrates the denoising effect achieved by the ACPT algorithm. While ACPT can smooth the image, it may lead to a loss of image details in certain cases. It may not effectively address large-scale noise and fine structures in the image. Additionally, when confronted with continuous noise (such as Gaussian noise), it can result in image softening and loss of detail.
The image denoising results of the NLH algorithm, as shown in Figure 9f, effectively leverage the image’s non-local self-similarity to reduce random noise interference and demonstrate a strong ability to preserve image detail information. However, when dealing with weak edges in the image, it often excessively smooths out these finer features.
As shown in Figure 9g, the WVBOD denoising algorithm effectively mitigates certain noise from the wear debris image, yet demonstrates inadequate preservation of texture information and edge details.
The algorithm proposed in this paper employs wavelet decomposition to achieve a good balance in detail preservation by denoising the image after dividing it into four sub-band images, thus avoiding the slight inferiority of the KSVD algorithm in handling textures in complex images. It effectively removes image noise while preserving edge texture details and maintaining image smoothness. As shown in Figure 9h, the denoising effect is significantly better than that of other algorithms, demonstrating the effectiveness of the proposed image denoising algorithm.
To verify the effectiveness of the proposed image denoising algorithm in removing noise from both noisy and regular real-world images, we also applied it to common real-world images and classic photographer images in the dataset for visual comparison. The results are presented in Figure 10 and Figure 11.
Figure 10 and Figure 11 show that 2D-VMD can partially remove noise from the image, but noticeable noise residue remains, and some details are lost. Wavelet analysis can remove noise but causes the image to appear slightly blurred. Direct application of the BM3D algorithm takes a long computation time and results in significantly poorer denoising effects. ACPT performs well in removing salt-and-pepper noise but is not thorough, leaving residual noise. The NLH algorithm tends to over-smooth weak edge details in the image. The WVBOD algorithm demonstrates inadequate performance in preserving detailed image information. The proposed algorithm exhibits significantly better denoising effects on regular real-world images compared to other algorithms, demonstrating its notable effectiveness.

3.4. Objective Evaluation

In the numerical analysis section, we will conduct a detailed comparison of the average PSNR, SSIM, and EPI results for various algorithms applied to the image dataset at different noise levels. For objective evaluation, random noise with different levels (σ = 15, 25, 50) will be added to grayscale images after converting them from the original images.
Different denoising methods were applied to wear debris images under various noise conditions, and the objective evaluation results are presented in Table 2.
Various denoising methods were applied to real images under different noise conditions, and the objective evaluation results are displayed in Table 3.
As shown in Table 2, under noise conditions with σ = 15 , the SSIM and EPI values of the proposed algorithm are significantly superior to those of other algorithms. Although its PSNR value is marginally lower than that of the BM3D algorithm, the SSIM value is notably higher. In conjunction with visual comparison between the two algorithms, this further demonstrates that the proposed algorithm excels in preserving structural details and boundary information in wear debris images compared to BM3D. Under noise conditions with σ = 25 , the SSIM value of the proposed algorithm remains significantly better than those of other algorithms. Although the PSNR value is marginally lower than that of BM3D, the SSIM and EPI values of the proposed algorithm are notably superior, indicating enhanced preservation of texture details and boundary information in wear debris images. As wear debris image research prioritizes the preservation of detailed texture and boundary information, the proposed algorithm better satisfies the analytical requirements for wear debris images. When comparing EPI values, the proposed algorithm’s EPI value is lower than that of the ACPT algorithm. However, under these noise conditions, the PSNR and SSIM values of the ACPT algorithm for wear debris images are significantly lower than those of the proposed algorithm. Thus, although the ACPT algorithm preserves boundaries marginally better under these conditions, its overall denoising performance is clearly inferior to the proposed algorithm. Similarly, under noise conditions with σ = 50 , the proposed algorithm demonstrates superior denoising performance compared to other algorithms. Although the wavelet algorithm exhibits a higher EPI value regarding boundary preservation, the PSNR and SSIM values show that, despite better boundary retention, its denoising ability is clearly inferior to that of the proposed algorithm. In summary, the proposed W-KSVD-EDGE algorithm offers superior denoising for wear debris images while simultaneously ensuring superior preservation of surface texture details and boundary information.
Table 3 shows the parameter values for the real image dataset. Similar to Table 2, Table 3 indicates that under noise conditions with σ = 15 and σ = 50 , the proposed denoising algorithm performs significantly better in terms of numerical values compared to other algorithms. Although under noise conditions with σ = 25 , the PSNR value of the proposed algorithm is marginally lower than that of the BM3D algorithm, and the SSIM value of the proposed algorithm is more than double that of BM3D. As SSIM primarily emphasizes the preservation of structural information, this demonstrates that the proposed algorithm excels in retaining crucial image information. This further demonstrates that in real image denoising, the proposed algorithm achieves more substantial improvements in both denoising and the preservation of structural information.

4. Conclusions

4.1. Summary of Conclusions

This paper primarily focuses on researching and exploring techniques for processing textured images.
First, this paper proposes the (W-KSVD-EDGE algorithm for preprocessing textured images. This denoising technique effectively removes noise, improves image quality, enhances features, and provides robust data support for subsequent feature extraction tasks, such as IPCA (index of particle covered area) and PBR (particle big ratio), among others. Furthermore, in the experimental application of textured image processing techniques, a comparative analysis of various methods was conducted. The results indicate that the proposed denoising technique, which combines multi-band and KSVD, effectively enhances the processing of textured images.

4.2. Future Research Directions and Prospects

The research findings of this paper provide valuable insights for enhancing and applying textured image processing techniques. However, there are still some limitations and challenges. Future research directions and prospects include improving the accuracy and robustness of textured image preprocessing techniques to adapt to more complex operating environments, as well as developing techniques based on deep learning and artificial intelligence to enhance the automation and intelligence of the process.

Author Contributions

Conceptualization, Y.-C.K.; methodology, C.X.; software, H.Z.; validation, H.Z.; formal analysis, H.Z. and Y.-C.K.; investigation, C.X.; resources, H.Z.; data curation, H.Z.; writing—original draft preparation, H.Z.; writing—review and editing, H.Z.; visualization, H.Z.; supervision, H.Z. All authors have read and agreed to the published version of the manuscript.

Funding

This research received no external funding.

Data Availability Statement

Data can be made available upon request from the authors.

Conflicts of Interest

The authors declare no conflicts of interest.

References

  1. Bhattacharya, A.; Dan, P.K. Recent trend in condition monitoring for equipment fault diagnosis. Int. J. Syst. Assur. Eng. Manag. 2014, 5, 230–244. [Google Scholar] [CrossRef]
  2. Peng, P.; Chen, L.; Wang, J.; Chen, F. A Review on Detection Technology of Mechanical Wear. Lubr. Eng. 2018, 43, 115–124. [Google Scholar]
  3. Scott, D.; Seifert, W.W.; Westcott, V.C. Ferrography-an advanced design aid for the 80’s. Wear 1975, 34, 251–260. [Google Scholar] [CrossRef]
  4. Wu, H.; Li, R.; Kwok, N.M.; Peng, Y.; Wu, T.; Peng, Z. Restoration of low-informative image for robust debris shape measurement in on-line wear debris monitoring. Mech. Syst. Signal Process. 2019, 114, 539–555. [Google Scholar] [CrossRef]
  5. More, P.P.; Jaybhaye, M.D. Wear Pattern and Debris Analysis in Gearbox System. J. Fail. Anal. Prev. 2021, 21, 1697–1703. [Google Scholar] [CrossRef]
  6. Dai, X.; Wang, Y.; Yu, S. Ferrographic analysis of pivot jewel bearing in oil-bath lubrication. Wear 2017, 376–377, 843–850. [Google Scholar] [CrossRef]
  7. Hong, H.; Liang, M. A fractional calculus technique for on-line detection of oil debris. Meas. Sci. Technol. 2008, 19, 055703. [Google Scholar] [CrossRef]
  8. Zhi, Z.; Wang, S.; Wei, H.; Tomovic, M. Aliasing signal separation of oil debris monitoring. In Proceedings of the 2016 IEEE 11th Conference on Industrial Electronics and Applications (ICIEA), Hefei, China, 5–7 June 2016; IEEE: Piscataway, NJ, USA, 2016. [Google Scholar]
  9. Li, Y.; Zhang, P.; Xu, C.; Zhang, Y.; Li, L. An improved online de-noising method for Ultrasonic echo signal of wear debris in oil. In Proceedings of the International Conference on Information Technology and Management Innovation 2014, Singapore, 23–25 September 2014. [Google Scholar]
  10. Hubel, D.H.; Wiesel, T.N. Receptive fields of single neurones in the cat’s striate cortex. J. Physiol. 1959, 148, 574–591. [Google Scholar] [CrossRef]
  11. Aharon, M.; Elad, M.; Bruckstein, A. K-SVD: An Algorithm for Designing Overcomplete Dictionaries for Sparse Representation. IEEE Trans. Signal Process. 2006, 54, 4311–4322. [Google Scholar] [CrossRef]
  12. Tropp, A.; Wright, S.J. Computational methods for sparse solution of linear inverse problems. Proc. IEEE 2010, 98, 948–958. [Google Scholar] [CrossRef]
  13. Elad, M.; Aharon, M. Image denoising via sparse and redundant representations over learned dictionaries. IEEE Trans. Image Process. 2006, 15, 3736–3745. [Google Scholar] [CrossRef] [PubMed]
  14. Farouk, R.M.; Elsayed, M.; Aly, M. Medical Image Denoising based on Log-Gabor Wavelet Dictionary and K-SVD Algorithm. Int. J. Comput. Appl. 2016, 141, 27–32. [Google Scholar] [CrossRef]
  15. Chen, R.; Pu, D.; Tong, Y.; Wu, M. Image-denoising algorithm based on improved K-singular value decomposition and atom optimization. CAAI Trans. Intell. Technol. 2021, 7, 117–127. [Google Scholar] [CrossRef]
  16. Shensa, M.J. The discrete wavelet transform: Wedding the a trous and Mallat algorithms. IEEE Trans Signal Process. 1992, 40, 2464–2482. [Google Scholar] [CrossRef]
  17. Wang, L.; Li, X.; Qin, J. Cascade discrete wavelet multi-band decomposition attention image denoising method. Appl. Res. Comput. 2024, 41, 288–295. [Google Scholar]
  18. Khmag, A.; Ramli, A.R.; Al-Haddad, S.A.R.; Hashim, S.J.; Noh, Z.M.; Najih, A.A.M. Design of Natural Image Denoising Filter Based on Second-Generation Wavelet Transformation and Principle Component Analysis. J. Med. Imaging Health Inform. 2015, 5, 1261–1266. [Google Scholar] [CrossRef]
  19. Wu, D.; Zhang, H.; Nie, F.; Wang, R.; Yang, C.; Jia, X.; Li, X. Double-attentive principle component analysis. IEEE Signal Process. Lett. 2020, 27, 1814–1818. [Google Scholar] [CrossRef]
  20. Guhathakurta, R. Denoising of image: A wavelet based approach. In Proceedings of the 2017 8th Annual Industrial Automation and Electromechanical Engineering Conference (IEMECON), Bangkok, Thailand, 16–18 August 2017; pp. 194–197. [Google Scholar]
  21. Duan, Y.; Liu, F.; Jiao, L.; Zhao, P.; Zhang, L. SAR image segmentation based on convolutional-wavelet neural network and Markov random field. Pattern Recognit. 2017, 64, 255–267. [Google Scholar] [CrossRef]
  22. Cao, W.; Yan, J.; Jin, Z.; Han, Z.; Zhang, H.; Qu, J.; Zhang, M. Image denoising and feature extraction of wear debris for online monitoring of planetary gearboxes. IEEE Access 2021, 9, 168937–168952. [Google Scholar] [CrossRef]
  23. Neshatavar, R.; Yavartanoo, M.; Son, S.; Lee, K.M. CVF-SID: Cyclic multi-Variate Function for Self-Supervised Image Denoising by Disentangling Noise from Image. arXiv 2022. [Google Scholar] [CrossRef]
  24. Chen, H.; Gu, J.; Liu, Y.; Magid, S.A.; Dong, C.; Wang, Q.; Pfister, H.; Zhu, L. Masked Image Training for Generalizable Deep Image Denoising. In Proceedings of the 2023 IEEE/CVF Conference on Computer Vision and Pattern Recognition (CVPR), Vancouver, BC, Canada, 17–24 June 2023. [Google Scholar] [CrossRef]
  25. Han, L.; Zhao, Y.; Lv, H.; Zhang, Y.; Liu, H.; Bi, G. Remote sensing image denoising based on deep and shallow feature fusion and attention mechanism. Remote Sens. 2022, 14, 1243. [Google Scholar] [CrossRef]
  26. Liu, Y.; Qin, Z.; Anwar, S.; Ji, P.; Kim, D.; Caldwell, S.; Gedeon, T. Invertible Denoising Network: A Light Solution for Real Noise Removal. arXiv 2021. [Google Scholar] [CrossRef]
  27. Zamir, S.W.; Arora, A.; Khan, S.; Hayat, M.; Khan, F.S.; Yang, M.H.; Shao, L. Learning enriched features for fast image restoration and enhancement. IEEE Trans. Pattern Anal. Mach. Intell. 2022, 45, 1934–1948. [Google Scholar] [CrossRef] [PubMed]
  28. Canny, J. A computational approach to edge detection. IEEE Trans. Pattern Anal. Ma-Chine Intell. 1986, 8, 679–698. [Google Scholar] [CrossRef]
  29. Zhu, X.; Tang, M.; Zhang, K.; Wang, Q. Image detection method based on improved Canny algorithm. In Proceedings of the 2021 40th Chinese Control Conference (CCC), Shanghai, China, 26–28 July 2021; pp. 7033–7039. [Google Scholar]
  30. Pang, T.; Zheng, H.; Quan, Y.; Ji, H. Recorrupted-to-recorrupted: Unsupervised deep learning for image denoising. In Proceedings of the IEEE/CVF Conference on Computer Vision and Pattern Recognition, Nashville, TN, USA, 20–25 June 2021. [Google Scholar]
  31. Schmid-Schickhardt, D. Adaptive Canny Edge Detection: Hysteresis Thresholds with Deep Learning. Bachelor’s Thesis, Radboud University, Nijmegen, Germany, 2021. [Google Scholar]
  32. Choi, K.H.; Ha, J.E. An adaptive threshold for the Canny edge with actor-critic algorithm. IEEE Access 2023, 11, 67058–67069. [Google Scholar] [CrossRef]
  33. Chumning, H.; Huadong, G.; Changlin, W. Edge preservation evaluation of digital speckle filters. In Proceedings of the IEEE International Geoscience & Remote Sensing Symposium IEEE 2002, Toronto, ON, Canada, 24–28 June 2002. [Google Scholar]
  34. Dragomiretskiy, K.; Zosso, D. Two-Dimensional Variational Mode Decomposition. In Energy Minimization Methods in Computer Vision and Pattern Recognition; Springer: Cham, Switzerland, 2015. [Google Scholar] [CrossRef]
  35. Dabov, K.; Foi, A.; Katkovnik, V.; Egiazarian, K. Image denoising with block-matching and 3D filtering//Image Processing: Algorithms and Systems, Neural Networks, and Machine Learning. Int. Soc. Opt. Photonics 2006, 6064, 354–365. [Google Scholar] [CrossRef]
  36. Zhao, W.; Lv, Y.; Liu, Q.; Qin, B. Detail-Preserving Image Denoising via Adaptive Clustering and Progressive PCA Thresholding. IEEE Access 2018, 6, 6303–6315. [Google Scholar] [CrossRef]
  37. Hou, Y.; Xu, J.; Liu, M.; Liu, G.; Liu, L.; Zhu, F.; Shao, L. Nlh: A blind pixel-level non-local method for real-world image denoising. IEEE Trans. Image Process. 2020, 29, 5121–5135. [Google Scholar] [CrossRef]
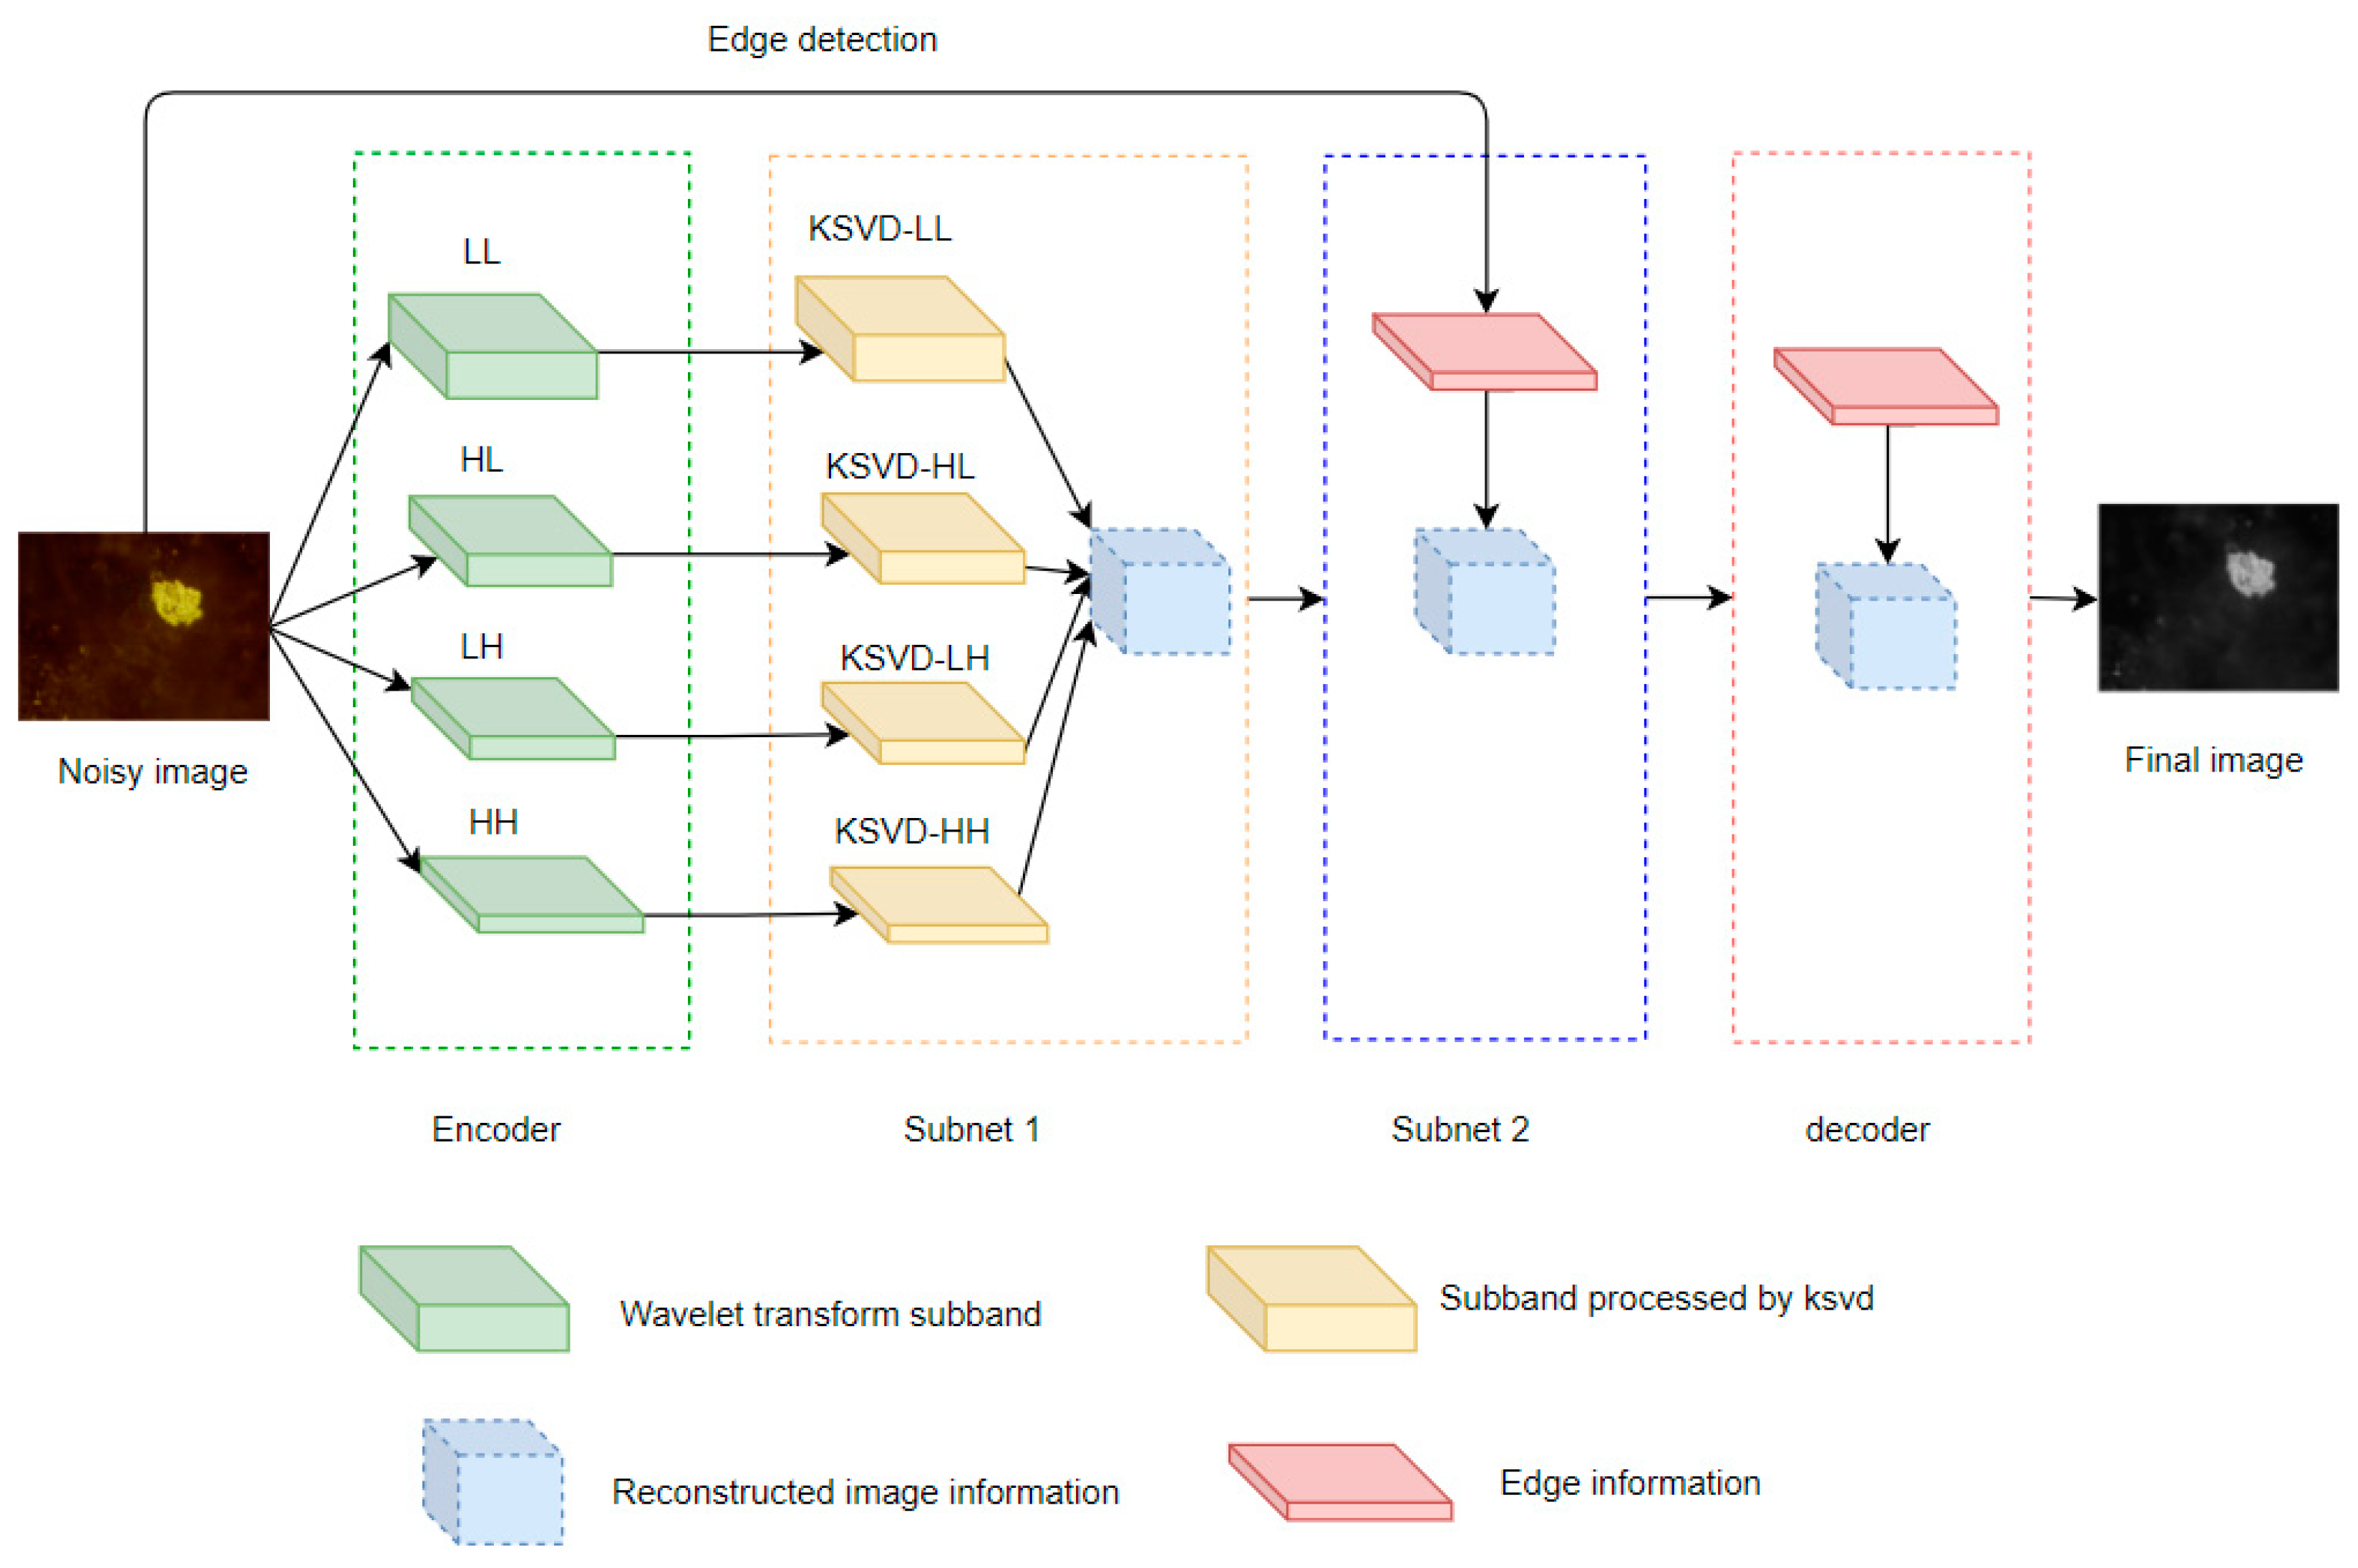
Figure 1. The overall network structure of the image denoising algorithm proposed in this paper.
Machines 12 00672 g001
Figure 2. The principle of multi-frequency band decomposition in wavelet transform.
Machines 12 00672 g002
Figure 3. Two-dimensional discrete wavelet Haar wavelet decomposition diagram.
Machines 12 00672 g003
Figure 4. Flowchart of the multi-band K-SVD denoising algorithm.
Machines 12 00672 g004
Figure 5. The procedure for enhancing boundaries in the denoised image.
Machines 12 00672 g005
Figure 6. Results of running-in image denoising algorithm processing.
Machines 12 00672 g006
Figure 7. Results of normal wear image denoising algorithm processing.
Machines 12 00672 g007
Figure 8. Results of severe wear image denoising algorithm processing.
Machines 12 00672 g008
Figure 9. Comparison of different denoising algorithms for wear debris image. (a) Noisy image; (b) wavelet; (c) 2D-VMD; (d) BM3D; (e) ACPT; (f) NLH; (g) WVBOD; and (h) W-KSVD-EDGE.
Machines 12 00672 g009
Figure 10. Comparison of different denoising algorithms for real image. (a) Noisy image; (b) wavelet; (c) 2D-VMD; (d) BM3D; (e) ACPT; (f) NLH; (g) WVBOD; and (h) W-KSVD-EDGE.
Machines 12 00672 g010
Figure 11. Comparison of different denoising algorithms for cameraman image. (a) Noisy image; (b) wavelet; (c) 2D-VMD; (d) BM3D; (e) ACPT; (f) NLH; (g) WVBOD; and (h) W-KSVD-EDGE.
Machines 12 00672 g011
Table 1. Analysis of main parameters of the iron spectrometer.
ProjectParameter
Oil sample usage3 mL
Solvent dosage2 mL
Immersion range of oil sample water areaCompletely submerged
Using solventsTetrachloroethylene
Oil velocity30 mL/h
Oil delivery time600 s
Cleaning solution speed10 mL/h
Cleaning solution cleaning time480 s
Spectral tilt angle
Magnetic field intensity>1.5 T
Field Gradient>5.0 T/cm
Spectral specifications60 mm × 24 mm × 0.17 mm
Test tube specifications φ 10 mm × 100 mm
Oil pipeline specifications φ 2.4 mm × φ 2.0 mm × 400 mm
Table 2. Comparison of denoising algorithm performance on wear debris images.
NoisyAlgorithmEvaluating Indicator
PSNRSSIMEPI
σ = 15 Wavelet30.61780.97910.4073
Wavelet30.61870.97910.4073
2DVMD30.57400.43560.2235
BM3D31.55660.48300.2728
ACPT14.37990.46390.3938
NLH26.41300.38930.1996
WVBOD29.79720.44740.3384
W-KSVD-EDGE30.85580.98010.4116
σ = 25 Wavelet28.95420.34470.3805
Wavelet28.95420.34470.3805
2DVMD20.02440.14690.2034
BM3D31.06120.43630.2943
ACPT14.40870.45780.4335
NLH24.24610.36360.1910
WVBOD28.30350.38200.3283
W-KSVD-EDGE28.34360.96390.3819
σ = 50 Wavelet25.14900.21710.2122
Wavelet25.14900.21710.2122
2DVMD13.90840.05360.1695
BM3D24.81820.18980.0237
ACPT1.99000.09950.0127
NLH23.40120.29020.1429
WVBOD24.66600.26180.1581
W-KSVD-EDGE25.62010.93380.1672
Table 3. Comparison of real image denoising algorithm data.
NoisyAlgorithmEvaluating Indicator
PSNRSSIMEPI
σ = 15 Wavelet26.20710.30980.3400
Wavelet26.20710.30980.3400
2DVMD26.27180.32110.2097
BM3D29.44460.41350.4991
ACPT17.15170.43390.5203
NLH24.65300.48040.3716
WVBOD22.11560.24840.2508
W-KSVD-EDGE29.73050.99130.5638
σ = 25 Wavelet25.18590.26780.2934
Wavelet25.18590.26780.2934
2DVMD20.13300.28930.2020
BM3D29.02270.41830.4895
ACPT17.45240.51480.5612
NLH24.05630.44870.3554
WVBOD21.92980.21160.2431
W-KSVD-EDGE27.14890.98400.4616
σ = 50 Wavelet23.03120.21360.1653
Wavelet23.03120.21360.1653
2DVMD13.84840.13080.1427
BM3D23.91270.31350.0731
ACPT6.53820.21050.0137
NLH22.61540.37170.2776
WVBOD21.50360.16310.2141
W-KSVD-EDGE24.67710.97190.2347
Disclaimer/Publisher’s Note: The statements, opinions and data contained in all publications are solely those of the individual author(s) and contributor(s) and not of MDPI and/or the editor(s). MDPI and/or the editor(s) disclaim responsibility for any injury to people or property resulting from any ideas, methods, instructions or products referred to in the content.