Article

Optimization of Occupant Restraint System Using Machine Learning for THOR-M50 and Euro NCAP

1
Department of Mechanical Design Engineering, Tech University of Korea, Siheung-si 15073, Republic of Korea
2
Safety Performance Test Team 2, Hyundai Motor Group, 150, HyundaiYeonguso-ro, Hwaseong-si 18280, Republic of Korea
*
Author to whom correspondence should be addressed.
Machines 2024, 12(1), 74; https://doi.org/10.3390/machines12010074
Submission received: 28 November 2023 / Revised: 10 January 2024 / Accepted: 13 January 2024 / Published: 18 January 2024
(This article belongs to the Special Issue Recent Analysis and Research in the Field of Vehicle Traffic Safety)

Abstract

:
In this study, we propose an optimization method for occupant protection systems using a machine learning technique. First, a crash simulation model was developed for a Euro NCAP MPDB frontal crash test condition. Second, a series of parametric simulations were performed using a THOR dummy model with varying occupant safety system design parameters, such as belt attachment locations, belt load limits, crash pulse, and so on. Third, metamodels were developed using neural networks to predict injury criteria for a given occupant safety system design. Fourth, the occupant safety system was optimized using metamodels, and the optimal design was verified using a subsequent crash simulation. Lastly, the effects of design variables on injury criteria were investigated using the Shapely method. The Euro NCAP score of the THOR dummy model was improved from 14.3 to 16 points. The main improvement resulted from a reduced risk of injury to the chest and leg regions. Higher D-ring and rearward anchor placements benefited the chest and leg regions, respectively, while a rear-loaded crash pulse was beneficial for both areas. The sensitivity analysis through the Shapley method quantitatively estimated the contribution of each design variable regarding improvements in injury metric values for the THOR dummy.

1. Introduction

1.1. Background

In the relentless pursuit of enhancing vehicle crash safety, the field of automotive industry has witnessed remarkable advancements in occupant restraint systems over the years, with fatality from vehicular crashes reduced by 25% from 1990 to 2009 [1]. Advancements in occupant restraint systems, vehicle crashworthiness, and crash mitigation systems have also led to significant reductions in fatality and the severity of injuries sustained during crashes [2,3,4,5].
The optimization of occupant restraint systems is an important task to maximize the protection of an occupant while minimizing the risk of occupant injury due to a safety device. Occupant restraint systems, which consist of seatbelt, airbags, seat, and vehicle interior, have been developed to provide protection to an occupant during various crash scenarios via optimization. While an airbag is a widely used occupant protection system, an overly aggressive airbag can cause severe injuries during deployment [6]. At the same time, insufficient restraint force from an overly weak airbag will not be able to provide adequate protection to occupants, either during high-severity crashes or large occupants.
The difficulty of developing an occupant restraint system is increasing due to enhanced safety regulations and consumer rating testing protocols [7]. The reinforcement of safety requirements involves stringent thresholds for injury criteria, increased crash severity during testing, and the introduction of new anthropometric devices. The European new car assessment programme (Euro NCAP) introduced the THOR 50M (Test Device for Human Occupant Restraint 50th percentile male) dummy in the 2020 new frontal impact test with a mobile progressive deformable barrier (MPDB), as opposed to the previously used Hybrid III 50th percentile male dummy (H-III 50M) [7]. The THOR dummy is known to be more biofidelic than the H-III dummy during frontal crash conditions, holding promise for facilitating advancements in occupant restraint devices [8,9]. The thoracic region of the vehicle occupant is one of the most frequently injured body regions during frontal crashes [10]. While the H-III dummy measures chest deflection at one location, the THOR dummy measures chest deflection at four points, employing IR-TRACC (Infra-Red Telescoping Rod for the Assessment of Chest Compression) sensors. The THOR dummy has demonstrated higher sensitivity to changes in the restraint system design than the Hybrid III dummy, potentially due to its ability to capture the local deformation of the thoracic region of the dummy [11]. Therefore, it is necessary to investigate the influence of the restraint design system on occupant protection for the newly introduced THOR dummy.
Computational parametric studies are widely used to investigate the effect of restraint systems on occupant protection [12,13]. A large number of design parameters and dummy injury metrics make it complicated for a parametric study to employ conventional experimental method designs. Due to this reason, many studies have employed simplified computational models or focused on a few focused body regions. Wang et al. (2023) utilized analytical models to investigate the ways to improve occupant protection from vehicle pulse and restraint system characteristic standpoints [13]. They found that a combination of concave crash pulse and upward restraint stiffness was the best to maximize the restraining performance. Zhang et al. (2019) developed a two-degrees-of-freedom model for optimizing occupant restraint systems [14]. Although these findings can give vehicle safety engineers general guidelines, it is difficult to draw THOR dummy-specific new knowledge using this model due to the ignored design aspects of restraint systems, which include knee bolster, belt route, seat stiffness, and so on, for simplification.
A metamodel, often obtained through statistical or machine learning methods, has been developed to investigate the optimal settings of occupant safety systems by utilizing crash simulation results. Horii et al. (2017) constructed metamodels capable of predicting injury metrics for a given set of six design variables [15]. The authors utilized these metamodels in the optimization process to enhance the performance of occupant restraint systems. While the authors proposed a framework for metamodel-based optimization of occupant safety systems, the complexity of the considered occupant model and restraint systems was somewhat limited, hindering the application of the findings to actual systems. Joodaki et al. (2021) developed metamodels to predict the overall performance of occupant protection systems using more detailed models than those from Horii (2017) [16]. The authors demonstrated that there is a difference in the optimal settings of occupant safety systems for normal and obese occupants. Similarly, Du et al. (2021) optimized the vehicle front structure using metamodels [17]. While these studies highlighted that metamodels can predict the performance of occupant restraint systems, engineers find it challenging to quantitatively understand the impact of each design variable on the system’s performance. It is necessary to understand the cause of the improvement to obtain insights from optimization studies on occupant safety systems.

1.2. Research Objectives

This paper seeks to bridge the gap between traditional occupant restraint system design and the transformative potential of machine learning. The goal is to optimize restraint systems for the THOR dummy and understand the effects of design variables on injury metric values of the THOR dummy using a machine learning framework in an automated manner. First, a crash simulation model was developed for a Euro NCAP MPDB frontal crash test condition. Second, a series of parametric simulations were performed using a THOR dummy model with varying occupant safety system designs, such as belt route, belt load limit, crash pulse, and so on. Third, metamodels were developed using a neural network to predict injury criterion values for a given occupant safety system design. Fourth, the occupant safety system was optimized using metamodels, and the optimal design was verified using a crash simulation. Lastly, the effects of design variables on injury score were investigated using the SHAP method (Shapley additive explanations) [18,19,20,21].

2. Materials and Methods

2.1. Overview

This section describes the process of optimizing occupant restraint systems for the Euro NCAP MPDB offset frontal crash test condition using a neural network (Figure 1). First, a mid-sized sedan sled model with the THOR dummy was developed and validated with Euro NCAP MPDB frontal sled test results. Second, 500 parametric simulations were performed, randomly varying fourteen design variables of occupant restraint systems. Parametric crash simulations were performed using design variable combinations generated using the Latin hypercube sampling (LHS) method, a widely used random sampling technique [22]. Crash simulation results were used to develop a metamodel that could explain relationships between design variables of restraint systems and dummy injury values. Subsequently, a genetic algorithm was used to find the optimal restraint design setting, which could maximize the Euro NCAP score, using the metamodel. The optimal design identified by the optimization was verified via crash simulation. If there was a large discrepancy between predicted and actual Euro NCAP scores, the process of optimization was repeated by updating the metamodel with additional crash simulation results using newly generated design variables. This process was repeated until the optimal design from the metamodel was verified by crash simulation results. Lastly, the optimally derived THOR dummy restraint configuration was applied to a mid-size human body model to test the protective effect of the restraint system on the human occupant.

2.2. Model Validation

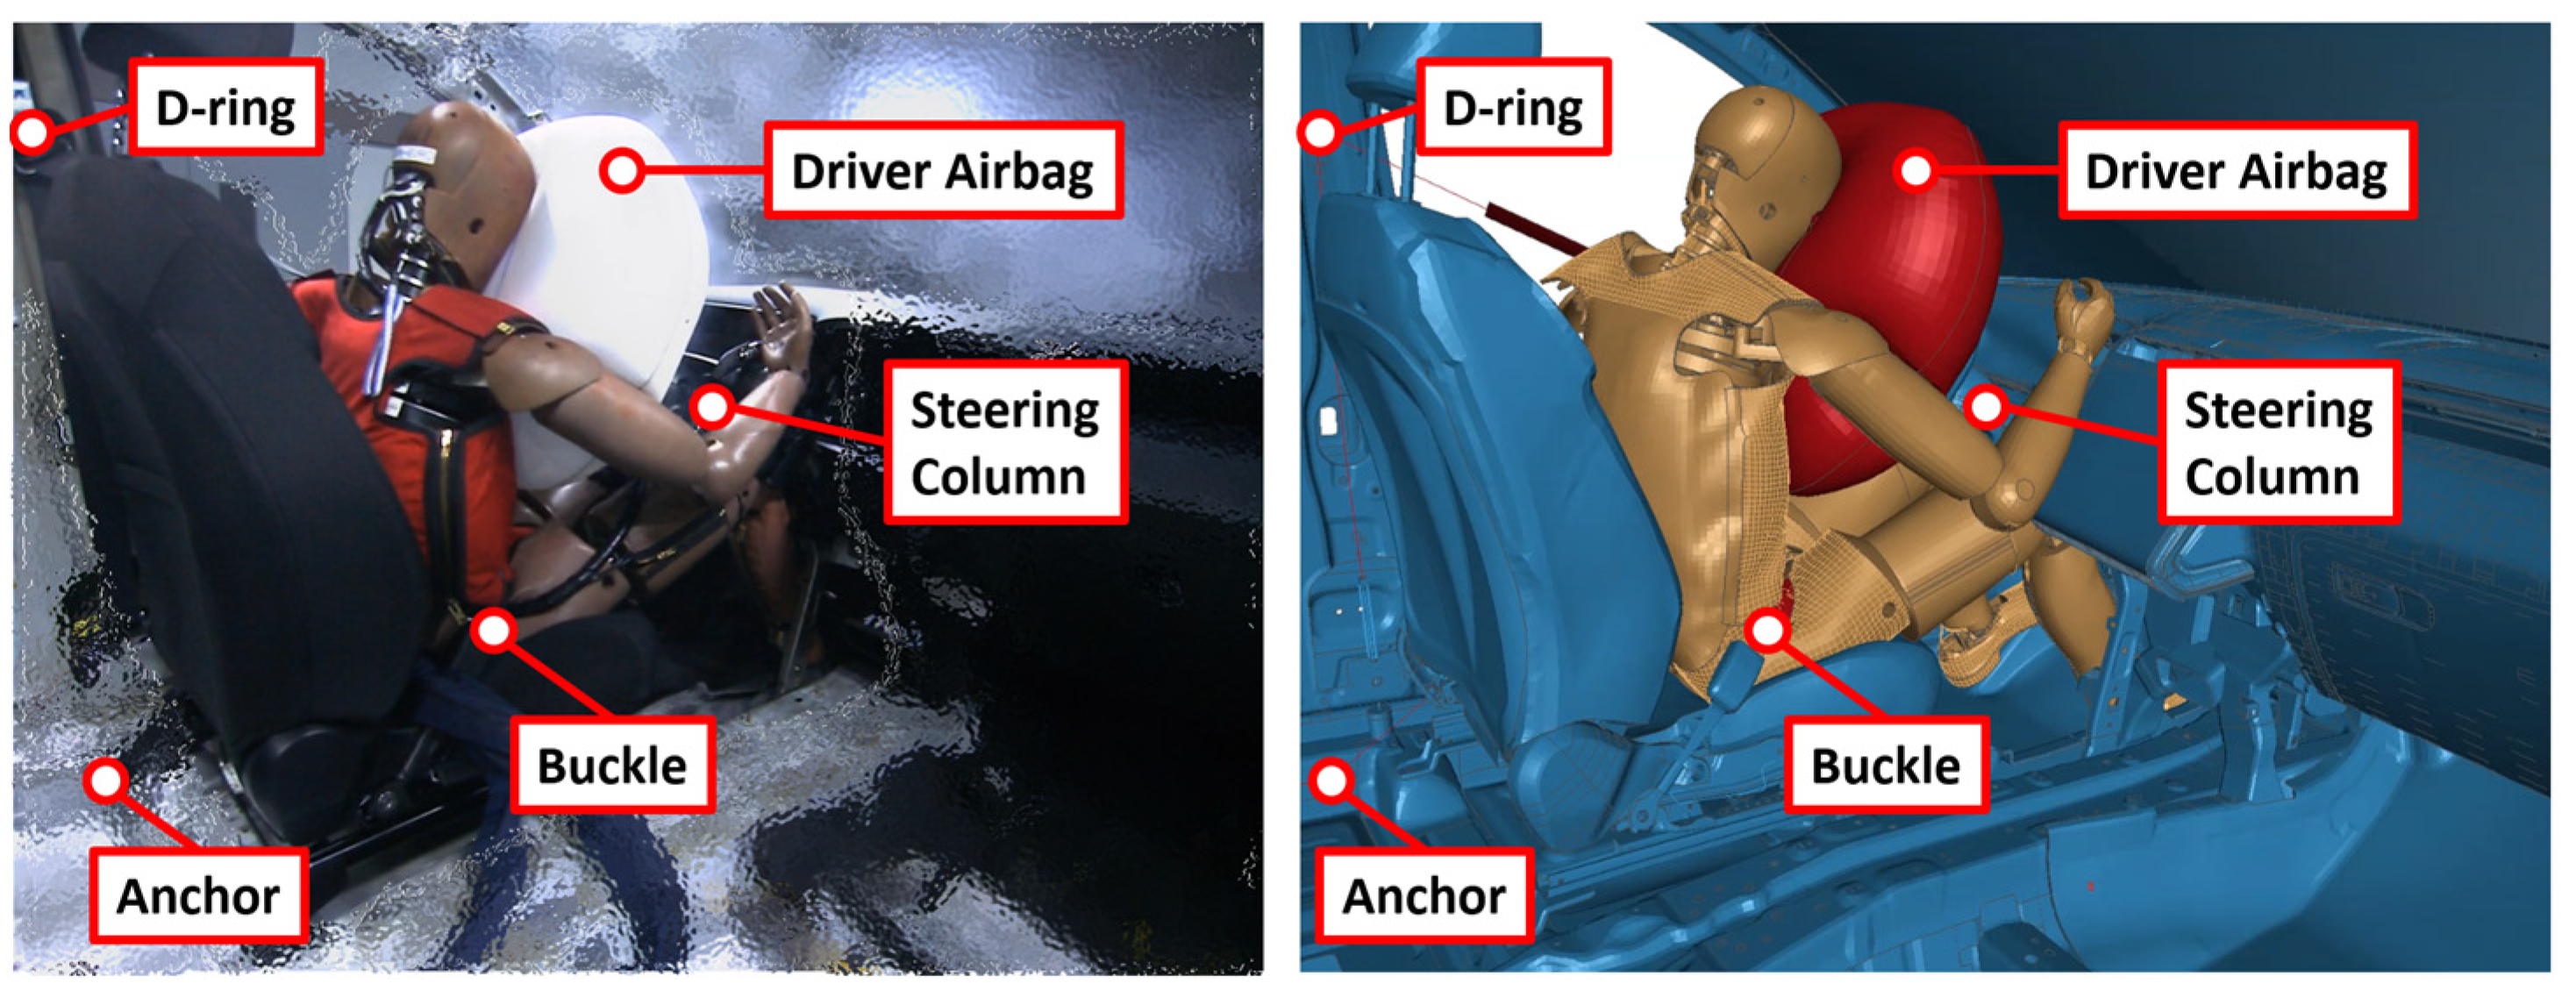
The sled model for a crash simulation was validated against Euro NCAP MPDB frontal crash test results with the 50th percentile male THOR dummy using commercial finite element software, LS-Dyna (version R9.1.0, LSTC, Livermore, CA, USA). The THOR dummy utilized in the Euro NCAP MPDB frontal crash simulation used the retrofitted Hybrid III lower extremity. The THOR dummy was positioned in the driver’s seat. The seat track position and the posture of the dummy were matched to those of an actual test. Restraint systems included frontal driver airbag, shoulder belt load limiter, D-ring and anchor pretensioners, and collapsible steering column (Figure 2). Lastly, the vehicle pulse from Euro NCAP MPBD test was applied to the sled model to evaluate the correlation between physical test and simulation results.
Time histories of responses of the THOR dummy, such as accelerations, displacements, forces, and moments, were measured to calculate injury criteria specified in the Euro NCAP Protocol (Table 1) [7]. Euro NCAP rating is a scale used to assess vehicle ratings. It has a total of 16 points on a 4-point scale for each of four body regions: (1) head and neck, (2) chest and abdomen, (3) knee, femur, and pelvis, and (4) lower leg. Each injury criterion has upper and lower thresholds. If the injury criterion value exceeds the upper threshold, 0 is assigned. If it is below the lower threshold, 4 points are given. Values in between these two thresholds are linearly interpolated to calculate scores between 0 and 4 points. Furthermore, each body region is divided into specific segments, and the score of the segment with the lowest score is selected to calculate the final score. For instance, if HIC15 is 4 points and A Resultant 3 ms is 0 points, then the score for the head region would be calculated as 0 points. SUFEHM and BrIC are used for monitoring purposes. They are not employed in injury calculations. Also, abdominal compression was excluded from all simulations because all simulations demonstrated abdominal compression of less than 88 mm.

2.3. Parametric Simulation

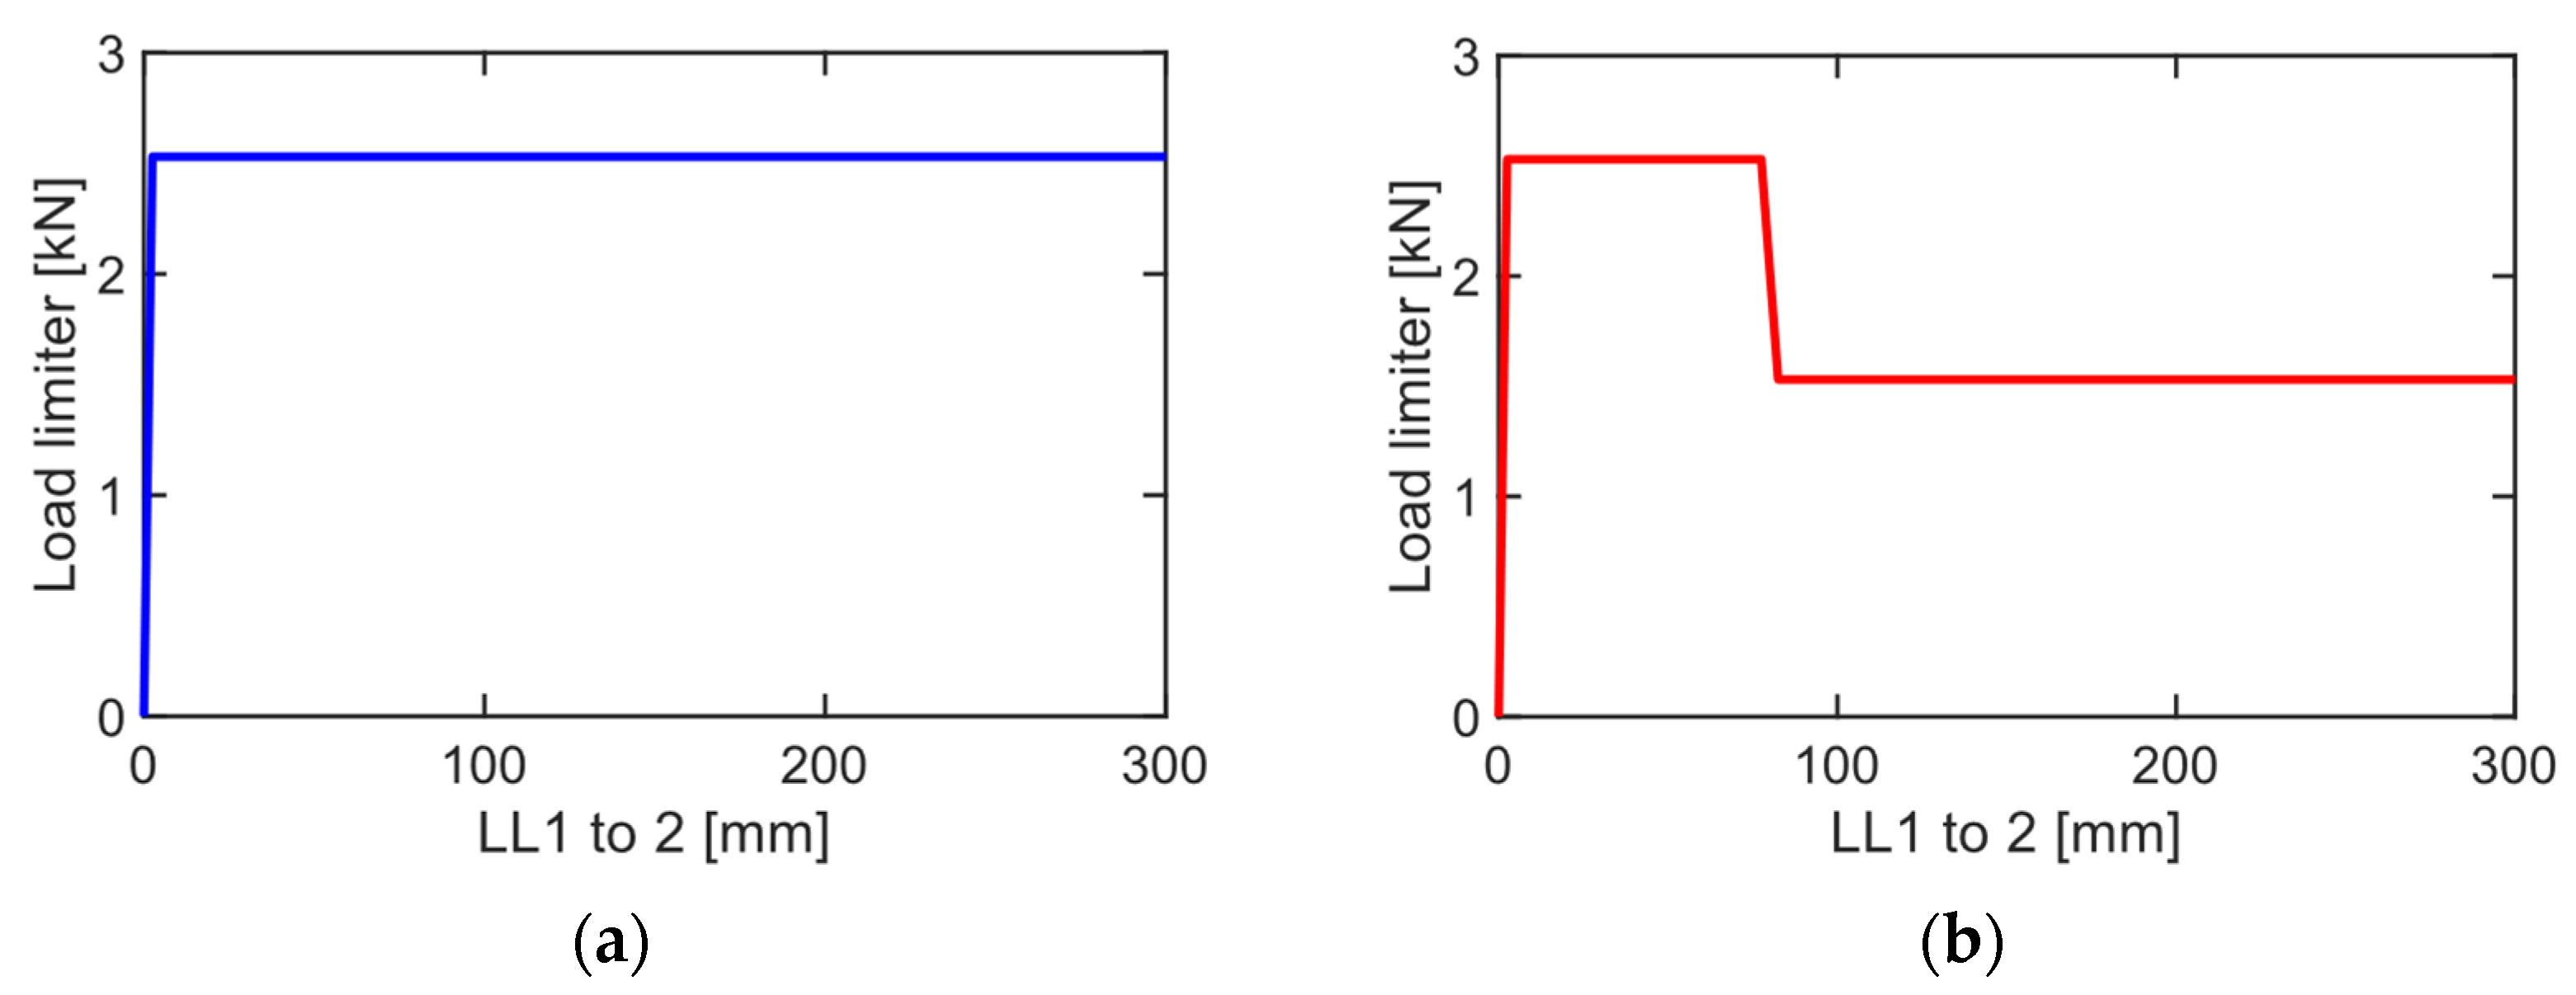
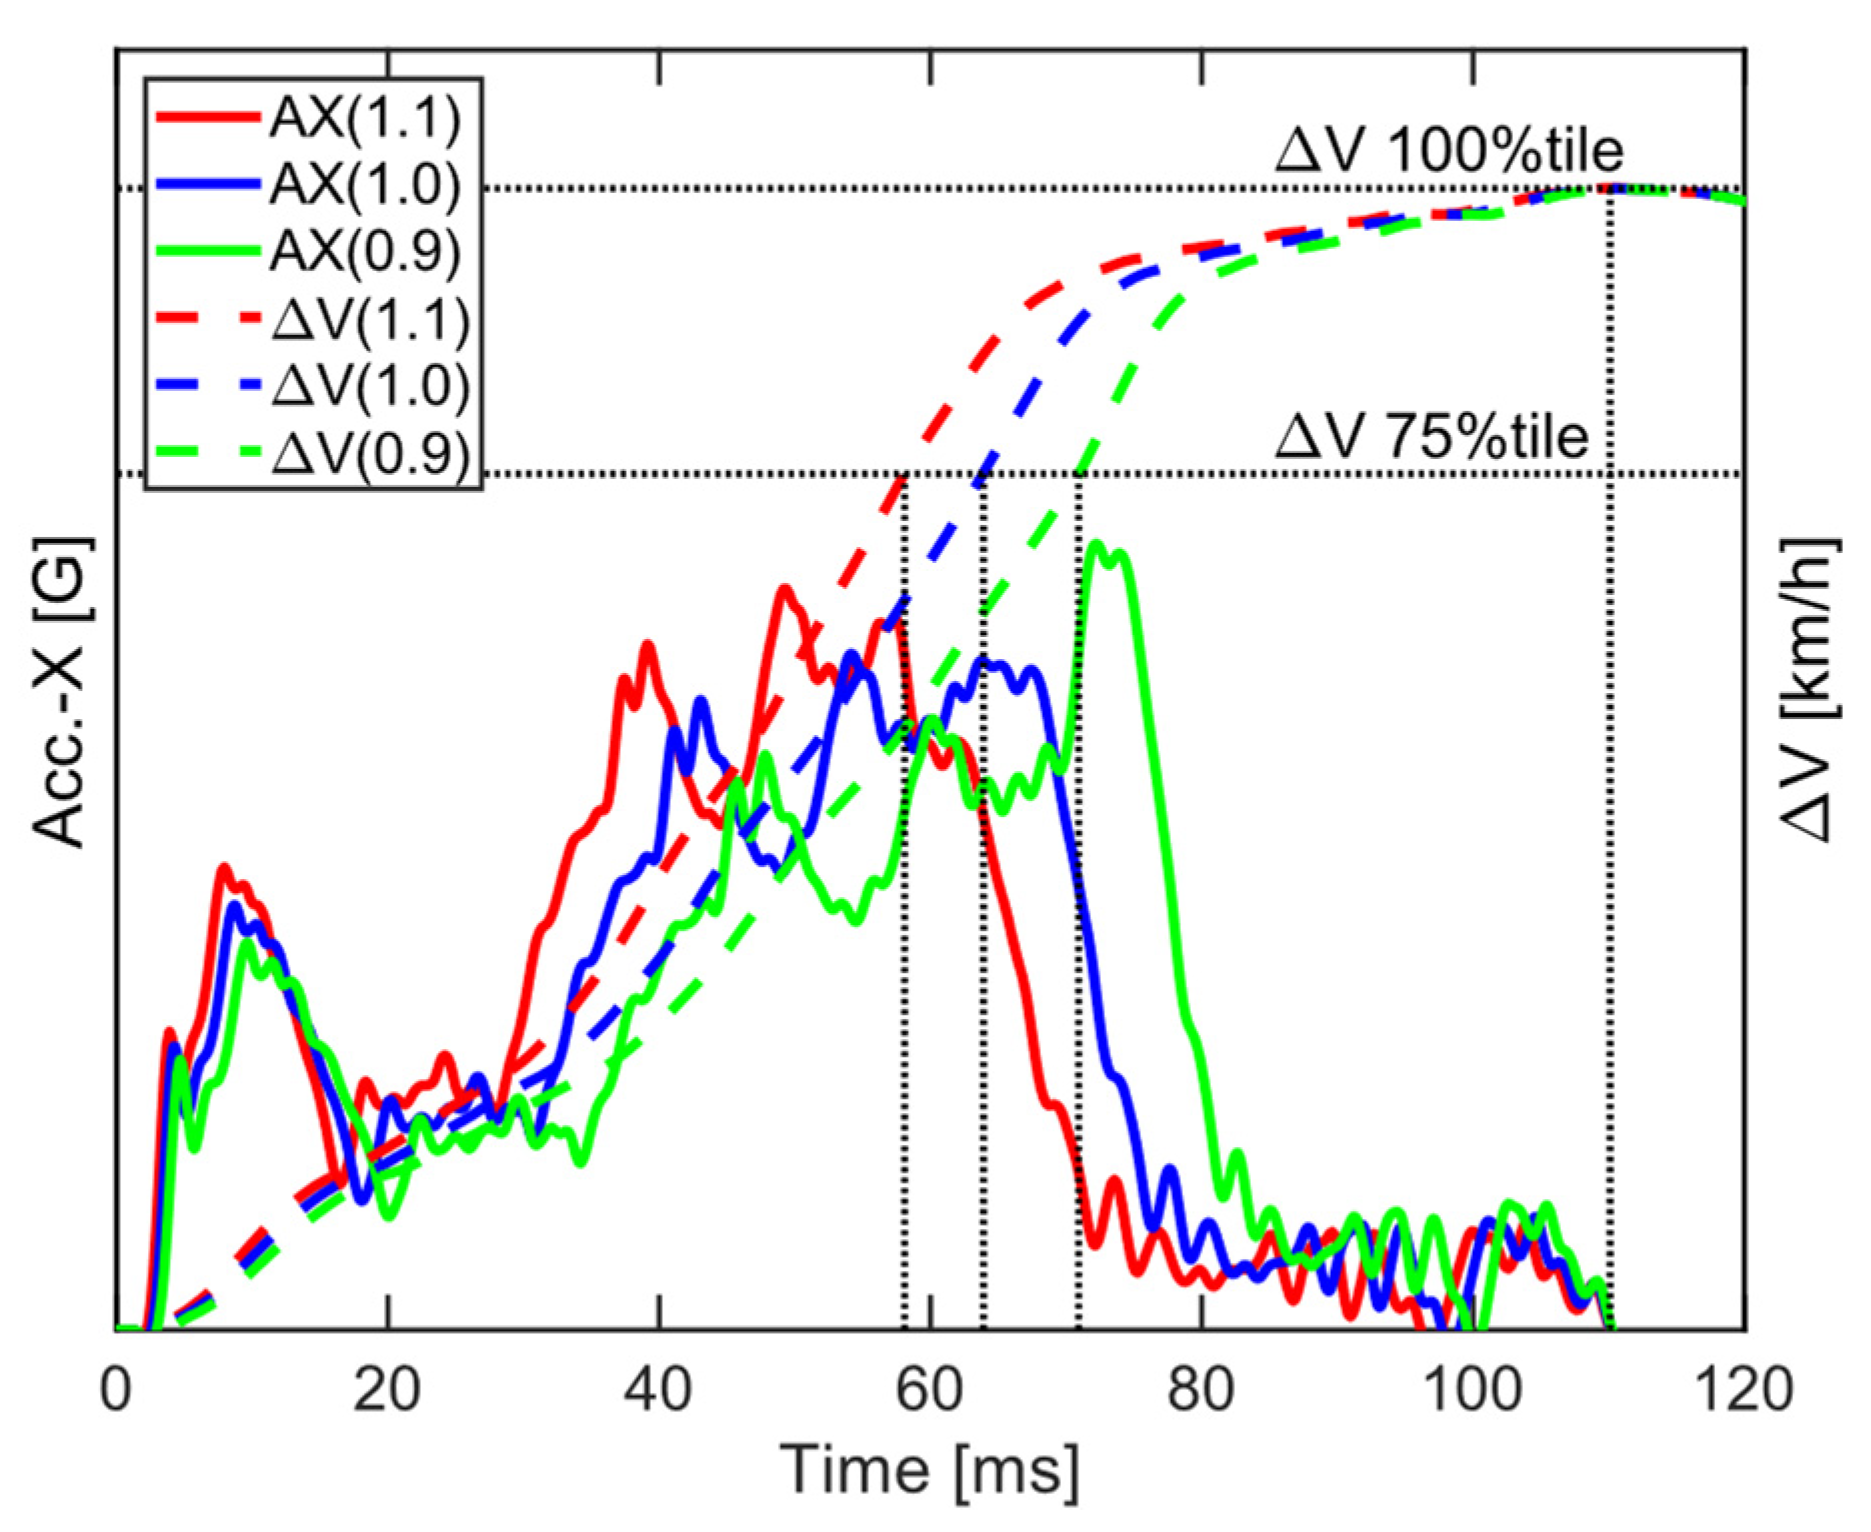
Table 2 lists 14 restraint design variables and their ranges for parametric simulations. First, five design variables related to belt hardpoints were included to vary the belt path with respect to the dummy. Next, four design variables associated with characteristics of the belt system were included. The anchor pretensioner (APT) was set to be either on or off. A single- or dual-stage load limiter can be realized using three-load limiter-related parameters (LL1, LL2, and LL1 to 2 in Figure 3). Three design variables concerning driver’s airbag were chosen to regulate pressure and volume of the airbag. Furthermore, the steering column collapsing load was adjusted to control the degree of collapse and the stroke of the column. Additionally, the vehicle pulse was adjusted between the front load and the rear load while keeping the Delta-V the same as the baseline pulse (Figure 4). Eleven injury metrics, which were used to calculate Euro NCAP scores, were calculated for 500 parametric simulations (Table 1). Head and neck, chest and abdomen, knee, femur, pelvis, and lower leg scores for the Euro NCAP rating were then calculated for each crash simulation.

2.4. Metamodeling

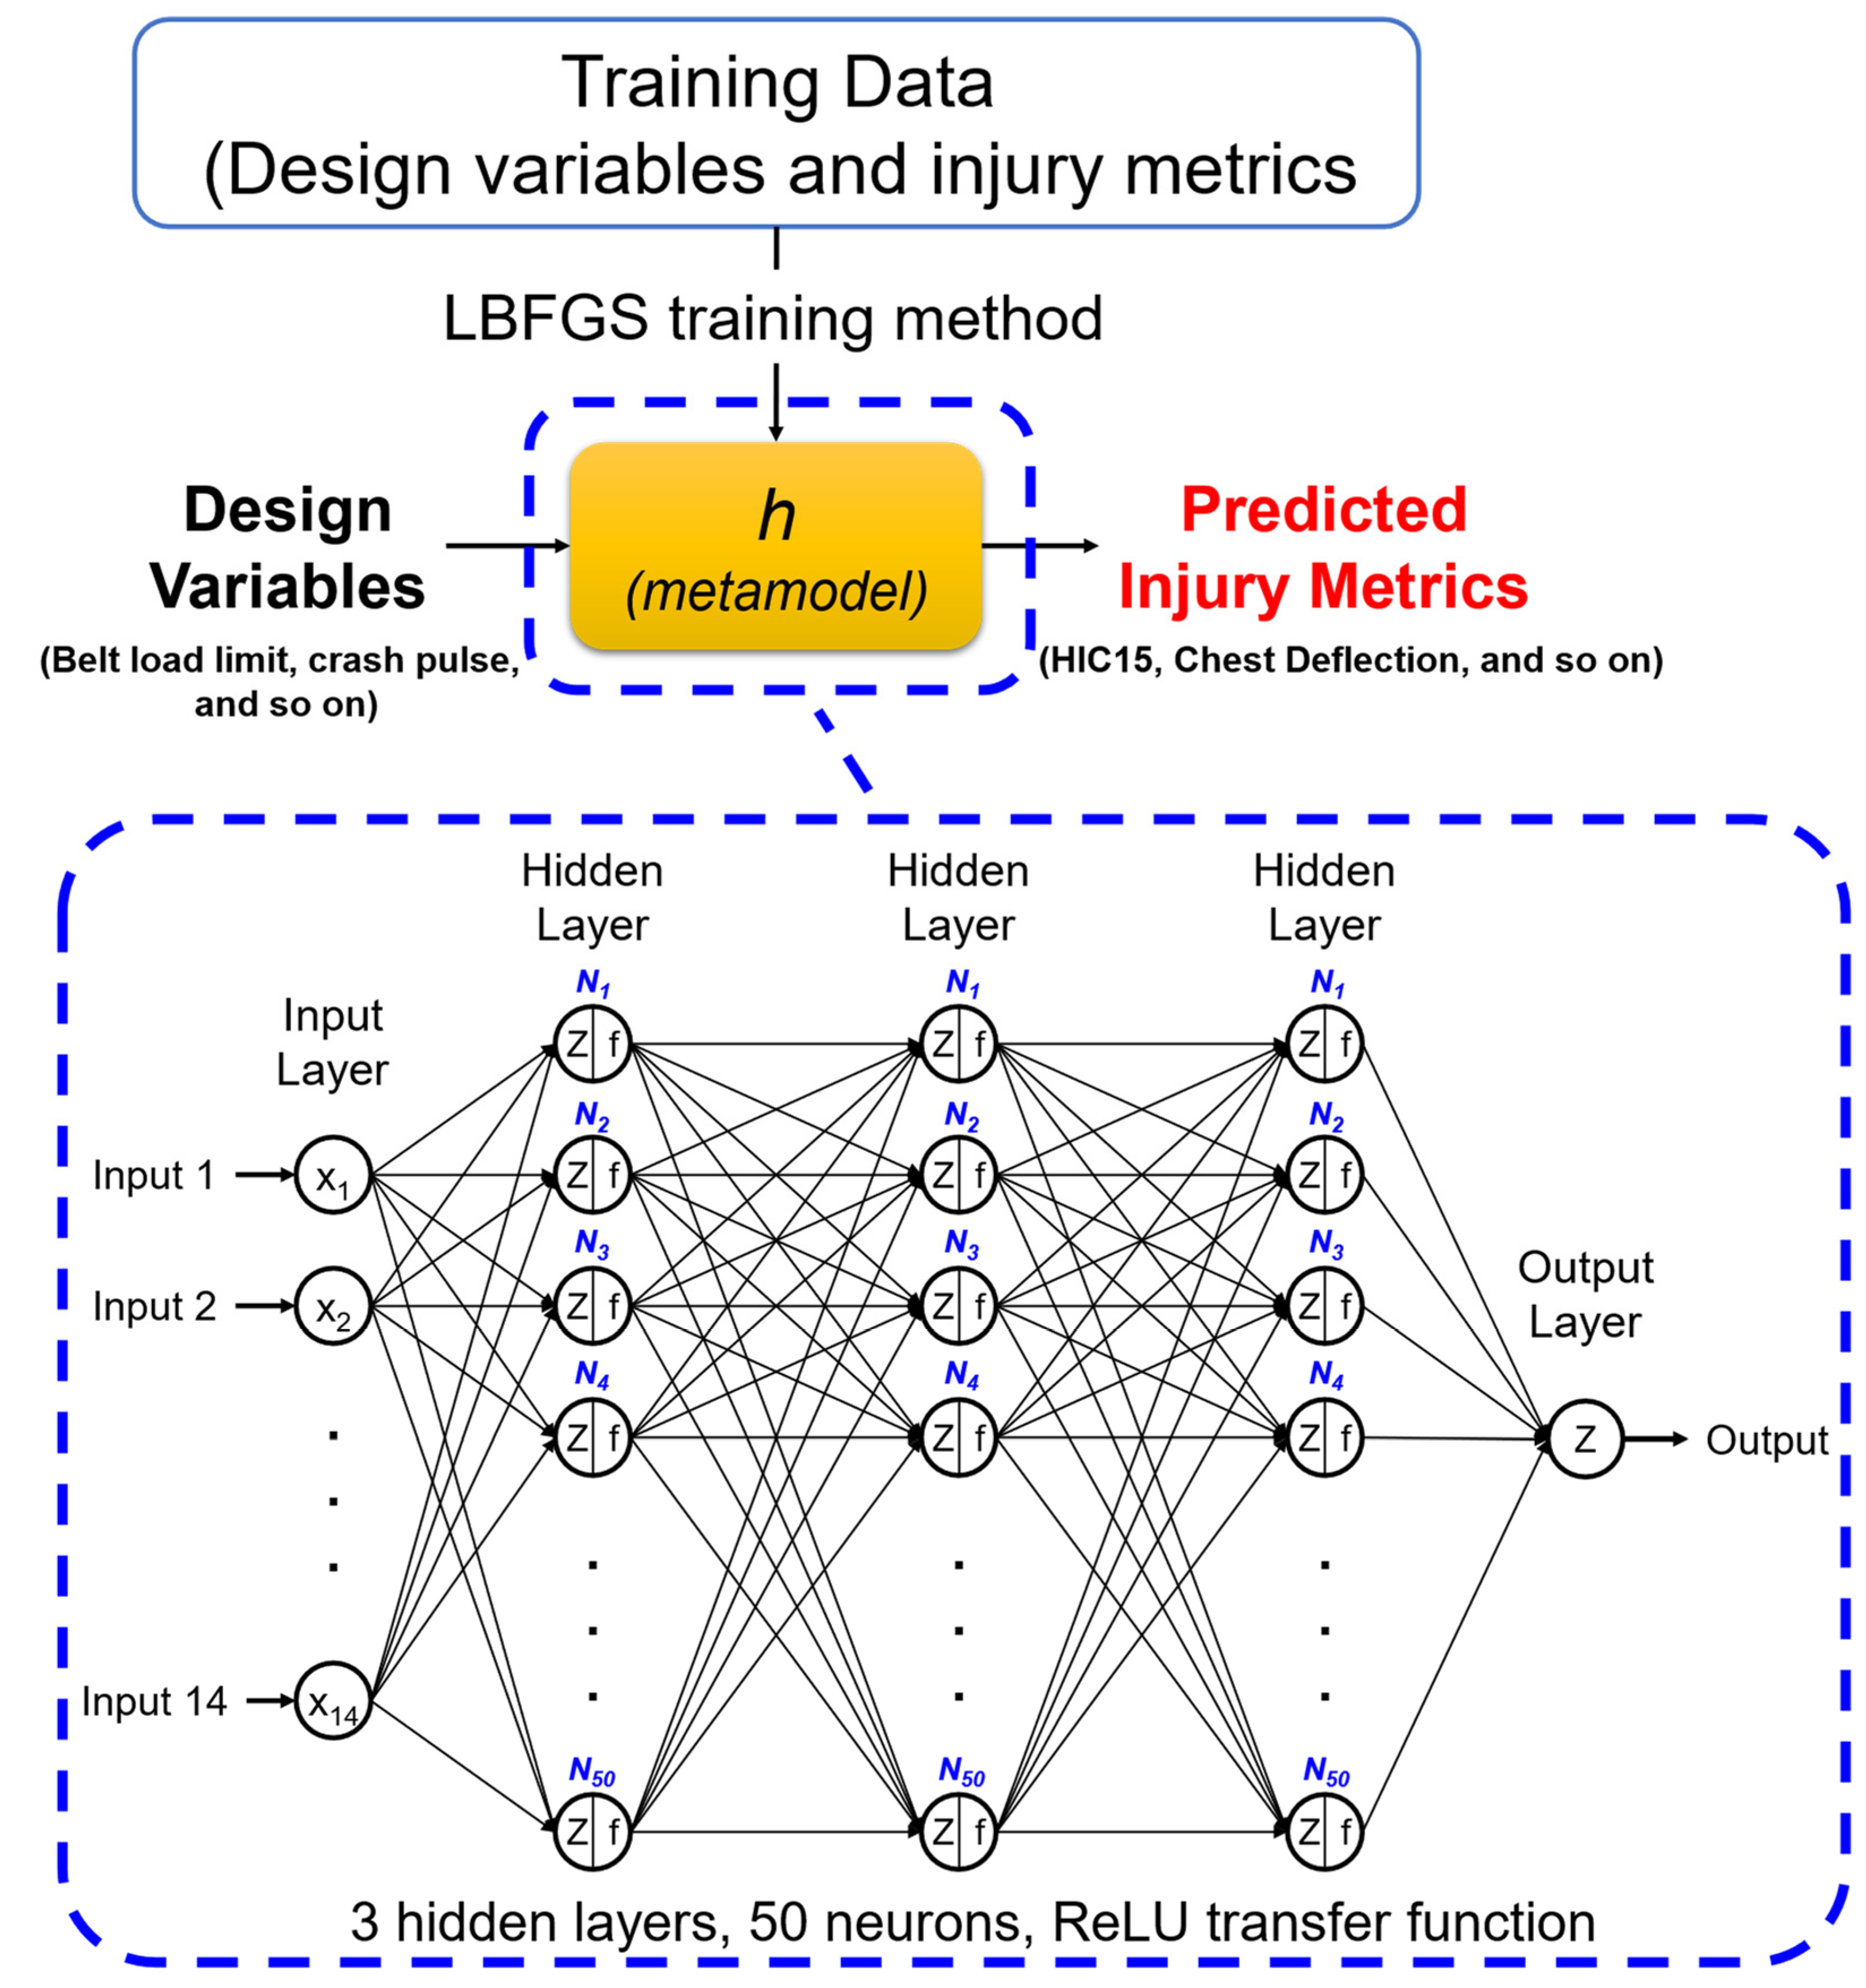
Metamodels that could predict injury criteria for the Euro NCAP score for a given set of 14 design variables were developed using neural network (NN) framework. Instead of directly predicting the Euro NCAP rating score, individual metamodels were developed to predict injury criteria used to calculate the Euro NCAP rating score (Table 1). Euro NCAP rating was then simply calculated using these predicted injury metrics, such as HIC15, Rmax, and so on, following the Euro NCAP rating protocol. The prediction accuracy of this method was compared with that of using Euro NCAP rating as a single output value. To assess prediction performance accurately, the entire dataset was divided into training, validation, and test sets. The test set was then used to evaluate prediction errors once the model training was completed. Additionally, hyperparameters were tuned through a trial-and-error approach to avoid overfitting or underfitting (Figure 5). The training algorithm used was LBFGS (Limited-memory Broyden–Fletcher–Goldfarb–Shanno), a variant of BFGS (Broyden–Fletcher–Goldfarb–Shanno) [23]. LBFGS, when compared to BFGS, is more memory efficient while providing fast and stable convergence, making it suitable as a training algorithm for optimizing restraint systems. As a result, 11 NN models and one additional NN were developed to predict the 11 injury criteria and the Euro NCAP score, respectively (Table 1). These machine learning and optimization processes were conducted using MATLAB programming [24].

2.5. Optimization

In this study, the Euro NCAP rating was chosen as the objective function of a single-objective optimization problem (Figure 6, Table 3). The reason for multiplying by −1 on the Euro NCAP rating is that a higher Euro NCAP score indicates a better restraint system (out of a maximum of 16 points). A genetic algorithm, which is effective for global optimization, was adopted as a mathematical algorithm for the optimization task [25]. The algorithm utilizes diverse initial solutions and maintains diversity through mutation and crossover, making it less prone to becoming stuck in local optima. The derived optimal design was validated through a verification simulation using the sled model (Figure 2). If the predicted Euro NCAP score was not realized from the simulation, then metamodels were re-trained with additional 57 crash simulation results, which were also parametric simulations based on Latin hypercube sampling. This process of adding additional simulation results into the training data set, retraining the metamodel, and optimizing the design variables was repeated until the predicted optimal design was validated with the verification sled simulation (Figure 1). Additional optimizations of design variables were performed by constraining vehicle pulse variables to certain levels to see the influence of vehicle deceleration pulse on the performance of the restraint system.
The optimal safety device design for a THOR model was also applied to the mid-sized male GHBM-O model to see if the design change also improved the safety performance for a human body model. All injury criteria considered for the THOR dummy were used for the GHBM-O model, except for chest deflection and knee shear displacement. While chest deformation of the THOR dummy was determined utilizing Rmax measured from four IR-TRACC sensors, chest compression of the GHBM-O model was measured from the outer surface of its thoracic regions. Three sets of nodal coordinates, which mimicked three chest bands, were located around the T10, T12, and L1 levels. The knee shear displacement for the GHBM-O model was ignored in the current study.

2.6. Sensitivity Analysis

Even if a restraint device design for optimal solutions demonstrates an improvement in the extent of occupant injuries, it is still meaningful to understand factors driving such enhancements. Thus, trained metamodels were used not only for optimization but also for understanding effects of design variables on injury criteria of the THOR dummy in a frontal crash condition (Table 1). The Shapley additive explanation (SHAP) method [18] was used for this purpose. The SHAP analysis was conducted based on a metamodel predicting injury criterion values for each specific area used in Euro NCAP score prediction for a given set of design variables (Table 2). The Shapley value represents the effect of each feature, which was the restraint system design variable, on predicted output, which was the injury criteria values. The range of change in each feature was normalized to be between 0 and 1, which meant minimum and maximum values, respectively. A positive Shapley value for a given set of feature values implied an increase in the output value, and vice versa. One of the major advantages of the SHAP method is its ability to not only reveal effect of each feature on the output values but also indicate the direction of change of the output value due to the feature value. The feature importance value, which is the average absolute value of Shapley values of considered ranges of feature values, indicates the magnitude of the effect of a feature on the output. It allows for comprehension of overall effects, enabling numerical ranking of significant variables. Identified important variables can then serve as key tuning factors during the development of countermeasures.

3. Results

3.1. Model Validation

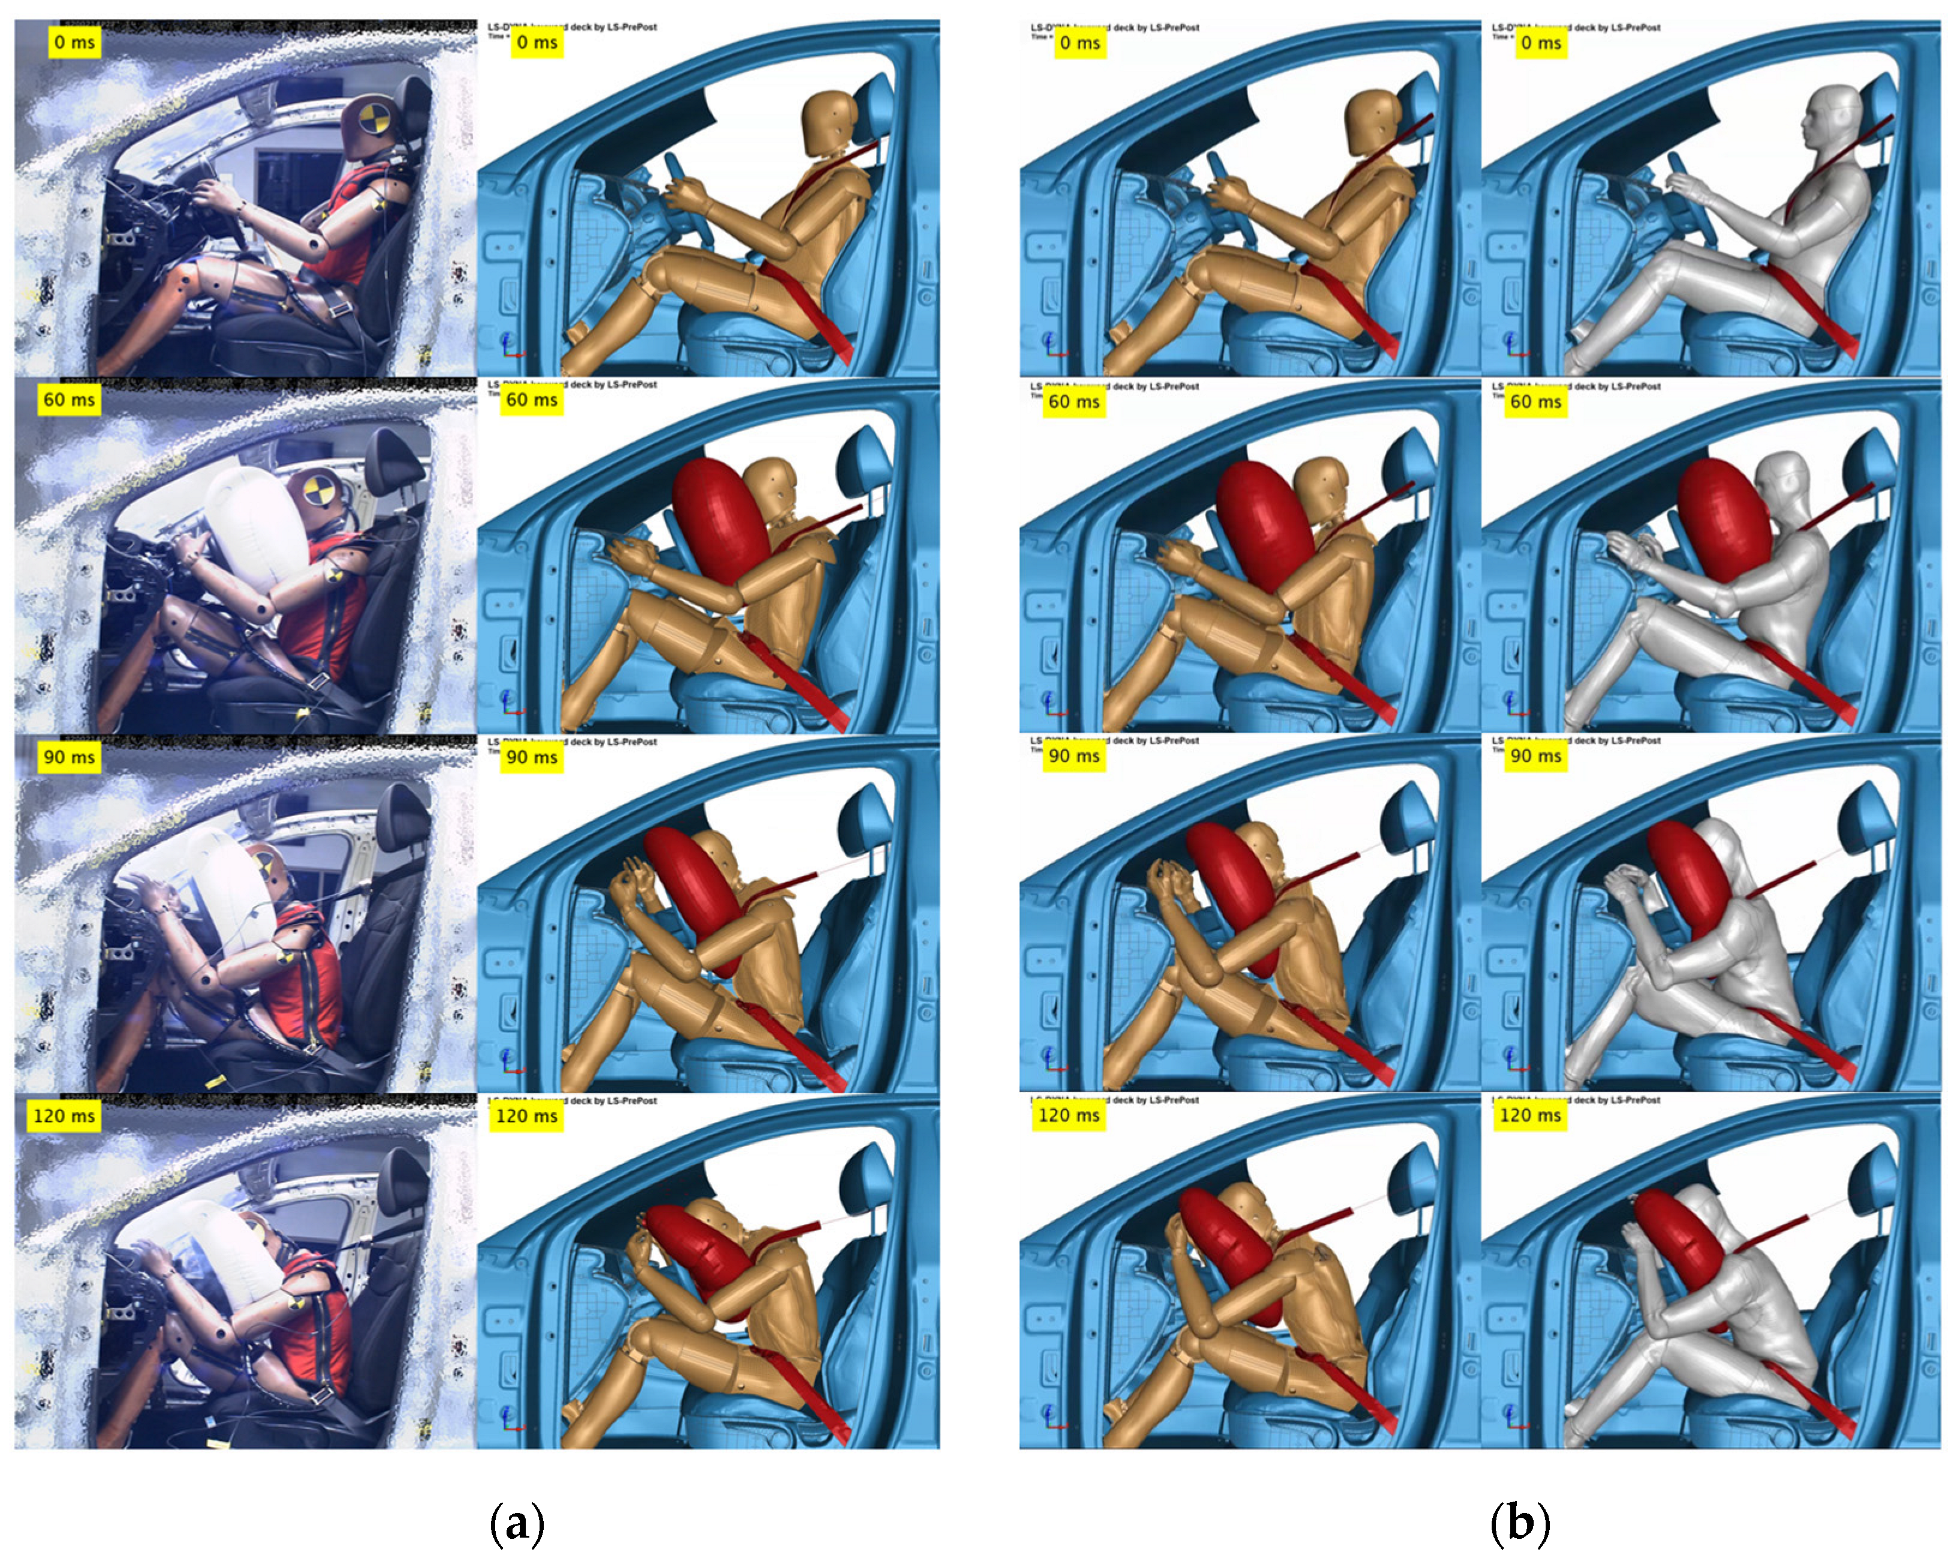
The crash simulation model demonstrated similar responses to the test results in terms of dummy responses and injury criteria values (Figure 7 and Figure 8). The simulation model demonstrated a 4% higher Euro NCAP score than that of the test result (Table 4). The maximum resultant chest deflection (Rmax) from the simulation was almost identical to the test data. The crucial injury parameter with the most pronounced impact in parametric simulation results, the maximum chest deflection, exhibited a remarkable accuracy, with an error rate of only 0.14%, showing a test result of 43.90 mm and an analytical result of 43.84 mm. The largest discrepancy between the model and test data was observed in the leg region. The model predicted a 17% higher lower leg score than that of test data. Based on these results, it could be concluded that the simulation model closely aligned with the test results.

3.2. Parametric Simulations

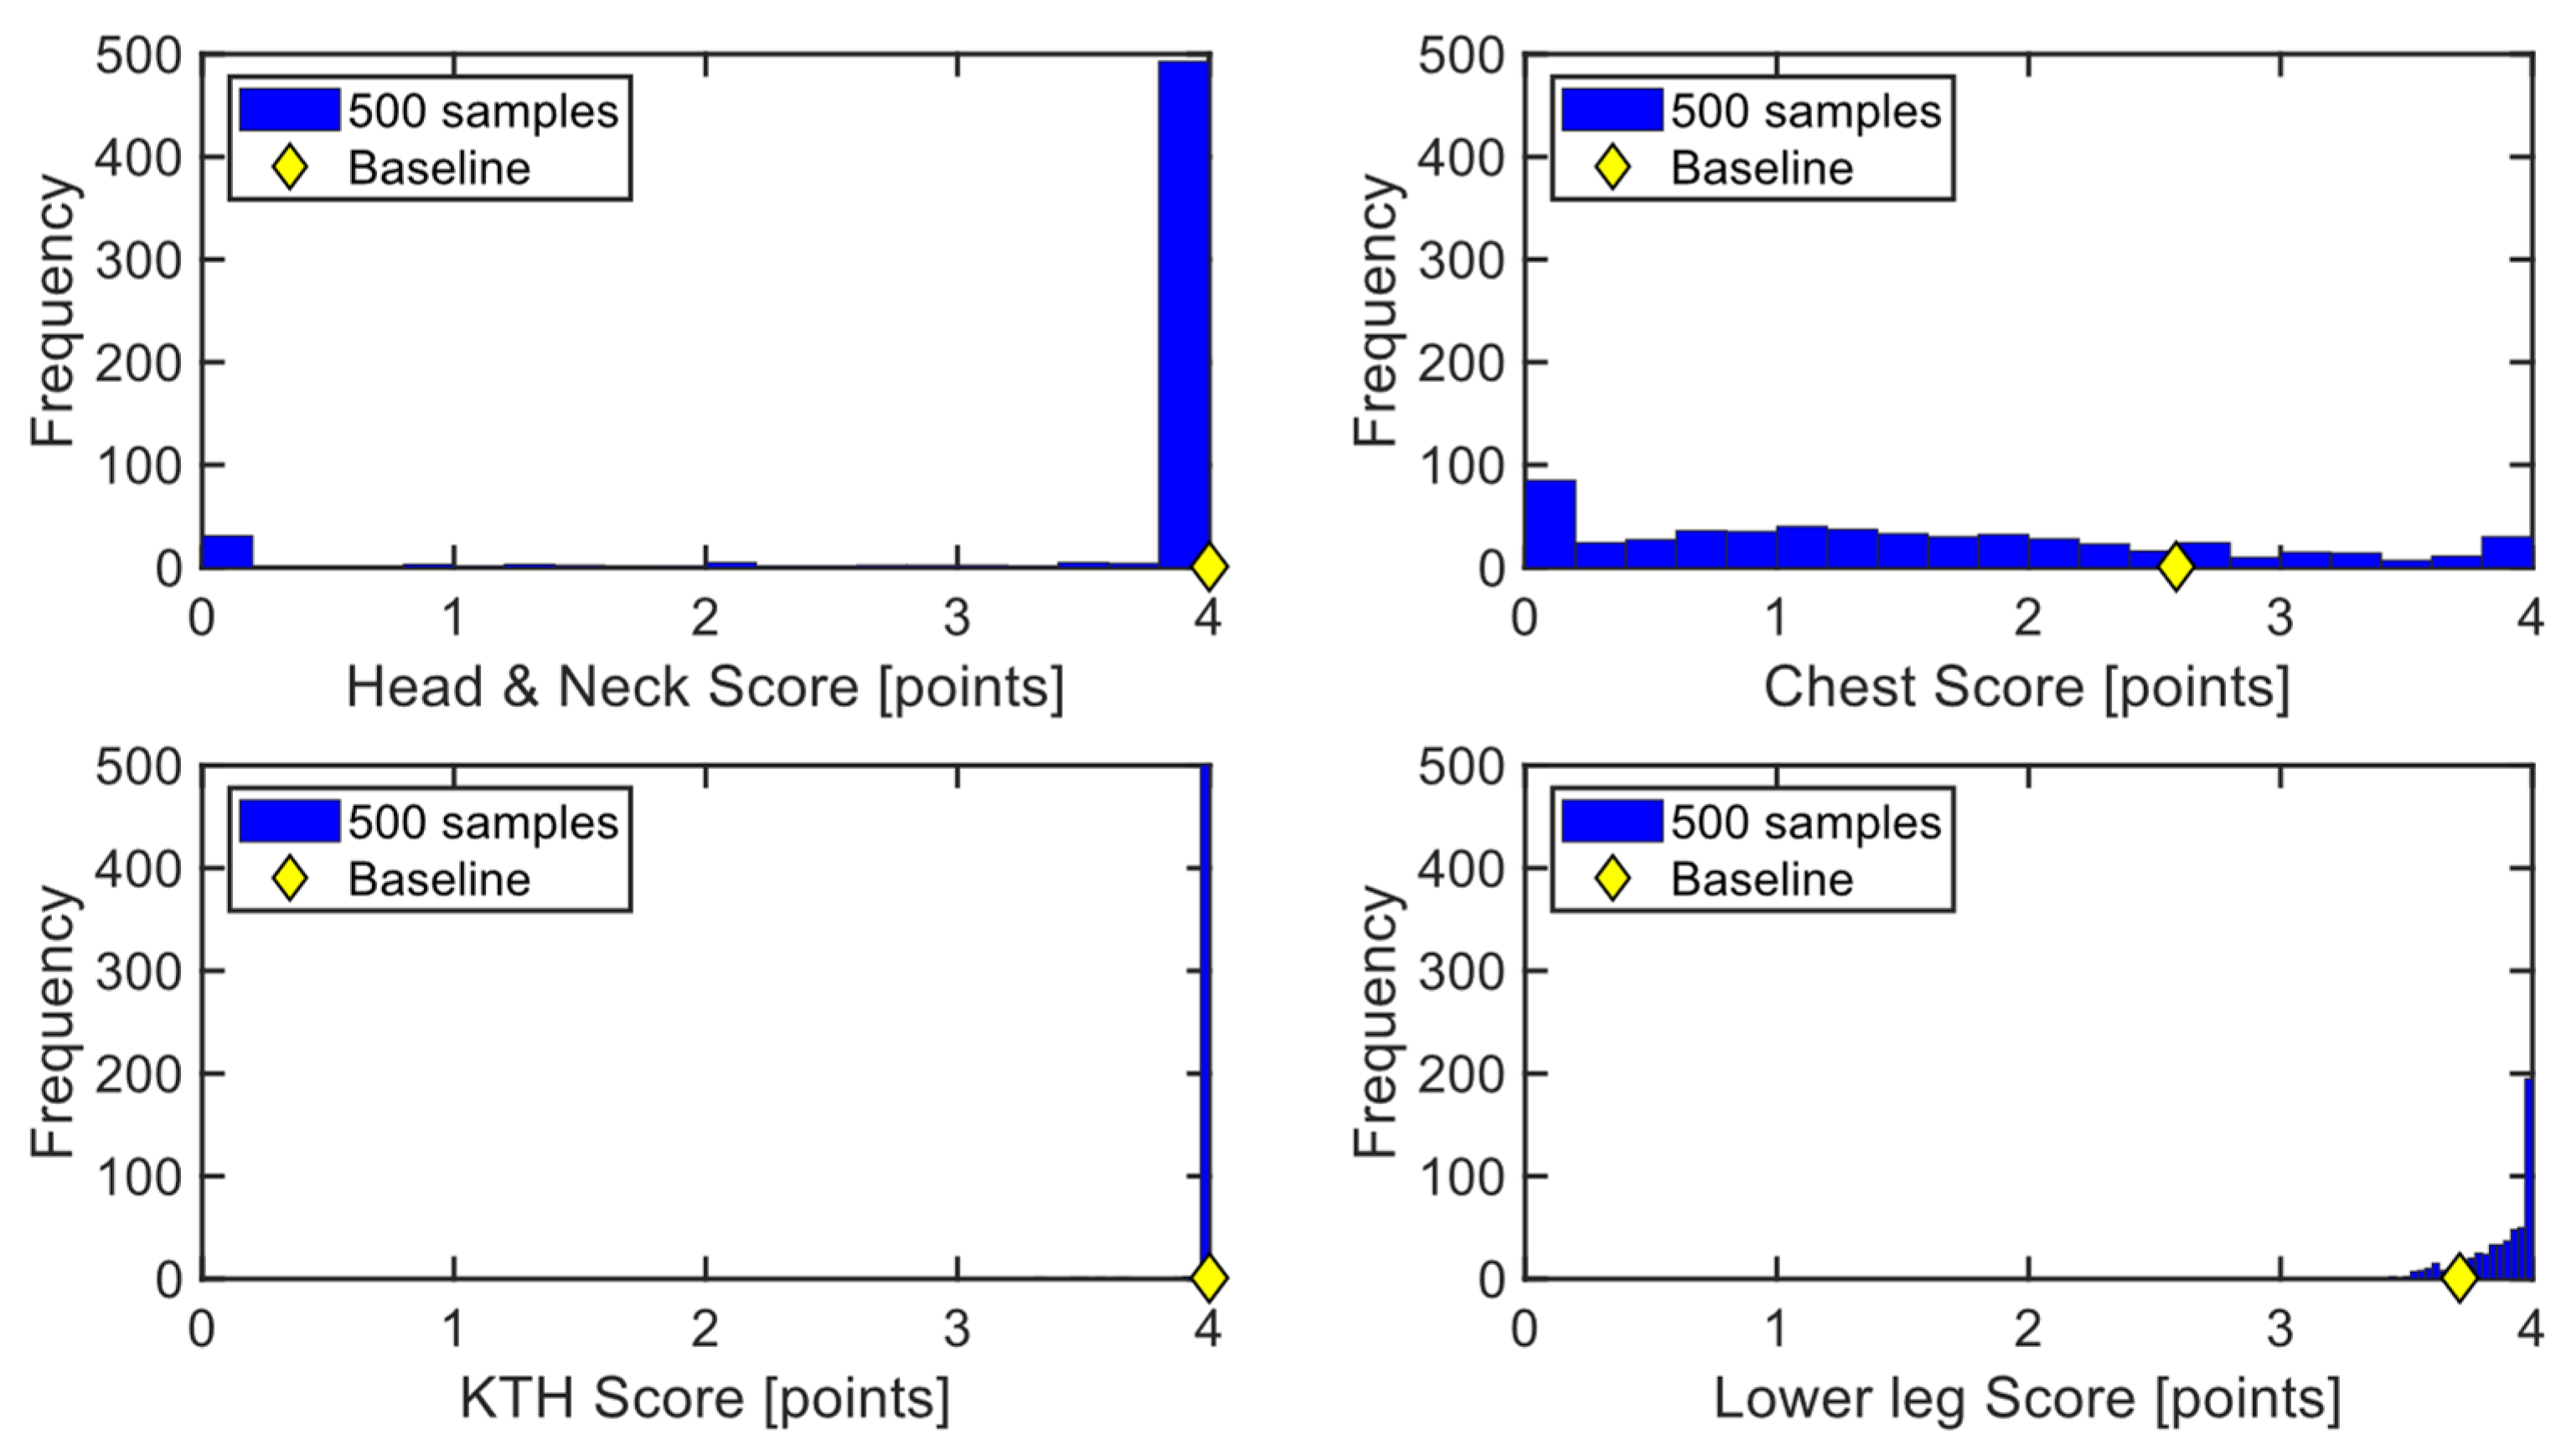
Figure 9 summarizes the distribution of calculated scores of four regions of the body obtained from a total of 500 crash simulation results. Overall, the risk was highest in the chest and abdomen area, followed by the lower leg area and the head and neck area. The KTH area had an average score of 3.99 points out of 4 points, indicating that this region would have little issue within the design domain. The best Euro NCAP score obtained among the 500 simulations was 15.6 points, which was 1.3 points higher than that of the baseline condition. Still, the full score of 16 points was not achieved due to the chest and abdomen region.

3.3. Development of Metamodels

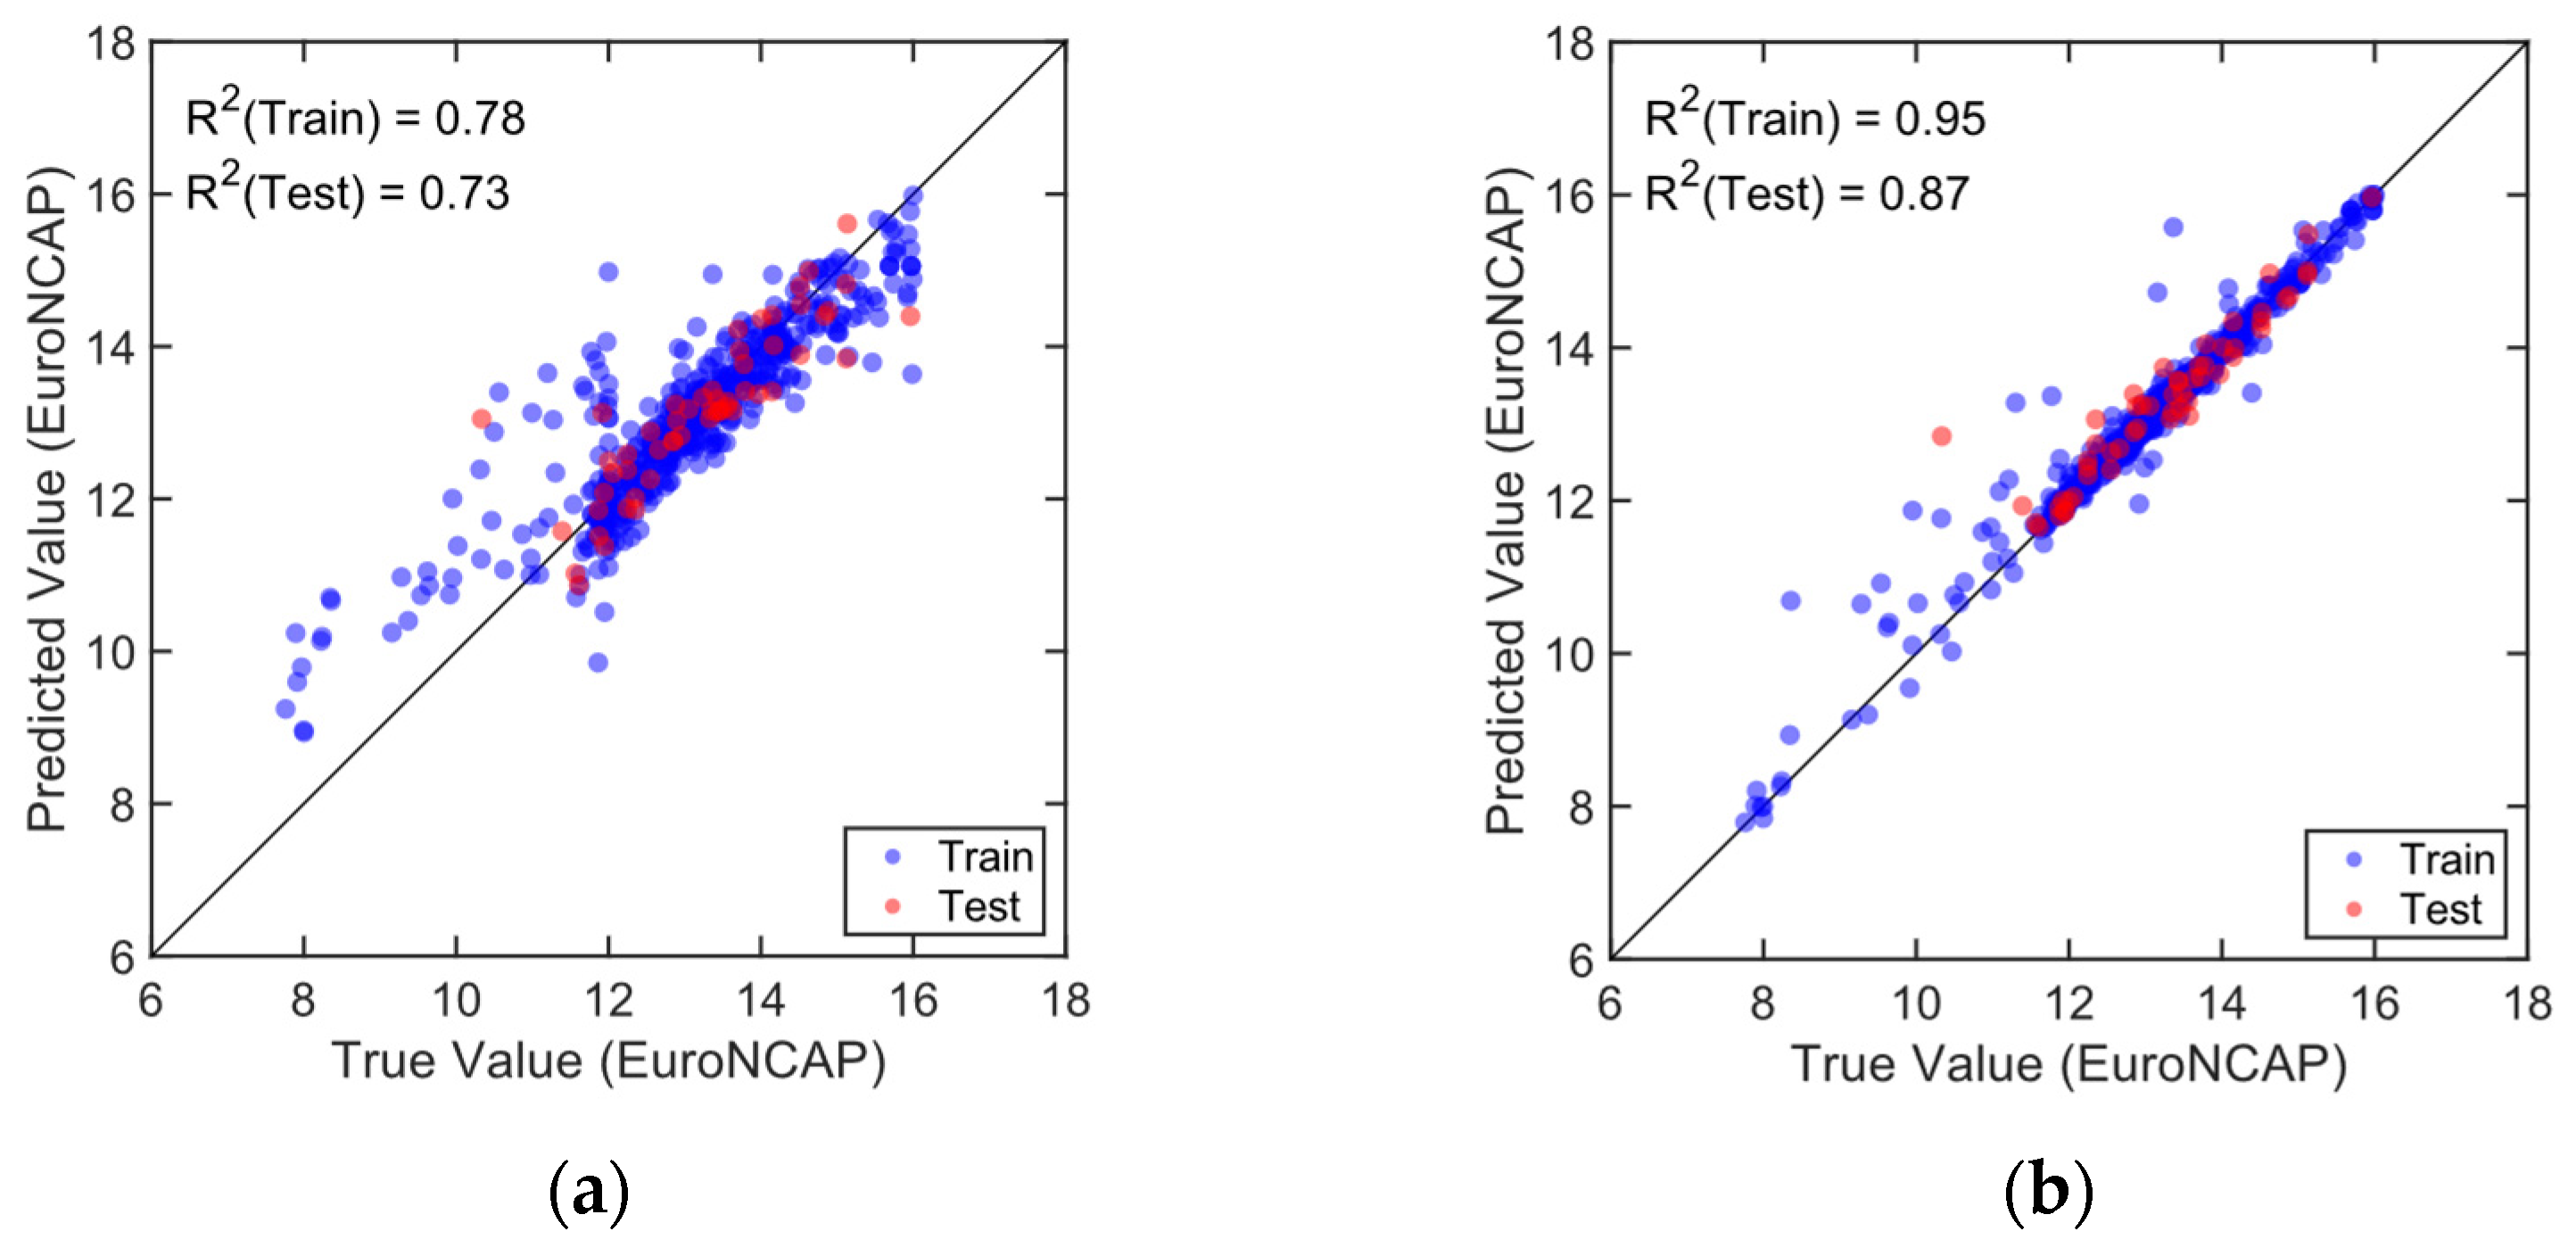
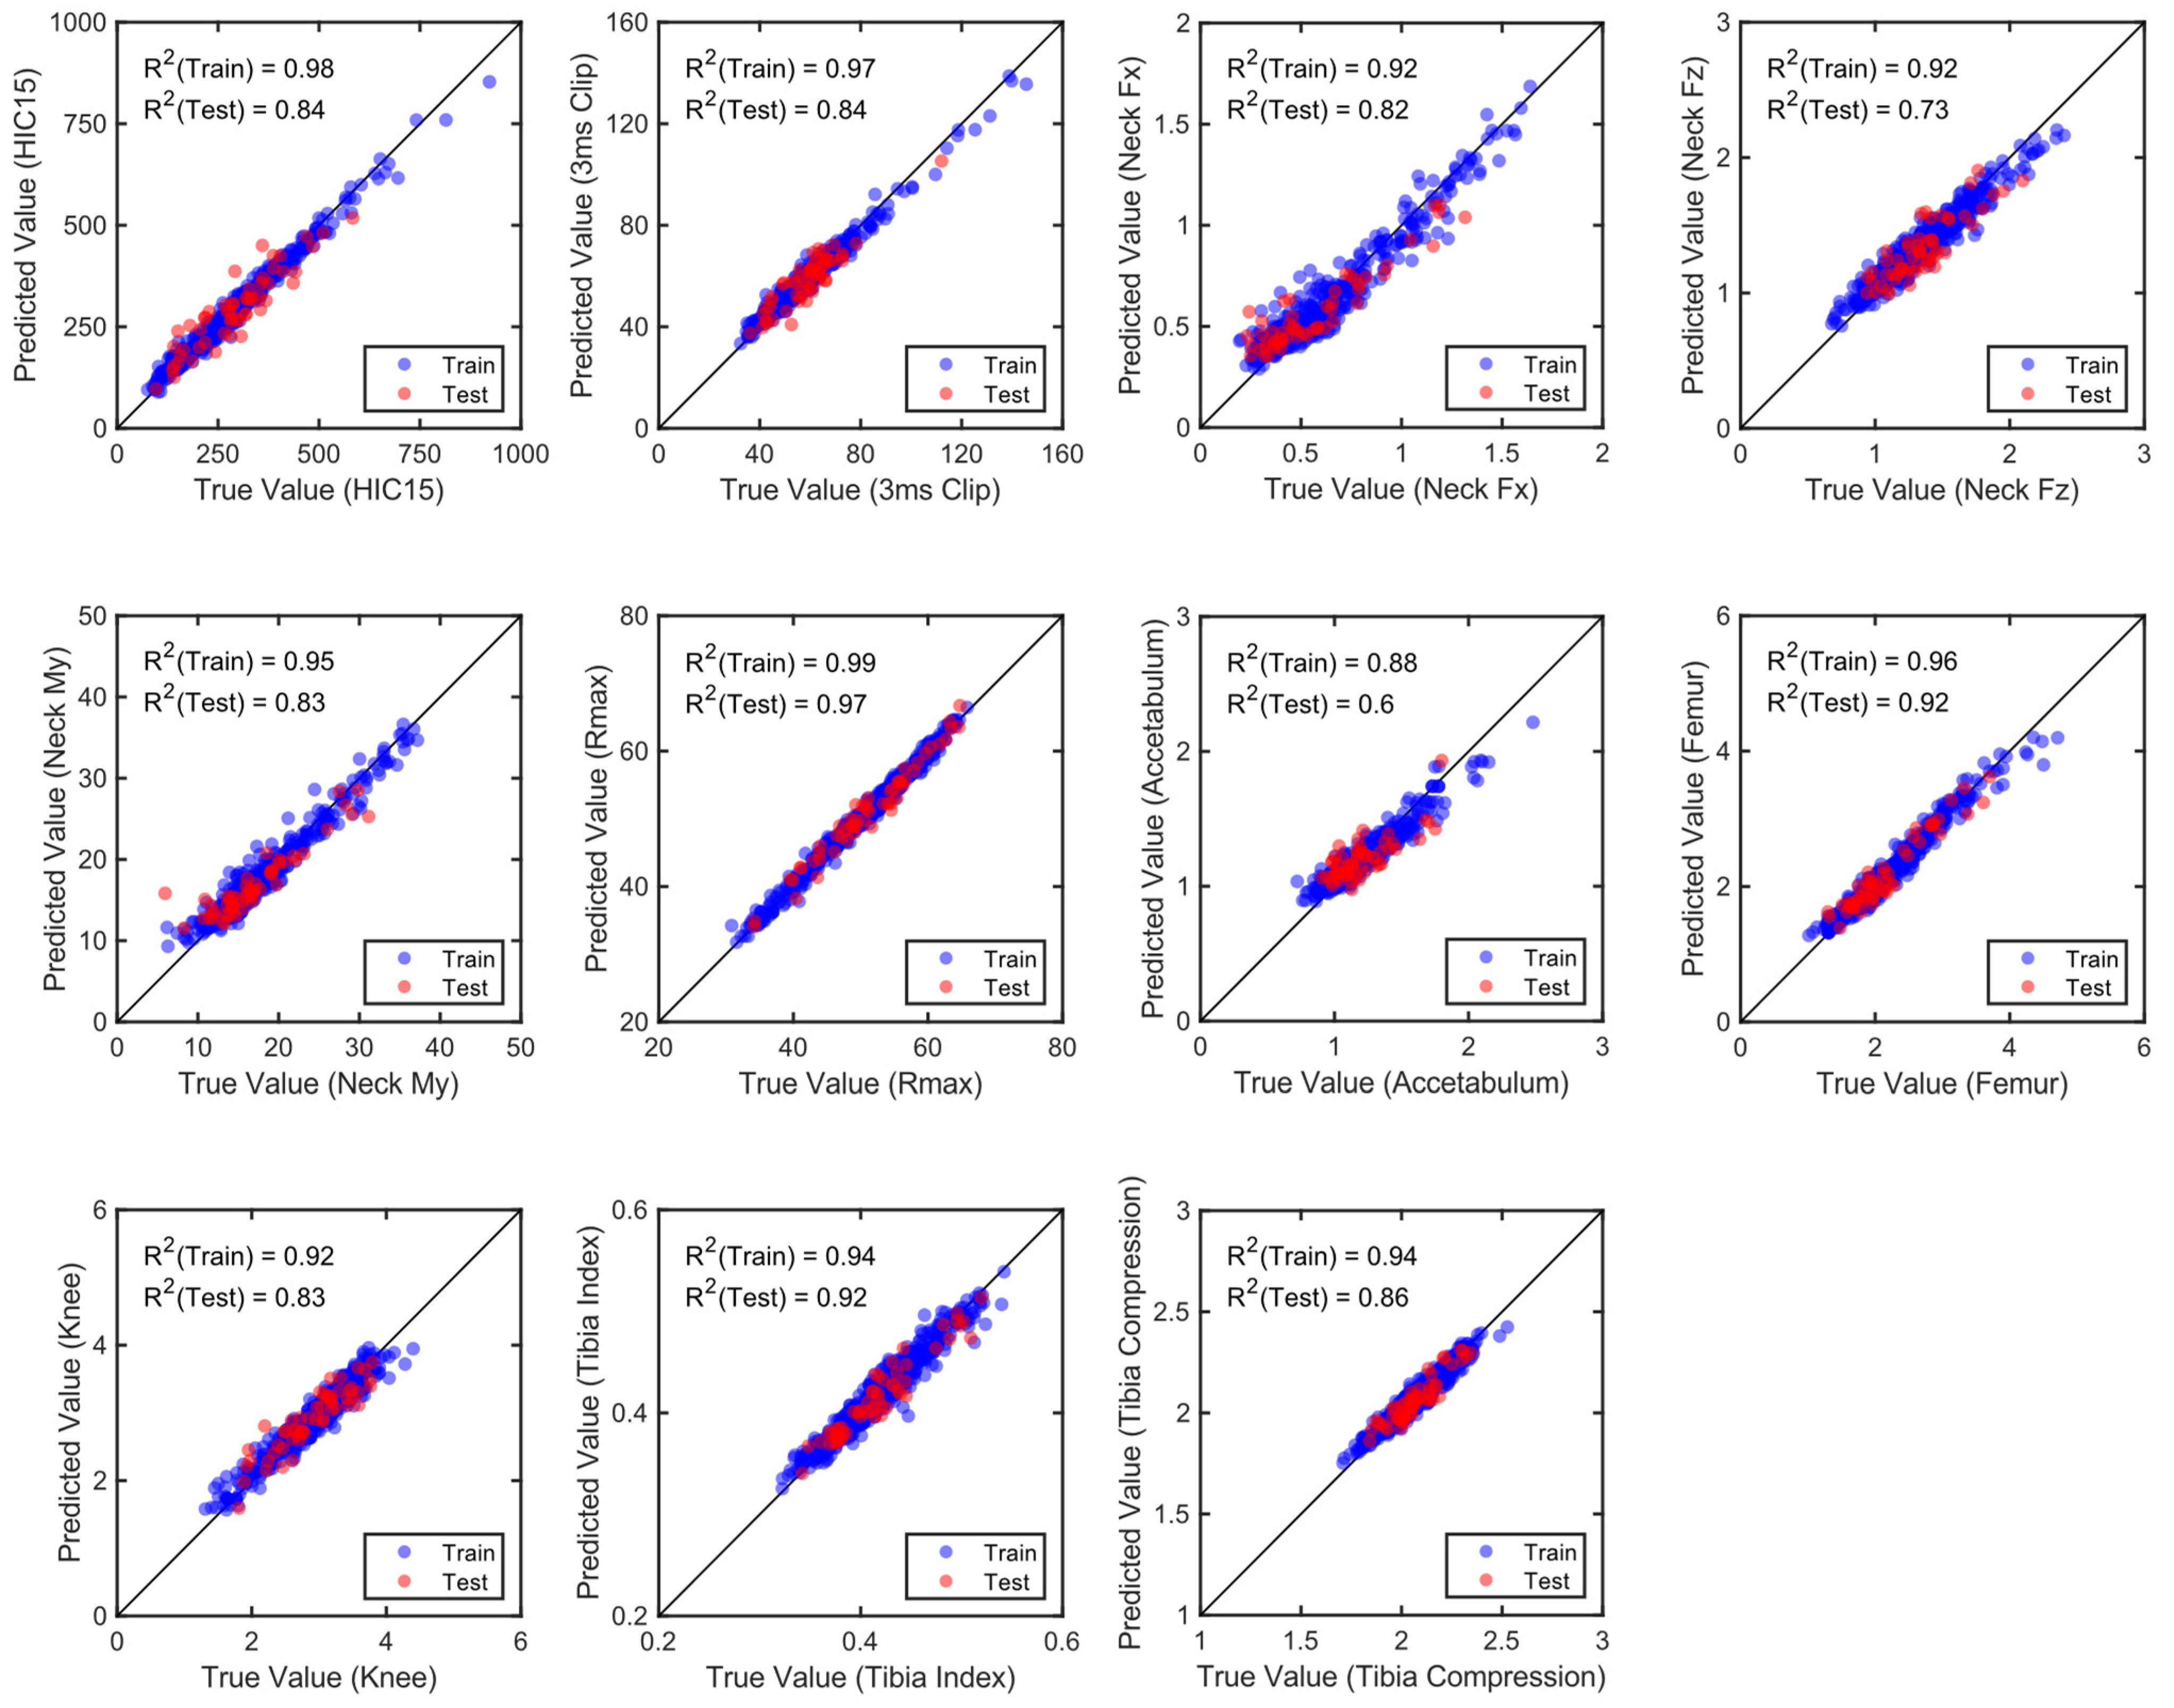
Utilizing the results from a total of 557 parametric crash simulation results, including the initial 500 designs and additional 57 designs, the final version of the metamodel was developed (see Table S1). Figure 10 displays the results of predicting Euro NCAP scores using two methods: one that predicts Euro NCAP scores directly and another that predicts the Euro NCAP scores based on the individually predicted injury criteria values. The X-axis represents Euro NCAP scores obtained from crash simulations (true value), while the Y-axis represents Euro NCAP scores predicted by the metamodel (predicted value). Points closer to the diagonal line, where y equals x, indicate more accurate predictions. When the Euro NCAP score was predicted using a single metamodel, the coefficient of determination for the test data set was 0.73. In contrast, when the Euro NCAP score was predicted using metamodels that could predict each injury metric value, the coefficient of determination for the test data set was 0.87. Figure 11 and Figure 12 display the accuracy of the metamodels in predicting individual injury metrics and present selected learning curves for these metamodels, respectively. This result implies that predicting individual injury metric values is more effective for forecasting the Euro NCAP score than directly predicting it.

3.4. Optimization and Verification

For optimizing design variables, the 11 metamodels, which predicted the 11 injury metrics individually, were used to predict the Euro NCAP score for a set of given design variable values (Figure 10b and Figure 11, Table 5). The predicted optimal design condition was then verified through a crash simulation using the optimal condition (Table 6). According to the validation simulation result of the meta optimum, the Euro NCAP score, which was a composite injury index, was improved compared to both baseline design and the best sample design. In particular, the meta optimum achieved a perfect score, which was 16 points. The meta optimum design resulted in lower injury criterion values across the board than those of the baseline, except for HIC15, head 3 ms clip, and acetabulum force. The meta optimum design significantly improved the chest area, where the baseline and sample best designs scored 2.6 and 3.6 points, respectively. When the meta optimum design was applied to a mid-size human body model (GHBM-O M50), the maximum chest deflection reduced from 34.6 mm to 30.9 mm compared to that of the baseline design.
Compared to the baseline design, the meta optimum design lowered the pulse scale from 1.0 to 0.9, resulting in a soft pulse occurrence (Figure 4). The first-stage load limit of the shoulder belt was lowered from 2.5 kN to 1.6 kN (Figure 3). Although there was a difference between the first- and second-stage load limits of the belt in the meta optimum design, the limiting loads for the two stages were similar to each other. The transition from the first stage to the second stage occurred at around 70 ms, which was close to the time of peak chest deflection. The steering column load scale was set to have a 10% higher value than that of the baseline. The position of the D-ring was moved upward and forward by 107 mm and 36.5 mm, respectively, compared to those of the baseline. Buckle Z was set to a low value, causing it to move downward. Anchor X was set to a high value, moving it forward. There were conflicting changes made for the driver’s airbag characteristics from the baseline design to the meta optimum design. While the mass flow rate was reduced from 1.0 to 0.89, the leakage and the vent size were reduced from 1.6 to 0.5 and from 1.5 to 0.56, respectively. As a result, the airbag pressure of the meta optimum condition was comparable to that of the baseline condition until 75 ms. It became higher afterwards.

3.5. Metamodel Interpretation

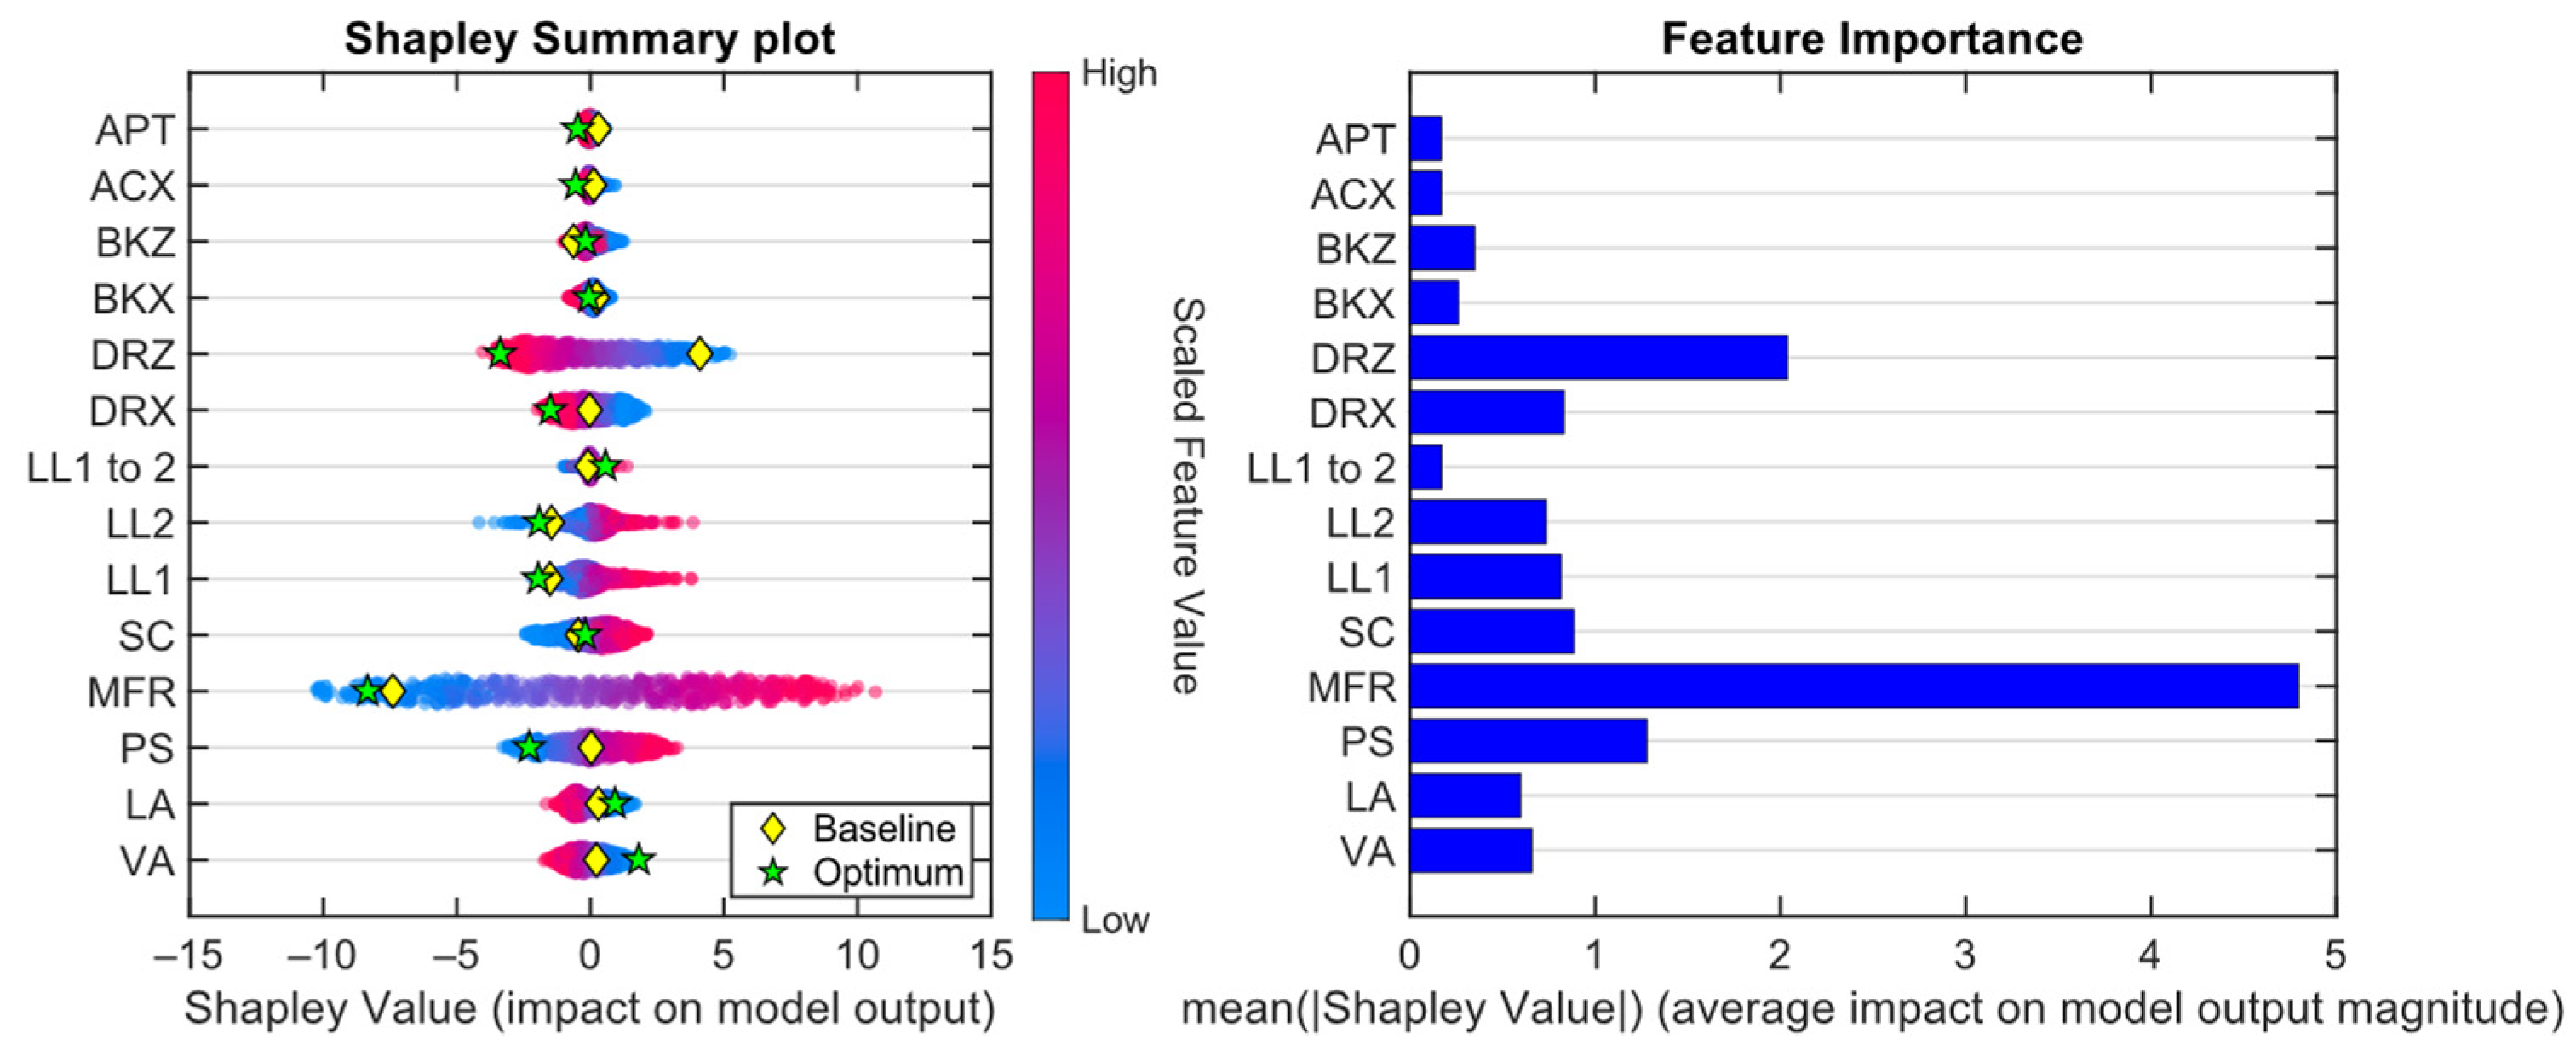
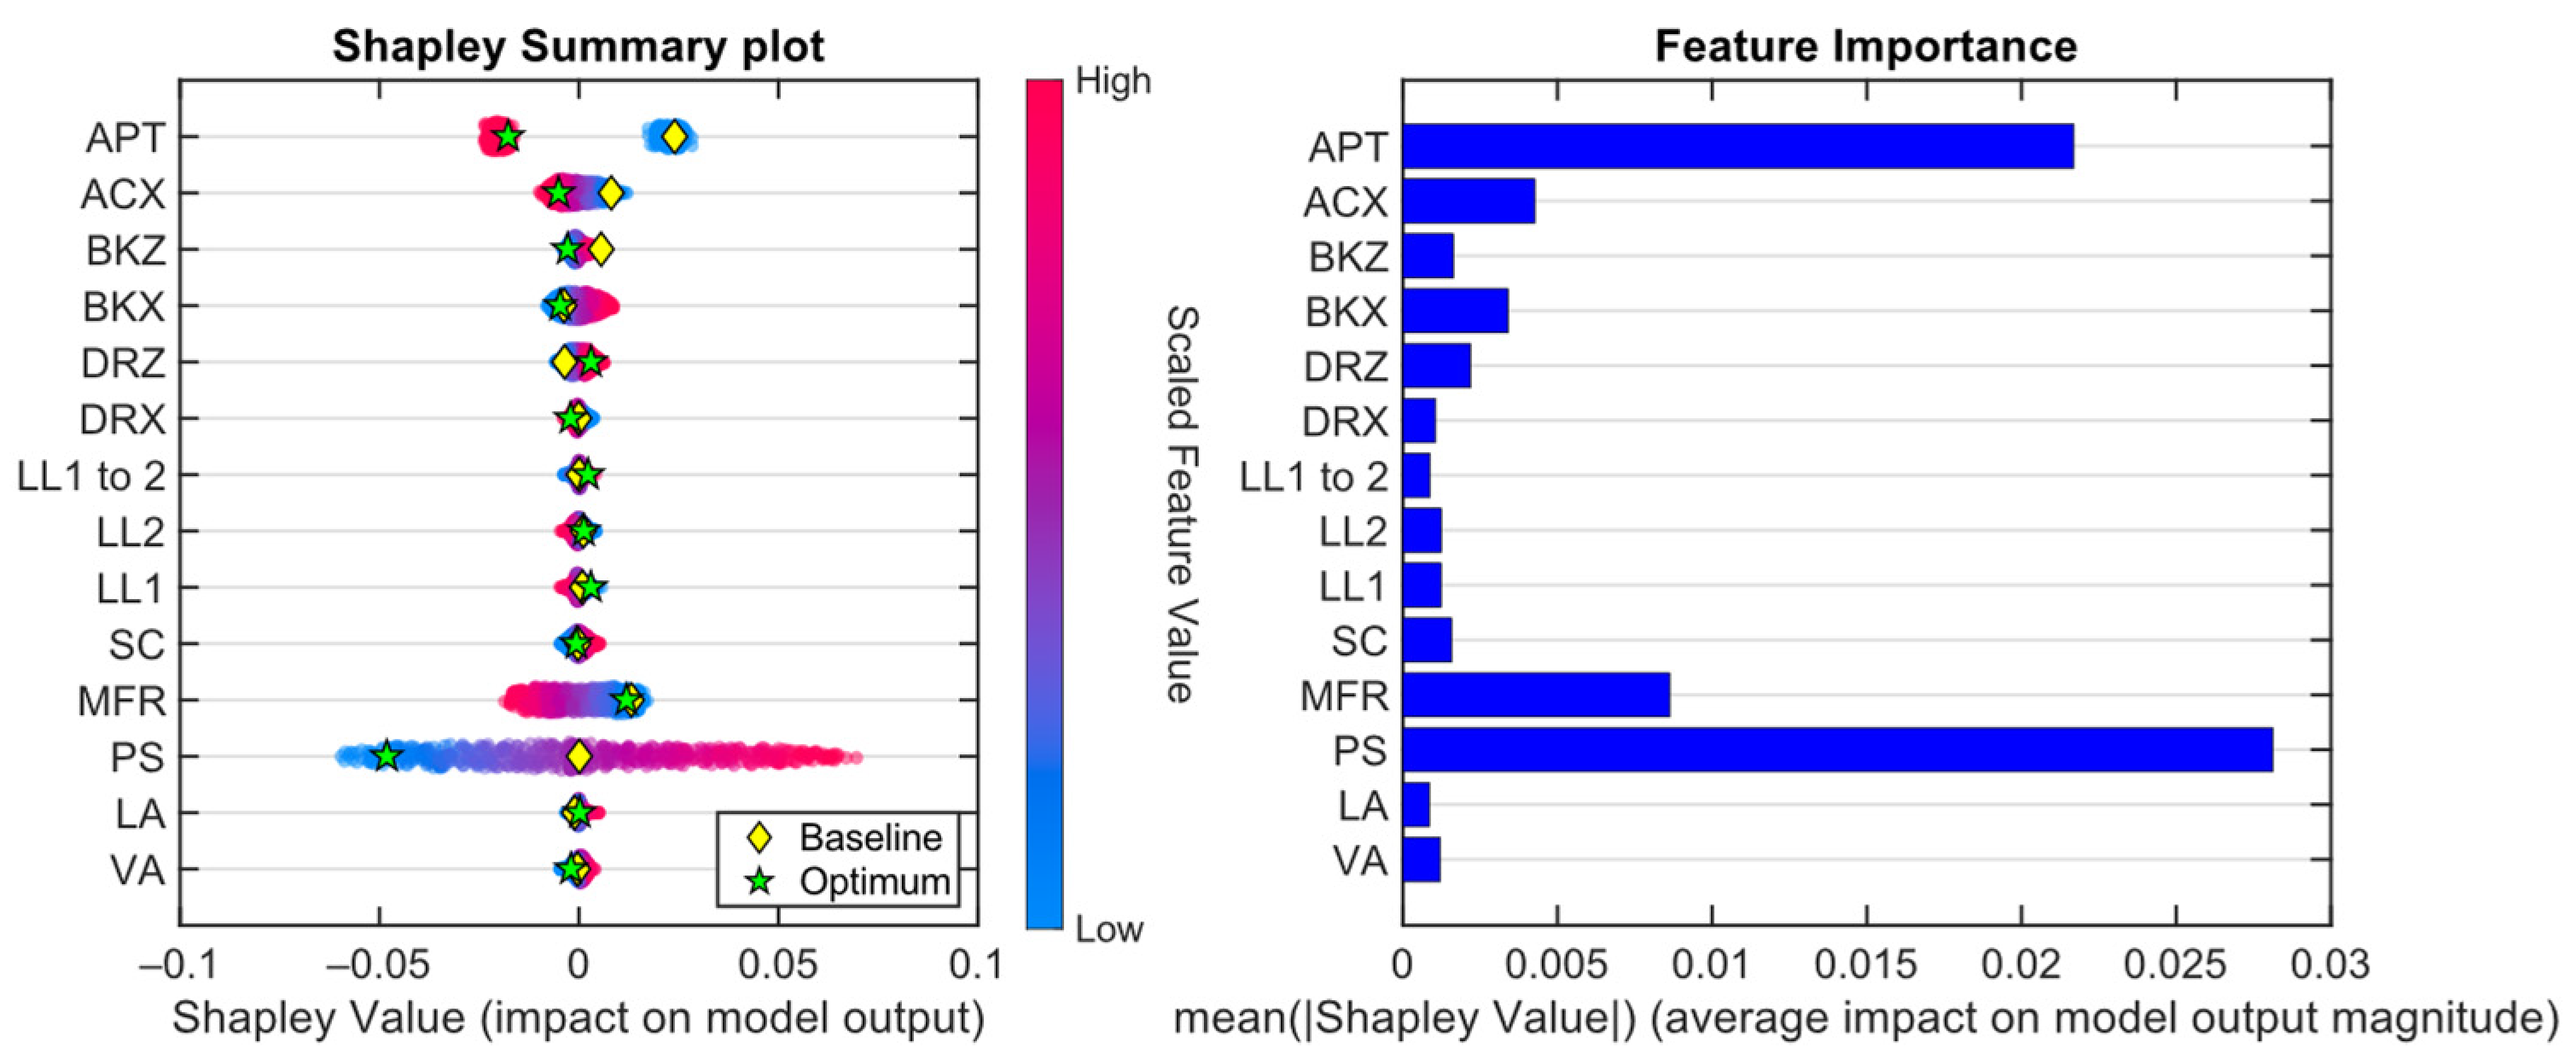
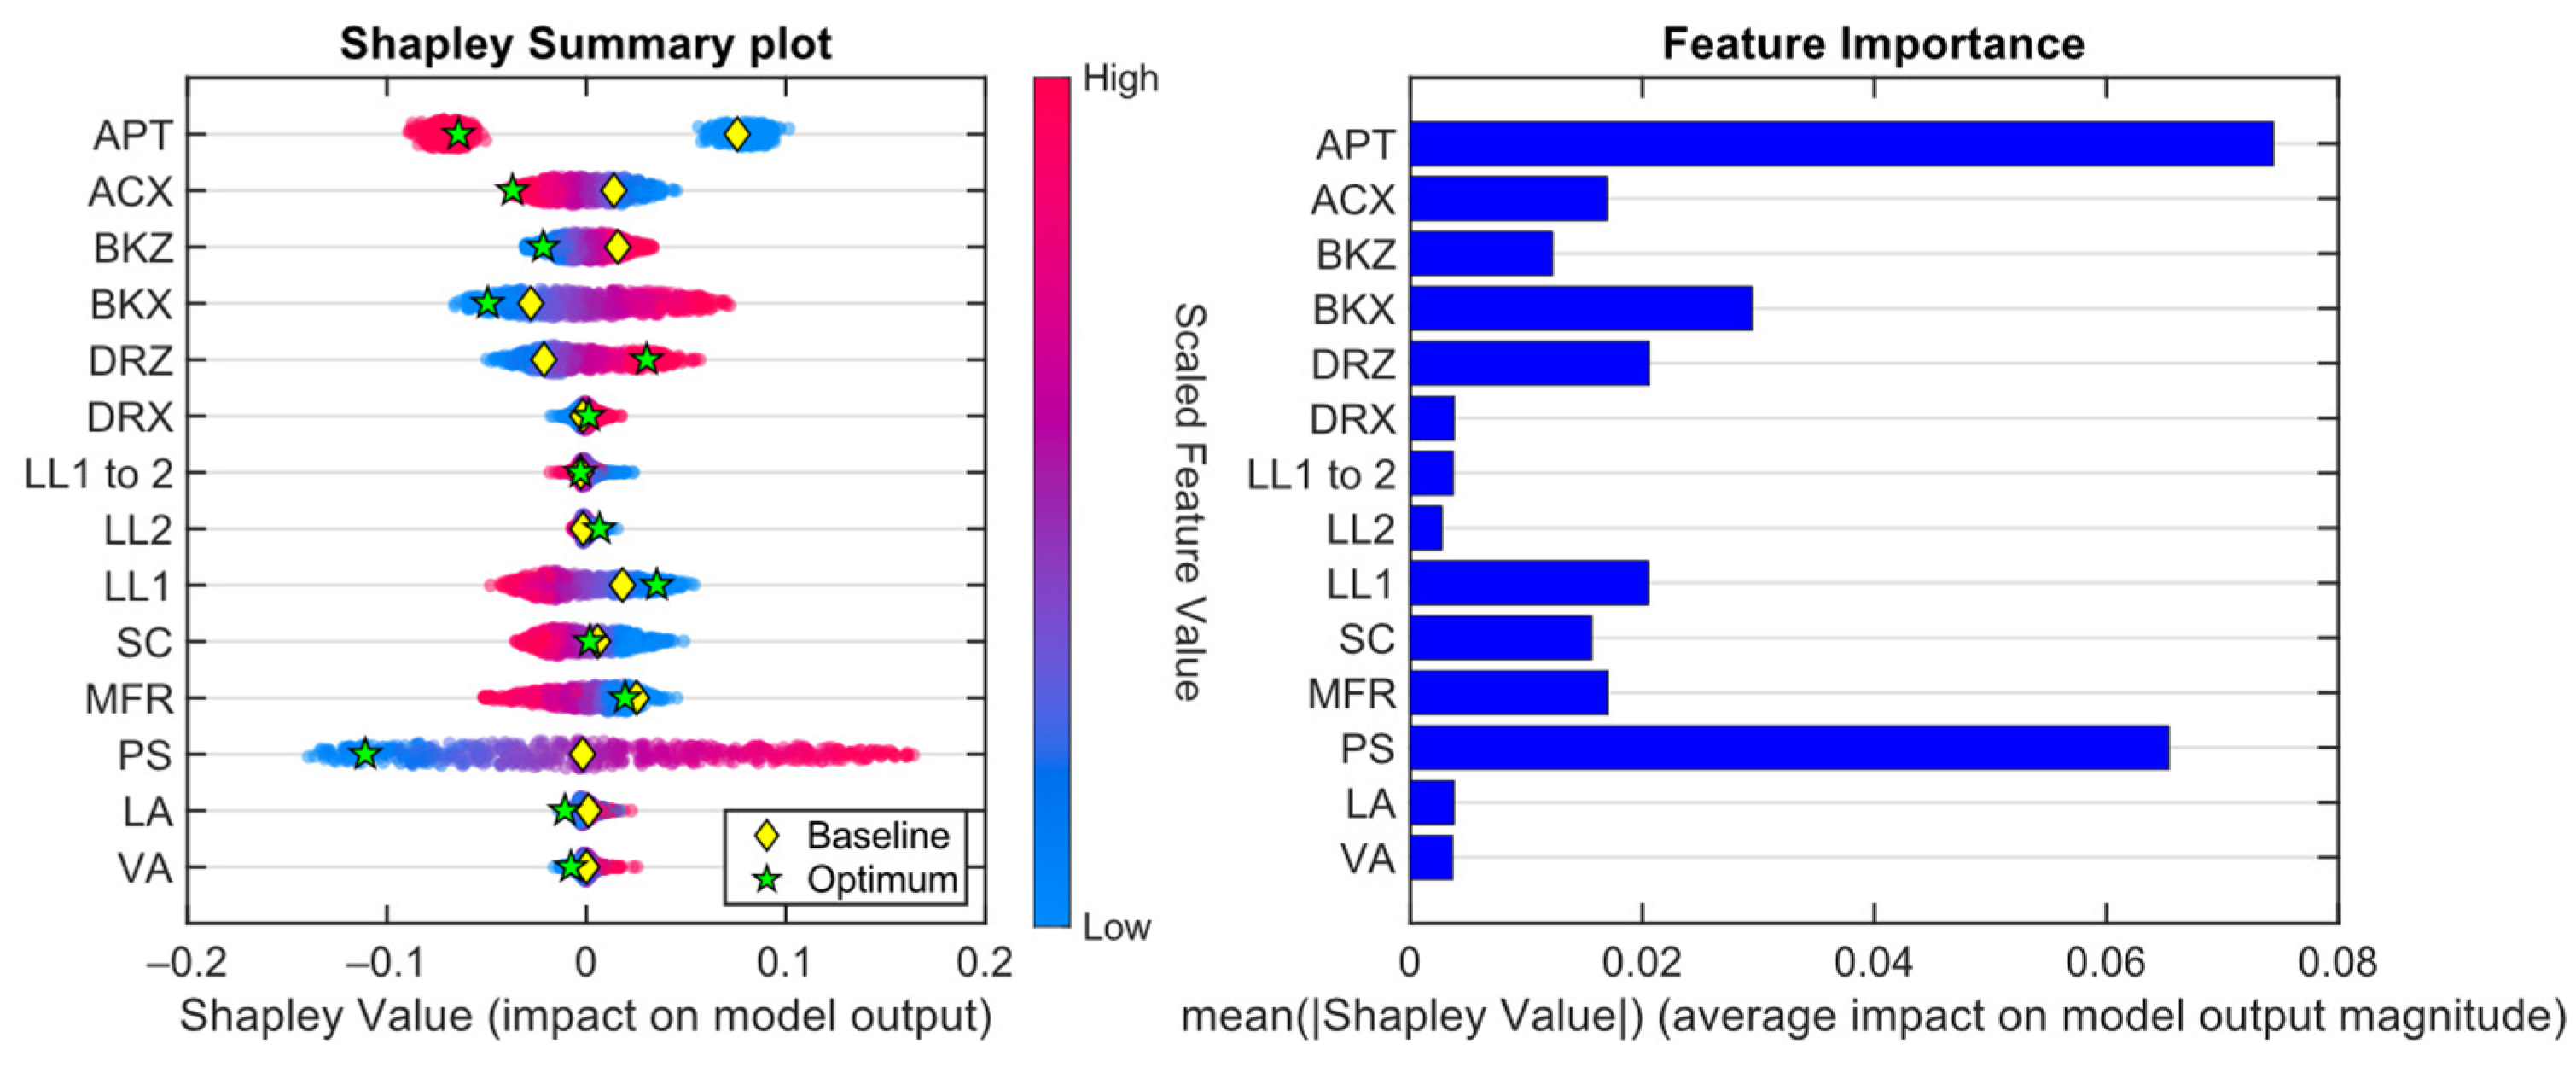
Figure 13, Figure 14 and Figure 15 show the SHAP analysis results for the maximum chest deflection, tibia index, and maximum tibia compression values, respectively. The diamond and star symbols represent design variable values for baseline and meta optimum conditions, respectively. From these three exemplary results, it could be found that optimal design variables were changed to decrease the Shapley value. The upward and forward D-ring placement, lower shoulder belt load limits, lowered driver’s airbag mass flow rate, reduced airbag gas leakage, and softened pulse contributed to lowering the chest deflection value (Figure 13 and Figure 16). Considering the changes in design variables from baseline to meta optimum conditions, D-ring height and crash pulse changes were the two main contributors to the reduction in the chest deflection. Both the tibia index and the tibia compression were influenced mostly by the change in the crash pulse and the activation of the anchor pretensioner (Figure 14 and Figure 15). Although a higher airbag mass flow rate and a higher D-ring height were preferred for improving these two tibial injury criteria, the metamodel chose not to utilize these changes due to conflict with lowering the maximum chest deflection.
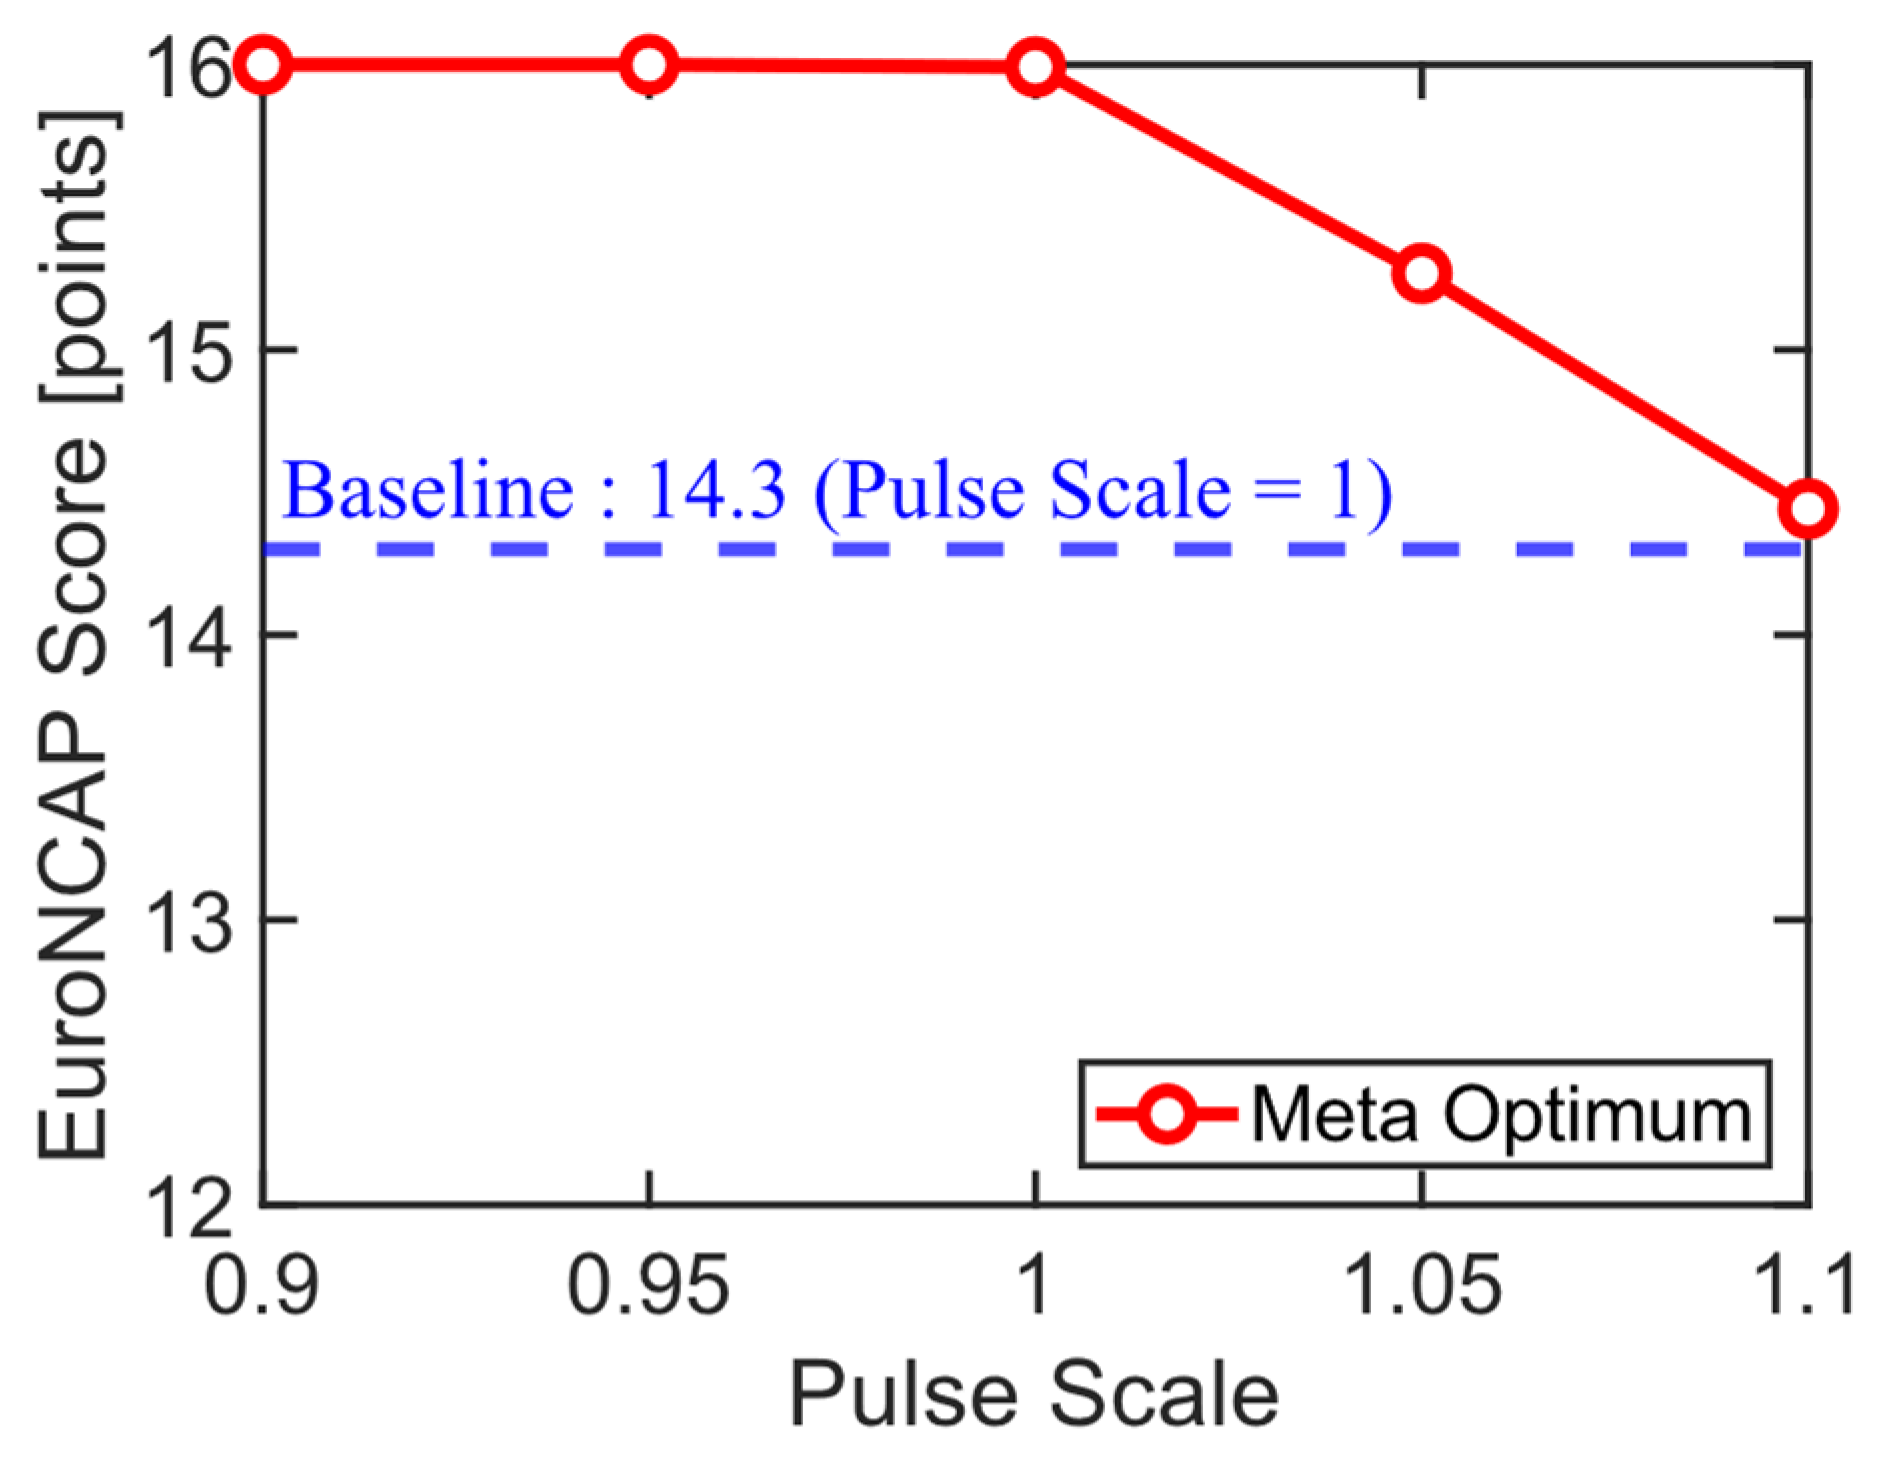
Figure 17 shows the verification simulation results of the meta optimum design, constraining the pulse scale to 0.9, 0.95, 1.0, 1.05, and 1.1. Please note that the result for the pulse scale, 1.0, was the same as the meta optimum results shown in Table 6. It was found that the softer the pulse, the higher the Euro NCAP score for the considered vehicle crash pulse in the current study. It was also evident that the three injury criteria, for which the baseline design did not reach the lower-bound threshold, decreased as the vehicle crash pulse became softer (Figure 13, Figure 14 and Figure 15).

4. Discussion

The current study demonstrated that the performance of an occupant restraint system could be predicted and optimized using a machine learning framework. Previous studies have also shown that the overall performance of an occupant restraint system can be predicted using machine learning algorithms. One of the findings of the current study was that individually predicting injury criteria yielded higher accuracy in predicting the Euro NCAP score (R2 = 0.87) than directly predicting the overall score (R2 = 0.73) (Figure 10). Joodaki et al. (2021) predicted lost years of life (LYL), estimating the overall impact of injuries, similar to the Euro NCAP score, using machine learning methods [26]. Although the metrics differ from the Euro NCAP, the prediction accuracy (R2 = 0.72) of the LYL was lower than that of the current study (R2 = 0.87). Horii (2021) predicted individual injury metrics, such as HIC, chest acceleration, and femoral loads, but did not calculate the overall impact of injuries, such as the NCAP score [15]. The occupant response during a crash is highly non-linear due to potential hard contact between the occupant and vehicle interior. The relatively large errors from directly predicting the overall score often occur when there is hard contact between the dummy’s head and the steering wheel. When there is hard contact between the head and the steering wheel, the point of the head and neck region has 0 points. If the hard contact is barely prevented, the head and neck region score will be 4 points. It seems challenging for the machine learning algorithm employed in the current study to predict such a non-linear phenomenon when attempting a direct prediction of the Euro NCAP score. In contrast, the algorithm successfully predicted this non-linearity when focused solely on the head 3 ms clip value (Figure 11). This result implies that a machine learning method can effectively predict a specific injury criterion from frontal crash simulations. Furthermore, it exhibited higher accuracy in predicting the overall score, specifically the Euro NCAP score in this study.
For the crash simulation, for which sophisticated models require substantial computation time, learning curve analysis was performed. The learning curve analysis from the current study indicated that around 300 frontal crash simulations were required to train a metamodel for predicting the injury criteria (Figure 12). Interestingly, Horii (2021) also demonstrated that the prediction accuracy of a response surface model for predicting HIC value starts to converge after the training sample size for simulations reaches 300 [15]. The author used multibody occupant and vehicle models, which were much simpler than the occupant and vehicle models used in the current study. Therefore, the 300-person sample size in a metamodel for predicting occupant behavior during a belted frontal crash condition might be applied to other frontal crash simulation models with various complexities. After the first round of the optimization trial, it is possible that the verification simulation of a meta optimum condition does not result in the predicted performance. A space-filling procedure is then required, which means that more training data can be generated by executing additional parametric crash simulations. Schneider et al. (2022) utilized the MaxPro method to maximize the contribution of each additional training sample to improve the prediction performance of metamodels [27,28].
The optimal design of restraint systems predicted by the metamodel resulted in 16 points of the Euro NCAP score, which was the full score, in the verification simulation. Please note that this meta optimum result was better than that of the sample best. The highest improvement stemmed from the reduction in the maximum chest deflection, which was improved by 1.4 points, followed by the lower leg region, which was improved by 0.3 points. In the optimization process, airbag mass flow rate, D-ring height, vehicle deceleration pulse, and the load limits were the most influential design variables for maximum chest deflection of the THOR dummy (Figure 13). Among these design variables, the D-ring height change was attributed to most of the reduction in the maximum chest deflection based on the Shapley analysis. The D-ring height was increased almost to its upper bound and moved forward (Table 5 and Figure 16). Although the belt route of the meta optimum resulted in a belt route that was closer to the upper-right IR-TRACC compared to that of the baseline, it resulted in better shoulder engagement and less yawing of the torso of the dummy. Eggers et al. (2014) performed a frontal crash sled test using a physical THOR dummy with two D-ring heights. The authors showed that the lower D-ring height was beneficial to reducing the chest compression of the THOR dummy [29]. It should be noted that the authors only considered the X-component of the chest deflection, while the resultant chest deflection was used in the current study. The contribution of the mass flow rate was lower than the D-ring height because the baseline airbag mass flow rate was close to that of the optimal value. For the lower leg regions, design variables of the meta optimum were selected to reduce pelvic forward excursion. Anchor pretensioner, rear-loaded crash pulse, and forward anchor placement are examples (Figure 14 and Figure 15). Among these changes, the activation of the anchor pretensioner and the choice of the rear-loaded crash pulse were the most influential changes. Although the human surrogates between Joodaki et al. (2021) and the current study are different, Joodaki et al. (2021) showed that the anchor pretensioner was beneficial in lowering lost years of life based on the GHBMC human body model [26]. From the Shapley analysis, some design variables were chosen to increase the injury criteria, which could be understood as a consideration of a trade-off among counteracting the effects of variables on different injury criteria. The meta optimum derived using the THOR model was demonstrated to be effective for a mid-size male GHBM-O model. Although there was a small difference in Euro NCAP scores between the baseline and meta optimum for the GHBM-O model, the chest deflection value was reduced from 34.6 mm to 30.9 mm.
Improving the Euro NCAP crash performance by changing the vehicle crash pulse is more difficult than changing the occupant restraint system. Therefore, a constrained optimization of the occupant restraint system was performed by constraining the vehicle deceleration pulse to five specific conditions including the baseline condition. When the crash pulse was constrained to the level of the baseline deceleration pulse, the optimal condition, which was also verified by the verification simulation, demonstrated a full score of 16 points for the Euro NCAP score. A more rear-loaded pulse than the baseline pulse resulted in a higher Euro NCAP score (Figure 17). For a pulse harder than the baseline, the full score of the Euro NCAP was not achievable using the considered design space. Due to saturation in the current Euro NCAP scoring system at 16 points, it is unclear whether a pulse softer than the baseline vehicle deceleration pulse is beneficial to occupant protection. Similarly, Hu et al. (2017) demonstrated the benefit of a softer pulse for rear-seated occupants using crash simulation results [30]. The proposed optimization method for restraint systems using a metamodel can be used to evaluate the necessity of a changing vehicle deceleration pulse. This approach of optimizing through constraint settings not only aids in understanding the effect of the pulse on human injuries but also serves as a useful method for deriving practical optimal safety solutions, considering variables such as D-ring height.
One of the limitations is the necessity of extensive computation time. In the current study, 500 simulations were completed in 3 days using around 2000 cores. The number of cores per simulation, which was 32 cores, was optimized to minimize the entire computation time for the 500 simulations. In contrast to the required relatively large number of simulations, the entire optimization process, which includes crash simulation model generation, execution of simulations, building meta models, and so on, can be automated once a parametric crash simulation model is built (Figure 1). At the cost of extensive simulation time, we can obtain clearer pictures of the effects of design variables on individual injury criteria and the overall performance in a much wider design space compared to the traditional design of experiment method (Figure 13, Figure 14 and Figure 15). In addition, although the simulation model was validated against the experimental test data under the baseline condition, the findings from the current study need to be verified through an experimental study with a physical THOR dummy. Using a simplified vehicle buck and deceleration sled systems, it would be relatively easy to perform the verification tests.
As Joodaki et al. (2021) suggested and the current study demonstrated, the developed machine learning-based occupant protection performance prediction can be expanded to develop an adaptive restraint system, which adjusts its operation setting depending on the crash and occupant conditions [16]. As the proportion of the elderly occupant population grows and various seating configurations emerge with autonomous driving technologies, the adaptive capabilities of the restraint system will become important.

5. Conclusions

The current study demonstrated an optimization process of an occupant restraint system, utilizing neural network-based metamodels trained using crash simulation results. During the metamodeling, individually predicting injury criteria yielded higher accuracy in predicting the Euro NCAP score than directly predicting the overall score. Also, the THOR dummy-specific information regarding the relation between the restraint system parameters, which includes belt anchorage locations, crash pulses, airbag characteristics, and so on, and THOR dummy responses was derived using detailed and validated simulation models. The performance of the occupant restraint system was improved following the proposed systematic process, which included parametric crash simulation, training of the metamodels for predicting injury criteria, optimization of the restraint system, and verification simulation. Shapley analysis of the developed metamodels was also used for interpreting the optimization results and for identifying underlying trade-off considerations on the selection of design variable values. Under the considered vehicle model and the crash condition, higher D-ring placement, rear-loaded crash pulse, and lower load limits than those of the baseline model were found to be beneficial for decreasing the maximum resultant chest deflections of the THOR dummy. For the lower leg region, anchor pretensioner, rearward anchor placement, and rear-loaded crash pulse were found to be beneficial for decreasing injury criteria. The optimal design obtained for the THOR dummy model was also beneficial for a mid-size male human body model. A higher front-loaded crash pulse than the baseline resulted in worse overall performance. In summary, this study applied a new dummy introduced to optimize restraint systems and proposed a machine learning framework to understand the impact of design variables on injury metrics. The SHAP method can serve as a valuable tool for visualization and knowledge acquisition for restraint system development engineers. The optimum conditions and the effects of the design parameters need to be verified through experimental studies. Lastly, the proposed method may be a useful tool in developing adaptive restraint systems by allowing for the identification of the optimum occupant restraint setting for various crash conditions.

Supplementary Materials

The following supporting information can be downloaded at: https://www.mdpi.com/article/10.3390/machines12010074/s1. Table S1. Euro NCAP MPDB frontal crash simulation results using THOR dummy model, Machine learning training data has been added in Excel format.

Author Contributions

Conceptualization, T.K.; methodology, T.K.; software, J.H.; validation, T.K.; formal analysis, J.H. and T.K.; investigation, T.K.; resources, M.G.C.; data curation, J.H.; writing—original draft preparation, J.H.; writing—review and editing, T.K.; visualization, J.H. and T.K.; supervision, T.K.; project administration, T.K.; funding acquisition, T.K. All authors have read and agreed to the published version of the manuscript.

Funding

This work is supported by the Korea Agency for Infrastructure Technology Advancement (KAIA) grant funded by the Ministry of Land, Infrastructure and Transport (RS-2021-KA160637).

Data Availability Statement

Data are contained within the article and Supplementary Materials.

Acknowledgments

Special thanks to Hyundai Motor Group for providing vehicle crash simulation model and the sled test data. The views expressed in this paper are those of the authors and do not necessarily reflect the views of the Hyundai Motor Group.

Conflicts of Interest

The funders had no role in the design of the study; in the collection, analyses, or interpretation of data; in the writing of the manuscript; or in the decision to publish the results.

References

  1. Miller, T.R.; Bhattacharya, S.; Zaloshnja, E. Fruits of 20 years of highway safety legislative advocacy in the United States. In Annals of Advances in Automotive Medicine/Annual Scientific Conference; Association for the Advancement of Automotive Medicine: Chicago, IL, USA, 2011; Volume 55, p. 357. [Google Scholar]
  2. O’Neill, B. Preventing passenger vehicle occupant injuries by vehicle design—A historical perspective from IIHS. Traffic Inj. Prev. 2009, 10, 113–126. [Google Scholar] [CrossRef]
  3. Fang, J.; Sun, G.; Qiu, N.; Kim, N.H.; Li, Q. On design optimization for structural crashworthiness and its state of the art. Struct. Multidiscip. Optim. 2017, 55, 1091–1119. [Google Scholar] [CrossRef]
  4. Bhalla, K.; Gleason, K. Effects of vehicle safety design on road traffic deaths, injuries, and public health burden in the Latin American region: A modelling study. Lancet Glob. Health 2020, 8, e819–e828. [Google Scholar] [CrossRef] [PubMed]
  5. Forman, J.; Poplin, G.S.; Shaw, C.G.; McMurry, T.L.; Schmidt, K.; Ash, J.; Sunnevang, C. Automobile injury trends in the contemporary fleet: Belted occupants in frontal collisions. Traffic Inj. Prev. 2019, 20, 607–612. [Google Scholar] [PubMed]
  6. Bai, Z.; Jiang, B.; Zhu, F.; Cao, L. Optimizing the passenger air bag of an adaptive restraint system for multiple size occupants. Traffic Inj. Prev. 2014, 15, 556–563. [Google Scholar] [PubMed]
  7. Sandner, V.; van Ratingen, M.; Ellway, J. Euro ncap-new frontal impact test with mobile progressive deformable barrier (mpdb). In Proceedings of the 26th International Technical Conference on the Enhanced Safety of Vehicles (ESV): Technology: Enabling a Safer Tomorrow National Highway Traffic Safety Administration, Eindhoven, The Netherlands, 10–13 June 2019. paper number. 19-0196. [Google Scholar]
  8. Parent, D.; Craig, M.; Moorhouse, K. Biofidelity Evaluation of the THOR and Hybrid III 50th Percentile Male Frontal Impact Anthropomorphic Test Devices (No. 2017-22-0009); SAE Technical Paper; SAE: Warrendale, PA, USA, 2017. [Google Scholar]
  9. Yoganandan, N.; Pintar, F.A.; Moore, J.; Maiman, D.J. Sensitivity of THOR and Hybrid III dummy lower neck loads to belt systems in frontal impact. Traffic Inj. Prev. 2011, 12, 88–95. [Google Scholar]
  10. McMurry, T.L.; Sherwood, C.; Poplin, G.S.; Seguí-Gómez, M.; Crandall, J. Implications of functional capacity loss and fatality for vehicle safety prioritization. Traffic Inj. Prev. 2015, 16 (Suppl. 2), S140–S145. [Google Scholar] [CrossRef]
  11. Sunnevång, C.; Lecuyer, E.; Hynd, D.; Carroll, J.; Kruse, D.; Boström, O. Evaluation of near-side oblique frontal impacts using THOR with SD3 shoulder. Traffic Inj. Prev. 2014, 15 (Suppl. 1), S96–S102. [Google Scholar] [CrossRef]
  12. Liufu, K.; Liu, Q.; Lu, Y.; Chen, Z.; Zhang, Z.; Li, Q. Multiobjective optimization on cooperative control of autonomous emergency steering and occupant restraint system for enhancing occupant safety. Accid. Anal. Prev. 2021, 159, 106302. [Google Scholar] [CrossRef]
  13. Wang, D.; Zhang, J.; Zhang, T.; Zhang, H.; Peng, Y. A Coupling Optimization Method of Vehicle Structure and Restraint System for Occupant Injury Protection in Traffic Accidents. Symmetry 2023, 15, 558. [Google Scholar]
  14. Zhang, J.; Wang, D.; Ni, Y.; Chen, C. A two degrees of freedom model–based optimization method for occupant restraint systems in vehicle crash. Struct. Multidiscip. Optim. 2019, 60, 2597–2614. [Google Scholar]
  15. Horii, H. Advancement of vehicle occupant restraint system design by integration of artificial intelligence technologies. Int. J. Transp. Dev. Integr. 2021, 5, 242–253. [Google Scholar]
  16. Joodaki, H.; Gepner, B.; Lee, S.H.; Katagiri, M.; Kim, T.; Kerrigan, J. Is optimized restraint system for an occupant with obesity different than that for a normal BMI occupant? Traffic Inj. Prev. 2021, 22, 623–628. [Google Scholar] [CrossRef] [PubMed]
  17. Du, X.; Xu, H.; Zhu, F. A data mining method for structure design with uncertainty in design variables. Comput. Struct. 2021, 244, 106457. [Google Scholar]
  18. Lundberg, S.M.; Lee, S.I. A unified approach to interpreting model predictions. Adv. Neural Inf. Process. Syst. 2017, 30, 1–10. [Google Scholar]
  19. Chen, H.; Chen, H.; Zhou, R.; Liu, Z.; Sun, X. Exploring the mechanism of crashes with autonomous vehicles using machine learning. Math. Probl. Eng. 2021, 2021, 5524356. [Google Scholar] [CrossRef]
  20. Dong, S.; Khattak, A.; Ullah, I.; Zhou, J.; Hussain, A. Predicting and analyzing road traffic injury severity using boosting-based ensemble learning models with SHAPley Additive exPlanations. Int. J. Environ. Res. Public Health 2022, 19, 2925. [Google Scholar]
  21. Guo, M.; Yuan, Z.; Janson, B.; Peng, Y.; Yang, Y.; Wang, W. Older pedestrian traffic crashes severity analysis based on an emerging machine learning XGBoost. Sustainability 2021, 13, 926. [Google Scholar]
  22. Helton, J.C.; Davis, F.J. Latin hypercube sampling and the propagation of uncertainty in analyses of complex systems. Reliab. Eng. Syst. Saf. 2003, 81, 23–69. [Google Scholar] [CrossRef]
  23. Liu, D.C.; Nocedal, J. On the limited memory BFGS method for large scale optimization. Math. Program. 1989, 45, 503–528. [Google Scholar] [CrossRef]
  24. The MathWorks Inc. MATLAB, Version: 9.13.0 (R2022b); The MathWorks Inc.: Natick, MA, USA, 2022. Available online: https://www.mathworks.com (accessed on 1 November 2023).
  25. Chipperfield, A.J.; Fleming, P.J. The MATLAB Genetic Algorithm Toolbox. 1995. Available online: https://digital-library.theiet.org/content/conferences/10.1049/ic_19950061 (accessed on 1 November 2023).
  26. Joodaki, H.; Gepner, B.; Kerrigan, J. Leveraging machine learning for predicting human body model response in restraint design simulations. Comput. Methods Biomech. Biomed. Eng. 2021, 24, 597–611. [Google Scholar]
  27. Schneider, B.; Kofler, D.; D’Addetta, G.A.; Freienstein, H.; Wolkenstein, M.; Klug, C. Approach for machine learning based design of experiments for occupant simulation. Front. Future Transp. 2022, 3, 913852. [Google Scholar] [CrossRef]
  28. Joseph, V.R.; Gul, E.; Ba, S. Designing computer experiments with multiple types of factors: The MaxPro approach. J. Qual. Technol. 2020, 52, 343–354. [Google Scholar] [CrossRef]
  29. Eggers, A.; Eickhoff, B.; Dobberstein, J.; Zellmer, H.; Adolph, T. Effects of variations in belt geometry, double pretensioning and adaptive load limiting on advanced chest measurements of THOR and Hybrid III. In Proceedings of the IRCOBI Conference, Berlin, Germany, 10–12 September 2014. [Google Scholar]
  30. Hu, J.; Reed, M.P.; Rupp, J.D.; Fischer, K.; Lange, P.; Adler, A. Optimizing Seat Belt and Airbag Designs for Rear Seat Occupant Protection in Frontal Crashes (No. 2017-22-0004); SAE Technical Paper; SAE: Warrendale, PA, USA, 2017. [Google Scholar]
Figure 1. Overview of the occupant restraint optimization.
Machines 12 00074 g001
Figure 2. Configuration for frontal sled test and simulation.
Machines 12 00074 g002
Figure 3. Load limiter type: (a) single-stage load limiter; (b) dual-stage load limiter.
Machines 12 00074 g003
Figure 4. Vehicle deceleration pulse and velocity change.
Machines 12 00074 g004
Figure 5. Neural network structure. Fully connected layers include hidden layers and neurons. The Transfer function is applied to every fully connected layer except the final fully connected layer. The final fully connect layer has one output. The final adopted neural network structure consists of 3 hidden layers, each containing 50 neurons, with the activation function being relu for all layers.
Machines 12 00074 g005
Figure 6. Overview of calculation of the cost function value. Eleven metamodels were utilized in the optimization to predict the Euro NCAP score.
Machines 12 00074 g006
Figure 7. Test and simulation: (a) baseline; (b) meta optimum. (a) shows the test (left) and simulation (right) of the THOR dummy with baseline restraint systems. (b) shows the simulation of the THOR dummy (left) and GHBM-O model (right) with the optimized restraint systems.
Machines 12 00074 g007
Figure 8. Comparison of frontal sled simulation results and Euro NCAP Test data.
Machines 12 00074 g008
Figure 9. Parametric simulation results (histogram, bins = 20).
Machines 12 00074 g009
Figure 10. Euro NCAP score predicted results: (a) direct prediction of Euro NCAP score; (b) Euro NCAP score using individually predicted injury criterion values.
Machines 12 00074 g010
Figure 11. Training results of metamodels for injury criteria.
Machines 12 00074 g011
Figure 12. Examples of learning curves for prediction injury metric values.
Machines 12 00074 g012
Figure 13. SHAP analysis results for maximum chest deflection (Rmax).
Machines 12 00074 g013
Figure 14. SHAP analysis results for tibia index.
Machines 12 00074 g014
Figure 15. SHAP analysis results for tibia compression.
Machines 12 00074 g015
Figure 16. Comparison of belt routes and dummy kinematics of baseline and meta optimum designs.
Machines 12 00074 g016
Figure 17. Optimization results by constraining vehicle deceleration pulses.
Machines 12 00074 g017
Table 1. Injury criteria of Euro NCAP.
Body RegionInjury CriterionUnitUpperLowerScoring
Head & NeckHIC15-7005004 points
SUFEHM-Monitoring
BrIC-Monitoring
A Resultant 3 msG8072
FxkN3.11.9
FzkN3.32.7
MyNm5742
Chest & AbdomenChest Compression/Rmaxmm60354 points
Abdominal Compression (ignored)mm88N/A
Knee, Femur, PelvisL/R AcetabulumkN4.13.284 points
L/R Femur CompressionkN9.073.8
L/R Knee shear displacementmm156
Lower LegL/R Tibia index-1.40.44 points
L/R Tibia CompressionkN82
Table 2. List of input parameters and range.
Input ParameterRange
Hard Point1D-ring X-position (DRX)75 mm (+37.5, −37.5) (+: rearward)
2D-ring Z-position (DRZ)107 mm (+107, 0) (+: upward)
3Buckle X-position (BKX)45 mm (+37.5, −7.5) (+: rearward)
4Buckle Z-position (BKZ)40 mm (0, −40) (+: upward)
5Anchor X-position (ACX)75 mm (+65, −10) (+: rearward)
Belt6Anchor Pretensioner (APT)on/off
7Load limiter 1st level (LL1)1.5–6 kN
8Load limiter 2nd level (LL2)1.5–6 kN
9Load limiter 1st to 2nd (LL1 to 2)0–100 mm
Airbag10Mass flow rate scale (MFR)0.7–4
11Vent area scale (VA)0.5–2 (245–980 mm2)
12Leakage area scale (LA)0.5–2 (480–1820 mm2)
Steering13Steering column load scale (SC)0.5–2
Pulse14Pulse scale (PS)0.9–1.1
Table 3. Statement of optimization problem for optimizing occupant restraint system (Table 2).
Minimize f x = E u r o   N C A P   s c o r e
w h e r e
x : t h e   d e s i g n   v a r i a b l e s
E u r o   N C A P   s c o r e :   f u n c t i o n   o f   e l e v e n   i n j u r y   m e t r i c   v a l u e s   o f   f o u r   b o d y   r e g i o n   s c o r e s  
s u c h   a s   H I C 15 ,   3 m s   c l i p ,   N e c k   F o r c e ,   a n d   s o   o n (Table 1)
with respect to x   R M
w h e r e
M : t h e   n u m b e r   o f   d e s i g n   v a r i a b l e s
subject to x i , l o w e r   b o u n d x i x i , u p p e r   b o u n d
w h e r e
i : 1,2 ,   ,   14
Table 4. Injury metric values and Euro NCAP score.
Body
Region
CriterionBaseline (Test)Baseline (Simulation)
ValueScoreValueScoreError (%)
HeadHIC15122.064135.7540.0
A Resultant 3 ms40.4740.28
NeckFx0.690.80
Fz0.931.01
My25.7320.17
Chest and AbdomenRmax43.902.5843.842.590.39
AmaxN/AN/A
Acetabulum1.8141.0140.0
Knee, Femur, PelvisFemur Compression2.962.74
Knee shear displacement1.683.37
Lower LegTibia index0.613.180.473.7117.0
Tibia Compression1.762.18
Euro NCAP Score 13.76 14.34.0
Table 5. Design variables of baseline, sample best, and meta optimum.
Input ParameterBaselineSample BestMeta Optimum
Vent area scale (VA)11.6High0.5Low
Leakage area scale (LA)11.5High0.56Low
Mass flow rate scale (MFR)11.5High0.89Low
Pulse scale (PS)10.9Low0.90Low
Steering column load scale (SC)11.2High1.1High
Load limiter 1st level (LL1)2.52.6High1.7Low
Load limiter 2nd level (LL2)2.51.7Low1.5Low
Load limiter 1st to 2nd (LL1 to 2)N/A12.0-100-
D-ring X-position (DRX)011.0High36.5High
D-ring Z-position (DRZ)018.0High107High
Buckle X-position (BKX)021.0High−7.5Low
Buckle Z-position (BKZ)0−5.6Low−40.0Low
Anchor X-position (ACX)06.9High65High
Anchor Pretensioner (APT)offon-on-
Table 6. Injury metric values and Euro NCAP score.
Body
Region
CriterionBaseline
(THOR)
Sample Best (THOR)Meta Optimum (THOR)Baseline (GHBM-O)Meta Optimum (GHBM-O)
ValueScoreValueScoreValueScoreValueScoreValueScore
HeadHIC15135.84220.94160.14124.14116.24
A Resultant 3 ms40.369.343.638.338.7
NeckFx0.80.30.40.40.7
Fz1.00.90.81.21.2
My20.115.412.624.418.8
Chest & AbdomenRmax43.82.637.83.632.8434.6430.94
AmaxN/AN/AN/AN/AN/A
Acetabulum1.040.941.642.742.74
Knee, Femur, PelvisFemur Compression2.71.81.01.00.5
Knee shear displacement3.42.61.6N/AN/A
Lower LegTibia index0.53.70.440.440.53.70.53.8
Tibia Compression2.21.91.81.21.2
Euro NCAP Score 14.3 15.6 16 15.7 15.8
Disclaimer/Publisher’s Note: The statements, opinions and data contained in all publications are solely those of the individual author(s) and contributor(s) and not of MDPI and/or the editor(s). MDPI and/or the editor(s) disclaim responsibility for any injury to people or property resulting from any ideas, methods, instructions or products referred to in the content.