1. Introduction
The human hand is recognized as the main tool people use to interact with their environment. Through it, people can communicate, innovate, create, and defend themselves from external danger. Although hand function is taken for granted in everyday life, when some pathologies affect the upper limb, the person who suffers them simultaneously loses mobility and his or her independence and quality of life [
1]. Since the hands send somatosensory information and receive motor information through the nerves that make up the peripheral nervous system, any alteration in them can affect their functionality [
2].
The main pathologies/accidents that can affect the upper limb are stroke and nerve damage. The former, which affects more than 800,000 people worldwide, is the main cause of disability and the third leading cause of death in the world. This pathology consists of a neurological explosion caused by the poor perfusion of blood vessels in the brain; it includes two types: ischemic (85% of cases) and hemorrhagic (15% of cases) [
3]. The most prevalent type of stroke is ischemic, arising from a blockage in a blood vessel that causes a lack of oxygen and nutrients. This blockage often stems from narrowed vessels due to atherosclerosis, which are progressively obstructed. Consequently, neurons experience suffocation from reduced blood flow and are prone to necrosis. Hemorrhagic strokes occur when pressure on the brain leads to the overloading of blood vessels. This type of stroke is divided into intracerebral and subarachnoid hemorrhages. In the former, blood gathers inside the brain; in the latter, it collects in the subarachnoid space. Around 90% of survivors face some type of disability afterward, often experiencing limb weakness or paralysis [
4].
The second kind of disability is nerve damage. Notice that somatosensory and motor information is transmitted through the radial, ulnar, and median nerves, which arise from the spinal column from C6 to C8. As mentioned above, these nerves’ lack of bony protection makes them susceptible to damage and wear and tear, translating into a loss of sensation and movement. The most common of these injuries are due to traffic accidents, violence, sports, or falls. Globally, the incidence ranges from 10.4 to 83 in developed countries, with 53.9% of these cases affecting the cervical spine [
5]. Most people who suffer this type of injury are at a young and productive age [
6]; therefore, when faced with this new disability, they also face significant economic losses due to the cost and duration of rehabilitation, as well as those caused by the disability itself.
Several strategies have been developed to face disability that involve technology, which improves safety, efficiency, and even the time involved in the rehabilitation process [
7]. One of the most promising rehabilitation techniques is FES, which produces electric currents that pass through electrodes to a muscle to make a specific movement [
8,
9]. This technique is used to correct the execution of movements, improve muscle weakness, and promote a habit by exercising neuroplasticity [
10].
The electrical discharge propagates through the electrodes, which can be either cathodes or anodes. At the same time, they can be invasive or non-invasive. In the case of invasive electrodes, the current reported in the literature is between 15 and 30 mA [
11]. The signal’s shape can be monophasic, consisting of a single polarity, or biphasic, ensuring that the transmitted current can be removed from the tissue and subdivided into symmetrical and asymmetrical currents. The former stimulates the muscle under the cathode and anode. It seeks to undo the electrochemical reaction caused by the initial phase. Typically, a period pause is located between the biphasic stimulations to ensure the proper propagation of action potentials. With the asymmetrical current, the contractions happen only under the cathode [
12]. Moreover, before administering electrical stimulation, it is crucial to consider the regular state of healthy patients. As the stimulation signal travels through the skin to reach the muscle, its initial condition needs assessment. The skin may be in poor condition with pressure injuries or irritation; moreover, the prolonged use of electrodes can also cause irritation [
13,
14,
15]. One may notice that selecting an effective electrical stimulation signal depends on many factors. However, the most significant one relates to the patient’s therapy. Usually, the suggested therapy includes the performance of specific extremity motions, which could be aided by applying the electrostimulation strategy. Hence, the electrophysiological activity in the proximal muscles can be used as triggering information to choose the requested stimulation signal, which is indeed a scarcely explored operation strategy.
Electromyographic (EMG) signals represent the electrical activity of muscles. When these signals are measured, they must be amplified and filtered. The gain is selected based on the function and the desired amplification, while the signal noise is removed with a proper arrangement of filters [
16]. Once the EMG signals have been properly obtained, they can be processed to determine muscle damage and therapy effectiveness. Among these processing strategies, EMG signal automatic classification could be used to determine the patient’s motion intention, which could then be used to define the adequate electrostimulation signal.
Automatic signal classification implies extracting features in each signal interval to recognize the characteristic information of each extremity motion [
17]. Different strategies have been studied to classify EMG signals, such as Simple Logistic Regression, Artificial Neural Networks (ANNs), Linear Discrimination Analysis, Naive Bayes, and K-nearest neighbors. EMG classification by machine learning has been used for different purposes.
Gonzalez et al. [
18] developed a hand gesture recognition model where the EMG signals were collected through the Myo Armband, which has eight channels and works with a sampling frequency of 200 Hz. Then, the features were extracted and classified according to the following gestures: fist, finger stretch, inward move, outward move, and double tap. The classification was achieved through ANNs with three layers and a total efficiency of 88.3%.
Ref. [
19] also collected the EMG data through a Myo Armband; however, the authors classified stronger movements as wrist pronation, supination, and elbow flexion and extension. The data were classified through ANNs with an accuracy of 94% [
19].
Gandolla et al. [
20] developed a controller based on electromyographic signals for a hand-assisted robotic device that detected movement intention. The authors measured the following movements: pinching, grasping, and fist. The Porti device from Twente Medical Systems was selected to collect the signals. It has five channels and works with a sampling frequency of 2049 Hz. After the feature selection process, the data were preprocessed with a third-order Butterworth bandpass filter of 5 to 10 Hz. Then, the authors used two ANNs, and each trial was classified as input in the form of EMG signal portions corresponding to the electromechanical delay—the pattern vector. The pattern vector was provided as input to successive ANNs with one hidden layer [
20]. This process demonstrated an accuracy of
.
Espinoza et al. [
21] compared decision trees and support vector machines for EMG signals. Eight EMG sensors were used to study the following movements: cylindrical grasp, tip grasp, hook grasp, open hand, palmar grasp, spherical grasp, lateral grasp, and fist. Then, the data were classified through the Extended Associative Memories (EAMs) method, which develops a relationship between the input (x) and an index
of the class to determine class movement. Through this method, the authors achieved an accuracy of 95.83% for these strong movements [
21]. Moreover, ref. [
22] collected and preprocessed raw EMG signals with a cut-off frequency of 5 to 500 Hz. Then, the authors classified the data with an ANN of the Long Short-Term Memory (LSTM) type; this network represented the features of the signals in a score range and obtained an overall accuracy of 90.4% [
22]. Due to this accuracy performance, we decided to develop an ANN of the LSTM type.
These results demonstrate the possibility of using an ANN as an efficient machine-learning tool to classify EMG signals, supporting the choice of an ANN in this study as the EMG classifier, which defines the signal to be electrostimulated. Nevertheless, most of the previous studies considered the application of an ANN with a static topology, which could neglect the time-dependent nature of EMG signals. This fact emphasizes the necessity of devising automatic classification algorithms based on dynamic forms of ANNs that can handle EMG signals more efficiently over time.
The motivation behind this research was multifold: enhancing rehabilitation, minimizing muscle fatigue, and enabling precision in treatment by FES. Overall, the ultimate goal of this research was to provide a more efficient and personalized rehabilitation approach for individuals with neurological injuries affecting their hand movements. Setting a base for combining functional therapy with careful stimulation adjustment (based on the automatic classification of EMG signals) aims to help these individuals regain upper limb mobility and improve their overall quality of life. The proposed automatic selection of FES signals involves the application of a recurrent ANN to consider the temporal nature of the processed information and the signals to be produced. The proposed methodology was evaluated on a prototype of a prosthetic hand that performed the motion established by the detected EMG signal. The device included a strategy that controlled the hand motion to achieve the correct position only when the produced FES signal corresponded to the expected motion defined by the classified EMG.
2. Methodology
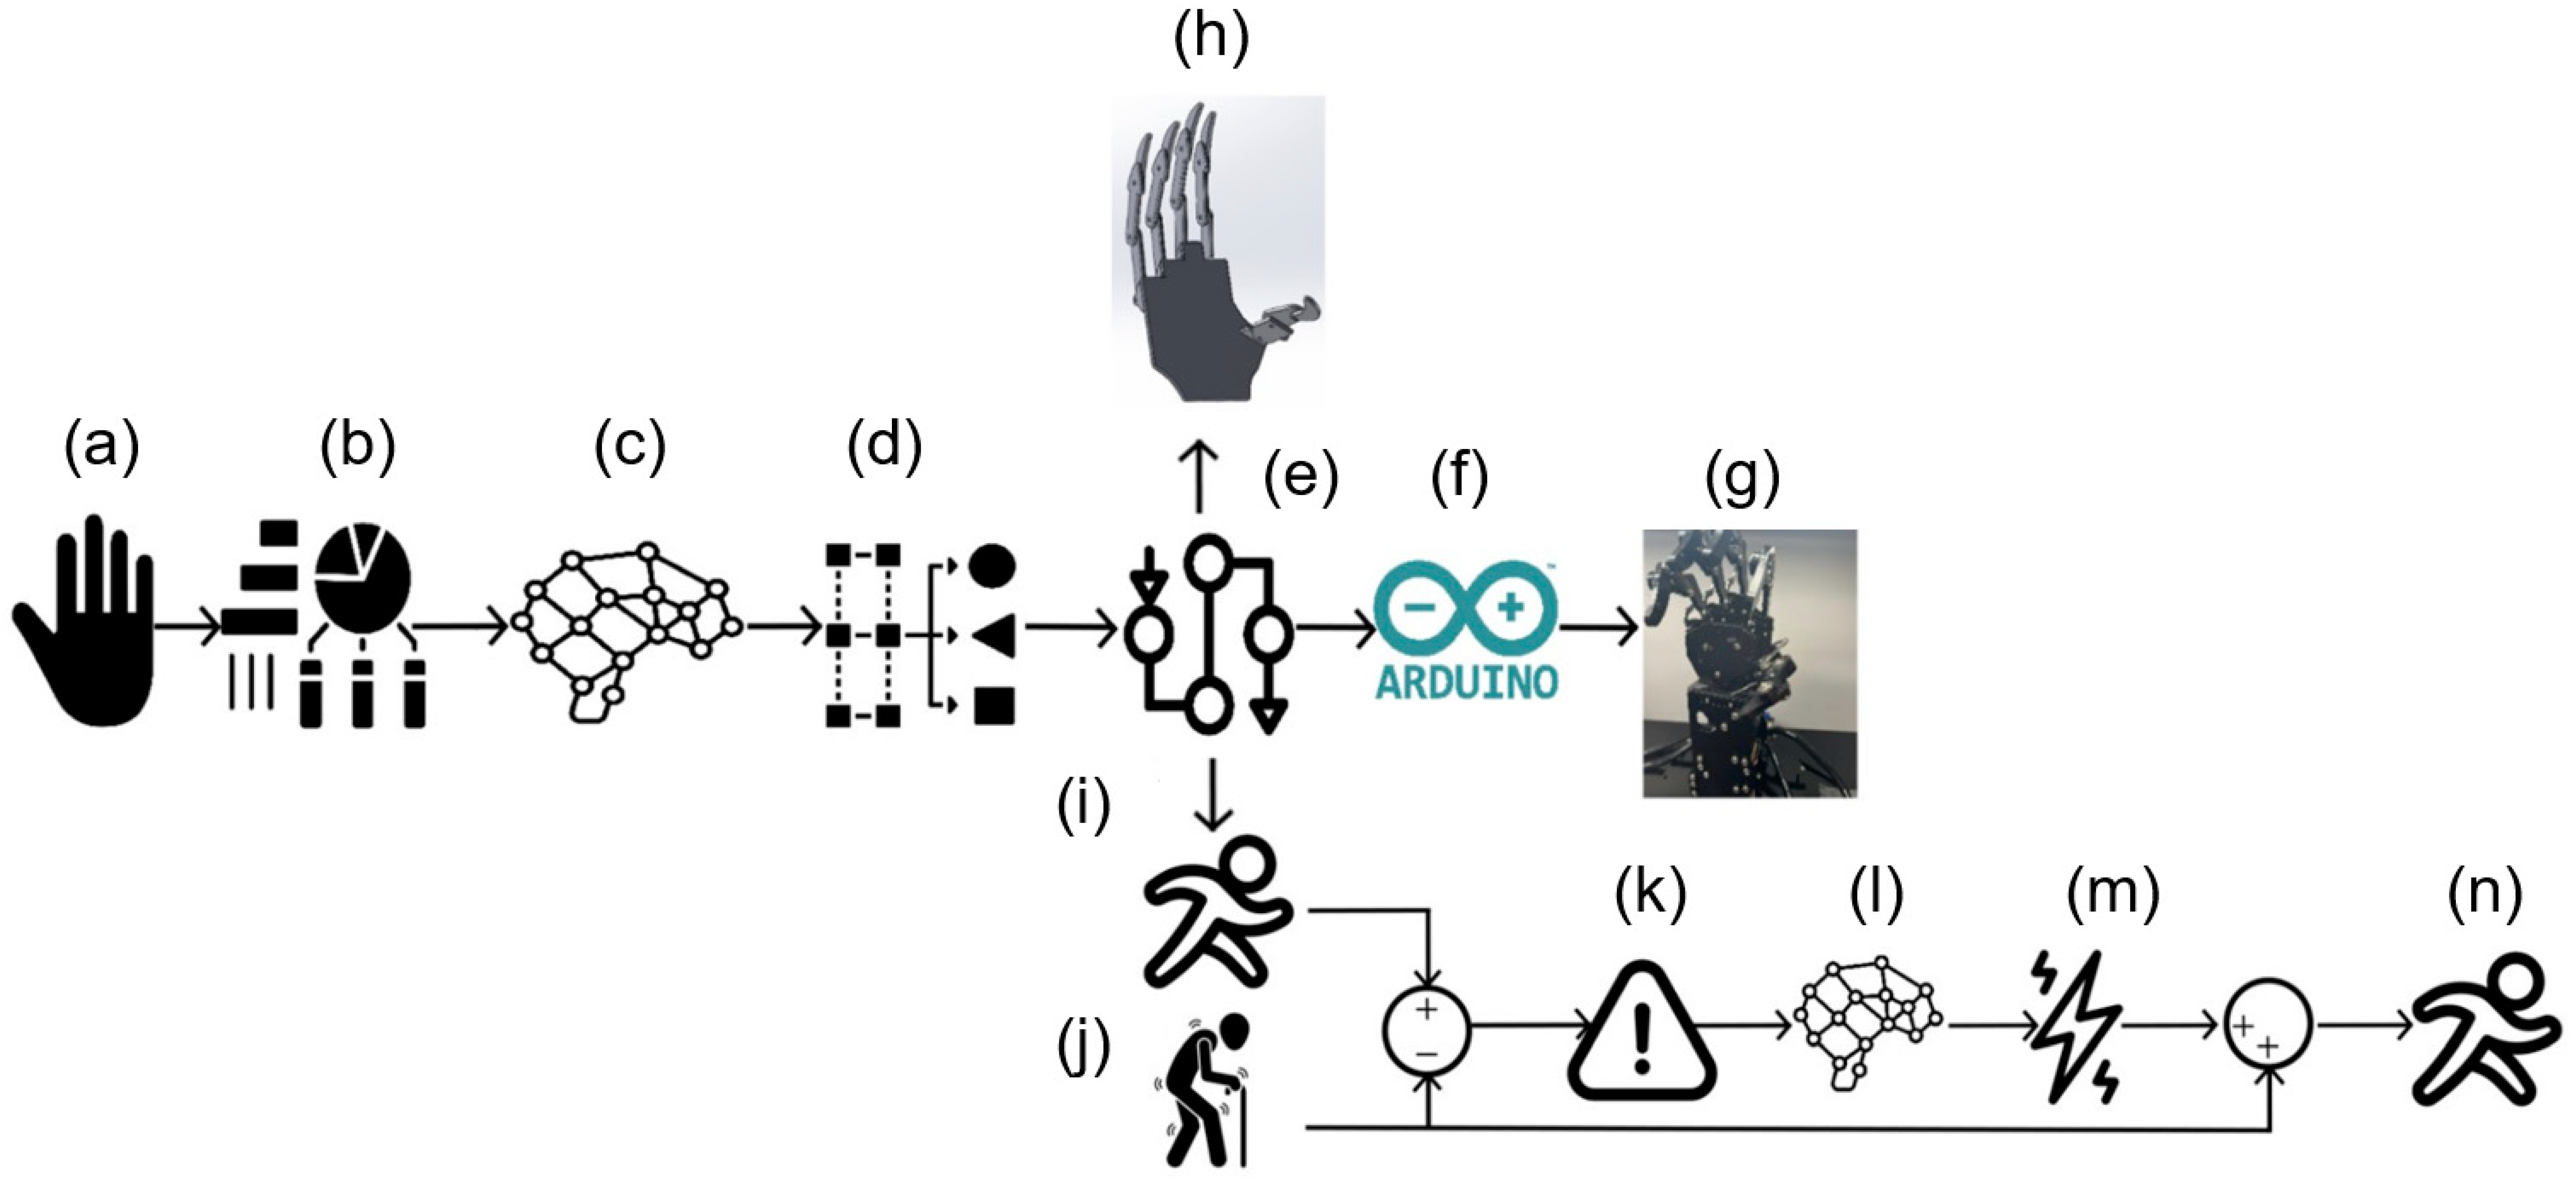
The proposed methodology comprised the following sequence of processing stages (
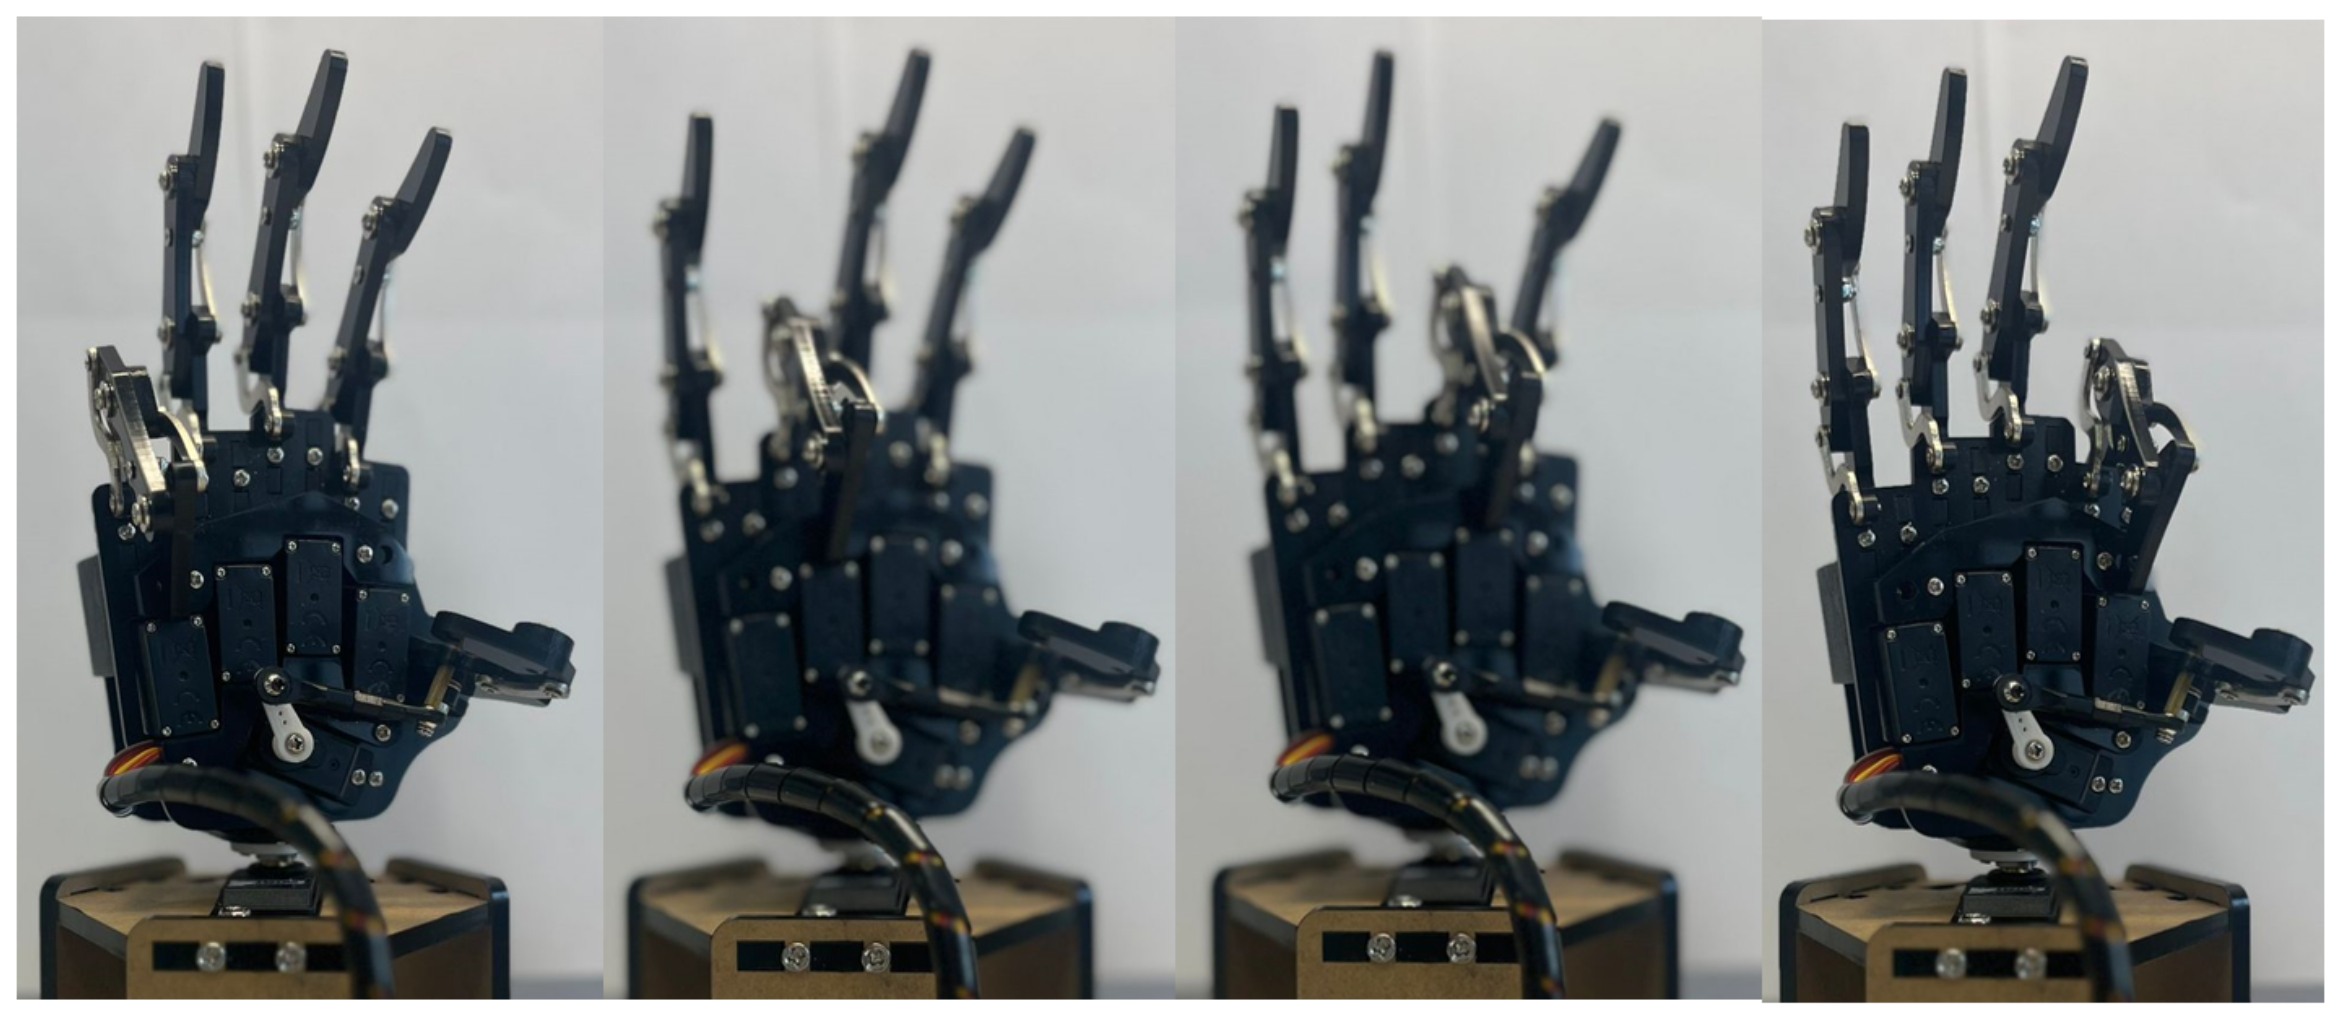
Figure 1): (a) Initially, a dataset containing ten different human hand movements was employed, consisting of five combinations of movements and five distinct finger movements. These signals were then processed by integrating signal processing, automatic classification, bioinstrumentation, and the controlled regulation of the prosthesis prototype. (b) Key features relevant to the application were extracted from these ten movements, six subjects, two channels, and ten repetitions. (c) Subsequently, a neural network was utilized to classify these movements based on the specific hand motion being executed. (d) The neural network output a number from 1 to 10 corresponding to one of the ten movements studied. (e) A set of trajectories required to replicate the movements of a healthy hand for reference purposes was determined. (f) A digital processing board was used to regulate the electronic function of the actual prosthetic device. (g) The Hiwonder UHand 2.0 device was used as the prosthetic hand, which received control instructions from the digital processing board. (h) A digital twin of the hand prosthesis was considered to evaluate the classification and the control. (i) Based on the processed information, the trajectories corresponded to a healthy movement. Because of this, they were used as reference coordinates. (j) To simulate the effectiveness of the FES strategy, a numerically evaluated sickness motion was proposed for the prosthetic hand using a non-tuned control form. (k) To assess the deviation from the reference coordinates for a person with a medical condition, the coordinates representing the affected individual were subtracted from the reference coordinates, resulting in an error that should be related to the required control actions in the hand. (l) Using this information differential, a second dynamic neural network calculated the decoded FES signal (m) that acted on the prosthetic hand, as shown in stage (n).
2.1. Database of Hand’s EMG Signals
The EMG signals used in this research were obtained from the database presented by [
23]. The authors measured ten different hand movements from six healthy men aged between 20 and 25 years. The EMG signals were acquired through two channels and were employed by the Delsys DE sensors. The first channel measured the signals from the extensor carpi ulnaris and extensor digiti minimi muscles. In contrast, the second one measured the signals from the flexor digitorum superficials and palmaris longus [
23]. Ten different movements were analyzed: five individual movements (thumb, index, middle, ring, and little), and five combination movements (thumb–index, thumb–middle, thumb–ring, thumb–little, and hand close). The acquired signals were processed with an amplifier gain of 1000 and filtered using a bandpass with a bandwidth of 20 to 450 Hz and a notch filter of 50 Hz to eliminate the interference. The result of measuring six people through 2 channels, performing ten movements ten times, was a matrix of 1200 signals.
Feature Extraction and Selection
Once the signals were preprocessed, they were converted to the frequency domain through the fast Fourier transformation. Since the result matrix was a series of complex numbers, their spectrum and phases were extracted from the signals. After that, the most common statistical characteristics in the literature were extracted through the following Matlab commands: average (
1), standard deviation (
2), root mean square (
3), shape factor (
4), peak value, signal to noise ratio crest factor (
5), and signal to noise and distortion ratio (
6).
The average (
) was the summation of all the signal components divided by the total number of signal components (N) (
1).
was used to obtain the standard deviation
as stipulated in Equation (
2).
The root mean square
was obtained by squaring each of the signal components, then adding them together and later dividing by
n (1200). Finally, the square root was applied to the result (
3).
The crest factor was obtained by dividing the maximum value of the signal by the
RMS.
After the feature extraction, the signal matrix was confirmed by a length of 1200 signals (rows) and nine characteristics (columns), where the first characteristic was the movement the signal referred to, and the following eight were the previous characteristics.
2.2. Automatic Classifier of EMG Signals
Because EMG signals lack a specific shape, the information they yield is interpreted based on the amplitude of the signals. The smaller the amplitude, the more the muscle is at rest; the more significant the amplitude, the more active the muscle. It is possible to find patterns encompassing each muscle’s information through machine learning (ML) techniques applied as classifiers, thus characterizing which movement is being executed.
One of these ML techniques is the ANN, a computational system inspired by biological neurons [
24]. ANNs have been demonstrated to successfully classify different kinds of biopotentials due to their ability to establish complex relationships between inputs and outputs. Other techniques have been tested for this task, such as the least-squares boosting ensemble. This kind of ensemble uses voting techniques to provide better predictive performance for regression problems. This work used these methods to classify the hand movement EMG signals: Long Short-Term Memory (LSTM), a kind of dynamic ANN, and a least-squares boosting ensemble.
2.2.1. LSTM Used as Automatic EMG Classifier
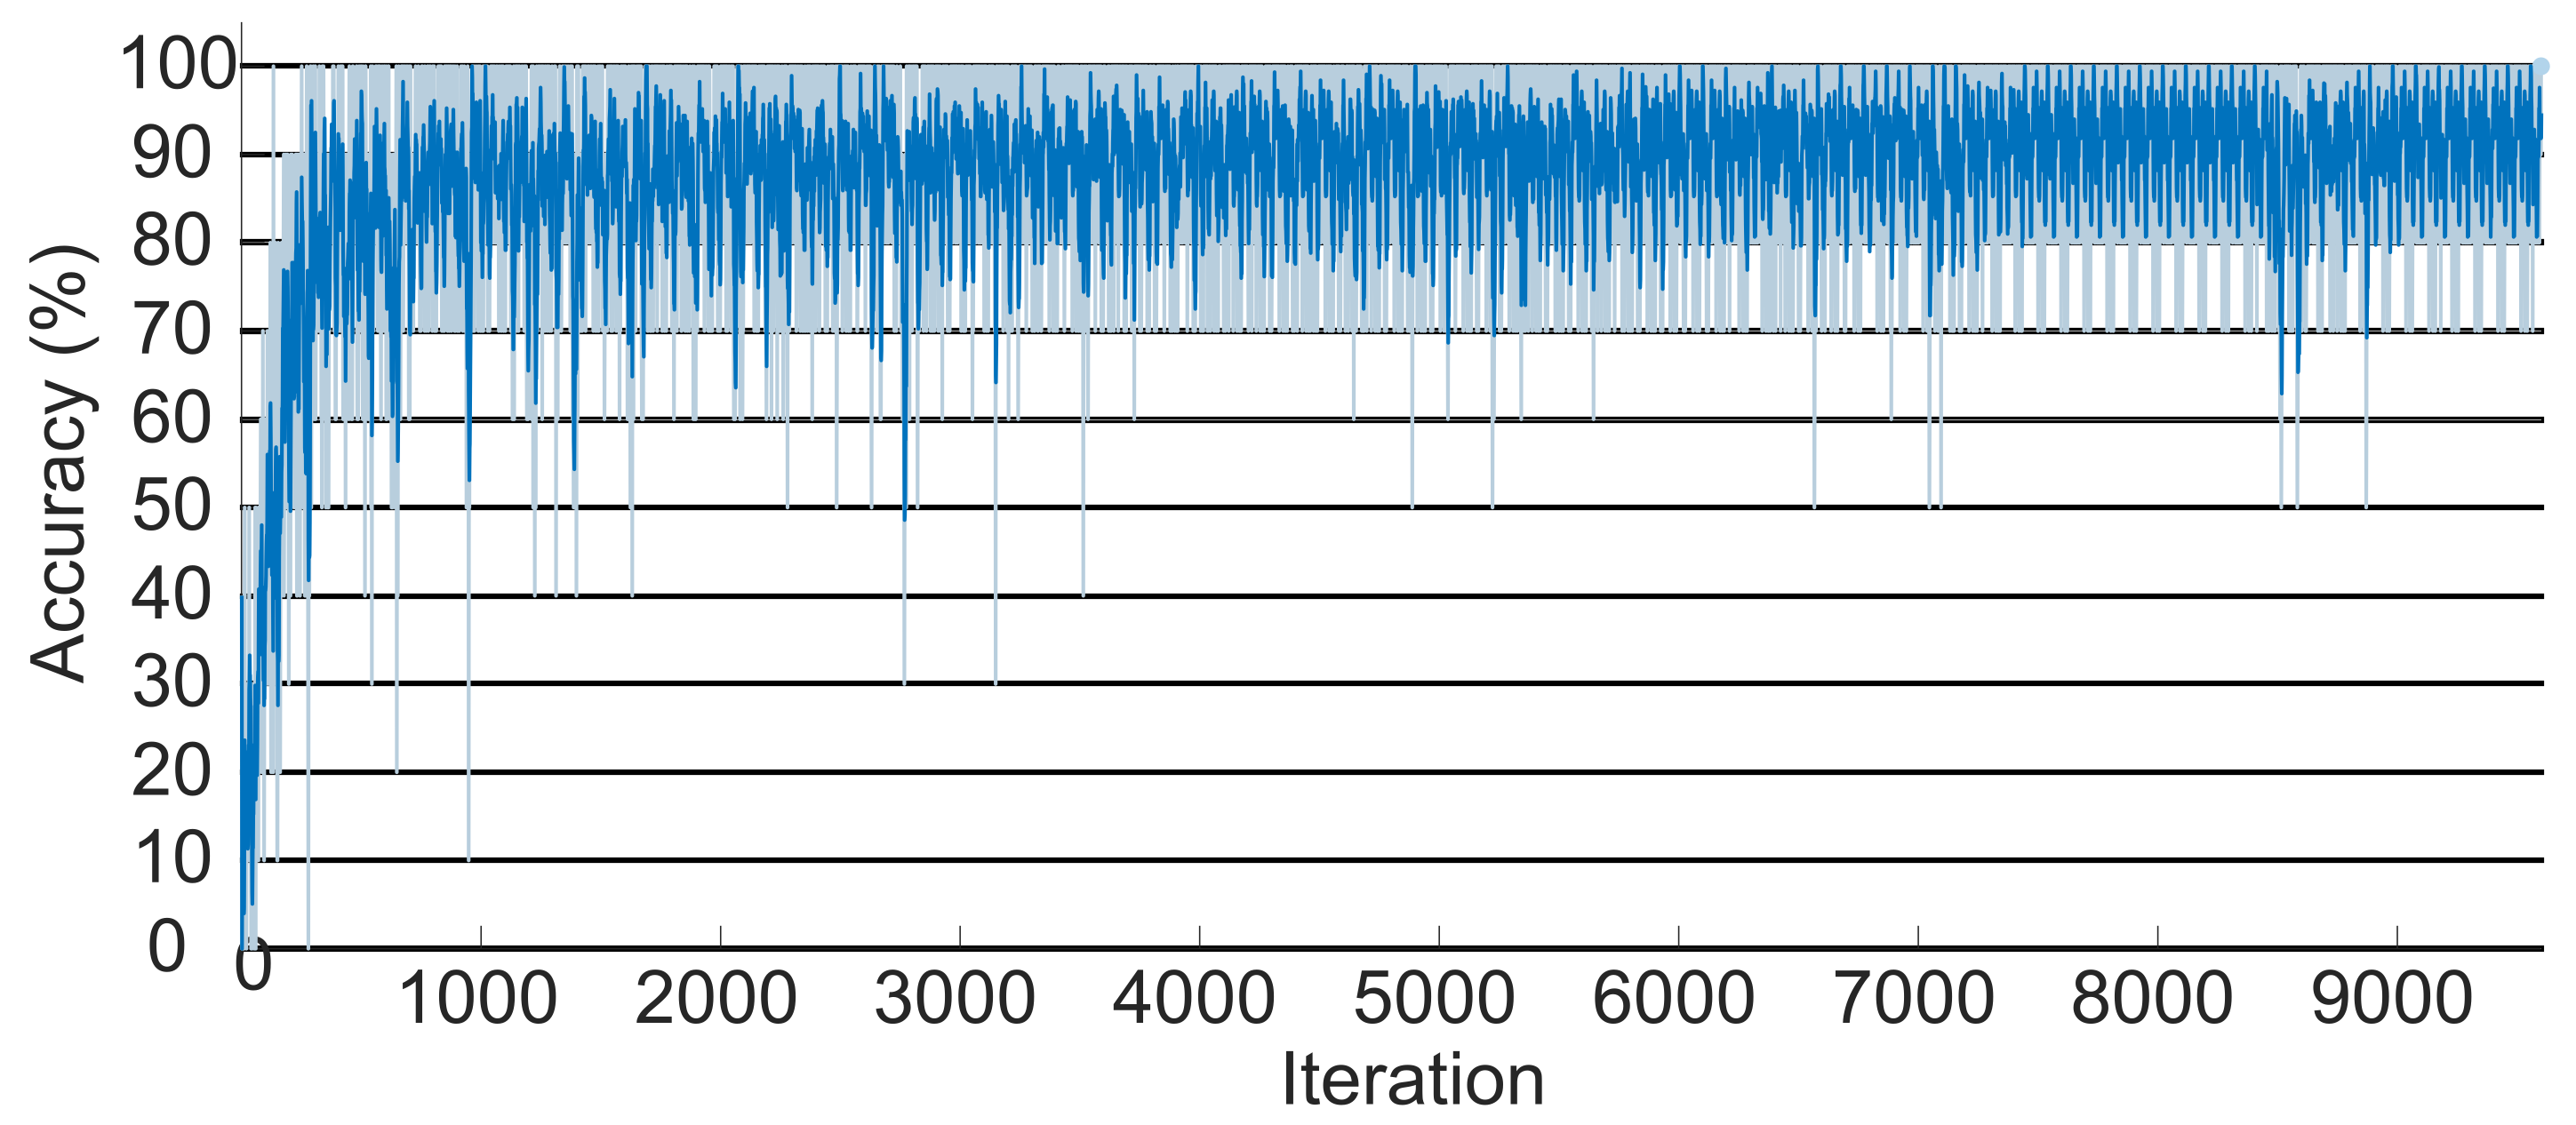
After extracting and selecting the most pertinent characteristics of the EMG signals, a recurrent neural network of the LSTM type, developed in Matlab, was used to classify the signals according to the relative hand motions. The suggested LSTM worked as follows: first, the ten movements were used as references in the neural network classes, where each class contained 120 signals; 80% of them were randomly selected to train the network, and the remaining were used to evaluate the proposed classification algorithm.
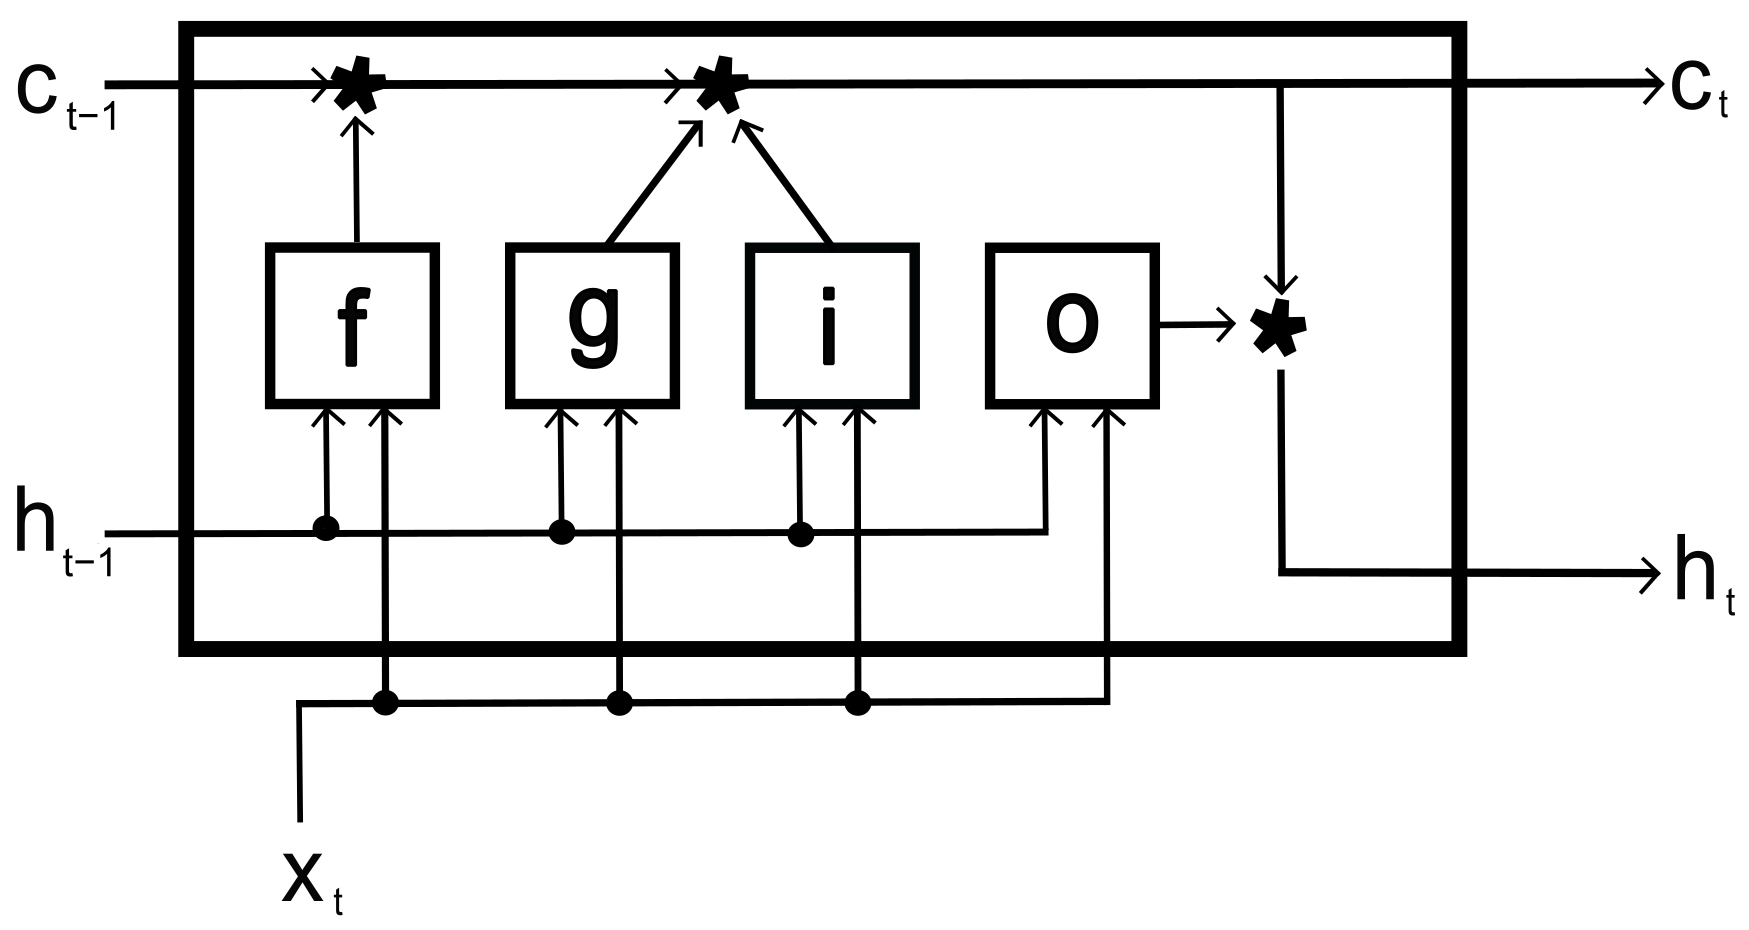
The LSTM mastered the dependencies between the periods of the input signals. It used ten fully connected bidirectional recurrent neural network (RNN) layers that learned bidirectional dependencies. The hidden layer had 500 units and 100 epochs per training iteration; these values were found empirically to minimize the loss function by using a mini-batch. Matlab based its LSTM on the work of [
25], according to the topology suggested in
Figure 2. This LSTM includes weights for the hidden layer, the input weights (
W), the recurrent weights (
R), and the bias (
b). The hidden layer concatenates the matrices as follows:
Here,
, and
o determine the input gate, hidden gate, cell candidate, and output gait, respectively. These gates are represented in the following equation:
Here,
t is the time unit,
is the hidden state (Equation (
9)),
X is the time series, and
is the sigmoidal function that determine the activation function:
where ⊙ is the vector product of the elements (Hadamard product) and cell state (
).
The Matlab method was employed to classify the signals. Such a method tests the gradient of the loss function and updates the weights. Softmax is used as an activation function, which converts the sum of the weights into probabilities. Based on these probabilities, the LSTM identifies the signal class that is represented with a number between 1 and 10.
2.2.2. Least-Squares Boosting Ensemble
The least-squares boosting ensemble introduces a new learner per ensemble to adapt to the gradient between the first output and the predictions made by previously developed learners. Then, K-fold cross-validation is used to validate the classification results [
26]. This validation method randomly subdivides the original sample into
K sub-samples. One of these is used for validation, and the remaining for training. The most common
K value reported in the literature is 5, which indicates that 80% of the samples are used for training and the remaining for testing [
27].
ANOVA (analysis of variance) was the technique applied for feature selection; it examines experimental information when diverse factors are measured across different situations and contrasts the average of different datasets. This information is obtained from
k different populations,
is the
observation from the
population,
is the mean of the population, and
corresponds to the random variation between
and
[
28].
has a normal distribution with a zero mean and variance (
). The static test (
F) evaluates the hypothesis of equal variance with a
distribution.
Here,
represents the unbiased estimator of variance for the
group [
29]. The null hypothesis of the ANOVA algorithm is that the compared means have to be equal to each other.
2.3. Human Hand Design in CAD
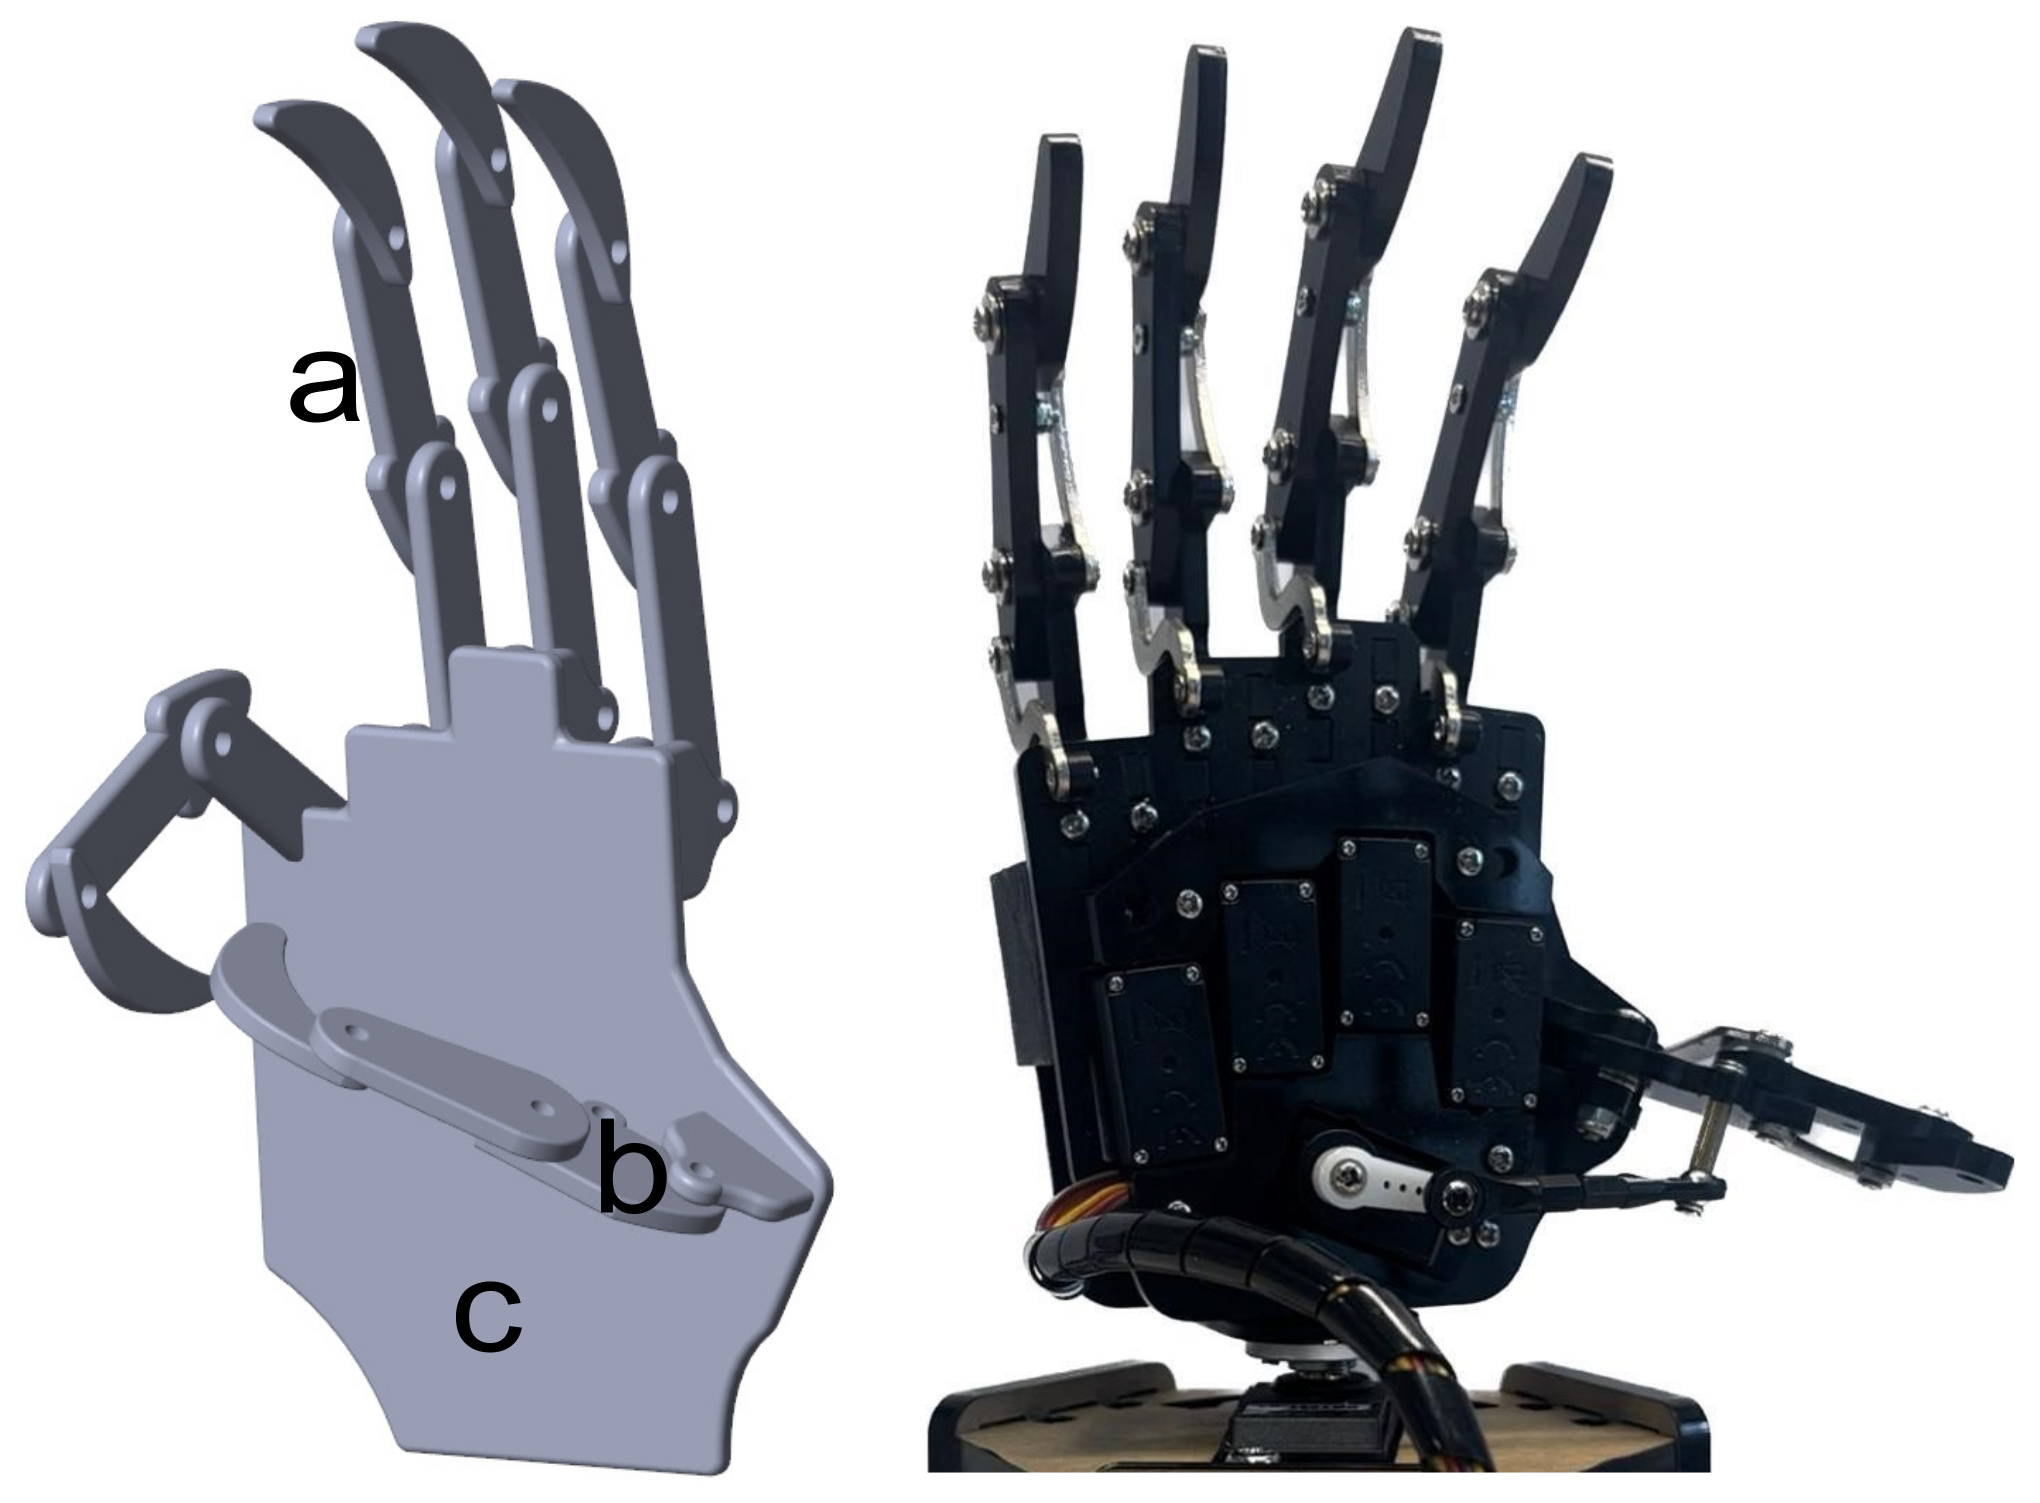
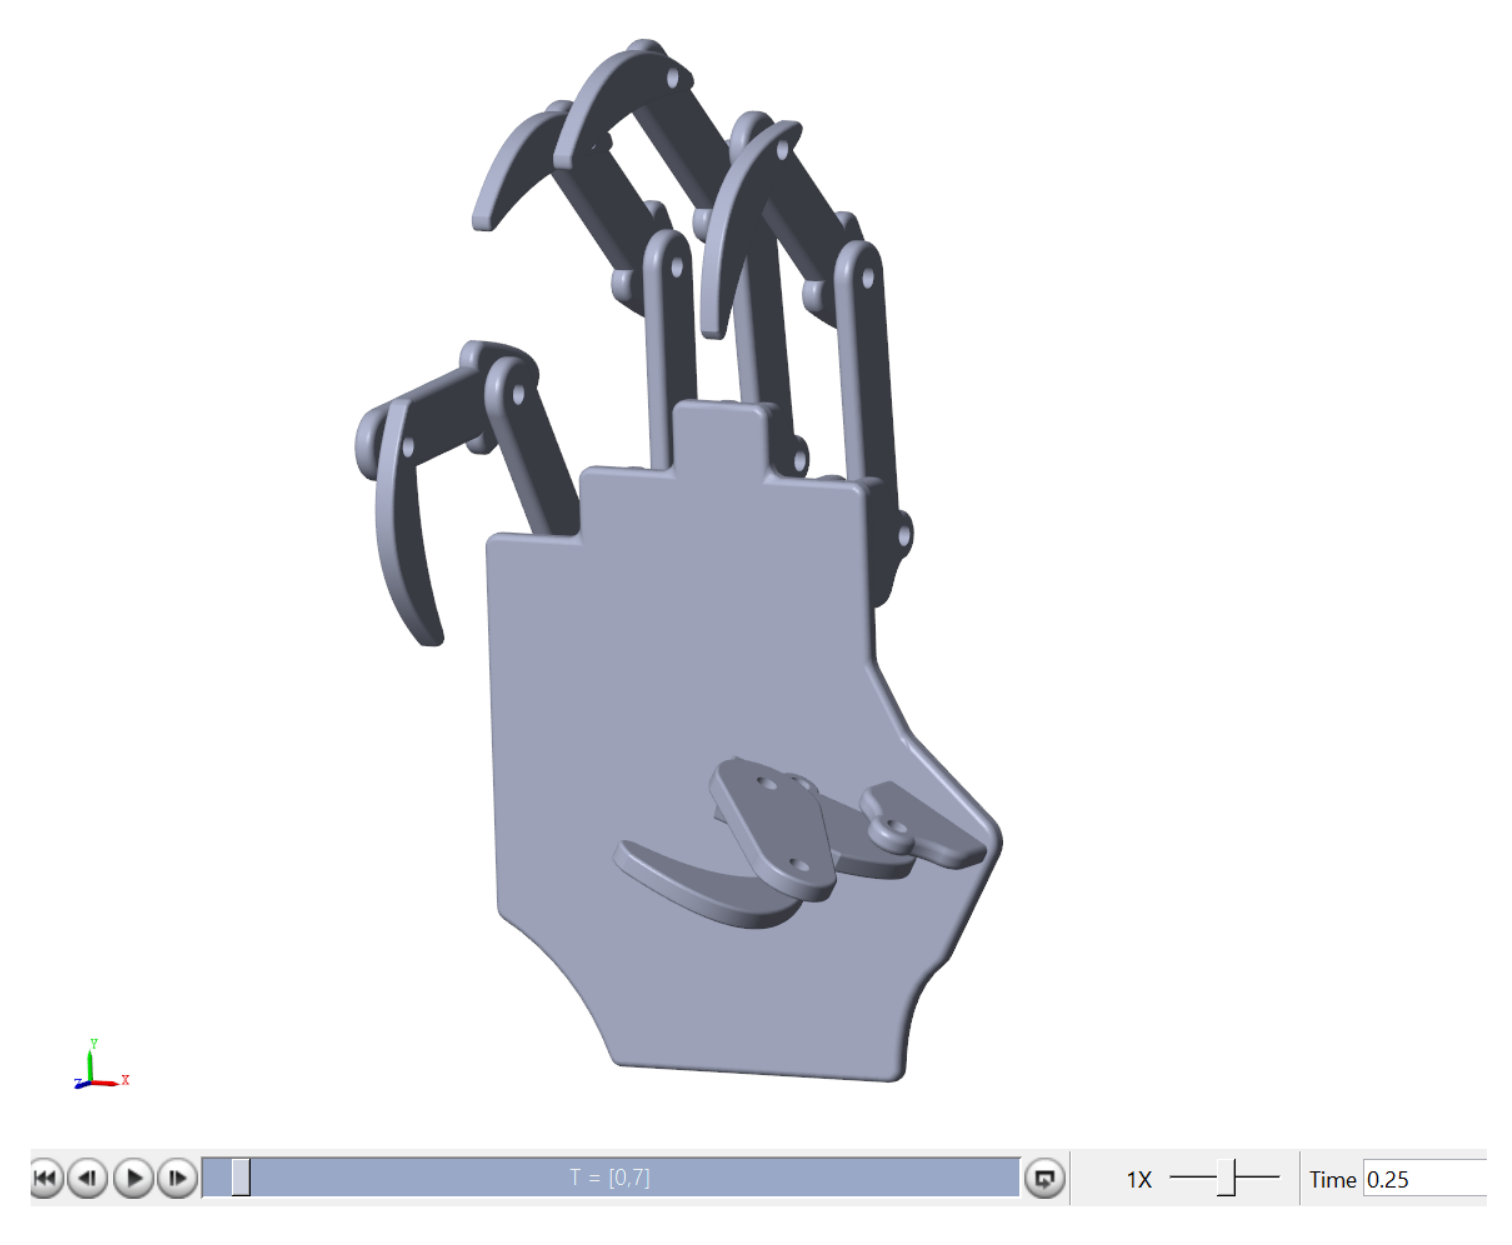
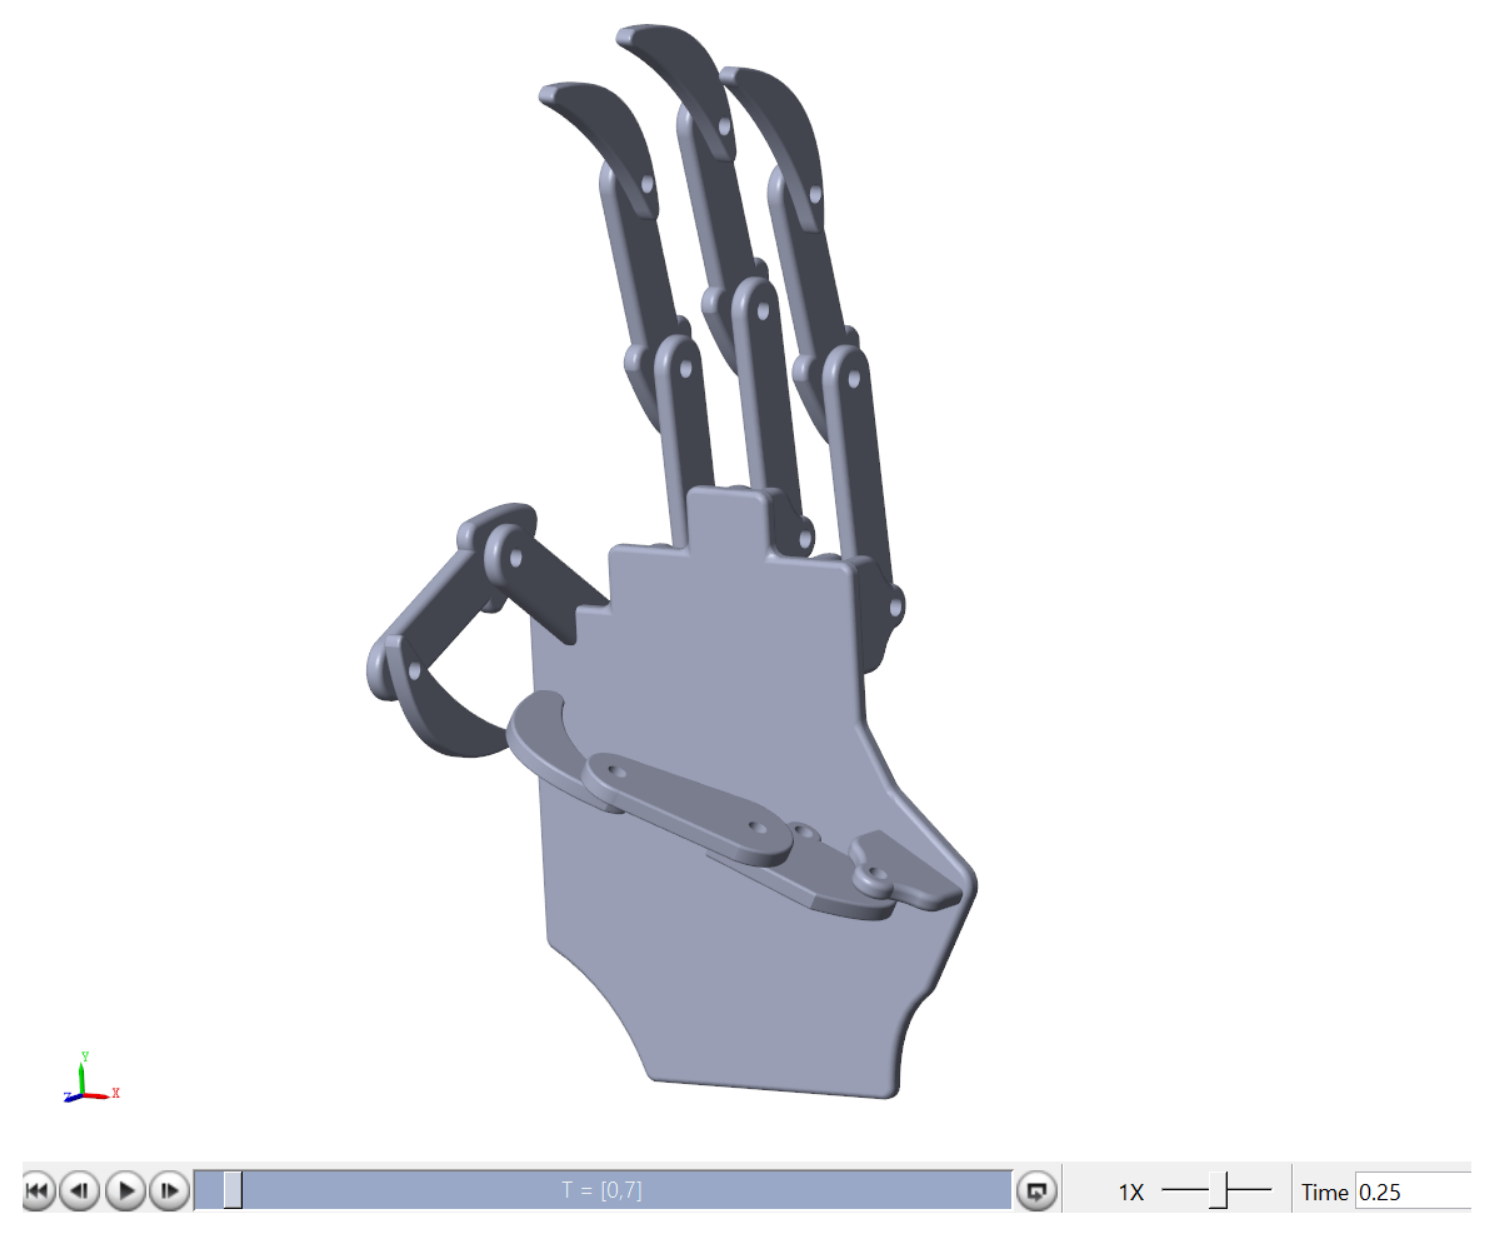
A simulated version of the hand prosthesis prototype was considered to evaluate the relation between the classifier and the controlled motion enforced by the simulated FES. The mechanical design followed the dimensions of the UHand 2.0 prosthesis, an open-source bionic somatosensory robot compatible with diverse digital processing boards. The design is shown on the right side of
Figure 3. The dimensions were assessed manually using a vernier caliper. In order to simplify the design and measurement process for the hand, it was broken down into distinct components, including the finger (
Figure 3a), thumb (
Figure 3b), and palm (
Figure 3c). The finger and thumb sections were further divided into three phalanges each.
This design was created in SolidworksTM (2022) and then exported to Matlab through SimmechanicsTM (2022b), which transferred the model to Simulink/MatlabTM (2022a) to perform a virtual evaluation of the designed hand prototype.
2.4. Automatic Control for the Prosthetic Hand
Once the design of the prosthetic hand was implemented in SimulinkTM, an automatic controller was proposed to reduce the deviation of the angular position at each articulation with respect to the desired trajectory. Two different controllers were compared: the first was a traditional Proportional–Integral–Derivative (PID) controller, and the second was a Proportional–Derivative (PD) controller complemented with a Super-Twisting sliding-mode algorithm, which estimated the tracking error derivative online to avoid the imprecision and inaccuracy introduced by the usual numerical differentiation methods such as Euler and its derivative methods.
2.4.1. Proportional, Integrative, and Derivative Controller (PID)
The selected PID controller introduced the output signal depending on the tracking error for each of the articulations considered in the prosthetic hand. Simulink has its own PID controller, which is based on Equation (
13).
In Equation (
13):
represents the proportional gain,
is the integrative gain,
corresponds to the derivative gain, and
is the time of a first-order derivative filter. The input of the controller (
) is the
k-th input in the respective joint of the proposed hand device. This study considered a class of distributed PID form, which simplified its application but could create a kind of interdependence that introduced transient vibrations in the joint’s motion. Moreover, the calculus of derivatives based on the traditional Euler approximation of derivatives can significantly decrease controller performance related to the tracking quality. Hence, Super-Twisting was introduced, a class of second-order sliding-mode algorithms that can work as robust and exact differentiators or even as non-linear Proportional–Integral controllers.
2.4.2. Proportional and Derivative (PD) and Super-Twisting Controller
The controller, aided by the sliding-mode algorithm, comprised two sections: a PD controller complemented by a Super-Twisting controller. The former is known for its speed control and ability to reduce oscillations. This controller was supplemented with Super-Twisting due to its efficiency in handling disturbances.
In the PD controller, the original trajectory signal was subtracted from the trajectory input of the joint and then amplified by a proportional gain (
). On the other hand, the trajectory signal was derived, and the velocity of the revolution was subtracted and also amplified by a derivative gain (
) (8). Both results were added and exported to the original diagram to be the hand torque. The proposed controller u is defined as follows:
The Super-Twisting output (
) is defined by Equation (
14), where
is the tracking error between the reference and the joint signal of the simulated hand prosthesis. The Super-Twisting controller
is defined by the following equation:
Here,
represents the first gain, which multiplies the sliding surface (
), defined as the combination of the tracking error and its derivative, that is
, where
is a positive constant. Then, the evolution (
v) is described as follows:
The second gain () was obtained to increase the efficiency of the controller, measured in terms of the tracking error quality.
2.5. FES Design Based on Digital Arbitrary Signal Generator
Although
FES has been studied for several years, the signal’s amplitude is still ambiguous, especially depending on the level of the patient’s motion, which could not be complete due to the sickness condition [
15,
30,
31,
32]. We considered a fundamental signal proposed as a reference signal satisfying a biphasic shape with a sawtooth shape of 30 Hz and a pulse width of 100
s [
15,
30,
31,
32]. At the same time, the trajectories of the simulated hand were obtained and used as the trajectory of reference.
Since
FES must work only if the patient cannot complete the required motion, it was necessary to emulate such conditions, leading to what we refer to as sick patient motion or SPM. To obtain the SPM, the gain of the proportional part of either of the chosen controllers for the hand’s prosthesis was reduced (
) to 10% of the gain (
) used when the hand could complete the requested motion, or HPM. Then, the
FES’ oriented error
was calculated using the reference and sick movement coordinates for each movement:
Here, the amplitude of FES satisfies
. The proportional electrostimulation signal corresponding to the error obtained previously (
17) was proposed to satisfy a linear form (Equation (
18)) with respect to the
component of vector
, namely
. The slope and ordinate variables
and
were determined with the following equation, where
is the maximum value of the error and
is the minimum error.
Notice that this model could be more complex. Nevertheless, for this study, such an invertible model was sufficient. Notice that this model was used as an artificial data generator for training the LSTM to estimate the signal the FES must apply. Hence, the error became the input of the designed LSTM. We considered M numerical artificial data generation experiments producing a set of , and their corresponding output vectors . A subset of 80%. of the pairs was used for training, and the remaining 20% were used for testing. After that, a regression layer was formed by 15 classes (1 class per finger joint), and 100 hidden units were created. The output of the LSTM, the stimulation signal, was converted into a pulse-width modulation (PWM) with a maximum number of variable steps of 1000 and a voltage amplitude of 2 V. This signal generated by Matlab was exported to a 16-bit digital processing board through an RS-232 protocol-based communication port.
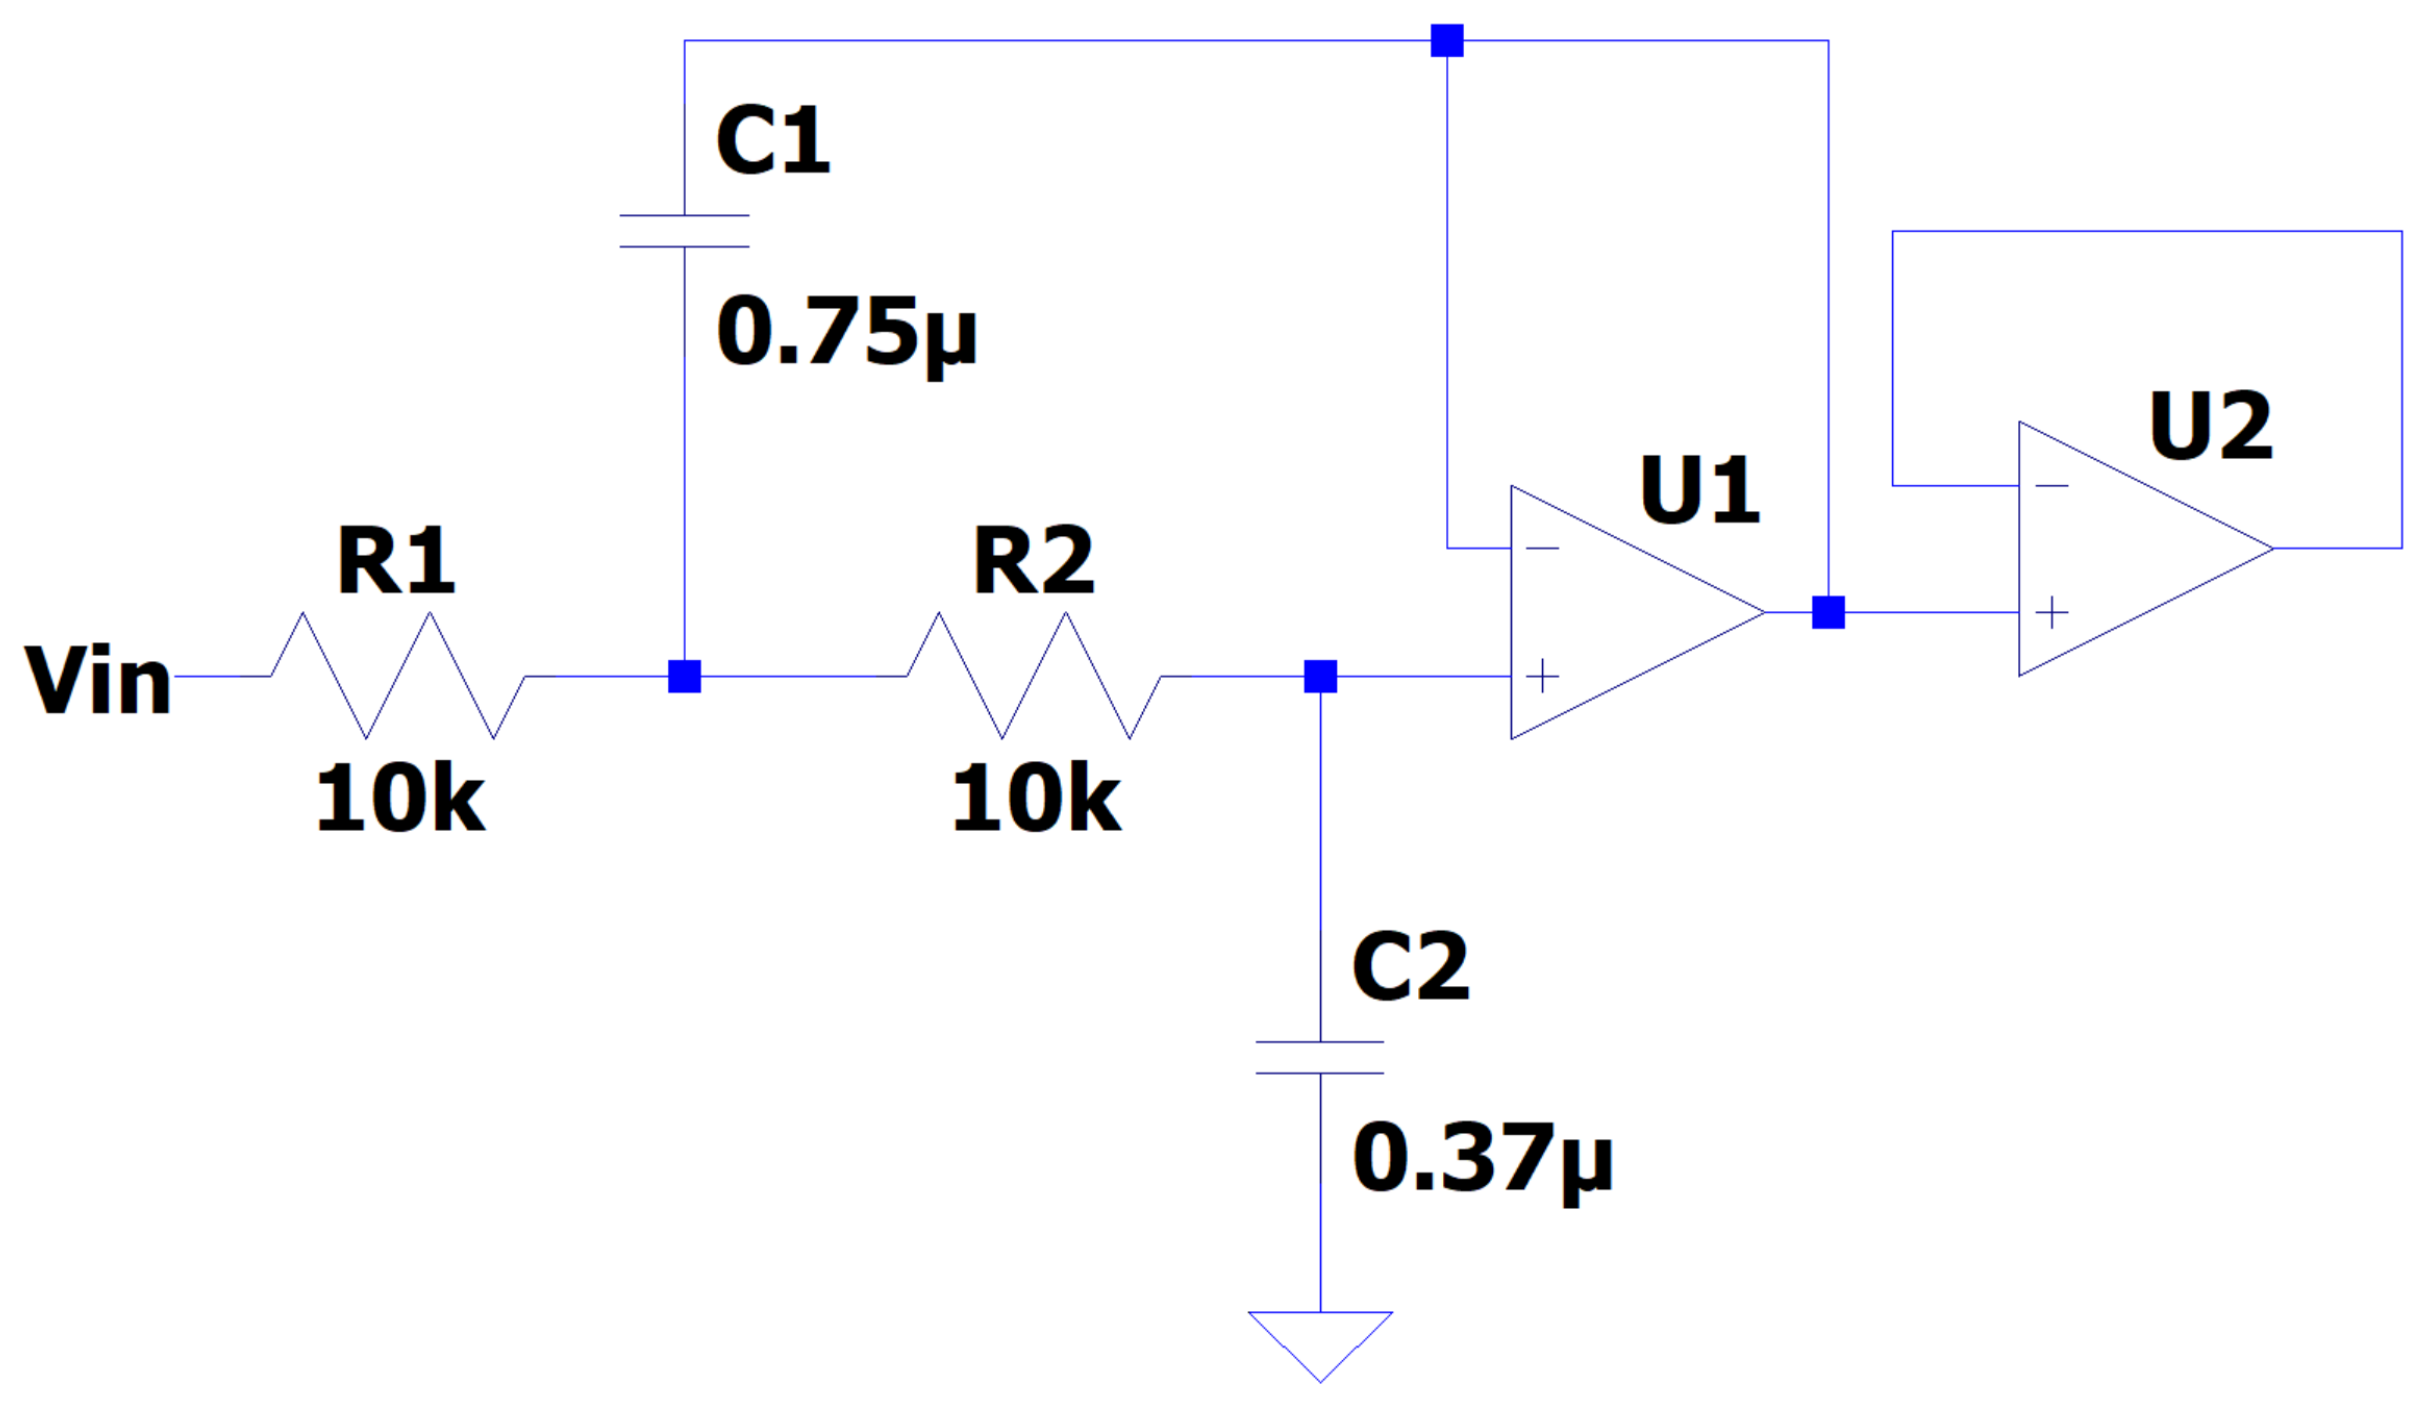
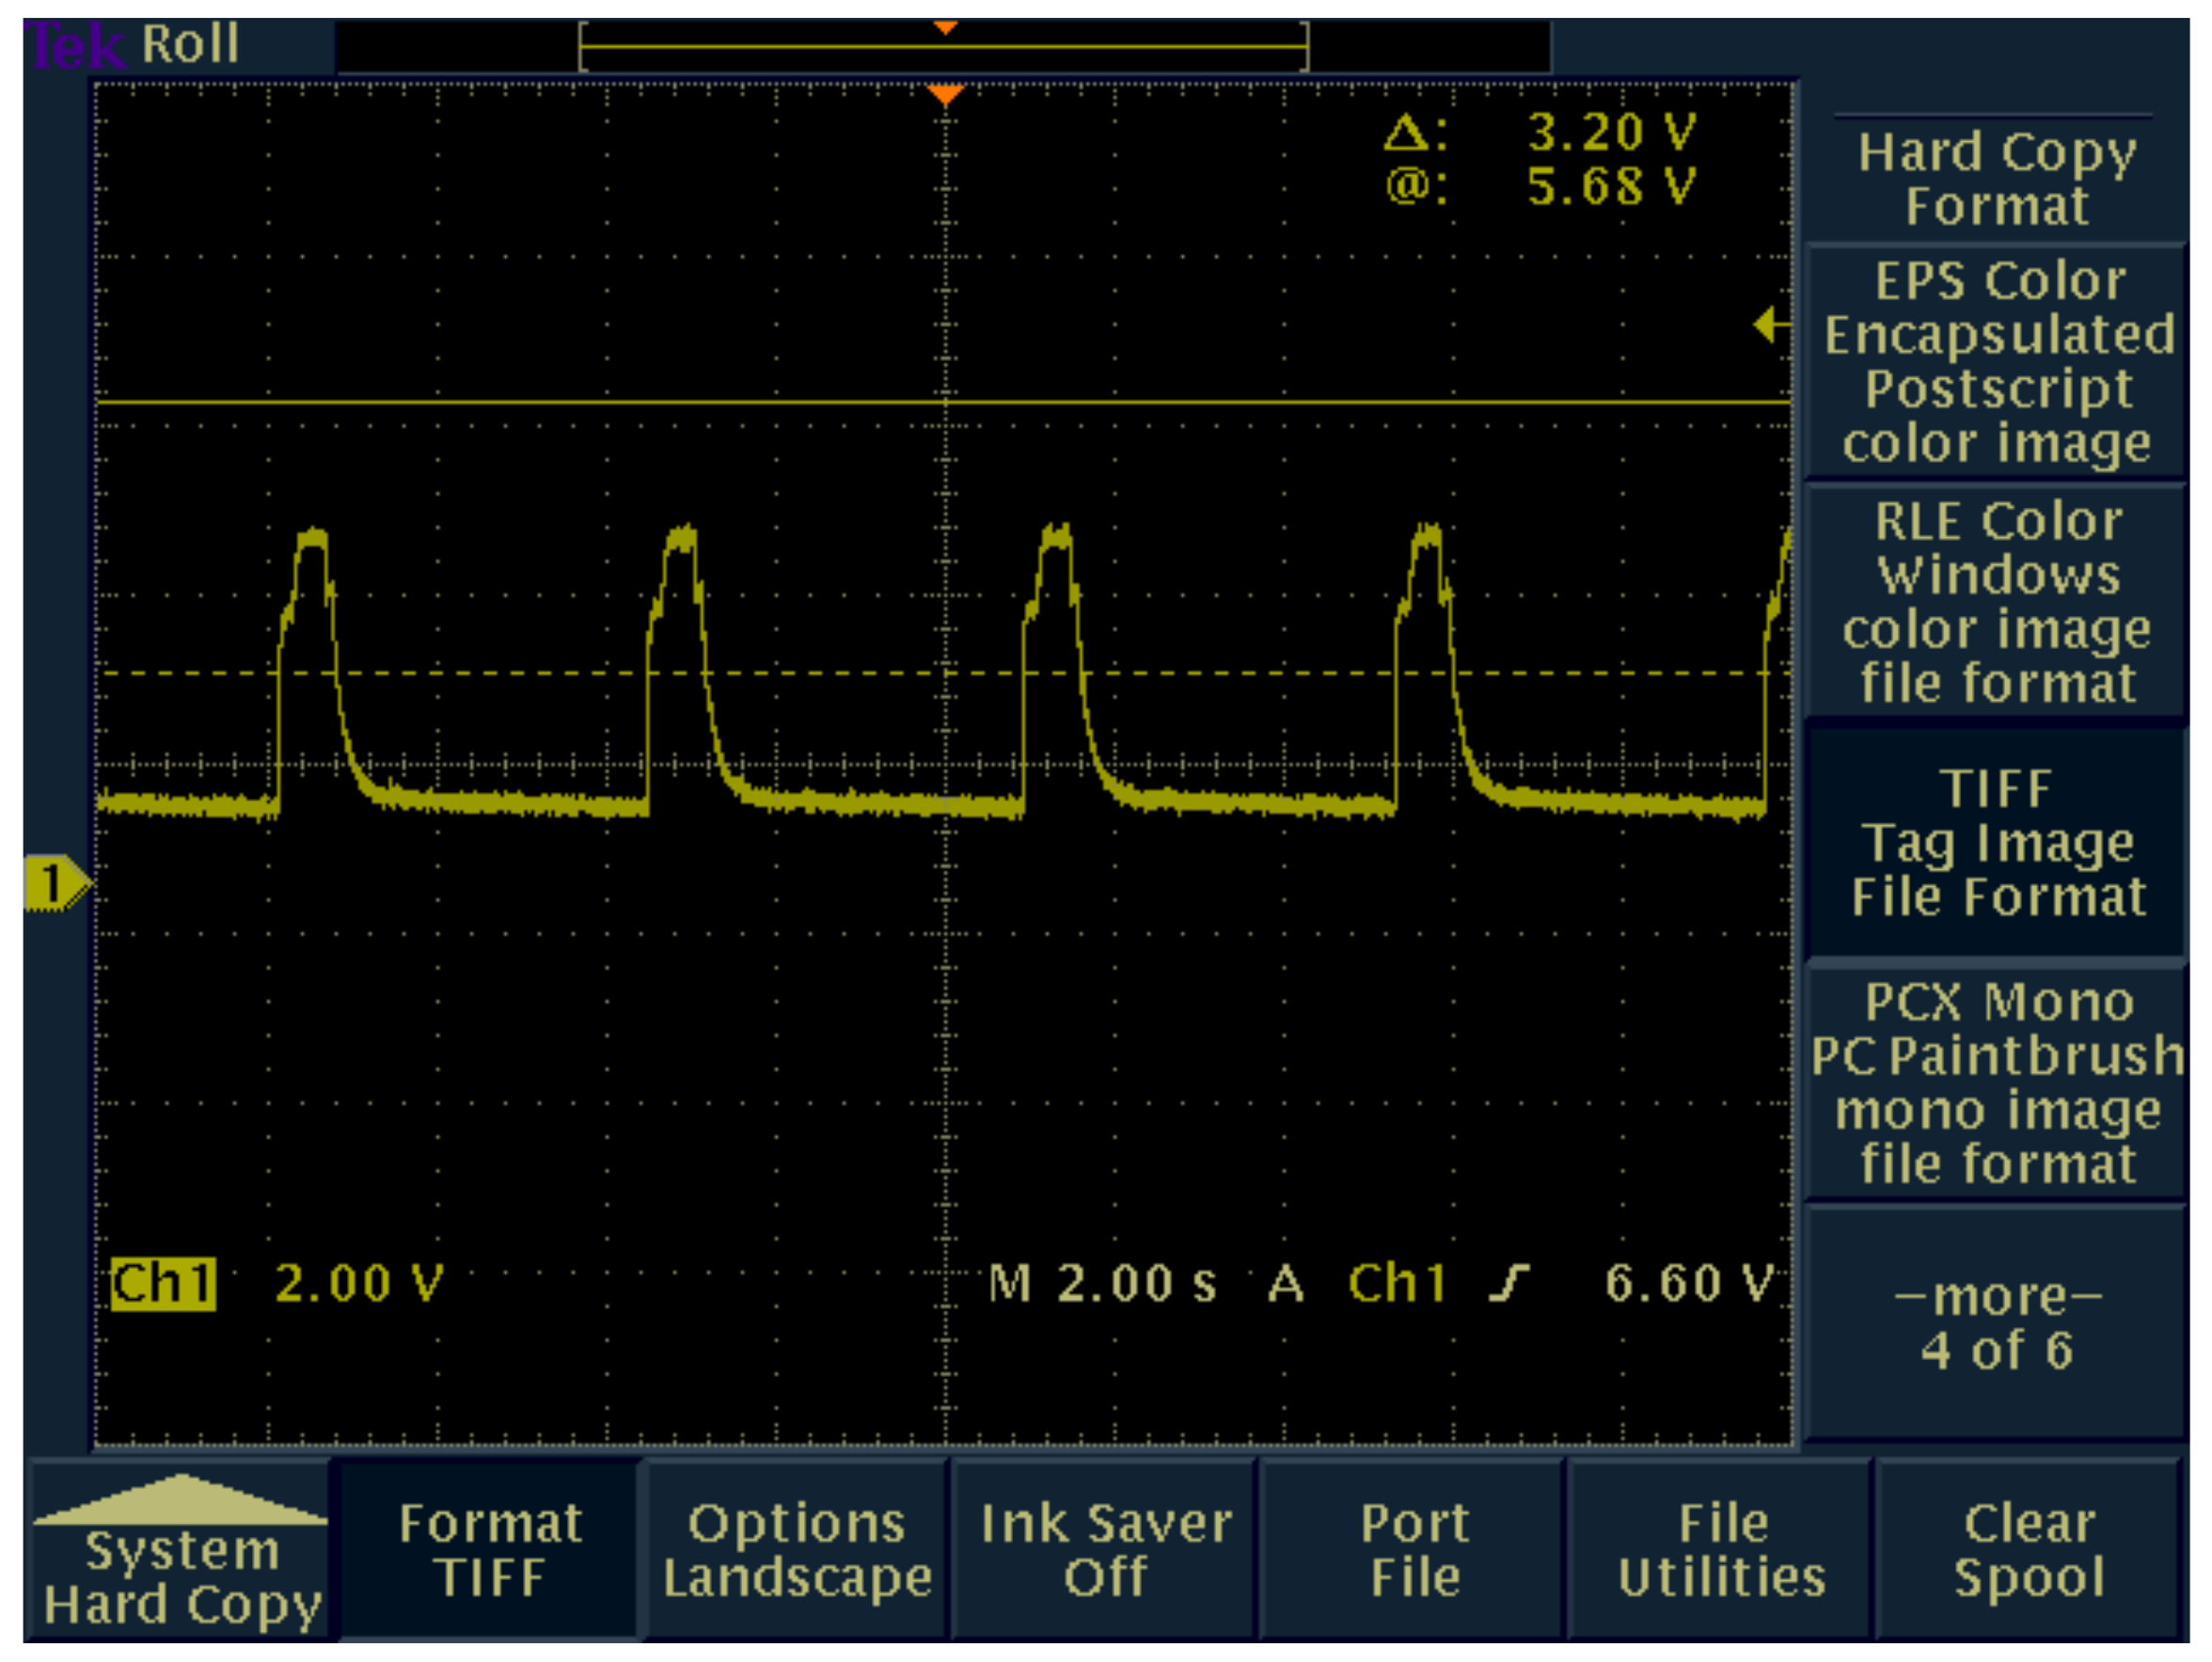
The PWM signal was transformed back to its original shape through a Butterworth low-pass filter of the second order (
Figure 4). This signal could be applied directly to the human hand muscles or to the considered prosthesis to perform the complemented motion. The filter was designed with a resistance of 10 k
and using Equation (
19), where
C is the capacitor,
f is the frequency, and
R is the resistance.
The literature average cutoff frequency (30 Hz) was employed. The values of the capacitors were calculated as and .
2.5.1. Strategy to Assess the FES on the Simulated Hand
Noticing that the simulated hand prosthesis was not a direct model that represented the relationship between the FES electrical signal and the biomechanical motion, this study considered an alternative to express the connection between them.
This strategy used the evolution of error (
) between the reference or literature stimulation signal
and the output of the second LSTM
for each of the iterations
j. To consider the deviation between the healthy and the LSTM signals, the mean error
for each joint of the simulated human hand was obtained using the following set of expressions:
In addition, the difference between the individual gains for the joint and was obtained, where the symbol refers to the controller gain considered for the simulation of the healthy patient, while is the gain used for processing the simulation when the sick patient was evaluated. This differential, , represents how much gain the sick simulated hand needed to be adjusted according to the following expression:
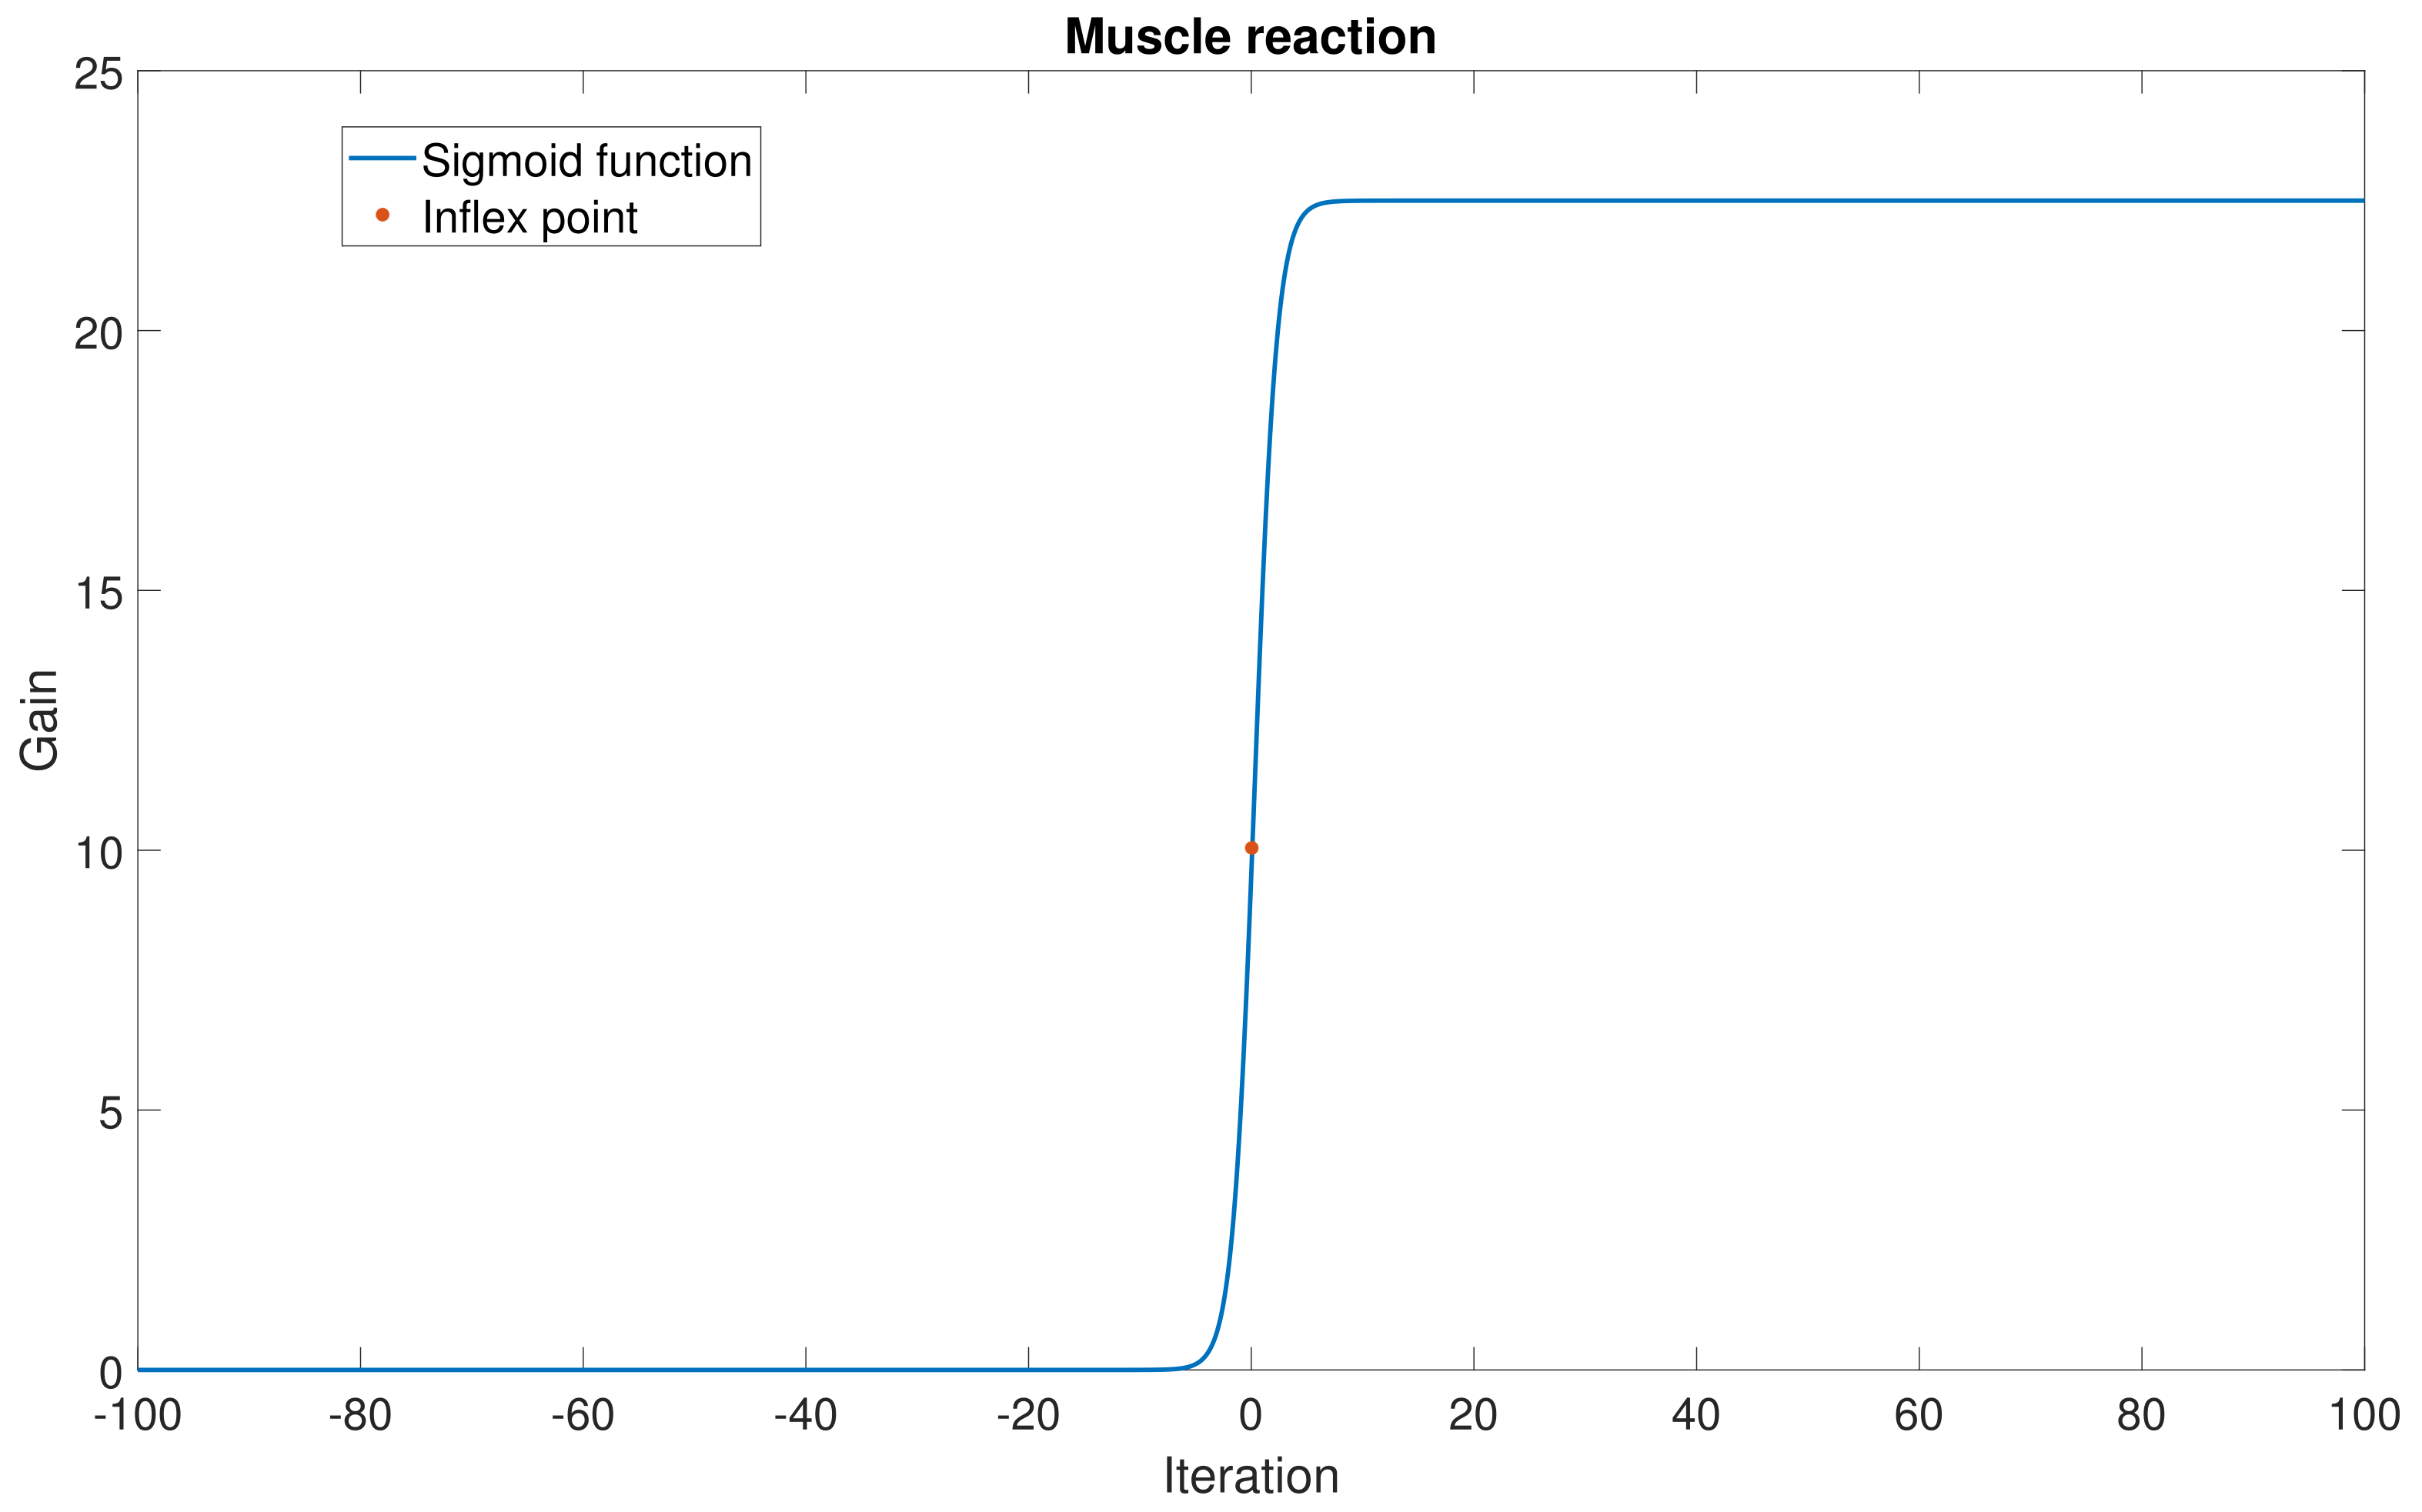
Given the electrophysiological evidence that a sarcomere presents a saturated reaction to the electrical stimulus (justified by the restricted motion performed by the muscle despite the amplitude of the electrical stimulation). One manner in which to represent such a saturated condition is using a sigmoid function evaluated on the estimation of
, as follows:
This function has an inflex point proportional to the mean error (
) and the constants
and
to control its shape. Then, it was demonstrated that Equation (
21) obtained the modification to the proportional control gain
, and it was added to correct the proportional gain of the simulated hand. Hence, depending on the estimation error of the LSTM, the gains were adjusted, yielding a closer condition to a healthy or sick patient. This numerical methodology substituted for the necessity of estimating the electro-bio-mechanical model of the simulated hand. Notice that the gain modification strategy could also be applied to the other gains in the controllers considered in this study.
2.5.2. Strategy to Assess the FES on the Prototype of the Prosthesis Hand
In a similar manner to the one considered in the previous subsection, an alternative strategy was used to evaluate the effectiveness of the LSTM classifier for EMG and the associated FES information when the generated signal was applied to the prototype of the prosthetic hand. A series of trajectories was computed to facilitate motion in response to a compromised hand condition. Upon receiving the pre-established FES, the hand had to execute movements in alignment with the reference trajectories, provided that the stimulation signal aligned with the accurately classified EMG signal. However, as the classifier for EMG signals had an accuracy of 91.87%, it could produce imprecise classification. Hence, the strategy considered the assessment of the stimulation error, defined as
The vector variable represents the stimulation error corresponding to the generation of the FES signal for all the articulations in the prototype, is the vector of the intended movement stimulation signal, and the vector is the stimulation signal estimated with the application of the LSTM classifier. Notice that this deviation can be calculated considering the validation strategy proposed in this study.
In view of the operative range for the UHand being
for all the articulations, there was a need to adjust the value of all components in
to match this admissible range. Such an adjustment implies that if the
i-th component of
is zero, then an action corresponding to
must be performed on the prototype, while if this component reaches its maximum value
, then it should produce the maximum action in the hand, that is
. Given the operative conditions for the hand, including its own internal electronic control, the following relationship can be used:
Notice that this expression permits the estimation of the value of
, which is the command that must be sent to the UHand. Furthermore,
defines the relationship between the hand’s voltage (
V for this particular prototype) and the stimulation signal voltage (
V), that is,
. After this generation scheme, the new trajectories that must be injected into the physical hand are defined by
Here, is the instruction used to stimulate the articulation of the hand, while are the trajectories corresponding to the case when a healthy patient is moving the hand. Notice that this strategy induces the requested motion on all articulations in the hand if the classifier based on the LSTM operates effectively. Otherwise, the prototype moves to a different position, confirming this strategy’s applicability.
2.6. Validation
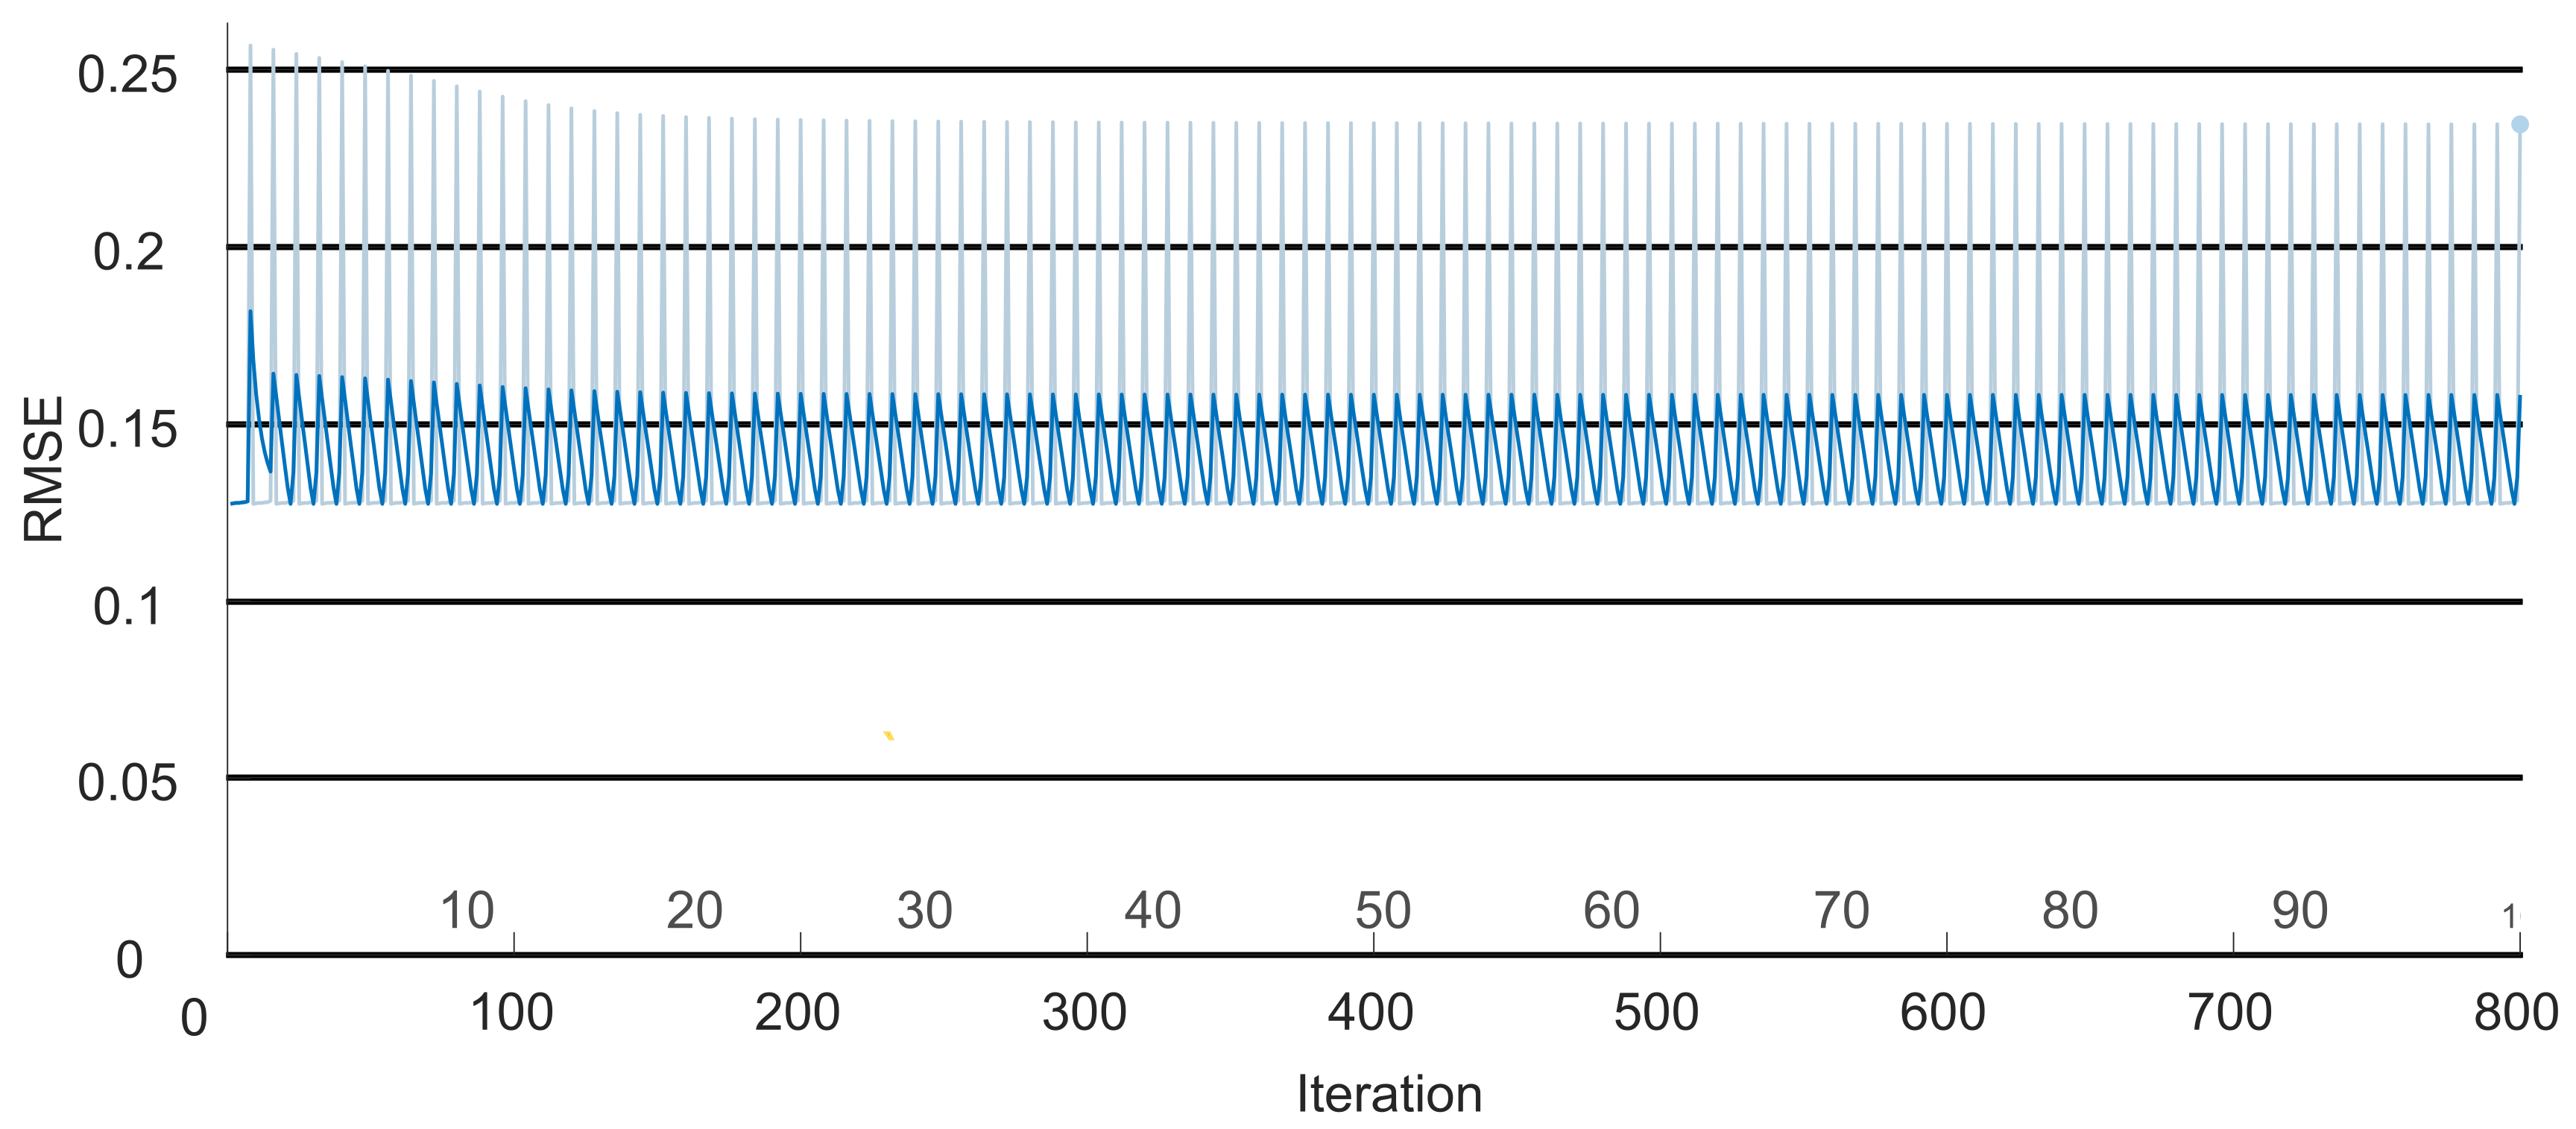
To prove the efficiency of the regression LSTM, a Pareto analysis was carried out. The study proposed by [
33] defines a Pareto diagram as a graph where various data classifications are organized in descending order to qualify their behavior. This method states that the error must be below 0.02. To validate that the identification error for the estimated FES signal was below that value, the loss of the signal (
) at the output of the LSTM (
) was obtained as follows:
Here, j is the iteration corresponding to the signal produced by the FES system. Then, the value for each iteration was determined with the following equation: .
4. Discussion
EFS has proven to be a valuable tool in the rehabilitation of patients with motor disabilities. Despite its well-established advantages and a history of use since the 1950s, its effectiveness is still contingent upon patient responses (including movement, pain, or relief) and the expertise of medical specialists.
Numerous studies have delved into the application of this technology for rehabilitation devices. However, there remains a gap in the exploration of critical factors, such as regulating the speed of desired movements and the force applied by muscles during action. To harness this technology for such devices, it is essential to consider key elements of the motor system, including the intended movement, the muscles involved, the type of stimulation signal, and the signal amplitude.
In this study, these parameters were considered to develop a system capable of simulating a human hand with a specific level of motor disability and providing appropriate stimulation for the system to replicate the movements of a healthy hand. A database of hand electromyography (EMG) signals was utilized to classify the user’s intended movements. In this phase, the effectiveness of the EMG signal classifier highlighted in this research represents a significant advancement compared to several previous studies. The achieved efficiency of 91.87% surpasses the performance of the classifiers presented in
Table 1. While the result might seem slightly lower than the classification reported by [
19] (94%), a deeper analysis reveals crucial distinctions.
The study by [
19] achieved a higher classification accuracy of 94% by focusing on robust movements involving coordinated finger actions. In contrast, the classifier presented in this work showcases a unique capability: the analysis of combined and individual finger movements. Sattar et al. [
19] concentrated on assessing strong, combined finger movements, which allowed for a higher accuracy due to the stronger input signals of their analysis. On the other hand, the classifier introduced in this research offers a broader scope, accommodating not only coordinated movements but also individual finger actions. This broader analysis widens the applicability and versatility of the classifier, enabling it to recognize and classify a more comprehensive range of movements.
Therefore, while the accuracy of the classifier might appear marginally lower when compared directly to [
19], its ability to analyze and categorize both combined and individual finger movements represents promise for applications in rehabilitation, as it accommodates a broader spectrum of hand movements.
Up to this point, it was possible to emulate the hand movement on the Uhand by applying PD and Super-Twisting controllers in combination with the classifier. This strategy permits the evaluation of the proposed classifier on prototypes of human hands in virtual and physical forms of this device. Moreover, the selected strategies to validate the application of the emulated EFM seem to offer alternative options to evaluate more complex forms of our proposed classifier.
5. Conclusions
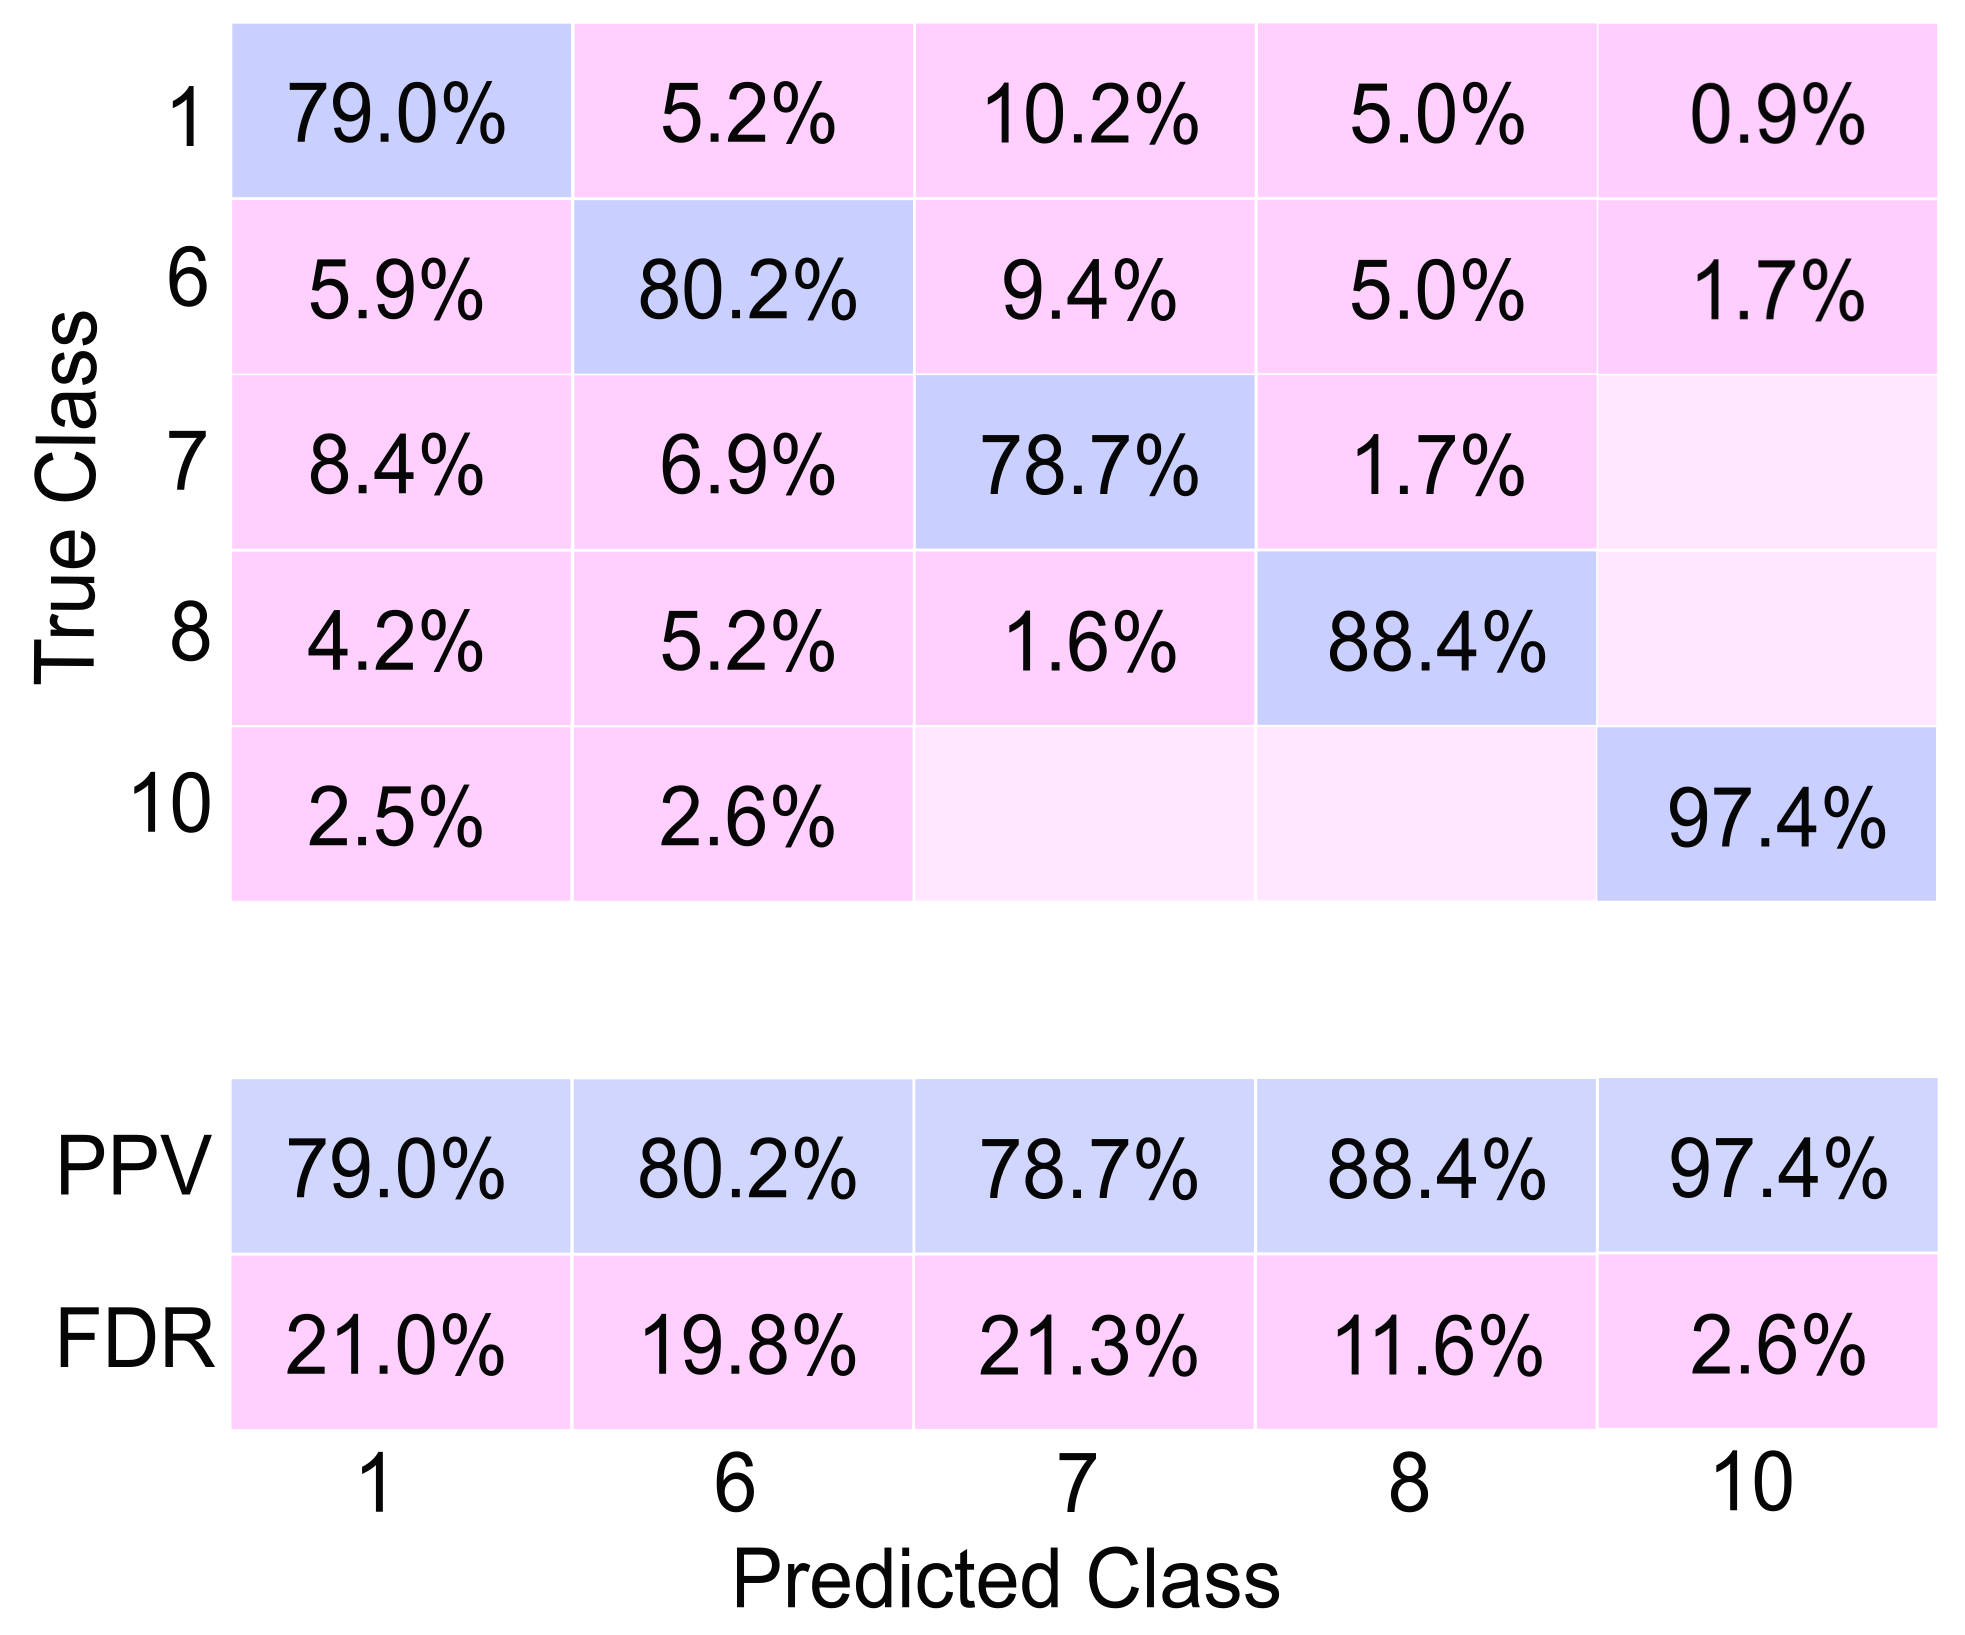
Analyzing the proposed methodology’s results, it can be concluded that they are favorable for personalizing FES. Firstly, the initial LSTM-type neural network achieved an efficiency of 91.87%, not only surpassing the average reported in the literature but also outperforming that reported for intricate movements, such as individual finger movements. Similarly, comparing the LSTM classifier and the assembly revealed consistent efficiency across all movements for the former. In contrast, the assembly reported an efficiency of 84.7% only for combined movements.
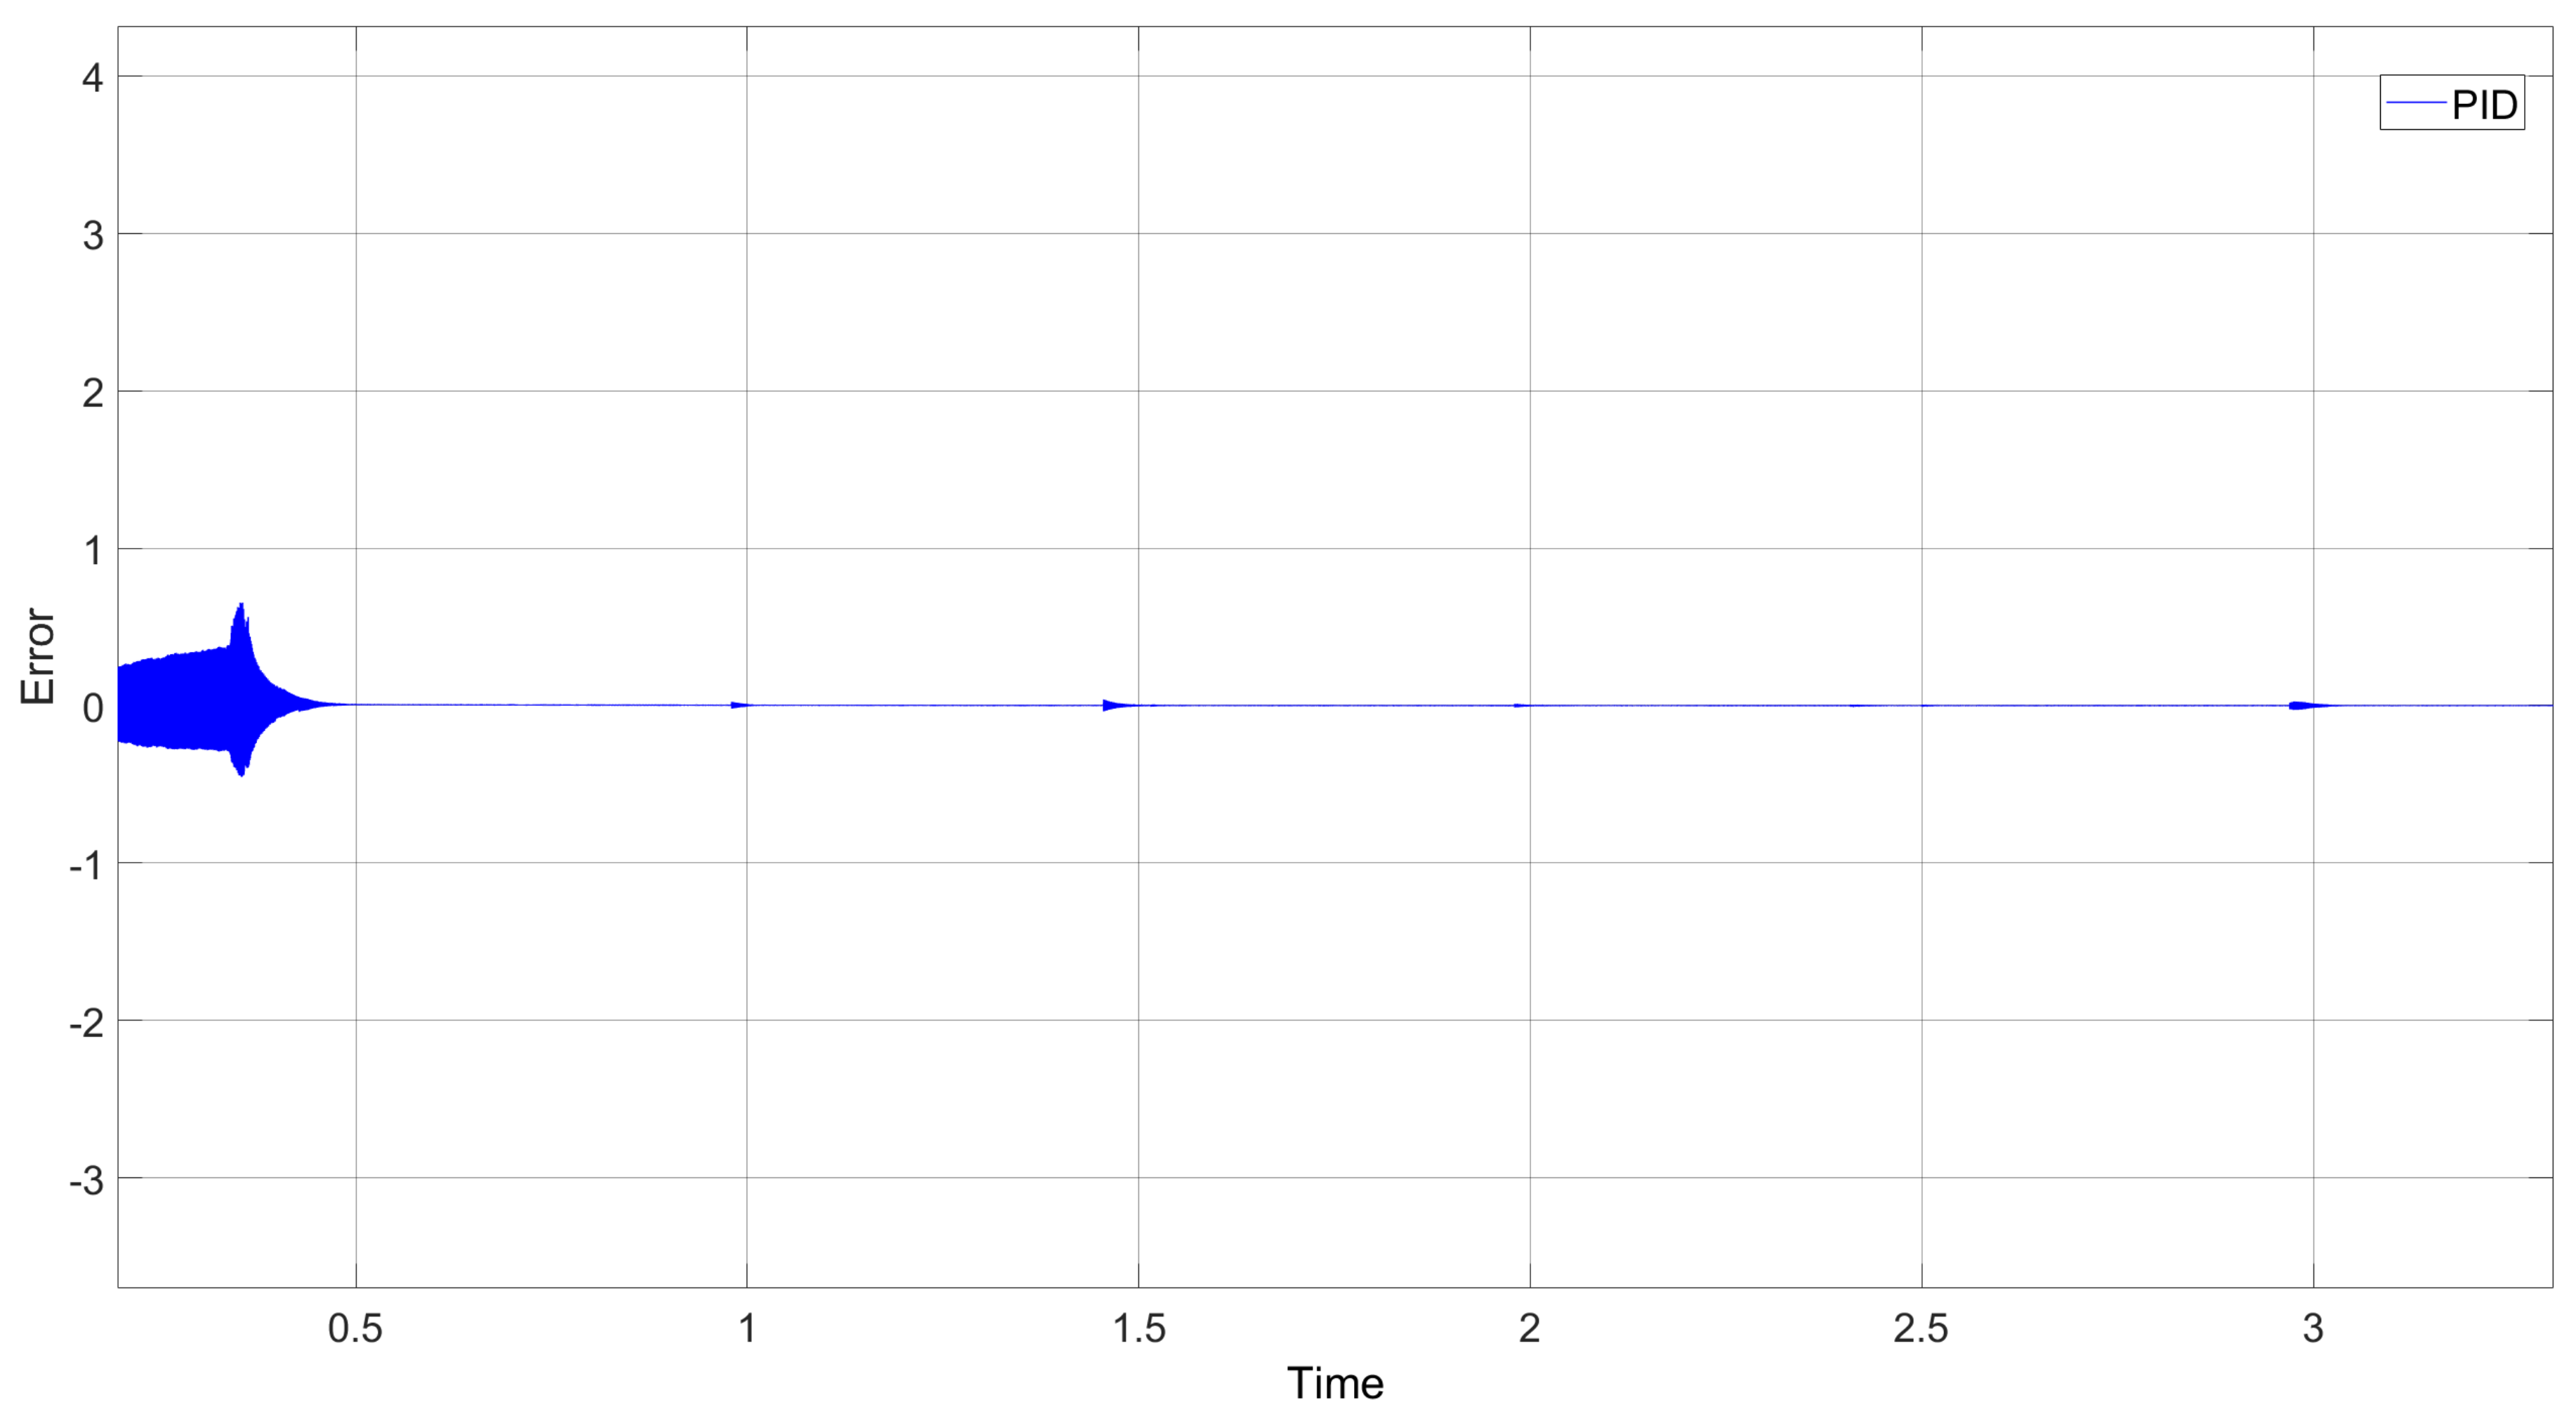
In assessing the proposed controllers, it is evident that the Proportional–Derivative (PD) controller excelled in managing the velocity component. When paired with the Super-Twisting controller, it converged toward zero more rapidly and with reduced amplitude oscillations. Consequently, the simulation of the human hand displayed fine and natural motion. Notably, the use of the PID controller provided by Simulink was dismissed due to its longer convergence period and abrupt oscillations, potentially leading to erratic movements despite ultimately reaching zero. Movements were evaluated after the execution of the movement class, and a precise controller was obtained. This study found that both the simulated and physical hands executed the ten movements in a manner consistent with natural human hand movements.
Based on the outcomes of the initial classification network, the trajectories corresponding to the reference motion were identified. Simultaneously, a model representing a diseased hand was devised by subtracting the previously determined reference coordinates. Using this error vector, the precise stimulation signal required for the individual to replicate the reference model’s movement was obtained. Subsequently, the neural network was assessed under the Pareto model, yielding an error of less than 0.02. This result ensures the efficiency of the signal provided by the second network.
Upon acquiring the stimulation signal, we simulated the responses of both the physical and simulated hands to the provided stimulus. During the simulation, it was observed that the simulated hand approximated the reference hand’s movement. While the movement was not a replica (given that it simulated a hand in rehabilitation), similar behavior was observed in the physical hand.
For future endeavors, a third neural network should be designed to offer feedback. This network would consider the individual’s initial movement, the reference movement, and the resultant movement following stimulation by the system. Its purpose would be to enhance patient safety, monitor real-time system movements, identify potential trajectory changes, and rectify them before they manifest.
