1. Introduction
In most engineering applications, undesired vibrations are considered among of the most important problems that arise in mechanical systems. Since vibration control at the source is not always viable, one of the most used solutions is to reduce the vibration transmission by including some type of isolating element with the appropriate stiffness and damping characteristics.
Although active-type isolators are ideal since they can adjust their response in real time to the vibration, passive-type isolators are the most widely used due to their lower cost, simplicity of installation and maintenance, stability and reliability, among other aspects.
Metal-mesh (or cushion) insulators are passive-type isolators composed of tangled or woven-metal wires, coiled and compressed into almost any geometric shape required. The material of the wire mesh is usually steel [
1], nickel [
2], titanium [
3] or aluminum [
4]. References to this type of insulator can be found in the scientific literature under different names, such as “wire mesh”, “metal mesh” and “metal rubber”, because they show certain similarities to elastomeric insulators. Nonetheless, metal isolators have notable advantages [
5] with respect to other types of isolators, such as high stiffness and amplitude of the hysteresis loop [
6], great damping capacity [
7], resistance to a large range of pressures and temperatures (−70 °C to 300 °C) [
8] and high resistance to corrosion, among others. Furthermore, their stiffness and damping are less affected by temperature changes than other isolator types, they slightly degrade [
9], and they are able to work in vacuum conditions and under radiation. Despite their multiple advantages, they have two main drawbacks: (i) their inherent non-linear behavior makes their characterization process challenging; and (ii) their mechanical behavior as vibration isolators depends on a large number of manufacturing parameters (wire diameter, radius of ripple, relative density or porosity, etc.) [
10], the correlation of which is not yet well understood.
Metal-mesh isolators are used in several engineering fields, such as the manufacturing sector [
11], biotechnology [
12,
13], seismic prevention [
14] and the logistics and transport sector in all its variants. The noise and vibration problem in motor and internal-combustion-engine vehicles is well known. Much effort and many economic resources have been invested to improve, among other things, the passengers’ comfort. This kind of isolator has been successfully applied to reduce vibrations transmitted to the vehicle steering wheel [
15] from the engine [
16] and the turbocharger [
17]. In the rail sector, this isolator type has been found to be great alternative to conventional elastomeric heatsinks since it presents better behavior under fatigue and thermal stress, ultraviolet radiation, humidity and degradation, among other conditions [
8]. Moreover, metal-mesh isolators have been tested as aircraft engine components [
18], and there have been studies analyzing the feasibility of using them in outer-space applications, for instance, in pumps to drive liquid hydrogen, which is one of the main fuels used by space rockets. In this specific application, conventional elastomeric insulators have been discarded because the low temperatures provoke a drastic damping decrease [
19]. Metal-mesh isolators are also employed to attenuate the vibrations caused in the launch phase [
20] and the micro-vibrations that are registered when satellites are in orbit, which decrease the image and video signal quality [
21].
Although metal-cushion insulators have a wide range of usages and applications, as well as being of their first patents dating back to the 1950s, their scientific analysis is still in a very early stage. Proof of this fact can be found in databases, such as Scopus, in which the number of references to metal mesh-based insulators is an order of magnitude lower than those to elastomeric isolators [
22]. Moreover, most of these references are from the last decade and address their characterization and modeling, mainly because the current methods for characterizing elastic elements are not suitable for this isolator type, primarily due to their strong nonlinear behavior [
23,
24]. It is evident that, although this topic is currently being researched, there is still work to be performed. The accurate characterization and modeling of these isolators are essential to be able to implement their characteristics in simulation software, in turn allowing for evaluating their effects on the performance of the system in which they are going to be mounted. The efficient design of these elements makes it necessary to comprehend the influence of manufacturing parameters on the dynamic characteristics of the isolators. For instance, Ma et al. [
25] proposed a strategy to analyze the response of a metal rubber isolator under random vibrations by effectively designing the stiffness and damping coefficients via its manufacturing parameters. Liu et al. [
26] described the design process of a metal rubber isolator, with its manufacturing parameters greatly influenced the mechanical properties of the device. Schroth and Wirz [
27] proposed a design of experiments to define the dependent factors of an analytical equation that describes the nonlinear force deflection of metal cushions.
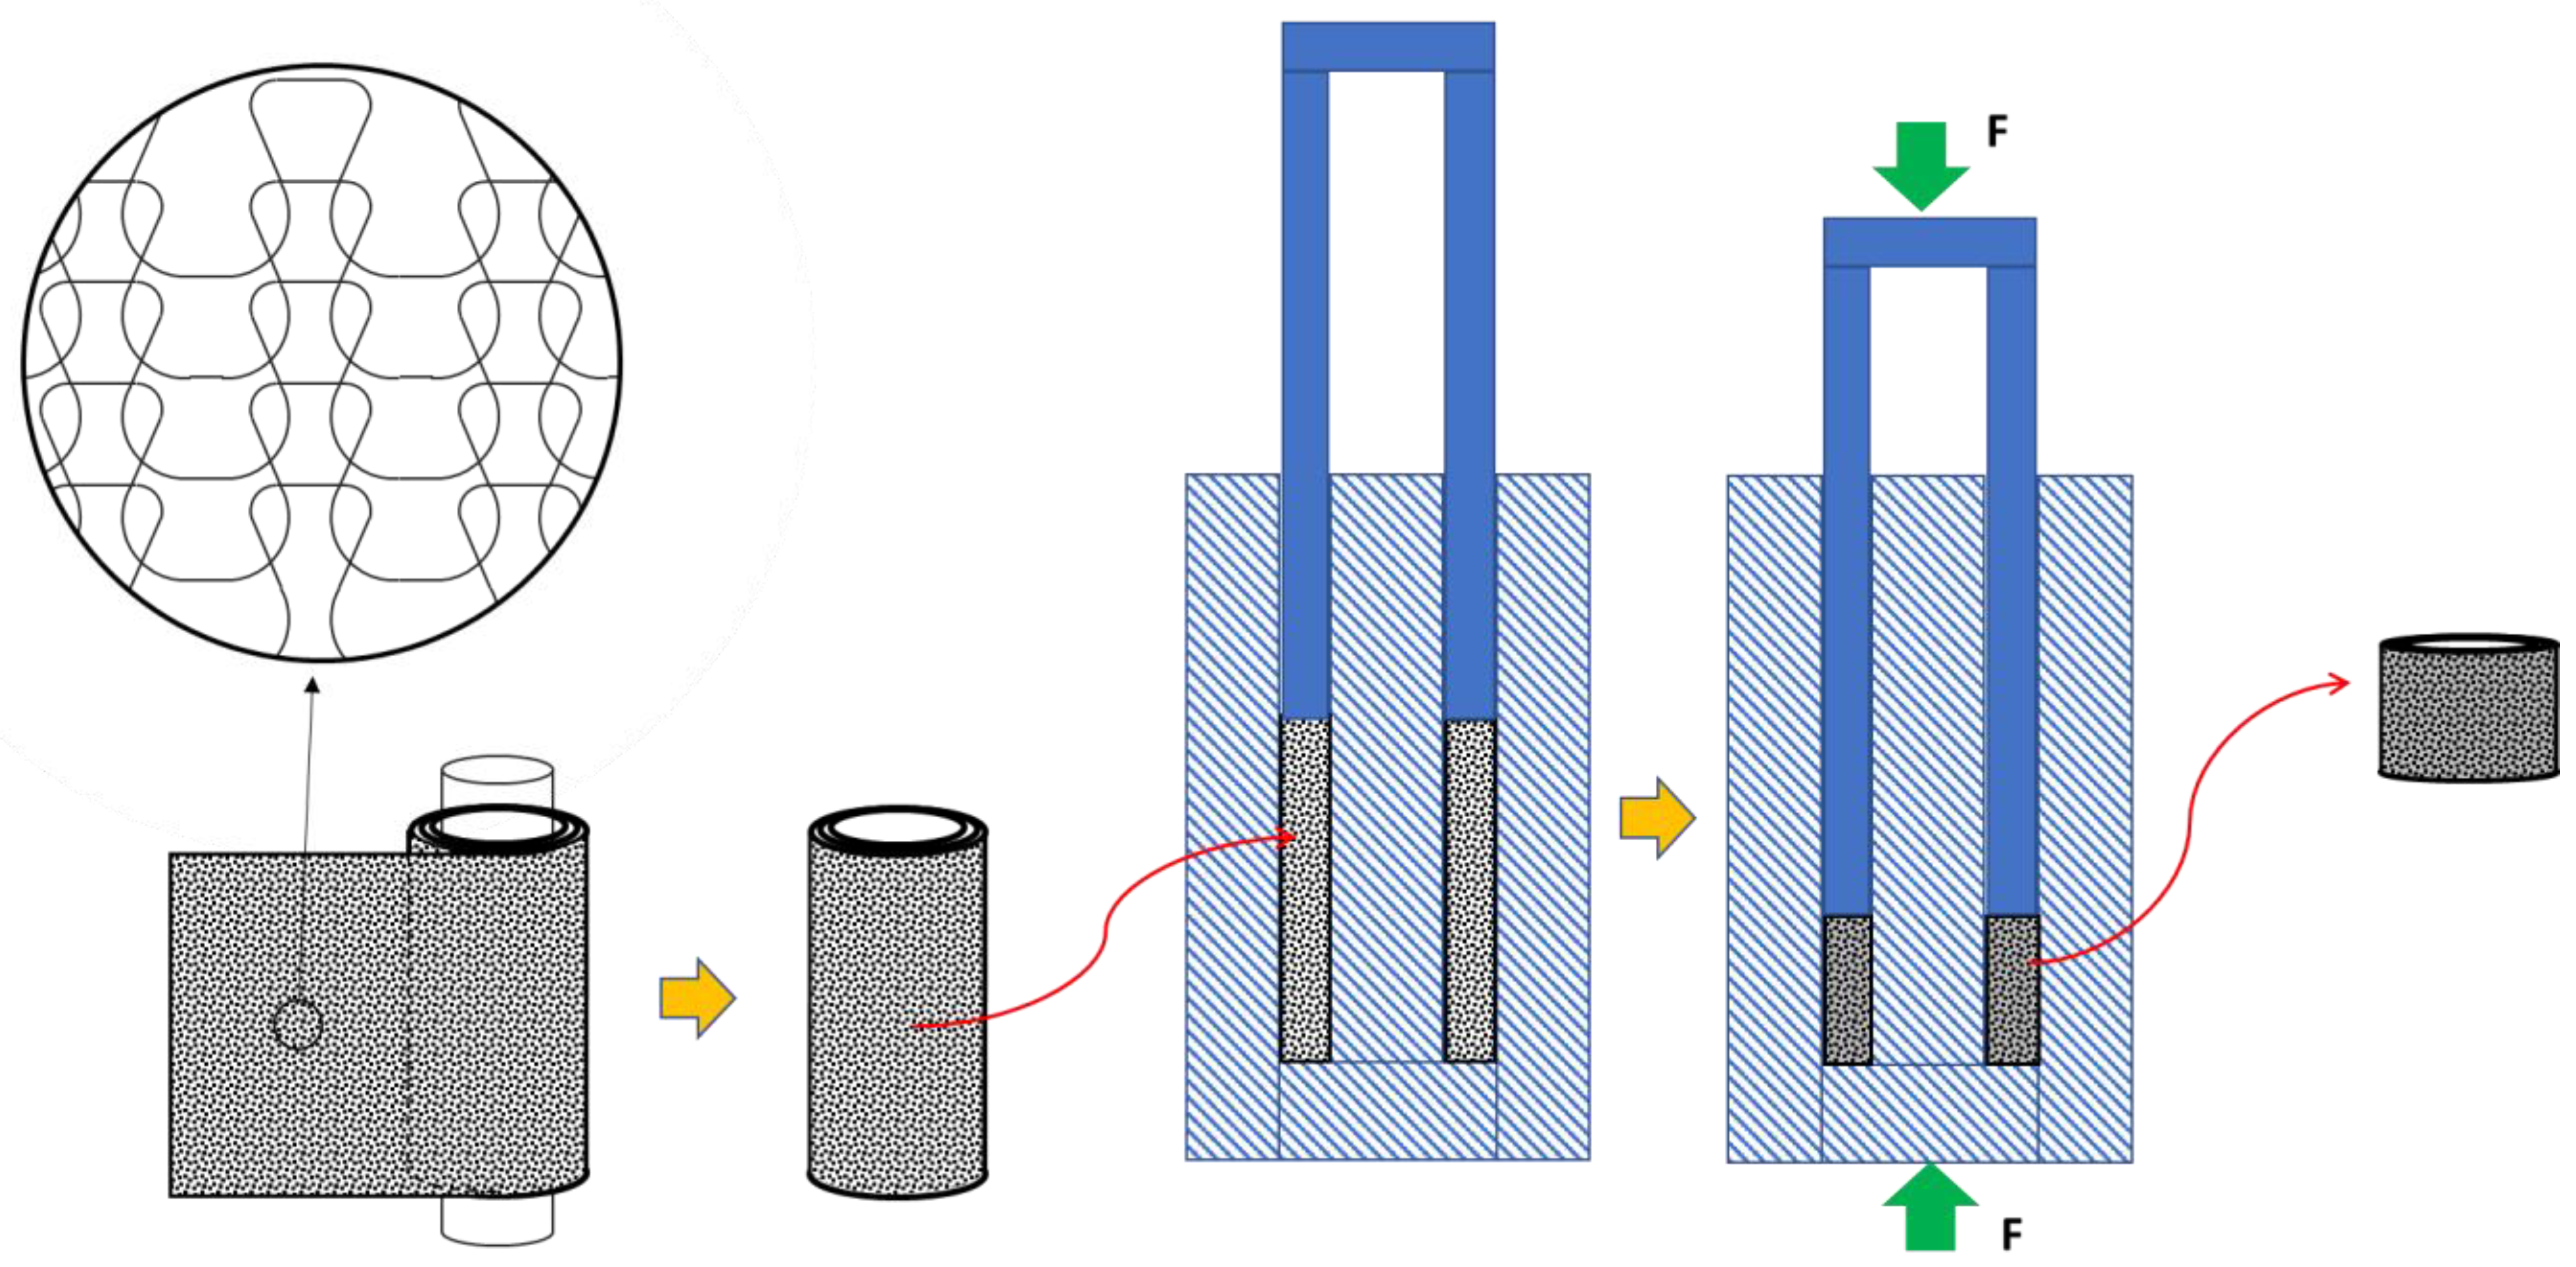
From the manufacturing point of view, two types of metal-mesh isolators can be distinguished: knitted and tangled. In this study, only the first type was analyzed. To manufacture knitted metal-mesh isolators (
Figure 1), a metallic thread is woven to form a mesh. Then, the blanket is undulated, cut to the desired size, rolled up on itself and inserted into a mold with the proper shape. Next, a compression force is applied to compact the mesh, which turns it into entangled threads in a complex and non-uniform meso-structure form, resulting in the volume of the isolator, without which it has not been possible to develop a model that predicts the isolator behavior from its manufacturing parameters to date.
Among numerous design parameters, current studies indicate that the relative density (understood as the ratio between the element mass divided by its volume and multiplied by the thread density) is one of the most important and, together with the isolator shape, one of its main design/adjustment variables in terms of performance and adaptability to different applications.
Considering the relative density as the main reference, this work aims to study the mechanical behavior of the cushion isolators through quasi-static tests. Although the complete characterization of the cushion requires the performance of dynamic tests, quasi-static tests can highlight some of its characteristics faster and more simply. Dynamic tests are necessary to consider higher strain rates, to account for the inertia effects of the isolator itself and to study its behavior with dynamic signals different from harmonics. In previous works [
28], based on dynamic tests, the dependence between the energy dissipation coefficient and the excitation frequency was highlighted.
To achieve this goal, in the next section, “Materials and Methods”, both the specimens and the tests are defined and described. Then, in the section entitled “Results”, the outcomes of the tests are presented, and finally, in the “Discussion” section, a summary of the main conclusions is presented.
2. Materials and Methods
Two types of quasi-static tests were carried out: monotonic compression tests at constant speed and compression tests with cyclic loading. The first tests resulted in the initial dynamic stiffness curve of the isolator under load, while with the second ones, the dynamic stiffness in a permanent regime was obtained, both for loading and unloading the system. Representation of the results of these cyclic loading tests on a force-displacement diagram provides the hysteresis loop of the isolator.
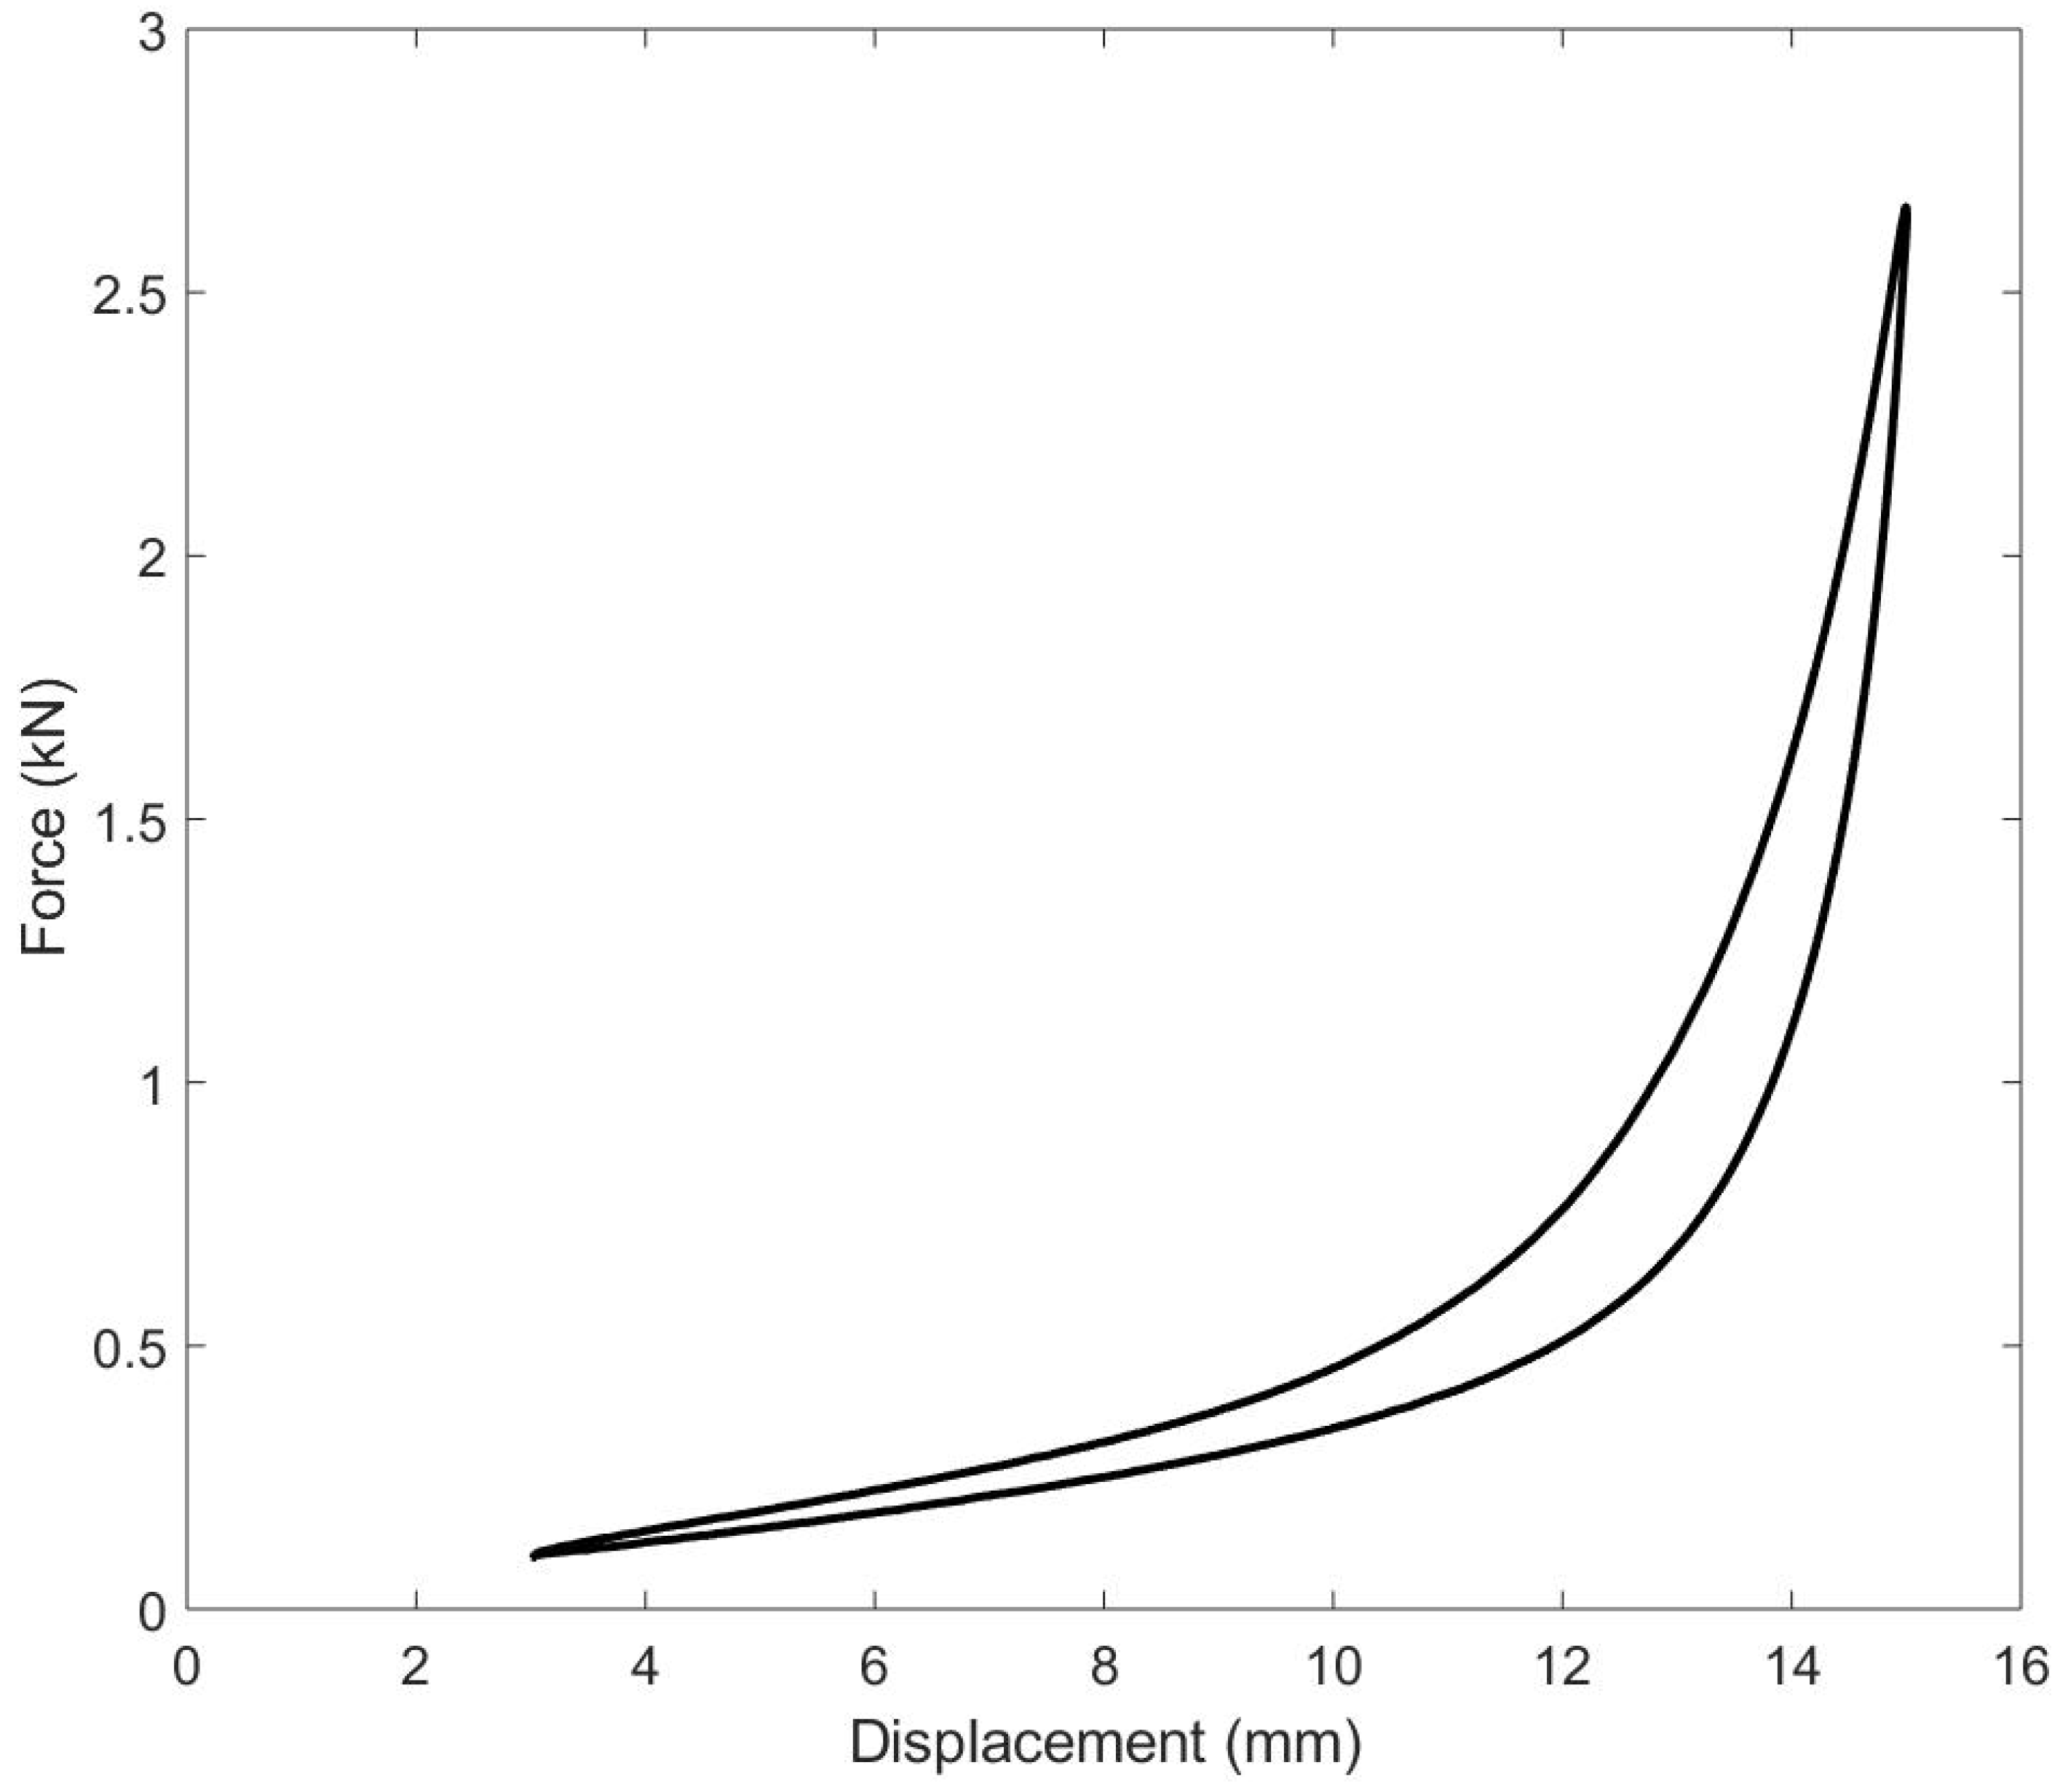
Figure 2 shows the generic hysteresis loop of a metal-cushion isolator, in which the upper curve corresponds to the increase in compressive load (loading phase), while the lower curve corresponds to the decrease in the compressive load (unloading phase).
Within the loading phase, there are three differentiated regions. An initial one with a relatively low stiffness can be distinguished, in which the coils are less compacted and have less contact with each other. In the second region, as the load increases, the stiffness increases exponentially due to the increased number of contacts between wire parts. In the third region, the equivalent stiffness stabilizes due to the elastic strain saturation of the wires.
Although the energy dissipation is complex and is not yet fully understood, it is considered that the friction between the wires is mainly responsible. There are three conditions that can occur in terms of the interaction between wires: (i) no contact; (ii) sliding contact; and (iii) sticking contact. The first takes place when the isolator preload is low and there is not enough compression force to produce many contacts (assuming a low initial density). In this case, the working regime is almost elastic, and the energy dissipation is low. The third condition occurs in the opposite case, in which the preload is so high that it causes most of the threads to be in contact, and there is no room for movement between them, although the contact force between them is high. However, this condition is usually avoided, as it is likely to cause local plastification in the isolator. The second condition is the usual regime for this kind of isolator.
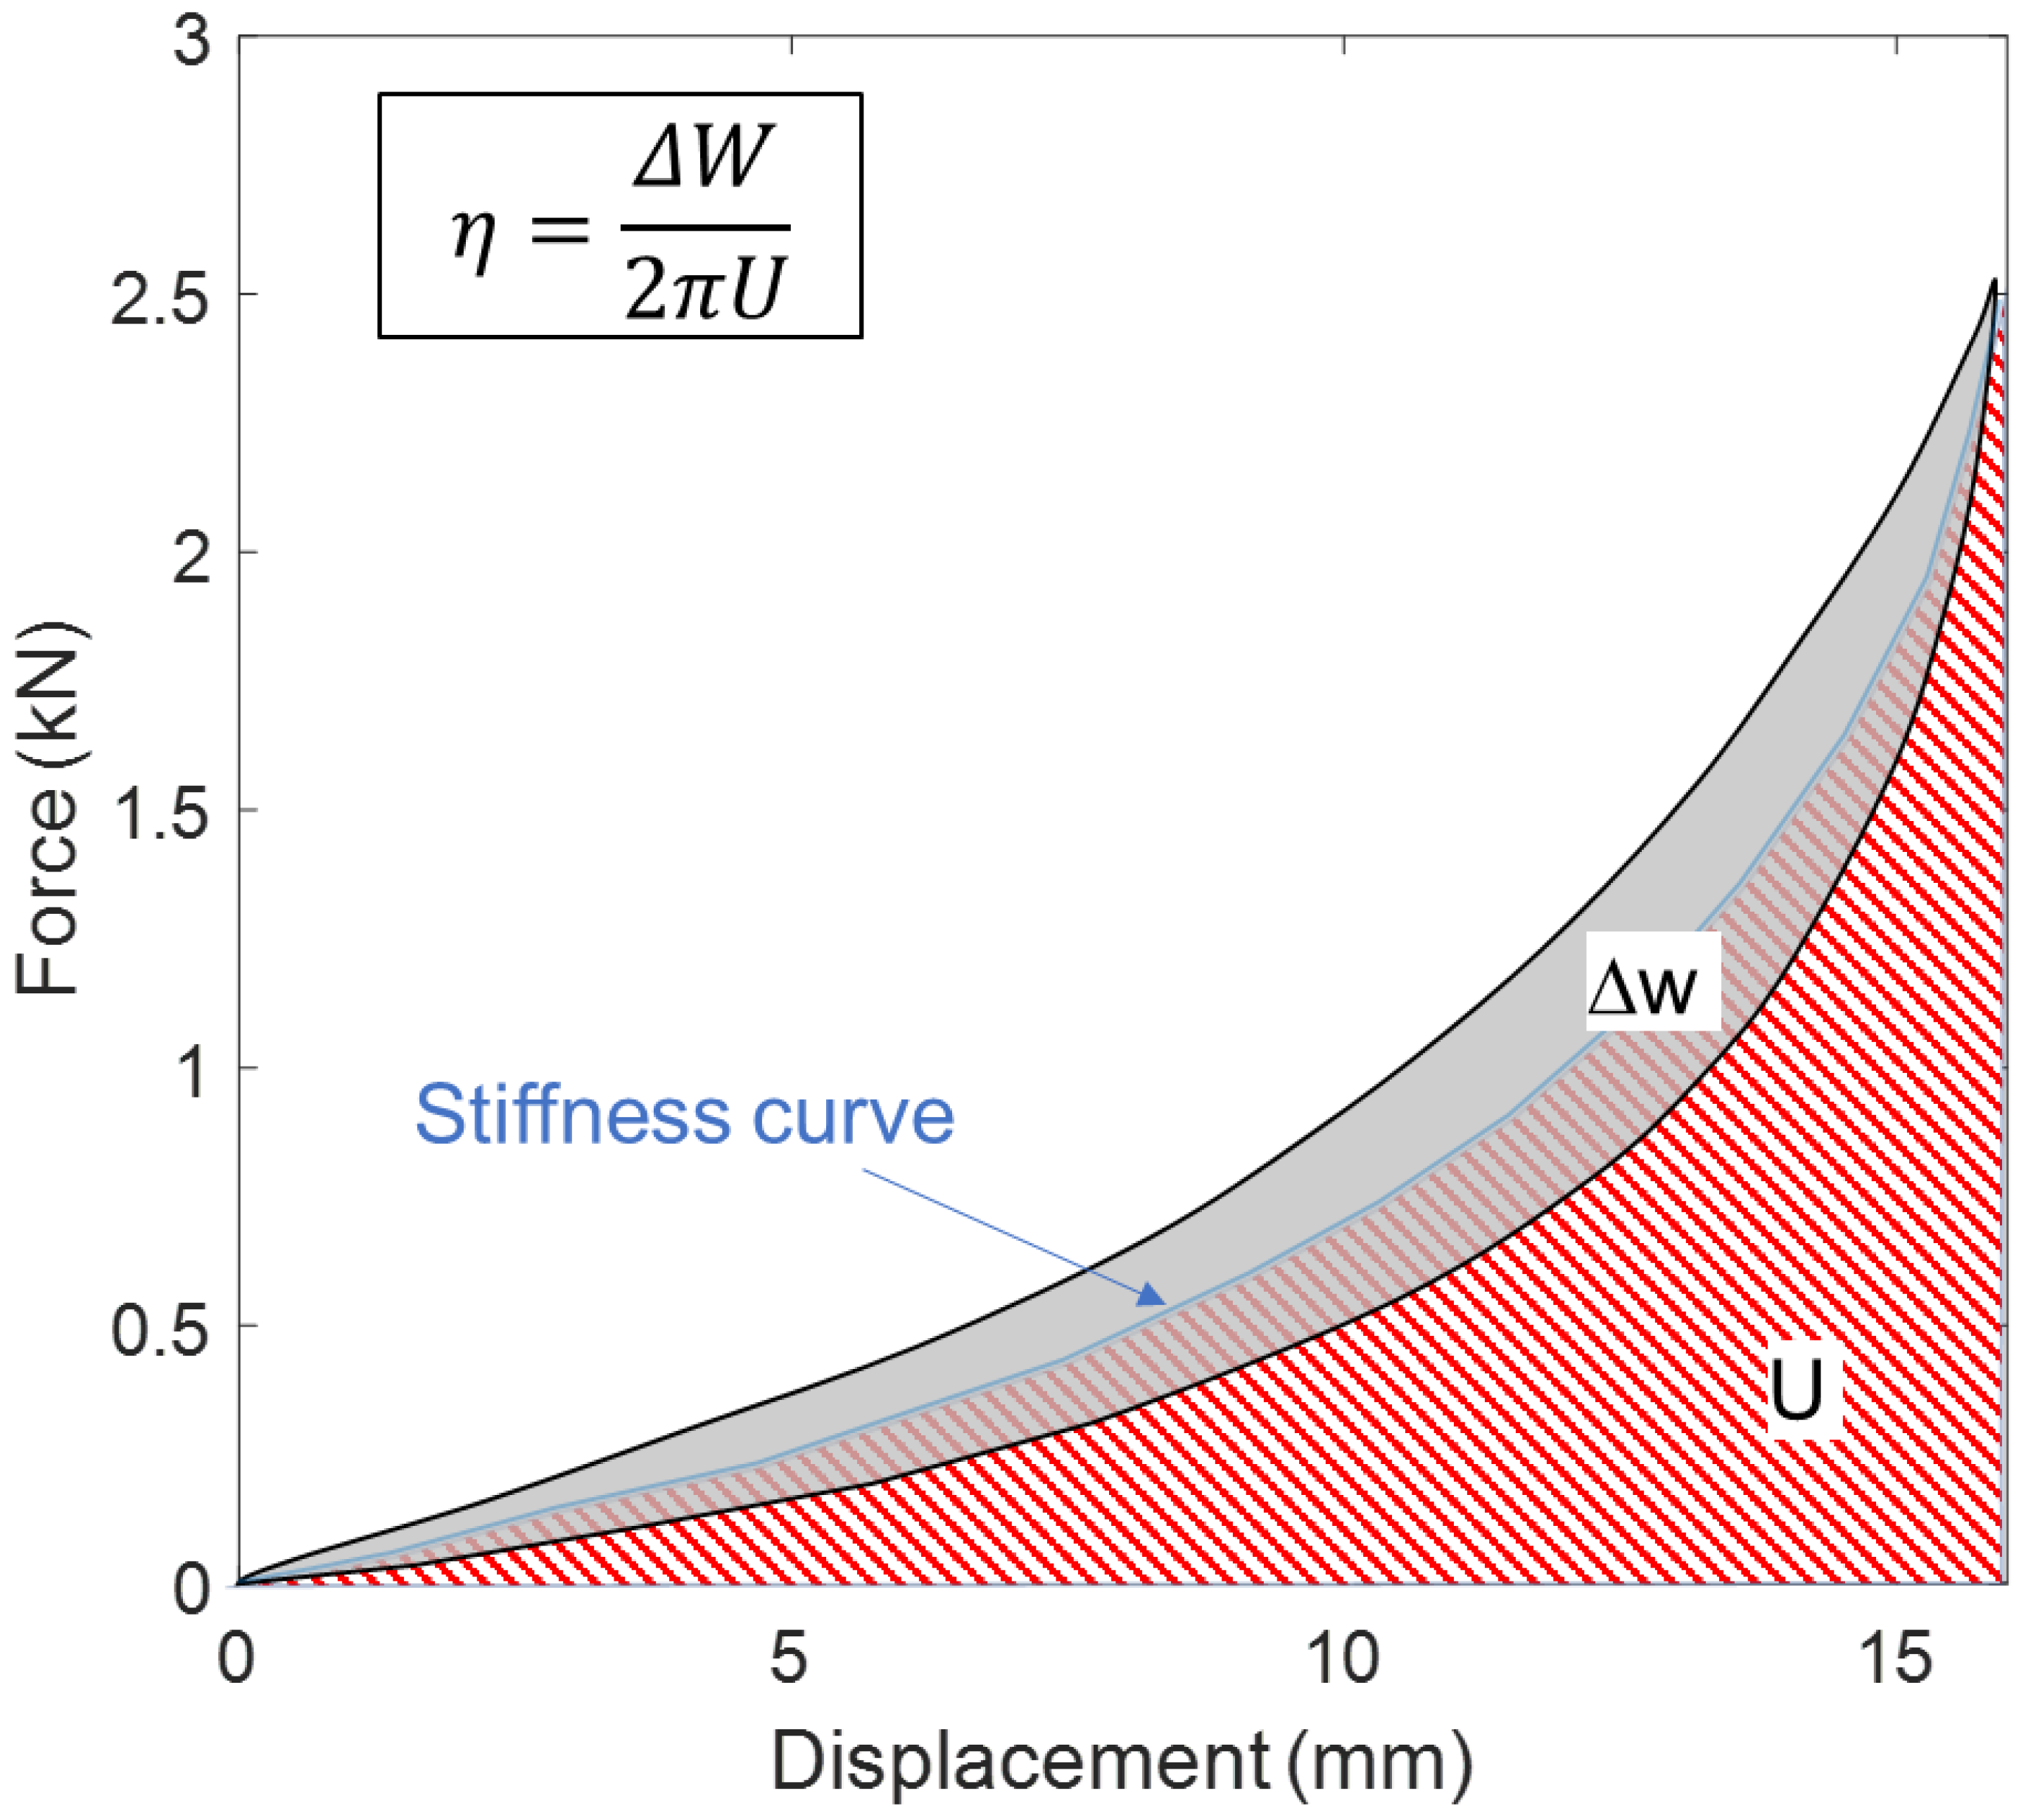
From the force-displacement diagram, basic parameters of the isolator can be determined, such as its stiffness curve and the energy dissipation coefficient, namely the loss factor (
η), as shown in
Figure 3.
In this diagram, is the dissipated energy (represented by the area within the hysteresis loop in gray), and U is the maximum elastic energy, which corresponds to the area under the stiffness curve (represented by the area colored in red diagonal lines). It is assumed that the stiffness curve corresponds to the intermediate curve between the loading and unloading curve of the hysteresis cycle for the same displacement value.
To obtain the load cycles of the isolators, low strain rates were used to minimize the inertial effects of the mesh and comply with the quasi-static condition. The range of speeds is between 15 and 75 mm/min. Some authors [
29] have highlighted the effect of inertia on the behavior of the isolator. Nevertheless, this study was solely based on quasi-static tests. Although the natural modes of the isolators were not determined, the accelerations involved in the cyclic loading tests were considered sufficiently low to not produce dynamic effects, which in turn would affect the measurements. In future studies based on dynamic tests, the effect of the isolator’s inherent dynamics on its behavior will be assessed.
Fulfilling Chandrasekhar et al.’s requirements [
29], before each test, the samples were subjected to cycles up to 120% of the maximum load that would be used in the test. This step stabilized the dimensions of the cushions and improved the repeatability of the results. Likewise, the test began with a minimum load that ensured adequate contact of the isolators with the compression plates. The compression of the mesh for this initial force was considered to be null.
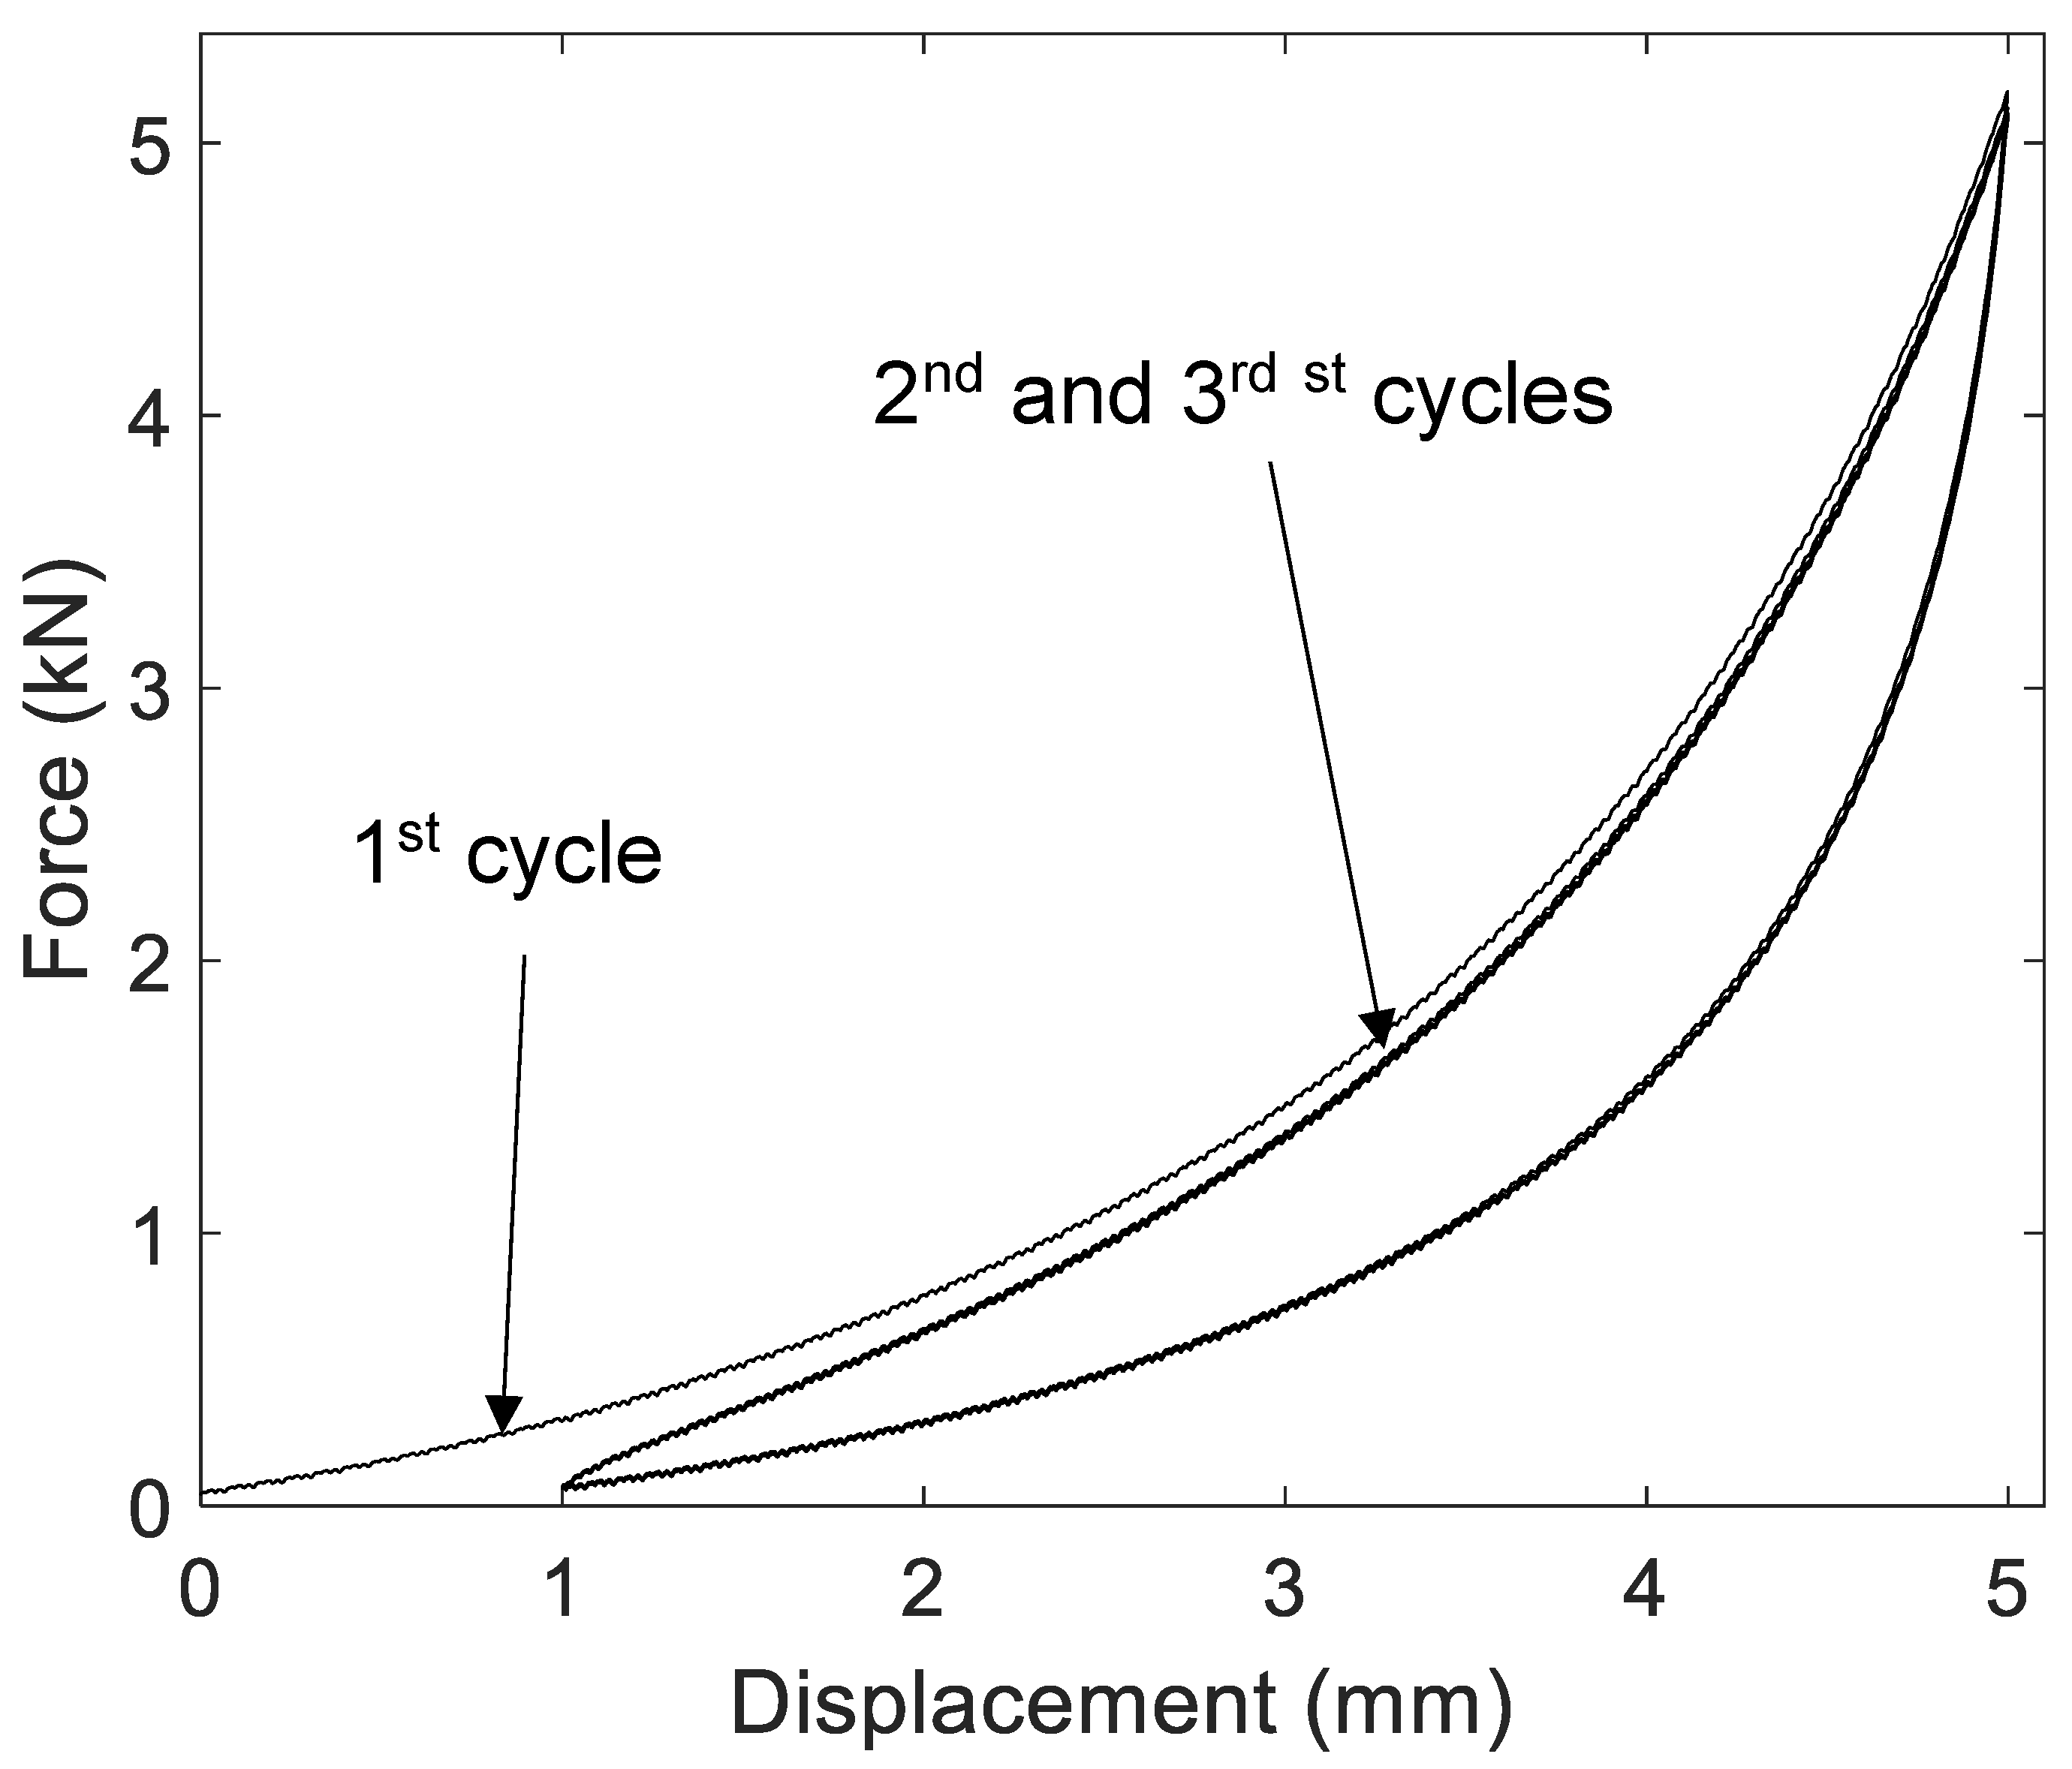
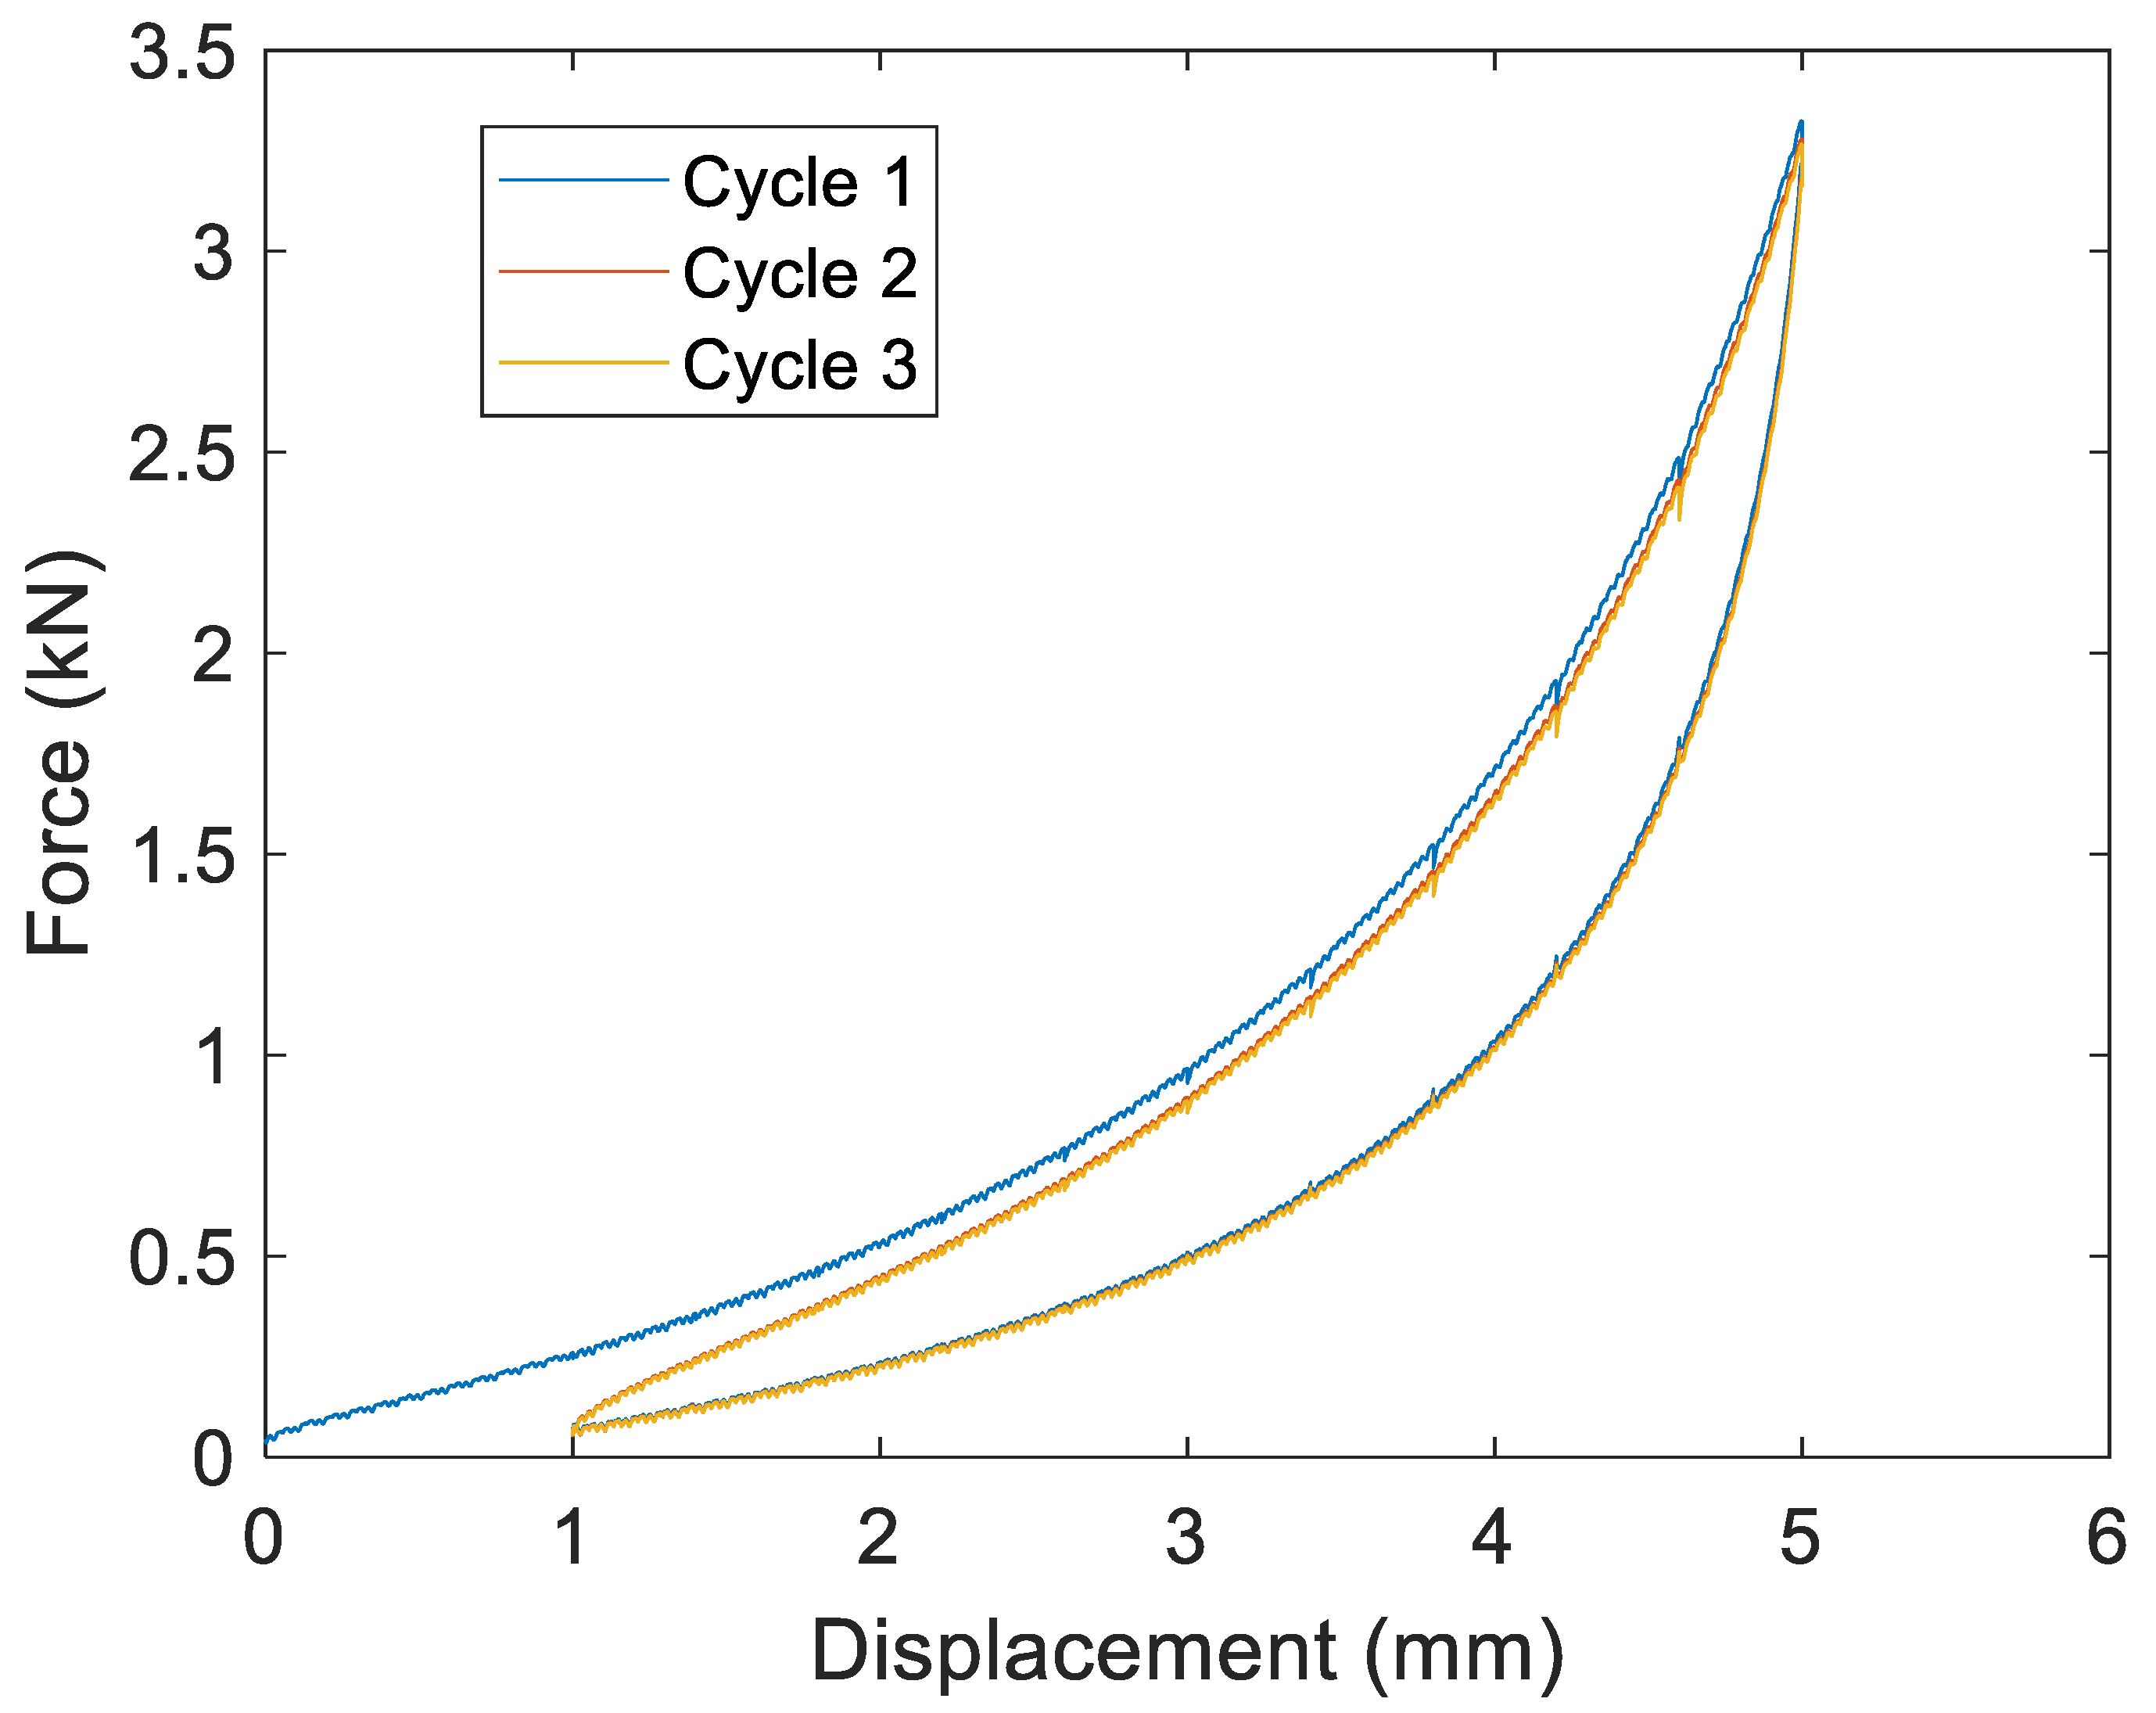
As shown in
Figure 4, the hysteresis cycles showed a different curve for the first cycle than for the subsequent ones.
Consequently, several cycles were carried out in each test to obtain the stable behavior of the isolator. This behavior was normally achieved after the second cycle, so the tests typically consisted of three load cycles between a minimum value and a maximum value of compression displacement.
2.1. Equipment
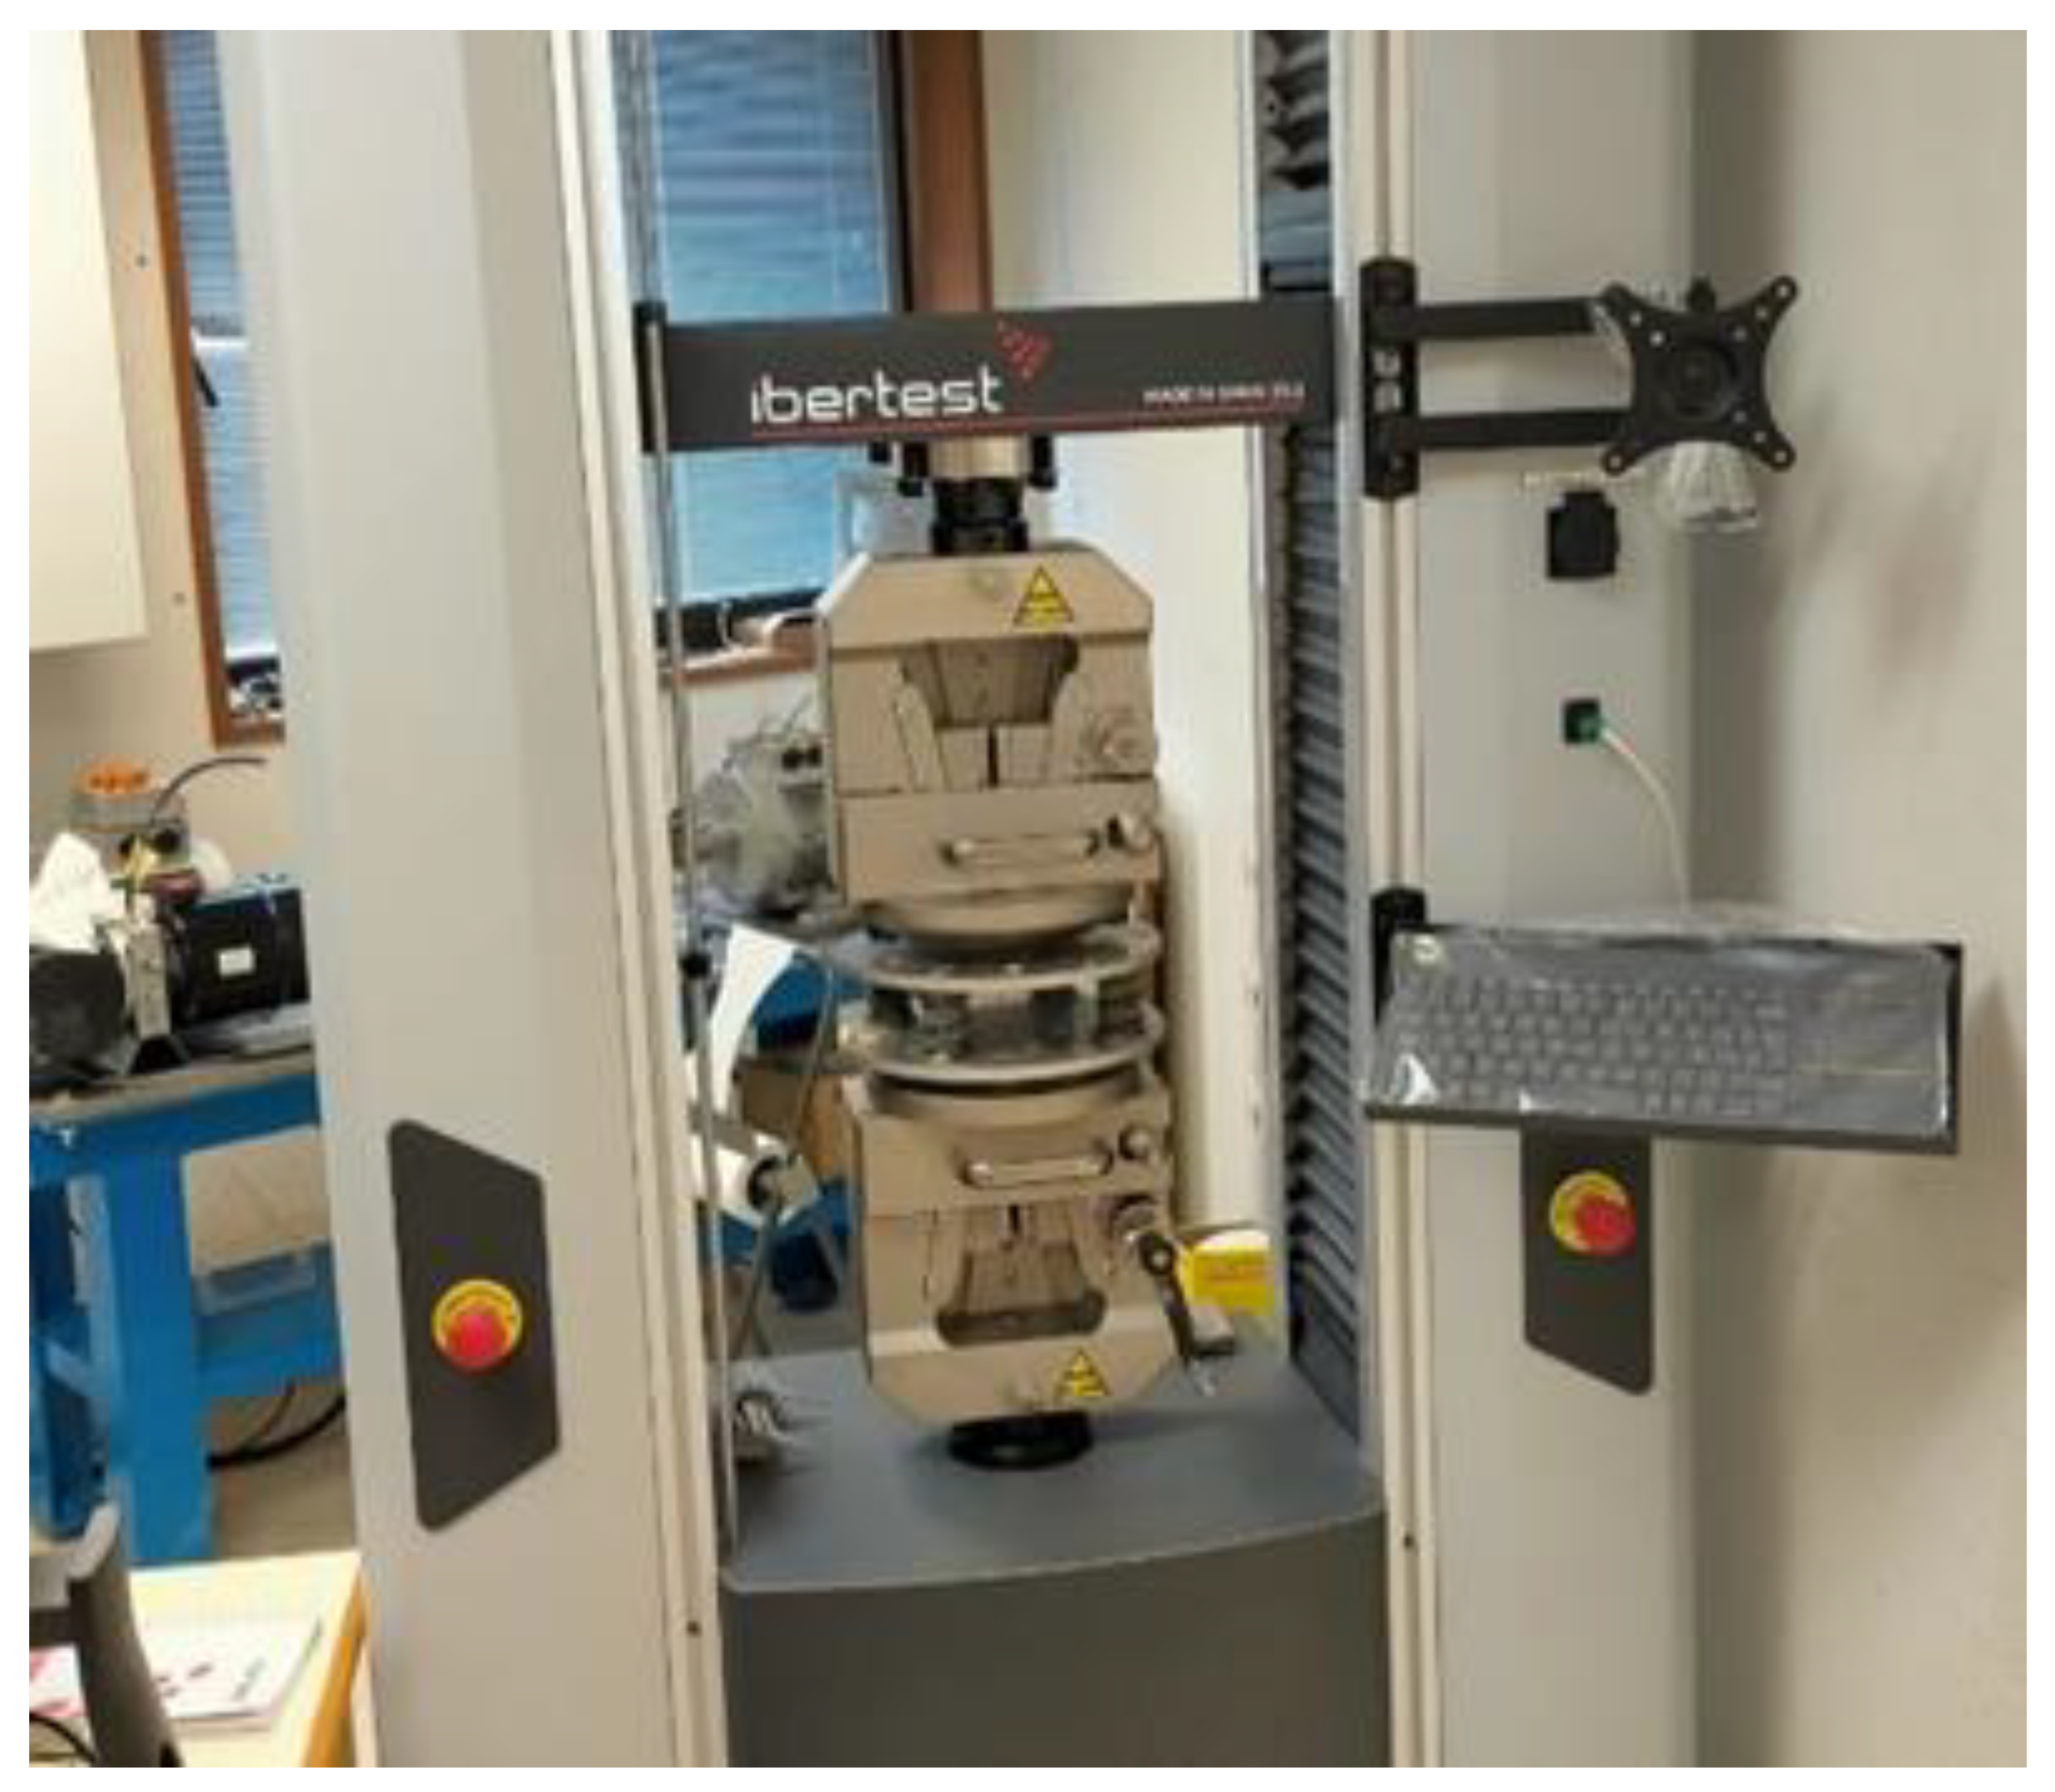
Tests were performed in an electromechanical universal testing machine (see
Figure 5), placing one or several cushions between its compression plates. This machine controls a load capacity of 100 kN with a nominal force precision of 0.5% and displacement resolution of 0.0024
.
2.2. Isolator Characteristics
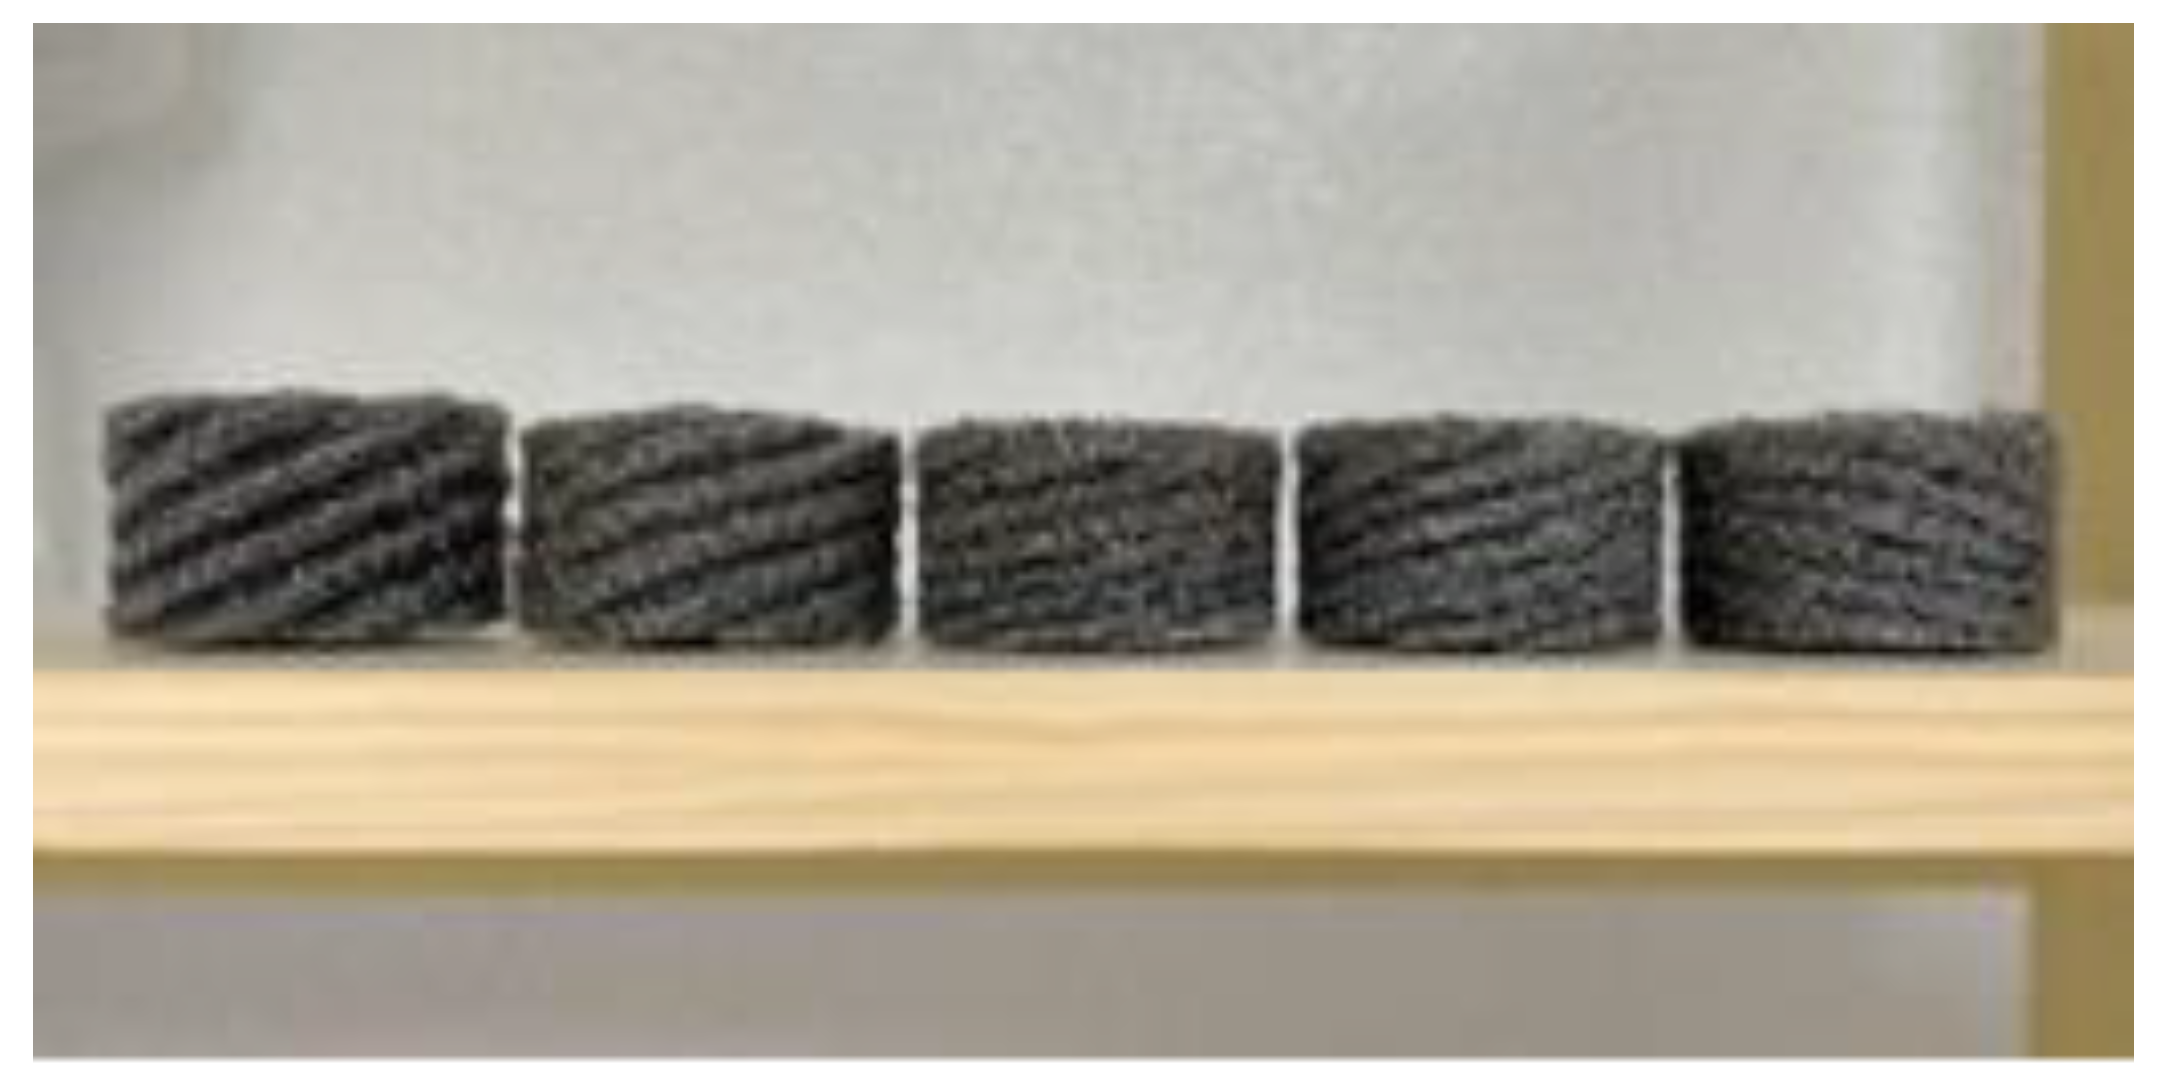
For the study, batches of five models of insulators (see
Figure 6) with the same nominal dimensions but different relative densities were provided. The material is AISI 304 steel, and the diameter of the wire is 0.2 mm.
Each batch comprised nine apparently identical units. However, due to the variability of the manufacturing process, the first step, before starting to work with them, was the verification of their dimensions and the calculation of their relative densities (or their complementary porosity). It should be noted that, especially in those models with less initial mesh compaction, the irregularity of their geometry adds uncertainty in terms of their dimensions and therefore to the calculation of their relative density.
Most researchers use the relative density to characterize porous materials, although some use its complementary property, porosity (). Porosity is defined as the ratio of the hole volume () to the total volume of the sample as solid ().
The relative density (
) is defined as the ratio of the mass (
) of the sample to the density of the material (
). It is also known that the sum of the porosity and the relative density is the unity. In this way, relative density and nominal porosity can be obtained according to Equations (1) and (2), respectively:
Therefore, for the calculation of the relative density, it is necessary to know the density of the material. In this case, since the thread material is stainless steel AISI 304, its density is
= 8000 kg/m
3. On the other hand, all of the isolators had the following nominal dimensions: 27 mm in height, 48 mm in external diameter and 10 mm in internal diameter. However, their real dimensions varied considerably with respect to these nominal values, as can be seen, for example, for the batch of model A in
Table 1.
The average values of the relative density and porosity of the different batches are shown in
Table 2.
To increase the accuracy of the force measurement, as well as to obtain more directly the averaged results of each model, the tests were carried out with four or seven samples of each model in parallel configuration.
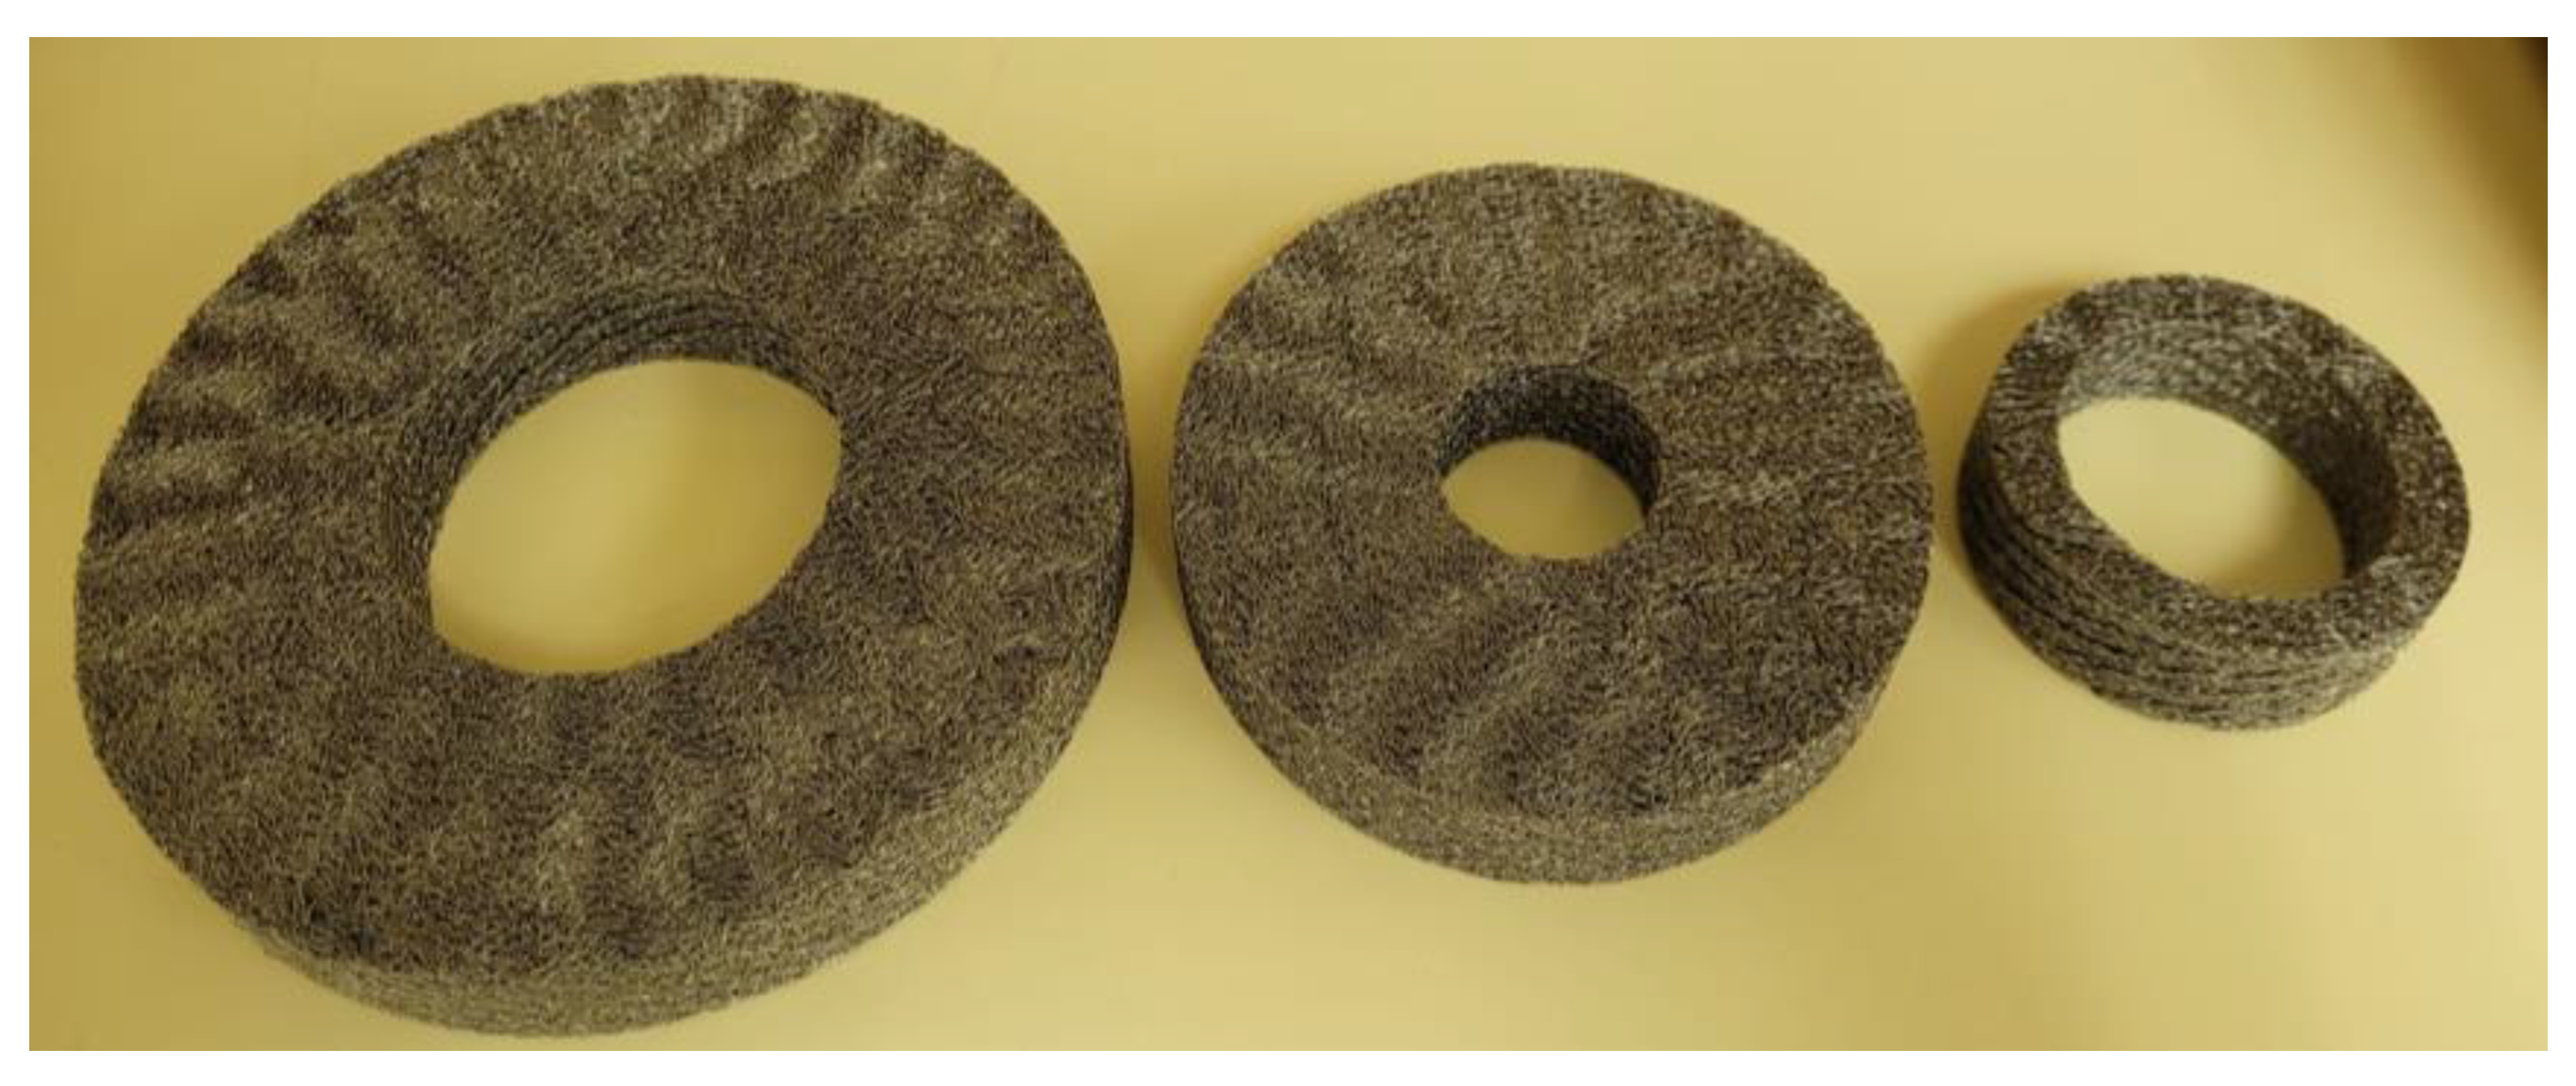
For the analysis of the cross-sectional area influence, there were three isolator models (see
Figure 7), which had the same height and relative density with respect to each other. Their physical characteristics are summarized in
Table 3.
3. Results
In this section, the effects of four parameters on the metal-mesh behavior are presented, namely relative density, speed, cross-sectional area and stacking effects. Then, the viscoelastic behavior is studied, and a mechanical model is proposed based on different tests.
3.1. Relative Density Effect
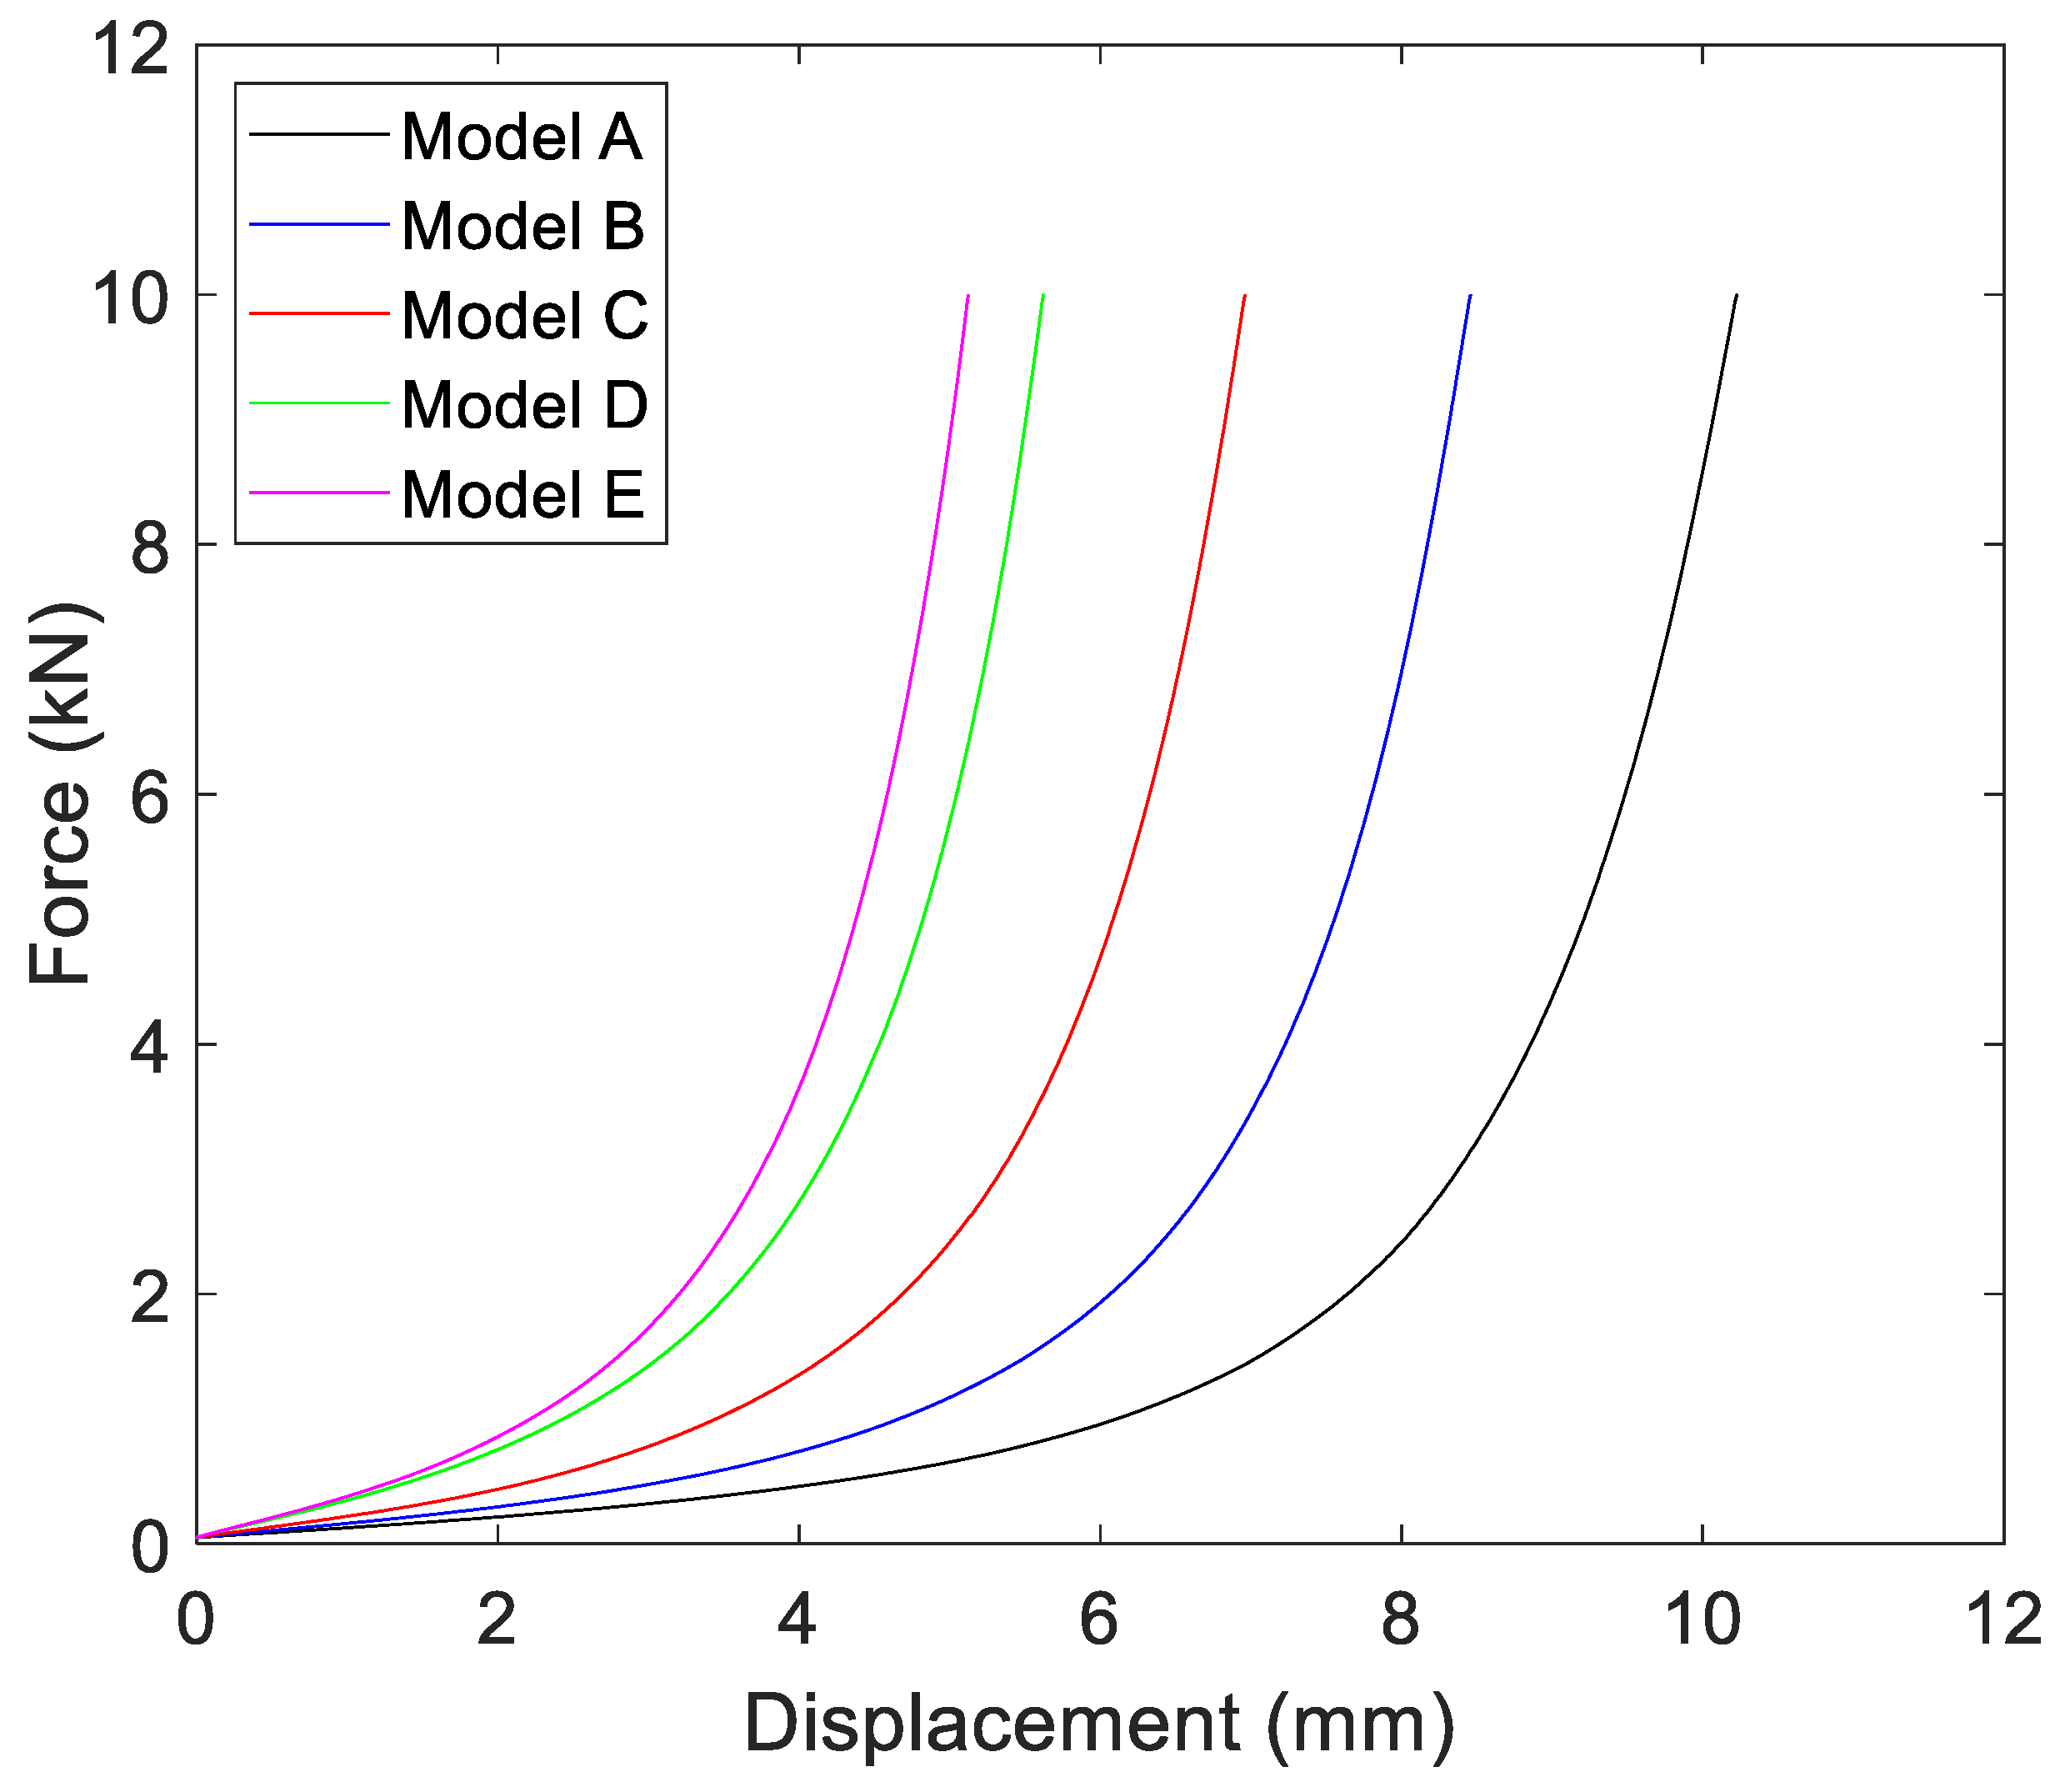
Monotonic compression tests were performed for four parallel samples of each insulator model up to 10 kN with a speed of 20 mm/min. The results are shown in
Figure 8.
The initial deformation, almost linear, is reduced as the relative density increases. Likewise, if the force values are compared for the same deformation value, it is observed that the relationship between the force and the relative density does not follow a mathematical pattern.
3.2. Speed Effect
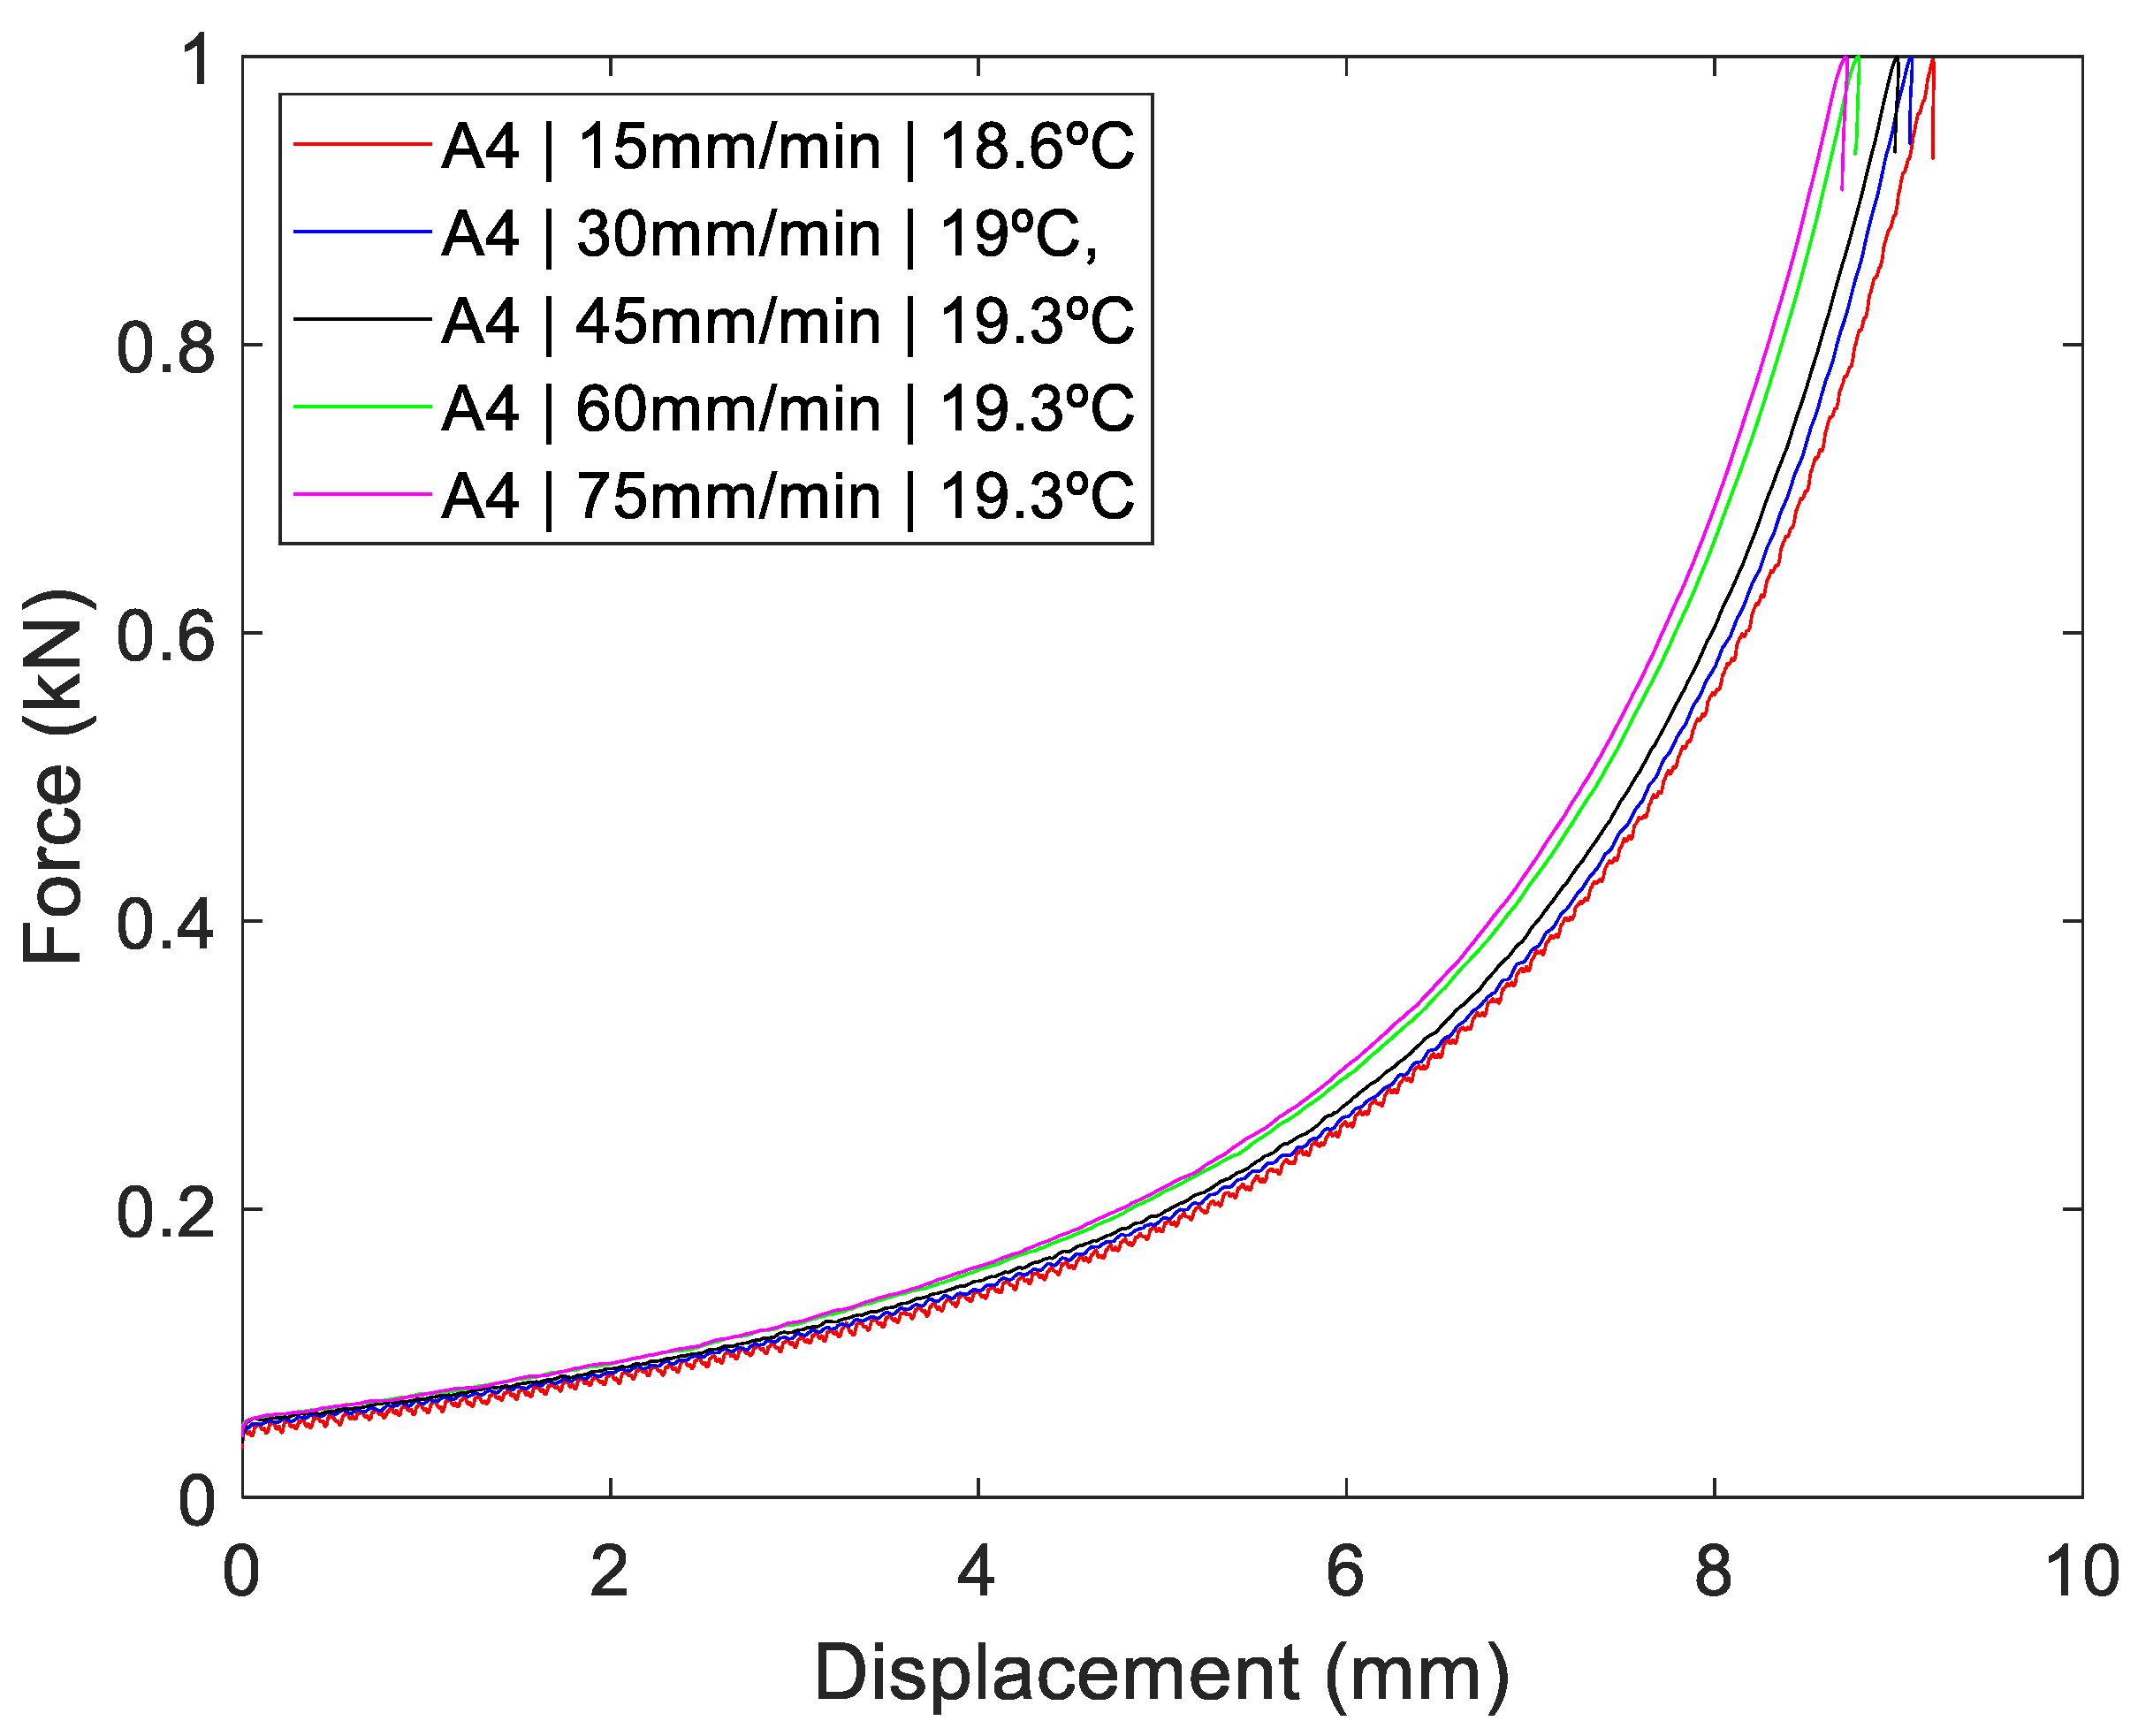
For simplicity, in
Figure 9, only the results of the minimum relative density model (model A) are shown. It can be seen that the dynamic stiffness increases directly with speed. This outcome emphasizes that at least part of the damping is of the viscous type.
3.3. Cross-Sectional Area Effect
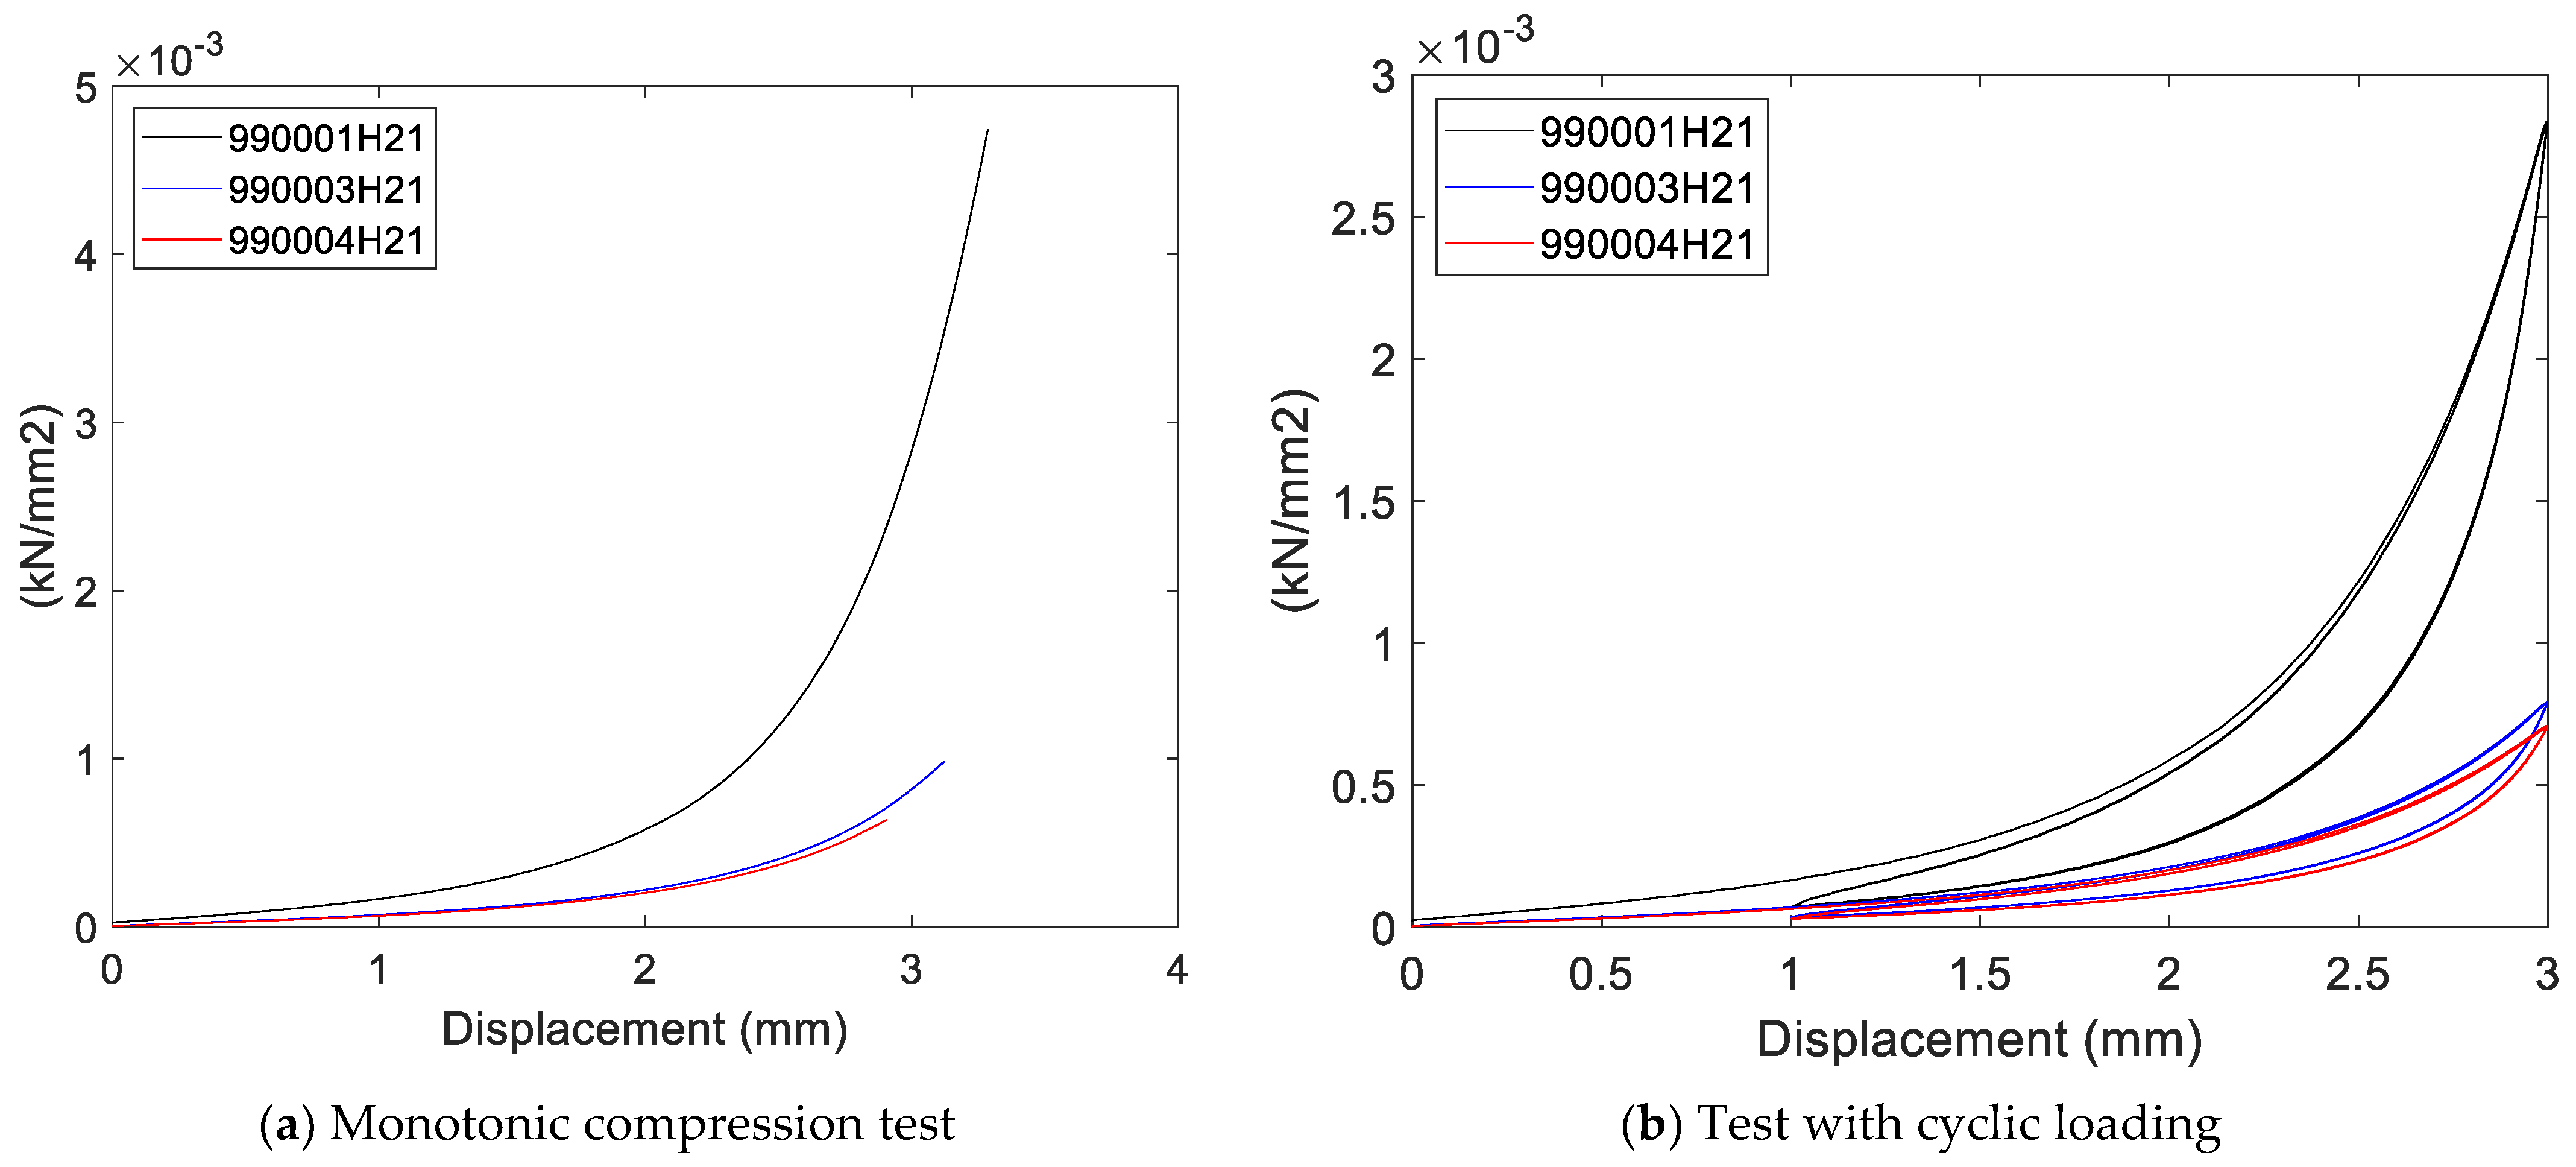
To study the influence of the cross-sectional area of the isolator, tests were carried out on the three models with different areas, which were previously described in
Table 3.
Figure 10 shows the results of the monotonic compression test at 20 mm/min for the three isolator models. To facilitate the analysis, values of force per unit of cross-sectional area are shown on the ordinate axis.
The results of the monotonic compression tests show an approximately logarithmic relationship between the dynamic stiffness and the cross-sectional area of the sample. That is, the greater that the cross-sectional area is, the less rigidity that there is per unit area (see
Figure 10). A similar behavior happens with the dissipated energy (see
Figure 10b).
3.4. Stacking Effect
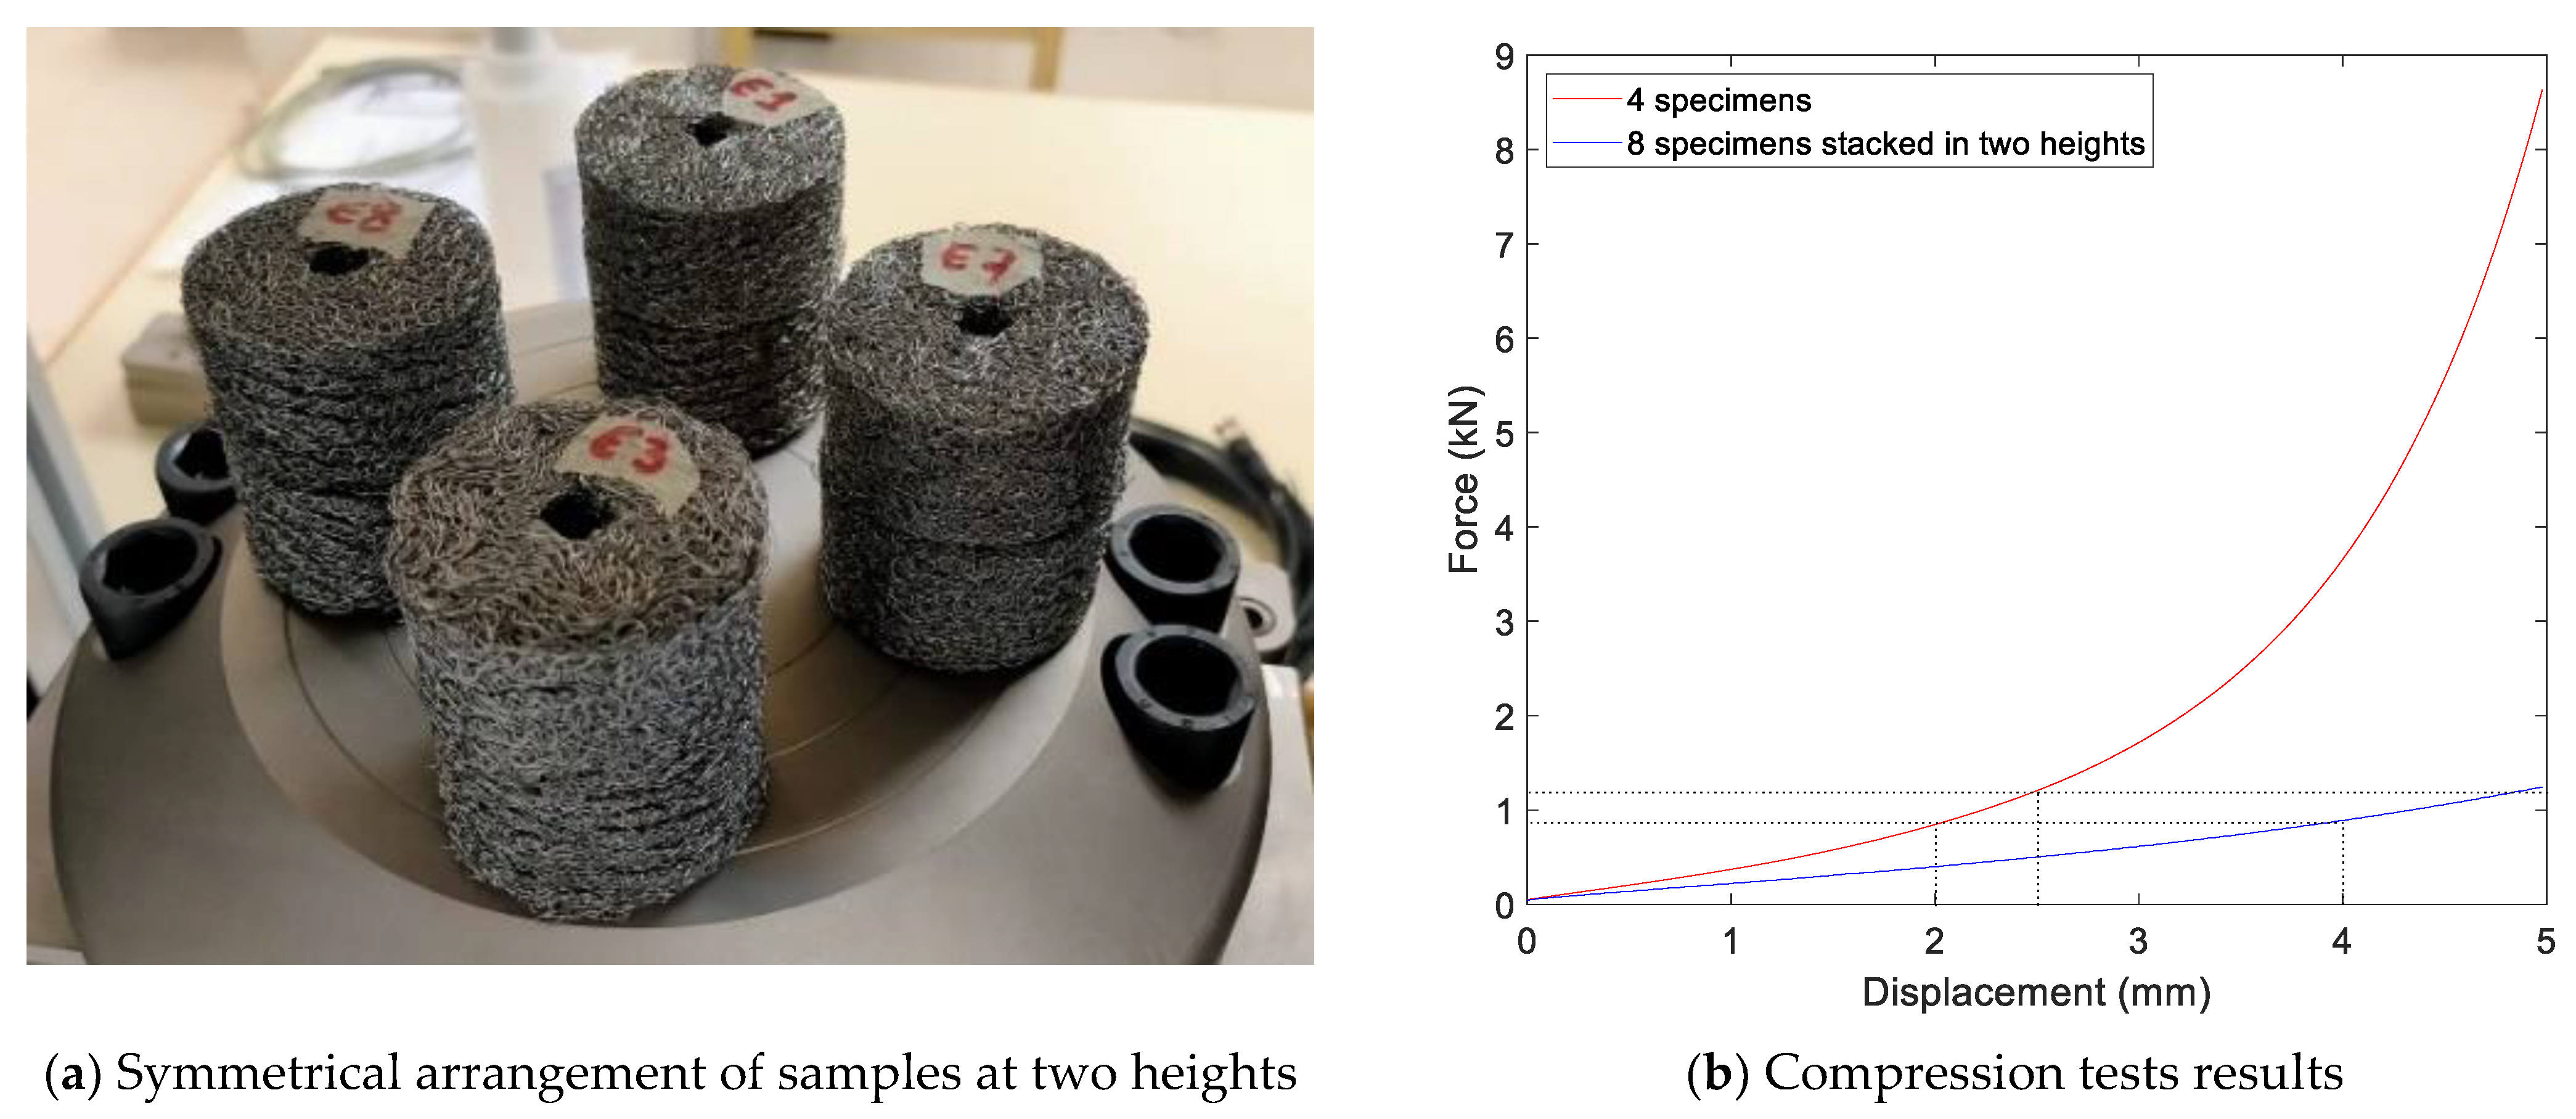
Figure 11a shows the configuration of one of these tests, in which eight insulators of the same model were configurated in four double-height blocks each. Indeed, as shown in
Table 1, there is some variability in the physical characteristics of nominally identical cushions. To obtain the average behavior of a type of cushion, the approach has been to test several in parallel, thereby reducing the number of tests needed to achieve the nominal behavior. Similarly, testing multiple samples in parallel allows for working with higher force values, enhancing the measurement resolution of that magnitude.
As an example of the results for this kind of test,
Figure 11b shows the force-compression displacement corresponding to model E for a total maximum compression of 5 mm with the eight isolators, compared with the corresponding ones for a test of four samples arranged in one single height. The strain rate was 20 mm/min in the case of two heights and 10 mm/min for that with one height so that the unit strain rate was 0.5/min for both, and the results were comparable.
From a theoretical point of view, the arrangement in two heights should provide half the static rigidity of a single height. The results for dynamic stiffness also agreed with this theory since it can be seen that the force value for the same unit strain is consistent (auxiliary dot lines in
Figure 11b). This outcome does not corroborate the affirmation of some researchers [
30] who pointed out that the interaction of insulating boundary layers with each other provides a different behavior than when these layers only contact the compression plates. In this work, the stacking effect obtained was the theoretically expected one.
3.5. Viscoelastic Behavior
In this section, tests with cyclical hysteresis loading that included periods without deformation are shown.
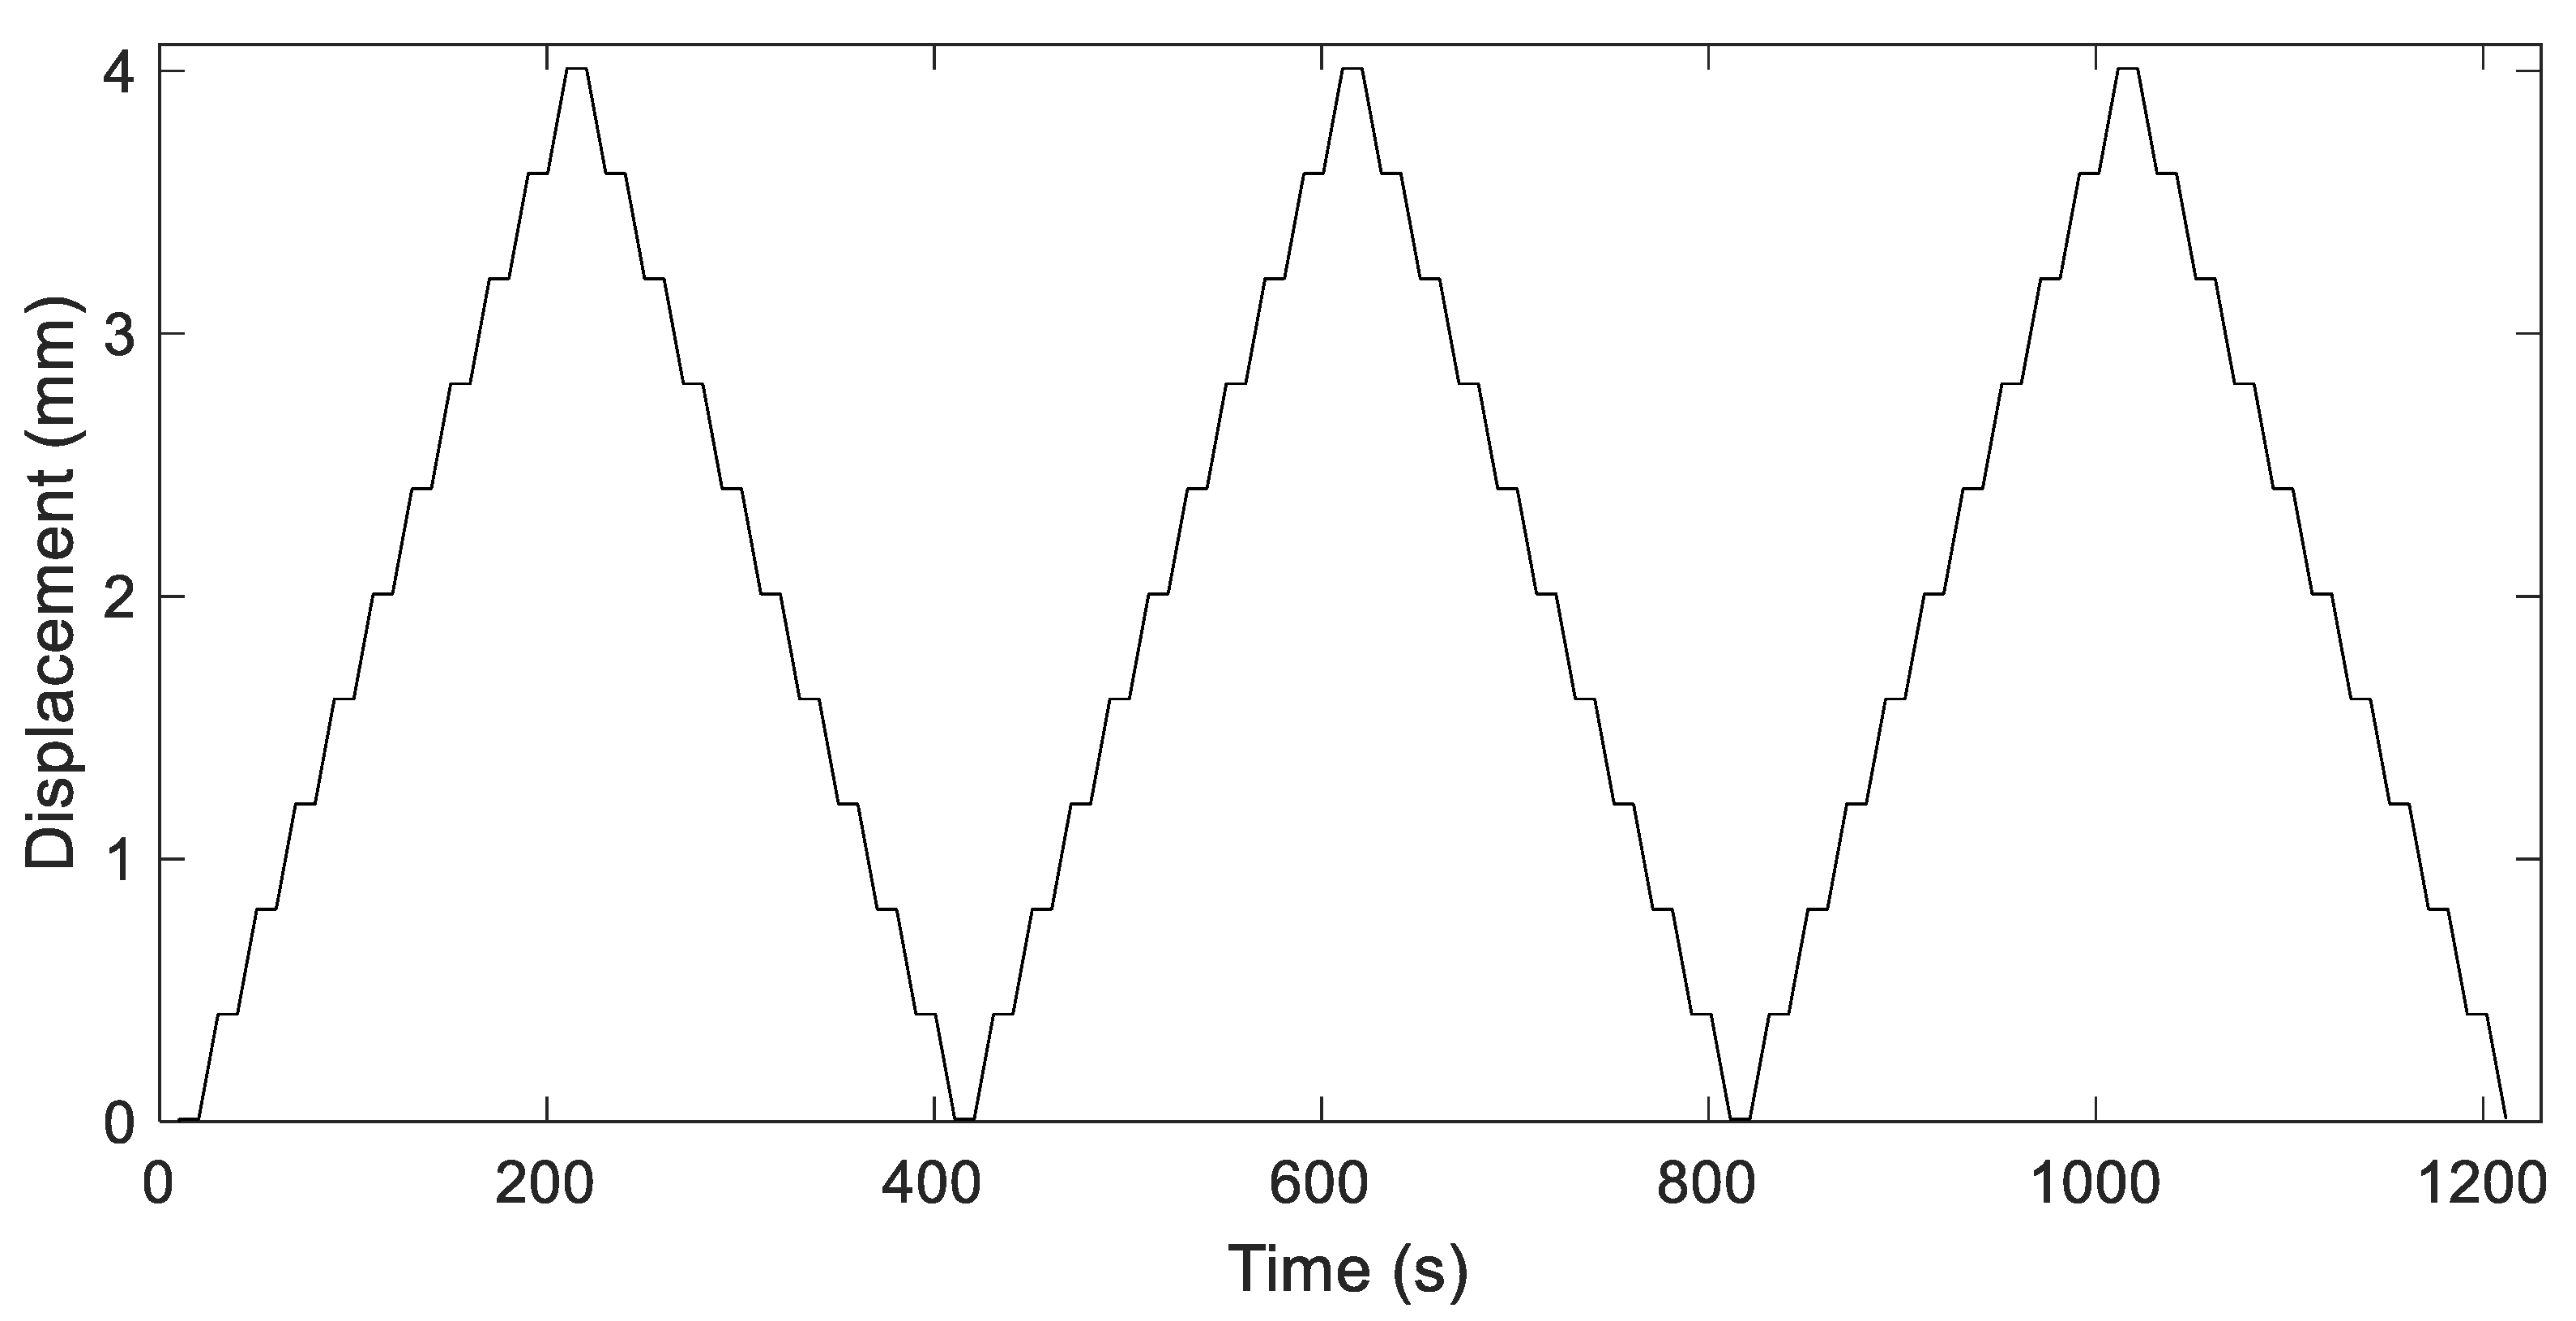
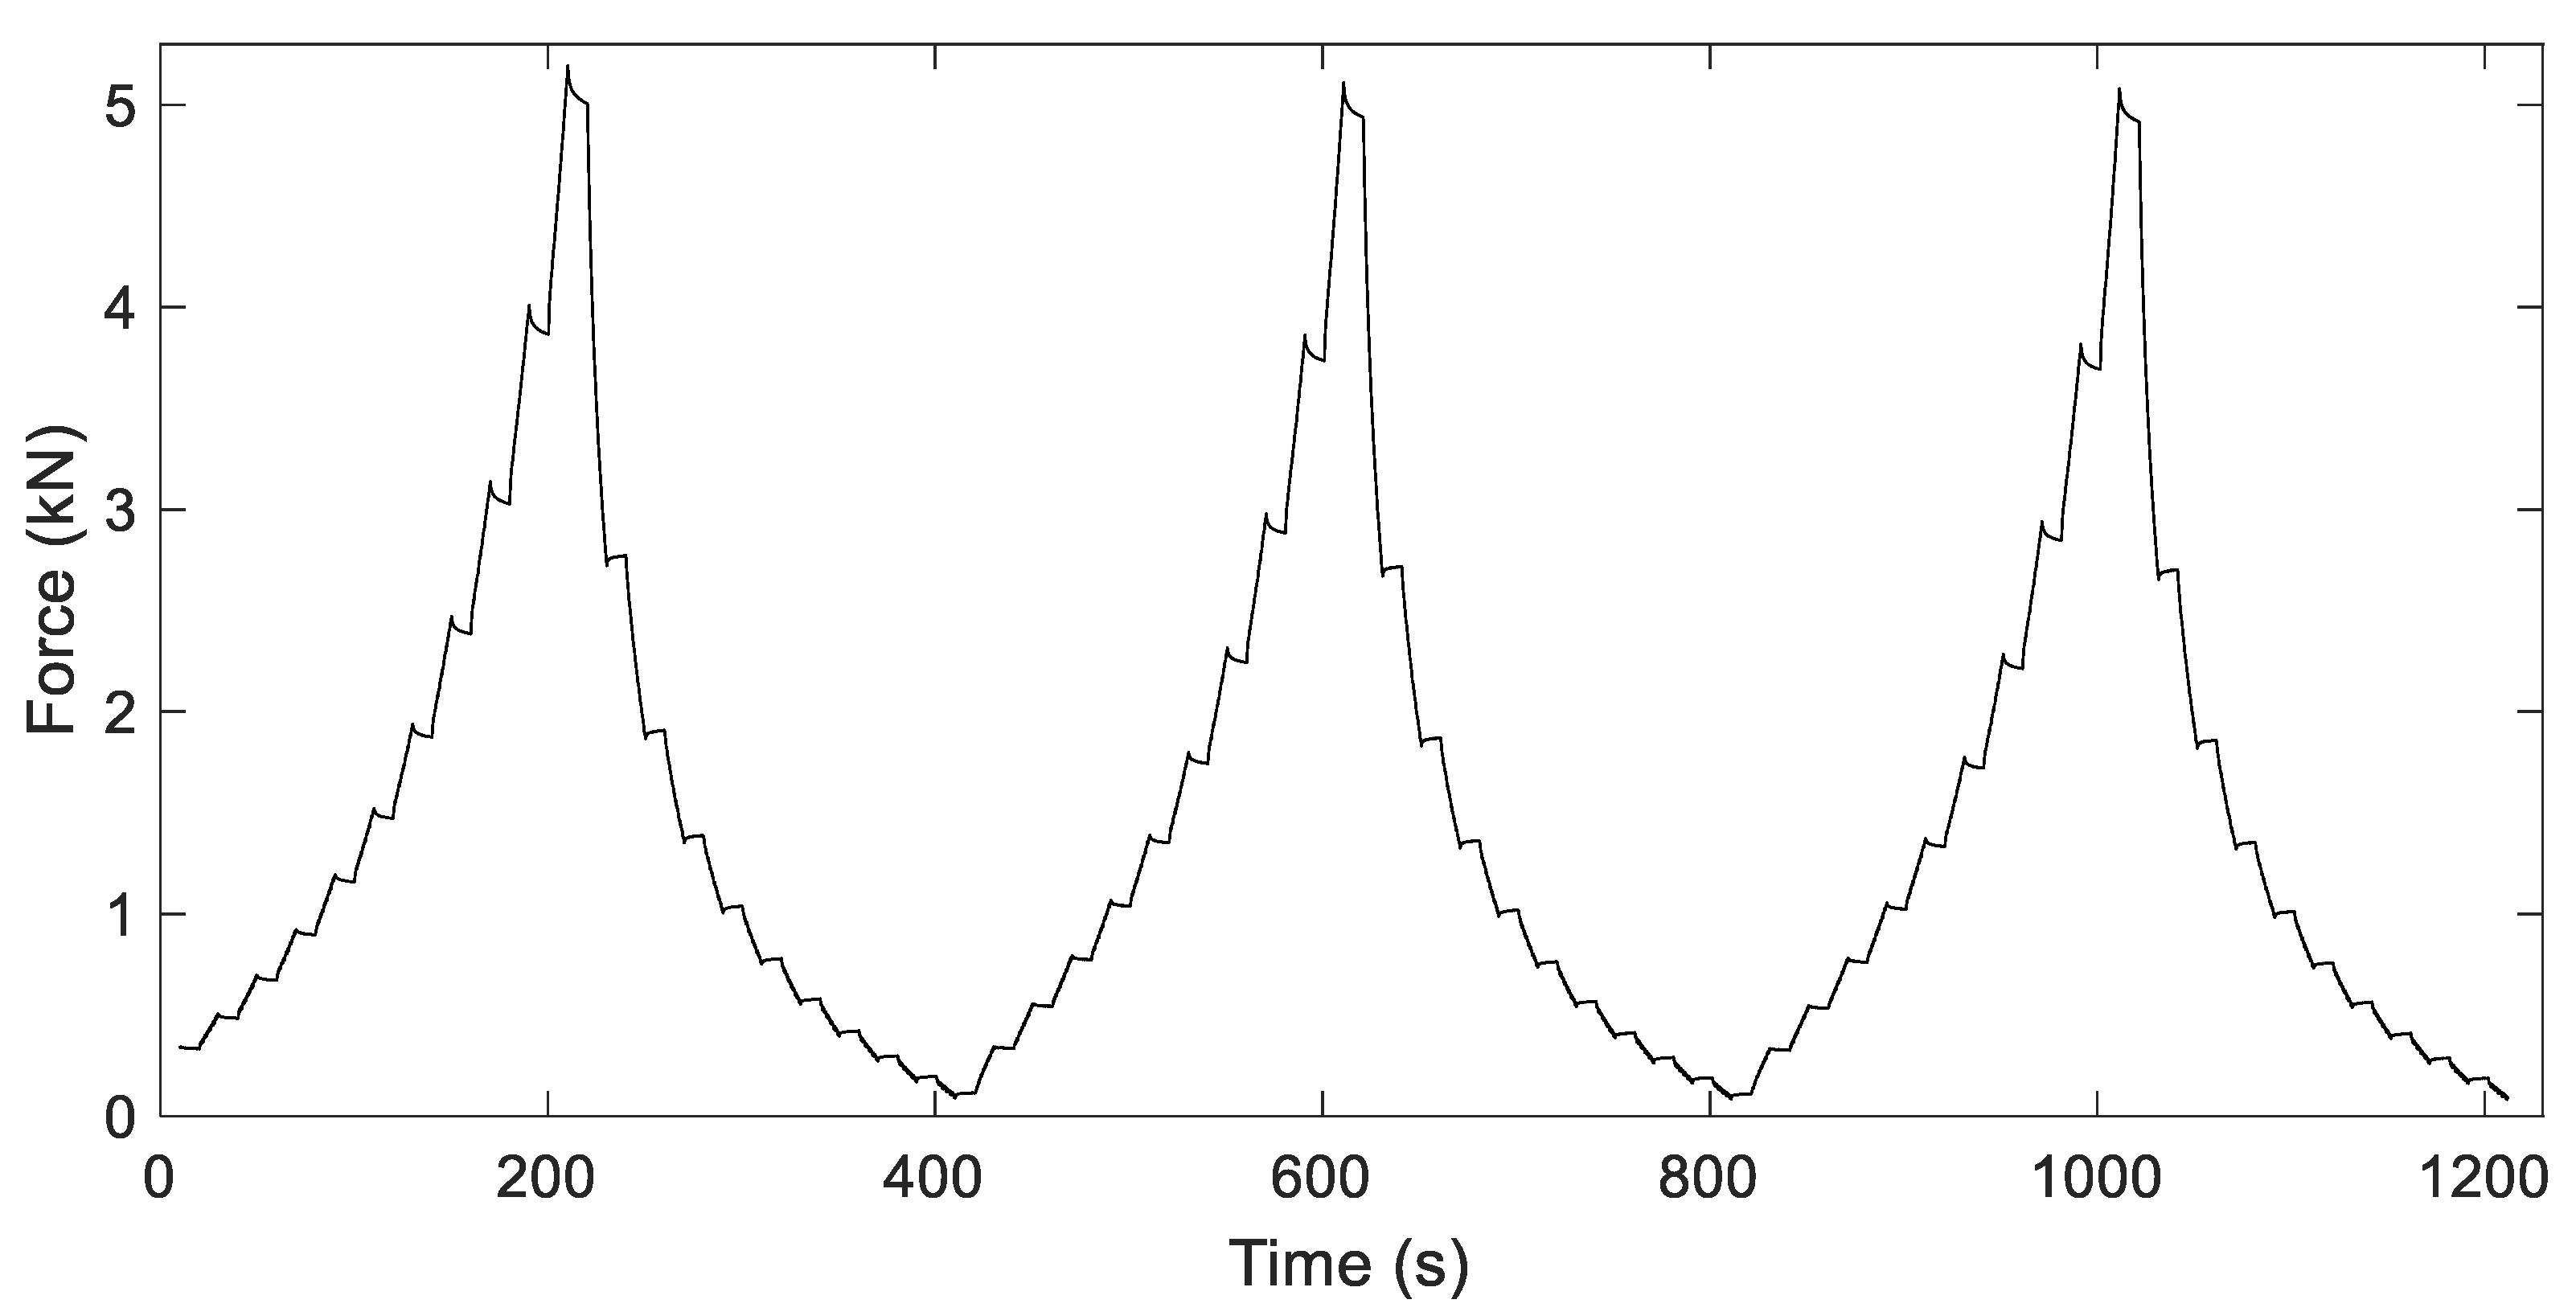
Figure 12 shows the programmed displacement-time diagram for one of these trials. The maximum deformation applied was 1.5% of the height of the insulators, and the maximum speed was 2.4 mm/min. Three loading and unloading cycles were performed with 10 stops of 10 s each, in both the loading and unloading phases.
The temporal response to the previous displacement curve for the isolator E model is shown in
Figure 13. In this case, seven isolators were tested in parallel.
The partial decrease in the force is clearly observed in the stops made in the loading phase. These partial relaxations have an exponential evolution, and their decrease is greater with the increase in the force at the moment of the stop. On the other hand, during the stops in the unloading phase, the opposite occurs: the force increases exponentially until stabilizing, although the variation is less than in the loading phase. This different direction of the force stabilizations is simply explained by the different direction of the damping force between the two phases. It can also be seen that the force steps in the loading phase are greater as the force increases. This outcome also happens in the unloading phase, but in a more pronounced manner.
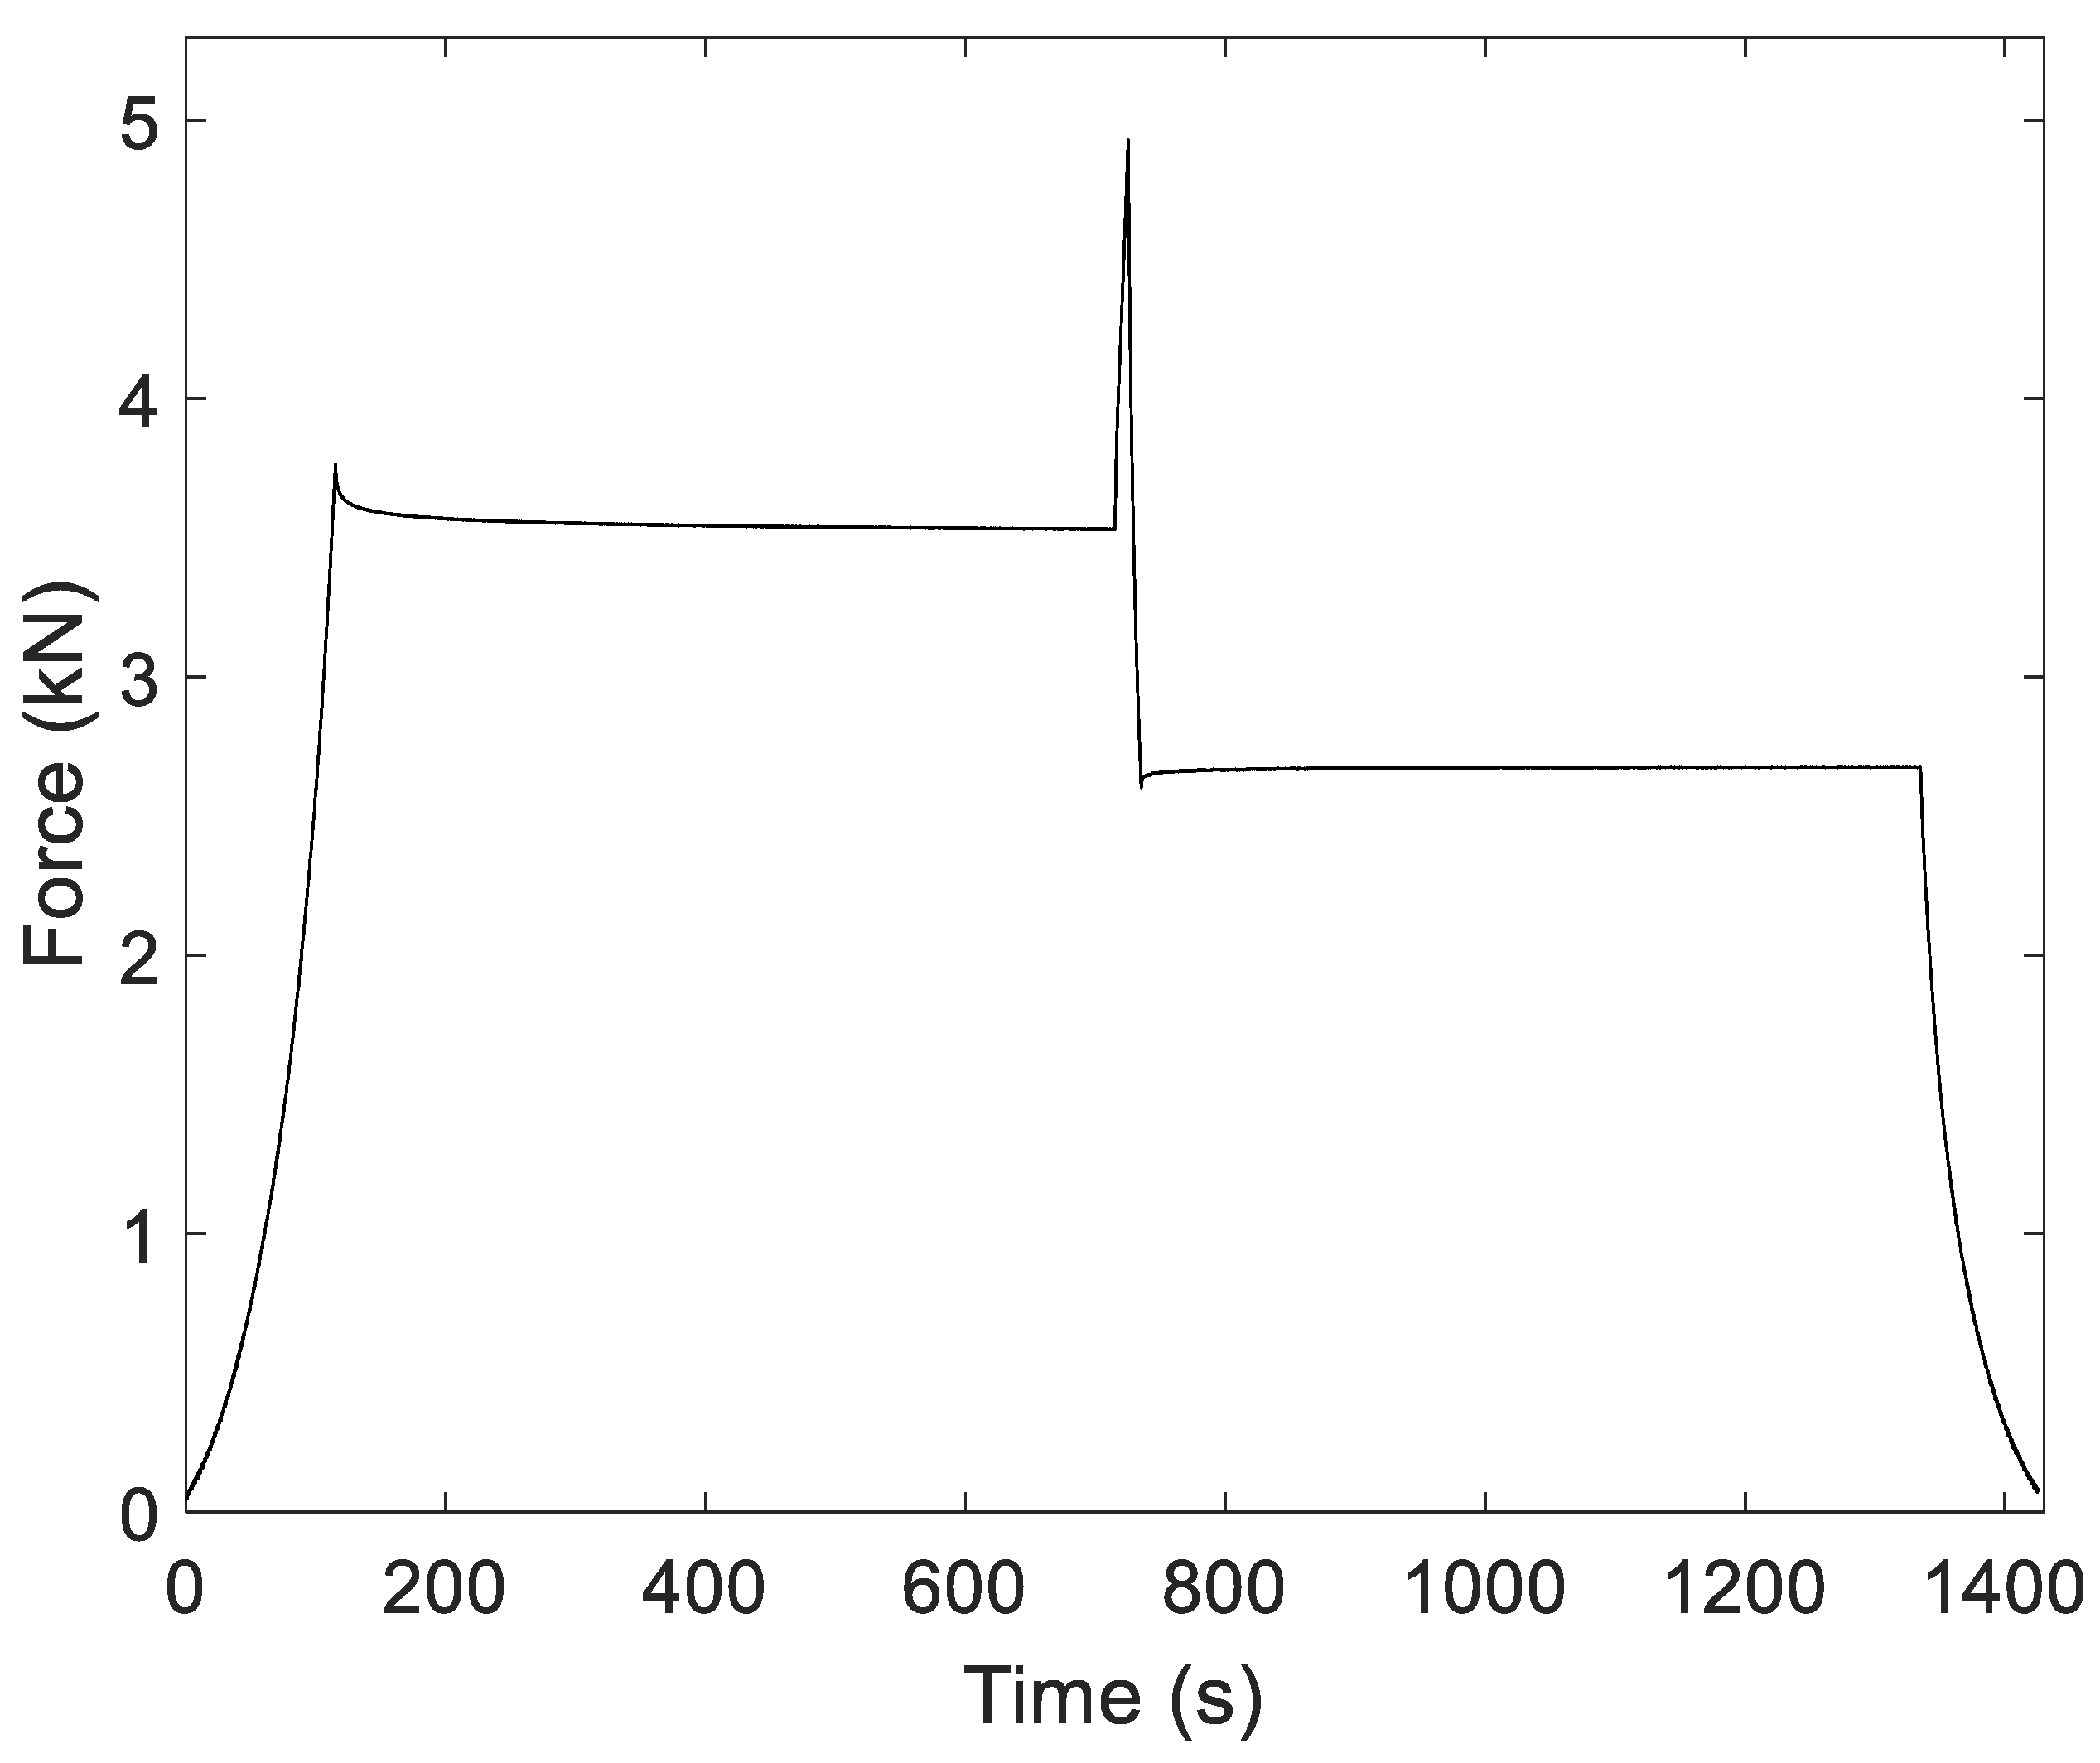
Figure 14 shows the result of an equivalent test with only one stop in each phase. Both stops last 10 min and occur for the same deformation of 3.5 mm. On the one hand, it is observed that the relaxation in the loading phase does not fully stabilize. On the other hand, the stiffening of the unloading phase does reach stabilization, and its exponential evolution is faster. It is also observed that the final values of force after both stops do not coincide despite the compression strain being the same, except for at low load values, at which the isolator recovers its starting condition.
This phenomenon may be due to the contact force between the wire parts increasing as the load increased. When the movement stopped, part of the accumulated elastic force managed to release certain contacts, so the total force decreased. The greater that the load was, the greater that the number of contacts were and the contact force between wires were; therefore, when the stop occurred, the number of contacts released was greater and thus was the magnitude of the relaxation. Likewise, in the unloading, the reduction in contacts/blocks between wires caused part of the elastic energy accumulated locally in the isolator to be transformed to general, resulting in an increase in the external force on the isolator. The difference between the final forces of both the loading and unloading phases for the same deformation value was due to the different configuration of the wire prior to the two states. The different number of contacts and blocks before stopping resulted in a different evolution, as with the final forces. Nonetheless, for low force values, the number of blocks between wires decreased; thus, in the unloading phase and after a while, the isolator recovered its dimensions.
3.6. Mechanical Model and Parameter Identification
Results of these tests can also be represented in a force-displacement diagram (see
Figure 15) to visualize the corresponding hysteresis loops.
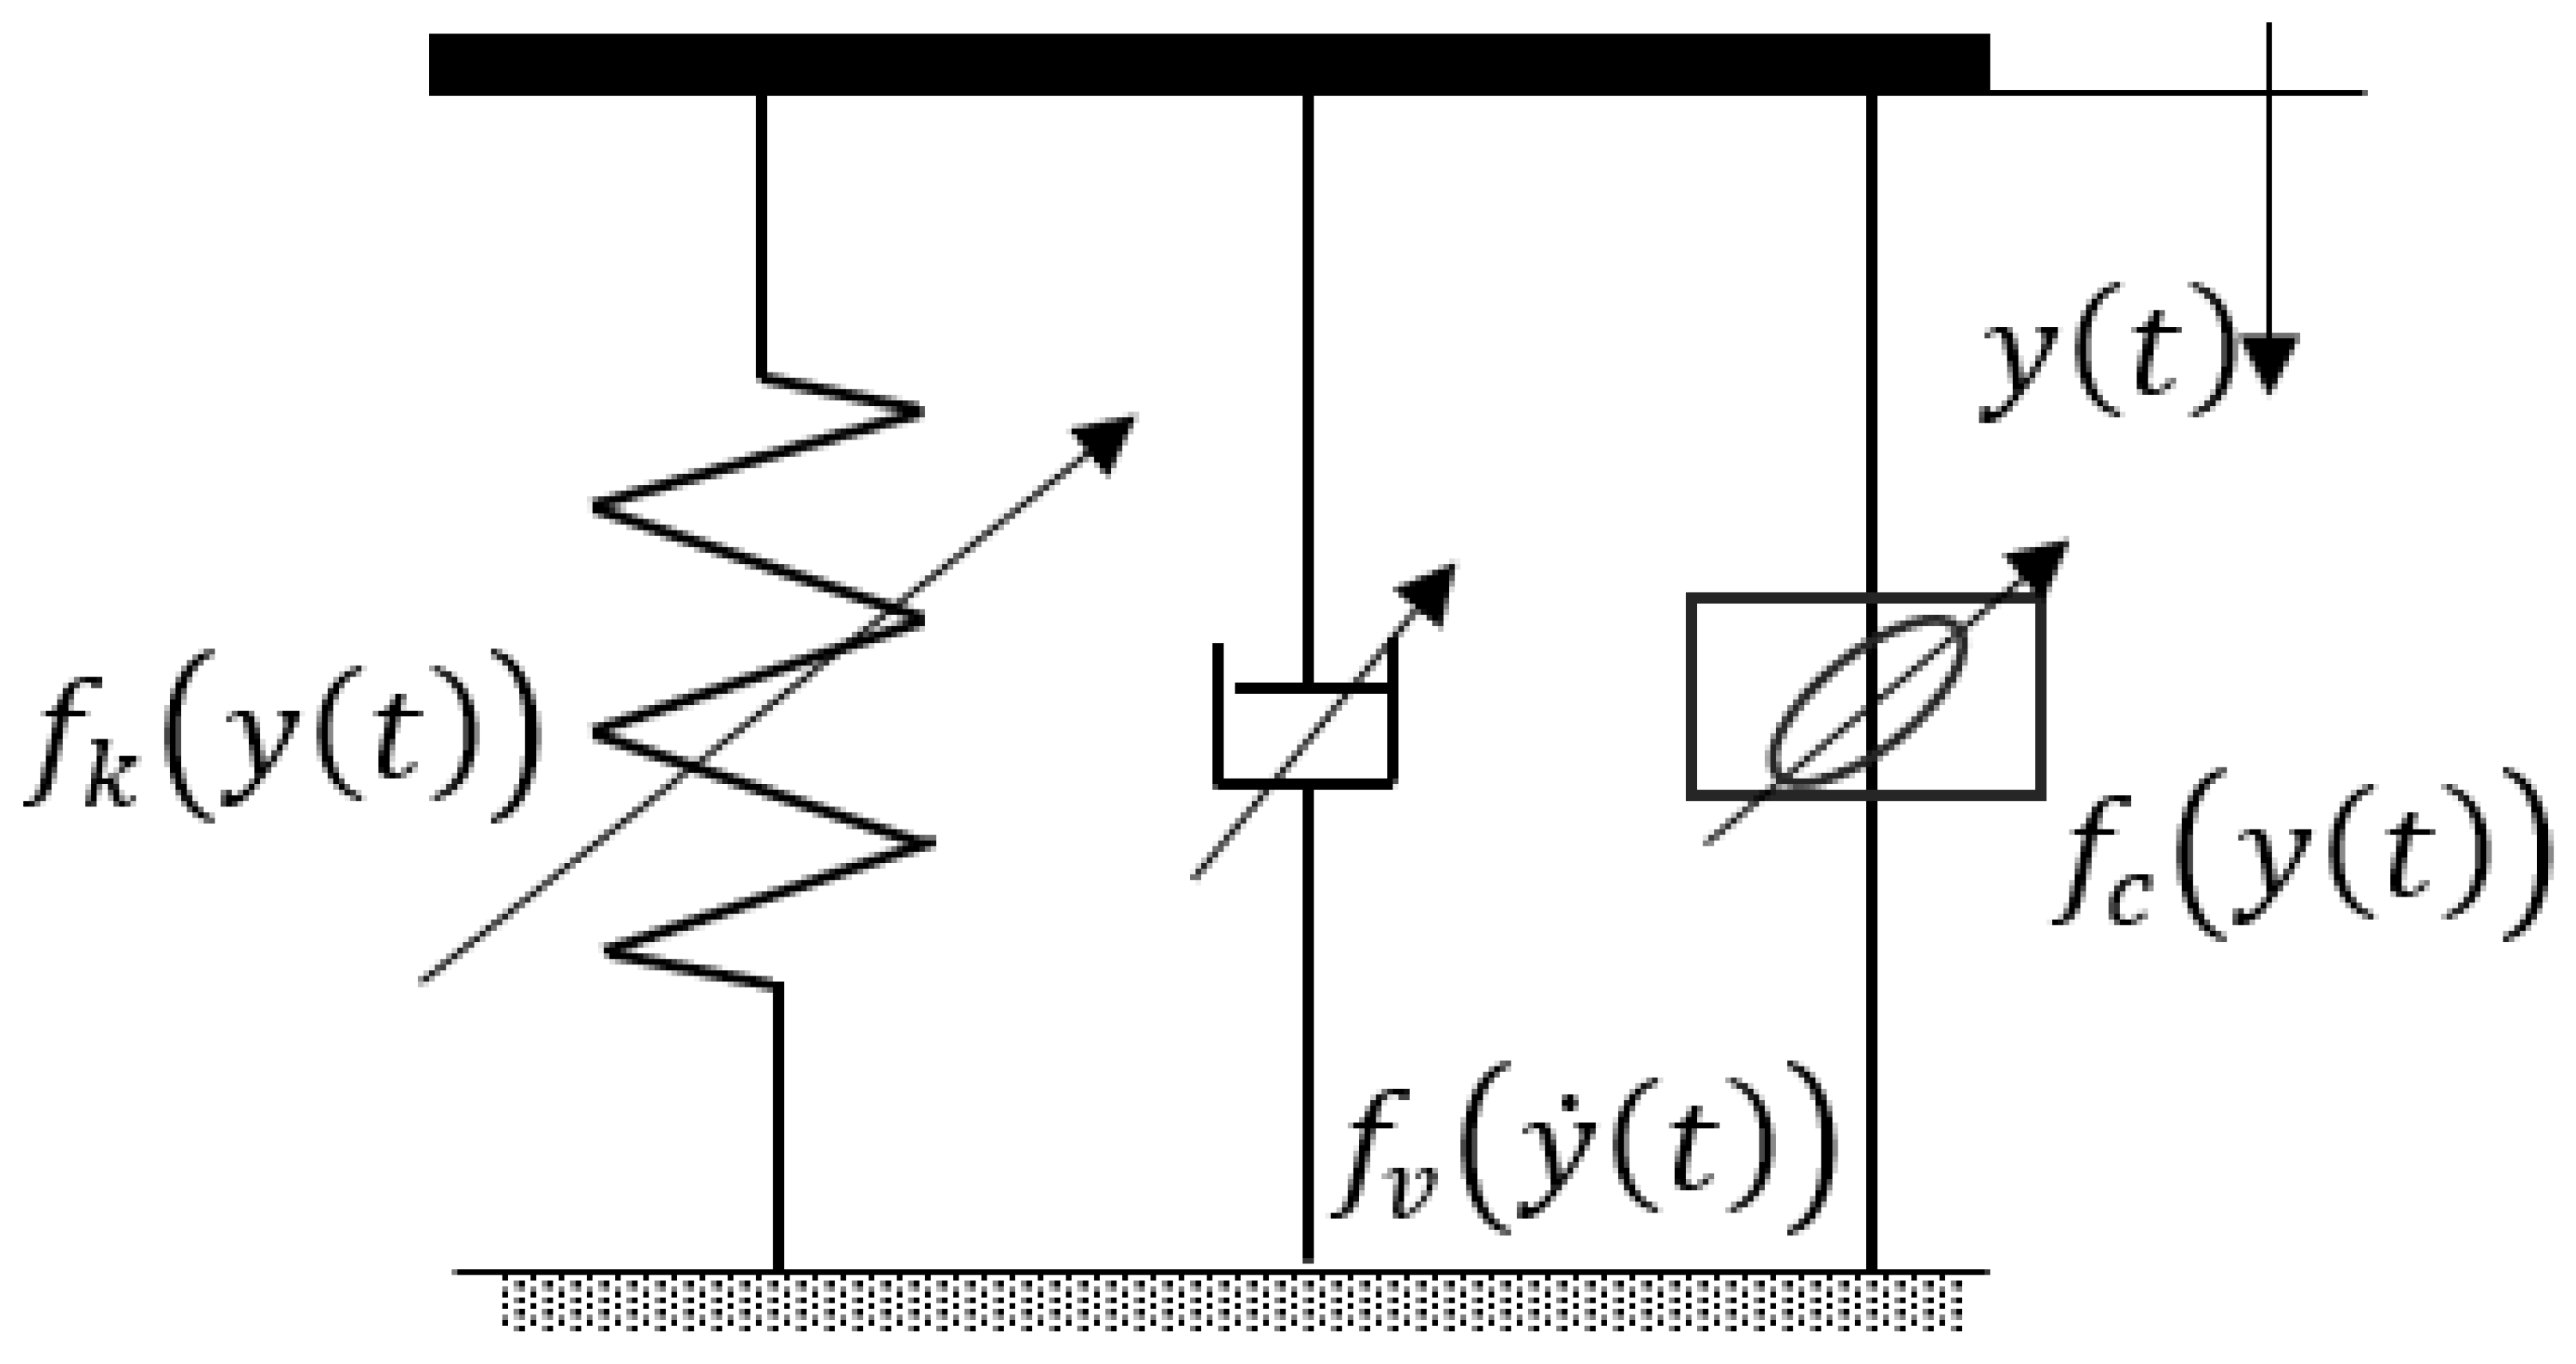
The peaks in the hysteresis loop correspond to the relaxation and stiffening produced during the stops. As previously explained, they are due to the evolution over time of the contact conditions among the wires of the mesh. This temporal dependence means that, from a mathematical point of view, the associated energy dissipation can be modeled as viscous damping. However, the influence of these peaks on the energy dissipated in the cycle can be considered a minor fraction, while the rest of the energy dissipated is associated with Coulomb’s damping.
Based on this consideration and the results of the tests shown above, the schematic model presented in
Figure 16 was adopted to describe the behavior of the isolator in mechanical parameters.
The stiffness was obtained from the tangent of the loading and unloading curves, which were obtained from the hysteresis loop. It must be considered that the loading and unloading curves, apart from noise, presented non-coincident sampled values for the same deformation. Therefore, they were fitted using polynomials. The stiffness curve was likewise determined and fitted using polynomials from the previously fitted curves.
On the other hand, for the estimation of the damping by means of the hysteresis cycle with stops, the next methodology is proposed for future development. First, the hysteresis loop that passes through the relaxation/stiffening peaks is interpolated (
Figure 17a). Second, polynomial fitting of these curves is performed, as shown in
Figure 17b.
The area inside the inscribed loop between the relaxation/stiffening peaks will correspond to the energy dissipated by dry friction (area inside the red line in
Figure 11b), while the area inside the inscribed loop and the total without peaks will correspond to the energy dissipated by the viscous component of the damping (area between red and black lines).
From the energy dissipated by dry friction, the loss factor is determined as indicated in
Figure 3. Nevertheless, it should be noted that the loss factor value calculated with this procedure has a global nature for the displacement considered in the test. If more precise values are desired, the described procedure should be carried out for different values of oscillation amplitude, starting from a certain preload value.
Regarding the estimation of the viscous damping component, it is proposed to determine it by obtaining the time constant using an exponential fit of the force–time curves in relaxation.
