1. Introduction
In recent years, the evaluation and prediction of operating conditions, as represented by steam turbines and generators, have increasingly become the research focus of large energy equipment [
1,
2,
3]. Meanwhile, the prediction and identification of rotor state parameters during asymmetric operation are important to generator design and development in smart grid technology. In fact, the research results obtained from field experiments are the most reliable, and on-site monitoring data and comprehensive analysis of rotor iron cores are the most intuitive and accurate, providing the strongest evidence for predicting the operating status of generators. However, due to factors such as the generator volume, on-site technical conditions, process complexity, and cost, the promotion of this experimental method is greatly limited [
4,
5].
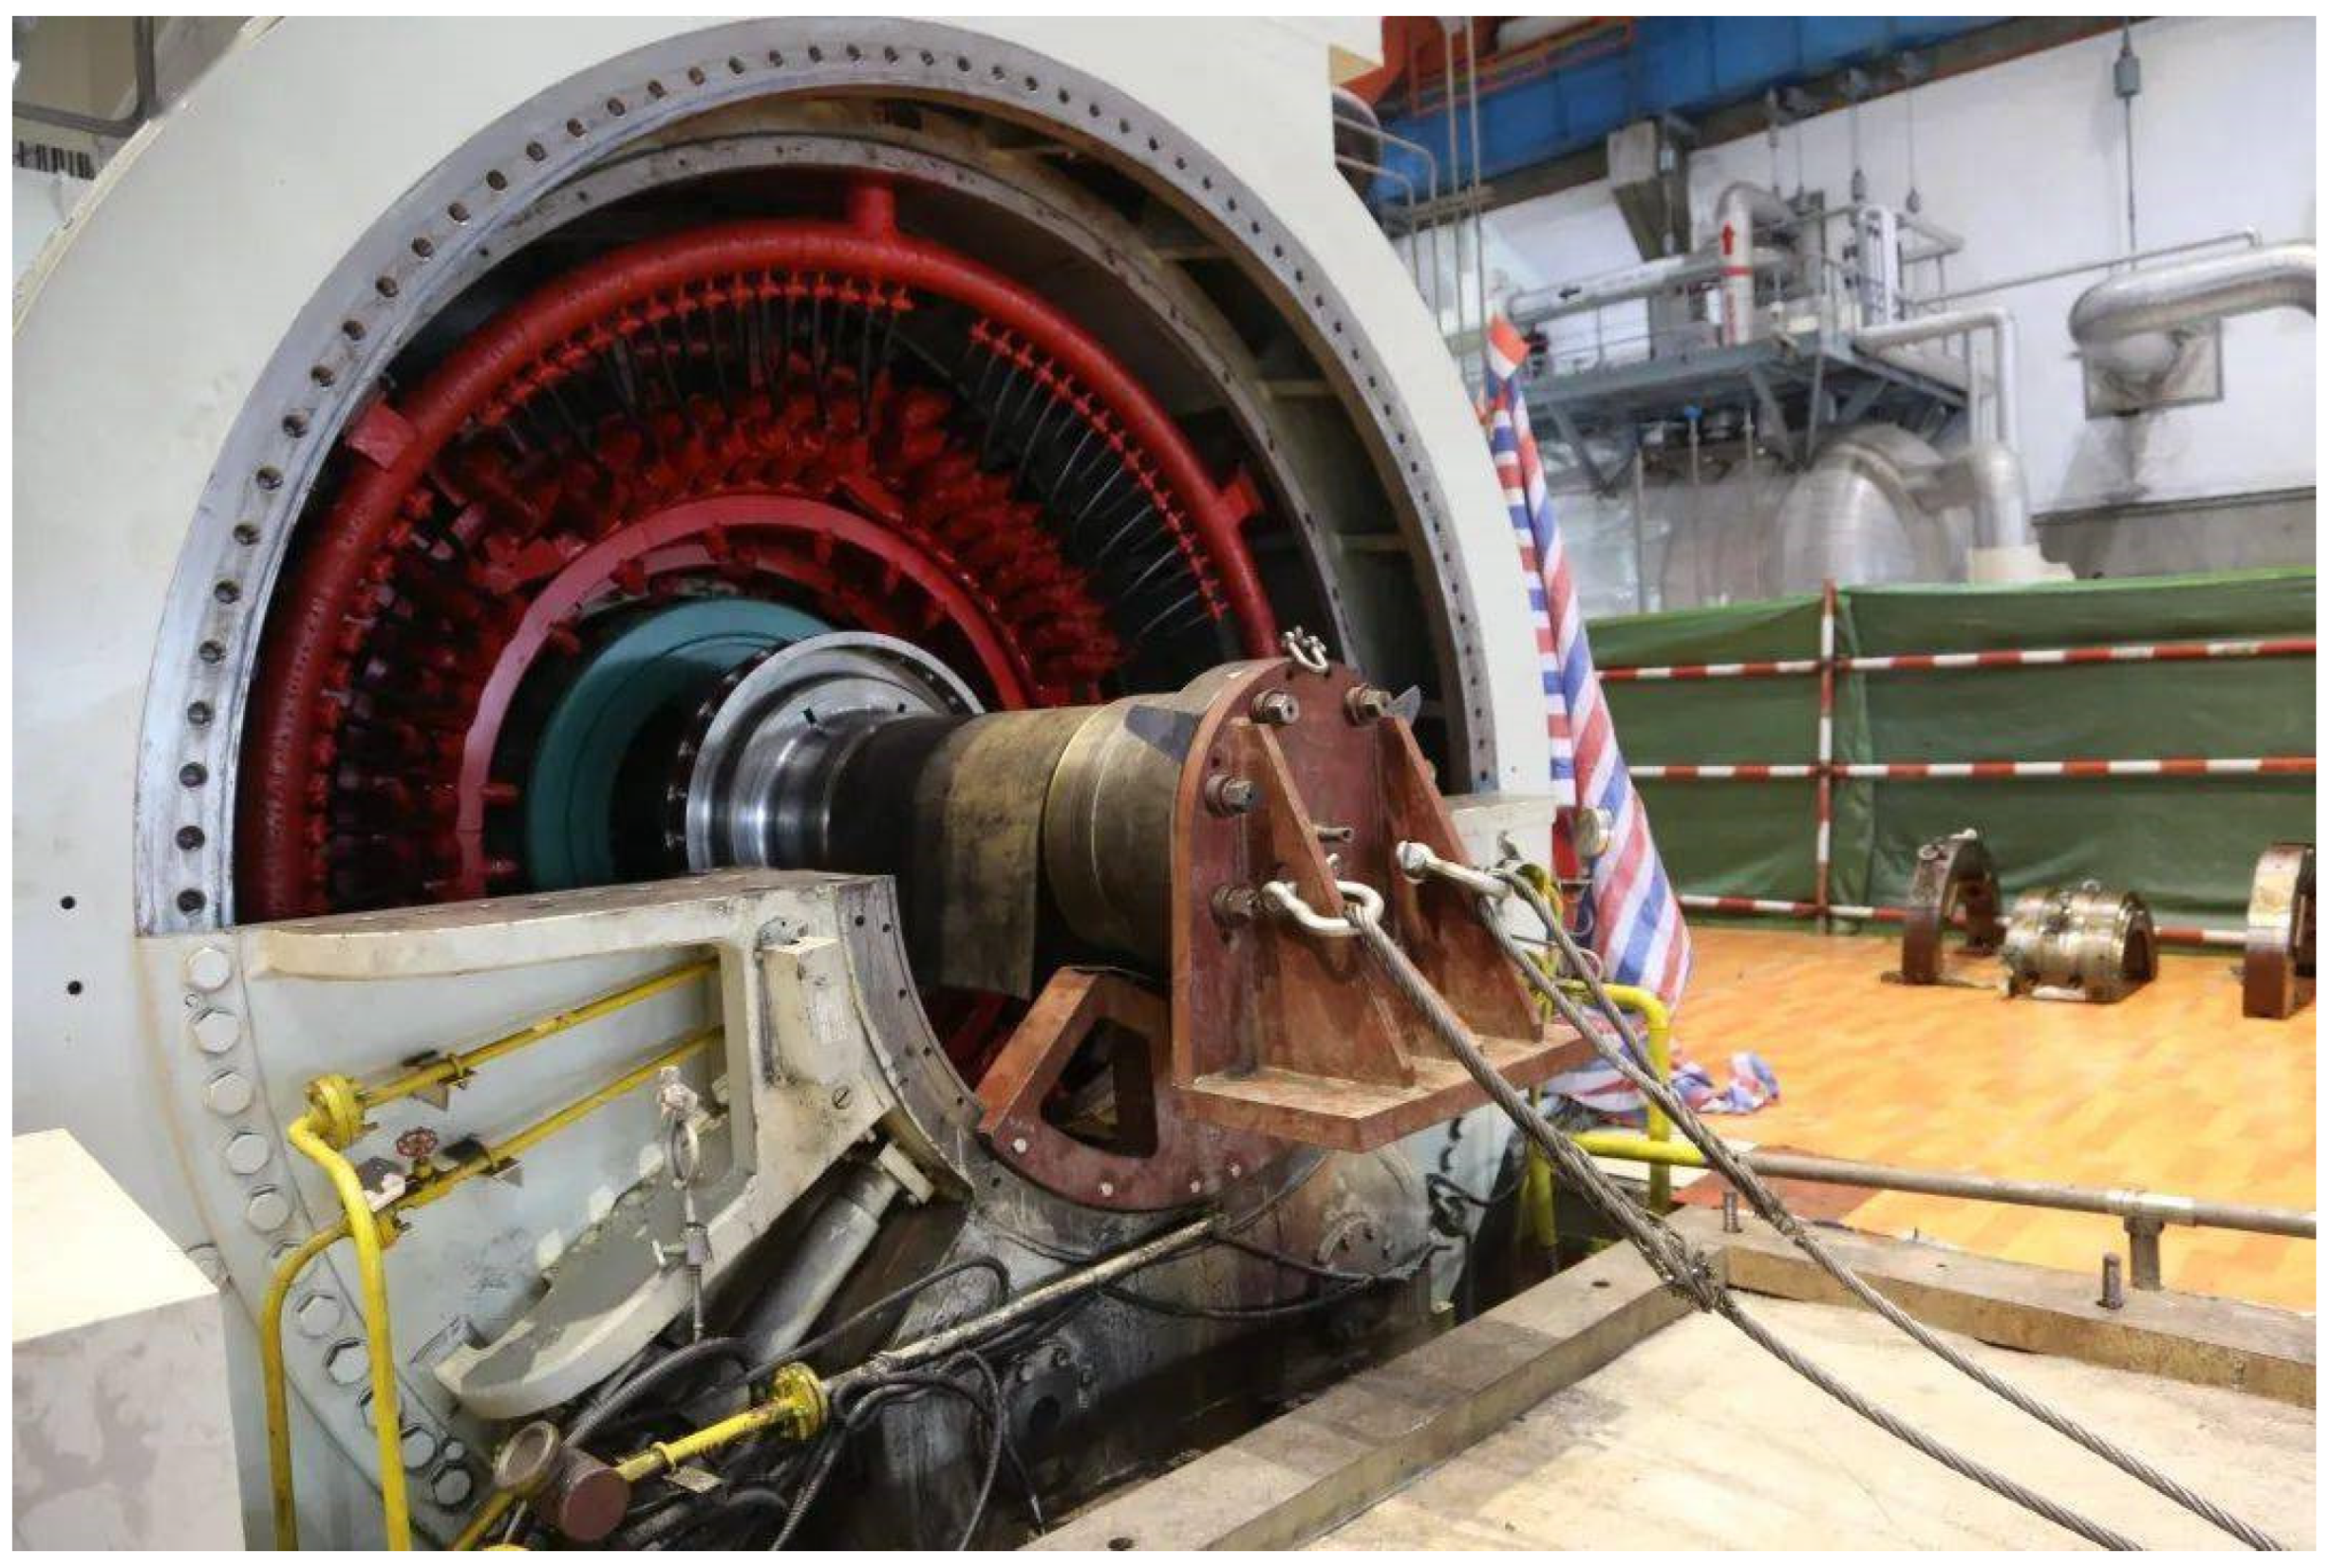
Figure 1 shows the rotor core pulling operation that must be completed during experimental testing or maintenance of large generators. The technical difficulty of its operating procedures can be imagined, and it is also unrealistic for large equipment to frequently carry out such operations. Therefore, conducting effective research on rotor operating state prediction has high theoretical value and practical significance.
The circumferential velocity of the rotor of a large generator is very high. Under the action of such a high circumferential velocity, the rotor components will be subjected to significant centrifugal force, which results in high material requirements for the rotor body [
6]. As shown in
Figure 2, the rotor core is made of a whole piece of high-strength alloy steel with good magnetic conductivity and forged into a shaft, and the rotor magnetic poles are made into hidden poles. However, when an asymmetric operating state occurs, the surface of the rotor is more prone to overheating or burning, which is often irreversible. For such important and expensive large power equipment, conducting such destructive experiments requires great caution. Therefore, how to effectively avoid rotor overheating under asymmetric operating conditions has become an urgent problem to be solved [
7]. As the core large equipment in the smart grid, the production and installation of rotors have strict workflow and technical indicators. Therefore, the monitoring and prediction technology related to the generator status is particularly important.
When the generator operates asymmetrically, both the voltage and current experience asymmetry, with the current asymmetry having a more significant impact on the generator [
8]. To analyze such problems, the symmetrical component method is generally used to decompose the three-phase asymmetric current into three components: positive, negative, and zero sequence. Usually, when the neutral point of a generator is not grounded or grounded through impedance, the impact of a zero-sequence current is minimal. Therefore, the main consideration is the impact of a negative-sequence current on the generator, and overheating or burning caused by a negative-sequence current has the most severe impact on the generator rotor. As shown in
Figure 3, the temperature rise in the rotor caused by a negative-sequence current not only affects the operating efficiency of the generator but also directly damages the main structural components. Due to various limitations of field measurement, using mathematical methods to analyze and predict the generator status has become one of the main ways to solve the problem.
Under asymmetric operating conditions, the rotor components of the large generator experience eddy currents and changes in the temperature field distribution under the action of power loads. The analysis of the overheating caused by a negative-sequence current is one of the key issues concerning the negative-sequence capability of the generator. The solution to the electromagnetic thermodynamic response of the components can be divided into an analytical expression and a numerical solution, although the analytical expression is difficult to apply to practical engineering due to the difficulty of the solution [
9,
10]. Since the 20th century, finite element calculation methods have been widely applied in various fields of generator state analysis, with possibilities for solving complex engineering problems [
11,
12,
13]. Hanic et al. present accurate and computationally efficient finite element calculation and modeling methods for simulating symmetrical steady-state load conditions in synchronous generators [
14]. The finite element calculations and experimental measurements are employed to detect faults in a two-pole synchronous generator. The air-gap magnetic field can be obtained and calculated using the finite element method [
15]. The finite element and magnetic circuit methods are used to detect the no-load leakage flux coefficient, and its variation trend charts the change in the pole arc coefficient, air gap length, and PM thickness [
16]. The measurement of the flux density is performed with the measuring coils installed on the stator teeth, and the calculations are conducted using the finite element method [
17].
However, the finite element method has some shortcomings and limitations, such as the complex calculation, dependence on mesh generation, and constitutive equation of the materials [
18,
19]. Discontinuous problems, such as crack growth, large impact deformation, material damage and failure, corrosion, and penetration, are difficult to solve with the finite element method. As for materials with unclear constitutive equations, the finite element method cannot be applied. In addition, the finite element method requires meshing during the calculation process, which creates cumbersome preparation work and greatly relies on the quality of the mesh for the calculation accuracy. In order to solve the above problems, although some improved analysis methods have emerged [
20,
21,
22], these methods are still based on physical laws and are limited by material constitutive models. At the same time, the asymmetric operating state of the generator is essentially a dynamic change process, and the development trend is constantly changing. It is also difficult to accurately predict temperature-rise changes quickly and accurately using finite element methods. With the rapid growth of the electricity demand, the actual scale of the network system is becoming larger and more constrained, and the system structure is becoming increasingly complex. The limitations of classical analysis and calculation methods are becoming increasingly apparent, making it difficult to meet the scientific computing needs of real-time processing.
To explore solutions beyond the finite element method, predicting the rotor temperature rise can be regarded as a data-generation process under given conditions, thereby bypassing physical problem-solving methods [
23]. Due to the good continuity and high vertical resolution of monitoring data for the asymmetric operation of generators, as well as their sensitivity to the temperature-rise response, the method of predicting the negative-sequence temperature rise using an Artificial Neural Network (ANN) with the generator operation curve as the characteristic input is attracting attention both domestically and internationally. ANNs have been used in various aspects of generator research [
24,
25,
26], and the above studies have achieved good application results, although there are still shortcomings. (1) ANNs are limited by the synchronous instantaneous input and cannot reflect the time-accumulation effect of a continuous signal, affecting the identification accuracy of the highest negative-sequence temperature rise [
27]. The temperature-rise prediction is mainly based on the combination of the amplitude characteristics of each operation curve, so the accurate extraction of the operation curve shape is the key to improving the recognition accuracy, which is essentially a nonlinear time-variant system classification problem [
28]. (2) The amplitude and frequency of the asymmetric operating curve undergo frequent abrupt changes, with many singular points, and they belong to the non-stationary time-varying process signal [
29]. ANNs are also limited by the excitation function, so it is difficult to effectively complete the nonlinear mapping of such complex singular signals [
30].
A Process Neural Network (PNN) realizes continuous input signal processing by improving the neuron aggregation mechanism [
31,
32], which is more suitable for approximating a nonlinear time-variant system. However, the internal mapping structure of the network is complex, the orthogonal basis expansion parameters grow exponentially, the training speed is slow, and the training convergence has great shortcomings. To summarize, in order to improve the accuracy of negative-sequence temperature-rise prediction, this paper uses the ridgelet function as the excitation function of the process neuron, and the Ridgelet Process Neural Network (RPNN) is adopted. Meanwhile, a niche genetic algorithm (NGA) based on initial population chaos optimization is proposed by combining the chaotic sequence generated by tent mapping. Furthermore, the improved niche genetic algorithm (INGA) is applied to optimize the RPNN parameters. By comparing the simulation experiments of 10 benchmark test functions with the field experiments of a 300 MW generator under negative-sequence operating conditions, the effectiveness of this model in predicting the highest temperature rise of the rotor is verified. Finally, for different negative-sequence operating conditions, the maximum temperature rise on the pole surface can be predicted by considering the rotor length and damping system type, which will provide a basis for the structural design and safe operation of a large generator.
2. Accident Characteristic Analysis and Field Experiments for a 300 MW Generator
As the core piece of large equipment in the power system, the actual operation accidents are the most accurate and intuitive scientific experiments for large generators and the most accurate and intuitive reflection of urgent scientific problems that need to be solved. Generally, generator accidents are often caused by defects in materials and structures. In recent years, with the continuous expansion of the power production scale and the continuous increase in the single-unit capacity, asymmetric faults have occurred frequently, especially the occurrence of extremely serious damage, which has affected the operation of and created huge economic losses for power plants. This section will take multiple asymmetric faults of a 300 MW turbo-generator as examples to analyze the impact of negative-sequence components on the overheating of the generator rotor and complete the construction and measurement of an on-site experimental environment.
2.1. Analysis of Accident Characteristics
Thermal power generation accounts for a large proportion of the global power generation, and for a considerable period of time in the future, 300 MW generators will still be the main units used in the power grid. The 300 MW generator studied in this paper has been in safe operation for over 30 years since it was successfully implemented in 1990. Since the generator has been in operation for over 30 years, the technical requirements for operation maintenance, technological improvement, and energy conservation are increasingly urgent to ascertain. Hence, it is necessary to optimize the parameters to improve its actual operating level. Moreover, power plants equipped with 300 MW units have experienced various accidents since they were put into operation. Therefore, it is crucial to conduct an in-depth analysis of typical accidents, identify the causes of accidents, and propose solutions to ensure the safe operation of large units to clarify the development direction of scientific research concerning large generators.
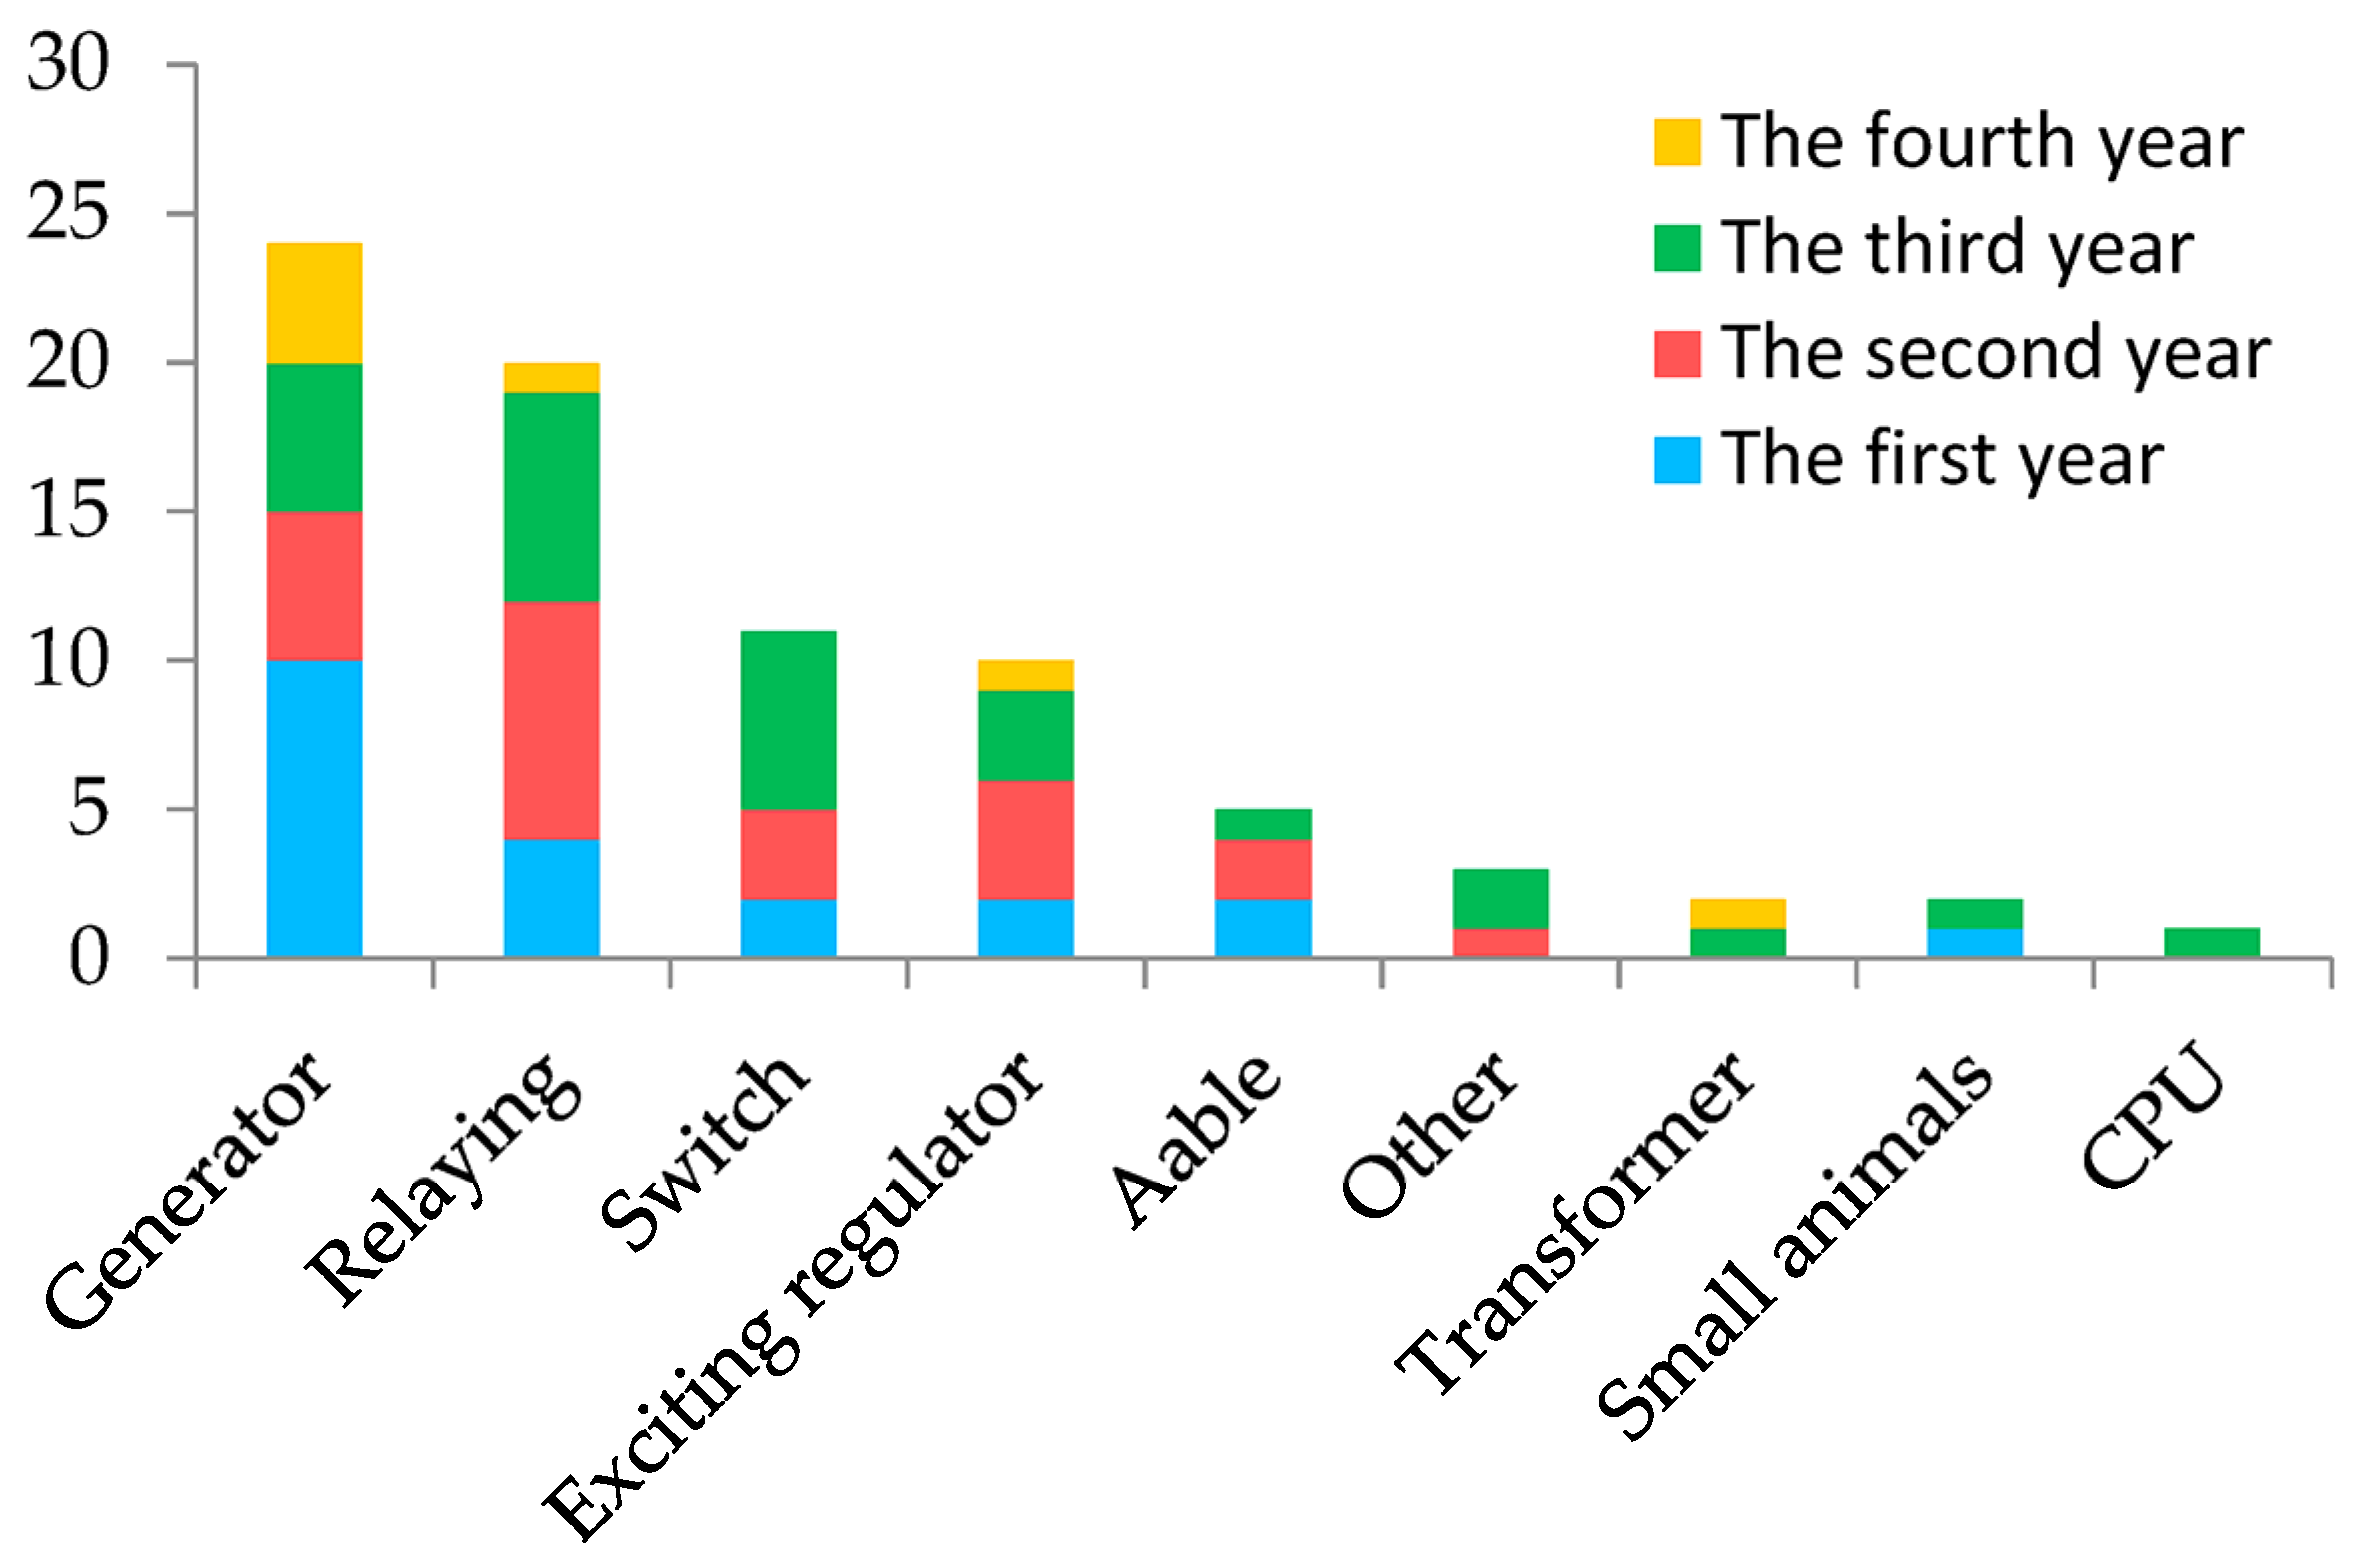
Figure 4 shows the statistics of shutdown accidents in a certain power grid for 4 consecutive years. A total of 78 electrical accidents occurred in 300 MW thermal power generation units, including generator shutdown, accounting for 30.7%; relay protection shutdown, accounting for 25.6%; circuit breaker shutdown, accounting for 14.1%; and automatic excitation regulation device shutdown, accounting for 12.8%. The above four types of faults account for 83.2% of electrical shutdown accidents, especially the highest proportion of generator failure.
Regarding the collected faults in
Figure 4, a large portion of the generator faults had a wide impact and caused huge economic losses. Especially in several asymmetric generator accidents, there were three accidents where the generator rotor was severely burned and took a long time to repair, resulting in huge economic losses. Therefore, it is urgent to conduct an in-depth analysis and exploration of the design improvement of generator technical parameters and strive to solve the negative-sequence overheating of the rotor. The derivation process and distribution characteristics of heat generation are particularly important for the negative-sequence temperature-rise problem of rotors, which is also the first problem to be solved when researching such scientific problems.
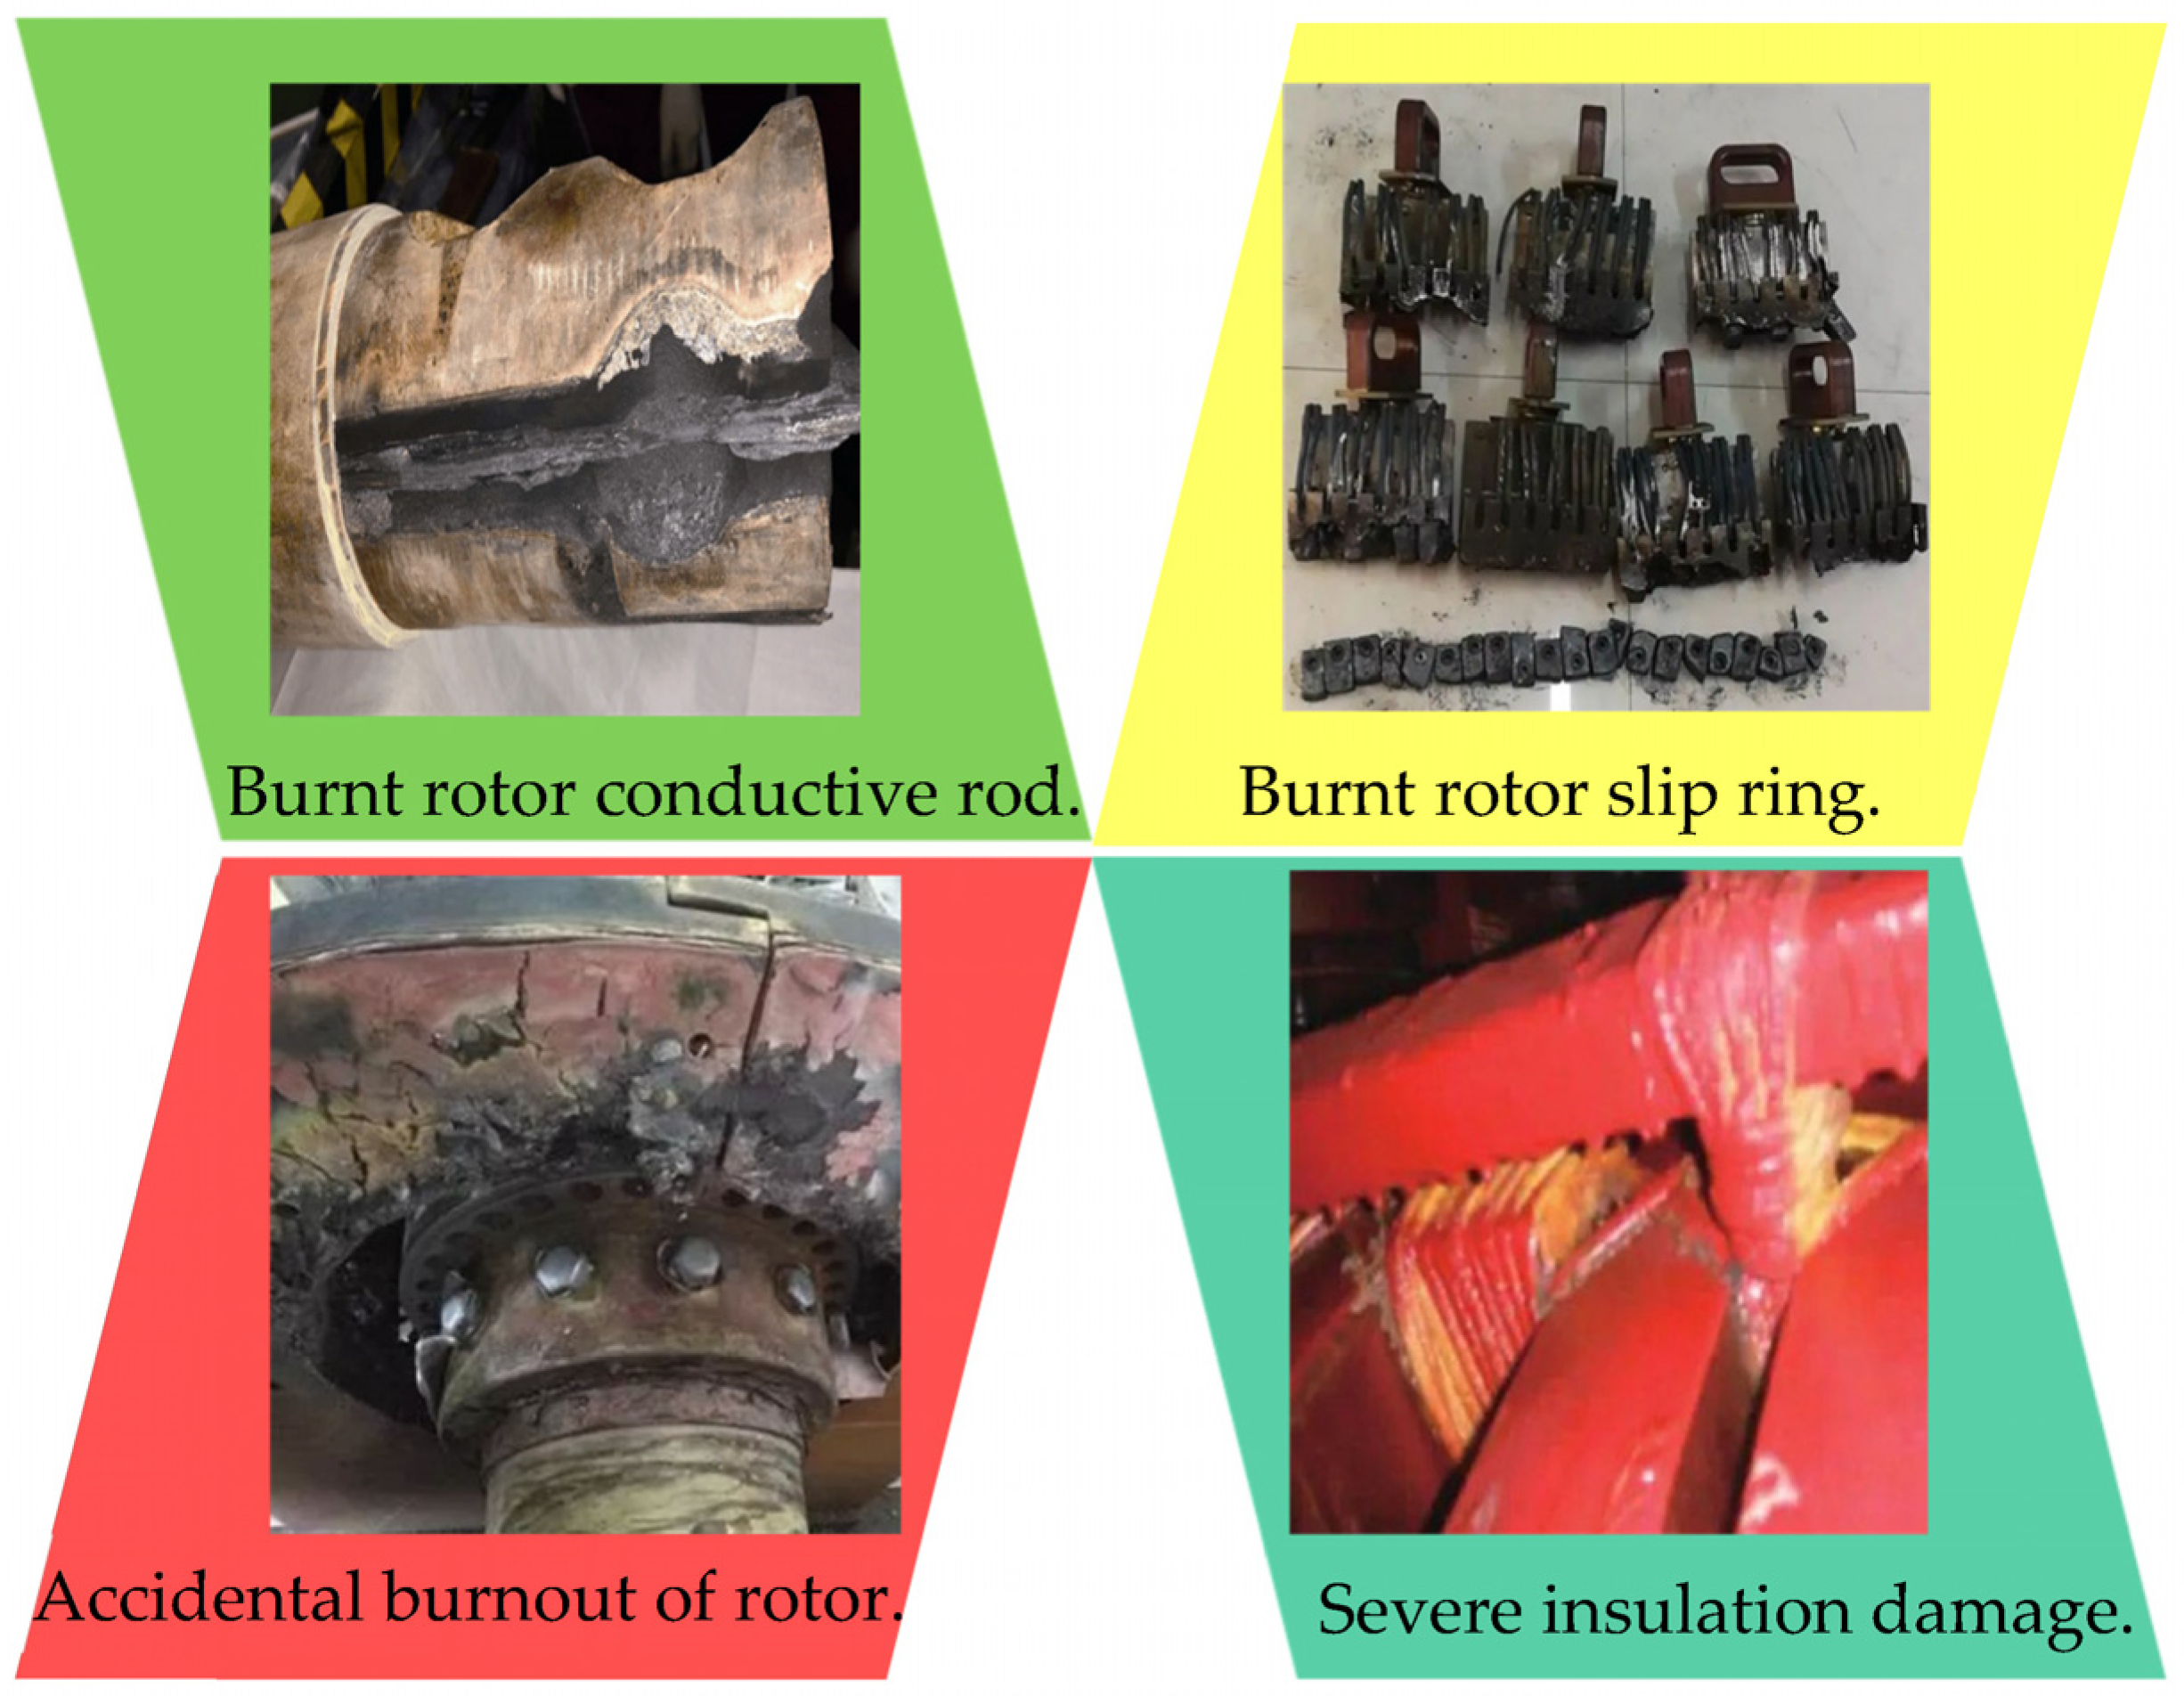
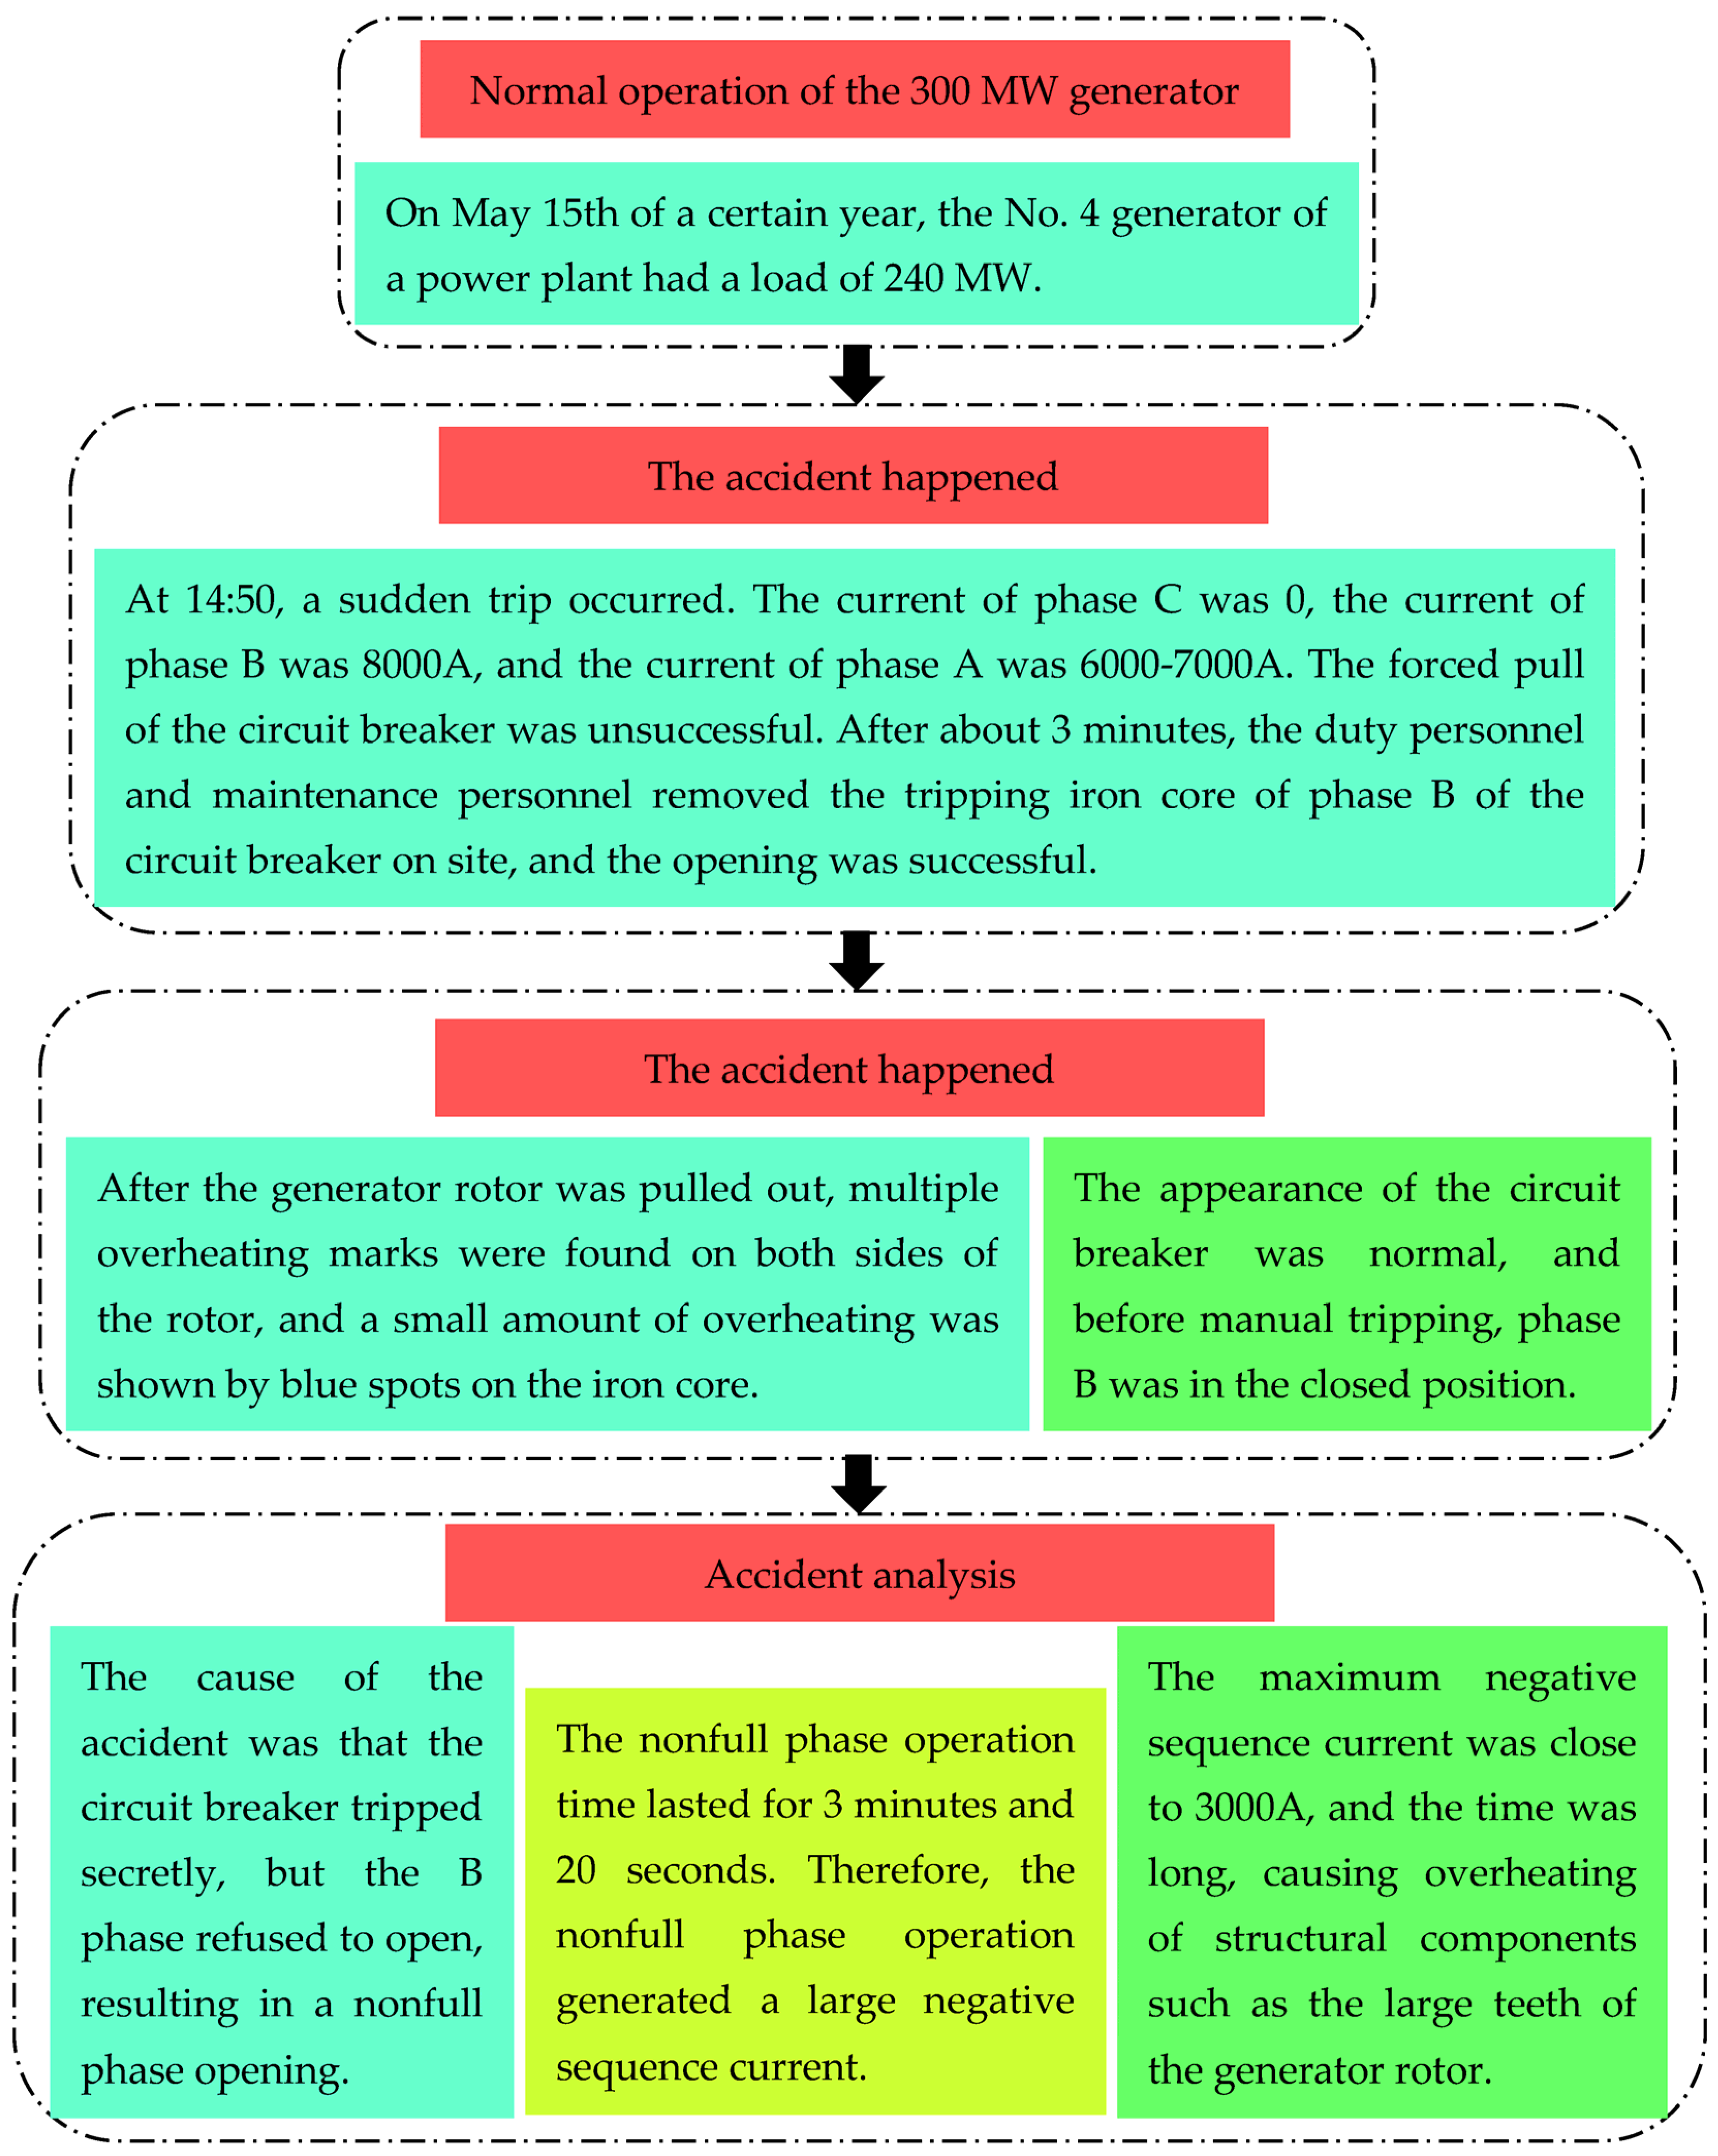
Figure 5 shows a typical non-full phase opening fault process, providing a basis for analyzing the negative-sequence overheating characteristics of the generator rotor.
According to the accident phenomenon in
Figure 5 and the daily monitoring data, it can be seen that the negative-sequence current damage caused by asymmetric operating conditions on a 300 MW large generator is very serious. The big teeth of the rotor, especially at the edge of the transverse slots, will generate a large amount of eddy current loss and cause a local temperature rise in the rotor body under negative-sequence operating conditions. For such situations, installing damping winding at the edge of the transverse slot is undoubtedly the most effective solution, which is also an effective way to improve the negative-sequence capacity. Therefore, this paper explores the rotor heating situation during negative-sequence operation, as well as the influence of damping windings on negative-sequence heating, which is of important practical significance.
Moreover, a large frequency-doubling current is constantly formed and circulated in the damping bars, resulting from the main structural components being continuously cut by the negative-sequence magnetic field at a synchronous speed of two times the frequency. The current in the damping bars can reduce the negative-sequence rotating magnetic field. Meanwhile, the induced current in the rotor winding has also been significantly reduced, which causes the rotor heating. Therefore, as an important part of generator design and operation, the damping winding, which has the function of enhancing the system operation stability and reducing the impact of overvoltage, has played an immeasurable role in the operation of the large generator, and its performance in improving the negative-sequence operation ability of the generator is particularly outstanding.
In addition, due to the high speed of the generator, the maximum diameter of the rotor is mainly limited by mechanical stress, and the diameter of the rotor cannot be too large. Hence, the generator’s capacity can only be increased by appropriately increasing the length of the rotor. Usually, the shape of a rotor is a slender cylinder with a length of 2–6 times the diameter. Therefore, optimizing the design of the stator and rotor structure, appropriately increasing the effective size, ensuring an increase in the generator output, and enhancing the ability to withstand a negative-sequence current are some effective solutions.
Therefore, for the generator structure with 22 transverse slots in a large tooth, this paper aims to summarize and analyze the impact of different large tooth damping winding structures and different negative-sequence component ratios on the negative-sequence heating of the rotor. At the same time, this paper illustrates effective methods that can be used to improve the negative-sequence capacity.
2.2. Experimental Setup and Methods
This study takes a 300 MW turbo-generator in service as the experimental research object and obtains 130 sets of steady-state asymmetric operation data concerning a power plant’s No. 1 300 WM turbo-generator from March to August 2019 [
33]. Meanwhile, the specific situation of conducting negative-sequence experiments is shown in
Figure 6, and the obtained experiment results strongly support the research on the negative-sequence temperature rise, etc.
3. Improved Niche Genetic Algorithm
The application of intelligent algorithms for the online, real-time prediction of the operating status of large generators has become an effective method for solving such problems. The niche technology is used to divide each generation of individuals into several categories, select several individuals with higher fitness from each category as excellent representatives of a group, and then cross and mutate within the population and between different populations to create a new generation of individual groups. The NGA can better maintain the diversity of solutions, and at the same time, it has a high global optimization ability and rate of convergence, making it especially suitable for the optimization of complex multimodal functions. In order to further avoid the problems of a slow rate of convergence, poor stability of the calculation results, and easy precocity in the algorithm, this paper improves the basic NGA.
3.1. Chaotic Optimization of Initial Population
Most of the solution sets of optimization problems exist in the multi-dimensional space represented by multiple parameters, and there is no prior knowledge that can indicate the location of the global optimal solution. Therefore, for genetic algorithms, the quality of the solution results for optimization problems is often related to the initial population. The richer the diversity of the initial population, the more likely the results are to be close to the global optimal solution and even accelerate the rate of convergence speed. Therefore, the uniform coverage of the initial population in the entire space is extremely important. Genetic algorithms try to ensure that the population covers the entire solution space of the optimization problem at the beginning of the design, although they still use random initialization methods when initializing their population in practice, which leads to insufficient coverage of the entire solution space by the initial population and affects the algorithm performance.
The randomness and ergodicity of chaotic sequences make the initial solutions generated more evenly distributed throughout the entire solution space, which is conducive to solving the global optimal solution of the optimal problem. They have been widely used in the population initialization of various optimization algorithms. Therefore, this paper introduces chaotic sequences into niche genetic algorithms to initialize atomic populations. At present, the commonly used methods for generating chaotic sequences include logistic mapping and tent mapping. The chaotic sequences generated by tent mapping have better uniform distribution and are more in line with the initial population generation of niche genetic algorithms. The sequence-generation function is shown in Equation (1).
After performing Bernoulli displacement changes to Equation (1), Equation (2) is obtained.
where
N is the number of chromosomes, and the size of the initial population is determined by the number of chromosomes and the search space dimension
D. We can generate an initial population using Equation (2) to replace the randomly generated initial population in the NGA, thereby enriching the diversity of the initial population and promoting the algorithm’s optimization results closer to the global optimal solution.
3.2. Implementation Steps and Process for INGA
The specific implementation steps for the improved niche genetic algorithm are as follows:
Step 1—Encoding: The purpose of encoding is to represent the data of independent variables in the solution space as genotype structural data in the genetic space. The basic encoding types include binary encoding, integer encoding, and real encoding. The computational complexity of binary encoding is significant, and the representation accuracy of the weight coefficients is limited. However, the optimal solution obtained by real coded GA must undergo discretization and be normalized, and the result is often no longer the global optimal solution. For multi-constrained optimization problems, infeasible solutions may even be generated. The integer-coded genetic algorithm has the advantages of both binary coding and real coding, and it has good global convergence performance. Therefore, this paper uses integer coding, and the encoded gene string is represented by an integer sequence.
Step 2—Generation of the initial population: Using the chaotic optimization method in
Section 3.1, N integer vectors with a dimension of D are generated, and each vector can be served as an independent chromosome.
Step 3—Construct the fitness value function: Genetic algorithms generally do not require other external information during the search and evolution process and only use the evaluation function values to evaluate the quality of individuals or solutions. This paper evaluates the fitness of each individual in the population according to the error function.
Step 4—Selection: The selection is divided into two steps. Firstly, the first N superior individuals are pre-selected from the obtained offspring individuals, making them the candidate parents in the next generation’s genetic operation. Secondly, the parent individuals who participate in the crossover operation are selected using the gambling wheel method. In order to avoid the phenomenon of being trapped in local solutions in traditional gambling methods, the following improvements are made: The chromosomes in the population are sorted according to their fitness values from good to bad; that is, the smaller the number, the better the corresponding individuals and the greater the probability of being selected. Meanwhile, the probability of subsequent individuals being selected should gradually decrease.
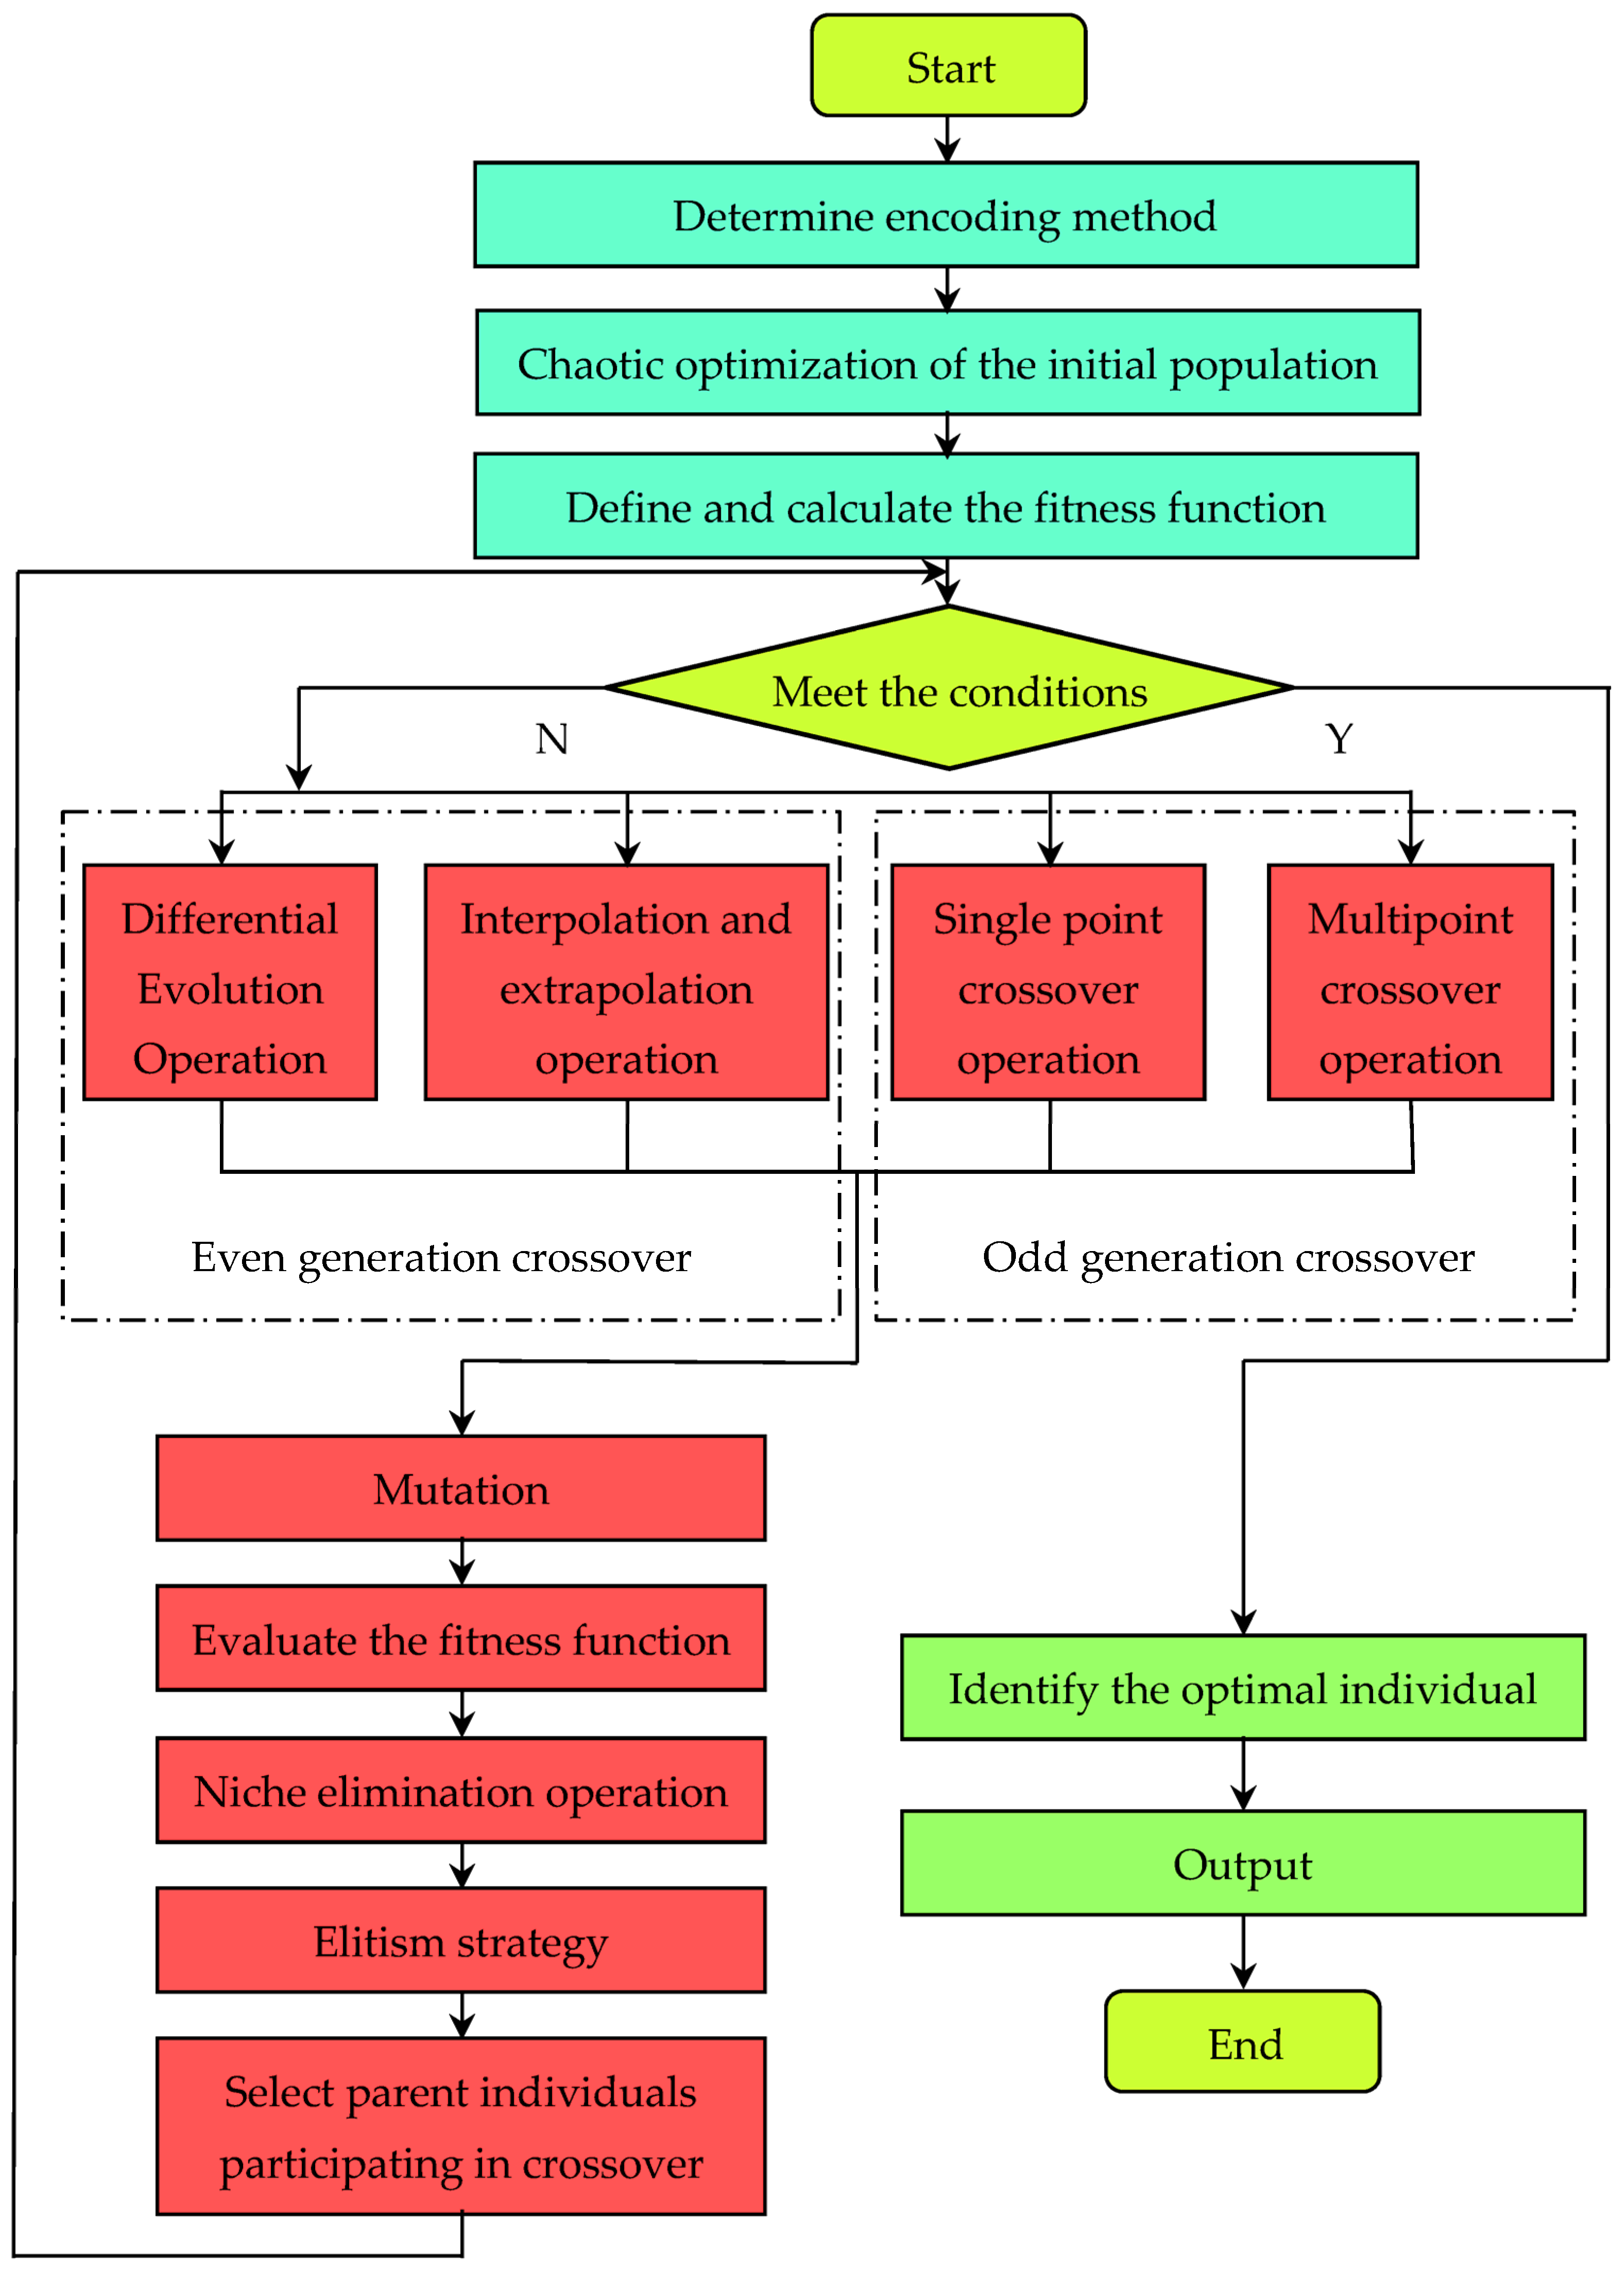
Step 5—Crossover: To overcome the dependence of convergence on the initial population selection, four different crossover operations can be used, and these four operations can be alternated in pairs during offspring generation. Crossover and multipoint crossover operations are used to generate offspring chromosomes in odd generations, and differential evolution and interpolation/extrapolation operations are used to generate offspring chromosomes in even generations.
Step 6—Mutation: After the crossover operation of each generation is completed, a small number of offspring individuals are randomly selected for the mutation operation. The specific operation is similar to the generation of individuals in the initial population, and the number of mutated individuals accounts for 1% to 2% of the total population in order to break through local limitations and converge to the global optimal solution.
Step 7—Evaluate the fitness value function: Similar to Step 3.
Step 8—Niche elimination operation: The Euclidean distance between two individuals is defined and calculated for the above offspring chromosomes after the genetic operation. When it is less than the set value, the weaker individuals are punished and their fitness value is reduced to 1/2 of the original value. The processed new individuals are sorted according to their fitness values from highest to lowest, and the first N chromosomes are used as the population for the subsequent genetic operations.
Step 9—Elite retention strategy: If the optimal value of the population obtained through Step 8 is inferior to that of the parent, it is necessary to replace the worst individual in the offspring with the best individual in the parent population to ensure that the optimal value of the offspring population is not inferior to that of the previous generation and improve the convergence efficiency of the algorithm.
The specific process of the improved niche genetic algorithm is shown in
Figure 7.
3.3. Validation of the Effectiveness of INGA
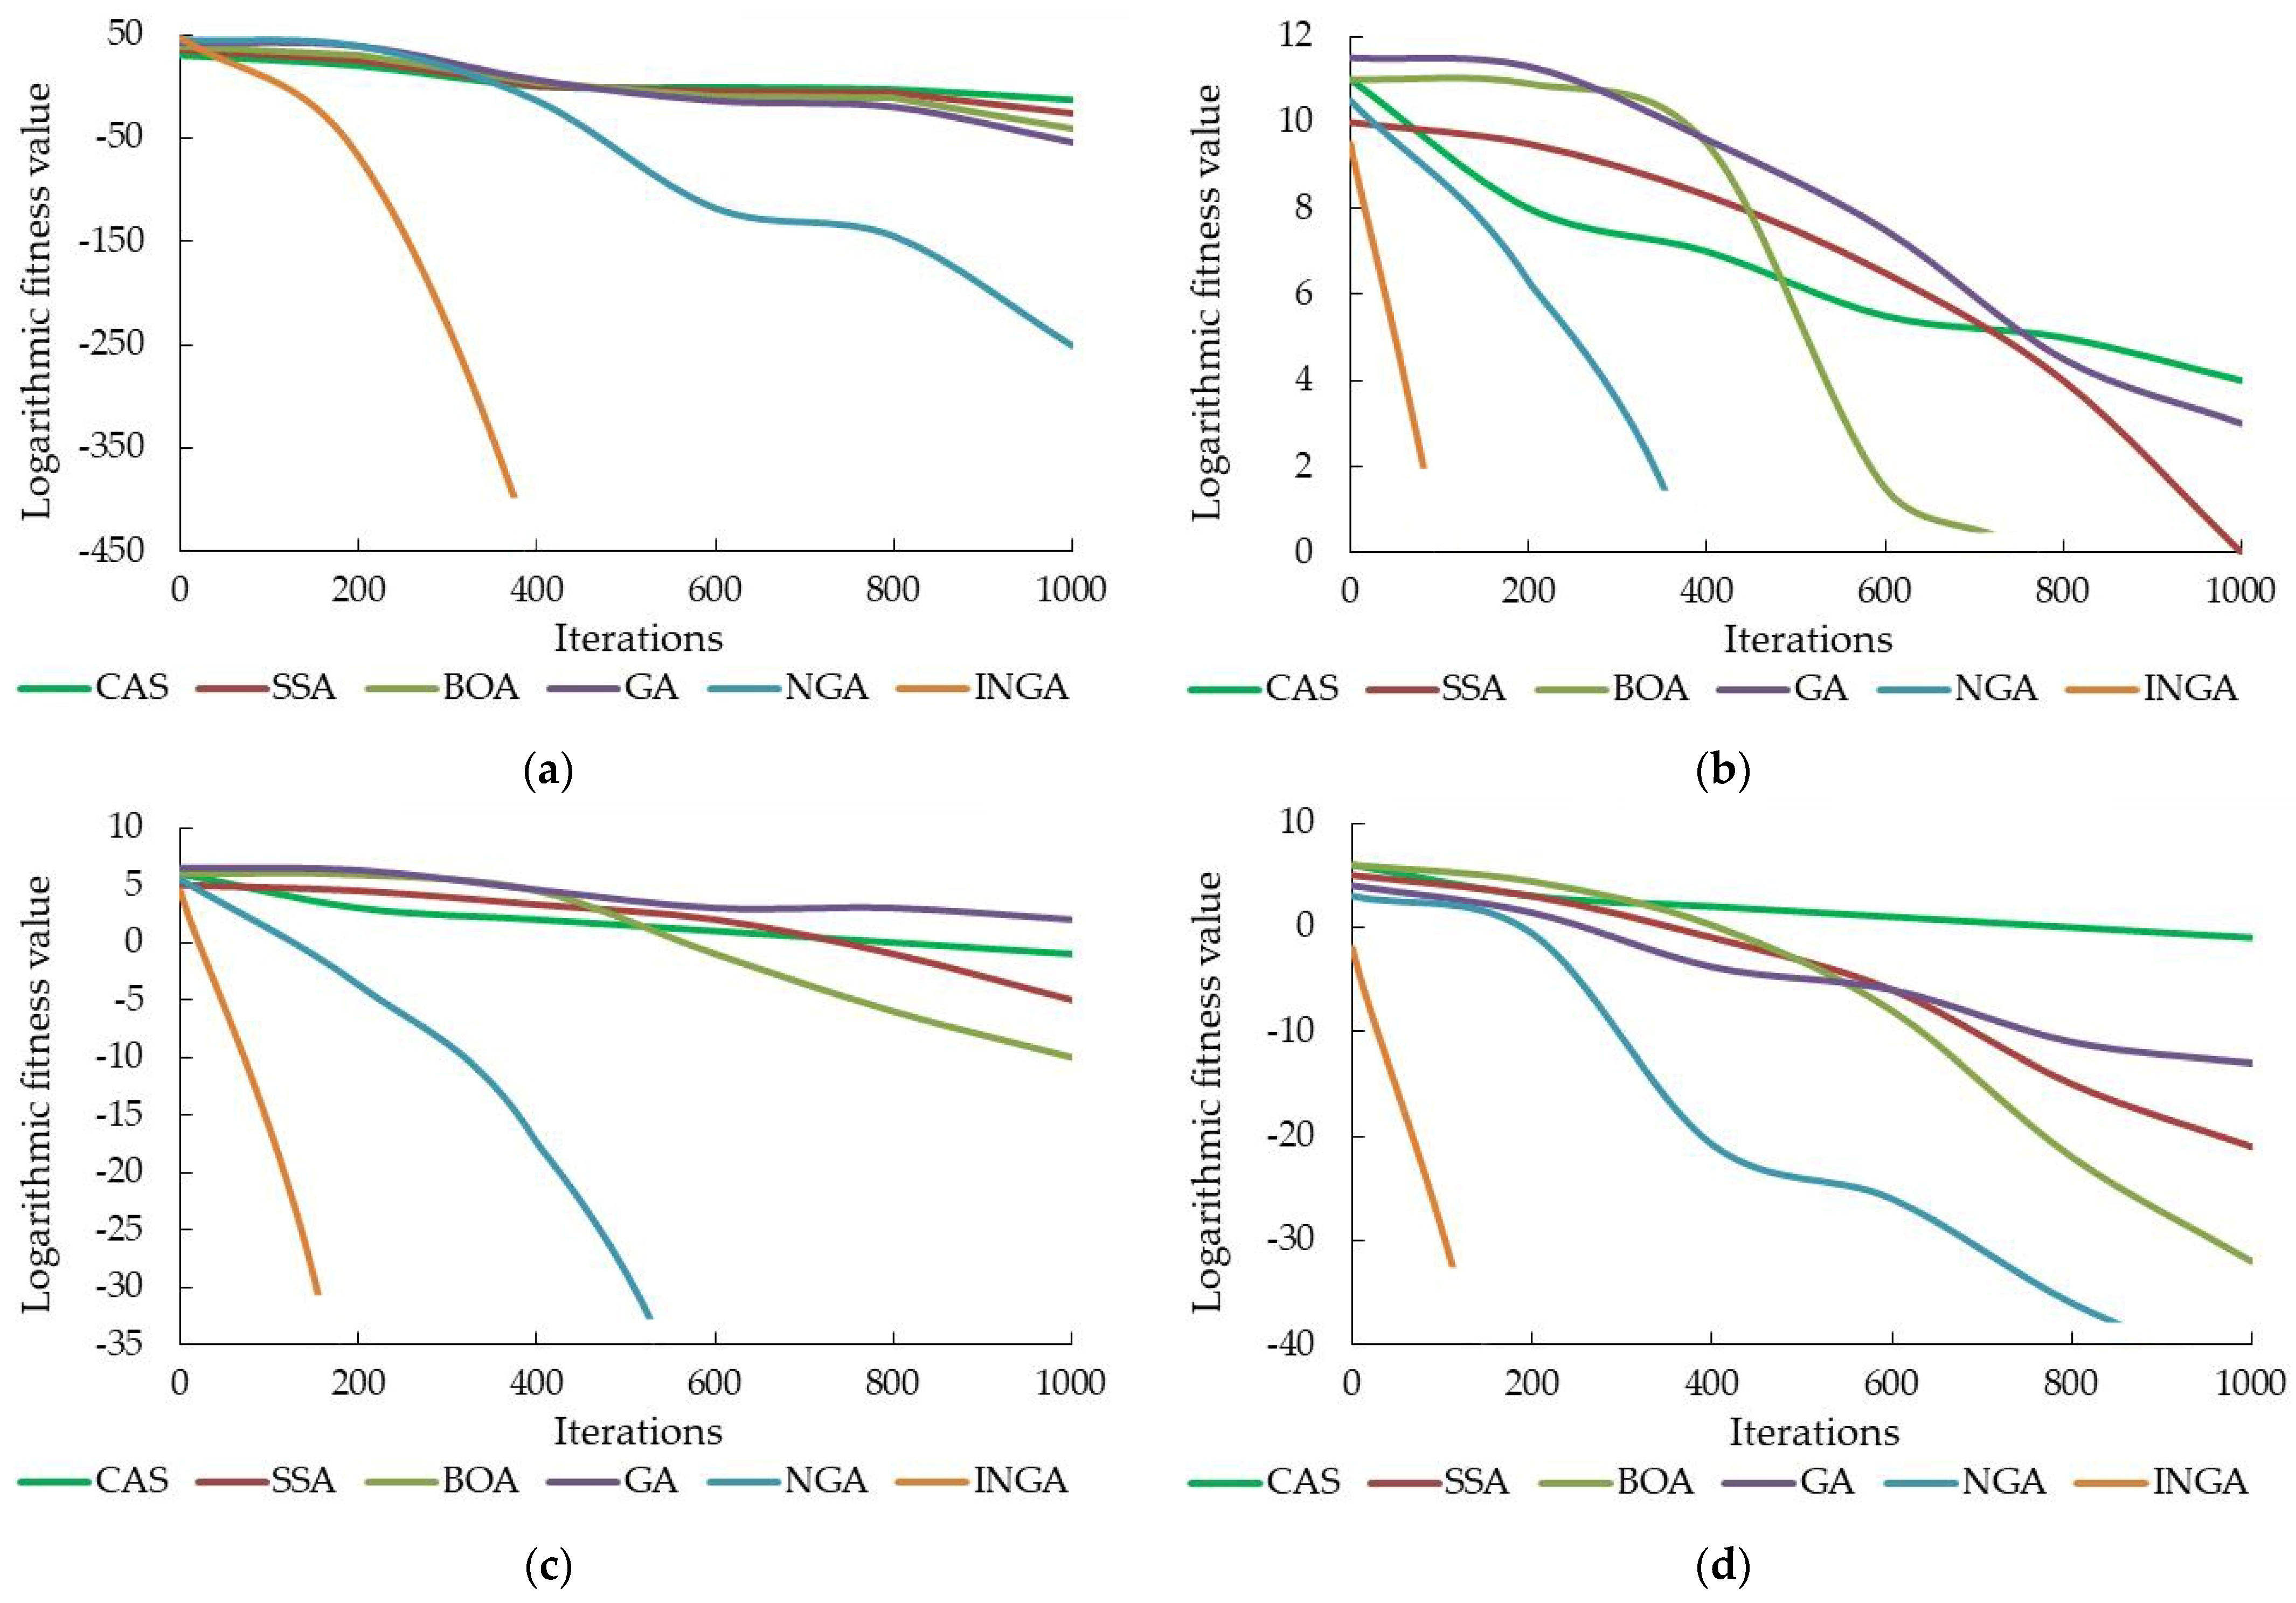
To explore and validate the optimization performance of the INGA algorithm, this paper selects 10 classic benchmark test functions for the simulation experiments, as shown in
Table 1. To fully validate the optimization performance of the algorithm proposed in this paper, three popular population intelligence algorithms from recent years have been selected, including the crow search algorithm (CSA) based on crow intelligence behavior [
34], the salp swarm algorithm (SSA) simulating the aggregation behavior of salp sea squirts [
35], and the butterfly optimization algorithm (BOA) simulating the feeding and mating behavior of butterflies [
36]. Comparative experiments are also carried out between the GA, NGA, and INGA. To ensure the objectivity and fairness of the experiment, this paper sets the population size of all the comparative algorithms to 30 and the maximum number of iterations to 1000. Each algorithm independently conducts 100 numerical experiments and calculates the mean value (Mean), standard deviation (Std), and best value (Best) of the 100 experimental results as algorithm evaluation indicators. The simulation environment used in this paper includes the Windows 10 operating system, Intel (R) Core (TM) i7-5557U CPU, 3.10 GHz as the main frequency, 8 GB of memory, and the MATLAB 2016a experimental platform. The experimental statistical results are shown in
Table 2, and some iteration curves are listed in
Figure 8.
According to
Table 2 and
Figure 8, it can be seen that compared with the other intelligent algorithms, the INGA in this paper has better optimization performance. Moreover, the INGA not only exhibits good search performance in the early stages of iteration but also maintains this advantage until the algorithm iteration terminates and approaches the theoretical optimal value of the function. Under the same population sizes, iteration times, and dimensions, except for the
f7 function, the computational accuracy of the INGA on the other benchmark test functions is much higher than that of the comparison algorithm and even reaches the optimal value. The numerical experimental results demonstrate that the INGA has better computational performance and optimization ability. Although on the
f7 function, the best index of the INGA is worse than that of the BOA algorithm, it can be found that the stability of the INGA algorithm is higher than that of the BOA by comparing the Mean and Std, which further verifies the reliability and robustness of the INGA algorithm. At the same time, the INGA obtains the optimal calculation accuracy for the three indicators on the unimodal and multimodal functions, indicating that the INGA has stronger local development, convergence, and global exploration abilities.
4. Proposal and Validation of the INGA–RPNN Prediction Model
The conventional PNN model needs to increase the number of hidden layer nodes or hidden layers to meet the accuracy requirements for complex singular time-varying signals such as negative-sequence operating curves, which affects the model’s generalization ability. In recent years, ridgelet transform has been used as a multi-scale geometric analysis tool to effectively approximate singular signals [
37]. This section combines the INGA with the RPNN to predict the maximum temperature rise of the rotor.
4.1. Principles of RPNN
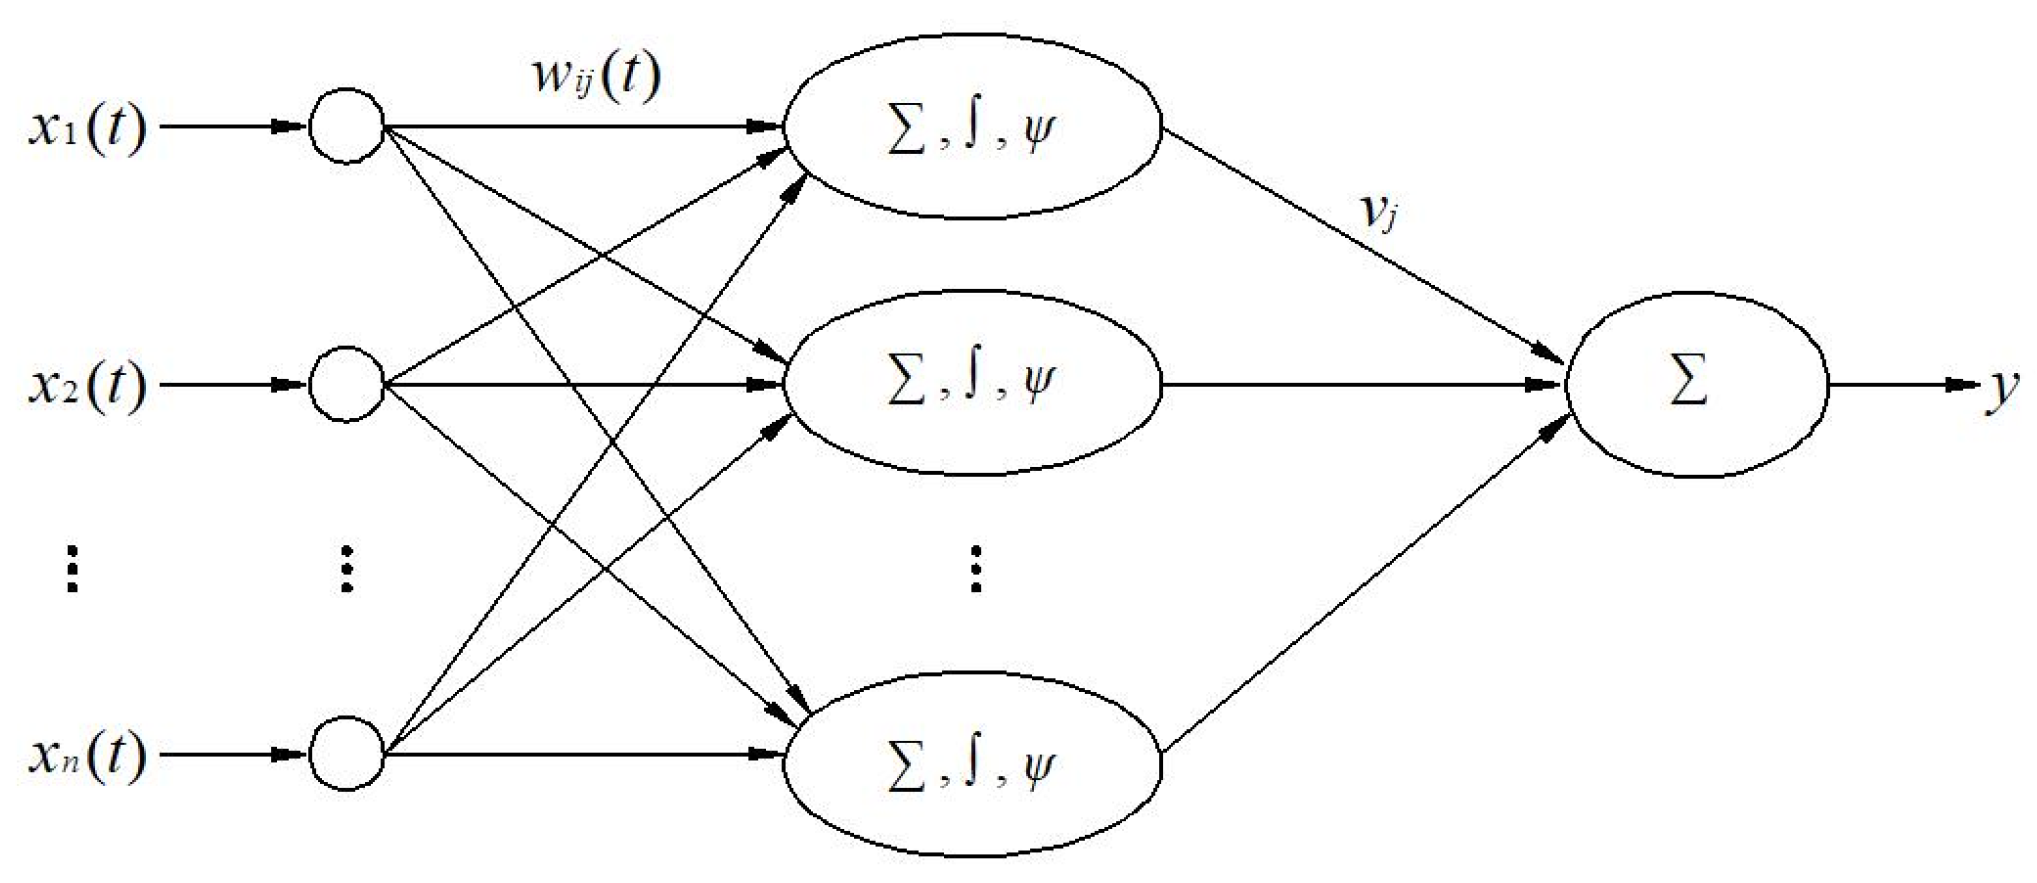
This paper focuses on the mapping approximation problem of frequent abrupt changes in asymmetric operating curves and selects ridge transformation as the excitation function of the PNN. The connection weight function is
W(
t) = {
w1(
t),
w2(
t), …,
wn(
t)},
Ψ is the ridgelet function, and the single hidden layer RPNN structure is shown in
Figure 9.
The relationship between the output and input of the RPNN is given in Equation (3).
where
wij(
t)
xi(
t) is the inner product of the
i-th input
xi(
t) and
wij(
t).
A group of orthogonal basis functions
b1(
t),
b2(
t), …,
bL(
t) are selected in the input function space and expanded as Equation (4) when the input function and weight function satisfy the fitting accuracy.
According to Equation (4), Equation (3) can be rewritten as Equation (5).
According to the characteristics of the orthonormal basis, Equation (5) can be sorted as Equation (6).
If the sample is (
xk1(
t),
xk2(
t), …,
xkn(
t),
dk),
k = 1, 2, …,
K, the error function of the RPNN is defined as Equation (7).
4.2. Optimization of the Design of the INGA–RPNN Predictive Model
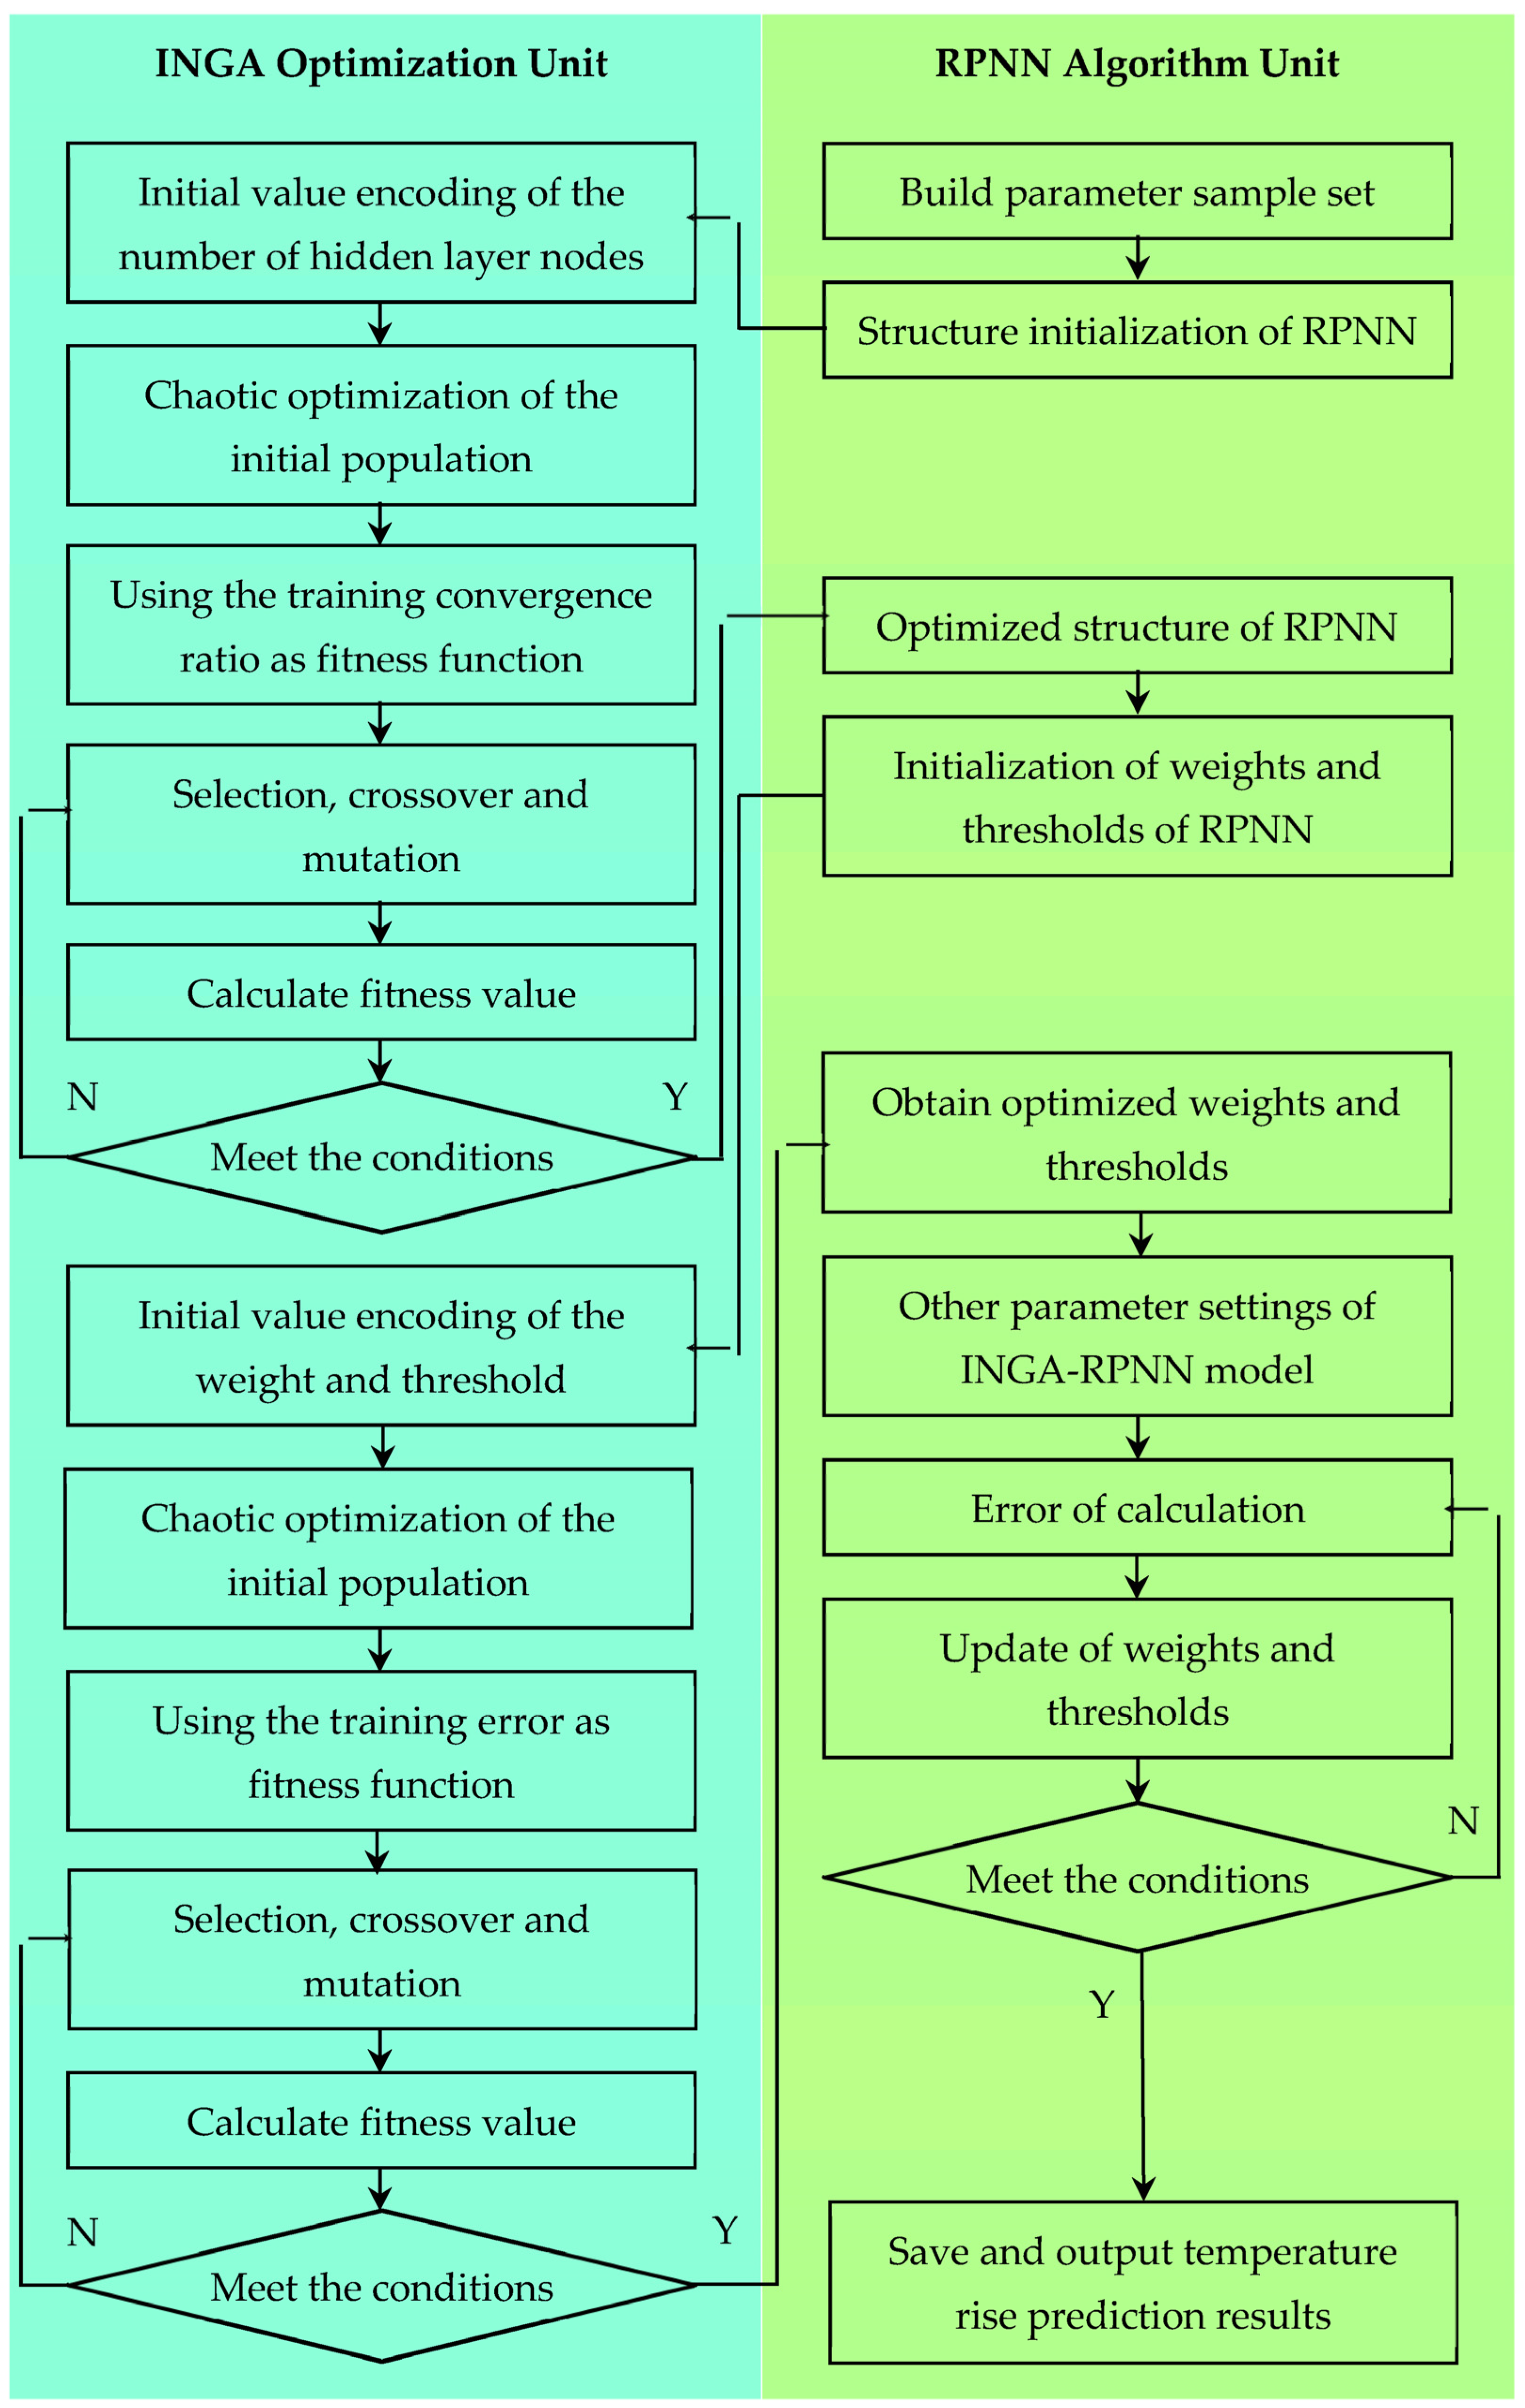
In the above comparative experiments, the optimization results of the INGA under different benchmark test functions and dimensions have better superiority and faster convergence compared to the other comparative algorithms. Therefore, this article introduces the performance advantages of the INGA in solving complex optimization problems to RPNN parameter optimization and proposes an RPNN parameter optimization method based on the INGA method (INGA–RPNN). Additionally, it is used to solve the optimization problem of the highest temperature rise in the rotor under negative-sequence operating conditions.
Regarding the optimization problem, this paper maximizes the accuracy of the RPNN as the optimization principle, transforms the training process of the RPNN into the optimization problem optimization process, and uses the INGA to solve the optimization objective. The basic idea is to optimize the number of hidden nodes, initial weights, and thresholds of the RPNN through the INGA algorithm and to take the convergence ratio and training error of the RPNN as individual fitness values. Finally, the optimal network structure, initial weights, and thresholds are selected to construct an RPNN prediction model. The precise convergence ratio function is shown in Equation (8). The specific implementation steps of the INGA–RPNN prediction model are shown in
Figure 10.
where
E0 is the set convergence accuracy,
E1 is the actual convergence accuracy, and
t is the network training time.
4.3. Experimental Verification of the Effectiveness of the INGA–RPNN Prediction Model
To verify the effectiveness of the INGA–RPNN prediction model, 130 sets of steady-state asymmetric operating data concerning a 300 MW generator in a power plant for 6 months in 2019 were selected for the accuracy experiments on the actual operating state prediction results. At the same time, performance comparison experiments were conducted with four other PNN prediction models.
The typical negative-sequence characteristic curves under asymmetric operation conditions of large generators include a three-phase current versus time curve, three-phase voltage versus time curve, power factor versus time curve, speed versus time curve, generator load versus time curve, rotor slot wedge conductivity versus time curve, cooling hydrogen outlet air temperature versus time curve, cooling hydrogen inlet air temperature versus time curve, the thermal conductivity curve of the rotor slot wedge with time, and the vibration frequency curve of the generator with time. Since the operating curve is a comprehensive reflection of the rotor heating problem, selecting more operating curves is conducive to improving the accuracy of the temperature-rise prediction. However, when the input sample dimensions are large, the neural network model not only has low calculation efficiency and a slow rate of convergence but also causes complexity in the network structure. Therefore, this paper uses the principal component analysis method for the generator operating parameter curve.
Due to the limitations of the orthogonal basis expansion structure of the PNN model, with each additional input node, the training parameters increase exponentially, which greatly increases the model complexity, reduces the training convergence rate, and affects the classification and recognition accuracy of the model. The cumulative contribution rate of the first seven principal components has exceeded 85%. According to the principle of PCA, when the cumulative contribution rate of multiple principal components exceeds 85%, it can represent the original data space features. Therefore, the first seven principal components are ultimately selected to represent the operational features.
The INGA algorithm proposed in this article is used to optimize the RPNN. After experimental comparison and analysis, the CPPNN network structure is selected as 7-13-1, which includes 7 input nodes, 13 process neuron nodes, and 1 non-time-varying neuron output node. The output value is the highest temperature rise on the surface of the rotor teeth. We can select the Legendre basis function, with the number of basis expansions L = 7 under accuracy conditions, and the network will converge after training 1863 times. Using the trained INGA–RPNN network to calculate the samples in the training sample set, the average relative error is 2.76%. The prediction of the test set samples showed an average relative error of 2.54%. Hence, the results fully demonstrate the effectiveness of the online data analysis and monitoring method for large equipment in this paper.
To further validate the predictive performance of the model, the same dataset was used to train the other models, such as the RPNN, GA–RPNN, PSO–RPNN, and NGA–RPNN. In order to ensure fairness in the algorithm comparison, the population size of all the swarm intelligence algorithms is 30, and the RPNN parameters in the various prediction models adopt the same network structure. As shown in
Section 2.2, steady-state experiments were carried out for a 300 MW generator under asymmetric operating conditions. Some measured maximum temperature-rise data concerning the rotor and the comparison results of various prediction model experiments are shown in
Table 3.
From
Table 3, it can be concluded that the prediction method based on the INGA–RPNN proposed in this paper presents a good predictive performance in predicting the highest temperature rise of the rotor. The average error of the RPNN, PSO–RPNN, GA–RPNN, NGA–CPPNN, and INGA–RPNN models is 4.40%, 3.41%, 3.40%, 2.77%, and 2.34%, respectively. Meanwhile, compared with the other neural network models, the prediction model based on the INGA–RPNN has the fewest iterations. Overall, the experimental comparison results of the prediction model based on the INGA–RPNN proposed in this paper for the maximum temperature rise of large generator rotors fully demonstrate its feasibility and accuracy.
5. Temperature-Rise Prediction for a 300 MW Generator
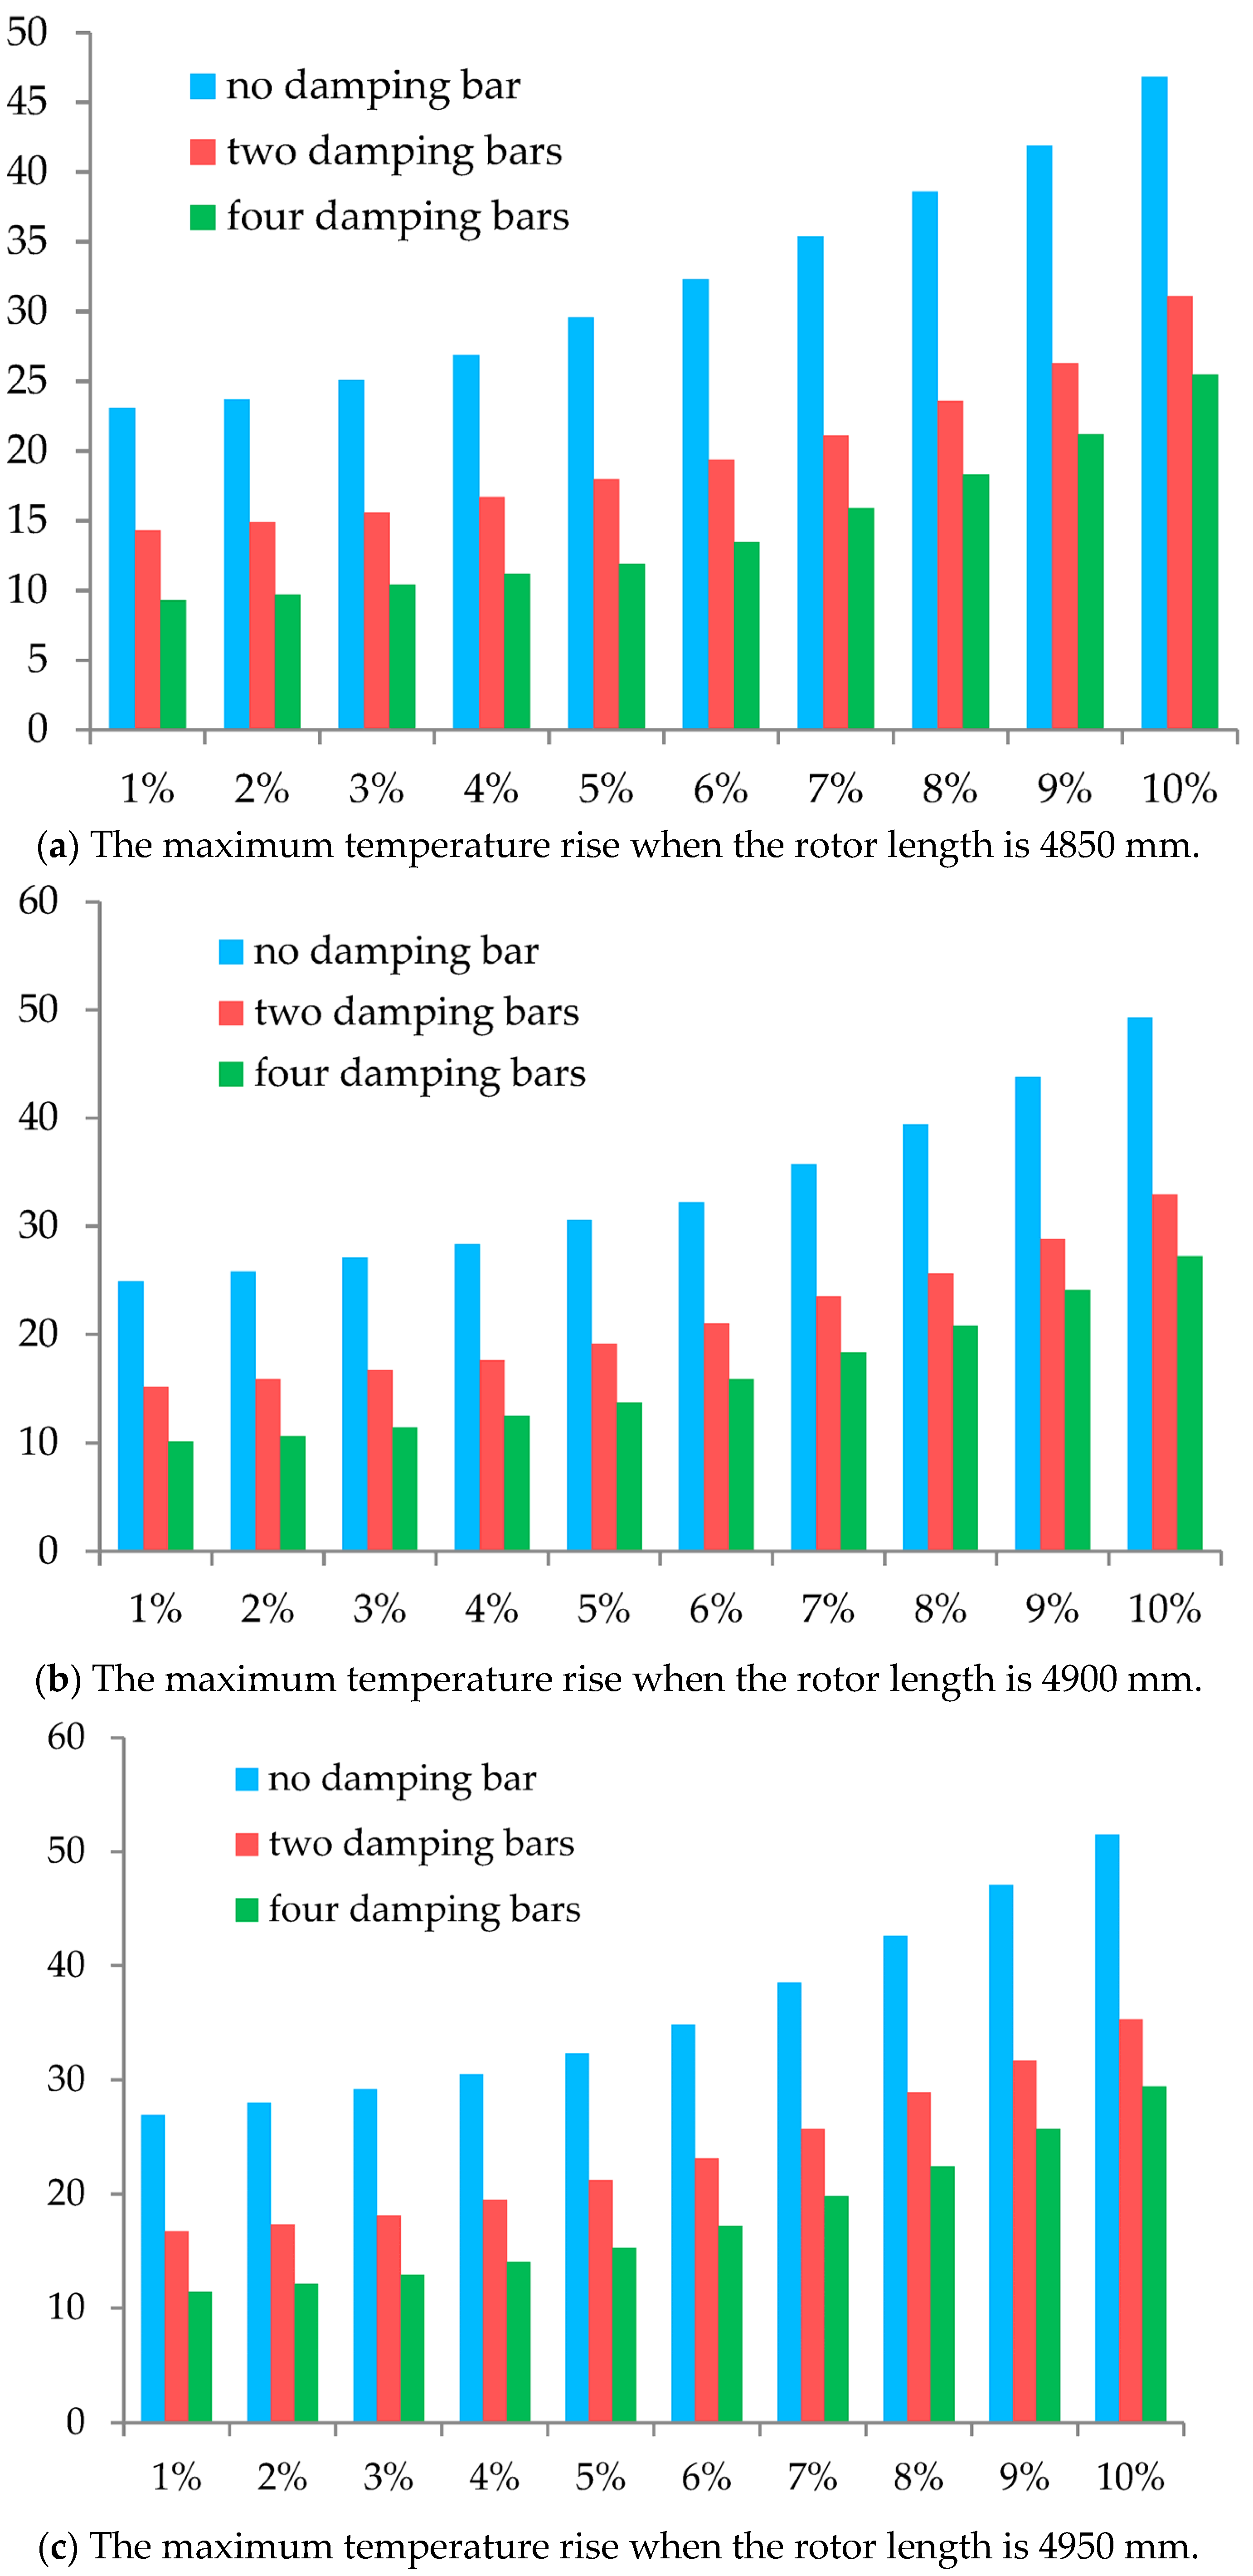
In order to effectively solve the optimization problem of the rotor structure for a 300 MW generator, this paper applies the INGA–RPNN prediction model to the study of the temperature rise of the rotor under negative–sequence operating conditions and deeply explores and analyzes the influence of the rotor length and pole damping bar number on the negative-sequence heat generation under different negative-sequence component ratios. The prediction results using the INGA–RPNN model are shown in
Figure 11.
As for
Figure 11, it can be seen that from the temperature calculation results of the three types of polar damping structures mentioned above, the rotor length and the number of polar damping bars have a significant impact on the rotor heating under different negative-sequence operating conditions. When the negative-sequence component increases proportionally, even if the same polar damping structure is used, the negative-sequence temperature rise caused by it does not increase proportionally. Under steady-state negative-sequence operating conditions, the smaller the proportion of negative-sequence components, the smaller the temperature rise caused by them; the larger the proportion of negative-sequence components, the more rapid the increase in temperature caused by them. When the proportion of negative-sequence components increases from 1% to 5%, the maximum difference in the temperature rise generated is about 6 °C. When the proportion of negative-sequence components increases from 6% to 10%, the maximum difference in the temperature rise generated is about 17 °C. However, the temperature rise rate of the latter is about three times that of the former. Given this, it can be found that in actual operation, it is necessary to suppress the generation of negative-sequence components and reduce their amplitude in order to improve the negative-sequence heating phenomenon of the rotor.
Furthermore, in
Figure 11, it can be observed that the different polar damping structures have a significant impact on the negative-sequence loss and heat generation of the rotor. Under the same negative-sequence component, when there are four damping bars on the polar surface, the temperature rise is the smallest, followed by when there are two damping bars, and when there is no damping bar, the temperature rise is the largest, which is about 16 °C higher than when there are two damping bars on the polar surface and about 23 °C higher than when there are four damping bars on the polar surface. Therefore, under the same negative-sequence operating conditions, the rotor negative-sequence heating problem caused by the pole surface undamped winding is the most severe. Hence, in selecting a polar damping structure, from the perspective of negative-sequence heating, the actual structure with multiple damping bars on the polar surface should be preferred, which will significantly reduce the negative-sequence temperature rise in the generator and effectively improve the negative-sequence operating capacity.
Meanwhile, by analyzing the data in
Figure 11, it can be concluded that the highest temperature rise of the rotor occurs when the rotor length is 5050 mm, the negative-sequence component is 10%, and the pole surface is undamped. The maximum temperature rise is 58.7 °C. The increase in the rotor length of 200 mm causes the maximum temperature to rise by about 12 °C. Due to the temperature limit of each component of the rotor under steady-state negative-sequence operating conditions being 130 °C, there is still a large temperature rise margin to meet the requirements of negative-sequence operation.
6. Conclusions
This paper focuses on the online prediction of the rotor temperature rise under negative-sequence operating conditions of large generators. By comparing and analyzing the results of negative-sequence on-site experiments and various numerical experiments involving 300 MW generators, the following conclusions and managerial implications can be obtained:
Firstly, the proposed INGA, which integrates chaotic optimization, can significantly improve the original algorithm’s solution accuracy, convergence speed, local extremum escape ability, and algorithm stability in various aspects. Additionally, its comprehensive performance is also far superior to other similar common swarm intelligence algorithms. The methodological feasibility evidence has been obtained for the online calculation and evaluation of intelligent algorithms in the field of large engineering equipment, providing algorithmic guarantees of fast and accurate online prediction.
Secondly, the negative-sequence temperature-rise prediction model INGA–RPNN can effectively optimize the number of hidden layer nodes, weights, and thresholds of the neural network and has been applied to predict the highest negative-sequence temperature rise in the rotor pole surface of a 300 MW turbo-generator. Field and numerical experiments show that the optimized network model has higher prediction accuracy. This provides a strong reference for the feasibility of artificial intelligence technology in temperature-rise prediction research concerning large power generation equipment.
Thirdly, the maximum temperature rise prediction results are obtained for the 300 MW turbo-generator rotor under three conditions: installing no damping bars, two damping bars, and four damping bars on each pole surface when using different pole damping structures with different proportions of negative-sequence components. The results can indicate the influence of different proportions of negative-sequence current on the heating of the turbo-generator rotor. At the same time, they also can provide a feasible scientific solution to effectively solve the local high-temperature problem under the negative-sequence working condition of the transverse slot. The calculation results point out that the highest temperature rise in the rotor is different when different damping winding structures are used, and different pole damping structures have a significant impact on the rotor heating. This conclusion has important scientific value and practical significance for the structural design and operation monitoring of large power generation equipment of similar types.
Fourthly, the research proves that increasing the length of the rotor can effectively improve the generator’s power and enhance its ability to withstand negative-sequence currents. After increasing the length of the rotor by 200 mm, the output of the improved motor in the paper increases from 300 MW to 350 MW. However, due to the increased rotor length, eddy current losses are more easily formed, so the maximum temperature rise on the rotor surface is slightly increased. Even so, there is still a lot of margin from the limit value of 130 °C. Meanwhile, from the perspective of mechanical torque and motor manufacturing, the rotor length should not be increased too much, and multiple factors, such as the generator output power and equipment safety, should be comprehensively considered. The relevant research results can provide important theoretical references for future generator design, especially for selecting the main structural component sizes, which has high practical value.
Finally, the experimental process and research results also fully demonstrate that the online prediction method can predict and avoid the adverse effects of asymmetric operation in advance, although large equipment still requires increased supervision in daily monitoring management and equipment maintenance. Repeated negative-sequence high-temperature damage will seriously affect the operational efficiency of large equipment. Therefore, the research on intelligent algorithms for the online calculation and evaluation of devices’ operation status urgently needs to be deepened, and the effective improvement and adoption of algorithms will provide a broader research and development space for such problems. At the same time, for the storage and calculation of massive amounts of operational data concerning large power equipment, it is also necessary to strengthen the classification management of relevant databases, providing convenient conditions for online prediction data analysis and feature extraction.
This paper aims to optimize the structural parameters of neural networks using intelligent algorithms for the online prediction of large equipment. The results of the on-site and numerical experiments fully demonstrate the feasibility and effectiveness of the method. Future research will focus on optimizing other shallow neural network parameters based on the INGA, as well as on searching for the optimal deep neural network architecture to solve the problem of asymmetric operation state prediction for large power-generation equipment.


