1. Introduction
With increasing environmental concerns, significant efforts have been made to mitigate pollution caused by combustors in civil aviation engines. In contrast, military aero-engines are designed to operate with high fuel/air ratios, aiming to achieve higher temperatures before reaching the turbine [
1]. For civil aviation engines, it is crucial to maintain an appropriate equivalent ratio in the combustion zone of the combustor to minimize pollutant emissions. Lean fuel combustion, which shows promising potential in reducing NOx emissions, is continuously being developed for civil aviation engine combustors. As a result, the mixture of fuel and gas within the combustor is becoming more uniformly distributed. However, this trend towards uniformity has led to a decline in the ignition performance of the combustor due to the characteristics of lean fuel combustion, large head intake, and low swirl intensity [
2,
3,
4].
In contrast, military aero-engines are typically equipped with combustors designed for rich fuel combustion to increase the fuel/gas ratio and temperature prior to the turbine. However, this rich fuel configuration often leads to an uneven distribution of outlet temperatures. To address this issue, increasing the air ratio in the combustor has been employed as a solution. With the advancements in new-generation advanced combustor designs, it has become imperative to investigate the ignition performance of these novel combustors. The existing research on conventional combustor ignition is no longer adequate to support the research and development of these low-pollution combustors.
In summary, the development of advanced combustors for both civil aviation and military aero-engines is heading in different directions, but the need for effective ignition performance remains a critical research area. As the industry continues to prioritize environmental protection and fuel efficiency, further studies on the ignition performance of combustors will be essential to ensure sustainable and safe aviation.
The ignition process of a combustor involves complex physical and chemical processes that are influenced by the flow structure and fuel and gas distribution within the combustor. Ignition is a long-standing problem in combustor development, and as equipment use boundaries expand, and new aero-engines are developed, the scope of the ignition problem continues to evolve. Researchers both domestically and internationally have made significant strides in studying the ignition propagation process of combustors.
Experimental investigations of the ignition characteristics of swirl combustors have been carried out by Mastorakos et al. [
5,
6,
7,
8,
9]. His research on the ignition process of turbulent non-premixed flame under atmospheric pressure has made significant progress through optical measurement. The study found that the flame propagation direction during the ignition process of turbulent non-premixed flame is greatly influenced by the initial ignition position.
The research found that the easiest area of the combustor to ignite is distributed near the contour of the appropriate chemical ratio. After the formation of the core, it will rotate with the tangential velocity of the flow until the flame becomes stable. When the initial ignition position is at the edge of the reflux zone, the ignition success rate is the highest. However, if the initial ignition position is inside the reflux zone, ignition will not be successful.
Furthermore, the study of lean fuel combustion, chemical-appropriate ratio combustion, and rich fuel combustion revealed that fuel evaporation significantly impacts flame propagation speed. The experiments also showed that the best initial ignition position is located in the maximum radial position of the recirculation zone, and the flame is easier to establish when the initial ignition position is in this region.
Overall, Professor Mastorakos’s research sheds new light on the ignition characteristics of swirl combustors and provides valuable insights for the design and optimization of combustion systems.
The team at Cambridge University, as detailed in [
10,
11,
12,
13,
14], conducted optical measurement research on the high-altitude re-ignition performance of the LDI combustor on the high-altitude ignition test bench of the Luo company. The experimental results showed that successful ignition occurs when the incoming air velocity is low, and fuel is injected at a conical angle. On the other hand, under the condition of failed ignition, the incoming air velocity is high, and there is no large droplet distribution in the fuel.
The team also made acceptable measurements of the position of the igniter head through PLIF, which were consistent with the high-speed camera shooting results. In cases of ignition failure, the fuel was found to be distributed as small droplets under the influence of high-speed incoming flow. Additionally, the team developed a set of image analysis algorithms to obtain the complete ignition development process of the LDI combustor and summarized four typical ignition failure modes: rapid disintegration of the core, flame blowing out, flame splitting, and flame instability.
The team’s findings are significant in understanding the high-altitude re-ignition performance of the LDI combustor and provide valuable insights for the design and optimization of combustion systems for high-altitude applications.
The combustion process in aero-engines is a complex interaction of physical and chemical processes. Therefore, numerical simulation of the ignition performance in combustors has been developing since the end of the 20th century. After nearly 20 years of development, it is now possible to accurately simulate the ignition process in gaseous fuel combustors. However, the relevant models of spray combustion in liquid fuel combustors are still immature and in the exploration stage, as stated in [
15,
16].
Research on numerical simulation of combustor ignition is at the forefront of international studies. Jones et al. [
17] studied the ignition process of an aero-engine combustor using a large eddy simulation method. The ignition energy was simulated using the LES-PDF method by adding energy source terms. The simulation results were in good agreement with the experimental results. The study found that the spark “size” is an important parameter for kerosene fuel combustor ignition.
Overall, the numerical simulation of combustor ignition is a promising research area, providing valuable insights for the design and optimization of aero-engine combustion systems. However, further exploration and development are still required to accurately model the complex interaction of spray combustion in liquid fuel combustors.
Sitte et al. [
18] conducted experiments and numerical simulations to study the ignition characteristics of bluff-body combustors under lean burn conditions. The results obtained through the use of a 5KHZ OH-based self-illumination high-speed camera showed that the success of ignition is due to the propagation of the core to the upstream with the flow, which is similar to the previous findings about non-premixed ignition. The high ignition probability is distributed in the low Karlovitz number (the ratio of local strain rate to extinguishing strain rate in the flow field) and negative velocity region. Taking into account the quenching effect of turbulence, a model was constructed to predict ignition success probability, which was verified to be accurate through both experiments and numerical simulations.
In order to gain a deeper understanding of the ignition process in engine combustors, David et al. [
19] conducted research on combustor ignition through experiments and numerical simulations. They carried out an experimental study of a multi-head combustor at the CORIA Experimental Center and used the CERFACS large eddy simulation method for the numerical simulations. Comparing the numerical simulation results with the experimental results showed that the large eddy simulation was consistent with the experimental results. The large eddy simulation was also able to capture macroscopic phenomena of flame propagation, such as flame front propagation to adjacent swirl nozzles, flame propagation mode (axial and radial), and ignition delay time.
Subramanian et al. [
20] carried out a large eddy simulation of the ignition process of a bluff-body turbulent non-premixed combustor and studied the effect of the ignition position on the ignition process. Lacaze et al. [
21] calculated the complete ignition process at a certain ignition position using a thickened flame model and a one-step chemical reaction of methane. They analyzed the flame nucleus’s formation and propagation process in detail using the energy deposition model and compared the results with the experimental results. They also analyzed the ignition probability distribution obtained from the experiment.
The team led by Lin Yuzhen at Beijing Airlines conducted a series of studies [
22,
23,
24,
25,
26,
27,
28,
29,
30] on the ignition and flameout performance of the central graded radial swirl combustor, investigating the influence of various structural parameters on its ignition performance, including the flow distribution of the radial swirl, the length of the mixing section of the swirl cup sleeve, the swirl number of the swirl, and the axial position of the primary combustion hole. Additionally, the team carried out experimental research on the multi-swirl spray flame ignition process, studying the spark ignition and flame core propagation process in the central graded radial swirl combustor. The ignition process was captured using high-speed photography technology, and the time scale of the successful ignition process was analyzed with the static theory method, revealing the time randomicity of the ignition process. The combustion process was found to consist of three stages: flame propagation, residence, and growth.
Meanwhile, Wang Kaixing [
31] from the Institute of Engineering and Heat at the Chinese Academy of Sciences investigated the influence of ignition position changes on the ignition performance of the centrally staged combustor through numerical simulation. Wang also studied the ignition performance of the centrally staged combustor under high-altitude, low-temperature, and low-pressure environments through high-speed camera experiments.
While numerous numerical simulations have been conducted on the ignition process of combustors, the majority of them have focused on the combustion of gaseous fuels. Presently, numerical simulation research on gaseous fuel combustor ignition has progressed to encompass full annular combustors. However, the corresponding models for spray combustion are still in their early stages of development, and research on the ignition process of spray combustion remains exploratory. Furthermore, although various combustion models have been applied to numerical simulations of combustor ignition processes to some extent, the flame surface model and the dynamic thickened flame surface combustion model have gained widespread use in practical numerical calculations of combustor ignition. This is primarily due to their relatively low computational complexity and acceptable accuracy, which meet the engineering requirements.
This paper takes a center-staged double-swirl combustor as the research object. For a double-swirl combustor, the swirl intensity of the secondary flow is a key structural parameter that affects its combustion performance. The secondary flow structure at the head of the double-swirl combustor is the main characteristic structure that forms the recirculation of the combustor. The flow field inside the combustor is the most critical factor that affects the ignition performance of the combustor. Therefore, in order to study the effect of the change in the swirl intensity of the secondary flow on the ignition performance of the combustor, this paper uses large eddy simulation and the dynamic thickened flame surface model to study the ignition development process of the combustor, obtain the law of the effect of the change in the swirl intensity of the secondary flow on the ignition performance of the combustor, and obtain the mechanism of the effect of the swirl intensity of the secondary flow on the ignition process of the combustor.
2. Materials and Methods
2.1. Physical Model
A double-swirl combustor head scheme is designed based on a double-swirl structure, as depicted in
Figure 1. The head structure comprises a primary stage and a pilot stage, with the pilot stage located at the center consisting of an axial swirl and a convergence channel. The fuel nozzle is positioned at the center of the pilot stage, and the nozzle outlet is flush with the throat position. The primary stage is situated at the periphery of the pilot stage and is composed of axial cyclone blades and a convergence channel. The double-swirl combustor scheme includes the center-stage double-swirl head, the head flange, and a 100 mm confined space with a square structure. Downstream of the combustor head outlet, there is a 30° convergence channel at 125 mm, and the final height of the confined space outlet is 55 mm.
The blade angle of the primary stage in the double-swirl combustor is set to 45°, and the rotation direction of both the primary and pilot stages is the same. The effect of the pilot stage swirl intensity on the ignition propagation process of the combustor is investigated while keeping the primary stage unchanged. Four different pilot stage swirl angles are considered, namely 30°, 35°, 40°, and 45°, with corresponding swirl intensities of 0.43, 0.52, 0.61, and 0.73, respectively. It is worth noting that the swirl intensity in this study refers to the geometric swirl intensity (
Sn) [
32], which is calculated using the following formula:
where
Z is the ratio of swirl hub diameter to flow path outer diameter, and
is the swirl angle.
This article also focuses on the design and manufacturing of a rectangular test piece for conducting experiments on the non-reacting flow field and ignition propagation process, and it validates the numerical simulation method used in this article based on experimental results. The experiments on the characteristics of the center-staged dual-swirl flow field and the ignition propagation process were conducted on the test bench at Northwestern Polytechnical University, and the experimental system is shown in
Figure 2 [
33]. The test bench consists of an air supply system, a premix section, a measurement section, a visualization test section, a PIV system, and a high-speed camera. In the premix section, 6 porous rakes were used to evenly distribute the tracer particles in the mainstream air, and the tracer particles and mainstream air were fully mixed before entering the visualization test section through the measurement section. Pressure probes and Pt100 thermocouples were installed in the measurement section to measure the pressure and temperature at the inlet of the swirlers. The inlet pressure was measured using a Rosemount pressure transmitter with an accuracy of ±0.5%, and the measurement accuracy of the Pt100 thermocouple was ±0.1%.
The flow field experiment was conducted using a 2D PIV system from German company Lavision, which includes a solid particle generator, Nd:YAG double-pulse laser (Vlite-200), light guide arm, optical components, CCD camera (Image SX 4M), synchronization controller, and post-processing software. In the ignition propagation process experiment, a Phantom TMX-6410 high-speed camera was used, and the camera resolution selected for the experiment was 750 × 800, with a maximum shooting frequency of 50 kHZ at this resolution, and a frequency of 2 kHZ was selected for this article. The high-speed camera was placed on the side of the combustion chamber, with the lens perpendicular to the glass window and the focal plane selected as the central section of the combustion chamber, which provided better observation and recording of the transient ignition propagation process.
In order to verify the ignition and propagation process of the combustion chamber at ambient temperature and pressure, the experiments in this article were conducted under normal temperature and pressure conditions. The experiments on non-reactive flow characteristics were conducted at an airflow rate of 76 g/s, a temperature of 300 K, and an operating pressure of 104 kPa. The reason for choosing this operating condition is that this article studied a total pressure loss of 3.3% for the combustion chamber design condition. In order to investigate the basic flow characteristics of the combustion chamber, the experiment was conducted at the same Mach number as the design condition. Jet-A aviation kerosene was chosen as the fuel for the ignition and propagation process experiment, and the equivalence ratio of the combustion chamber was chosen as 0.58 for the study.
2.2. Numerical Method
The RANS method is used to obtain the cold time-averaged flow characteristics of the combustor. A simple algorithm couples the pressure and velocity, and the second-order upwind scheme discretizes the energy equation. Based on the obtained cold flow field, the non-reactive instantaneous flow field of the combustor before ignition is obtained [
34]. The turbulent sub-grid model adopts the WALE model, which considers the effect of wall viscosity on the flow. Due to the numerous combustion modes that occur under the interaction of turbulent flow and chemical reaction during the ignition process, this paper selects the dynamic thickening flame surface model to simulate flame propagation in the combustor. The simulations were performed using Ansys Fluent.
The filtered Navier–Stokes equation can be expressed as:
In order to close the governing equation, this paper selects the Algebraic Wall-Modeled LES model (WMLES). It uses the RANS method to simulate the flow field inside the boundary layer, while it uses the LES method to simulate the flow field outside the near wall area. The eddy viscosity is defined as:
The discrete phase model follows the Euler–Lagrange method, treating the dispersed phase as a continuous phase and solving the Navier–Stokes equations. The discrete phase is solved by tracking a large number of particles, bubbles, or droplets during the computation of the flow field, and there is an exchange of momentum, mass, and energy between the discrete phase and the fluid.
The important assumption of the Euler–Lagrange method is that the volume fraction of the discrete phase is relatively low, and the interactions between particles can be ignored. In the computation of the continuous phase, the trajectories of particles or droplets are calculated individually at specified intervals. The motion trajectories of discrete particles are predicted by integrating the force balance on particles, bubbles, or droplets in the Lagrangian reference frame. This force balance ensures that the particle inertia is equal to the force acting on the particle, and the calculation formula is as follows:
where
is the velocity of the fluid phase,
is the velocity of the particle,
is the density of the fluid,
ρp is the density of the particle, and
represents the additional force per unit particle mass.
Electric spark or discharge ignition can effectively convert electrical energy into thermal energy in a relatively small volume. In the actual startup process of aviation engines, the discharge process of the ignition system is very short compared to the combustion reaction in the combustion chamber, and the discharge energy of the ignition system is much smaller than the heat released by fuel combustion. For the simulation of the ignition source, theoretically, it only needs to release a certain amount of energy at a fixed position and time. This can be achieved by adding a source term to the energy equation to simulate the discharge process of the ignition system. The source term model equation is as follows [
35]:
In the equation, represents the heat release rate of the ignition source model, and represents the ignition energy, and in this paper, we have chosen 12 J, which is the same as the experimental equipment. represents the ignition delay time, and in this paper, we have taken it to be 0.16 ms. represents the radius of the flame kernel, and in this paper, we have taken it to be 5 mm. (, , ) represents the initial position of the ignition, t represents the calculation duration, and represents the ignition start time.
The ignition process is a complex turbulent combustion process that involves various channels where chemical reaction affects turbulent characteristics, and turbulence affects the chemical reaction rate. In addition, multiple combustion modes coexist in the combustion process. To simulate such a process, this paper employs a thickened flame model suitable for the coexistence of multiple combustion modes in large eddy simulations of the ignition process.
The thickened flame model was proposed by Butler et al. The dynamic thickening flame model divides the combustion area by constructing the flame detection function
Ω. This function ensures that the thickening coefficient is only effective at the position of the flame surface, and
F = 1 at the position far from the flame surface. By increasing the diffusivity and proportionally reducing the reaction rate, it is possible to artificially increase the thickness of a laminar flame without altering its velocity. The thickened flame can then be adequately resolved on a coarse grid, while still capturing the correct laminar flame velocity. The detection function is defined by the following formula:
where
is the spatial filtering absolute value of the reaction rate,
β Is a constant, and the default value is 10.
The thickening factor
F is defined as:
where ∆ is the grid scale,
δ Is the laminar flame propagation speed, and
N is the number of grid nodes, which is taken as 10 in this paper.
However, due to the increase in flame thickness, the effect of small-scale fluctuation will be weakened, so the efficiency function
E is introduced to balance.
where
is sub-grid scale velocity fluctuation, α is the model constant, and
is the laminar flame propagation speed.
The discrete phase model (DPM) is used to numerically simulate the fuel atomization in the combustion chamber. The DPM follows the Euler–Lagrange method, where the fluid phase is treated as a continuous phase, and the N-S equation is solved, while the discrete phase is solved by tracking a large number of particles, bubbles or droplets during the calculation of the flow field, and there is an exchange of momentum, mass, and energy between the discrete phase and the fluid. Since the volume of fuel droplets in the combustion chamber is relatively small, the use of the DPM is more suitable for simulating the fuel atomization process in the combustion chamber.
In the central staging lean burn combustion chamber, only the pilot stage is used for ignition, so this process only involves the injection form of the pilot fuel from the centrifugal nozzle, and this article uses the Cone injection model to simulate the pilot fuel injection. The Cone injection model uses a solid cone model to simulate a solid cone-shaped spray. Based on the structure and performance of the real pilot fuel nozzle, parameters such as the nozzle coordinates, injection direction, nozzle diameter, spray cone angle, injection velocity, fuel flow rate, fuel temperature, and representative droplet size distribution conforming to the R-R distribution are set in the model to simulate the fuel mist field generated by the pilot fuel nozzle.
2.3. Grid Division
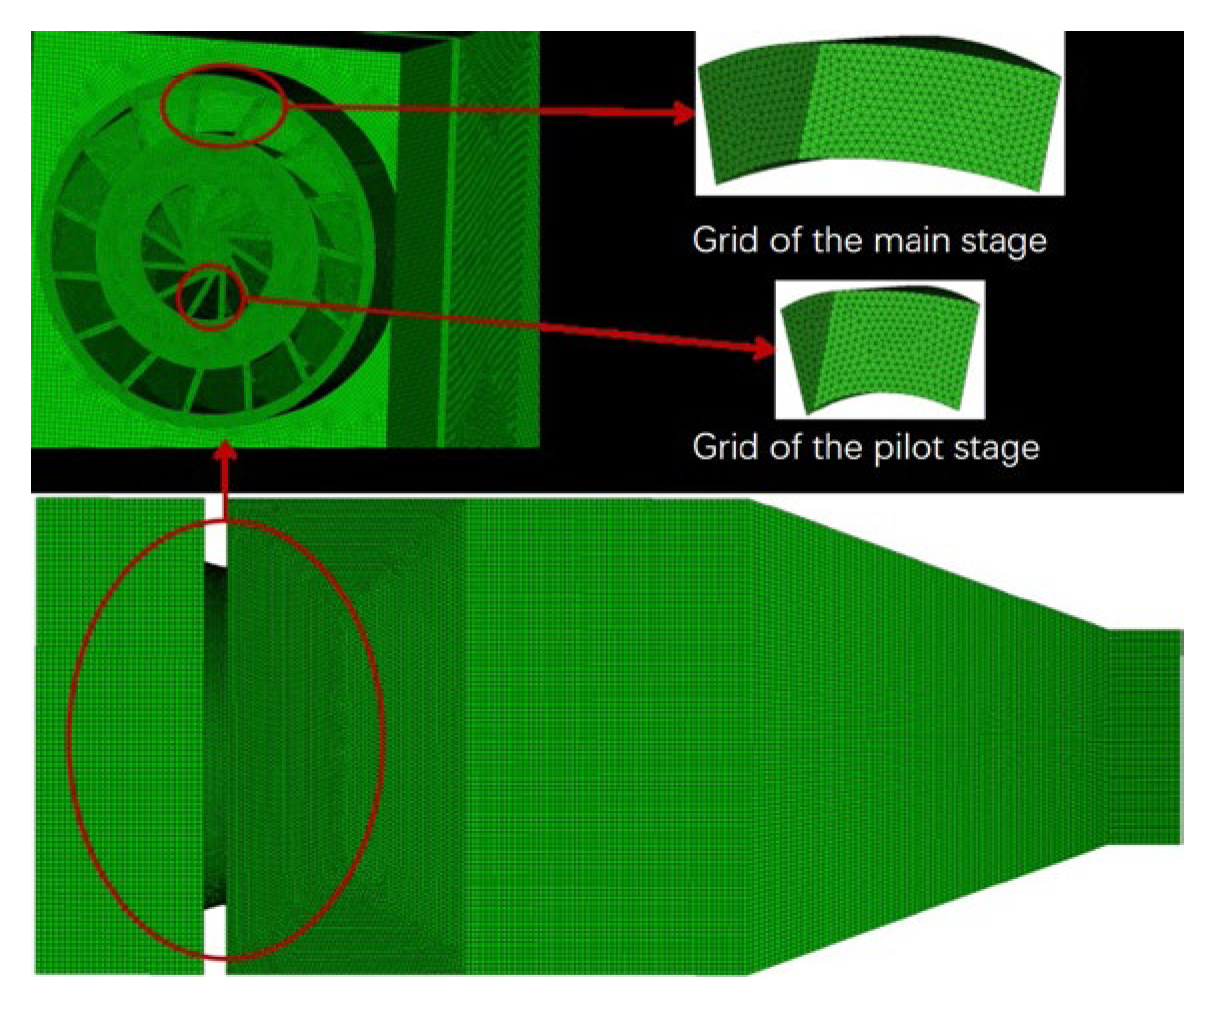
To improve mesh quality and ensure mesh uniformity in the transition region from small to large scales, a mixed mesh of tetrahedral and hexahedral elements is employed in this paper. Tetrahedral mesh is used in regions with large velocity gradients at the head of the combustor and upstream of the combustor, while hexahedral mesh is used in the remaining regions with small velocity gradients within the combustor. Through grid independence validation, a total of 10 million grids are generated, with a minimum grid size of 0.4 mm, and a Jacobian ratio of grid quality greater than 0.3. Grid non-inertia verification is performed to validate the grid quality.
Figure 3 illustrates the grid division of the combustor.
In large eddy simulation, the grid scale directly affects the analytical capability of turbulence inside the combustion chamber. This article validates the grid size based on the Pope criterion [
36], which characterizes the percentage of turbulent energy that cannot be directly analyzed inside the combustion chamber.
M = 0 indicates analytical accuracy equivalent to DNS method, while
M = 1 indicates analytical accuracy equivalent to RANS method. The calculation formula for Pope’s criterion is shown below:
where
represents the sub-grid-scale turbulent energy, and
represents the directly analyzable turbulent energy.
Analyzing the proportion of sub-grid-scale turbulent energy at the central section of the combustion chamber, the
M value at the outlet position of the combustion chamber head is approximately 0.2. The
M values at the central recirculation zone and near-wall positions, which are the focus of this study, are all less than 0.1. Reference [
36] states that when the
M value is less than 0.2, 80% of the turbulent energy inside the combustion chamber can be analyzed, which satisfies the computational requirements of large eddy simulation. This indicates that the grid size division in this study is reasonable. The distribution of sub-grid turbulence kinetic energy ratio in the X = 0 plane of the combustor is shown in
Figure 4.
2.4. Verification of Numerical Method
The large eddy simulation (LES) method is employed to simulate the cold flow characteristics of the combustor and to obtain the transient flow field before ignition. The boundary conditions are set as follows: at the inlet, the air flow rate is 76 g/s, the temperature is 300 K, and the working pressure is 104 kPa; for fuel injection, the Cone injection model with a flow rate of 3 g/s is selected; at the outlet, a pressure outlet boundary condition is applied.
To validate the accuracy of the numerical simulation method adopted in this study, the axial velocity distribution under cold conditions is obtained using both the LES method and particle image velocimetry (PIV) experimental method. The radial distribution curves of the axial velocity at different axial positions are compared, and the results are shown in
Figure 5. The numerical simulation and experimental study adopted the same model, with a pilot swirler angle of 35°. It can be observed that the axial velocity distribution curve obtained from the simulation is in good agreement with that obtained from the experiment, indicating that the numerical simulation method can accurately simulate the size and position of the velocity peak as well as the width of the central recirculation zone, thereby providing a more precise simulation of the cold flow characteristics of the combustor.
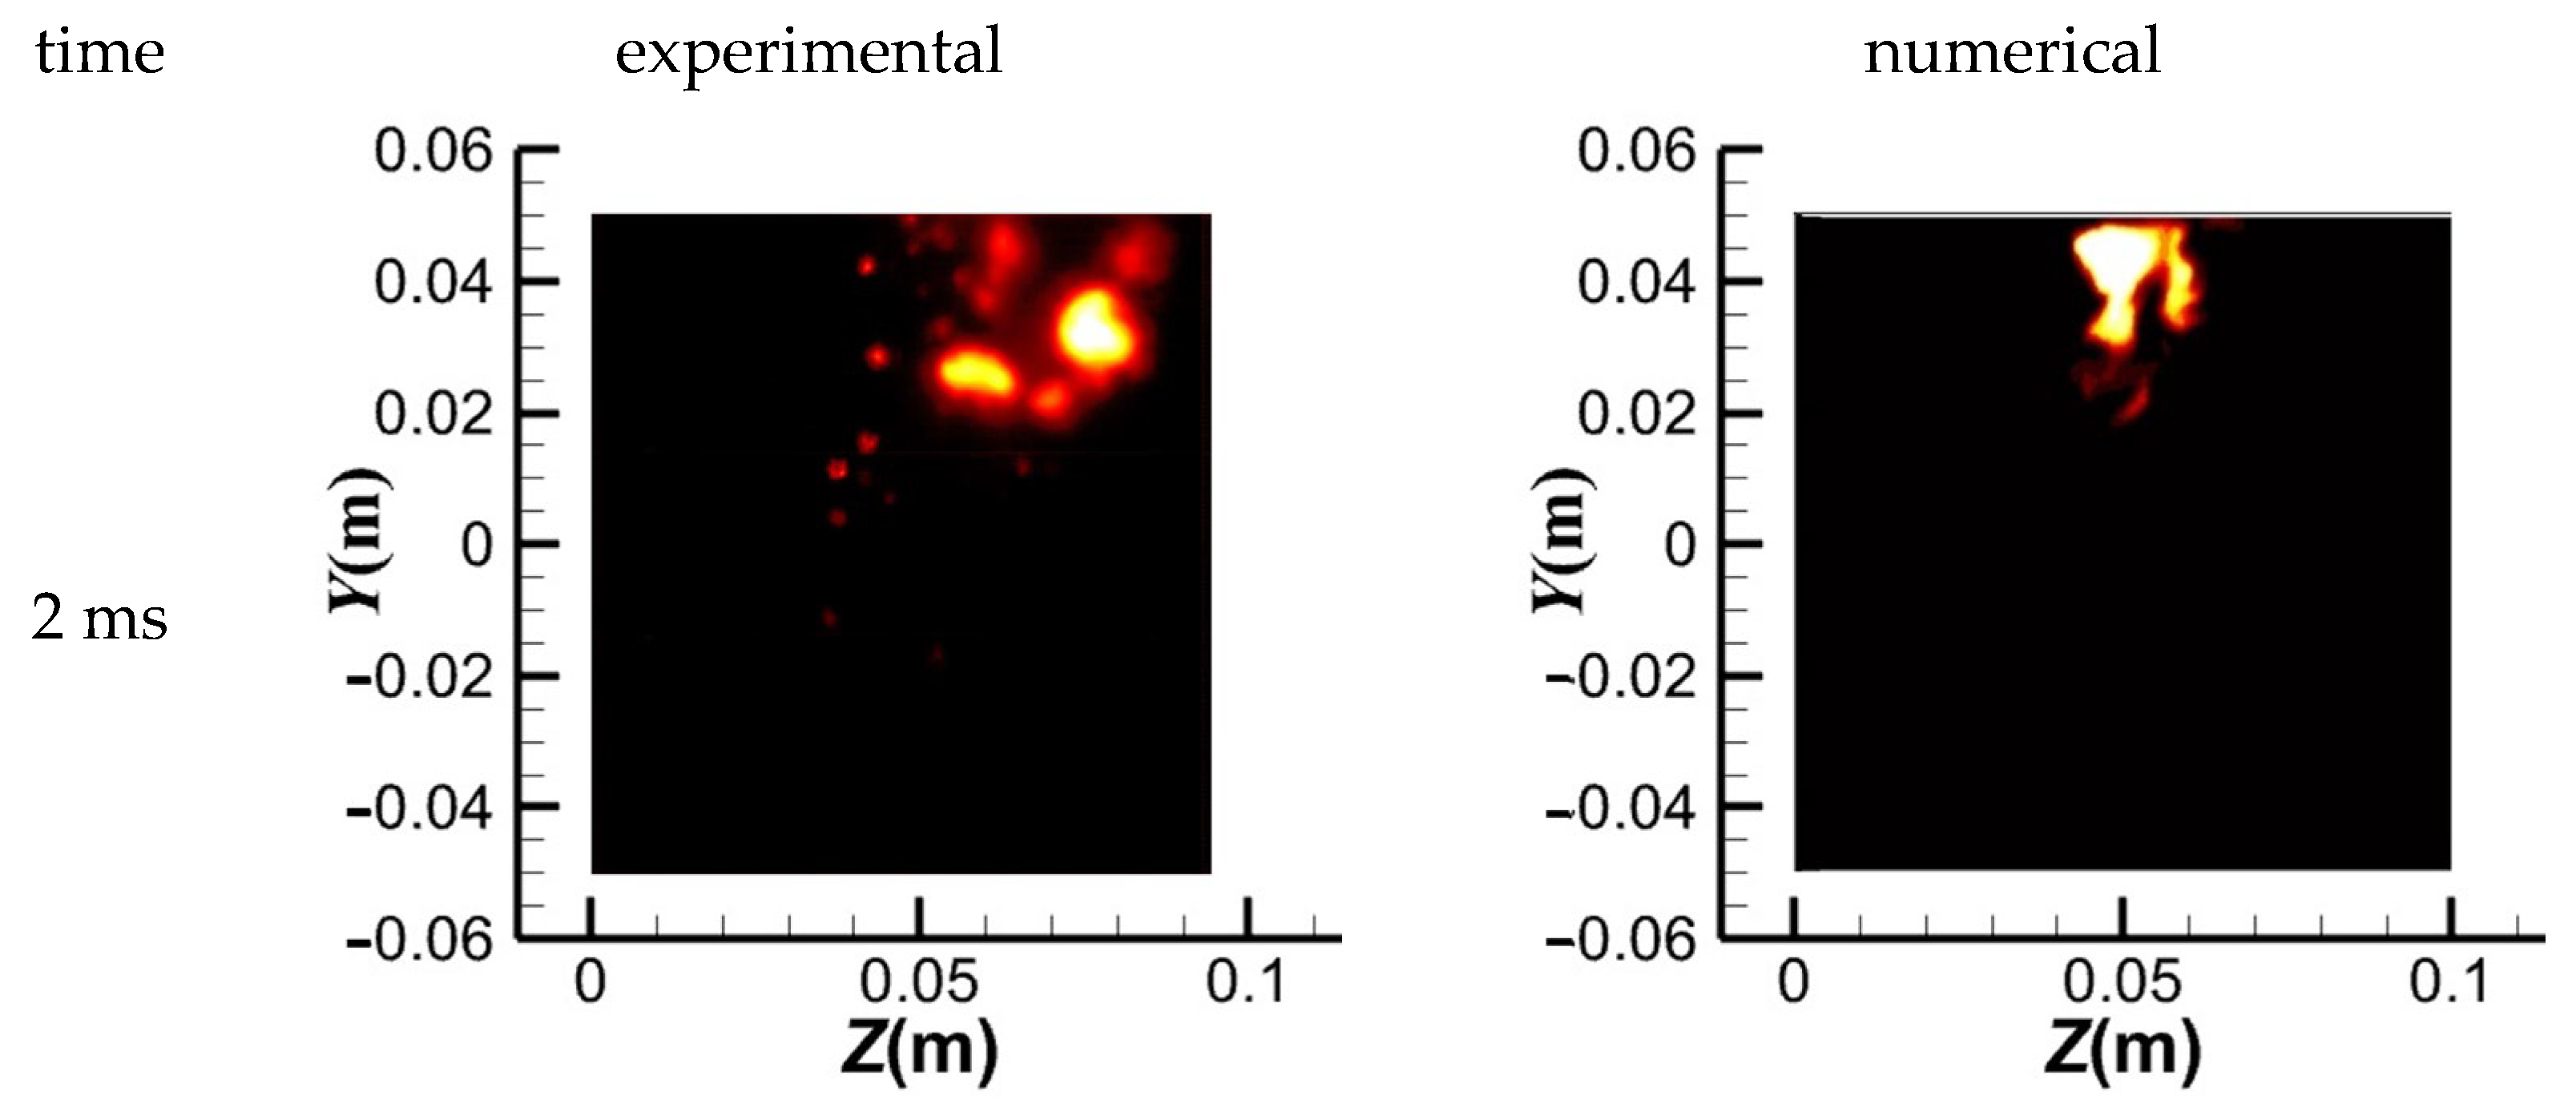
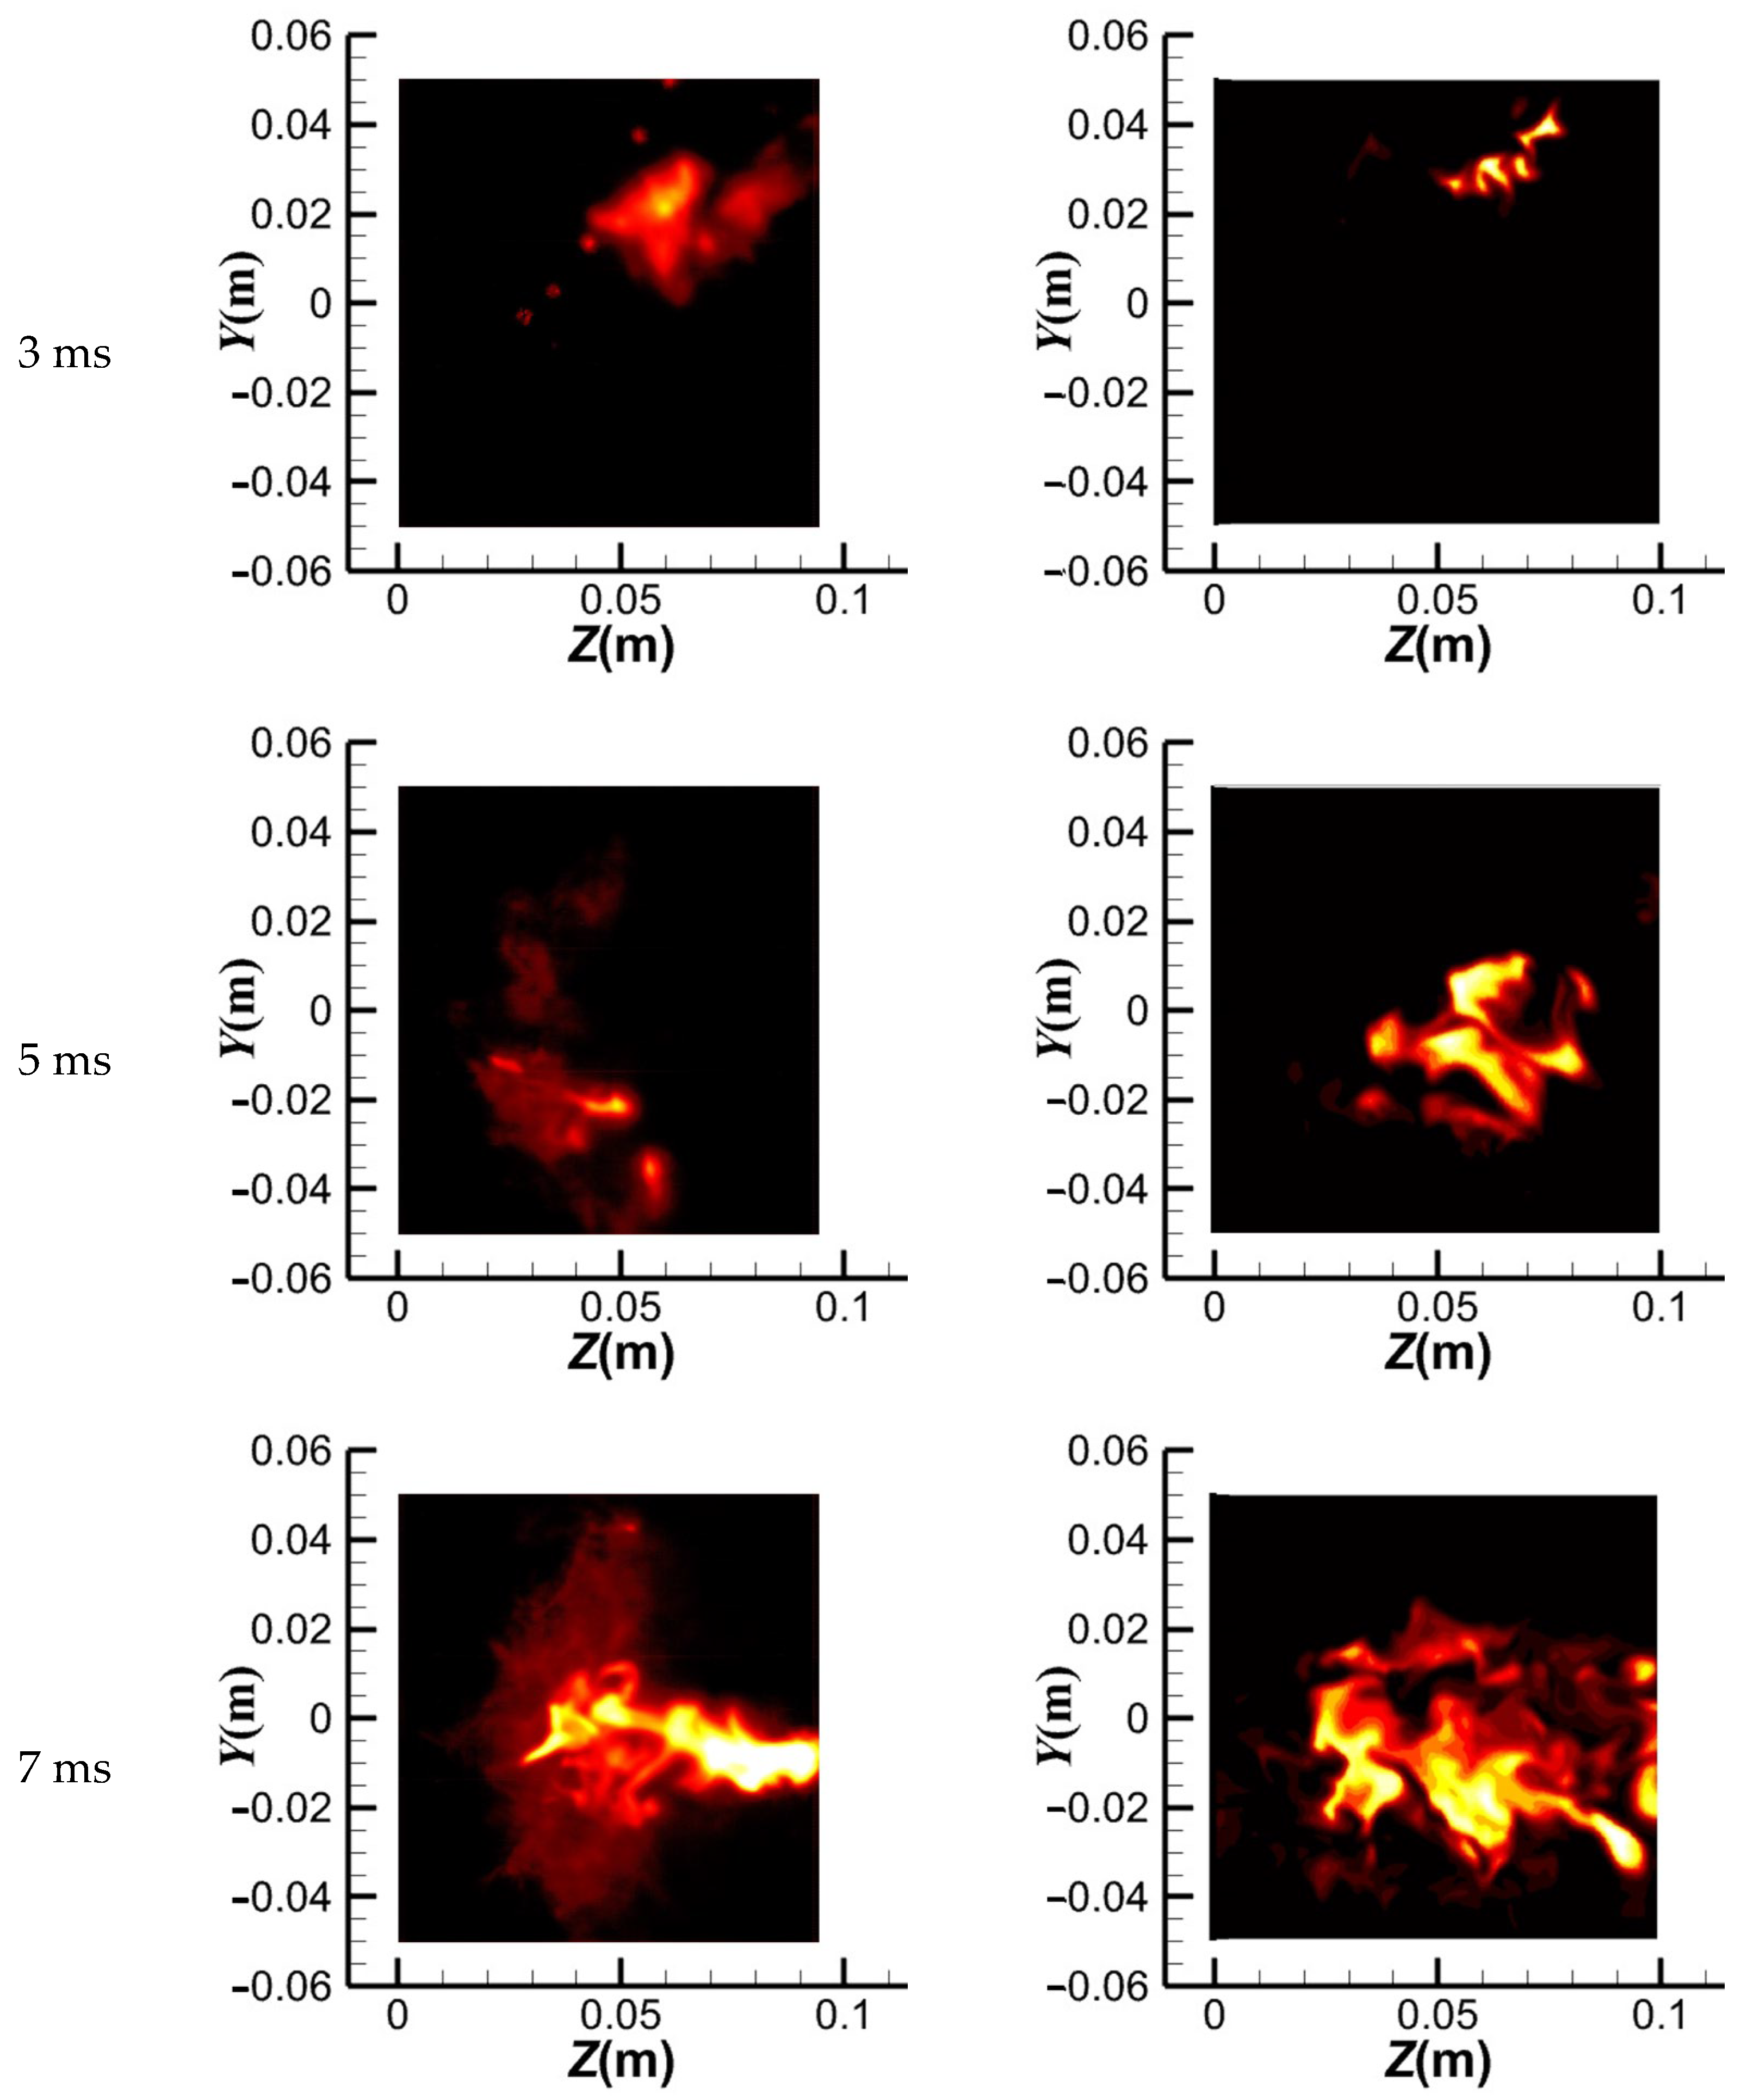
Figure 6 compares the experimental and numerical results of the combustion’s ignition propagation process with a pilot stage swirl angle of 35 degrees. The experimental results displayed in
Figure 6 illustrate the intensity of light in the central cross-section. Conversely, the numerical simulation results reflect the temperature distribution in the central cross-section. The ignition propagation process in the combustor’s central section was photographed at 20,000 frames per second within 12 ms of producing the combustion core. As shown in the figure, the numerical simulation results are in good agreement with the experimental results. Therefore, the numerical simulation method used in this paper can accurately predict the ignition propagation process.
3. Results and Discussion
Numerical simulations of the cold flow field, fuel concentration distribution, and combustor ignition propagation process have been conducted for four different head schemes (S30, S35, S40, and S45) with pilot mode swirl angles of 30°, 35°, 40°, and 45°, respectively. The influence of the pilot mode swirl angle on the flow field and fuel concentration distribution within the combustor has been investigated, and the relationship between these factors and the ignition propagation process has been analyzed.
3.1. Basic Flow Characteristics of the Combustor
The time-averaged flow field of the combustor over four periods (20 ms) was analyzed by monitoring the axial velocity change at the center of the combustor (0,0,50) and determining its approximate period to be 5 ms.
Figure 7 presents the program and streamlined superposition diagram of the axial velocity distribution at the center section of the combustor for different angles of the pilot mode swirl blades. To highlight the impact of the pilot mode swirl angle on the combustor’s flow field, the axial velocity on the central axis of the combustor was compared and analyzed, and the 0 velocity line at different swirl angles was examined. The figure shows a comparison of the axial velocity at the center axis of the combustor for different pilot stage swirl angles.
The results depicted in
Figure 7 indicate that the flow field at the center section of the combustor is similar for different swirl angles of the pilot mode. Specifically, there is a central recirculation zone at the outlet of the pilot mode cyclone, a lip recirculation zone between the primary and pilot modes, and an angular recirculation zone between the head and the wall. When the swirl angle of the pilot mode is increased from 30° to 35°, the length and width of the central recirculation zone in the combustor will increase to some extent. At a swirl angle of 35°, the width of the central recirculation zone has reached its maximum, which is the same as the height of the confined space. Further increases in the swirl angle of the pilot mode do not affect the width of the central recirculation zone, but the expansion angle of the recirculation zone near the outlet of the combustor head will continue to increase, as seen from the cloud diagram of the axial velocity distribution at the central section. Furthermore, as the swirl intensity of the pilot mode increases, the maximum axial negative velocity at the center of the combustor also increases, as observed from the axial velocity of the centerline at different axial positions.
To further compare the effect of the swirl intensity of the pilot stage on the flow field of the combustor, this study analyzed the axial velocities at four axial positions of the central section, namely 10 mm, 20 mm, 40 mm, and 60 mm.
Figure 8 presents the comparison of the axial velocity distribution along a radial direction at these positions.
After comparing the axial velocity under different swirl intensities of the pilot stage, it can be observed that at the Z = 10 mm position, the axial velocity of the combustor exhibits a “four-peak” distribution in the radial direction downstream of the primary and pilot stage outlets. The peak velocity at the outlet of the pilot mode cyclone decreases significantly with an increase in the pilot swirl angle, while the peak velocity at the main mode outlet changes slightly. As the recirculation zone develops further downstream, it becomes apparent that the S30 combustor has the smallest central recirculation zone width, while the other three schemes have similar widths. At the Z = 20 mm position, the axial velocity of the combustor still exhibits a “four-peak” distribution, but the lip recirculation zone size decreases. At this axial position, except for the S30 combustor, the other three combustors’ lip recirculation zones disappear. At the Z = 40 mm position, the axial velocity of the combustor exhibits a “double peak” distribution in the radial direction due to the primary and pilot modules’ swirling air converging at this position, forming higher axial velocity near the wall. At the Z = 60 mm position, the central recirculation zone width reaches its maximum.
3.2. Fuel Concentration Distribution in the Combustor
The fuel atomization and spatial distribution in a simple centrifugal nozzle with air-assisted atomization as the pilot model nozzle was investigated. The fuel atomization effect and spatial distribution of this atomization method are affected by various factors such as fuel supply pressure, gas/liquid ratio, and Weber number. The Weber number is the ratio of inertial force to surface tension, and it determines the relative impact of the tangential velocity of swirling air on the liquid film and the surface tension of the liquid film itself.
Under the same research conditions, when the swirl angle of the pilot mode increases, the tangential velocity of the pilot mode swirl air increases, which leads to an increase in the Weber number of the pilot mode fuel/air atomization. This increase is beneficial for reducing the fuel SMD in the combustor. To analyze the spatial distribution of fuel droplets in the combustor, the paper employs the discrete phase model.
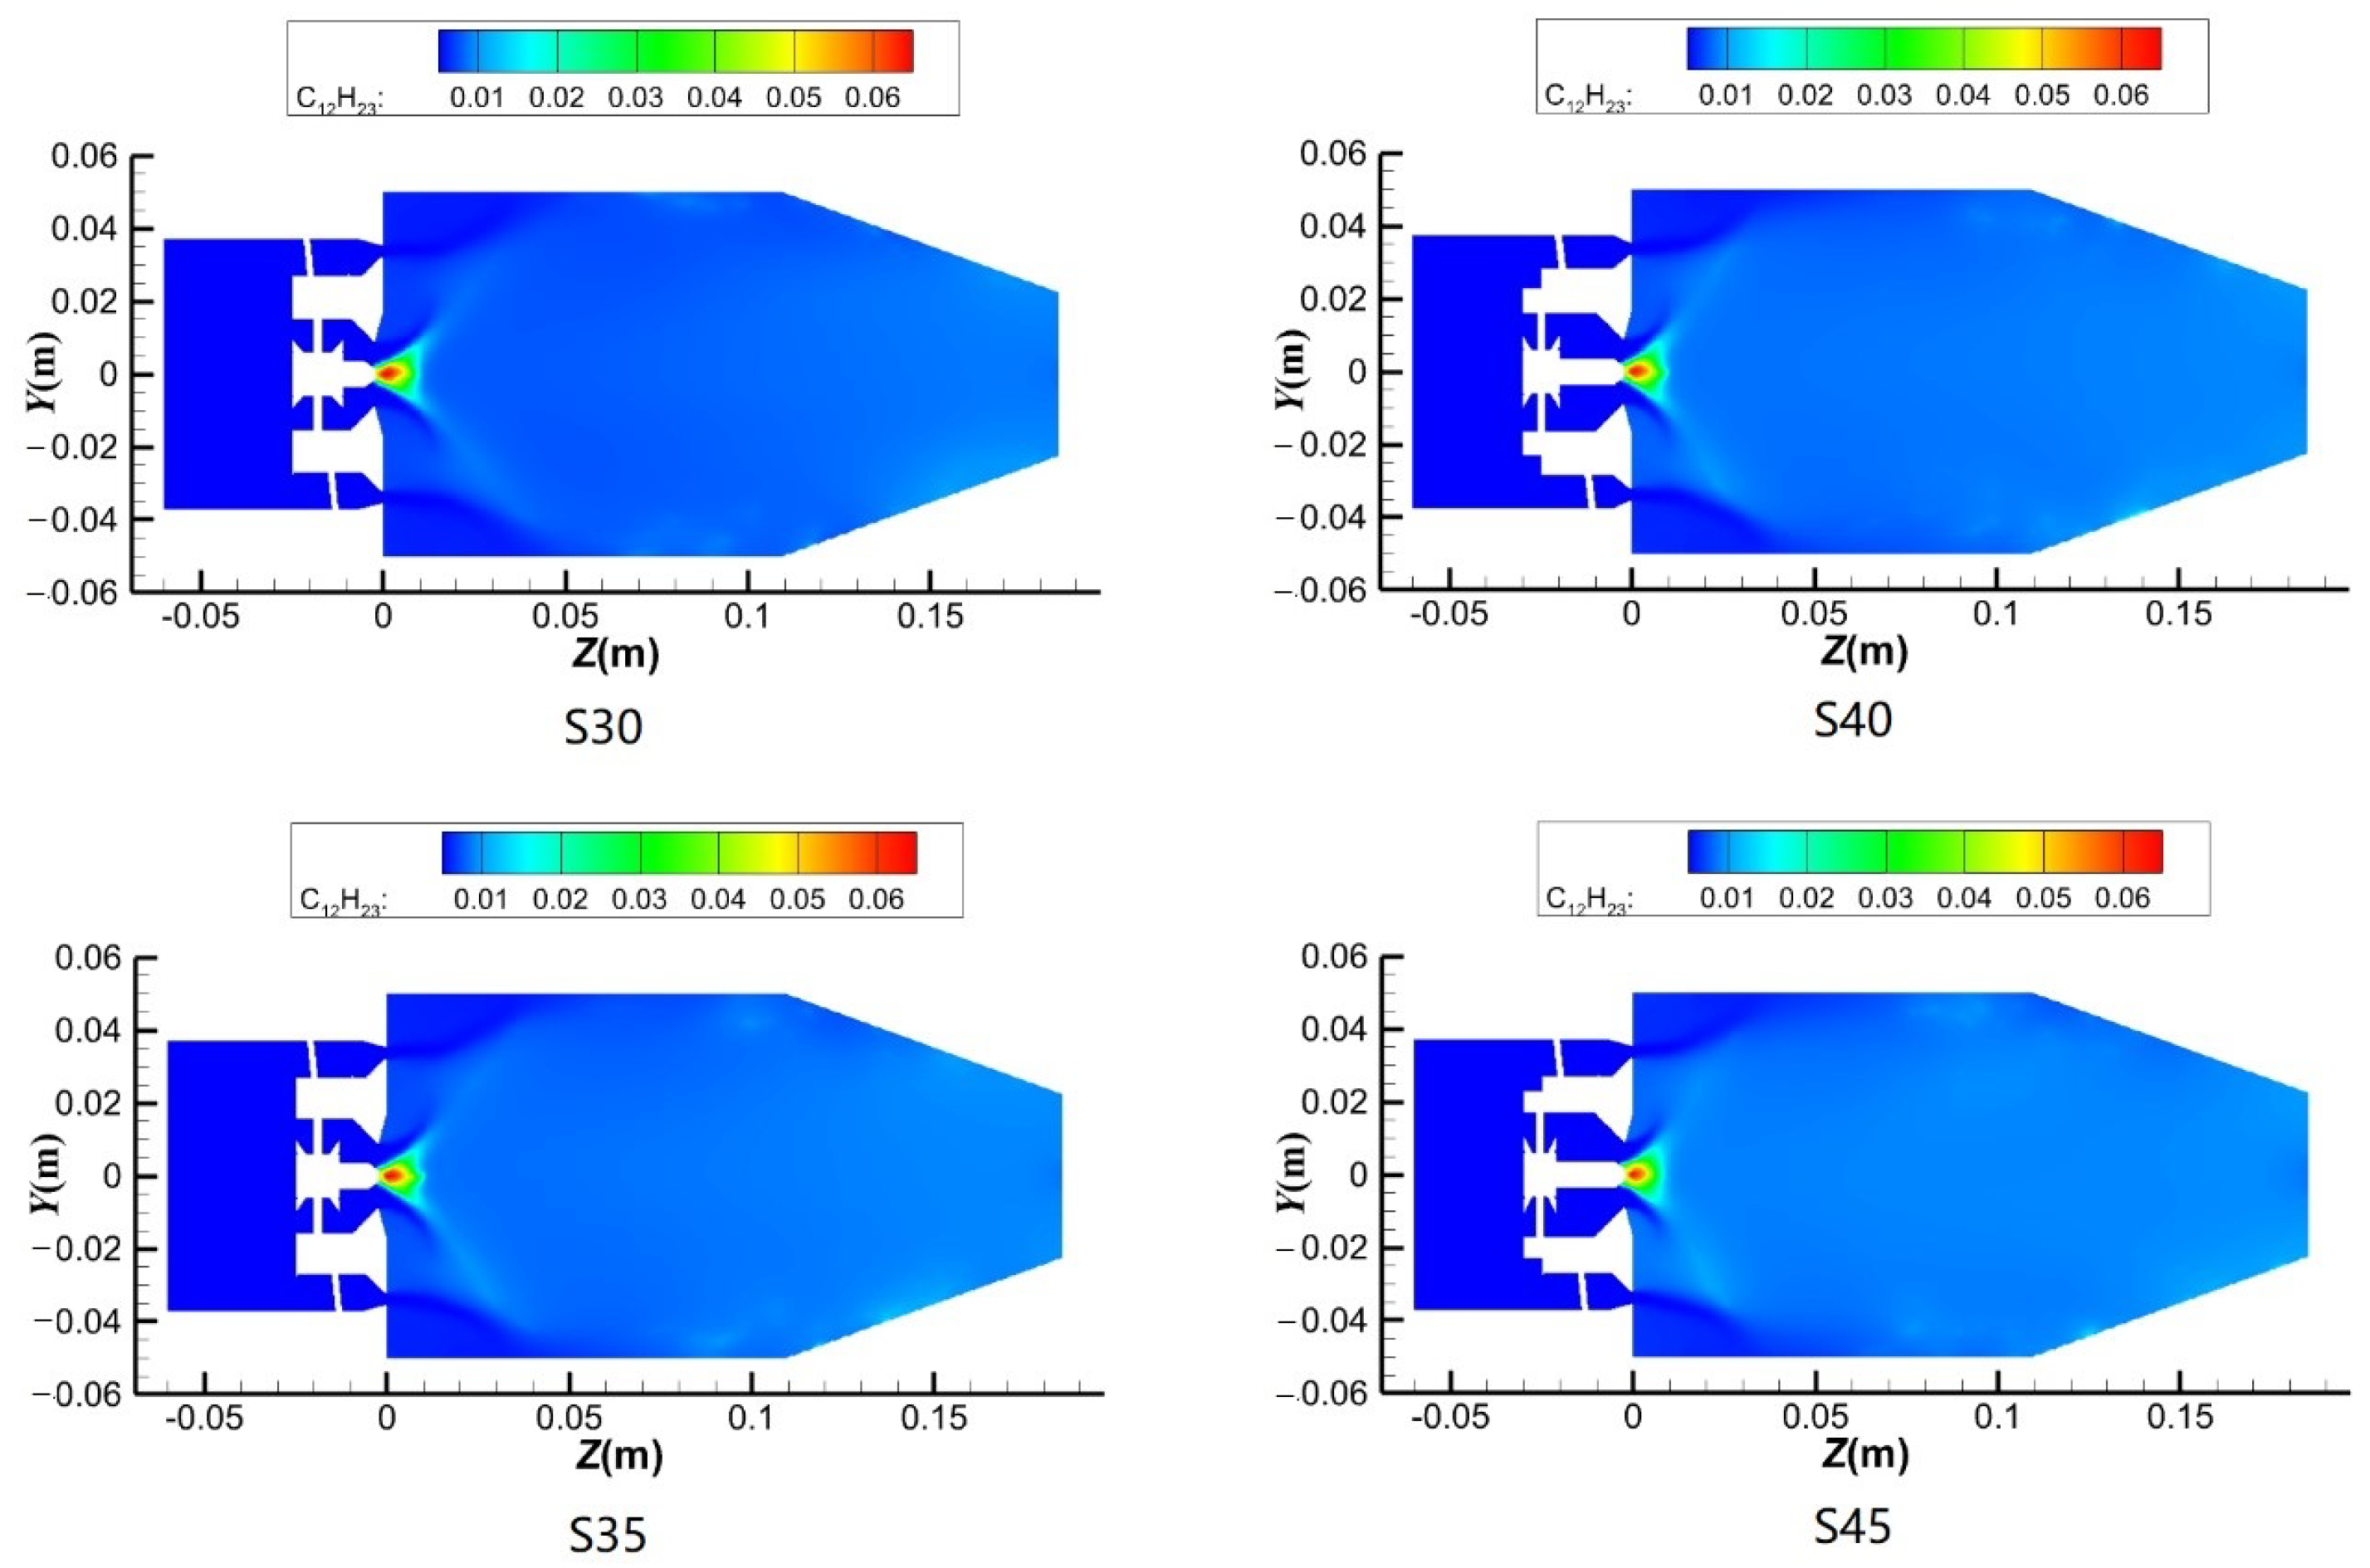
Figure 9 shows the spatial distribution of fuel droplets in the combustor under different secondary swirl angles. The figure shows the mass fraction of fuel. It can be observed that as the swirl angle of the pilot mode increases, the fuel is more influenced by the velocity distribution at the outlet of the pilot mode in the combustor. However, the droplets in the combustor are mainly concentrated within the 10 mm conical range at the outlet of the pilot mode under all swirl angles of the pilot stage. As the swirl angle increases, the fuel distribution cone angle gradually increases, and the droplets become more concentrated in the combustor.
Although the change in the swirl intensity of the pilot stage affects the Weber number of the fuel/air atomization of the pilot stage and, consequently, the SMD in the combustor, the spatial distribution of the fuel droplets is less affected by the swirl angle of the pilot stage. Only the spatial distribution cone angle of the droplets expands slightly within the conical range of 10 mm at the outlet of the pilot stage.
Based on these findings, the paper then analyzed the fuel concentration distribution along both the radial and axial propagation paths of the combustor igniter in four different schemes. The axial propagation path runs from the axial igniter position (0,0,47) to the combustor head outlet (0,0,0), while the radial propagation path runs from the igniter position (0,50,47) to the combustor centerline (0,0,47). The results are presented in
Figure 8, where the local initial 200 points are the axial position, and the remaining points represent the radial position.
As
Figure 10 illustrates, the fuel concentration in the combustor increases gradually in the radial direction as the swirl angle of the pilot mode increases. In the axial direction, the fuel concentration in the combustor increases gradually between the axial positions of 15 mm and 47 mm as the swirl angle of the pilot mode increases. However, within 15 mm of the combustor head, the fuel concentration in the combustor decreases with the increase in the swirl angle of the pilot mode.
3.3. Analysis of the Flame Propagation Process in the Combustor
Based on large eddy simulation of the cold flow field and fuel mist field, this paper investigates the flame propagation process in the combustor for different pilot swirl intensities over a total of 15 ms. To intuitively illustrate the impact of pilot swirl intensity on the ignition propagation process, this paper presents a three-dimensional temperature contour of the combustor at different time intervals following spark discharge.
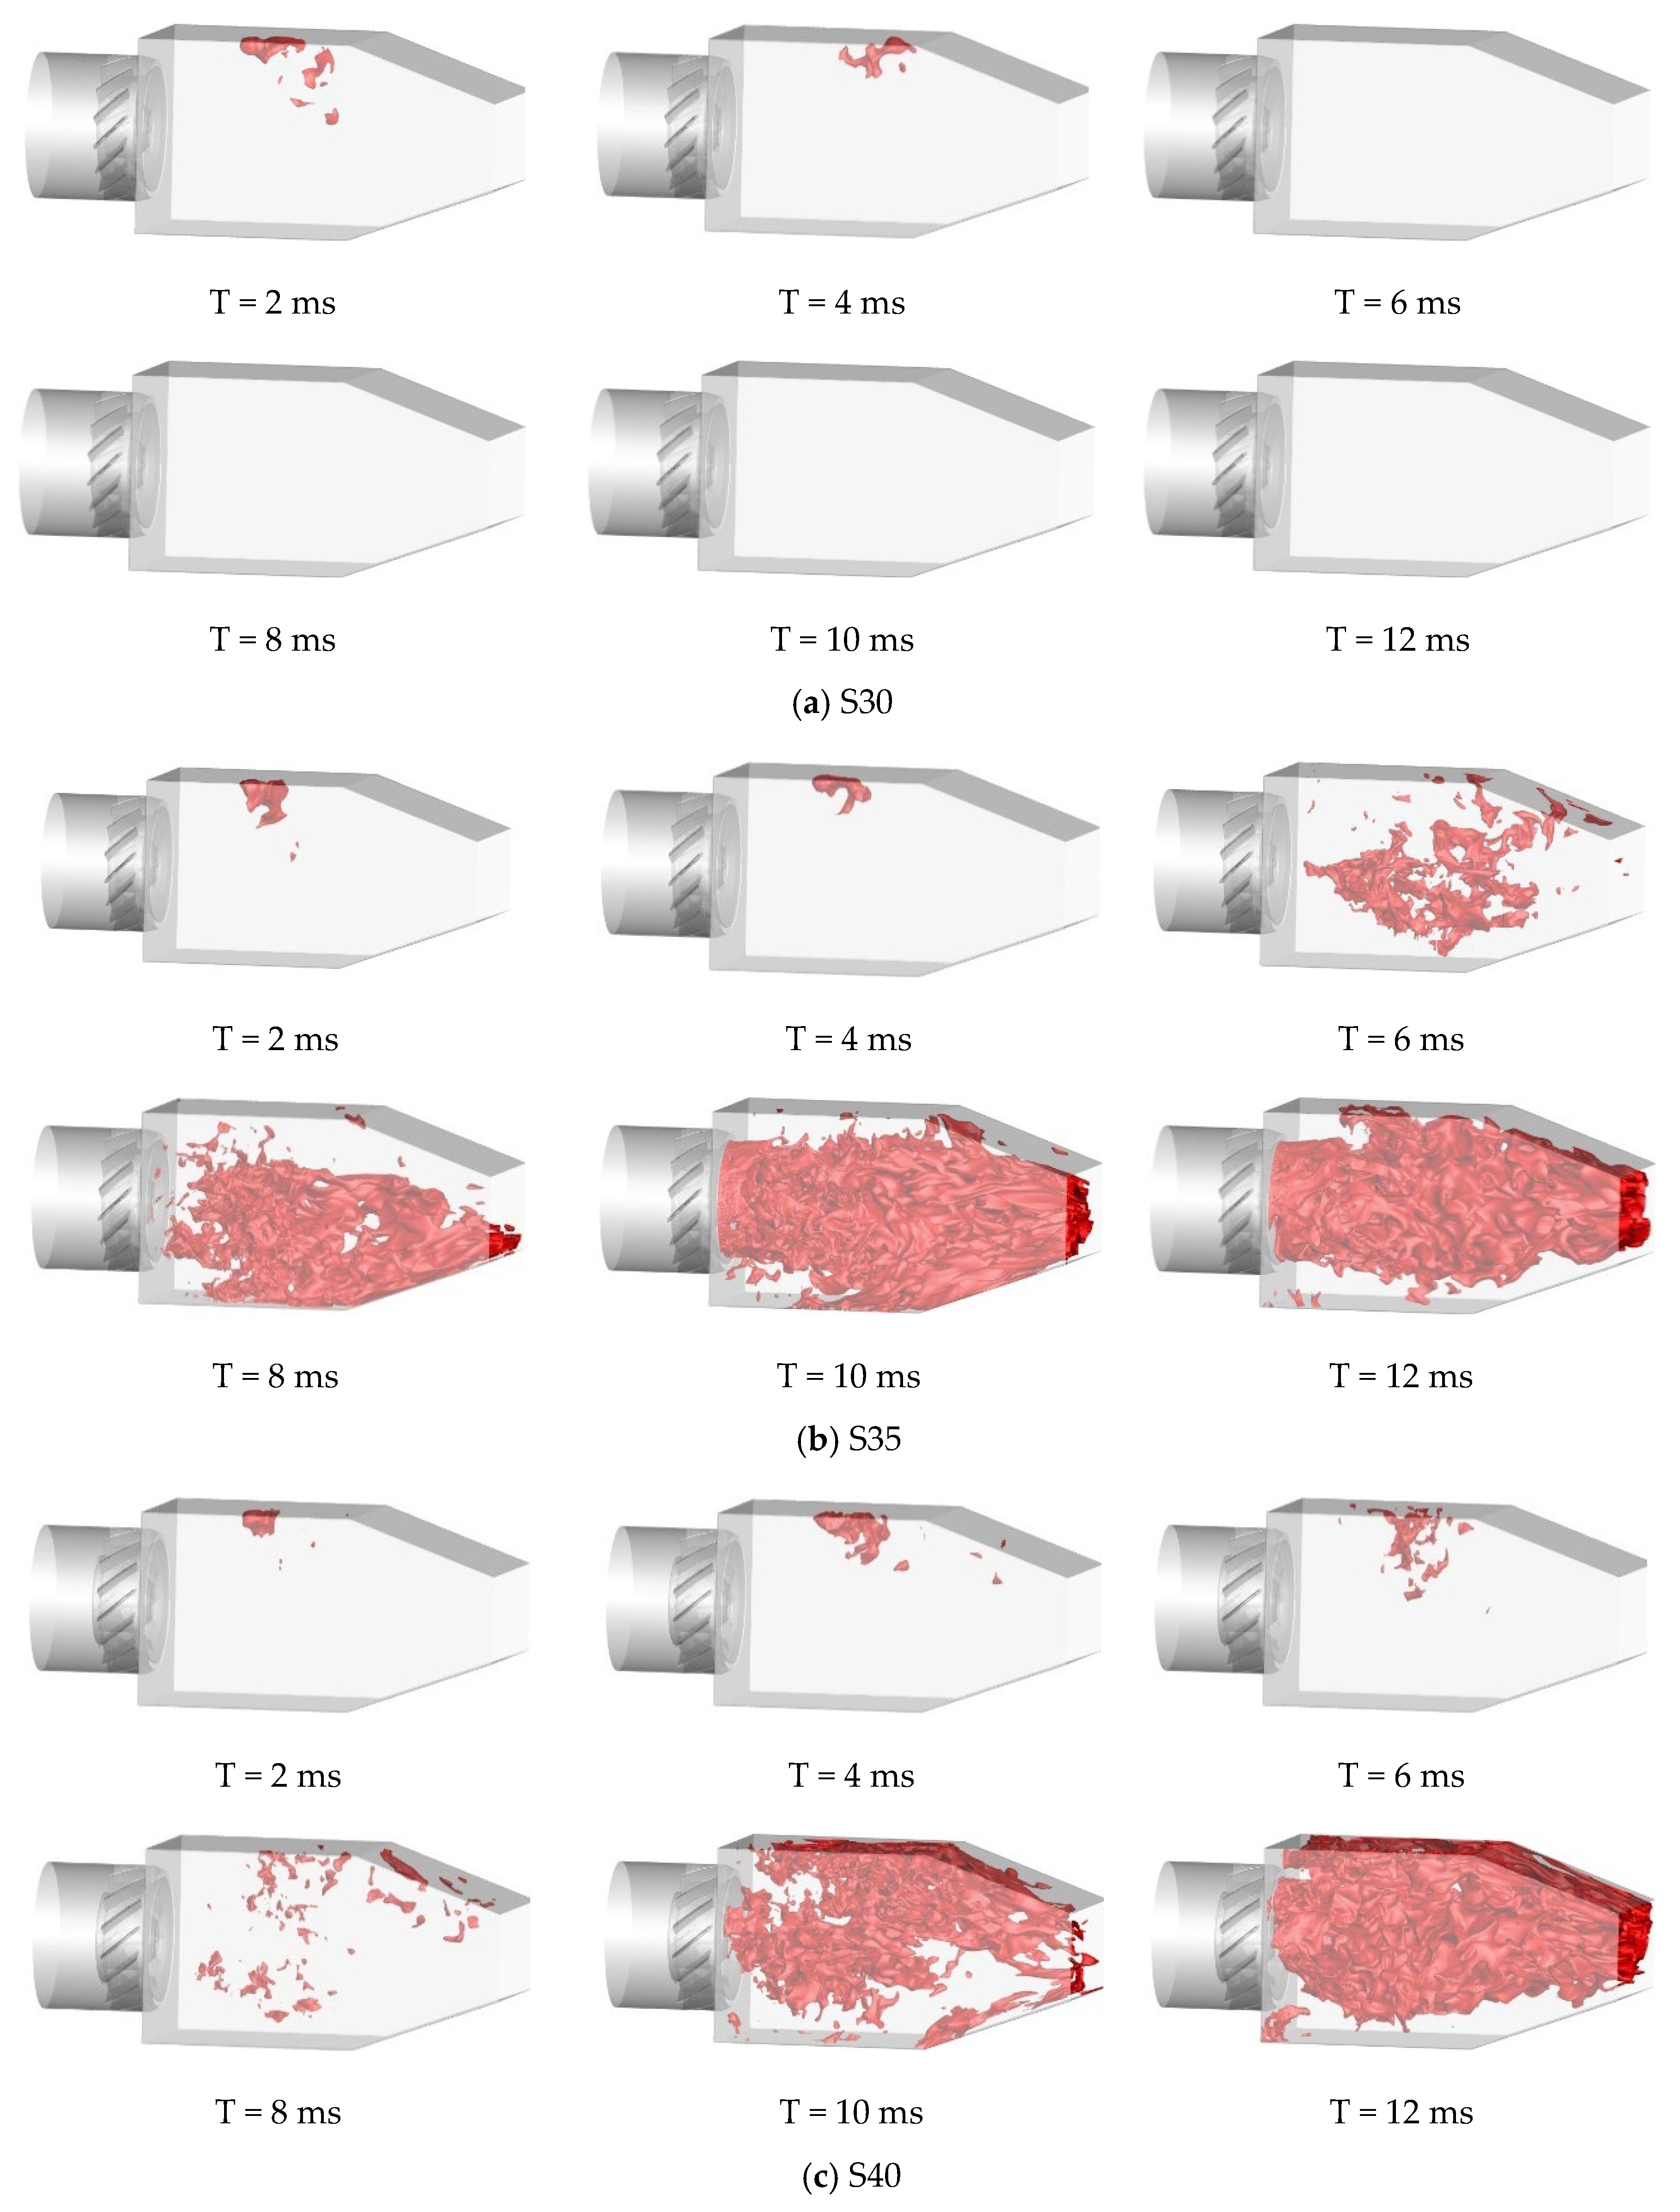
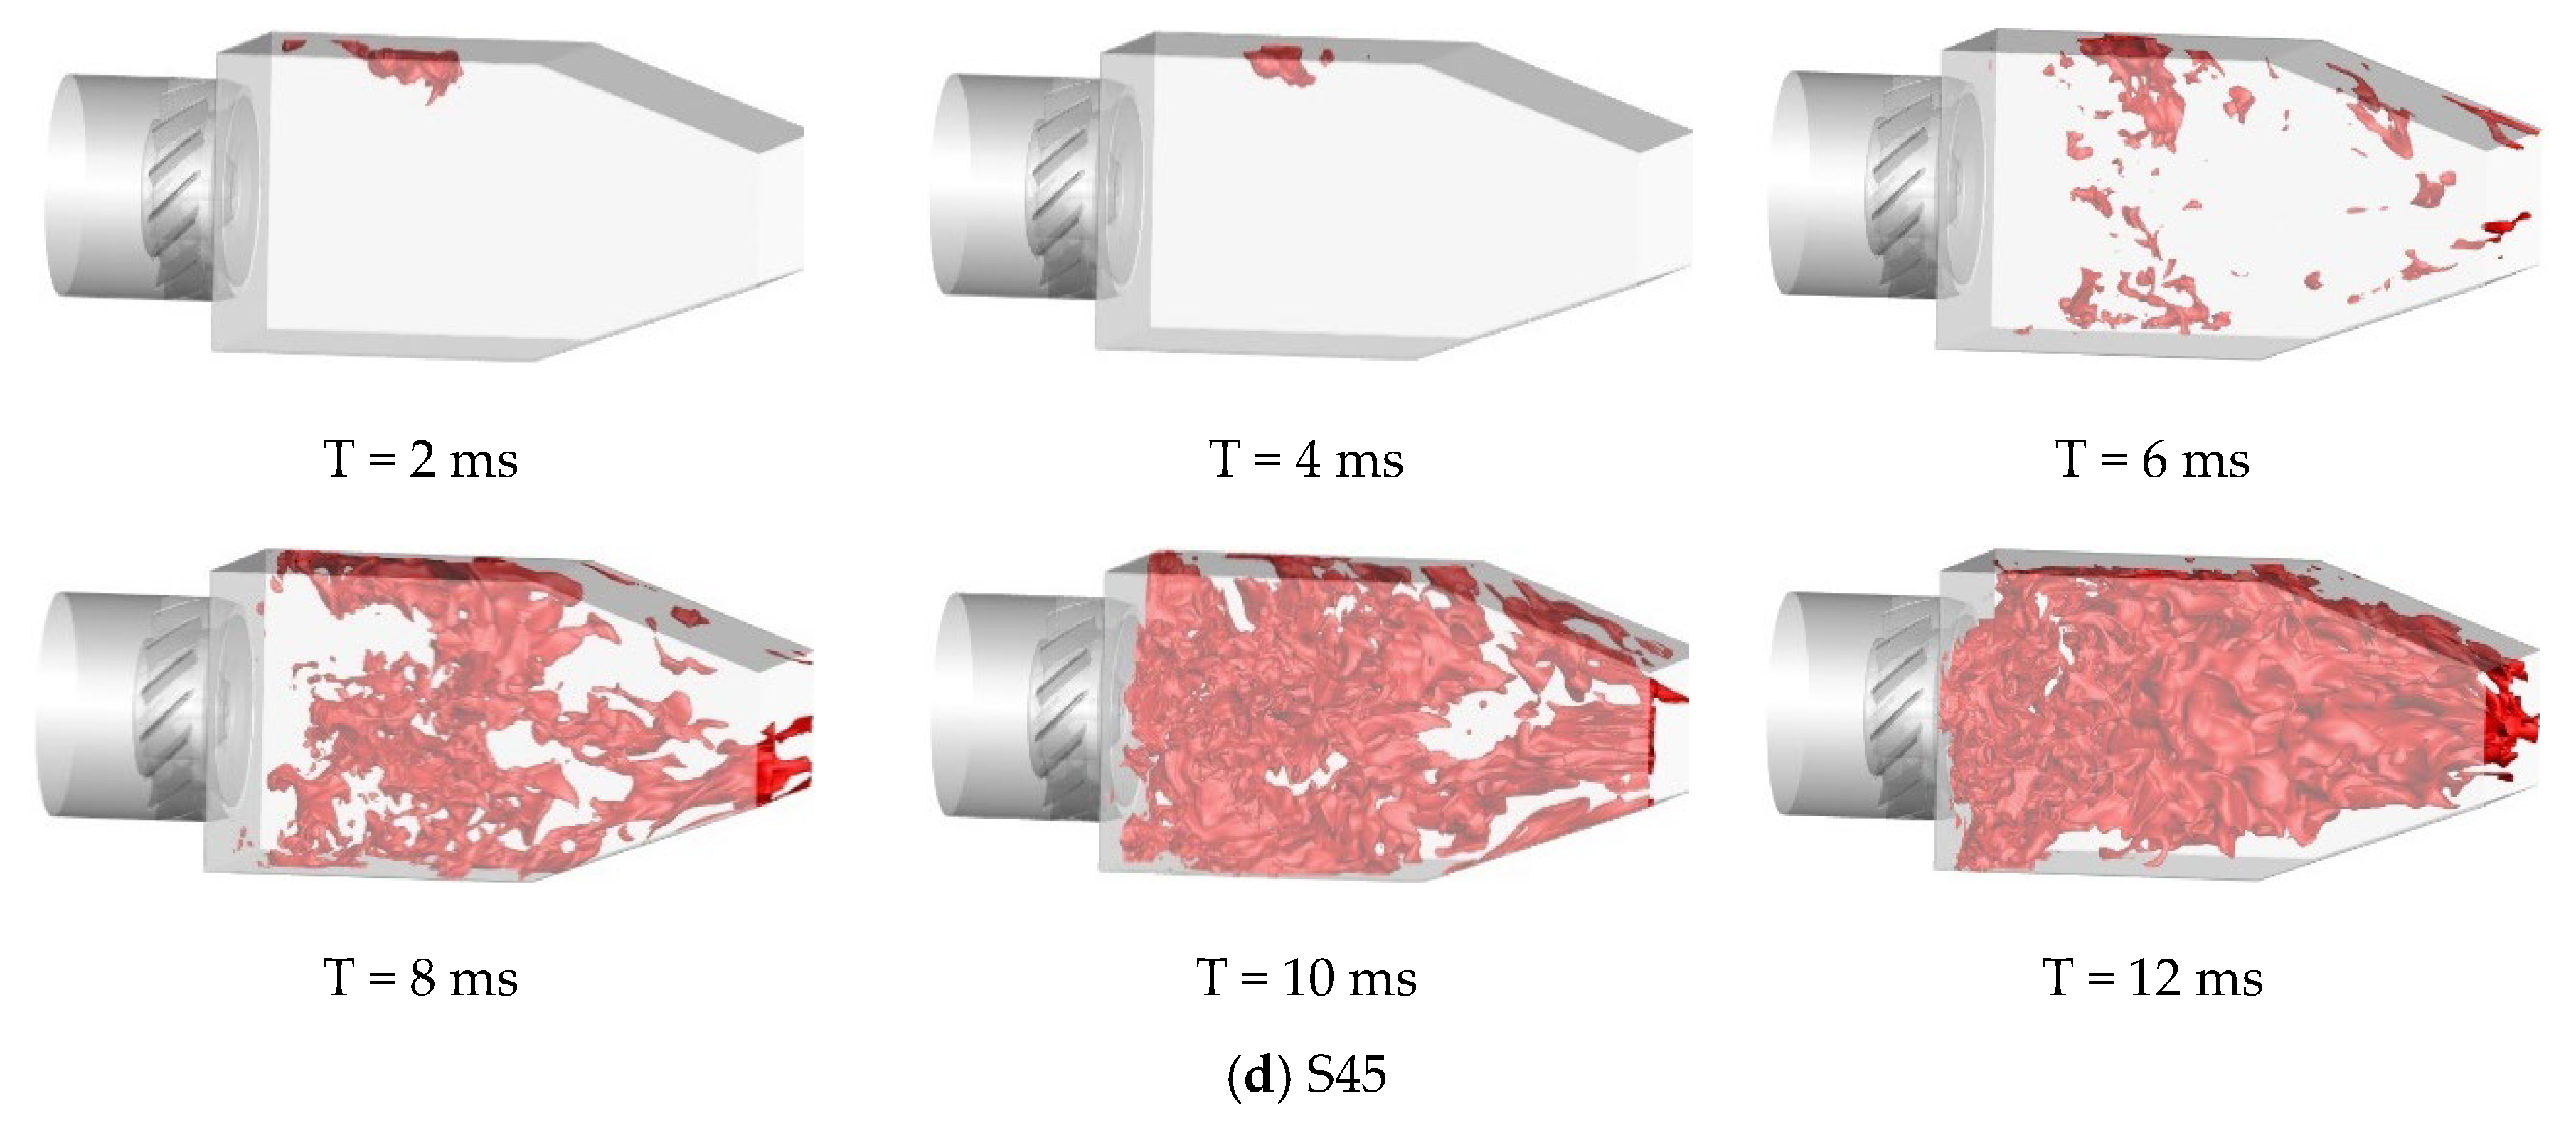
Figure 11 shows the variation in the three-dimensional temperature contour (2000 K) within 0–12 ms after spark discharge for different pilot swirl intensities. It is evident that the combustor has been successfully ignited for the other three swirl intensities, with the high-temperature flame completely filling the central combustion zone within 15 ms, except for the 30° swirl intensity of the pilot mode.
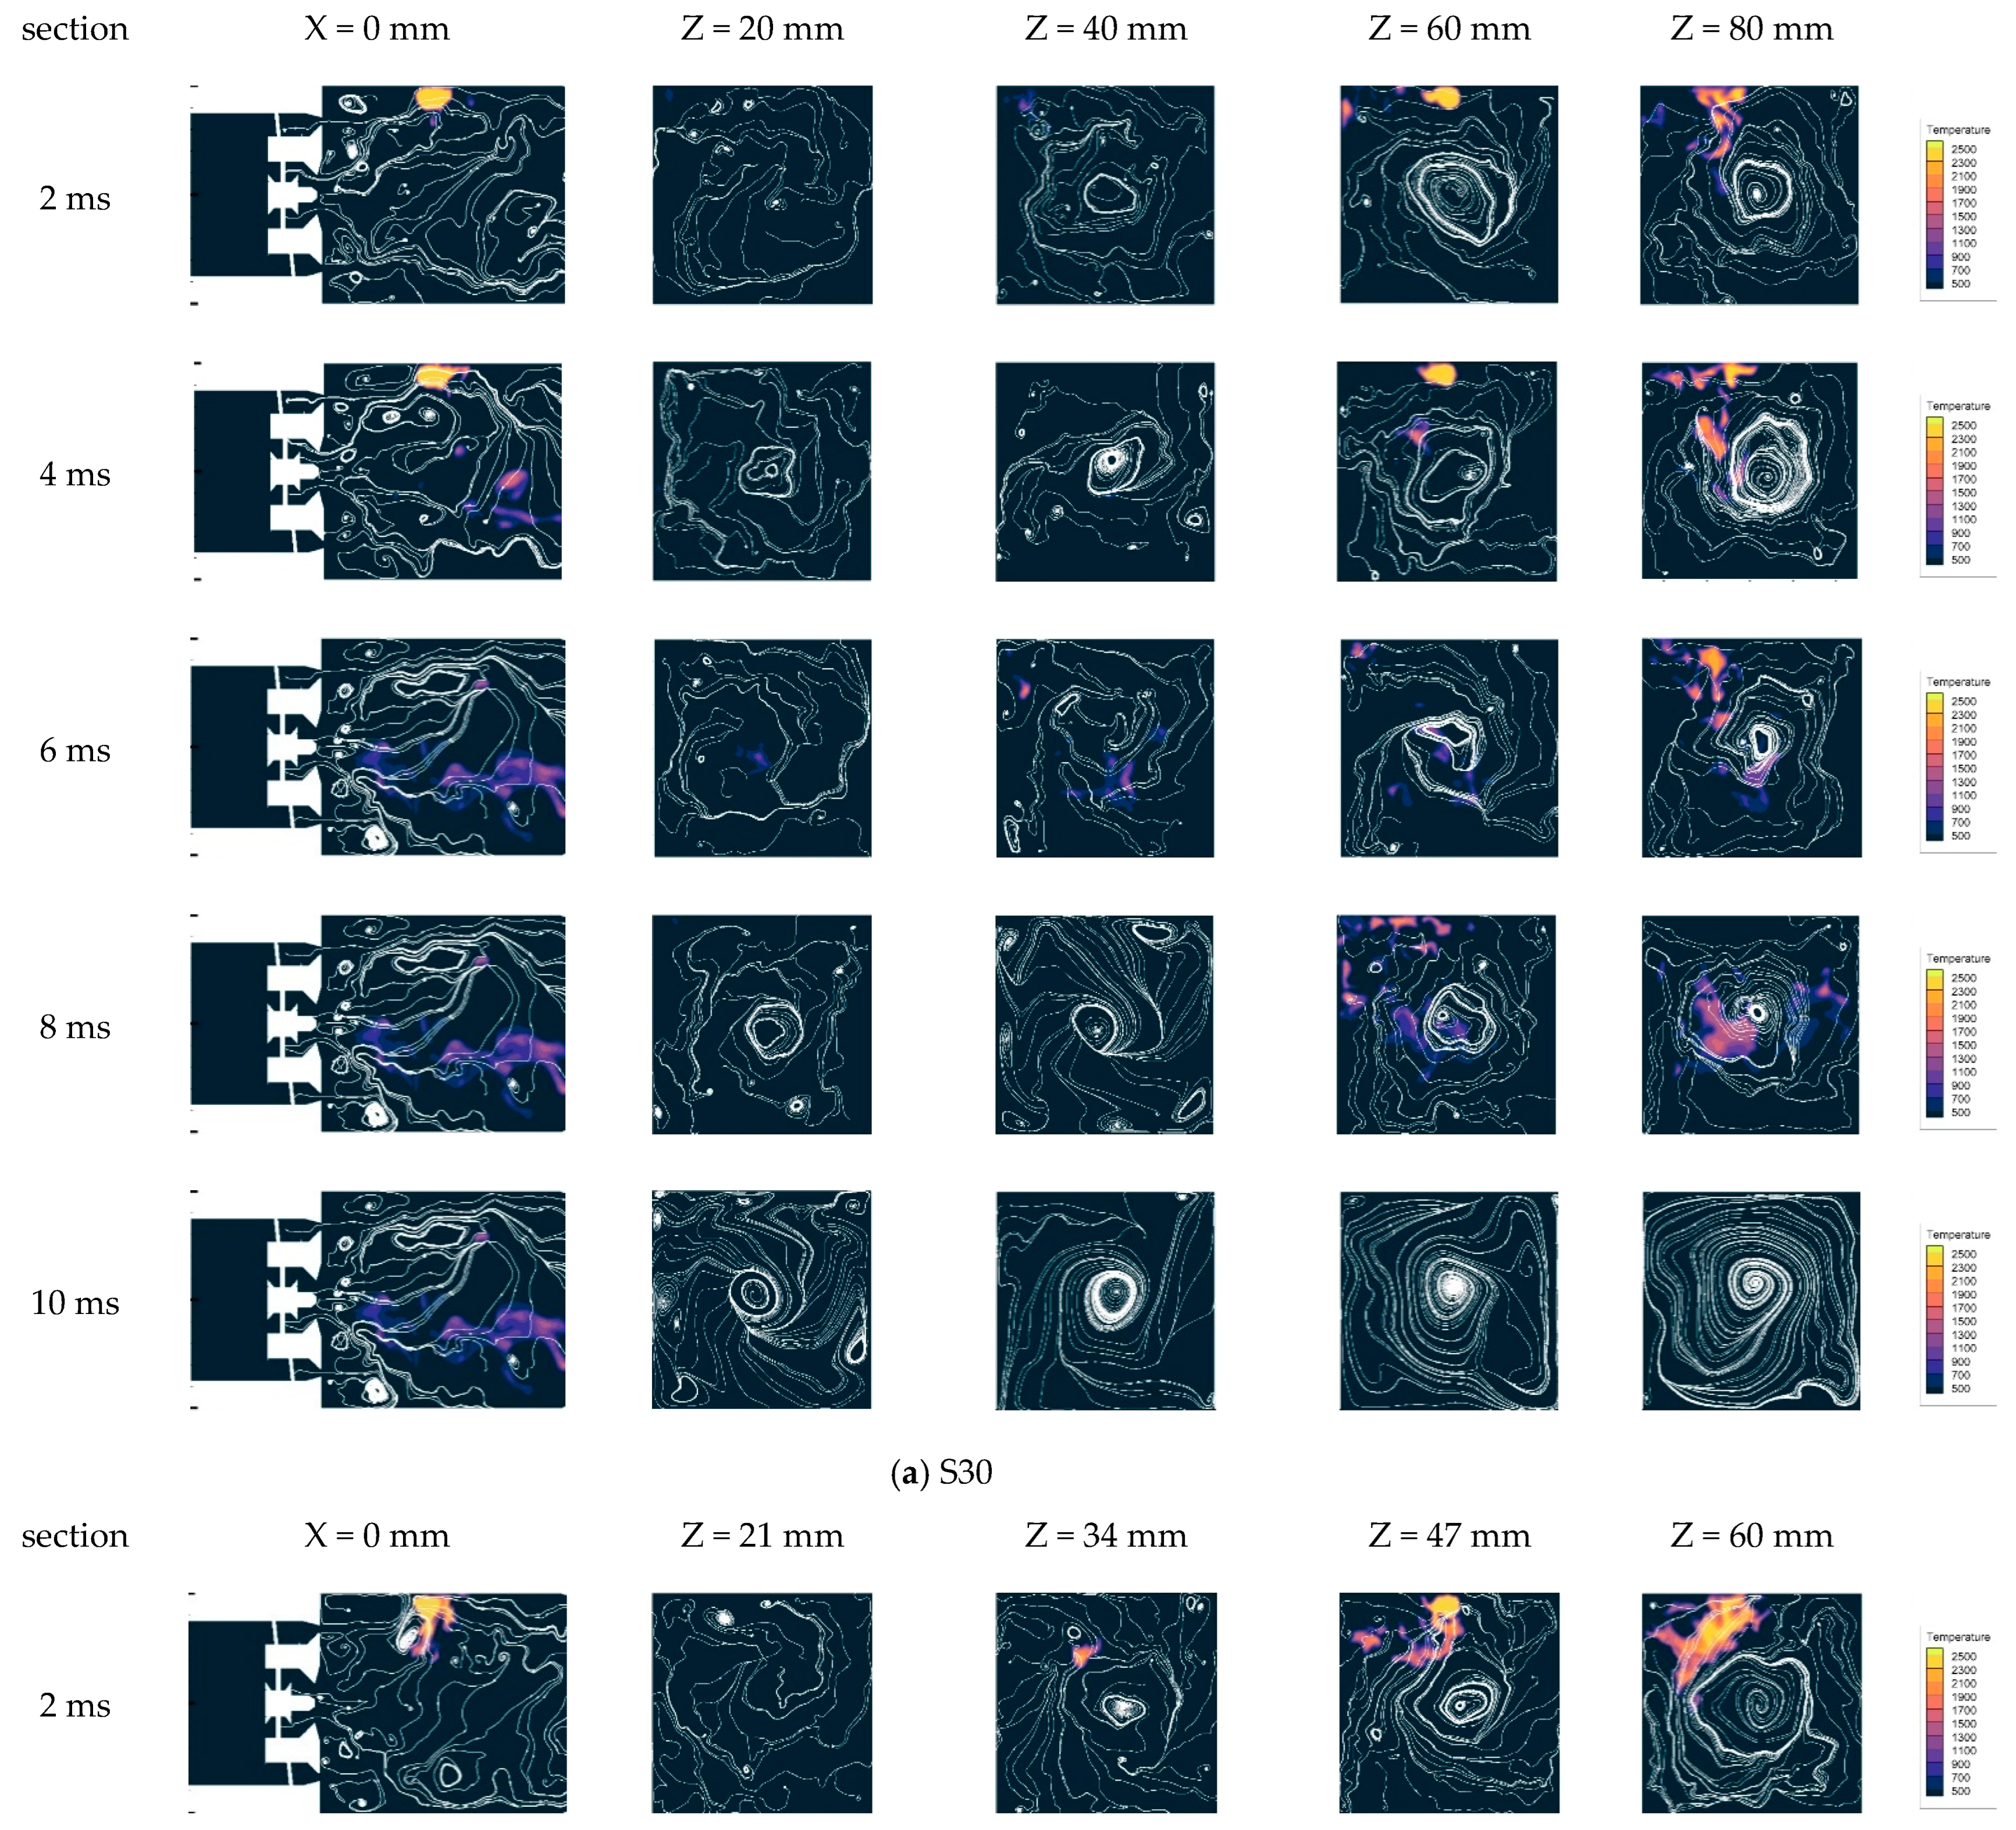
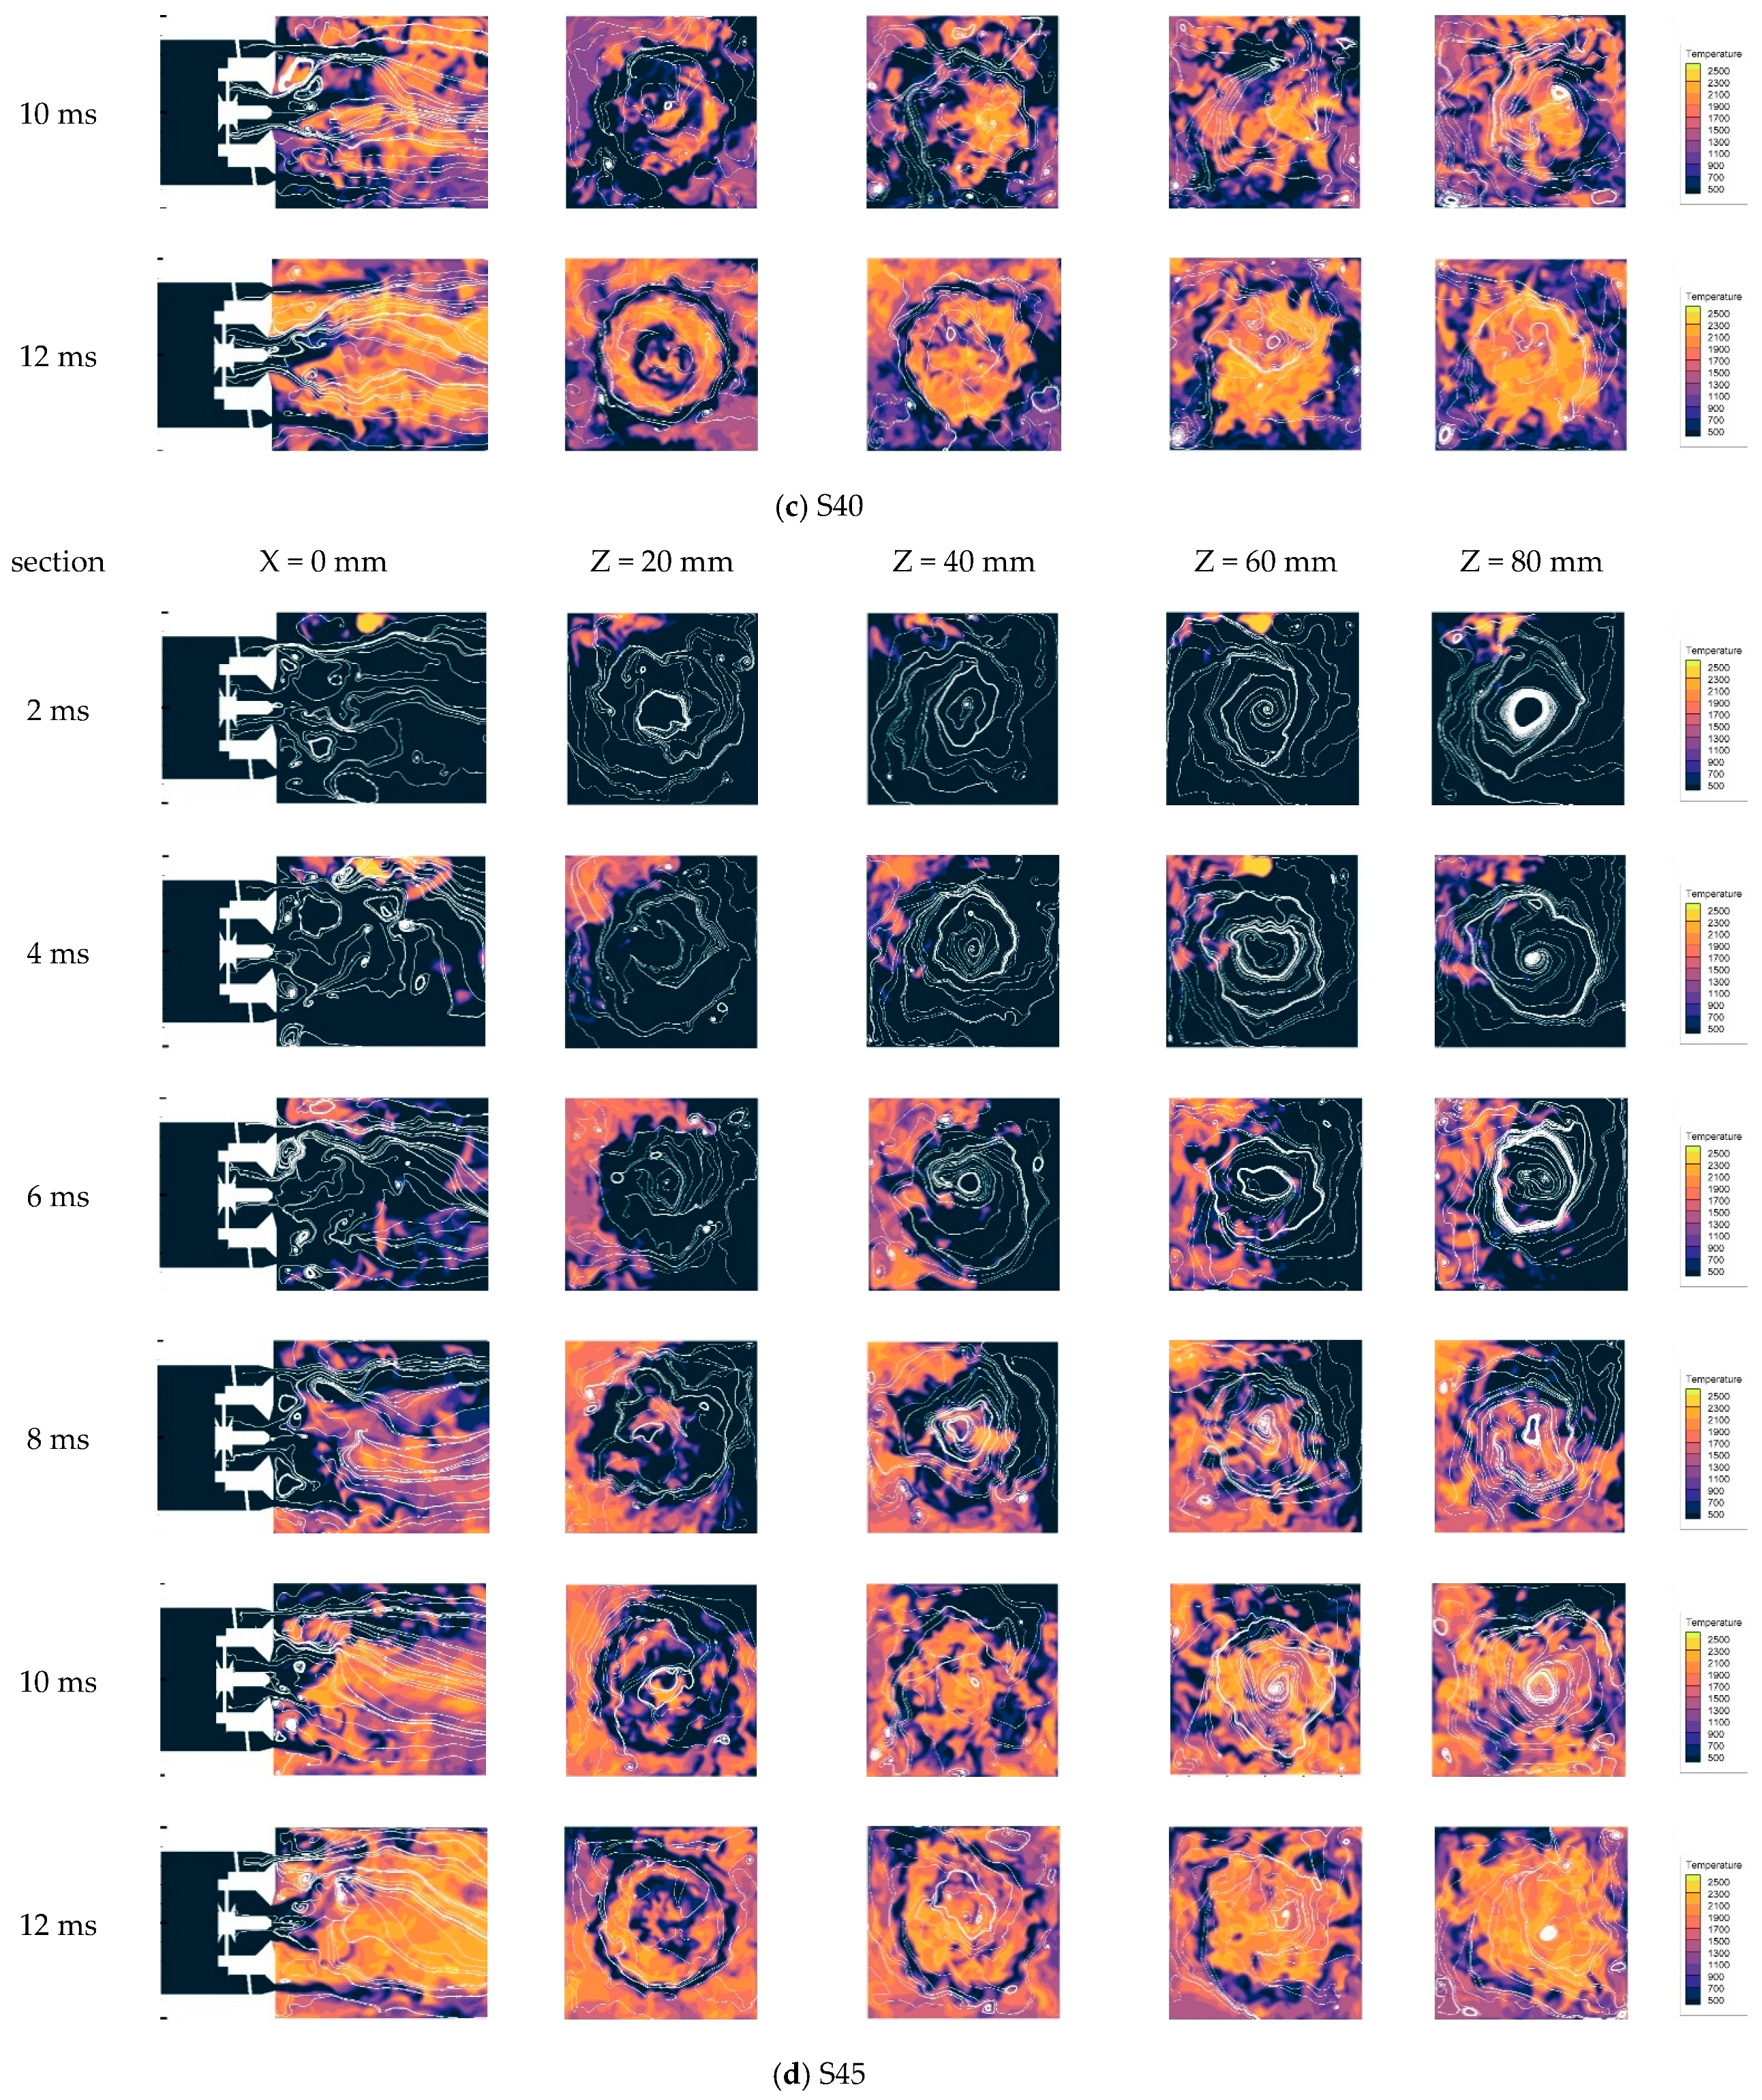
To further investigate the effect of different pilot mode swirl intensity changes on the ignition process in the combustor, the flame propagation of the central section of the combustor and four different axial sections (Z = 21 mm, 34 mm, 47 mm, 60 mm) for four schemes are compared and analyzed.
Figure 12a shows the superimposed streamline diagram of the temperature field at the center section and different axial sections of the combustor within 0–12 ms after spark discharge when the swirl angle of the pilot stage is 30°. After the core is formed, it begins to spread downstream under the influence of the airflow. However, due to the weak swirl intensity of the pilot mode and the low reflux velocity in the combustor, the flame cannot spread back to the position. As shown in the figure, there is no high-temperature zone above 2000 K in the combustor after 8 ms, and the model ignition is unsuccessful.
Figure 12b displays a superimposed streamline diagram of the temperature field in the combustor center section and various axial sections within 0–12 ms after the spark discharge, when the swirl angle of the pilot stage is 35°. At 2 ms, the flame is influenced by the airflow and transmits to the center of the combustor. The flame concentrates at the axial positions of 47 mm and 60 mm, where the ignition position is located at the edge of the recirculation zone, with a low airflow rate conducive to flame propagation. At this time, the core has developed downstream of the combustor and the center of the recirculation zone. From the axial temperature profile, the fire core propagates consistently with the streamlined direction of this position. At 6 ms, the flame has filled the axial positions of 47 mm and 60 mm, as well as the central position of the combustor at the axial position of 34 mm. As time goes on, the flame continues to develop and, at 10 ms, has spread to the head position of the combustor, filling the entire section at the axial position of 21 mm. After 10 ms, the flame fills the entire combustor, with the high-temperature zone distributed in the entire central reflux zone and the lip reflux zone downstream of the combustor head outlet.
Figure 12c shows the superimposed streamline diagram of the temperature field in the central section of the combustor and different axial sections within 0–12 ms after the spark discharge, when the swirl angle of the pilot mode is 40°. At 2 ms, the flame core only propagates along the swirl direction at the axial position of 60 mm, with a relatively slower flame propagation compared to the 35° swirl angle combustor. The flame does not develop to the center of the combustor due to the stronger tangential velocity in the 40° combustor, affecting the flame propagation process. At 10 ms, the flame has spread to the downstream position of the combustor head, and the distribution position of the high-temperature zone is the same as that of the pilot stage when the swirl angle is 35°.
Figure 11d depicts the superimposed streamline diagram of the temperature field in the central section and different axial sections of the combustor within 0–12 ms after the spark discharge when the swirl angle of the pilot mode is 45°. At 2 ms, under the influence of the airflow, the fire core propagates to the upstream and downstream of the combustor due to the strongest swirl intensity of the pilot stage. After the core generates, it propagates along the upstream and downstream directions under tangential and negative axial velocity. At 6 ms, the flame in each axial position of the combustor fills nearly half of the combustor along the swirl direction, which is also different from the other two combustor schemes that have successfully ignited, due to the swirl intensity of the combustor pilot module. With the continuous development of time, the flame fills the entire combustor after 10 ms.
Table 1 shows the ignition success time of the combustion chamber for different swirl angles of the pilot stage. From the table, it can be observed that as the swirl angle of the pilot stage increases, the ignition time of the combustion chamber decreases. When the swirl angle of the pilot module increases from 35° to 45°, the ignition time reduces from 10.7 ms to 8.7 ms.
In summary, the ignition position is at the recirculation zone’s edge, where the low air velocity is conducive to the stability and propagation of the fire core. After the spark discharge, the flame gradually propagates to the center upstream in the counterclockwise direction. After the flame spreads to the head, the fuel and gas mixture in the ignition return zone of the fire core is stabilized in the boundary layer of the primary and pilot stages and further propagates in the combustor until the entire combustor is ignited.


