Abstract
Due to increased powertrain efficiency, electrified propulsion has seen significant diffusion in the automotive sector in recent years. Despite the possible reduction in tailpipe CO2 emissions, the advancements in the technology are not sufficient to tackle the challenge of global greenhouse emissions. An additional action could be the use of second life vehicles to drastically reduce the emissions associated with vehicle manufacturing and recycling/disposal. Urban vehicles are the most suitable to be electrified due to the large start-and-stop cycling and the possibility of using regenerative braking. Therefore, this work considered the hypothesis of hybridizing a small size passenger car with parallel and Series technology. The powertrain is designed for an old vehicle suitable for second life use after refurbishment. A numerical model of the propulsion components was built and applied after previous validation in homologation conditions. Several urban cycles representative of European cities were considered. The final hybrid model is compared with two baselines: non-hybrid and pure electric version already lunched in the market by the manufacturer. The findings indicate that used HEV cars could be a viable option for cutting CO2 emissions from city vehicles without reducing their range. In comparison to non-hybrid vehicles, the series can typically reduce CO2 emissions by 41%, compared to the P2’s 32%.
1. Introduction
Second life vehicles refer to products that are no longer new but are still in good condition and have useful life remaining [1]. Nowadays, second life vehicles are usually identified as passenger cars purchased and customized for exploration, racing, or simply for leisure. However, with complete refurbishment, they can be still operative for several years, for timespans comparable to the lifetime of the original product. One of the main problems of just changing parts with new original ones is that profit margins are low and old vehicles have relatively high greenhouse gas emissions. Therefore, an improvement of the powertrain with new technology could be a potential solution to make these vehicles more attractive and cleaner, thus becoming a true alternative on the market [2].
Hybrid powertrains are propulsion systems that combine two or more sources of power to drive a vehicle [3]. Typically, they consist of an internal combustion engine (ICE) and an electric motor that work together to provide propulsion. The system can operate in a variety of modes, depending on driving conditions and battery charge level. There are two main types of hybrid architectures. The first is the parallel hybrid; in this type of hybrid powertrain, both the ICE and the electric motor (EM) are connected to the wheels and can work together or separately to drive the vehicle [4]. The EM provides additional power during acceleration and at low speeds, while the engine takes over at higher speeds. The second configuration is the series hybrid. In this type of hybrid powertrain, the ICE is used to generate electricity to power the EM, which drives the wheels [5]. The engine is not directly connected to the wheels and only serves to charge the battery when needed. In addition, it can be divided in terms of electrification level in plug-in or non-plug depending on whether the battery can be externally charged. Hybrid powertrains offer several benefits over traditional propulsion, including improved fuel economy, reduced emissions, and increased power and torque [6]. They can also operate in electric-only mode, which allows for zero emissions and quieter operation in certain situations. However, as the regulations are focused on tailpipe emissions, the automakers are quickly passing to pure electric powertrains. Currently, battery electric vehicles (BEV) are limited by the short-range, lack of proper charging technology, danger with battery fire and infrastructure, as well as cost/performance/environmental issues associated with current batteries [7]. Despite the fact that EVs are zero tailpipe emissions, a fair comparison with non-hybrid and hybrids would be in terms of global terms considering life cycle emissions.
Hybrid technology has been researched for a long time; however, there is still largely unexplored potential for improvements in design and management, especially in small city cars. To maintain a reasonable level of performance in a small engine, the use of advanced ICE technology is mandatory [8]. However, the use in a hybrid powertrain completely changes the way the ICE is used [9]. In Series hybrid only, the operating conditions are limited to a few (mostly steady-state) engine speed-load points, while for a parallel hybrid, the operation is focused on high loads. Therefore, the study of the ICE operation conditions and of their possible optimization is crucial in hybrid powertrains [10]. The advantage of the hybrid versus the pure electric is that the small battery reduces space and weight requirements, making the powertrain more compact and suitable for use in a wide range of small passenger cars. The control strategy also takes a crucial position in hybrid vehicles due to the necessity to combine two power sources. Rule base control, dynamic programming or energy consumption minimization strategies are often used to optimize vehicle efficiency or minimize emissions [11].
The objective of this manuscript is to compare different powertrain architectures for a second life small city car in terms of energy consumption and CO2 emissions. The proposed architecture aims to be integrated in a compact hybrid powertrain for small urban cars. It is based on a turbocharged gasoline engine connected to an electric machine in parallel and Series layout. A specific challenge for the considered vehicle category is that space constraints are paramount. The novelty of the manuscript lies in the complete modelling of the vehicles in controlled conditions and the global comparison in terms of greenhouse gas emissions. Engine modelling and vehicle dynamics are incorporated in the manuscript, as well as a well-to-wheel (WTW) and life cycle analysis (LCA).
2. Materials and Methods
The methodology is divided into five subsections. The first three subsections explain the vehicle model, internal combustion engine model, and testing routes. The last two subsections show the validation and performance testing procedure as well as the life cycle analysis model.
2.1. Vehicle Model
To perform the evaluation of the vehicle retrofitted to a hybrid powertrain, the small size passenger car segment is chosen. Specifically, a Smart Fortwo 1998-2006 non-hybrid commercial version. The BEV version (launched in recent years by the manufacturer) is taken for comparison. It is important to note that both (non-hybrid and electric) are rear wheel drive with the propulsion system always located in the back part of the car [12]. The energy storage system for the non-hybrid is a 33-L gasoline tank, while the pure electric is equipped with a 19-kWh battery pack [13]. In terms of propulsion motor, the non-hybrid has a 600 cm3 three-cylinder turbocharged engine with 40-kW maximum power and an automatic six-gear transmission [14]. On the other hand, the BEV case has a 60-kW electric motor with a single fixed-gear ratio transmission [13]. Figure 1 shows the schematic layout of the commercial powertrains.

Figure 1.
Smart city vehicle in the non-hybrid and pure electric commercial versions. Adapted from [15].
Retrofitting of the second life vehicles was considered in two hybrid configurations: parallel P2 and series. Figure 2 illustrates the main components powertrain configurations that will be compared in this work. The parallel adds an electric motor able to propel the vehicle or charge the battery; it is fitted between the ICE and the transmission. The separation to enable pure electric drive at low speeds of the vehicle can be achieved through an additional clutch. On the other hand, the Series hybrid is like the BEV but with an additional power source (i.e., other than the battery). This means the ICE is connected to a generator motor (Gen), totally separated from the wheels, which are powered by a traction motor (TM). As it is a full hybrid, the energy management control must maintain the same battery state of charge at the beginning and end of the driving cycle.
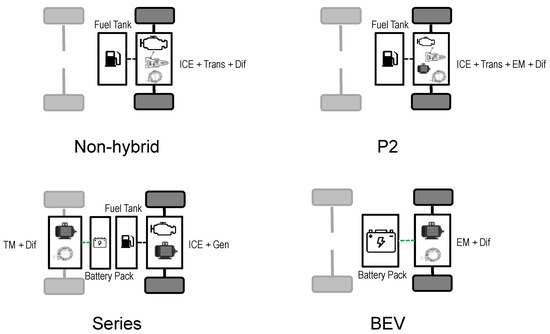
Figure 2.
Vehicle models used to evaluate a conventional powertrain (non-hybrid), hybrid powertrain (series and P2) and the pure electric vehicle. The models were created using GT-Suite 2023 from Gamma Technologies®.
Table 1 shows the main vehicle specifications. The battery pack is simulated using a stack of Series and parallel cylindrical cells. A high-power density cell was used for the hybrid, with 3.3 V and 2.5 Ah from A123 lithium-ion phosphate LFP cathode material [16]. The P2 is equipped with a 1.98 kWh battery (2px120s) because it only has one electric motor and the requirements are low in terms of power consumption. This battery size ensures acceptable electric motor operation in the cell voltage/current range. On the other hand, the Series hybrid needs a larger battery pack compared to the P2 HEV due to higher traction motor power requirements (60 kW instead of 20 kW). For this vehicle, a 3.96 kWh battery pack (4px120s) is selected. In addition, this battery size ensures an acceptable frequency of charge–discharge cycles to reduce battery degradation.

Table 1.
Vehicle specifications by type: non-hybrid, hybrid and electric.
The pure electric vehicle, a high energy density cell is used from LG with NMC 811 cathode material. The electric machine is modelled with the JMAG software using the rated power and torque specifications [17]. The efficiency map obtained is introduced in the GT-SUITE electric machine model. Transmission components are simulated with efficiency following the work of Irimescu et al. [18]. Lastly, the ICE is simulated with a dedicated numerical model in several engine speed and load points. More details on this sub model are given in next subsection.
2.2. Internal Combustion Engine Model
In order to be able to predict the energy consumption (equivalent to liquid fuel, i.e., gasoline, flow), it is necessary to have an engine model for the non-hybrid and hybrid powertrains. Therefore, a three-cylinder detailed model was built in GT-Suite so as to be able to reproduce the combustion and performance of the commercial engine. Figure 3a shows the engine model with all the subcomponents such as cylinders, crank train, intake/exhaust pipes, turbocharger system, etc. A control-oriented approach was implemented, meaning that actuation of the wastegate valve, injectors and ignition was performed by proportional–integral–derivative (PID) controllers. A limit was imposed in the turbo controller so as to avoid compressor surge, while in the ignition PID component, the limitations were implemented when the combustion model predicted knocking. Stoichiometric air–fuel ratio target value was imposed for the injection PID controller through most of the operating map, while at full load enrichment, it was imposed with lambda values down to 0.9. These settings were aimed at obtaining engine behaviour that was as close as possible to the real-world use. More details of the model can be found in [19,20]. The novelty of this manuscript is the simulation of the entirety of the operating maps (1000-6000 rpm and 2.5 to 17 bar bmep). This allows us to calculate the brake-specific fuel consumption map for the 600 cm3 Smart turbocharged engine. In previous work [19], only 100% load was analysed. This map will be entered as a matrix to the vehicle model to estimate the instantaneous fuel consumption. It is possible to see a minimum of 240 g/kWh of BSFC at medium engine speed and 11 bar bmep, while at low load, this parameter increases significantly.
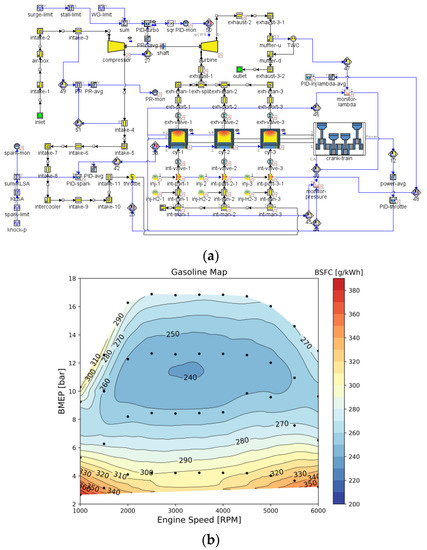
Figure 3.
Internal combustion engine model in GT-Suite (a) and the brake-specific fuel consumption map (b).
2.3. Routes
The evaluation of the vehicle will be performed under the European homologation cycles and user-created urban cycles. Two homologation cycles were considered. The first one is the Worldwide Harmonized Light Vehicles Test Cycle (WLTC), which is currently the homologation cycle in the Worldwide Harmonized Light Vehicles Test Procedure (WLTP). The second one is the New European Driving Cycle (NEDC), which was the homologation cycle when the second life vehicle was launched.
Moreover, the customize urban cycles are obtained with the GT-RealDrive tool, a plugin in GT-Suite that allows us to obtain the vehicle speed and altitude values versus time by imposing the start/finish targets. The virtual navigator software includes traffic lights, start/stop dynamics, and traffic data by using the costumer’s database. Figure 4 shows a schematic illustration of the route in the two different European cities that were considered to explore the vehicle’s behaviour (Madrid and Paris). The cycles were previously used in a work of the research group and more details can be found in [21].
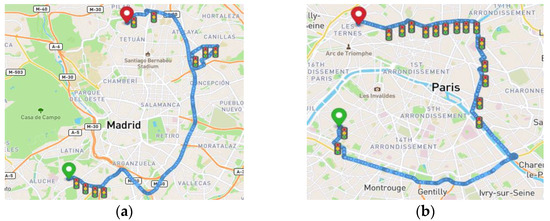
Figure 4.
Example of urban cycles in Madrid (a) and Paris (b) taken with GT-RealDrive.
The process was repeated in ten random routes in each city and thus several vehicle speed profiles were obtained. Figure 5 shows the resulting data. To have a better understanding of the results, Table 2 shows a summary of the most representative statistics of the cycles. Both cases show similar total distance, with an average of 15 km and average time of 36 min for Madrid and 45 min for Paris. Therefore, the average vehicle speed is lower for Paris compared to Madrid (5 km/h approximately).
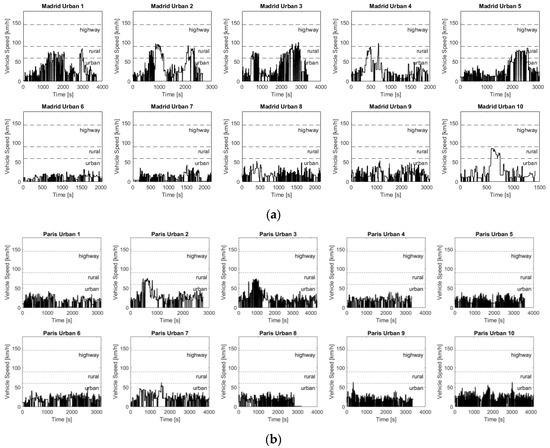
Figure 5.
Madrid (a) and Paris (b) ten urban driving cycles obtained with GT-Real Drive tool. Adapted from [21].

Table 2.
Mains average statistical parameter for the different real driving routes in Spain and France.
2.4. Validation and Performance Procedure
As validation of the vehicle and engine model, the data available in the bibliography were taken for the Smart Fortwo non-hybrid in the NEDC cycle [22]. The authors were able to obtain the total fuel consumption as well as the separate urban and highway values. This is an advantage because it is possible to validate the aerodynamics of the vehicle (highway part) and the low-load fuel consumption (urban part, including idling), as well as the global agreement of the results (complete NEDC). As the new homologation driving cycle is WLTC, this is added in the figure for the reader’s comparison between old and new cycle. However, it is not possible to find the fuel consumption in the mentioned cycle since it was never tested. Figure 6 shows the fuel (volumetric) consumption in terms of global value and the percentage difference between the reference and the simulation. The differences are lower than 2%, with excellent agreement in the urban case (<1%). The WLTC fuel consumption is also shown (even if there are no reference data), so as to give an idea of the difference between the two homologations; it is similar compared to the NEDC for this vehicle configuration (5.0 lt/100 km).
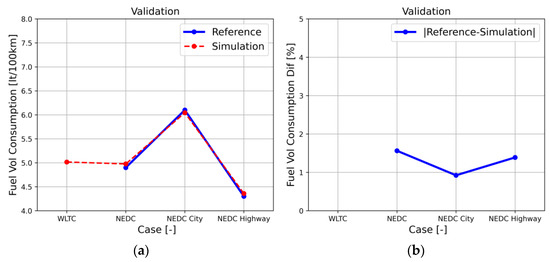
Figure 6.
Overall fuel consumption (a) and percentage difference between reference data and simulations (b) for the non-hybrid configuration.
2.5. Life Cycle Analysis Database
To have a global analysis of each powertrain potential, an LCA is included considering wheel to tank (WTT), tank to wheel (or tailpipe, TTW) and vehicle fabrication, maintenance, and disposal; these were focused on evaluating overall CO2 emissions. In this study, a 150,000 km vehicle life is considered as the functional unit of the analysis. The CO2-related computation is carried out by using detailed literature data to analyse the component of environmental impact. The values taken for this study are depicted in Table 3. The reference source is added in each parameter.

Table 3.
CO2 impact related to fuel production, component production, maintenance, and disposal and others main parameters for LCA.
The LCA calculation needs the first estimation in terms of WTT and TTW, and the equivalent vehicle components’ CO2 impact on the environment. Equation (1) shows that the WTT emission is obtained by multiplying the energy consumption values obtained through simulations by the fuel CO2 equivalent emission to produce the fuel. On the other hand, TTW emission is directly calculated from the fuel consumption in the vehicle simulation model (Equation (2)). Moreover, Equations (3) and (4) show the WTW and LCA parameters, respectively. The first is the sum of WTT and TTW, while the LCA is the sum of WTW and the vehicle components equivalent CO2 emissions. From the parameters of Table 2, it is necessary to consider the amount of the component used (weight, volume, etc) and the estimated life. In this work, 150.000 km is taken for a passenger vehicle.
3. Results
The results are divided in two subsections depending on the performance or the life cycle analysis. The first subsection analyses the effect of the driving cycle on the total energy consumption of the powertrain. Non-hybrid and BEV commercial vehicles are compared with the second life retrofitted HEV Series and parallel architecture. In the second subsection, the benefit of each powertrain is analysed in terms of the equivalent CO2 emissions in a global perspective.
3.1. Performance
The first analysis is performed in homologation driving cycle conditions, like the validation section in the methodology. However, Figure 7 shows the values for all four powertrains. Figure 7a shows the absolute energy consumption (liquid fuel + electricity) while Figure 7b shows the comparison against the non-hybrid. On average, the BEV is the most efficient powertrain with 15.1 kWh/100 km, while the worst case is the non-hybrid, with an average of 43.9 kWh/100 km. For these cycles, P2 shows lower energy consumption than the Series with 41.2 kWh/100 km and 41.9 kWh/100 km, respectively. As the Series needs to convert all mechanical ICE energy into electricity to pass to the wheels through the traction motor and the vehicle weight is high due to the number of extra components, the overall vehicle efficiency is reduced. In terms of relative overall differences, P2 HEVs reduce energy consumption by about 6.2%, while the BEV version consumes around 65.6% less energy (in tank-/battery-to-wheels terms). Despite the great difference between the BEV and the rest of powertrains, the main drawback for the BEV is the vehicle range and charging time. The autonomy is only 132 km (121 km for the WLTC and 146 km for the NEDC), while the non-hybrid achieves 660 km and the HEVs 466 km (470 km the P2 and 462 km the Series) with one fuel tank for the mentioned driving cycles. The manufacturer claims it takes 3 to 5 h to re-charge the battery, while for the other powertrains, only a few minutes are required; in addition, the energy consumption and range under WLTC conditions are 16.4–16.6 kWh/100 km and 125–135 km, respectively. It is important to note that the HEVs are full hybrid; therefore, the battery is re-charged with the ICE during the driving cycle.
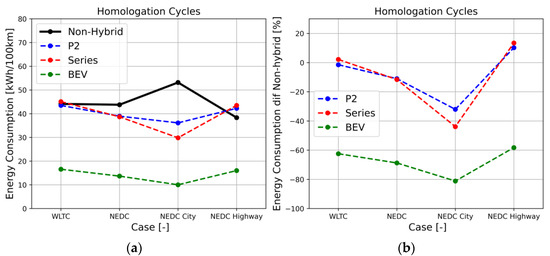
Figure 7.
Homologation driving cycles comparison in terms of energy consumption (a) and difference versus non-hybrid (b).
Moreover, if the cycles are compared between each other, it is possible to see that the electrified powertrains have a maximum energy consumption reduction in the NEDC city section due to the low speed and high frequency of start-and-stop events. The opposite behaviour is seen in the NEDC highway part, where the HEVs consume slightly more energy than the non-hybrid and the BEV has the lowest energy consumption reduction. In the highway cycle, less regenerative braking is possible, and the non-hybrid works in an efficient ICE condition. However, this type of vehicle is designed mainly for city use; therefore, a more detailed study was performed in this condition.
Figure 8 shows the Smart ForTwo energy consumption in 20 urban cycles (10 in Madrid and 10 in Paris) with four powertrain architectures. Like the analysis for the homologation driving cycles, the absolute and relative energy consumption is presented. It is possible to see that the urban cases increase the energy consumption for the non-hybrid with respect to the combined homologation cycles (WLTC and NEDC) due to the extensive time spent in idle conditions and the low load requested from the ICE. The non-hybrid energy consumption is almost double, with a jump from 43.9 kWh/100 km in homologation to 74.8 kWh/100 km in urban conditions. The opposite is found for the electrified powertrains, with a decrease in energy consumption in urban conditions with respect to the combined cycle scenario.
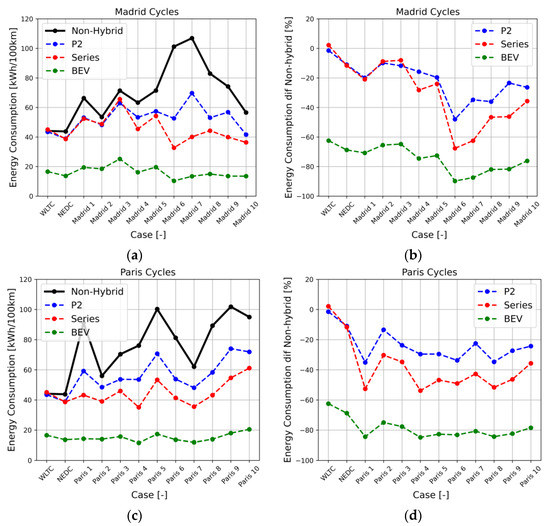
Figure 8.
Urban cycles comparison in terms of energy consumption (a,c) and difference versus non-hybrid (b,d) in Madrid and Paris.
When comparing the benefits of electrification, the P2 HEV improves fuel economy by around 26% on average in both cities, while the Series hybrid is close to a 40% improvement. Due to the large amount of start-and-stop events and the low-load conditions, the Series hybrid shows advantages in terms of energy consumption in urban areas.
As expected, the BEV provided the most significant reduction in energy consumption, with a battery-to-wheel difference close to 79% with respect to the non-hybrid. Apart from the opportunity of recovering kinetic energy during deceleration, the fact that engine idling is avoided for all electrified configurations is one of the main reasons for the observed reductions in energy consumption. The series HEV had better performance during these cycles compared to the P2 configuration; this is due to the larger traction motor and the possibility to set the ICE in the most efficient condition all the time it is on. The possibility of decoupling speed/load characteristics due to the powertrain layout shows better results than the parallel configuration. It is important to note the advantage of the BEV with similar energy consumption for all scenarios. This makes the pure electric powertrain less dependent on the condition of use. In addition, for all electrified powertrains, Paris shows larger energy consumption reduction compared to Madrid. The reason of this behaviour will be analysed in terms of driving cycle parameters.
Average cycle speed and stop time were considered as the main parameters to be analysed with respect to energy consumption in Figure 9; this is because they can be directly related to powertrain efficiency (ICE operating point and recovered energy in braking events). Figure 9a,b shows less evident energy consumption reduction when the driving cycle average speed increases. In addition, the results for the three powertrains correlate well with a line. For both cities, the Series hybrid shows more dependence with the average speed compared to the BEV and P2 hybrid. This can be explained by the fact that when the speed increases, the ICE needs to be turned on for longer periods of time and the effects of the liquid-electricity-propulsive power conversion chain are more evident. On the other hand, the P2 can directly act on the wheels without the need for intermediately converting the energy in electricity. The BEV featured a quite flat trend for all conditions, as expected.
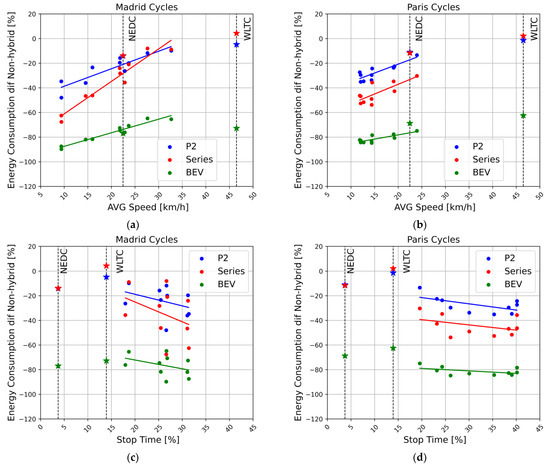
Figure 9.
Correlation between cycle parameters and energy consumption results and energy consumption vs. average speed for Madrid (a) and Paris (b); energy consumption vs. stop time for Madrid (c) and Paris (d) is also shown.
3.2. Life Cycle Analysis
After a detailed analysis of the energy consumption and benefits of the different powertrain electrification systems, this section will present an overall analysis of the equivalent CO2 emissions due to vehicle use, manufacturing, and end of life. To simplify the analysis, components that are similar in all the vehicles are not considered. The values taken for each component or energy source, as well the equations used, can be found in the methodology section.
Figure 10 presents the LCA results in terms of average CO2 values for the homologation cycles (NEDC and WLTC), Madrid urban and Paris urban. The items are separate in WTT, TTW, the CO2 associated with battery production and disposal (LCA battery), the CO2 associated with EM production and disposal (LCA EM), and the CO2 associated with vehicle body manufacturing (LCA body). It is important to note that the battery is changed after 100,000 km. Therefore, HEVs and BEVs consider two batteries along the 150,000 km lifetime. In addition, the second life retrofitting of the HEVs comes without the LCA body component due to the use of the non-hybrid part that would otherwise be discarded. Moreover, for each case scenario, a fifth powertrain is created that represents a BEV with the battery size necessary to achieve the vehicle range of the non-hybrid. Despite the fact that the battery will be larger than the available space, it is a fictional powertrain that can be measured in terms of LCA CO2 emissions.
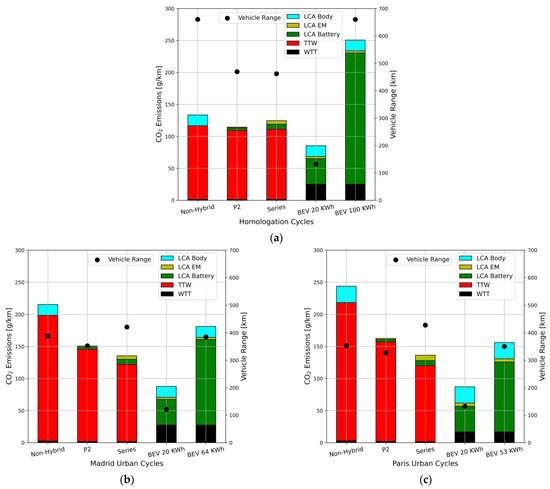
Figure 10.
LCA for homologation cycles (NEDC and WLTC) (a), Madrid urban (b), and Paris urban (c) cycles in terms of average CO2 emissions; separate categories are also highlighted.
The results shown in Figure 10a depict that in homologation conditions, the commercial BEV (BEV 20 kWh) achieves the highest CO2 benefits (36%) but the lowest vehicle range (528 km lower than non-hybrid and 306 km lower than the HEVs). The second life P2 hybrid vehicles reduce CO2 emissions by 14% with respect to the non-hybrid. However, in homologation conditions due to the highway phase, the Series second life battery vehicle reduces CO2 emissions by only 7% with respect to the non-hybrid. On the other hand, to achieve the same range of the non-hybrid version, a battery of 100 kWh is required instead of one of 20 kWh. This means 88% more CO2 emissions than the non-hybrid during the 150,000 km lifetime that was considered. The homologation cycles have a rural and highway phase that is worse for pure electric powertrains. As the vehicle under study is designed for urban use, Figure 10b and Figure 10c shows the results in average terms for 10 urban cycles in Madrid and Paris, respectively.
The results drastically change with a high increase in non-hybrid total emissions due to low fuel economy in urban areas. In this type of cycles, the electrified powertrains start to show its benefits, with a significant decrease in total CO2 emissions for the HEVs and BEVs. The best case again is the BEV with a 20 kWh battery with a reduction of 60% with respect to the non-hybrid. The series second life vehicle is the best between the HEVs, with 41% of CO2 reduction, while the P2 shows a CO2 reduction of 32%. The main benefit of the Series HEV is the combination of low CO2 total emission and high vehicle range. The latter achieves similar extension compared to the non-hybrid (340 km the P2 and 424 km the Series) and 255 km higher with respect to the BEV 20 kWh. The Series achieves these values due to low battery size and the benefit of operating the ICE in high efficiency points.
The main differences between the Madrid and Paris cycles are that Paris featured a lower average speed. Therefore, the benefits for the electrified powertrains are higher. In addition, the battery size necessary for a BEV with the same range as that of the non-hybrid is 11 kWh lower compared to Madrid. Overall, the P2 and Series hybrid second life is the best alternative to have a significant CO2 reduction with a similar range to that of the non-hybrid or even higher. The equivalent BEV for a similar range had higher CO2 emissions compared to the hybrid’s configuration.
4. Conclusions
This work studied the possible benefits of retrofitting a second life city vehicle with a hybrid powertrain. The results are compared against the non-hybrid and pure electric commercial versions. The main results show that the BEV is the most efficient in terms of energy consumption, followed by the HEV and the non-hybrid vehicle.
An additional case was generated to show the CO2 emissions of a pure electric vehicle with the same range as that of the non-hybrid. This work was based on numerical vehicle simulations and complemented with a LCA tool. The scenario studied was representative of homologation cycles as well as of the urban areas of two important cities in Europe (Madrid and Paris).
The results show that the second life HEVs are a potential solution to reduce CO2 global emissions in vehicles without a loss of range. The Series configuration is the best combination due to larger electric motors that maximize regenerative braking, as well the improved control of the ICE in low-load conditions such as urban roads. On average, the Series vehicle can reduce CO2 emissions by 41%, while the P2 configuration achieves 32% lower values with respect to the non-hybrid. For the mentioned cases, the range is around 424 km for the Series and 340 km for the P2; the non-hybrid featured 370 km and the BEV with a 20 kWh battery only 127 km. If the range is not the essential factor for users, the BEV with low battery size (20 kWh) achieves the maximum CO2 saving, with an average reduction of 60% for urban use.
The future work of this research group will be focused on the use of hydrogen in the engine as a zero tailpipe emissions fuel source. This will drastically reduce LCA emissions and will lead to a better competitor for the BEV. Using hydrogen provides ultra-low LCA emissions with higher energy density compared to the values achieved with a battery.
Author Contributions
Conceptualization, A.I. and S.M.-B.; methodology, S.M.-B., A.I. and P.C.-R.; formal analysis, A.I. and S.S.M.; data curation, A.I. and S.S.M.; writing—original draft preparation, S.M.-B. and A.I.; writing—review and editing, P.C.-R. and S.S.M.; supervision, P.C.-R. and S.S.M. All authors have read and agreed to the published version of the manuscript.
Funding
This research received no external funding.
Data Availability Statement
No new data were created or analyzed in this study. Data sharing is not applicable to this article.
Acknowledgments
The authors from STEMS-CNR acknowledge the funding received within the STRIVE FOE2022 project, WP2 Refurbishment of light duty vehicles (original title in Italian).
Conflicts of Interest
The authors declare no conflict of interest.
References
- Iqbal, H.; Sarwar, S.; Kirli, D.; Shek, J.K.H.; Kiprakis, A.E. A Survey of Second-Life Batteries Based on Techno-Economic Perspective and Applications-Based Analysis. Carbon Neutrality 2023, 2, 8. [Google Scholar] [CrossRef]
- Blat Belmonte, B.; Esser, A.; Weyand, S.; Franke, G.; Schebek, L.; Rinderknecht, S. Identification of the Optimal Passenger Car Vehicle Fleet Transition for Mitigating the Cumulative Life-Cycle Greenhouse Gas Emissions until 2050. Vehicles 2020, 2, 5. [Google Scholar] [CrossRef]
- Emadi, A.; Rajashekara, K.; Williamson, S.S.; Lukic, S.M. Topological Overview of Hybrid Electric and Fuel Cell Vehicular Power System Architectures and Configurations. IEEE Trans. Veh. Technol. 2005, 54, 763–770. [Google Scholar] [CrossRef]
- Nguyen, B.H.; Trovao, J.P.; German, R.; Bouscayrol, A.; Goulet, Y. Optimal Energy Management of a Parallel Hybrid Truck for Fuel Consumption Comparative Study. In Proceedings of the 2018 IEEE 87th Vehicular Technology Conference (VTC Spring), Porto, Portugal, 3–6 June 2018; pp. 1–5. [Google Scholar] [CrossRef]
- Kim, D.-M.; Benoliel, P.; Kim, D.-K.; Lee, T.H.; Park, J.W.; Hong, J.-P. Framework Development of Series Hybrid Powertrain Design for Heavy-Duty Vehicle Considering Driving Conditions. IEEE Trans. Veh. Technol. 2019, 68, 6468–6480. [Google Scholar] [CrossRef]
- Solouk, A.; Shakiba-Herfeh, M.; Arora, J.; Shahbakhti, M. Fuel Consumption Assessment of an Electrified Powertrain with a Multi-Mode High-Efficiency Engine in Various Levels of Hybridization. Energy Convers. Manag. 2018, 155, 100–115. [Google Scholar] [CrossRef]
- García, A.; Monsalve-Serrano, J.; Lago Sari, R.; Martinez-Boggio, S. An Optical Investigation of Thermal Runway Phenomenon under Thermal Abuse Conditions. Energy Convers. Manag. 2021, 246, 114663. [Google Scholar] [CrossRef]
- Martinez, S.; Merola, S.; Irimescu, A. Flame Front and Burned Gas Characteristics for Different Split Injection Ratios and Phasing in an Optical GDI Engine. Appl. Sci. 2019, 9, 449. [Google Scholar] [CrossRef]
- García, A.; Monsalve-serrano, J.; Sari, R.L.; Martinez-boggio, S. Energy Sustainability in the Transport Sector Using Synthetic Fuels in Series Hybrid Trucks with RCCI Dual-Fuel Engine. Fuel 2022, 308, 122024. [Google Scholar] [CrossRef]
- Solouk, A.; Shahbakhti, M. Energy Optimization and Fuel Economy Investigation of a Series Hybrid Electric Vehicle Integrated with Diesel/RCCI Engines. Energies 2016, 9, 20. [Google Scholar] [CrossRef]
- Donateo, T.; Ingrosso, F.; Lacandia, F.; Pagliara, E. Impact of Hybrid and Electric Mobility in a Medium-Sized Historic City; SAE Technical Paper; SAE: Warrendale, PA, USA, 2013. [Google Scholar] [CrossRef]
- Bingham, C.; Walsh, C.; Carroll, S. Impact of Driving Characteristics on Electric Vehicle Energy Consumption and Range. IET Intell. Transp. Syst. 2012, 6, 29–35. [Google Scholar] [CrossRef]
- Manica, L.; Croitorescu, V. Smart ForTwo Electric Conversion. In Proceedings of the 2015 Intl Aegean Conference on Electrical Machines & Power Electronics (ACEMP), 2015 Intl Conference on Optimization of Electrical & Electronic Equipment (OPTIM) & 2015 Intl Symposium on Advanced Electromechanical Motion Systems (ELECTROMOTION), Side, Turkey, 2–4 September 2015; pp. 731–736. [Google Scholar]
- Vella, A.D.; Vigliani, A.; Tota, A.; Lisitano, D. Experimental Ride Comfort Analysis of an Electric Light Vehicle in Urban Scenario; SAE Technical Paper; SAE: Warrendale, PA, USA, 2020; pp. 1–9. [Google Scholar] [CrossRef]
- Orecchini, F.; Santiangeli, A. CHAPTER TWENTY TWO—Automakers’ Powertrain Options for Hybrid and Electric Vehicles. In Electric and Hybrid Vehicles; Pistoia, G., Ed.; Elsevier: Amsterdam, The Netherland, 2010; pp. 579–636. ISBN 978-0-444-53565-8. [Google Scholar]
- Martinez-Boggio, S. Study of the Potential of Electrified Powertrains with Dual Fuel Combustin to Achieve 2025 Emissions Targets in Heavy-Duty Applications. Ph.D. Thesis, Universitat Politecnica de Valencia, Valencia, Spain, 2022. [Google Scholar]
- JSOL-Corporation Motor Design Tool Jmag International. Available online: https://www.jmag-international.com/express/ (accessed on 15 April 2023).
- Irimescu, A.; Mihon, L.; Padure, G. Automotive transmission efficiency measurements using a chassis dynamometer. Int. J. Automot. Technol. 2011, 13, 293–300. [Google Scholar] [CrossRef]
- Irimescu, A.; Vaglieco, B.M.; Merola, S.; Zollo, V.; De Marinis, R. Conversion of a Small Size Passenger Car to Hydrogen Fueling: Focus on Rated Power and Injection Phasing Effects; SAE Technical Paper; SAE: Warrendale, PA, USA, 2022. [Google Scholar] [CrossRef]
- Irimescu, A.; Vaglieco, B.M.; Merola, S.S.; Zollo, V.; De Marinis, R. Conversion of a Small-Size Passenger Car to Hydrogen Fueling: Simulation of CCV and Evaluation of Cylinder Imbalance. Machines 2023, 11, 135. [Google Scholar] [CrossRef]
- Serrano, J.R.; García, A.; Monsalve-Serrano, J.; Martínez-Boggio, S. High Efficiency Two Stroke Opposed Piston Engine for Plug-in Hybrid Electric Vehicle Applications: Evaluation under Homologation and Real Driving Conditions. Appl. Energy 2021, 282, 116078. [Google Scholar] [CrossRef]
- Info, C. Smart ForTwo Specifications. Available online: https://www.car.info/en-se/smart/fortwo/fortwo-2002-10661259/specs (accessed on 17 April 2023).
- García, A.; Monsalve-Serrano, J.; Martinez-Boggio, S.; Soria Alcaide, R. Carbon Footprint of Battery Electric Vehicles Considering Average and Marginal Electricity Mix. Energy 2023, 268, 126691. [Google Scholar] [CrossRef]
- García, A.; Monsalve-Serrano, J.; Martinez-Boggio, S.; Tripathi, S. Techno-Economic Assessment of Vehicle Electrification in the Six Largest Global Automotive Markets. Energy Convers. Manag. 2022, 270, 116273. [Google Scholar] [CrossRef]
Disclaimer/Publisher’s Note: The statements, opinions and data contained in all publications are solely those of the individual author(s) and contributor(s) and not of MDPI and/or the editor(s). MDPI and/or the editor(s) disclaim responsibility for any injury to people or property resulting from any ideas, methods, instructions or products referred to in the content. |
© 2023 by the authors. Licensee MDPI, Basel, Switzerland. This article is an open access article distributed under the terms and conditions of the Creative Commons Attribution (CC BY) license (https://creativecommons.org/licenses/by/4.0/).