Communication

Statistical Evaluation of the Impacts Detection Methodology (IDM) to Detect Critical Damage Occurrences during Quay Cranes Handling Operations

1
Marine Research Institute, Klaipeda University, H. Manto g. 84, LT-92294 Klaipeda, Lithuania
2
Department of Telecommunications, VSB—Technical University of Ostrava, 17. Listopadu 2172/15, 708 00 Ostrava-Poruba, Czech Republic
*
Author to whom correspondence should be addressed.
Machines 2023, 11(6), 638; https://doi.org/10.3390/machines11060638
Submission received: 5 May 2023 / Revised: 29 May 2023 / Accepted: 6 June 2023 / Published: 9 June 2023
(This article belongs to the Section Machines Testing and Maintenance)

Abstract

:
During various marine container handling operations, performed mainly in larger-scale container terminals, containers get damaged regularly. Our previous studies showed that each physical impact results in some form of physical deformation of the backbone structure. Even at low accelerations, the spreaders of the quay cranes impact the containers with enough force to substantially bend the metal parts of the corners of the containers, when additional hooking procedures are required. This means that the first time resulted in the metal rods hitting the metal frame with an average 15-ton mass at the average speed of 1.7 m/s. The metal rods of the hooking mechanisms’ impact areas of the containers are structurally important, and each impact surely damages the containers, diminishing their total operational time. We have already proposed the Impacts Detection Methodology (IDM) and its application system, tested in Klaipeda City port, and it proved to be efficient in real-time operations, detecting concurrent impacts with each new handling cycle. In this paper, we provide a summarisation of a larger number of detections using the IDM, and as a result of this analysis, we have detected that more impact events happen when containers are taken from the upper parts of the ship, in comparison to the ones taken from the shafts. Results suggest that more critical events occur due to operator actions and experiences working with the machinery, yet the same operators tend to make fewer impact mistakes taking the containers from the shafts as the vertical cell guides tend to direct the movements and lower the levels of the natural sway of the spreader inside closed environments. This surely damages the metal infrastructure of the shafts, as seen in our previous study, but minimizes the chances of secondary impacts occurring during hooking.

1. Introduction

Marine containers are constantly damaged during handling procedures, transportation and simple storage with external natural influences: wind gusts blowing containers from the stacks, corrosion of important structural elements and higher levels of humidity damaging the packages [1]. However, research showed fewer systems exist in the market that monitor these critical parameters and detect flaws in the operations in due time [2]. Novel solutions mainly deal with optimisation problems related to optimal stacking, allocation in the terminal, transportation and other managerial tasks [3,4,5]. Other systems rely on visual inspection techniques and research methods [6]. Namely, Mi et al. [7] analysed the problems of handling operations in ports, related to the security and safety of these operations and the importance of automation of these processes. They proposed a two-stage classification method to improve the accuracy of human detection for open-air handling operation areas in Tianjin port. Furthermore, Wang et al. [8] proposed a multi-type damage detection model for containers based on transfer learning and MobileNetV2 using CNN based on transfer learning, and Lee [9] enriched this research direction by utilising an end-to-end method by taking a low-quality video input and producing bounding boxes around corner castings by applying a recurrent neural network along with long short-term memory units, all computed in a specially developed system that uses back-propagation allowing joint tuning of all components, with the expressive image features from GoogLeNet used to produce intermediate image representations. Other attempts to involve neural network structure were also made in the area of control of crane motors [10,11], with decent results achieved already, coupled with machine vision techniques and novel cameras [12].
Other researchers analyse the sway patterns and the dynamics of the movements of the crane, its spreader mechanisms and the container maneuvering [13,14]. Here, Andersen and Jenses [15] investigated full-scale measurements of the wave-induced vertical bending moment amidship a large container carrier, and focuses on the effect of the hydro-elastic high-frequency vibration on the extreme hogging wave bending moment, and Szyszko [16] investigated the phenomenology of problems of cell guides container ships wear processes, taking into account the tribological and non-tribological types of wear processes in the carriage by sea and in the process of containers handling at the maritime port [17]. There were also other attempts to dampen the sway of the spreader, either by means of stabilisation mechanisms pulling the lines, or the mathematical modeling techniques addressing the physical nature of the dynamical process [18,19,20].
The most promising technological tracking innovations were presented by Salman et al. [21]. They adopted the real-time container tracking options to enhance the safety and productivity of logistics operations, enabling real-time tracking of containers as an IOT solution, as a result leading to smart logistics operations; recently, Jakovlev et al. [22] discovered a simplified solution to detect criticalities in the handling operations related to impact detection to the corners of the containers by the crane mechanisms. In recent literature, this was one of the first attempts to analyse the problem of handling from the acceleration perspective of the handling process. Further investigations resulted in the development of the impacts detection methodology (IDM), which has proved its value in handling operations as an embedded solution in the Klaipeda city port [23]. It was experimentally tested and the prototype system was validated in actual handling activities at LKAB “Klaipedos Smelte” container terminal [24]. As our previous research suggested, as well as the results of [1,25,26,27] indicate, the topic of container structural health monitoring is a hot topic, and therefore improvements of the IDM must be researched more. As we have indicated previously, the most important impacts occur during spreader faulty hooking procedures, which results in structural damage of the corner metal parts, which form the stability carcass of the containers (see Figure 1).
Repair of these structural elements is a true headache for repair units [28,29], as the removal of certain elements of the stability of the containers results in operational delays of this container and their overall operational period, and links these containers to further events due to a lack of structural stiffness, lower by comparison protection against corrosion and the overall deformation of the structure.
Therefore, the problem statement for this paper would be:
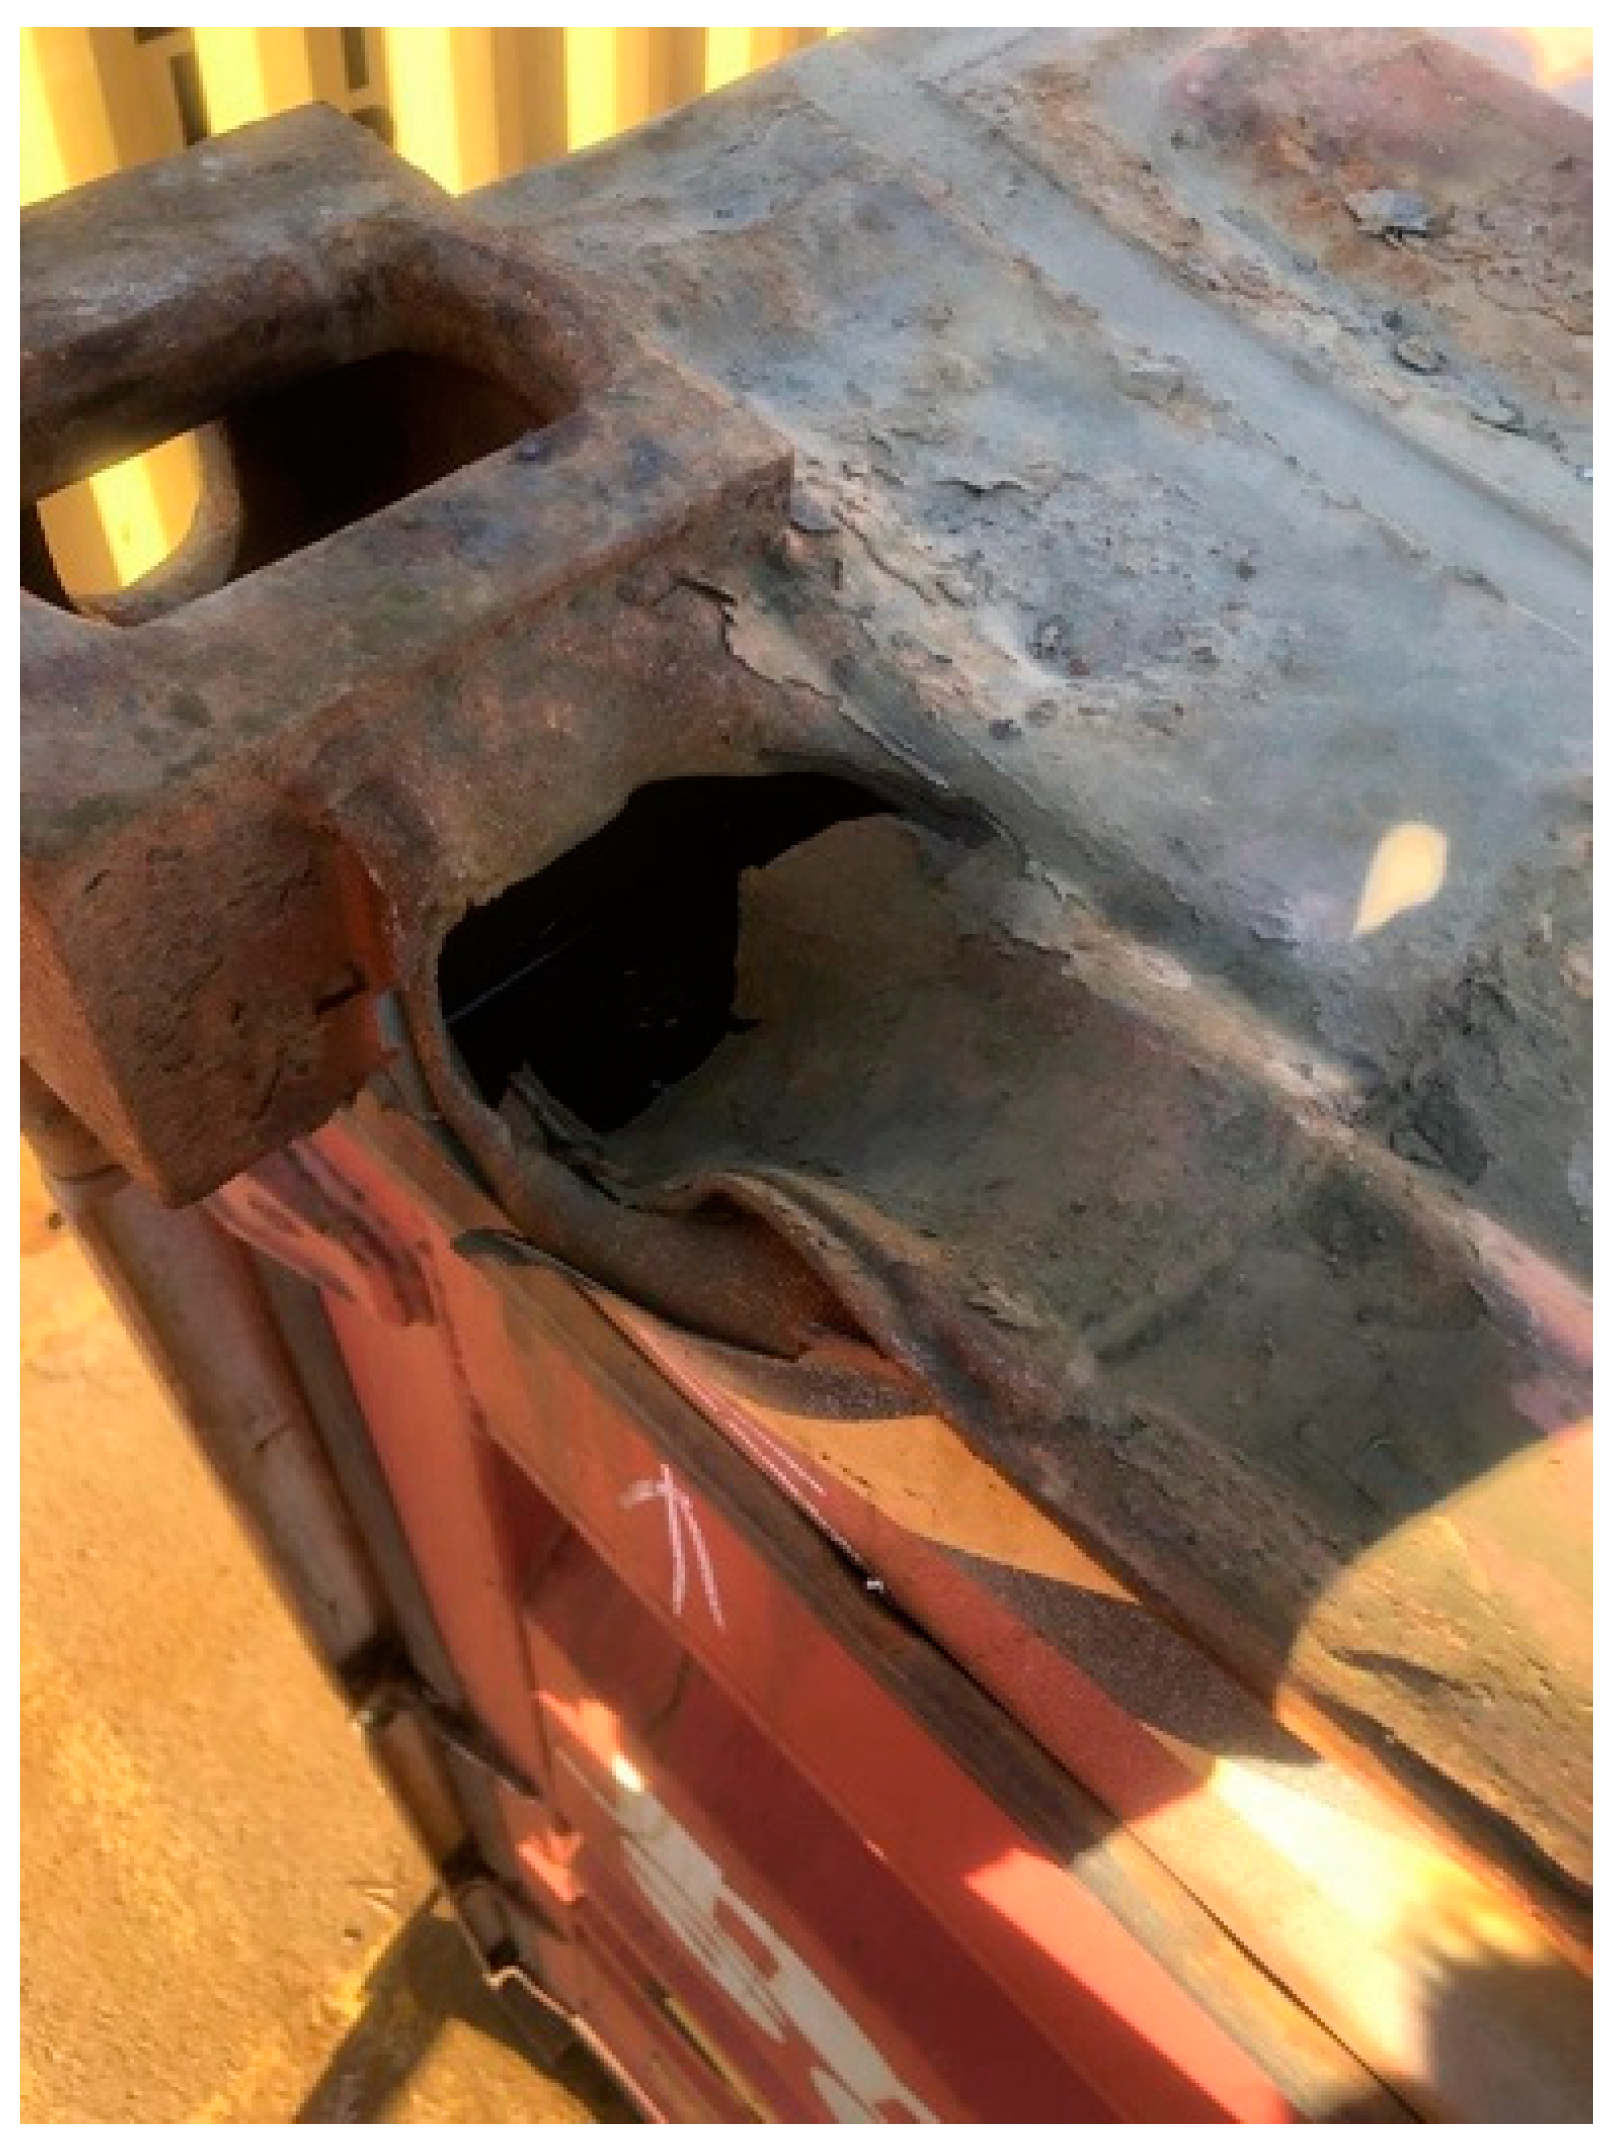
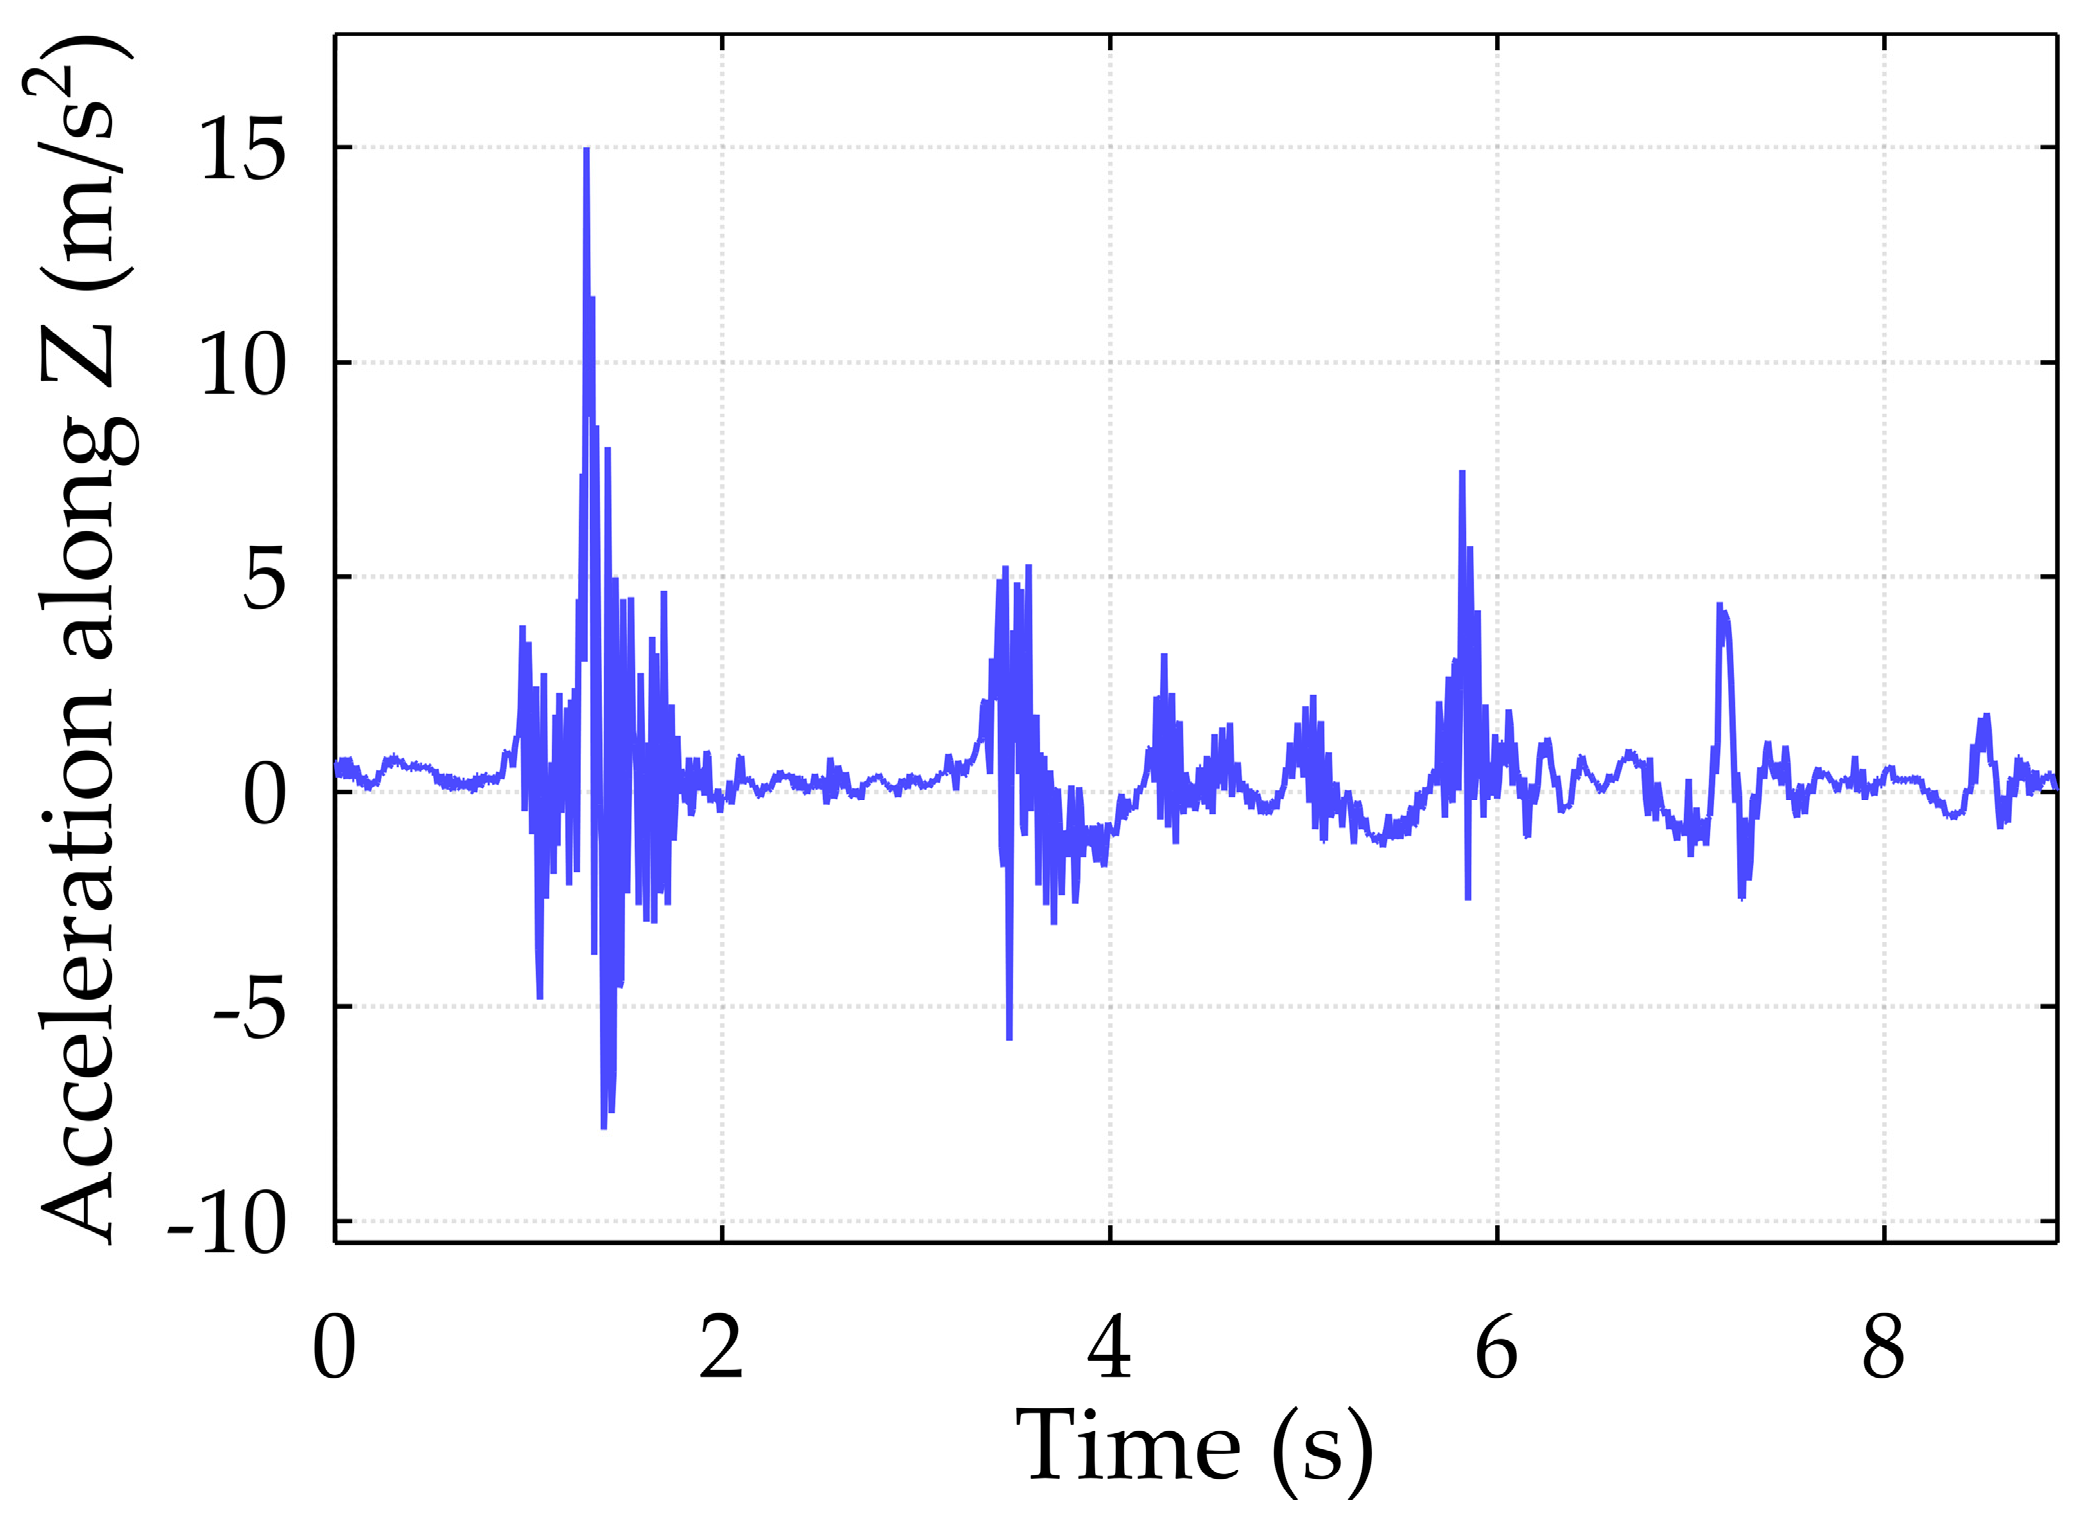
  • When the crane lowers the spreader on the ship towards the container, there is always a chance that the spreader impacts the container with a higher force.
  • If the crane operator correctly aims the spreader, all four hooks of the spreader engage in the hooking sockets of the container and the remaining vibration is generated by the contact surfaces between the container and the spreader’s mechanical parts. These low oscillations are not considered a problem state.
  • When the spreader mechanisms are aimed wrongfully, the hooks encounter the container first, then the rest of the spreader contacting surfaces damaging the container’s structural elements. After a hooking failure, the operator must raise the spreader a bit and re-attempt to hooking procedure, delaying operations.
The intent of this paper would be:
  • to further demonstrate the efficiency of the IDM detecting true physical impacts during handling operations from the ships and to provide statistically proven evidence that the problem area is too big to be discarded by the community, requiring the involvement of many engineers and specialists working with dynamic and control systems, mechanics and structural engineering, signal processing and data mining tools.

2. Materials and Methods

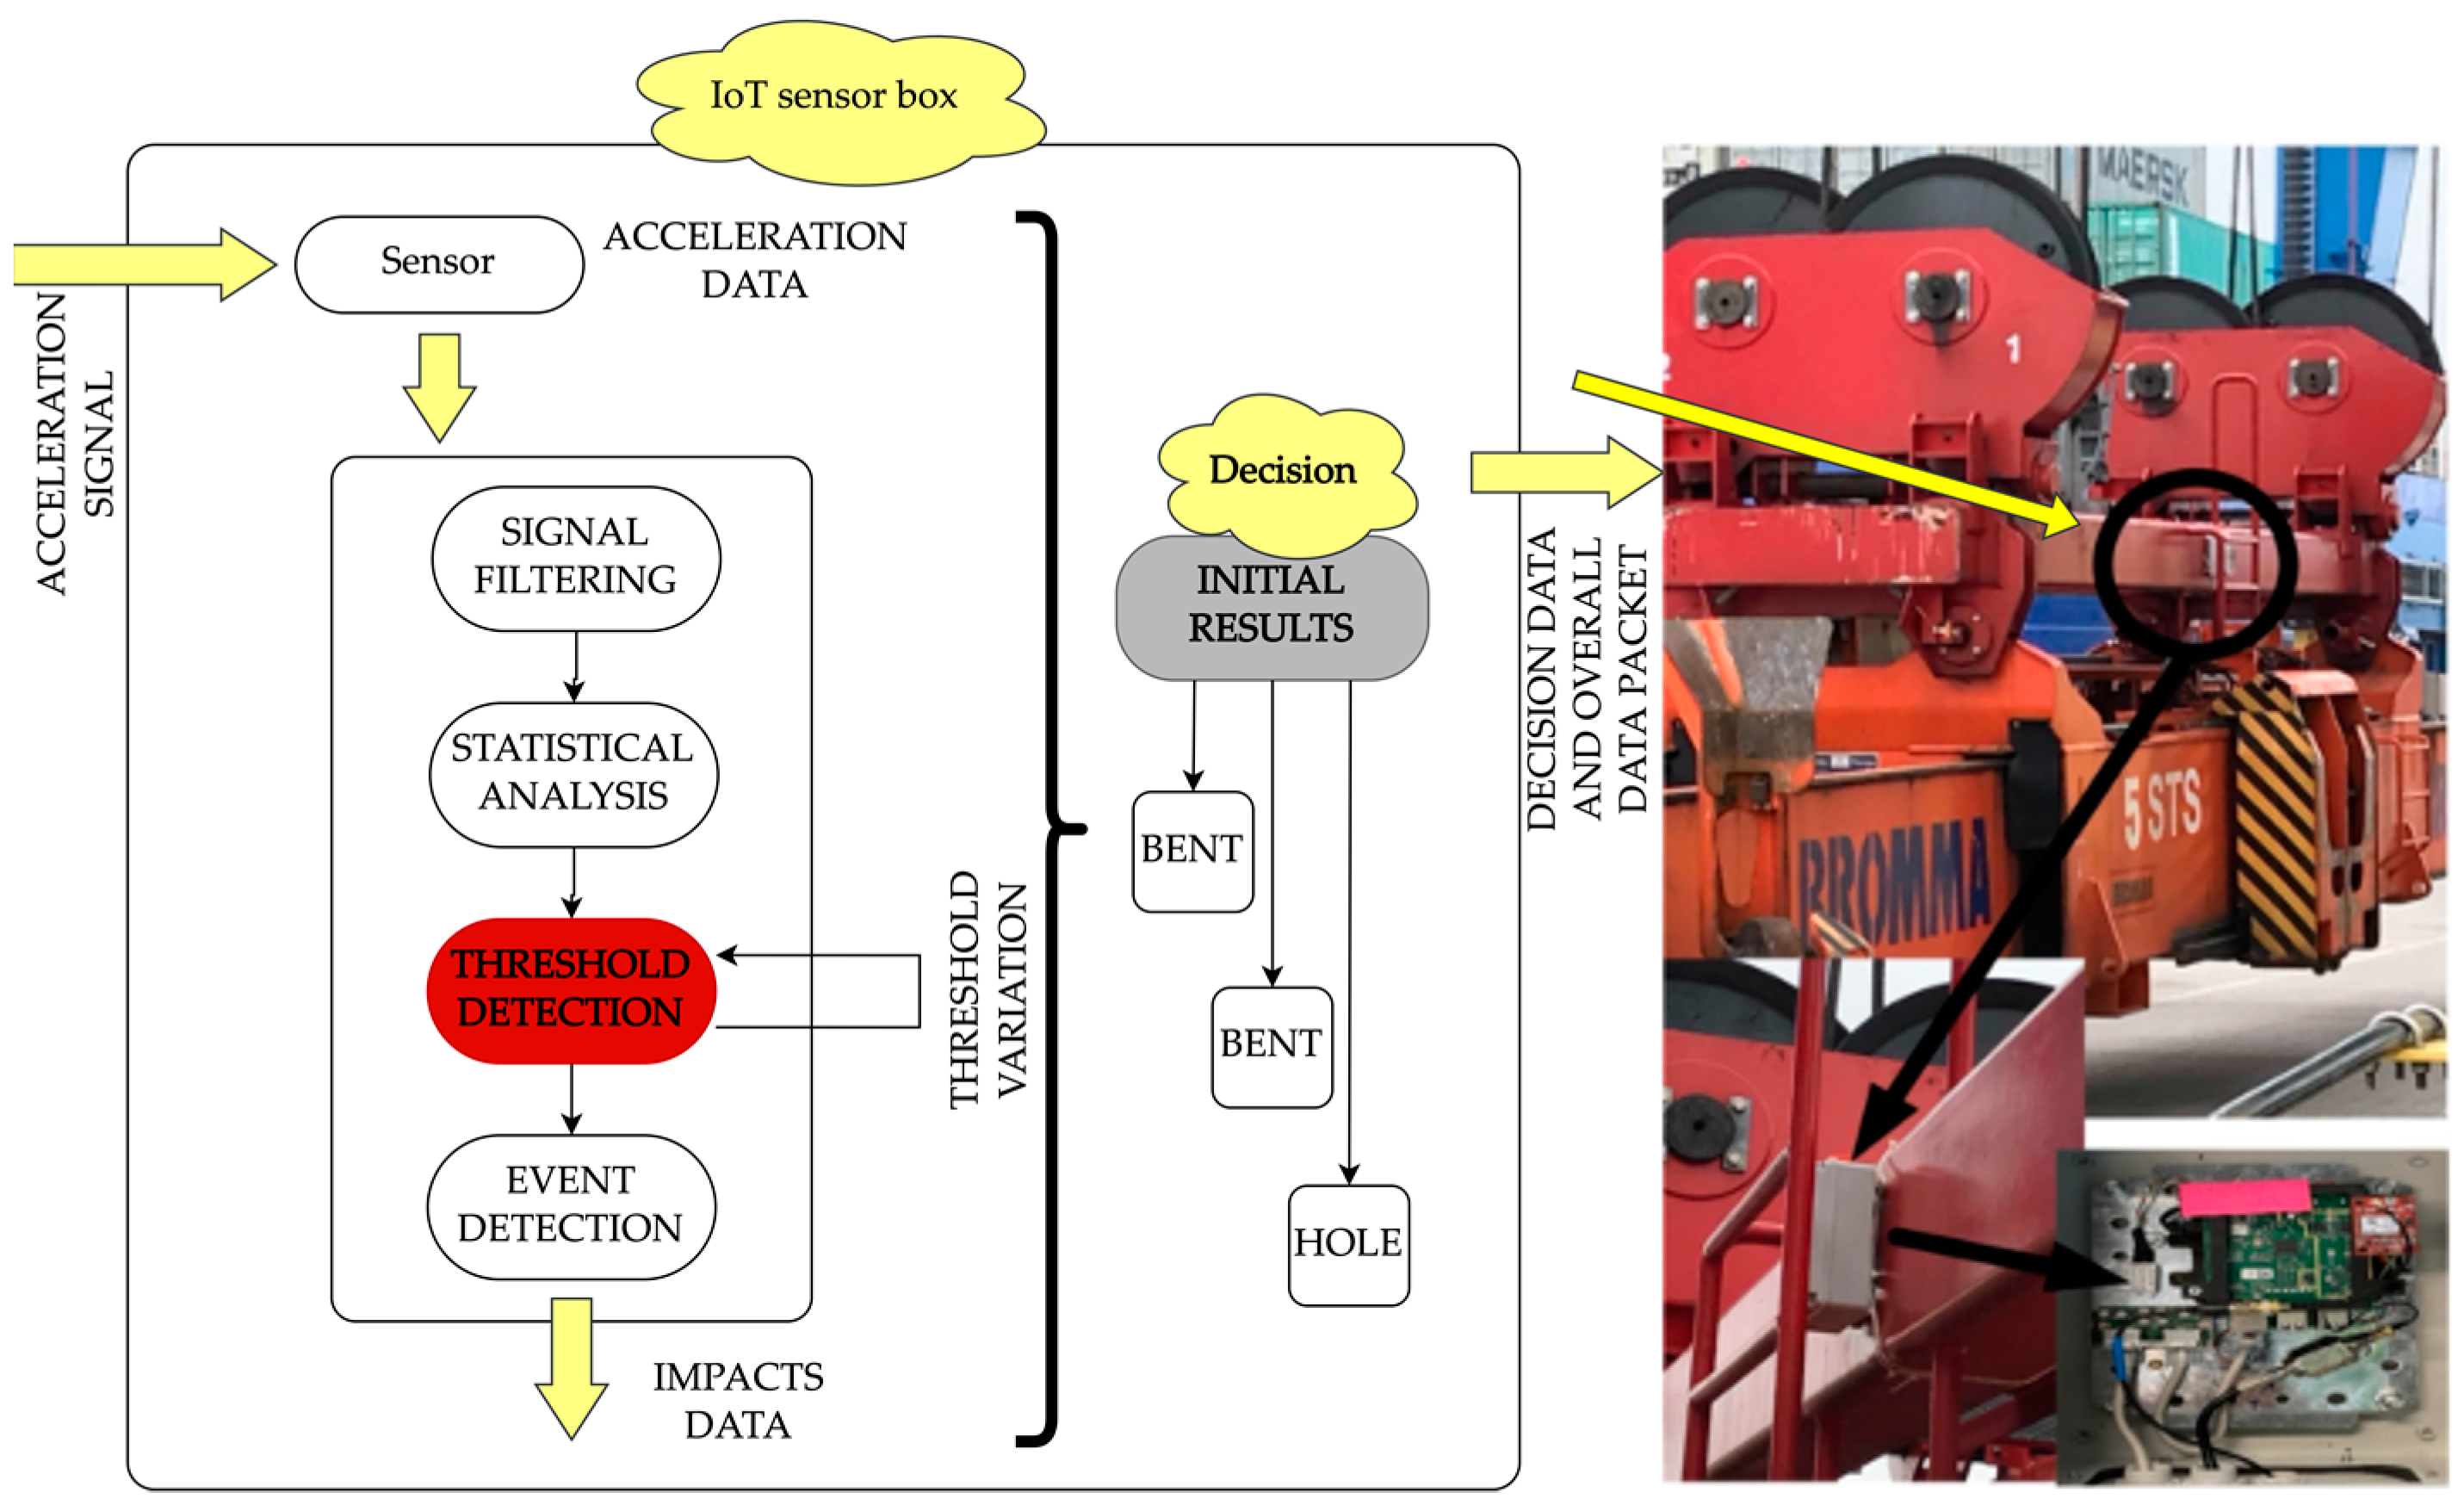
2.1. Detection Technique

The steps in the suggested IDM method for detecting impacts from a crane spreader into a container are filtering the signal, finding peak values in the filtered signal using statistical analysis, choosing the threshold steps, differentiating potential moments of impacts (events) using the threshold value, excluding the actual critical impact events, by grouping all the potential events and figuring out repeated impacts in the same area (refer to Figure 2).
The event frequency, which at this time equates to 100%, is detected by the threshold detection algorithm utilized by the IDM to determine the required optimal threshold level to be used as a starting point for impact detection. This threshold assessment technique has proven its adaptability in real-time applications already. Figure 2 demonstrated the main elements of the IDM (the necessary detection steps), whereas the description of the sensors, their placement and the entire detection framework can be accessed in more detail in [22].

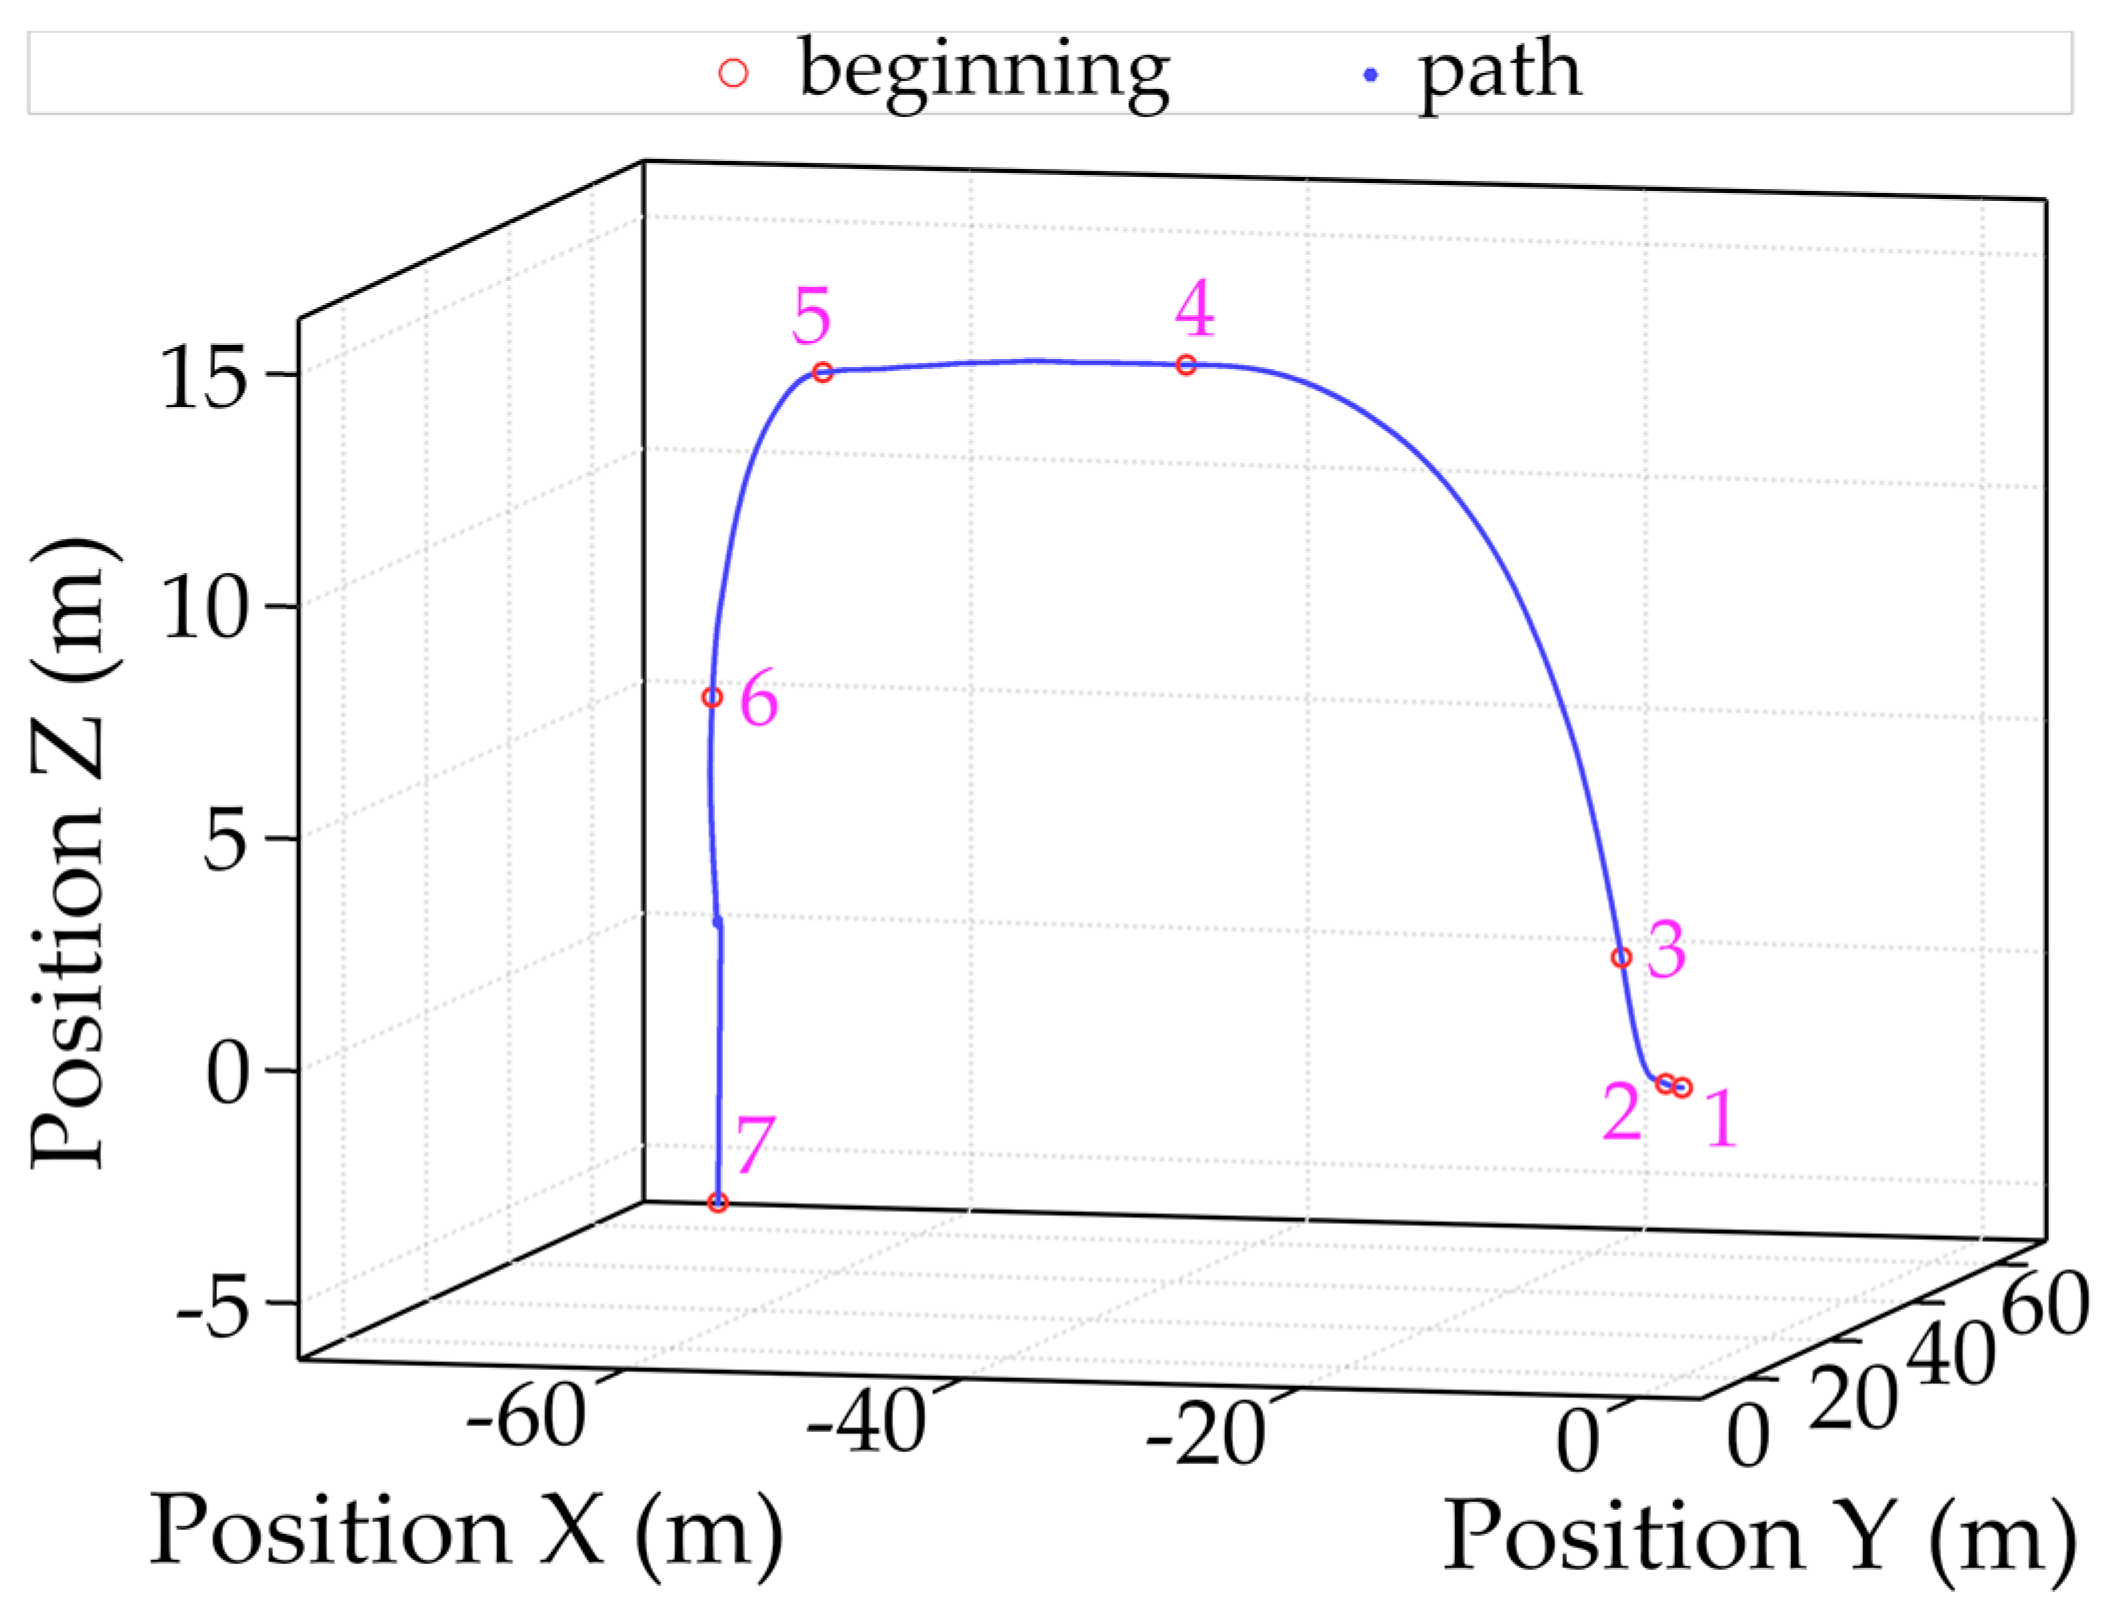
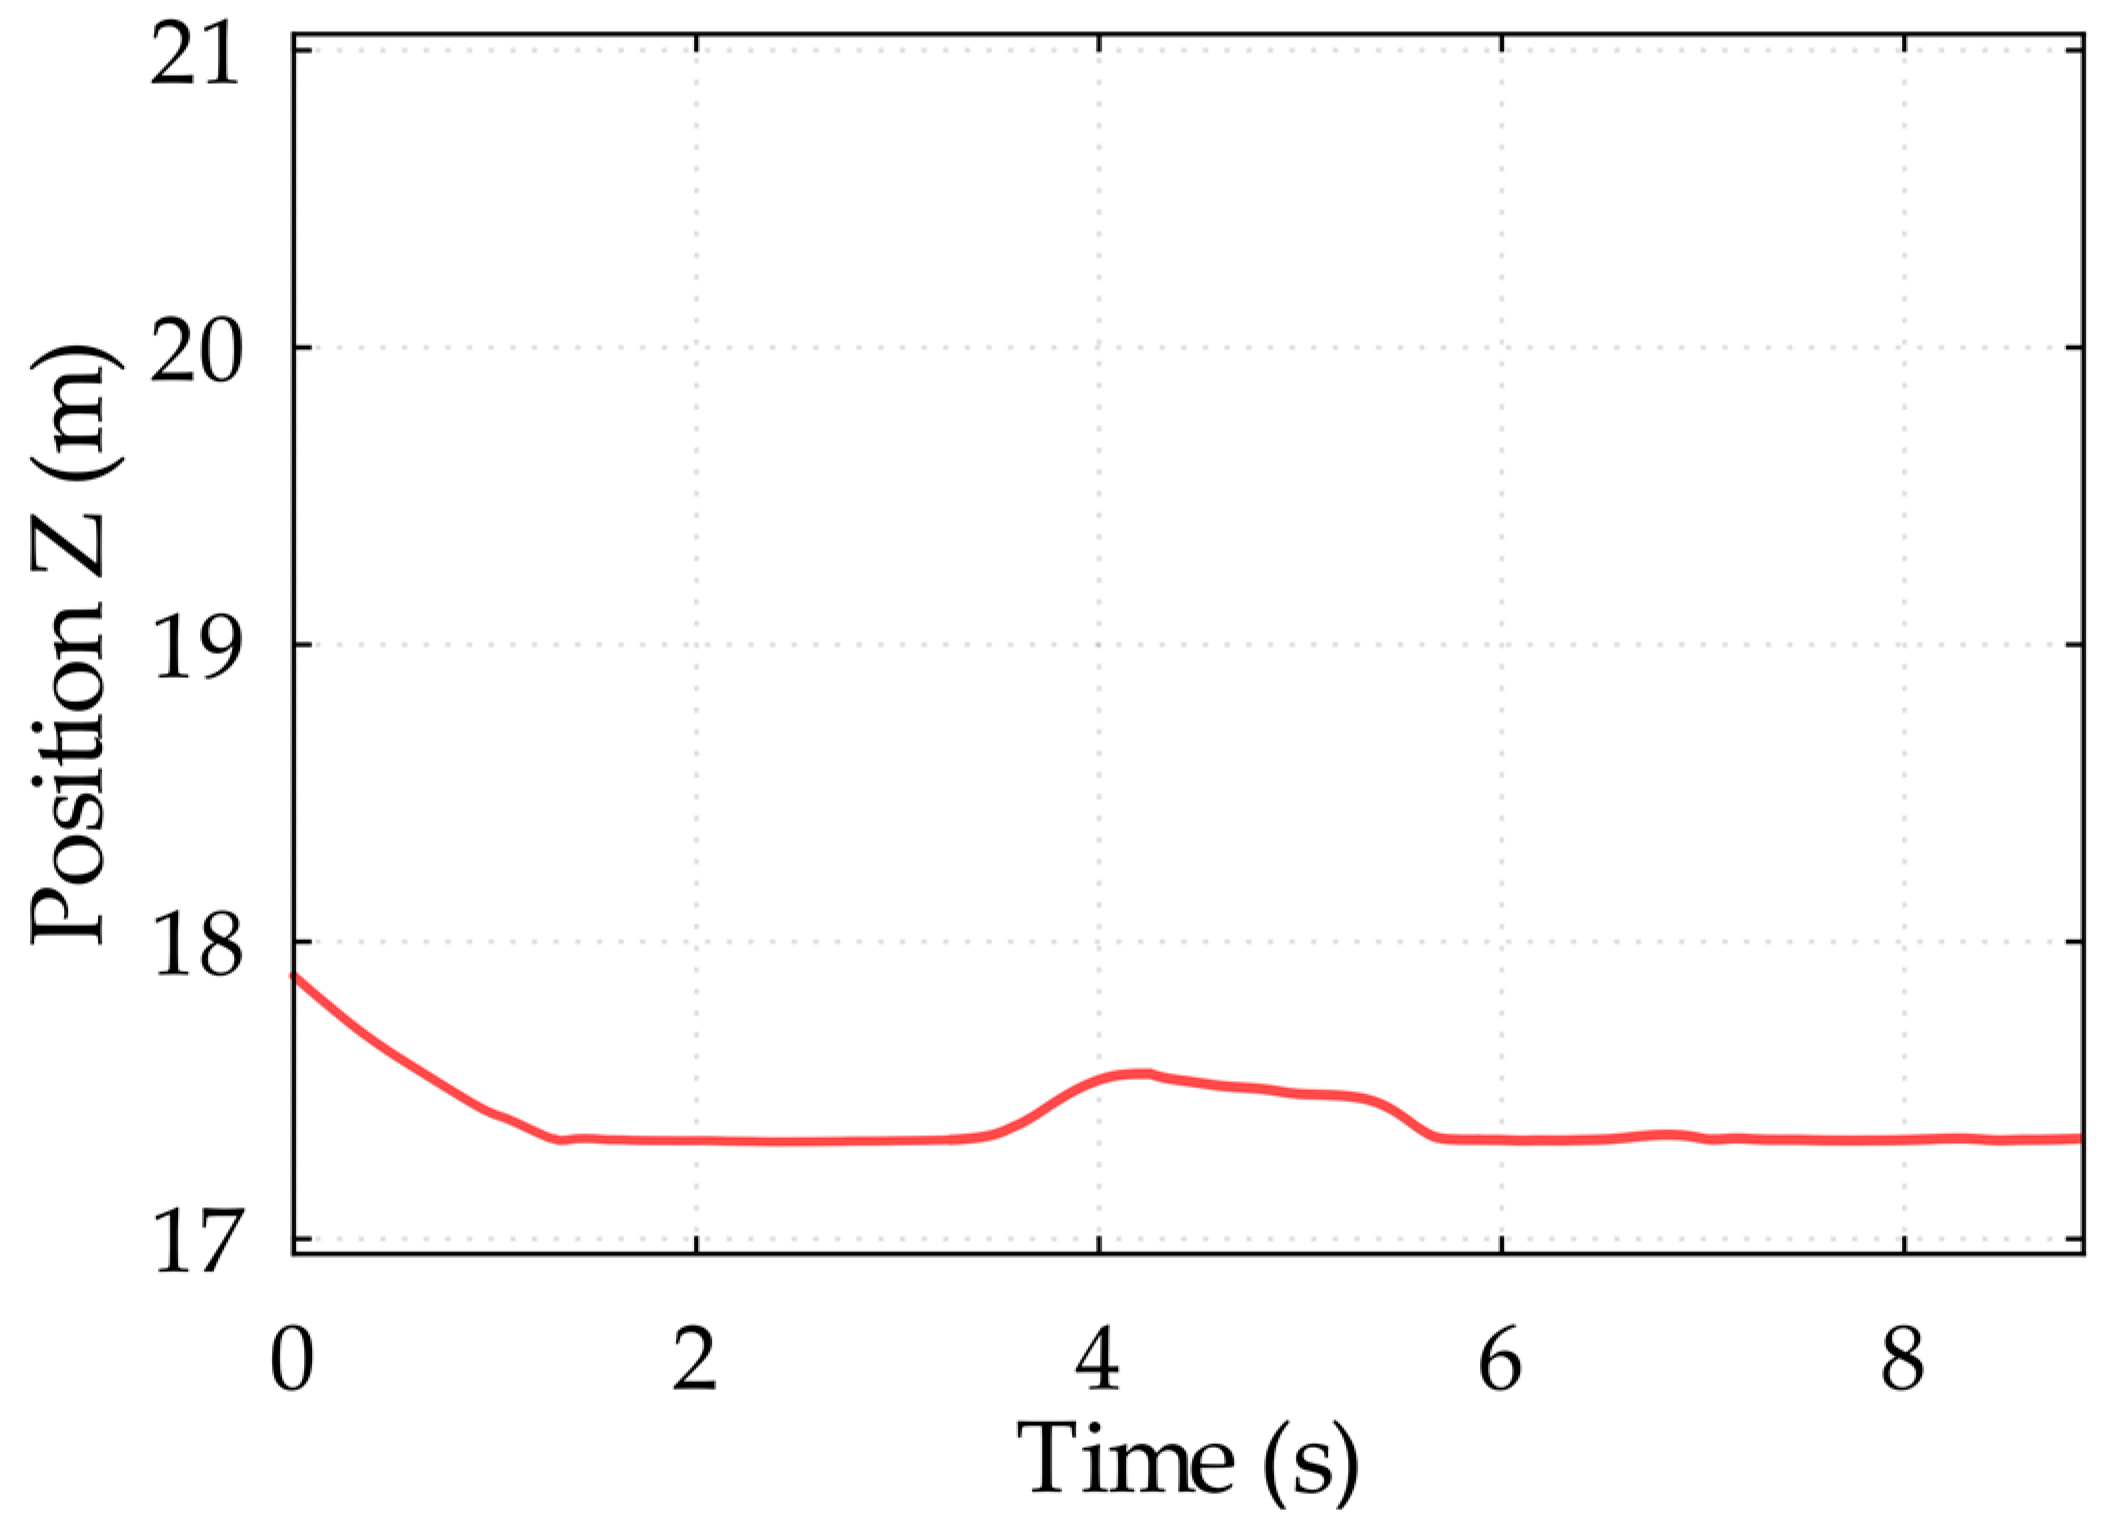
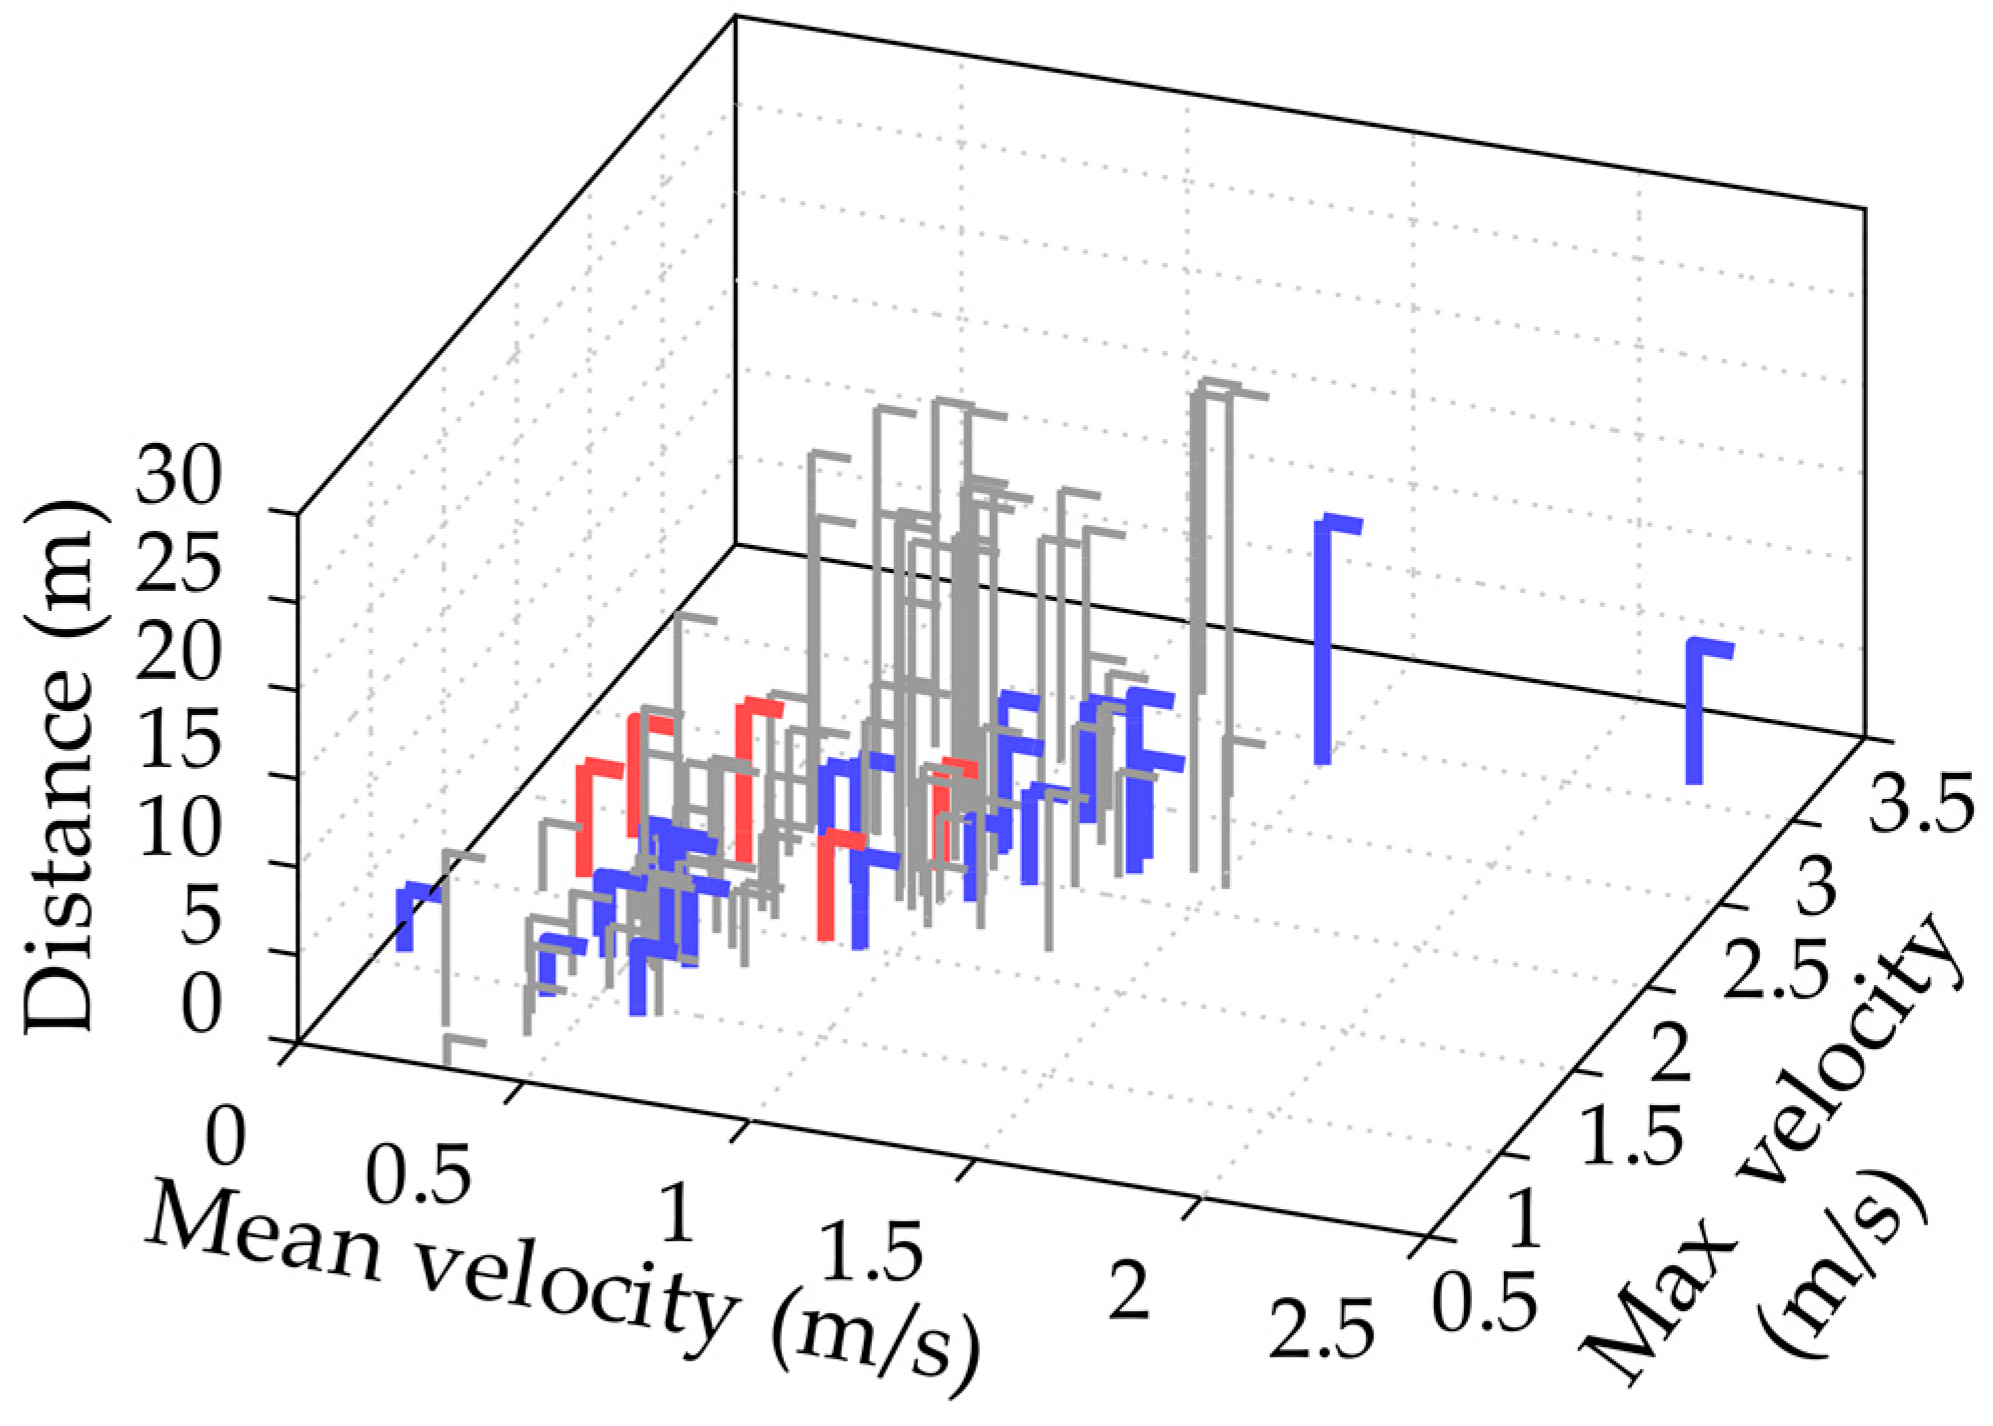
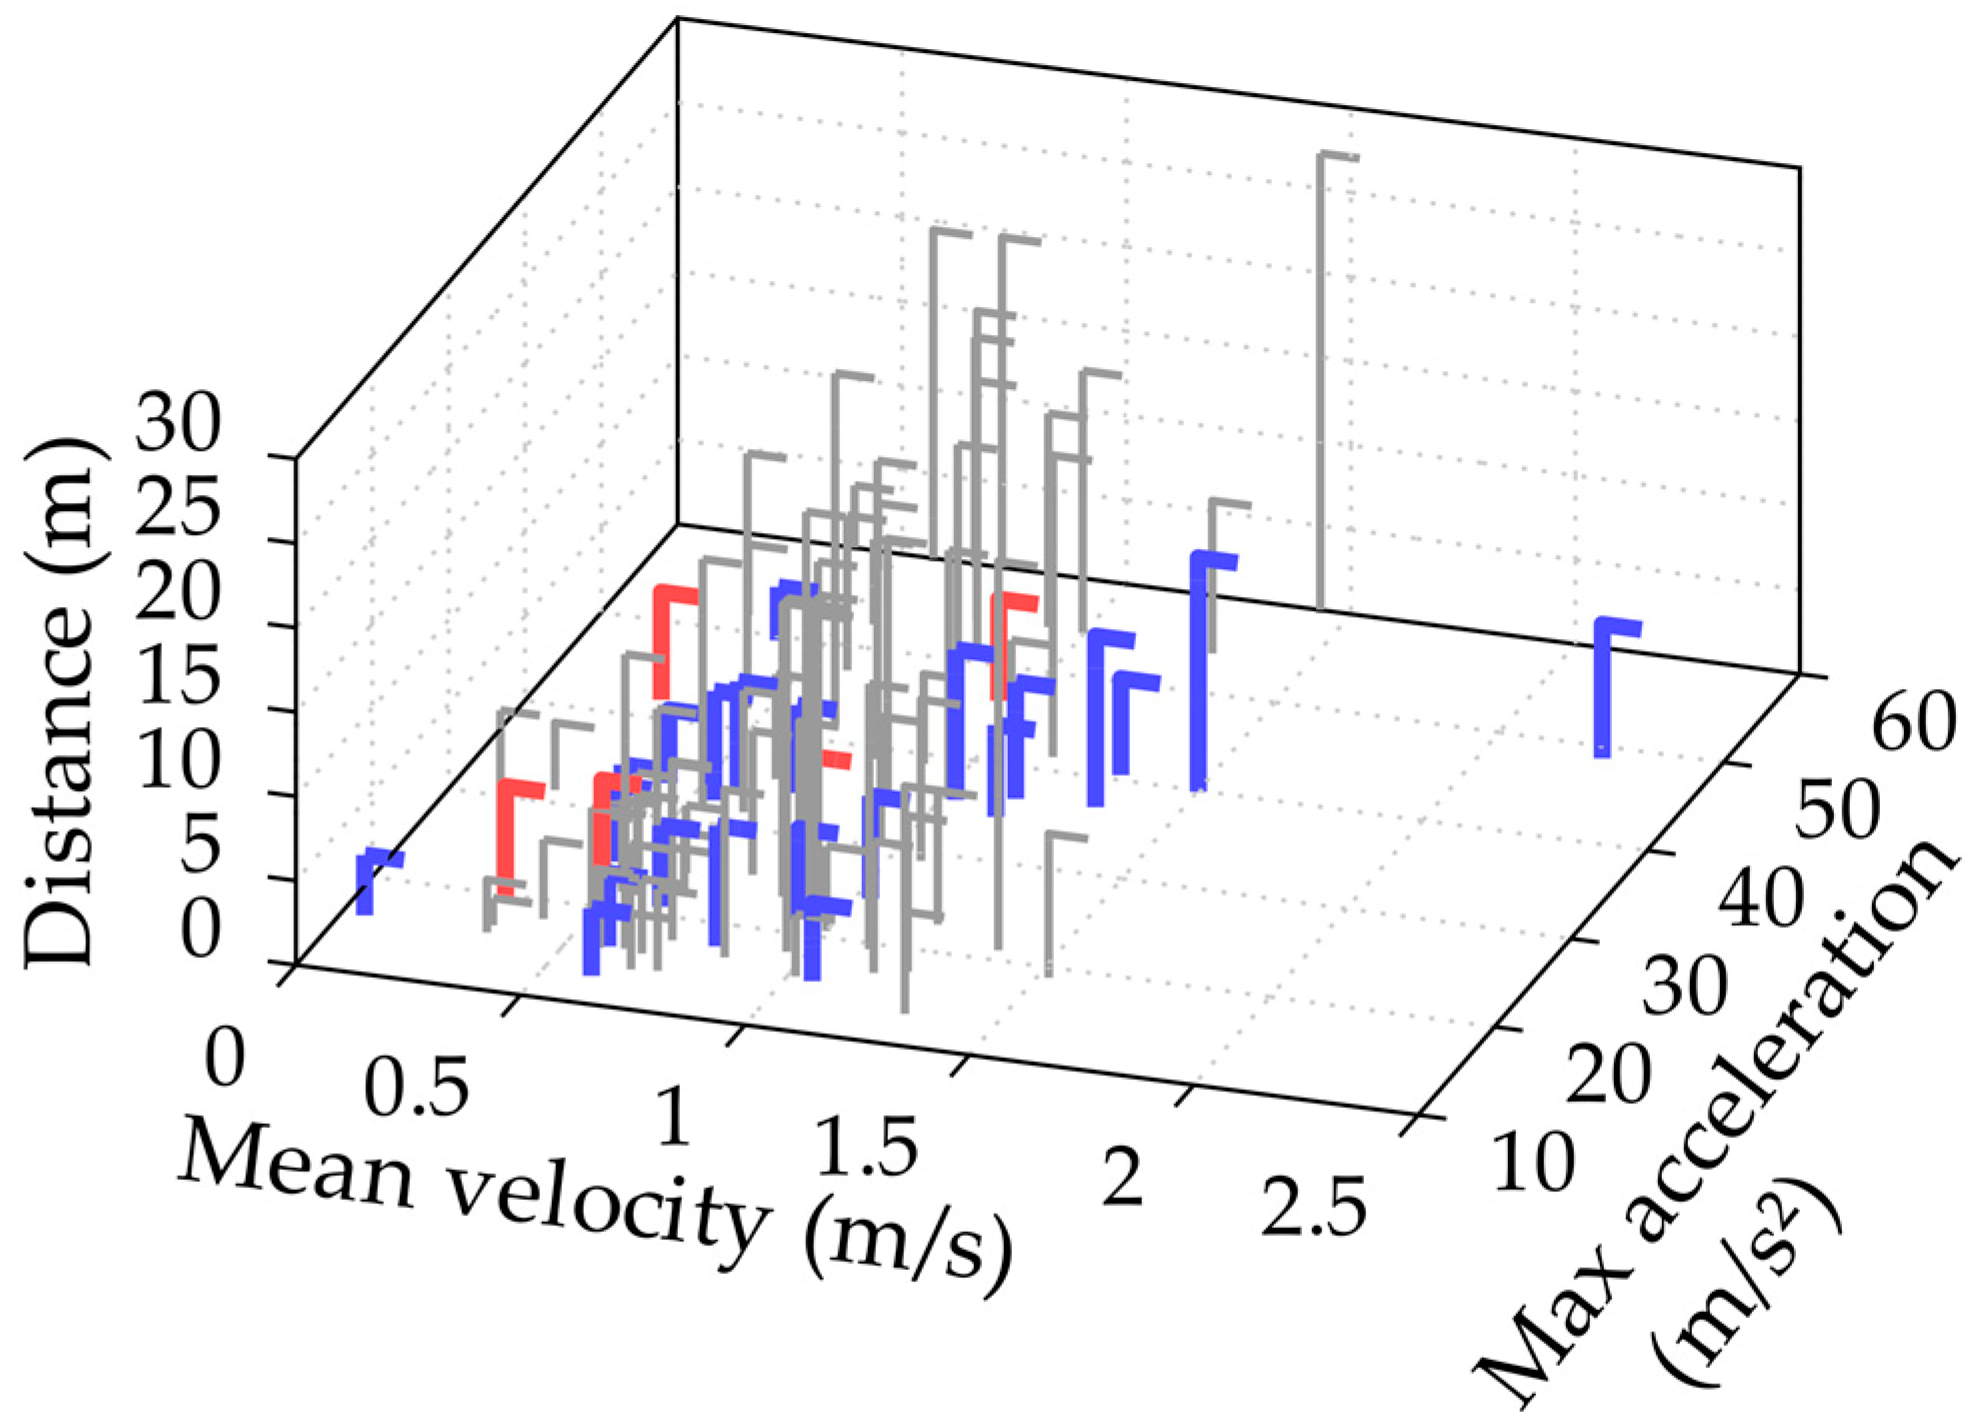
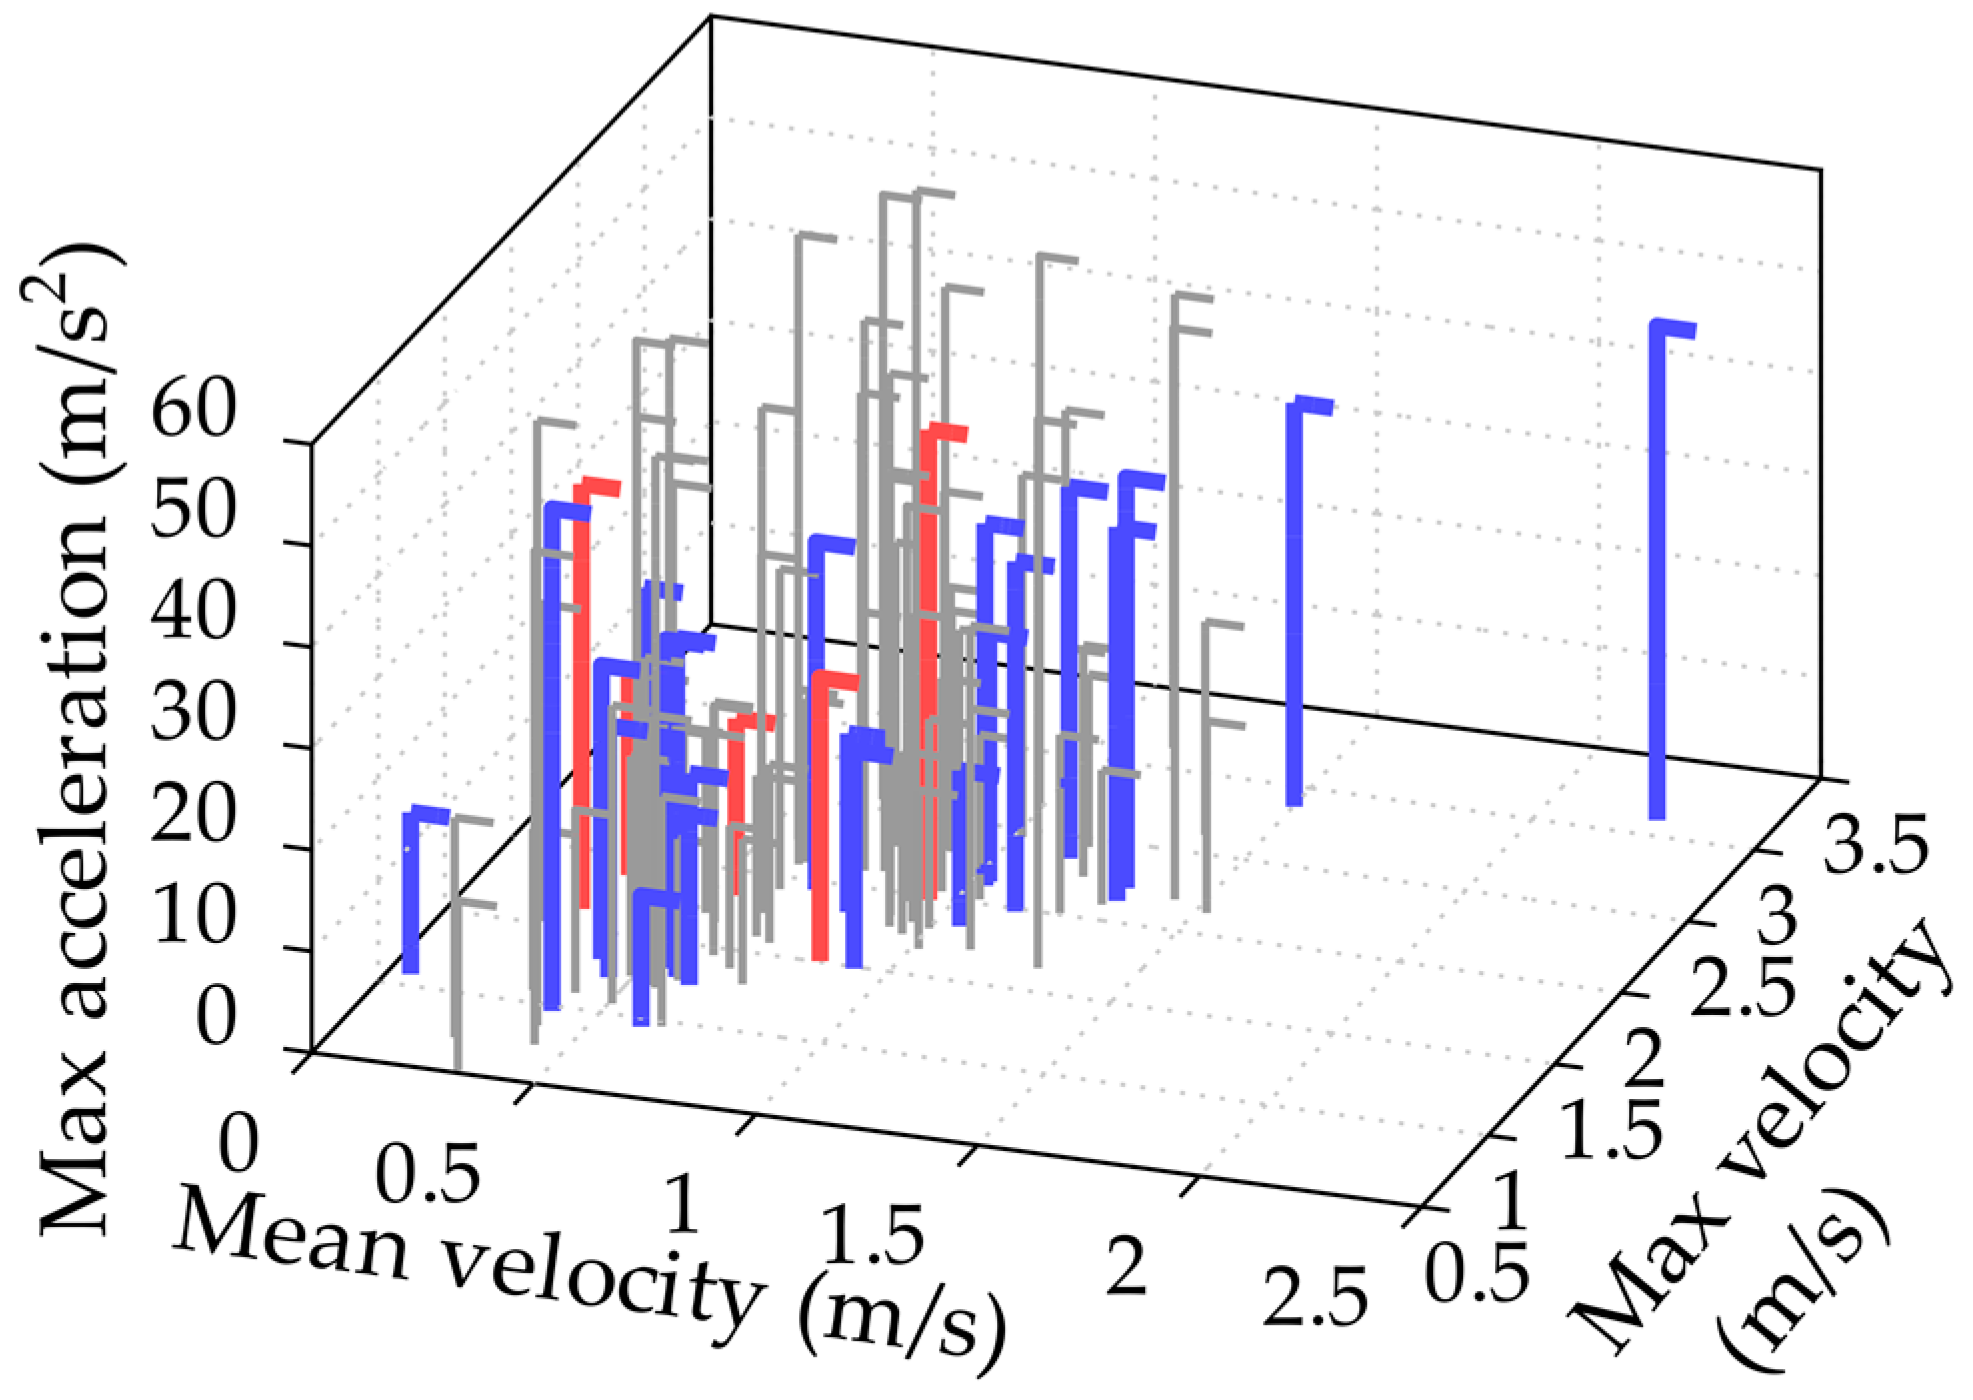
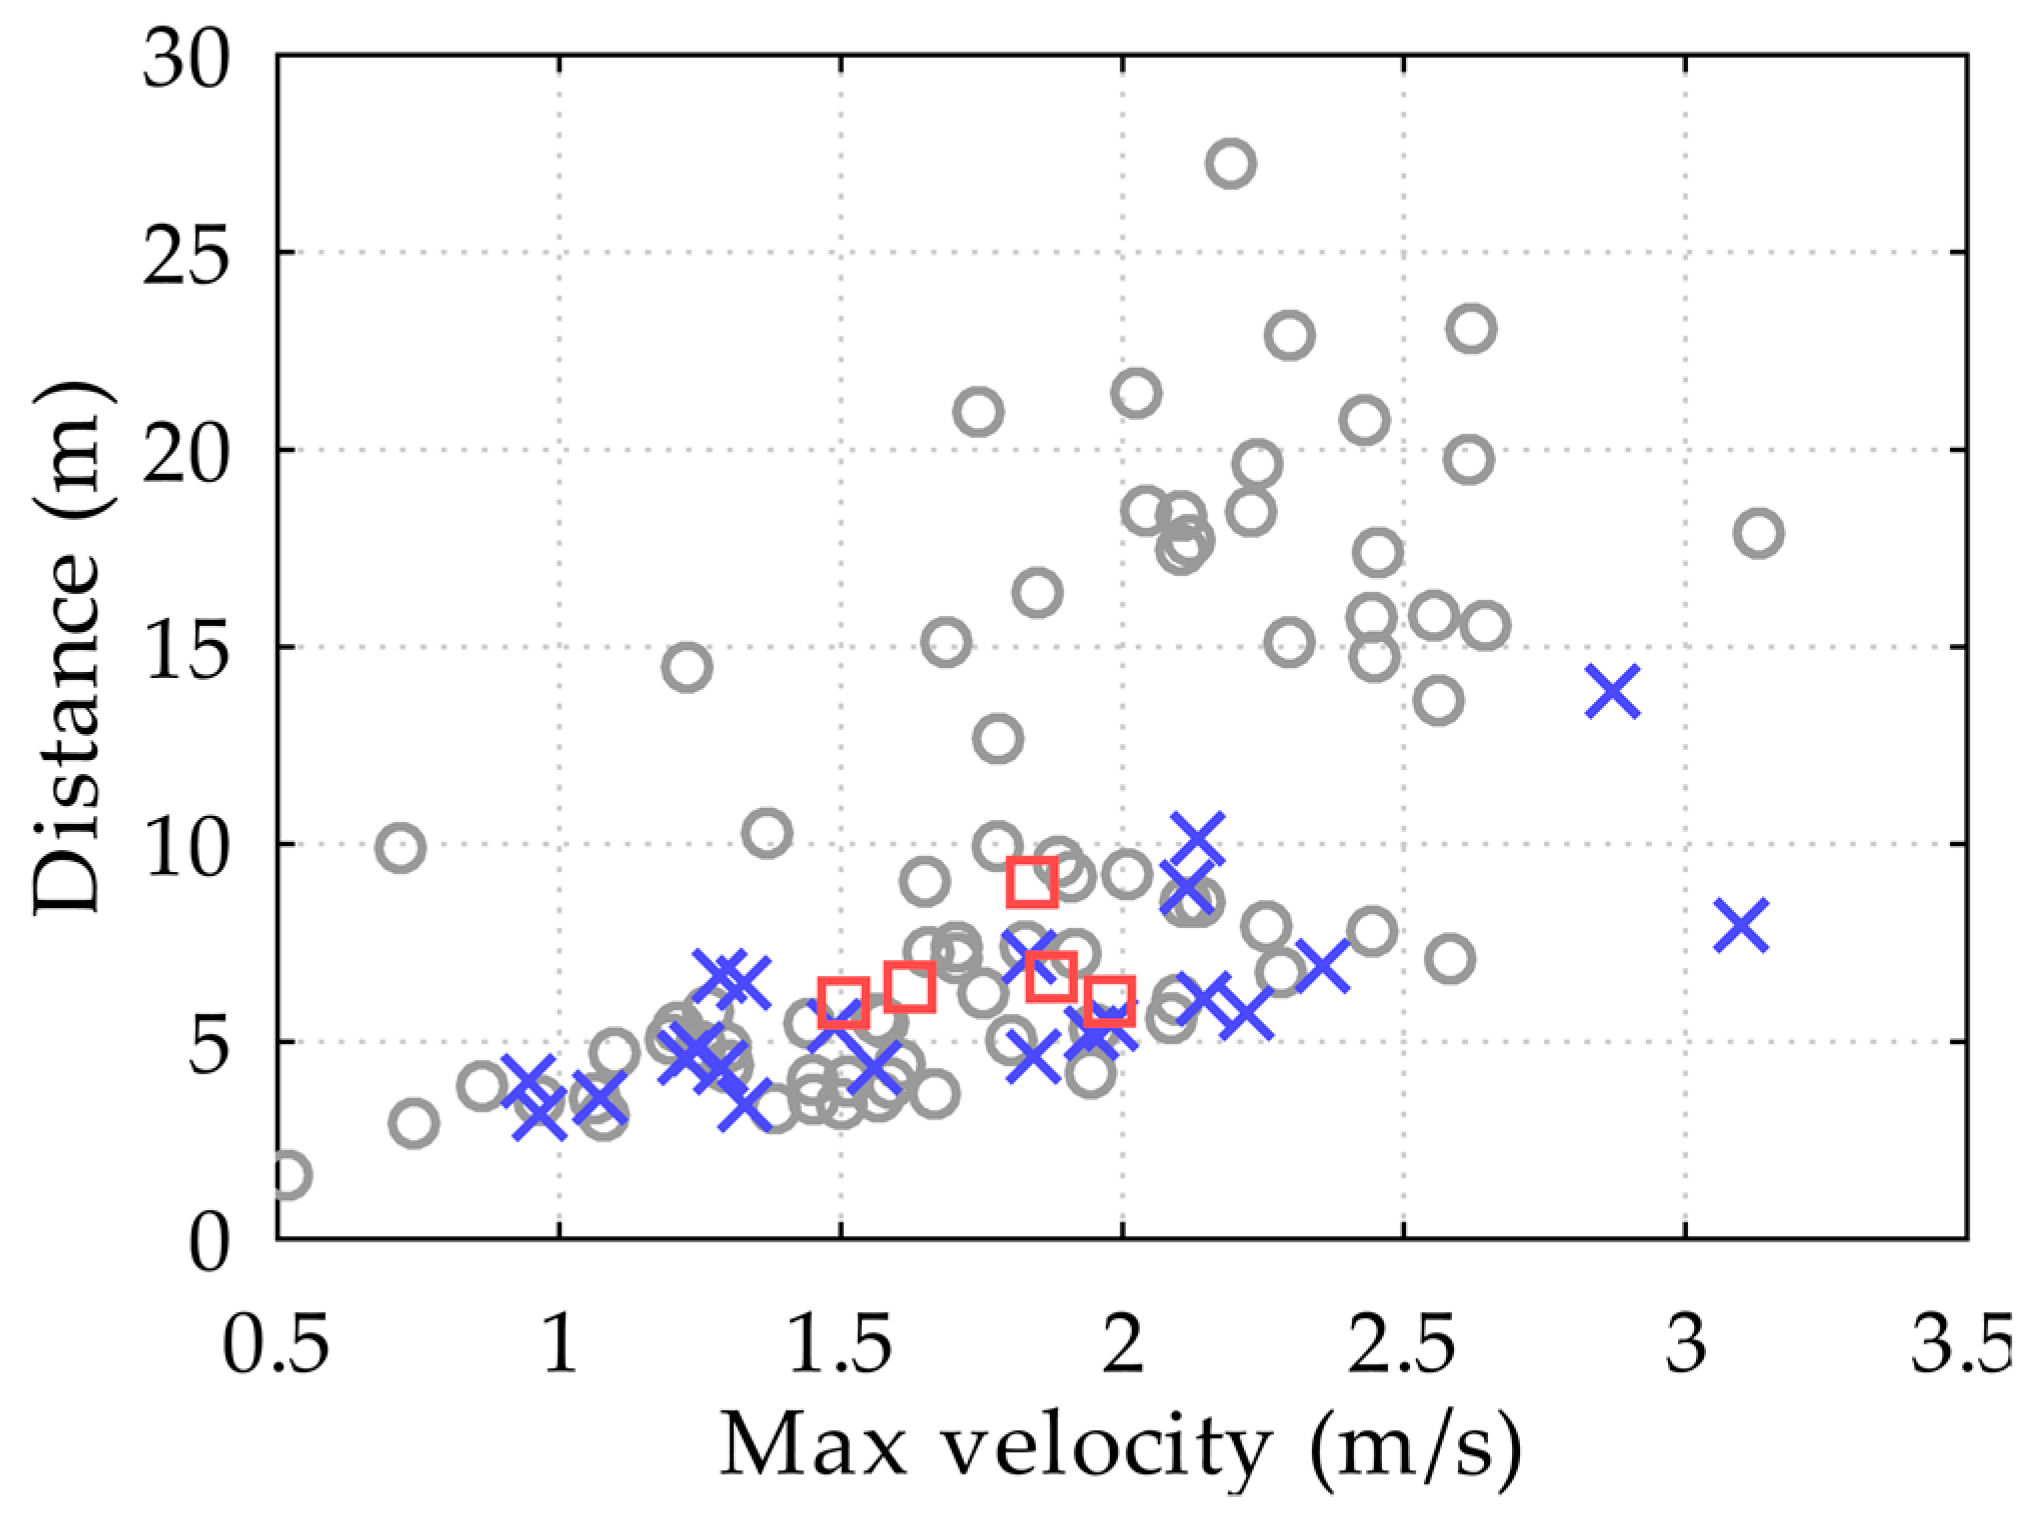
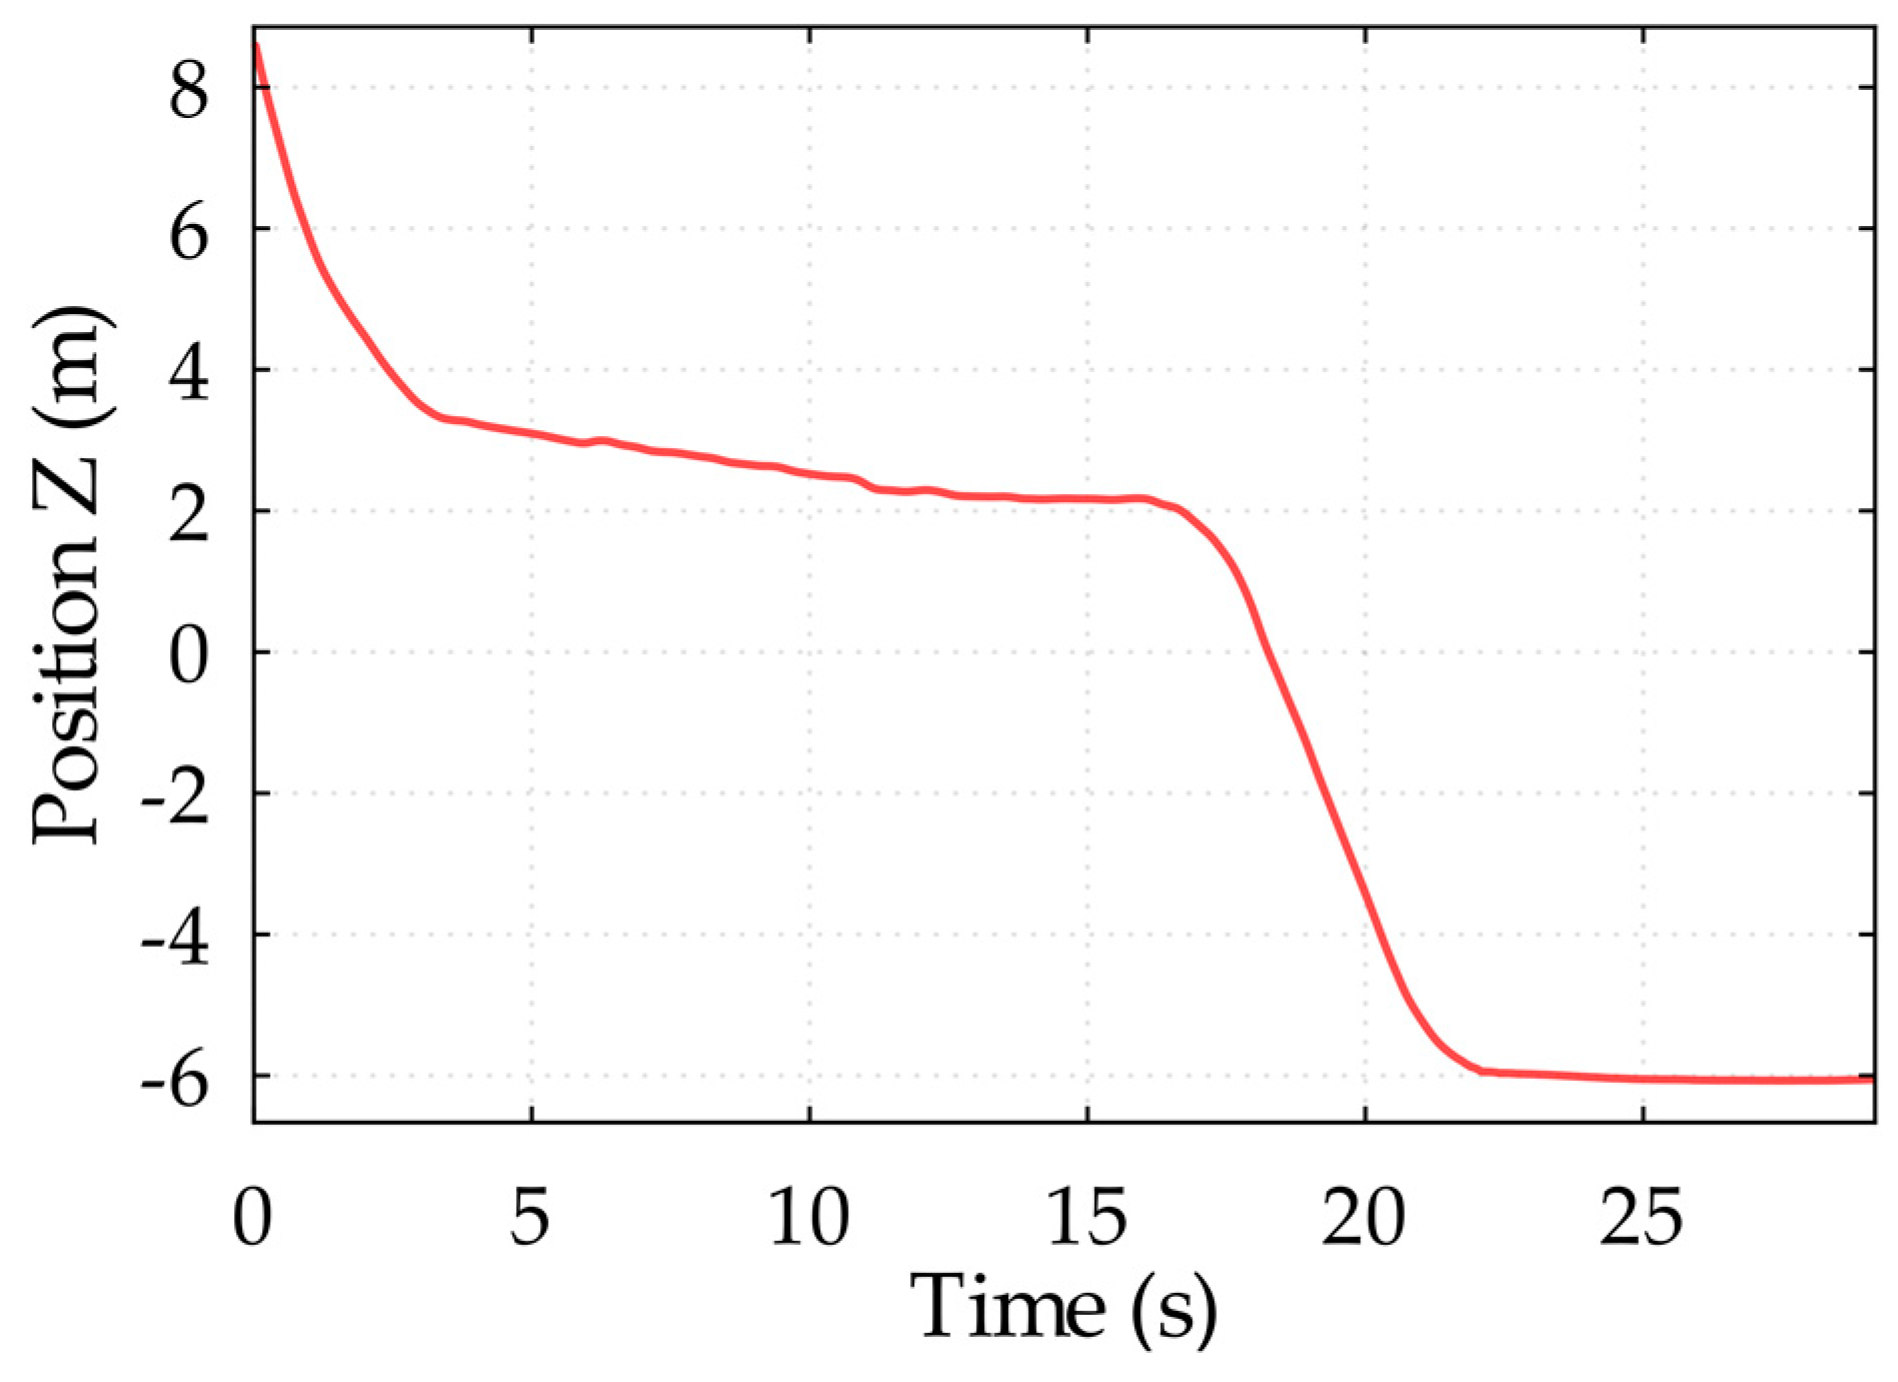
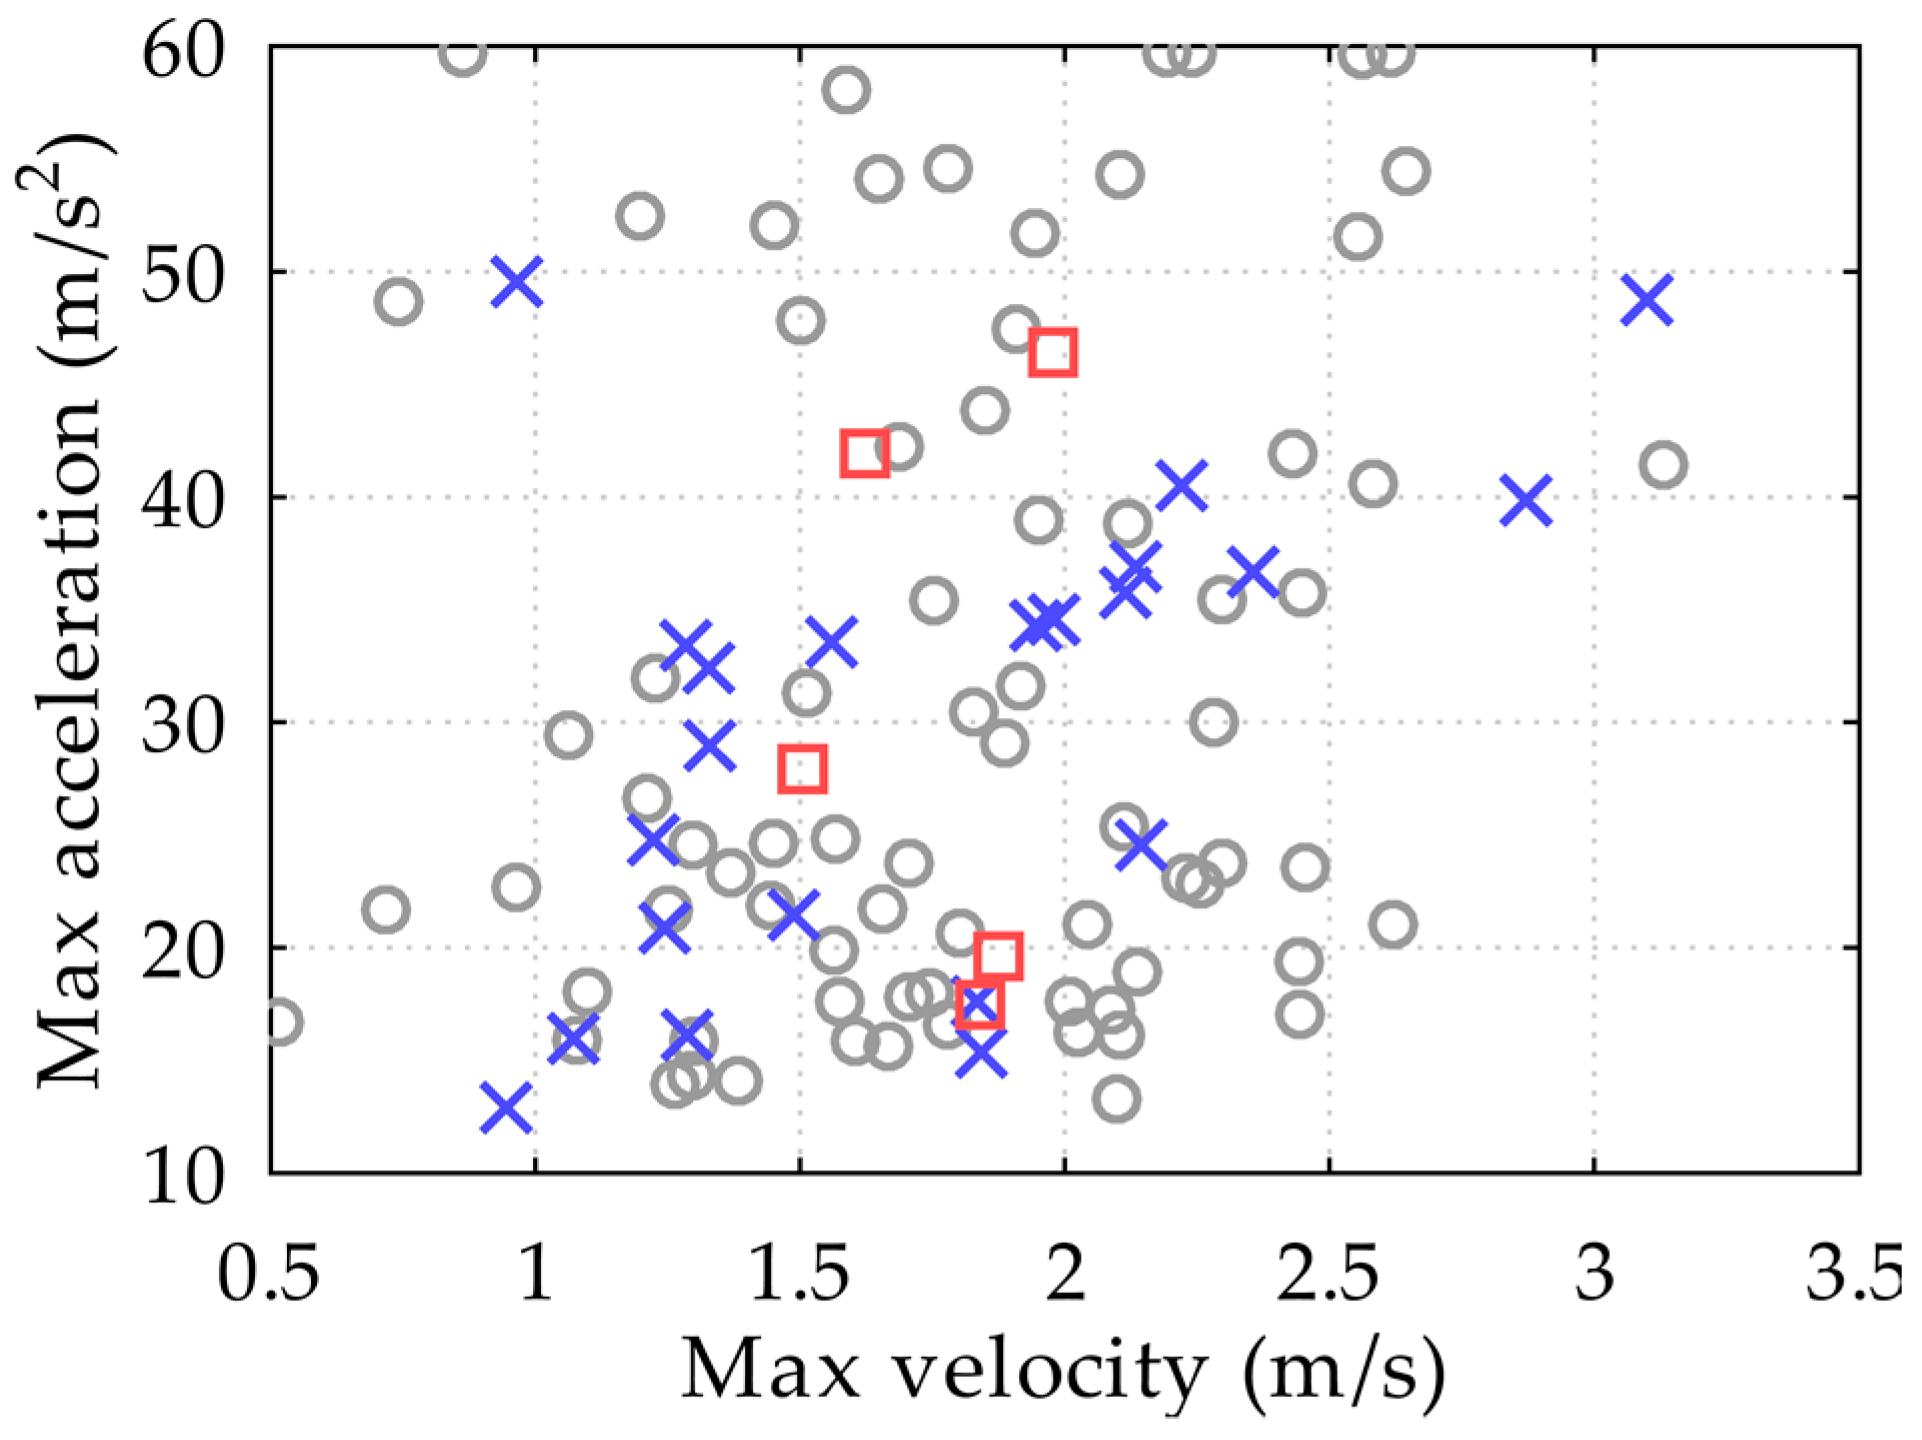
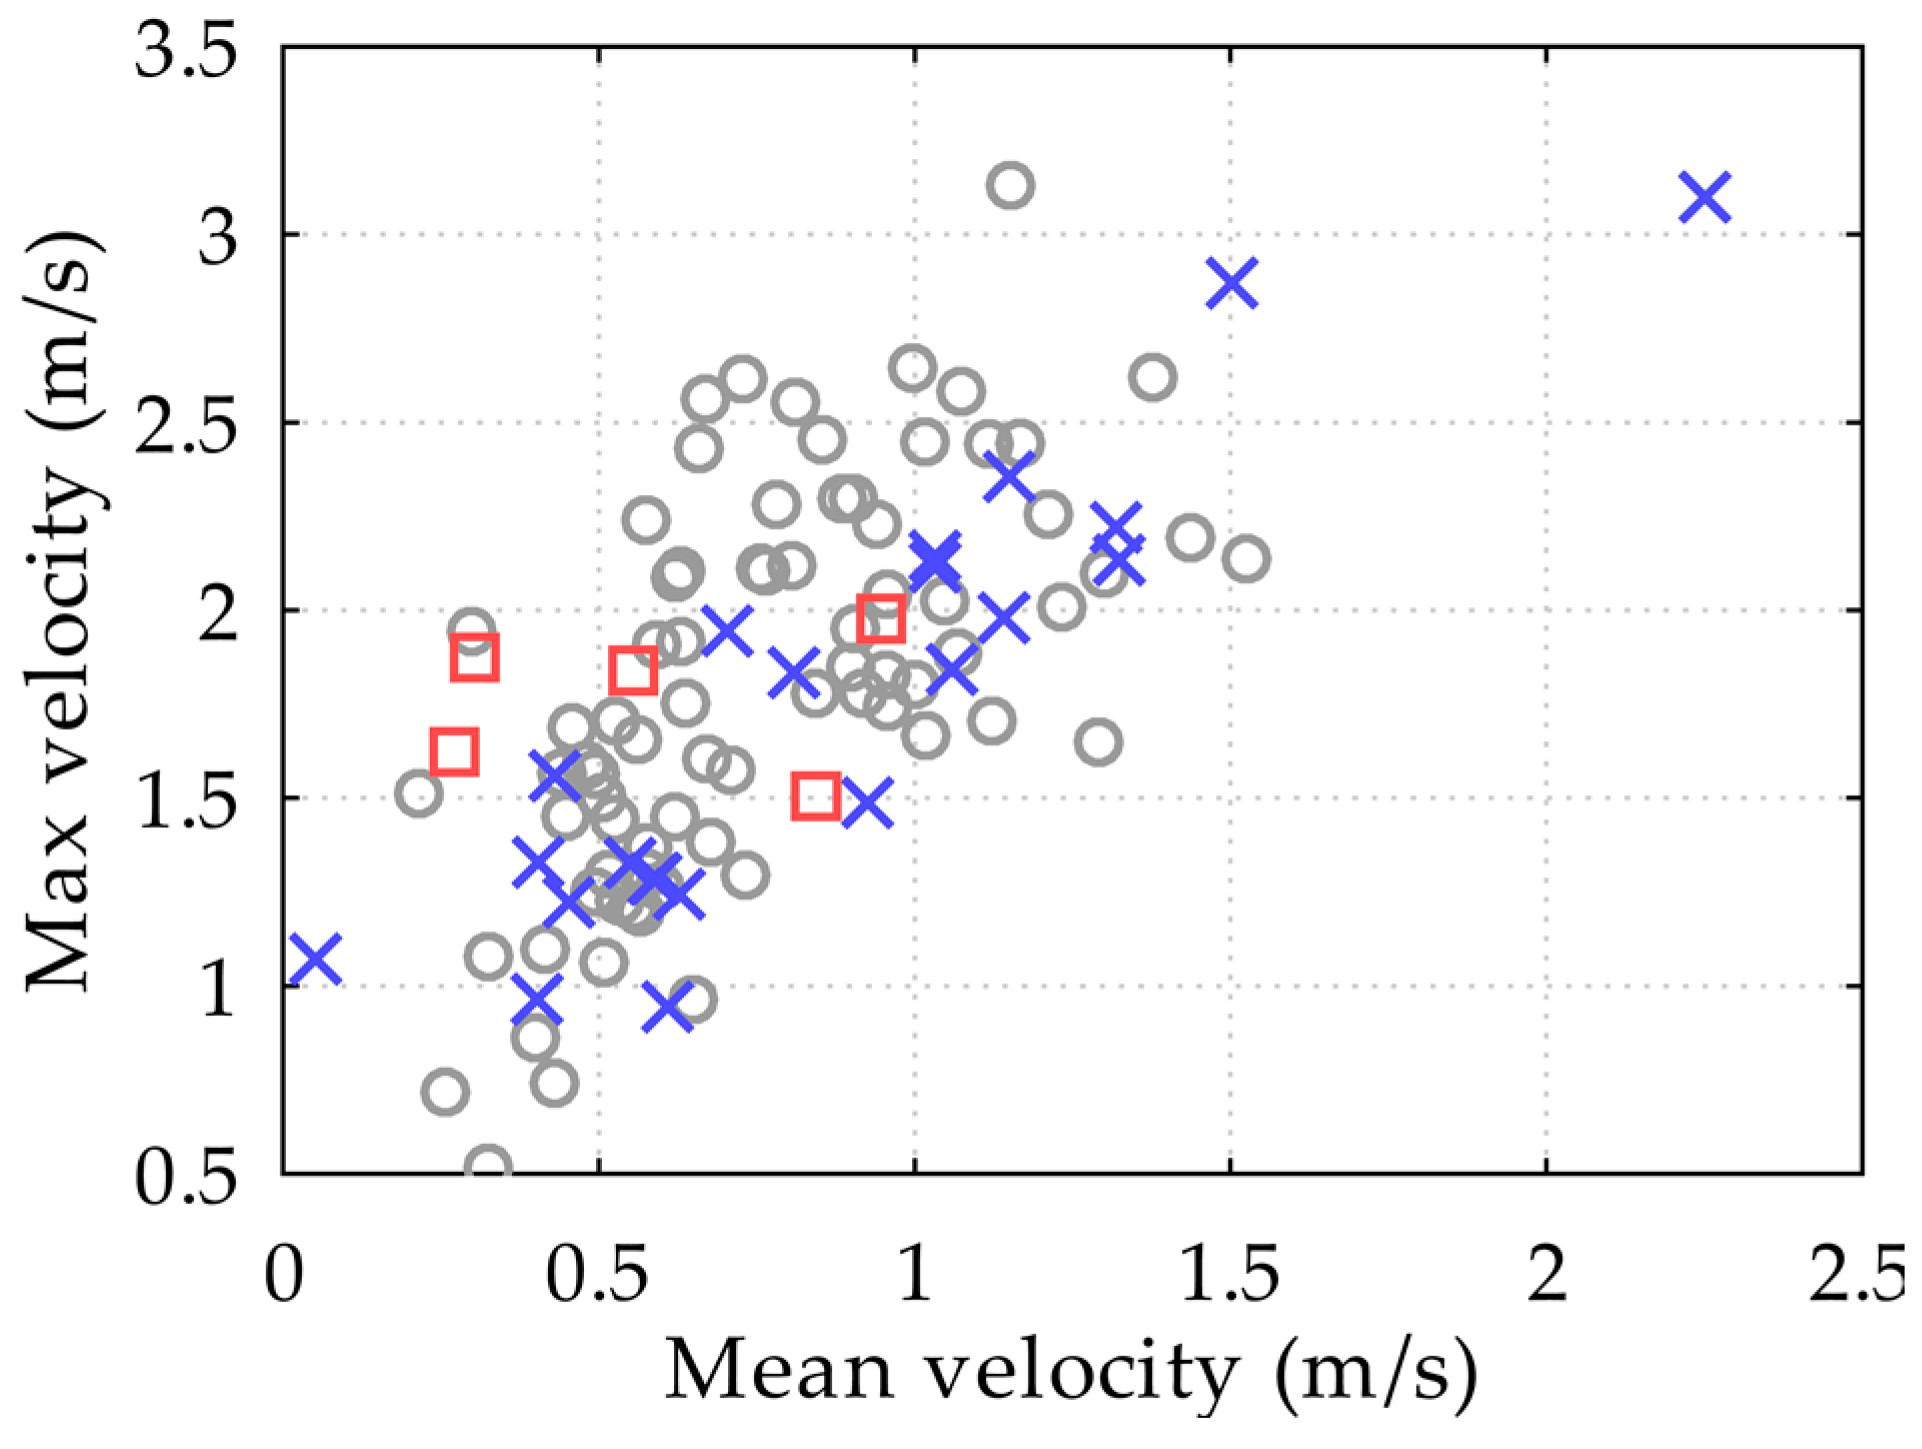
2.2. Assessment of the Operation

The average trajectory of the spreader during one handling cycle is shown in Figure 3. At point 1, the spreader is unhooked from the container, which is on the truck, and afterwards is raised to the maximum height (point 4), moved horizontally (to point 5) and lowered towards the container aboard the ship (point 7). This is the point where the hooking of the new container takes place.
In the trajectory of the spreader, it can be seen whether it hooked the container for the first time. The following Figure 4 shows that the spreader has reached the container at timestamp 1.2 s. This is confirmed by the large acceleration oscillations recorded at this moment in time (Figure 5).
In the trajectory graph of Figure 4, at the timestamp of the ~3.8th s, it is observable that the operator lifted the spreader. At the timestamp of the ~5.7th s, the operator lowered the spreader again, which impacted the container for the second time. In between these time stamps, we can observe significant fluctuations in acceleration, caused by incorrect stored and then lifted spreader fluctuations and the attempts of the operator to perfectly align the spreader hooking rods. At the time stamp of the ~5.8th s, it is observed that the operator moved the spreader again with another impact, which was successful. This specific impact is generated by the oscillations recorded by our system as an acceleration sudden change (see Figure 5). This means that not only did it impact the structural integrity of the container as the result of the initial faulty hooking, but it also added a 4 s delay to the operation, which was time wasted on the correct hooking.
After analyzing the recorded data of 102 handling cycles, it was found that 21 times the operator managed to hook the container only with the second attempt, and 5 times only with the third attempt. However, the operator actions were categorized as regular, indicating that such mistakes happen on a regular 20% average mistake rate. Several parameters were used for the further analysis of container hooking processes:
  • the vertical lowering distance of the spreader.
  • the maximum lowering speed of the spreader.
  • the average lowering speed of the spreader.
  • the maximum amplitude of shock-induced acceleration oscillations during the first contact.
  • the number of container hooking attempts.
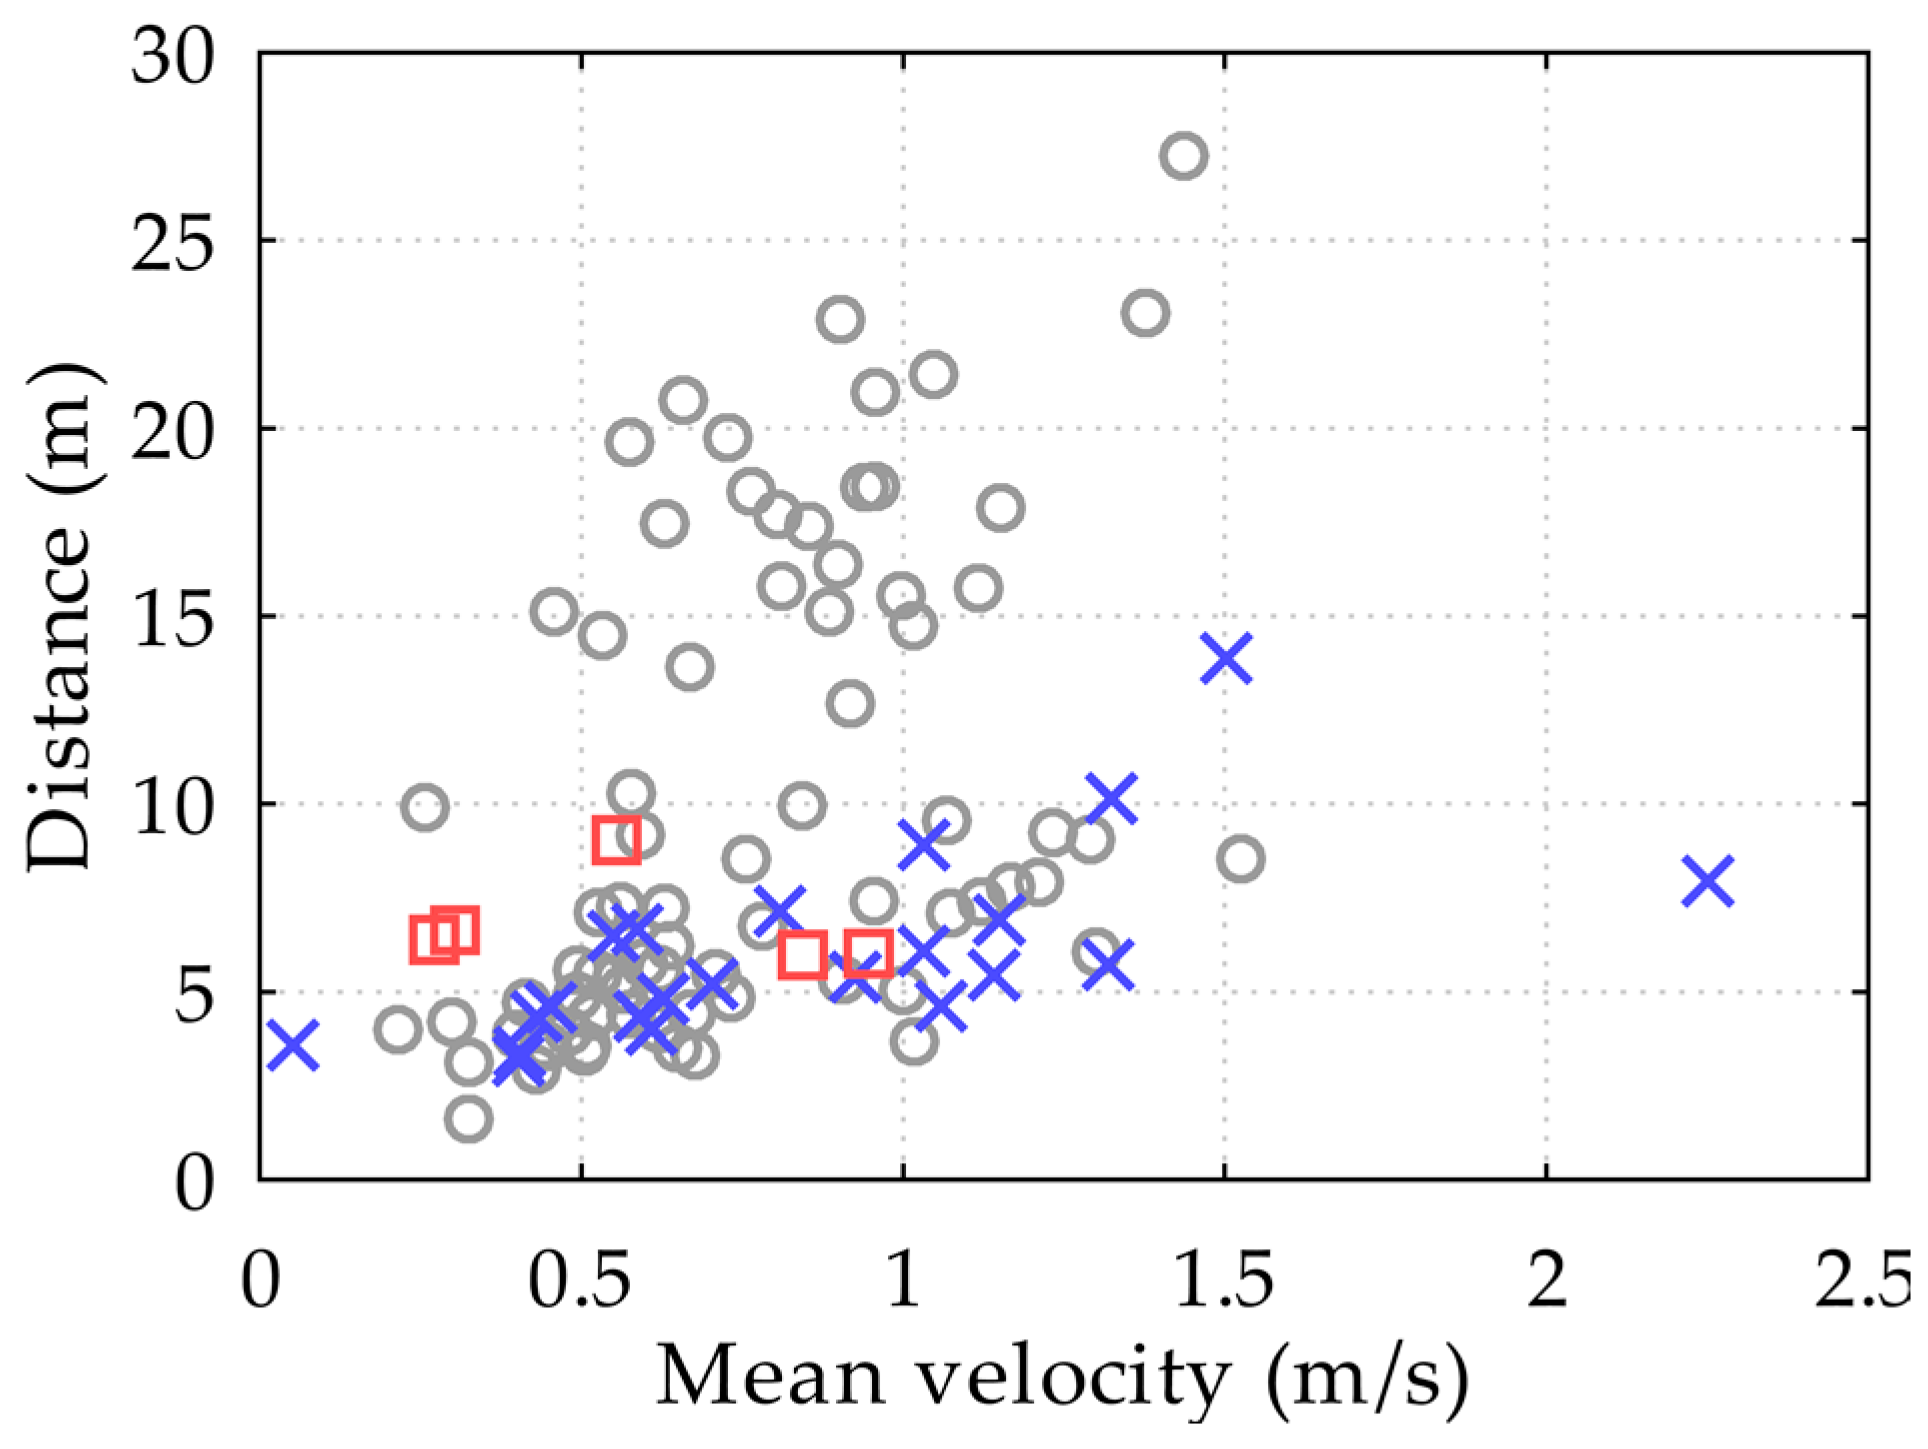
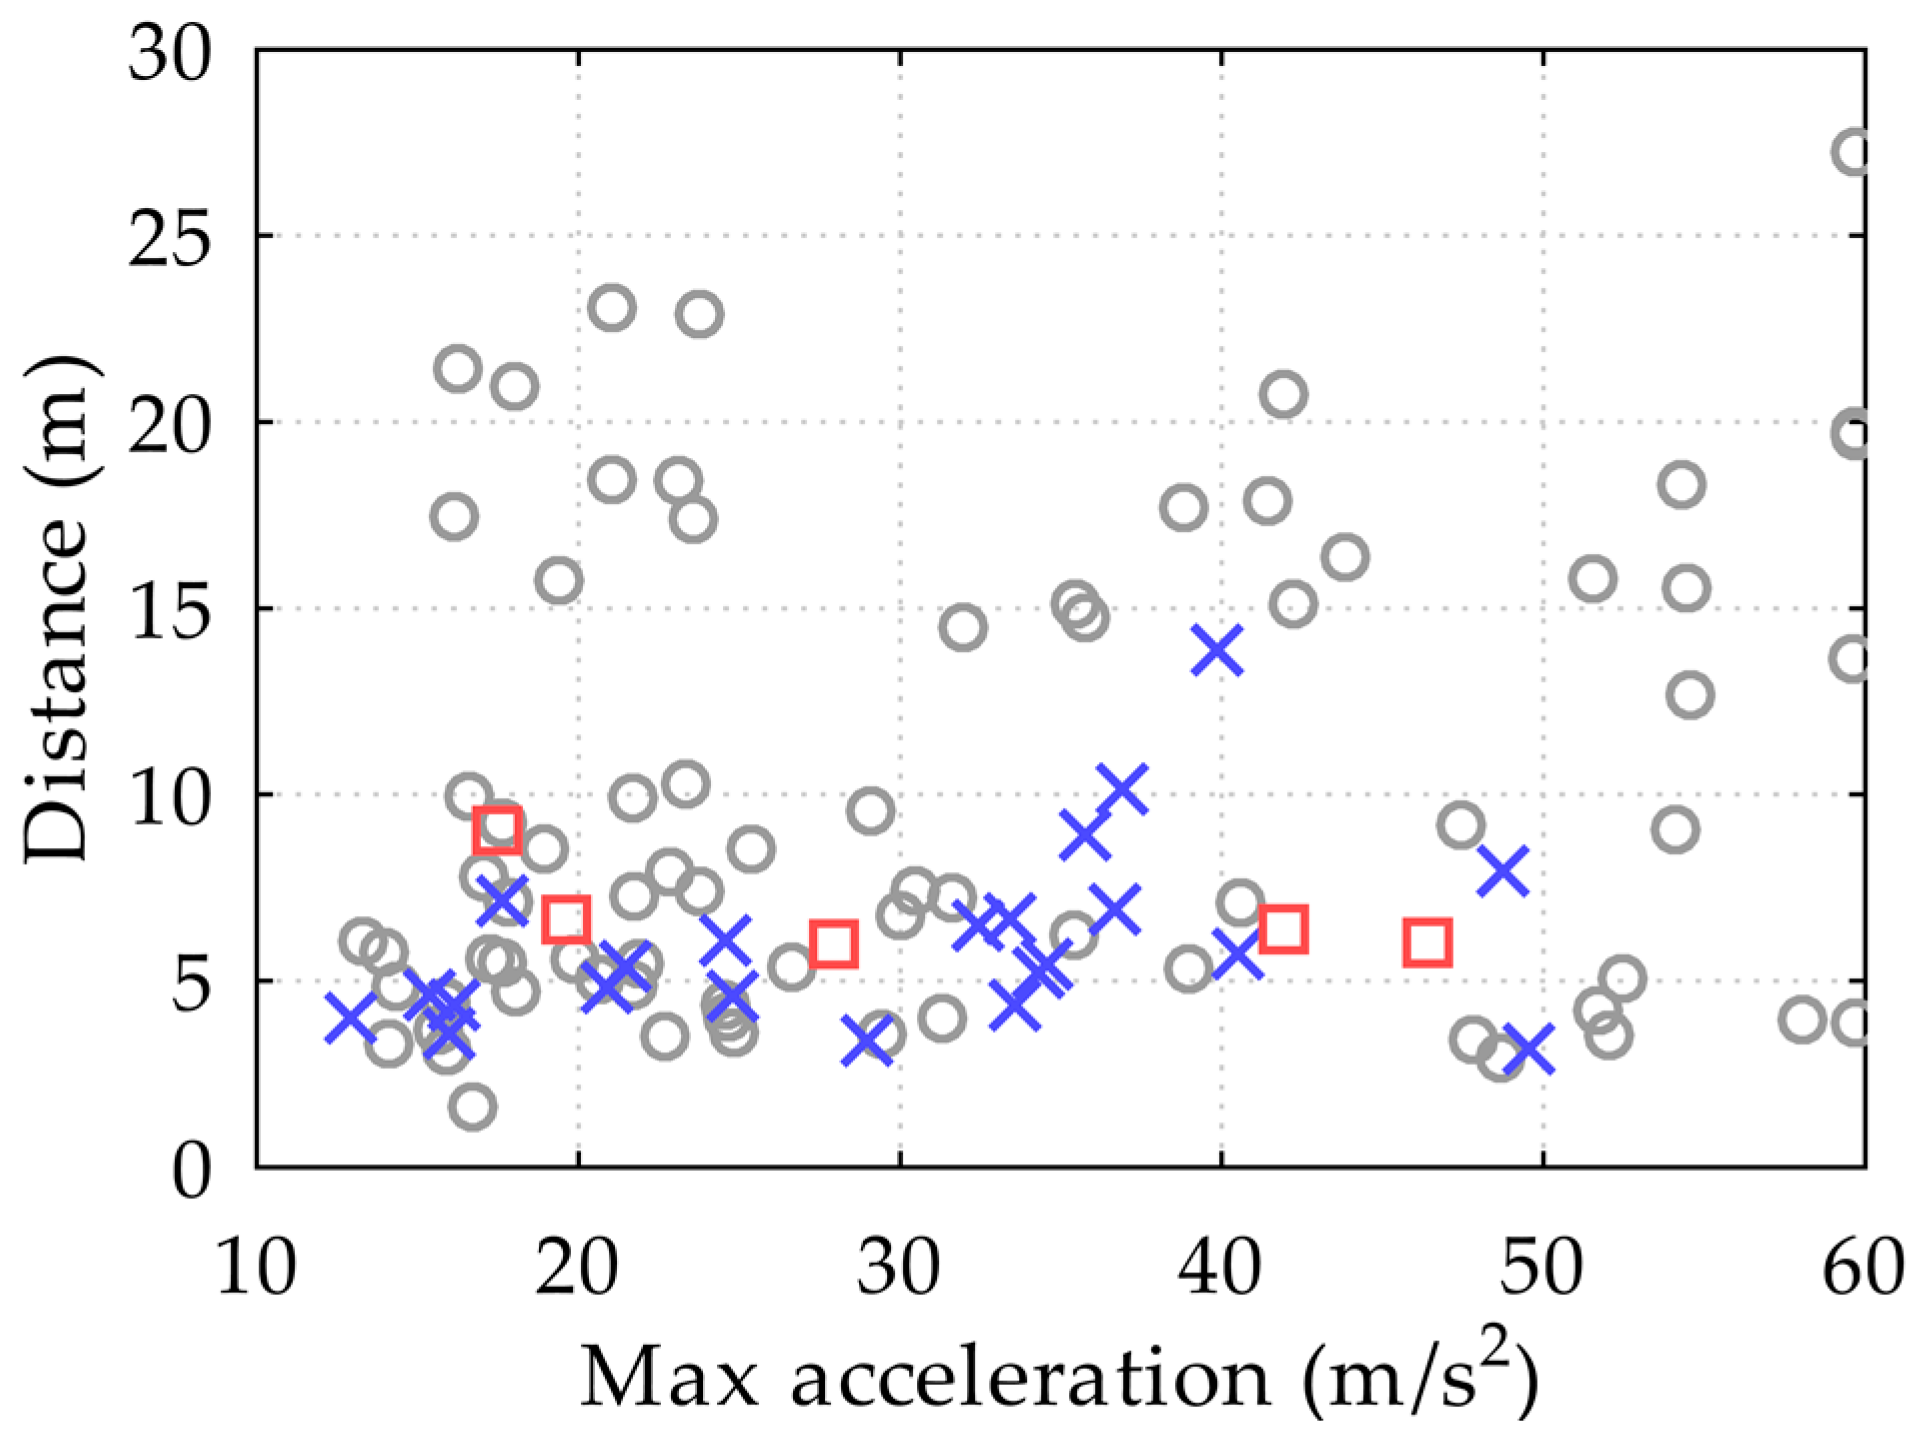
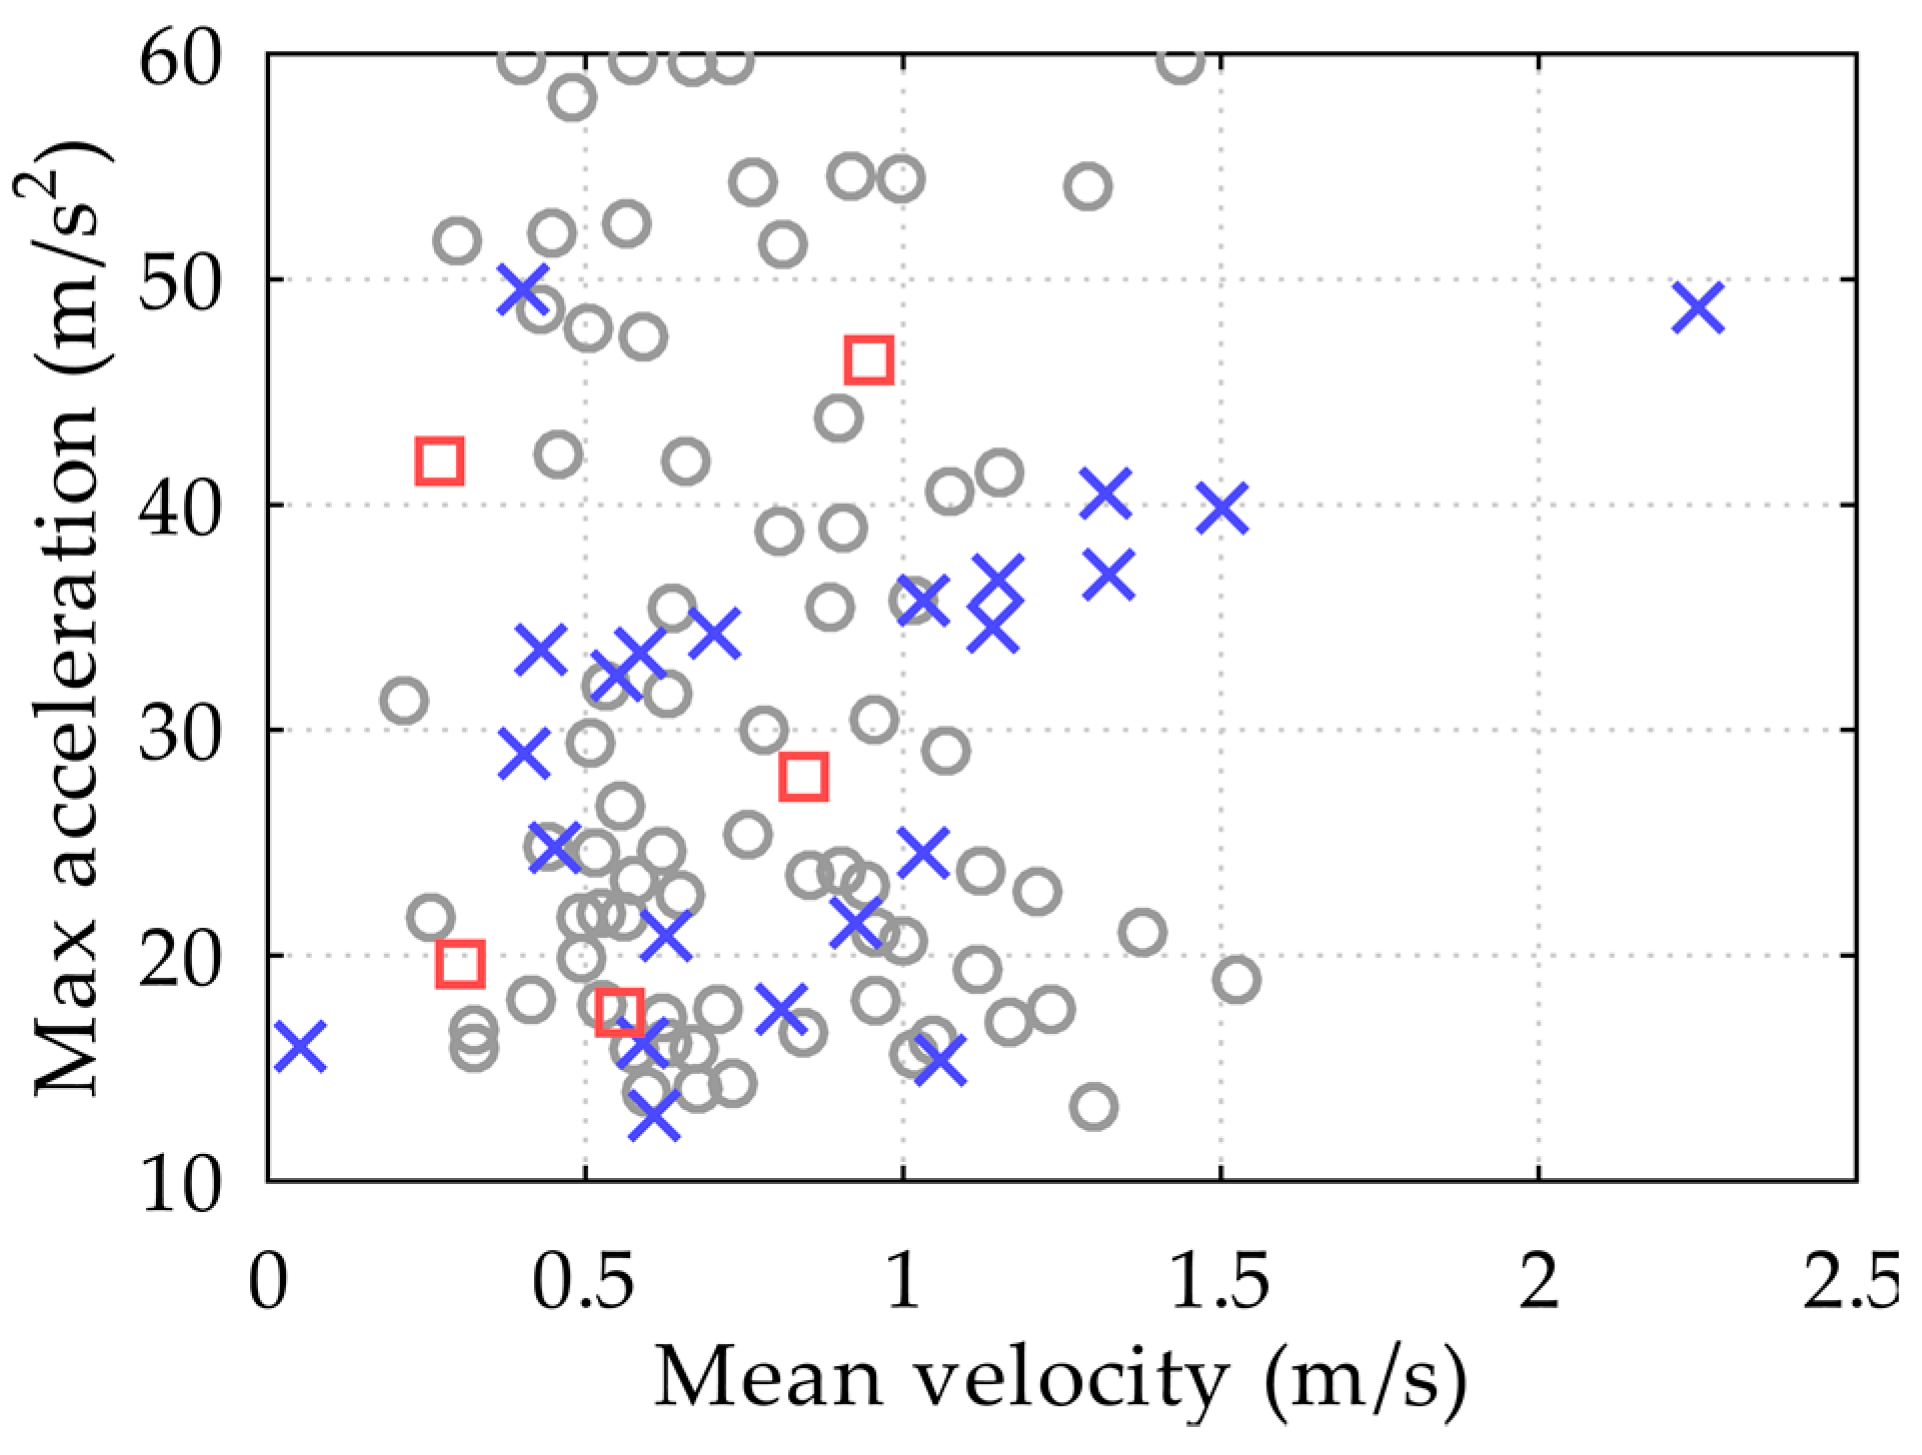
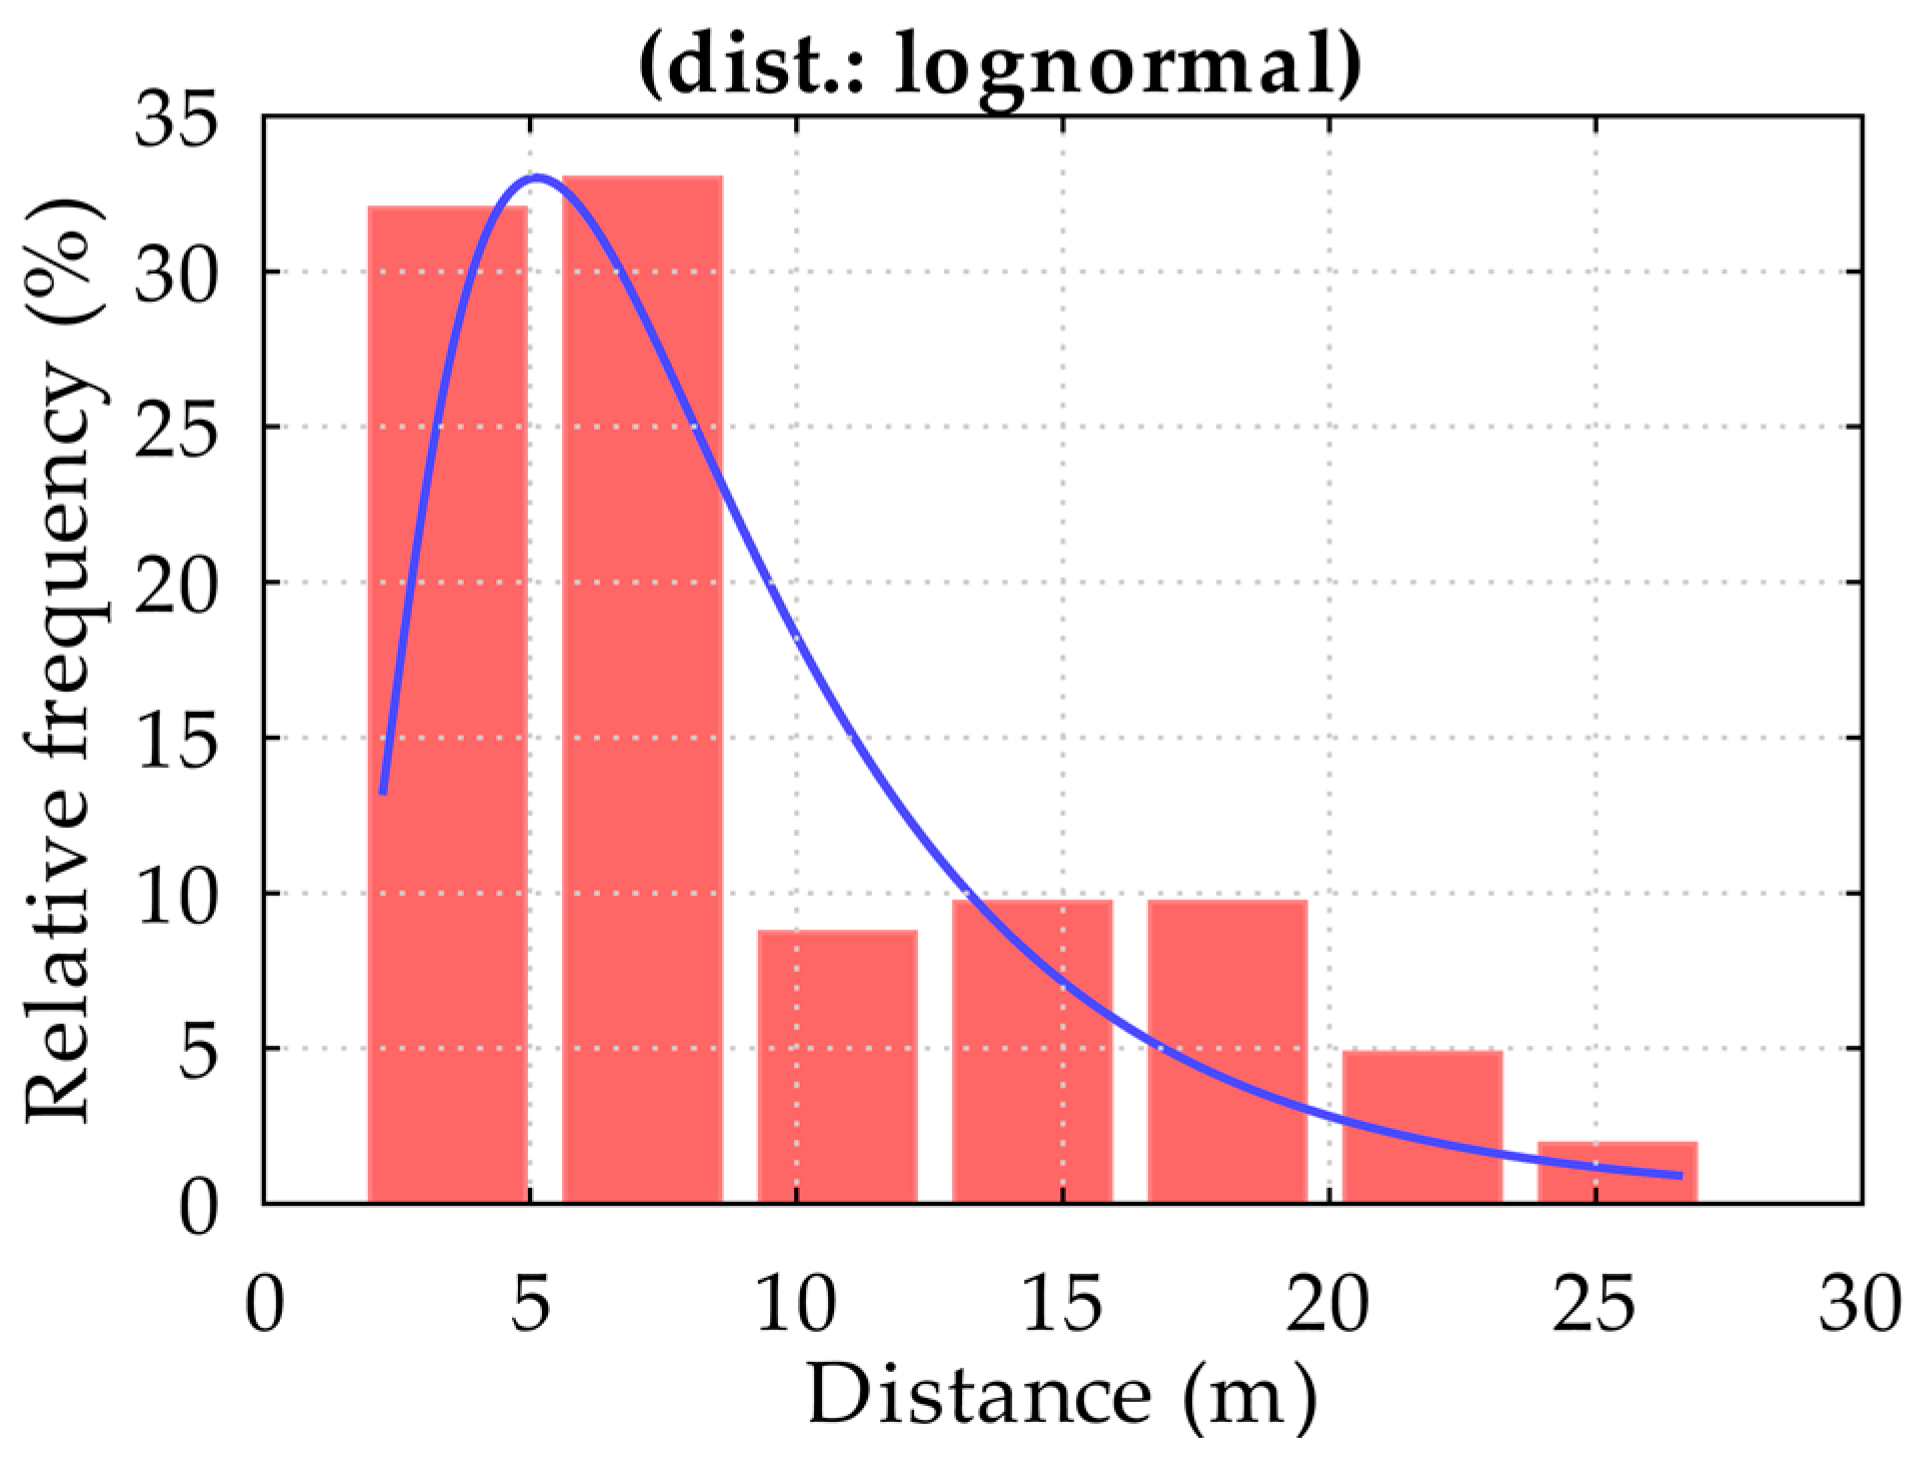
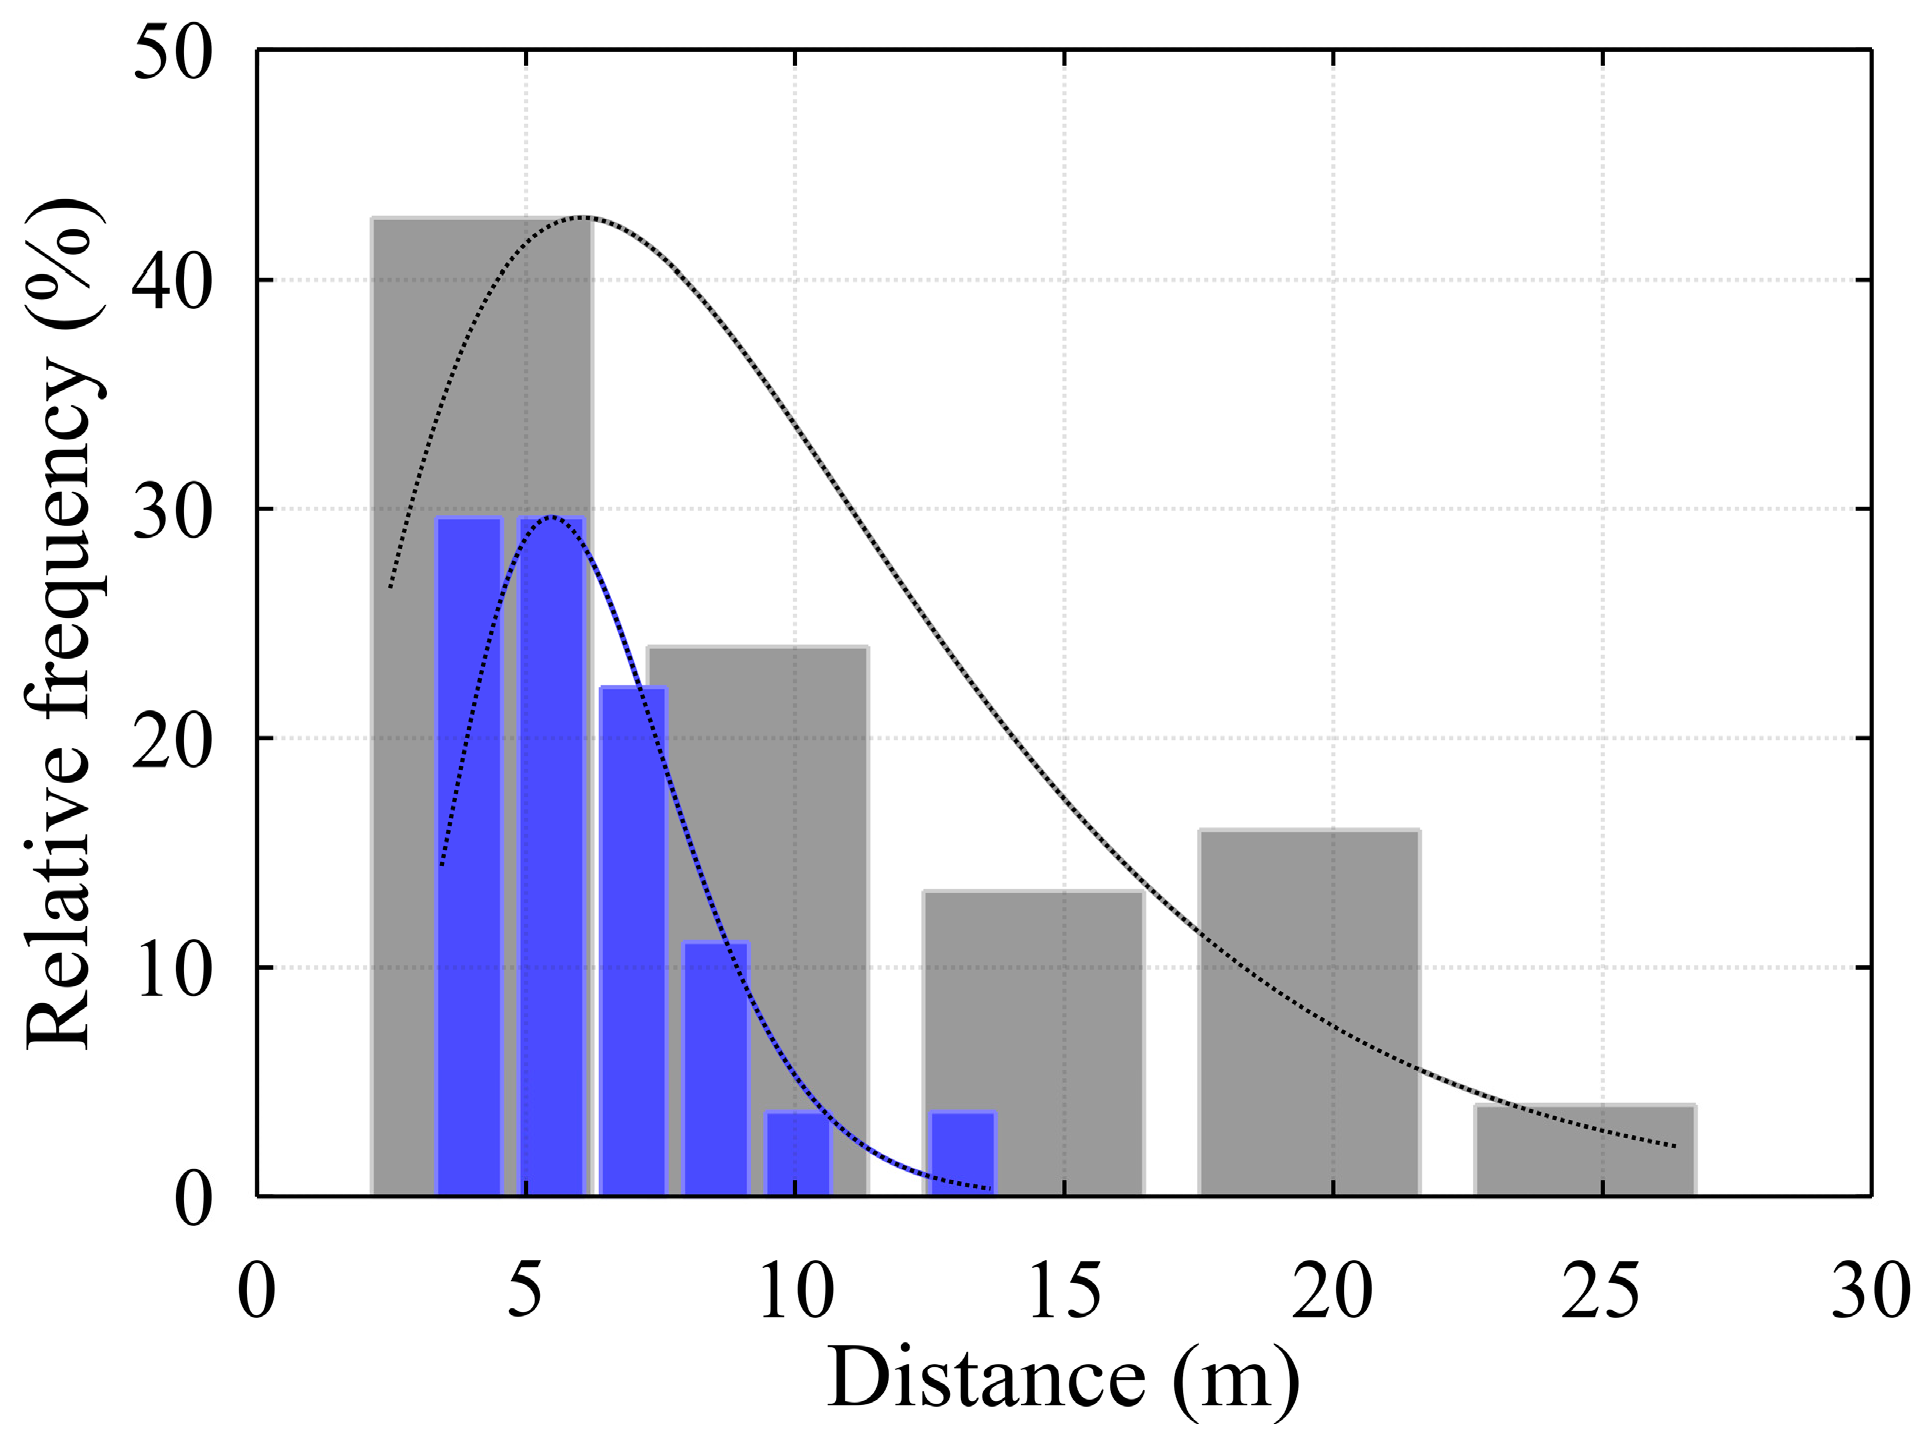
To measure the distance and velocities, the time interval for the spreader to travel from point 5 to point 7 after the first impact (Figure 3) was used. Figure 6 shows an overview of multiple data with the dependence of the number of tests on the drop height, its average and maximum speeds.
Here and in the other graphs to 8, hooks are shown in gray on the first attempt, blue on the second and red on the third. The failed hooking attempts occur at low drop heights. Figure 7 shows an overview of multiple data with the dependence of the number of trials on the drop height, average velocity and maximum acceleration amplitude. The acceleration amplitudes even reach 6 G.
The following Figure 8 shows an overview of multiple data with the dependence of the number of trials on maximum acceleration, average velocity and maximum velocity for each of the case studies.
The following Figure 9 shows the dependence of the number of attempts on the drop height and maximum velocity. Here, hooking procedures are shown in gray circles on the first attempt, blue crosses on the second and a red square on the third.
It can be seen that repeated hooking procedures occur at low drop heights. The initial conclusion suggests that the operator in these situations simply does not have enough operational time to adjust to the hook in the optimum positions due to the natural sway of the spreader, which is affected by a large number of factors like weather conditions, dynamic parameters of the machinery, etc. Spreader oscillations are too large, and there is not enough operator skills or time to suppress them in due time. Another possible reason is that the towed container is located above the deck, where there are no stack metal guides to dampen the spreader vibrations, like in the shafts of the ship. The vertical cell guides are installed below the ship’s deck, and the operator must first adjust to lower the spreader sway there. This adaptation operation is visible in the typically recorded spreader trajectories in Figure 10, the period from the 3rd to the 16th s (even the 13th s is wasted).
Figure 11 shows the dependence of the number of measurements on the maximum acceleration and maximum velocity. We can see that there is no clear correlation here.
Figure 12 shows the dependence of the number of measurements on the maximum velocity and average velocity. Here, what looks like a linear relationship is simply a consequence of the descent trajectory. Taking first-time hooking cases and calculating Pearson’s Correlation Coefficient (PCC) for them gave a value of 0.65, while taking cases with two or more hooking attempts gave a PCC value of 0.72. It could be concluded that there is a clear linear relationship between how quickly the operator tries to lower the spreader and how hard the spreader impacts the container. However, this conclusion would not be acceptable as a firm one, since the measurement sample is not large and increasing it is a task for further research.
It would be possible to draw a linear relationship, but I think this is simply a consequence of the descent trajectory. The PCC for successful first-down attempts is 0.63, while for at least one re-down attempt the PCC is 0.84. This would suggest a strong linear relationship between maximum and average descent speed, and is probably simply a consequence of the shape of the descent trajectory.
Figure 13 shows the number of measurements as a function of drop height and average velocity. The same conclusion is reached as in the case of Figure 11. It can be noticed that the gradient of the dependence of height and velocity is steeper. Most likely, this affects the lowering velocity when using the spreader to lower the shafts (Figure 10).
Here again, the operator would take advantage of the innovations in camera technologies with prediction sub-systems in any supportive form. For the first successful drop, the PCC is 0.46; for the other cases, the PCC is 0.55; and there is a significant linear dependence. A longer drop distance appears to allow the operator to select a higher grab drop speed.
Figure 14 shows the dependence of the number of measurements on the lowering height and the maximum acceleration.
The PCC is 0.25 for successful first drops and 0.28 for unsuccessful ones. Here again, the operator would need some augmented reality sensors. Figure 15 shows the dependence of the number of measurements on the maximum acceleration and the average velocity. The average velocity appears to vary uniformly between 0.2 and 1.5 m/s2.
The PCC for multiple cases is 0.43. This suggests that at higher average lowering speeds, the impact of the gripper on the container is greater when the operator fails to lower the gripper. In cases where the gripper is successfully lowered the first time, the PCC is −0.07, indicating that there is no linear correlation between the average speed at which the operator lowered the gripper and how strongly the gripper swung into the container.

3. Results

The results strongly suggest that unsuccessful hooking procedures only occur if the containers are hooked above the deck, as because here the operator simply does not have enough time to suppress the oscillations of the spreader effectively, the need to perform a higher number of handling procedures in the shift of each separate operator results in a drawback in quality of operations (for each full-cycle procedure). Consultations with the company representatives indicate that operational procedures and subsequent rules may be part of the cause. Further analytics in this matter are suggested. Concerning the finalising results, Figure 16 shows the histogram of the spreader heights lowering and the distribution function (PGF) that best describes the data. The containers with positions closer to the top of the stack were most likely to be unloaded, and this is related to the specific unloading plan for that day, that ship and that crane.
Figure 17 shows the histogram and PDFs of height lowering: related to the first successful hooking of the container at certain heights are colored gray and heights connected by re-hooks are colored blue. Here also the black lines represent the best approximation functions.
It can be observed that the unsuccessful hooking of containers is usually performed on top of the container stacks of the ship, while the containers below the deck were mostly hooked successfully. This is the result of the usage of vertical cell guides, which limit the sway motion of the spreader and the container during its handling procedure. The observations are also confirmed by the height boxplot in Figure 18.
In Figure 18, the results under N = 1 are the successful hooking procedures from the first attempt and the results under N > 1 are with the additional attempts. Despite the similar range in the mean results of the spreader lowering distance (see red lines in Figure 18), the height distribution range for N > 1 is much narrower compared to the results of the events with N = 1.
Here the red lines present the medians of the evaluations, the vertical blue lines on the left present the minimum and on the right sides the maximum values of the observed data. Also, the red plus and circle symbols present the outliers. The graph shows that the containers were hooked at various heights, but the unsuccessful hooking procedures are concentrated on the higher levels of the ship.

4. Discussion

It can be concluded that the handling of each ship is performed in a unified manner, which results in the same mistakes occurring with the same probability on average. Feedback from the LKAB “Klaipedos Smelte” container terminal indicated that such operators’ actions are standardized and control procedures do not follow any faulty pattern. The percentage of faulty operations is relatively high, yet not outside of the normal operational terms.
We have used the verified IDM methodology to detect the concurring impact events from 129 full-cycle operations, and the statistical evaluation shows interesting findings. Results indicate that 80 containers were hooked successfully from the first attempt, and the rest from two or more (37.98%). It is important to notice that these secondary hoking attempts occurred primarily from the deck of the ship, with fewer critical ones occurring in the shafts. Our previous research highlighted the more relevant importance of the problem to keep the shafts checked for mechanical damage of the vertical cell guides, rather than the containers, and this research proves that this is indeed so. The usage of methods of evaluation (like PCC) helped in the estimation of the levels of correlation between parameters during spreader-lowering procedures and in making weighted assumptions. For future research activities, we suggest using similar techniques as they prove their value working with real operational data. We intend to expand our research by collecting more statistics from real-life operations and performing modeling experiments, promoting digital twin techniques in our future research endeavors.

Author Contributions

Conceptualisation, S.J. and T.E.; methodology, S.J., T.E. and V.J.; software, P.P., M.J. and V.J.; validation, J.T., M.J. and V.J.; formal analysis, S.J. and M.V.; investigation, M.V. and T.E.; resources, M.J., P.P. and T.E.; data curation, J.T. and S.J.; writing—original draft preparation, S.J. and T.E.; writing—review and editing, M.V.; visualisation, T.E., V.J. and M.V.; supervision, S.J.; project administration, S.J.; and funding acquisition, S.J. All authors have read and agreed to the published version of the manuscript.

Funding

This research was funded by the Klaipeda University project JKSMART. This project has received funding from European Regional Development Fund (project No. 01.2.2-LMT-K-718-03-0001) under a grant agreement with the Research Council of Lithuania (LMTLT).

Data Availability Statement

Not applicable.

Acknowledgments

This research was also supported by The Ministry of Education, Youth and Sports of Czech Republic within the grant SP2023/007 conducted by VSB-Technical University of Ostrava.

Conflicts of Interest

The authors declare no conflict of interest.

References

  1. Hoffmann, N.; Stahlbock, R.; Voß, S. A Decision Model on the Repair and Maintenance of Shipping Containers. J. Shipp. Trade 2020, 5, 22. [Google Scholar] [CrossRef]
  2. American Bureau of Shippins. Certification of Container Securing Systems. 2019. Available online: https://safety4sea.com/wp-content/uploads/2019/11/abs-guide-for-certification-of-container-securing-systems-2019_09.pdf (accessed on 7 March 2023).
  3. Parreño-Torres, C.; Çalık, H.; Alvarez-Valdes, R.; Ruiz, R. Solving the Generalized Multi-Port Container Stowage Planning Problem by a Matheuristic Algorithm. Comput. Oper. Res. 2021, 133, 105383. [Google Scholar] [CrossRef]
  4. Lu, H.; Wang, S. A Study on Multi-ASC Scheduling Method of Automated Container Terminals Based on Graph Theory. Comput. Ind. Eng. 2019, 129, 404–416. [Google Scholar] [CrossRef]
  5. Chu, Y.; Zhang, X.; Yang, Z. Multiple Quay Cranes Scheduling for Double Cycling in Container Terminals. PLoS ONE 2017, 12, e0180370. [Google Scholar] [CrossRef] [Green Version]
  6. Mi, C.; Huang, Y.; Liu, H.; Yang, S.; Mi, W. Study on Target Detection & Recognition Using Laser 3D Vision Systems for Automatic Ship Loader. Sens. Transducers 2013, 158, 436–442. [Google Scholar]
  7. Mi, C.; Zhang, Z.; He, X.; Huang, Y.; Mi, W. Two-Stage Classification Approach for Human Detection in Camera Video in Bulk Ports. Polish Marit. Res. 2015, 22, 163–170. [Google Scholar] [CrossRef] [Green Version]
  8. Wang, Z.; Gao, J.; Zeng, Q.; Sun, Y. Multitype Damage Detection of Container Using CNN Based on Transfer Learning. Math. Probl. Eng. 2021, 2021, 5395494. [Google Scholar] [CrossRef]
  9. Lee, J. Deep Learning–Assisted Real-Time Container Corner Casting Recognition. Int. J. Distrib. Sens. Networks 2019, 15. [Google Scholar] [CrossRef]
  10. Abdullahi, A.M.; Mohamed, Z.; Selamat, H.; Pota, H.R.; Zainal Abidin, M.S.; Ismail, F.S.; Haruna, A. Adaptive Output-Based Command Shaping for Sway Control of a 3D Overhead Crane with Payload Hoisting and Wind Disturbance. Mech. Syst. Signal Process. 2018, 98, 157–172. [Google Scholar] [CrossRef]
  11. Smoczek, J.; Szpytko, J. Evolutionary Algorithm-Based Design of a Fuzzy TBF Predictive Model and TSK Fuzzy Anti-Sway Crane Control System. Eng. Appl. Artif. Intell. 2014, 28, 190–200. [Google Scholar] [CrossRef]
  12. Yoon, H.; Hwang, Y.; Cha, E. Real-Time Container Position Estimation Method Using Stereo Vision for Container Auto-Landing System. In Proceedings of the ICCAS 2010, Gyeonggi-do, Republic of Korea, 27–30 October 2010; pp. 872–876. [Google Scholar]
  13. Lajjam, A.; El Merouani, M.; Tabaa, Y.; Medouri, A. A New Approach for Sequencing Loading and Unloading Operations in the Seaside Area of a Container Terminal. Int. J. Supply Oper. Manag. 2014, 1, 328–346. [Google Scholar]
  14. Kim, Y.S.; Shim, H.; Yoshihara, H.; Fujioka, N.; Kasahara, H.; Sul, S.K. A New Vision-Sensorless Anti-Sway Control System for Container Cranes. Conf. Rec.—IAS Annu. Meet. IEEE Ind. Appl. Soc. 2003, 1, 262–269. [Google Scholar] [CrossRef]
  15. Andersen, I.M.V.; Jensen, J.J. Measurements in a Container Ship of Wave-Induced Hull Girder Stresses in Excess of Design Values. Mar. Struct. 2014, 37, 54–85. [Google Scholar] [CrossRef]
  16. Szyszko, M. Physico-Mechanical Wear Processes of Cell Guides in Container Ships -Phenomenology. Solid State Phenom. 2015, 225, 145–150. [Google Scholar] [CrossRef]
  17. Kugler, M.; Brandenburg, M.; Limant, S. Automizing the Manual Link in Maritime Supply Chains? An Analysis of Twistlock Handling Automation in Container Terminals. Marit. Transp. Res. 2021, 2, 100017. [Google Scholar] [CrossRef]
  18. Arena, A.; Casalotti, A.; Lacarbonara, W.; Cartmell, M.P. Dynamics of Container Cranes: Three-Dimensional Modeling, Full-Scale Experiments, and Identification. Int. J. Mech. Sci. 2015, 93, 8–21. [Google Scholar] [CrossRef]
  19. Maghsoudi, M.J.; Ramli, L.; Sudin, S.; Mohamed, Z.; Husain, A.R.; Wahid, H. Improved Unity Magnitude Input Shaping Scheme for Sway Control of an Underactuated 3D Overhead Crane with Hoisting. Mech. Syst. Signal Process. 2019, 123, 466–482. [Google Scholar] [CrossRef]
  20. Ileš, Š.; Matuško, J.; Kolonić, F. Sequential Distributed Predictive Control of a 3D Tower Crane. Control Eng. Pract. 2018, 79, 22–35. [Google Scholar] [CrossRef]
  21. Mahmood, S.; Hasan, R.; Ullah, A.; Sarker, K.U. SMART Security Alert System for Monitoring and Controlling Container Transportation. In Proceedings of the 2019 4th MEC International Conference on Big Data and Smart City (ICBDSC), Muscat, Oman, 15–16 January 2019. [Google Scholar] [CrossRef]
  22. Jakovlev, S.; Eglynas, T.; Voznak, M.; Jusis, M.; Partila, P.; Tovarek, J.; Jankunas, V. Detection of Physical Impacts of Shipping Containers during Handling Operations Using the Impact Detection Methodology. J. Mar. Sci. Eng. 2022, 10, 1250. [Google Scholar] [CrossRef]
  23. Zaja, M.; Roži, T.; Jakovlev, S.; Eglynas, T.; Jusis, M.; Voznak, M.; Partila, P.; Tovarek, J. Detecting Physical Impacts to the Corners of Shipping Containers during Handling Operations Performed by Quay Cranes. J. Mar. Sci. Eng. 2023, 11, 794. [Google Scholar] [CrossRef]
  24. Jakovlev, S.; Voznak, M. Auto-Encoder-Enabled Anomaly Detection in Acceleration Data: Use Case Study in Container Handling Operations. Machines 2022, 10, 734. [Google Scholar] [CrossRef]
  25. Bukkapatnam, S.T.S.; Mukkamala, S.; Kunthong, J.; Sarangan, V.; Komanduri, R. Real-Time Monitoring of Container Stability Loss Using Wireless Vibration Sensor Tags. In Proceedings of the 2009 IEEE International Conference on Automation Science and Engineering, Bangalore, India, 22–25 August 2009; pp. 221–226. [Google Scholar] [CrossRef]
  26. Lauf, J.O.; Sauff, H. Secure Lightweight Tunnel for Monitoring Transport Containers. In Proceedings of the 2007 Third International Conference on Security and Privacy in Communications Networks and the Workshops—SecureComm 2007, Nice, France, 17–21 September 2007; pp. 484–493. [Google Scholar] [CrossRef]
  27. Lin, G.; Pritoni, M.; Chen, Y.; Granderson, J. Development and Implementation of Fault-Correction Algorithms in Fault Detection and Diagnostics Tools. Energies 2020, 13, 2598. [Google Scholar] [CrossRef]
  28. Klinger, C. Failures of Cranes Due to Wind Induced Vibrations. Eng. Fail. Anal. 2014, 43, 198–220. [Google Scholar] [CrossRef]
  29. Kim, G.; Uddin, M.K.; Hong, B. Design and Implementation of Sensor Tag Middleware for Monitoring Containers in Logistics Systems. In Proceedings of the 2009 Third International Conference on Sensor Technologies and Applications, Athens, Greece, 18–23 June 2009; pp. 393–398. [Google Scholar] [CrossRef]
Figure 1. The result of the continuous forceful impacts of the spreader hooking mechanisms due to the lack of proper spreader control changes the trajectory of movement of the hooking rods.
Machines 11 00638 g001
Figure 2. Flowchart of the IDM solution (on the left) in the Embedded device placed on the spreader platform in Klaipeda port (on the right).
Machines 11 00638 g002
Figure 3. Container cranes spreader path in one cycle.
Machines 11 00638 g003
Figure 4. An example of the secondary placement of the spreader.
Machines 11 00638 g004
Figure 5. Quay crane spreader accelerations toward the container.
Machines 11 00638 g005
Figure 6. Graph of dependencies between the number of tests on the drop height, its average and maximum velocities.
Machines 11 00638 g006
Figure 7. Graph of dependencies between the number of tests on the drop height, its average velocity and maximum accelerations.
Machines 11 00638 g007
Figure 8. Graph of dependencies between the maximum acceleration, average velocity and maximum velocity for each of the case studies.
Machines 11 00638 g008
Figure 9. The dependence of the number of attempts on the drop height and maximum velocity.
Machines 11 00638 g009
Figure 10. Demonstration of the process of the spreader lowering to the inner parts of the ship in the shafts.
Machines 11 00638 g010
Figure 11. The dependence of the number of measurements on the maximum acceleration and maximum velocity.
Machines 11 00638 g011
Figure 12. The dependence of the number of measurements on the maximum velocity and the mean velocity.
Machines 11 00638 g012
Figure 13. The dependence of the number of measurements on the lowering height and the mean velocity.
Machines 11 00638 g013
Figure 14. The dependence of the number of measurements on the lowering height and the maximum acceleration.
Machines 11 00638 g014
Figure 15. The dependence of the number of measurements on the maximum acceleration and the average velocity.
Machines 11 00638 g015
Figure 16. The histogram of the spreader heights lowering and the distribution function (PGF) that best describes the data.
Machines 11 00638 g016
Figure 17. The histogram and PDFs of height lowering are related to the first successful hooking of the container at certain heights.
Machines 11 00638 g017
Figure 18. Statistics boxplot of the handling operations related to the height of spreader movements above the ship.
Machines 11 00638 g018
Disclaimer/Publisher’s Note: The statements, opinions and data contained in all publications are solely those of the individual author(s) and contributor(s) and not of MDPI and/or the editor(s). MDPI and/or the editor(s) disclaim responsibility for any injury to people or property resulting from any ideas, methods, instructions or products referred to in the content.

