Article

Optimizing the Neural Network Architecture for Automation of the Tailored UV Post-Treatment of Photopolymer Printing Plates

by
Davor Donevski
,
Tamara Tomašegović
* and
Sanja Mahović Poljaček
Faculty of Graphic Arts, University of Zagreb, 10 000 Zagreb, Croatia
*
Author to whom correspondence should be addressed.
Machines 2023, 11(6), 618; https://doi.org/10.3390/machines11060618
Submission received: 2 May 2023 / Revised: 29 May 2023 / Accepted: 31 May 2023 / Published: 3 June 2023
(This article belongs to the Section Automation and Control Systems)

Abstract

:
In this work, three types of photopolymer printing plates for packaging printing were subjected to varied UV (ultraviolet radiation) post-treatments, and their surface free energy (SFE) components were calculated. SFE of the photopolymer printing plate is crucial in the process of transferring the ink from the printing plate to the substrate. Calculated polar and dispersive SFE components were used to build and optimize artificial neural networks for the prediction of the surface properties of different photopolymer materials after the performed UVA and UVC post-treatments. In this way, the production of printing plates with tailored SFE components could be automated and optimized. Consequently, products with improved qualitative properties could be printed. Results of the research have shown that the choice of the neural network’s activation function is most significant for the minimization of the mean squared error (MSE), while the number of neurons and hidden layers in neural networks has less influence on MSE. The optimized neural networks applied for common photopolymer materials in this work have the potential to be applied for the automation of the printing plates’ post-treatment process and the production of printing plates with surface properties tailored to specific printing systems.

1. Background

Modern flexographic printing has found its domain mostly in packaging and functional printing. Due to the new qualitative requirements, workflows and materials used in flexography are constantly being improved. Digitally controlled processes and new methods of material processing are commonly applied in flexography [1,2,3,4]. The flexographic printing plate is the photopolymer material responsible for transferring the image (motive) to the printing substrate in a printing machine, thereby creating a printed product. The image on the produced printing plate is a relief, and printing elements on the plate transfer the ink to the printing substrate on the basis of a geometrical difference between the printing elements and embossed non-printing areas. During the application of the printing ink to the printing plate and then its transfer from the plate to the printing substrate, the surface properties of the photopolymer material highly influence the quality of the print. Therefore, they should be compatible with the used printing ink and the printing substrate, which is especially important when using new formulations of functional inks and experimenting with different printing substrates [5,6,7].
Modern flexographic printing plates can be solvent-washable or water-washable, and their production is based on the effect of crosslinking of certain organic compounds under exposure to UVA wavelengths that initiate crosslinking and UVC wavelengths that terminate it, thus producing large and stable molecular structures that are insoluble in the defined developing solution.
Laser ablative mask system (LAMS) is the most common and widely adopted technology used to produce flexographic printing plates. The process of flexographic printing plate production based on LAMS is presented in Figure 1.
The base of the photopolymer flexographic printing plate is made of polyethylene terephthalate (PET), on which the partially crosslinked photopolymer material has been applied (Figure 1a). The LAMS mask covers the whole surface of the printing plate. It enables the transfer of the image to the plate via the laser ablation process. After the back exposure performed in order to create the base layer for the printing elements (Figure 1b), the LAMS is removed by laser ablation from the image parts of the photopolymer material (Figure 1c). Figure 1d presents the main exposure to UVA wavelengths, after which the printing and nonprinting areas are formed. Exposed parts of the photopolymer material crosslink and become insoluble in the defined developing solution (organic solvent or water).
After the main exposure follow the rinsing of the unexposed parts of the photopolymer (Figure 1e) and the drying process (Figure 1f). The printing plate is finished after the UV post-treatments—the exposure to both UVA and UVC radiation (Figure 1g) in order to finish and terminate the crosslinking process and achieve the desired surface properties [8,9].
The duration of UV post-treatments significantly affects the surface properties, specifically the surface free energy (SFE) of the photopolymer and its dispersive and polar components [10,11]. Manufacturers of printing plates define the time frame of the recommended duration of UV post-treatments, rather than the specific duration of each UVA and UVC exposure. In the range of the acceptable duration of the UV post-treatments, the printing plate is fully functional, but its dispersive and polar SFE can significantly differ, and therefore affect the transfer of the ink, depending on the UV post-treatment duration.
With prolonged post-treatment, UV radiation causes further crosslinking of compounds in the material structure, which was started and was almost finished by the main exposure. By increasing the duration of the UV post-treatment (specifically UVA post-treatment), the molecular weight of the photopolymer increases [12]. As the molecular weight increases, the surface free energy of the polymers also tends to increase. However, these changes are dependent on the type of photopolymer material. Some materials have waxes with low molecular weight in their composition, which migrate to the surface of the material during the UV post-treatment and protect the material from degradation (photooxidation) [13]. Some printing plate materials without such waxes are more sensitive to UV radiation, especially to UVC wavelengths, and can undergo the start of the degradation process after prolonged UV post-treatment.
In any event, the polar and dispersive components of SFE change as a result of physicochemical changes that occur in the photopolymer surface layer under the influence of both UVA and UVC post-treatments. These changes affect the wetting of the printing ink on the printing plate in the graphic reproduction process and its transfer to the printing substrate [14,15]. The post-treatment process, as the last step in the flexographic printing plate production workflow, is therefore of crucial importance for precisely defining the surface properties of the finished printing plate. Previous research demonstrated that UVA and UVC post-treatments can be used as a tool to adjust the qualitative properties of the print. UVA and UVC post-treatments have been specifically recognized as a significant step for obtaining maximal possible quality in the flexographic reproduction process [16,17]. Therefore, a tool enabling the precise adjustment of the polar and dispersive SFE of a photopolymer printing plate prior to its production would significantly contribute both to the automation of the printing plate production process and to the improvement of the finished printing plate’s quality (and consequently, to the quality of the print) [18]. With that aim in focus, application and optimization of artificial neural networks (ANNs) used to tailor the surface properties of flexographic printing plates by UV post-treatments were performed in this work.
Many previous works used ANNs for modeling various surface and other material properties. In [19], authors use ANNs to analyze cracks in gear teeth. In [20], ANNs were used to predict tribological performance of surface treated tool steels. Prediction of surface roughness depending on laser treatment using ANNs was studied in [21]. Prediction of wetting rates of different powders and liquids was reported in [22]. In [23], authors employ graph neural networks for gas–liquid interface reconstruction. Predictions of contact angles between molten metals and solid oxides were reported in [24]. Previous studies addressed predictions of surface tension using ANNs as well. Convolutional neural networks were used to estimate surface tension from pendant drop images in [25]. In [26], a multilayer perceptron (MLP) network was used to predict the surface tension of various pure organic compounds depending on temperature. In [27], authors employed ANNs for surface tension predictions for various alcohols. They reported that ANNs provided more accurate predictions compared to common analytical models. In [28], authors found that ANN models outperformed empirical correlations in predicting the surface tension of aqueous solutions of sodium L-prolinate and piperazine blends.

2. Materials and Methods

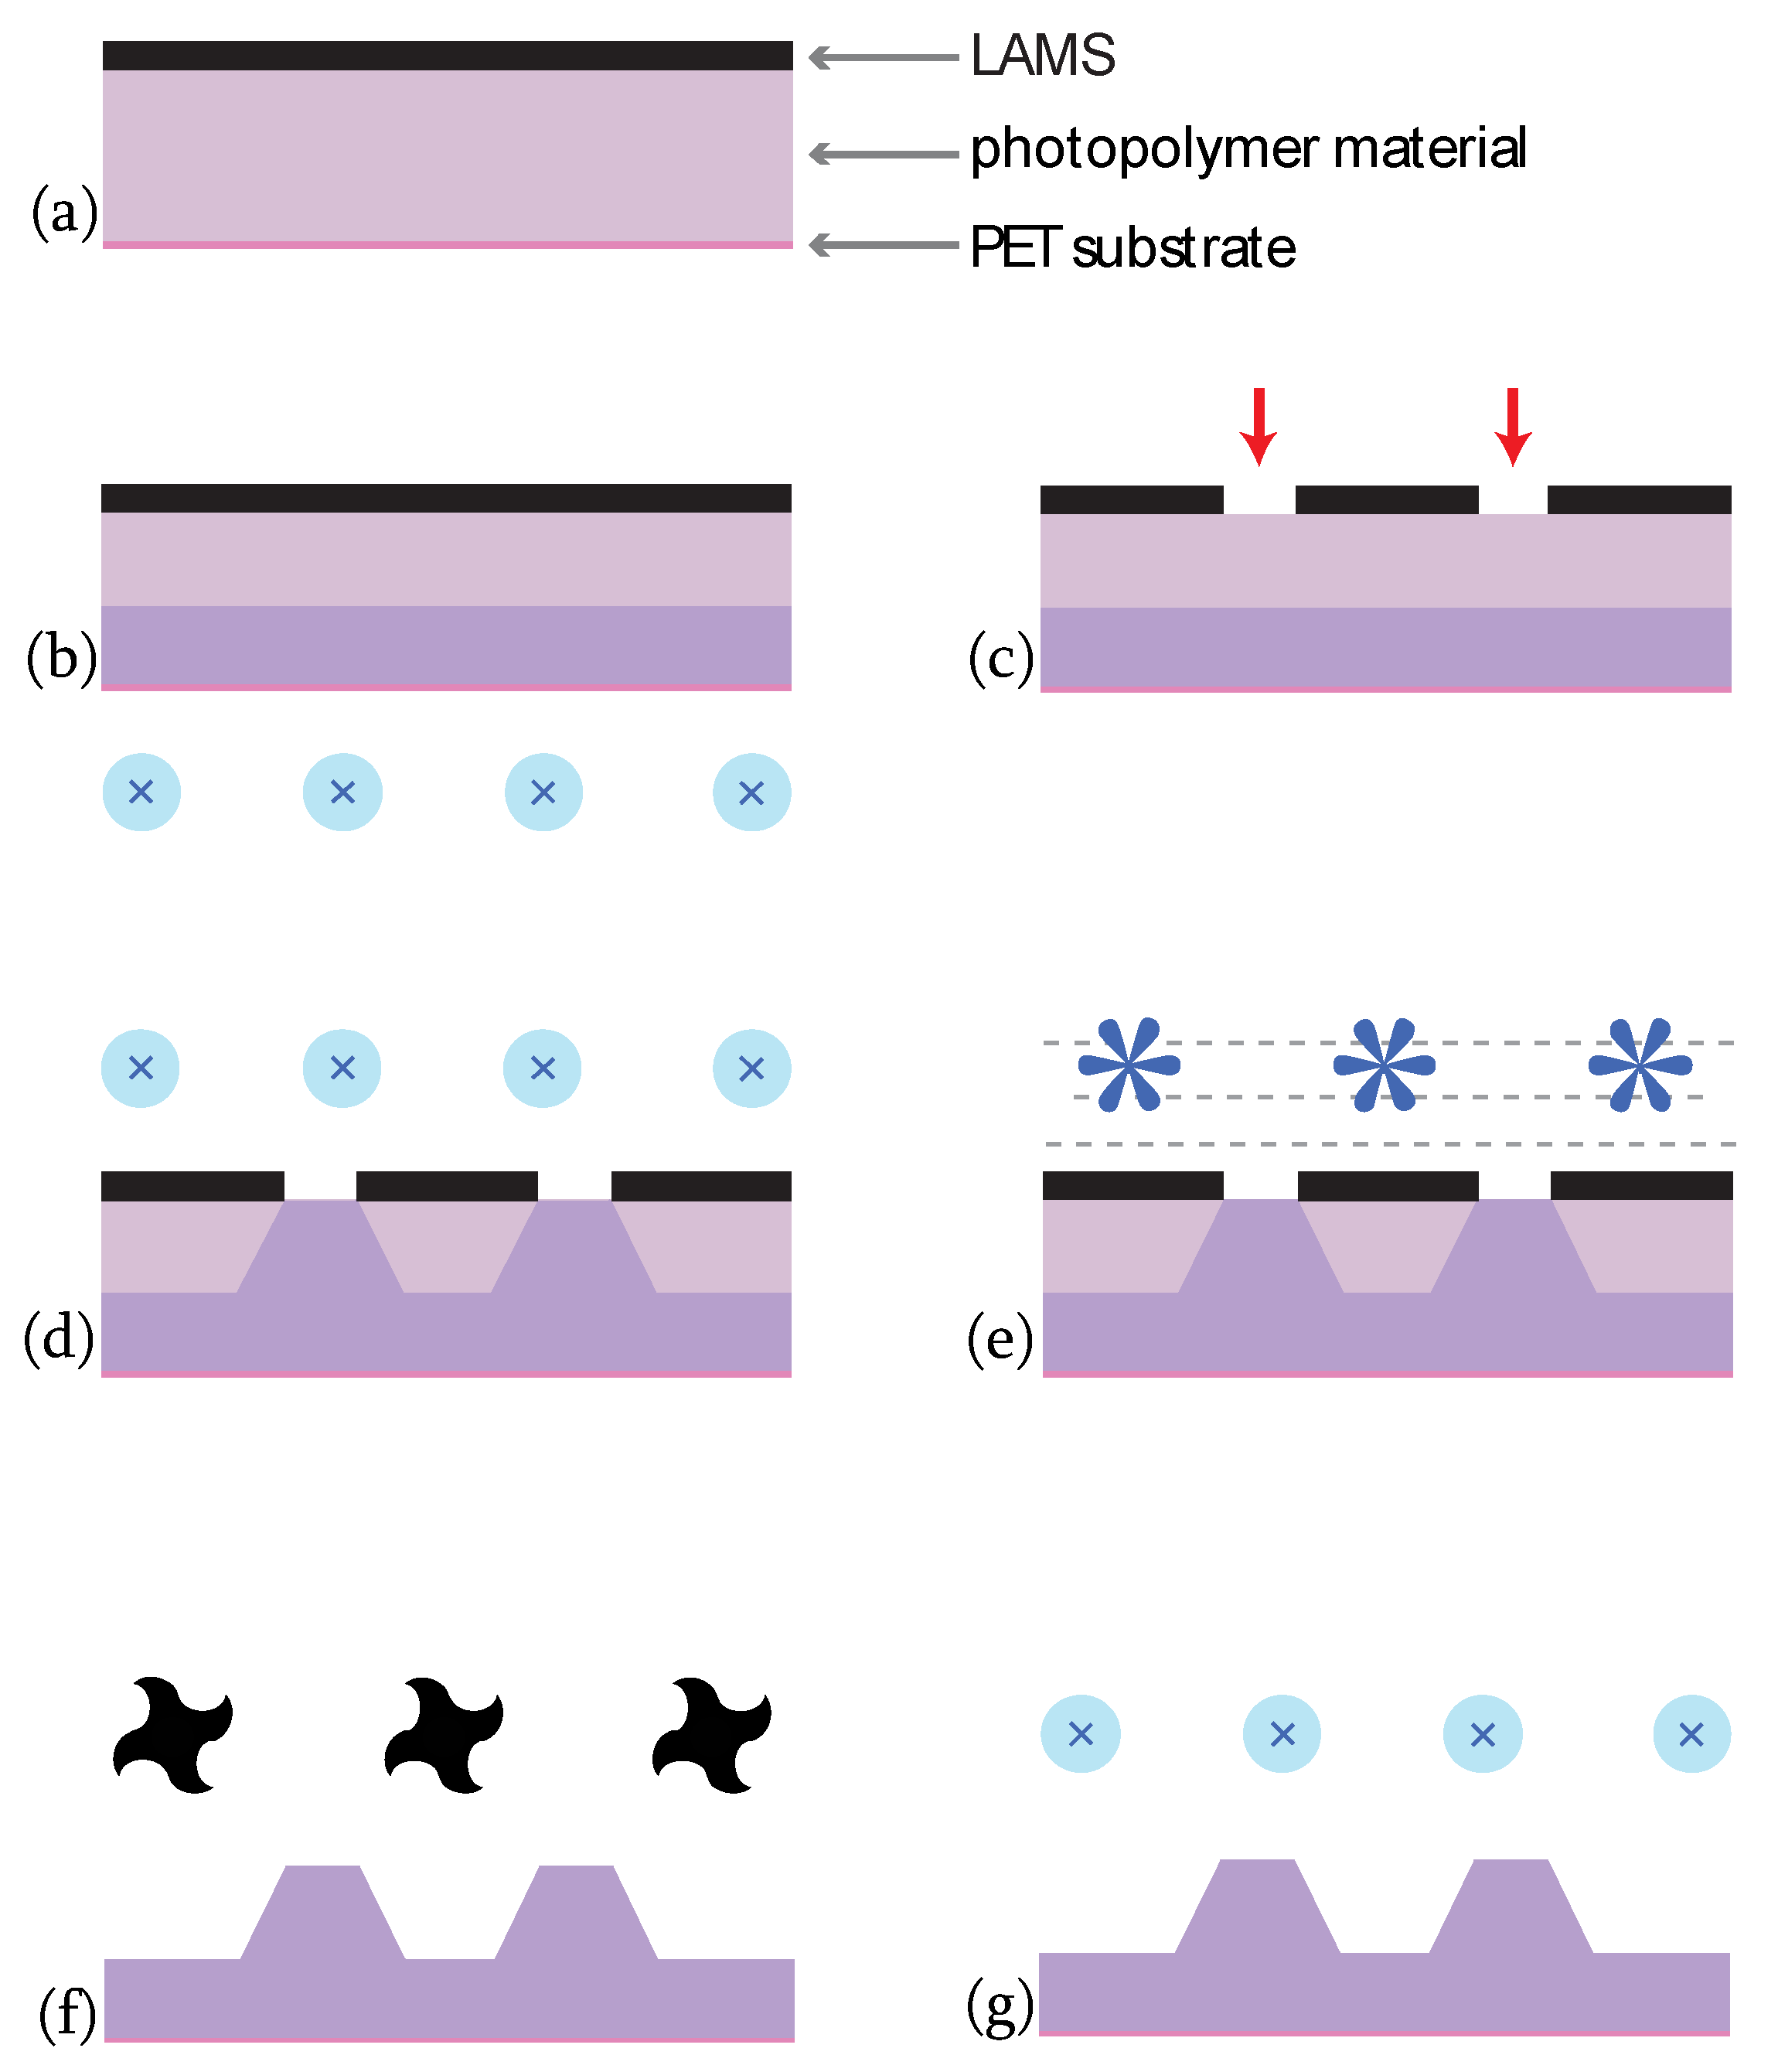
2.1. Photopolymer Printing Plates and Printed Motives

In this work, SFE components of three different types of photopolymer flexographic printing plates were calculated and analyzed, in relation to varied exposure of the photopolymer materials to UVA and UVC post-treatments. The aim was to build an optimized ANN for the prediction of the SFE components of these printing plates when UV post treatments are varied, thereby enabling the tailoring of the photopolymer’s surface properties before engaging in the printing plate production process. Since the primary prerequisite of this research was to retain the functional properties of printing plates in the reproduction process throughout all modifications, all procedures in the printing plate production workflow prior to the UV post-treatment needed to be kept constant and standardized, in order to result in a functional printing plate [29].
The types of photopolymer printing plates used in this research were two styrene-diene-based, commonly used, solvent-washable LAMS-based printing plates, and one water-washable LAMS-based printing plate. Specifically, the two solvent-washable photopolymer printing plates were Flint’s ACE Digital (Plate A), and MacDermid Digital MAX (Plate B). These two printing plates differed in their surface properties and composition. The third printing plate was a water-washable Toyobo Cosmolight QS, denoted as Plate C. All samples were prepared in standardized conditions up to the UV post-treatment, which was modified, pairing the constant duration of one wavelength type with the other that was varied. The motive on the printing plate surface consisted of fine lines (with line width from 0.02 mm to 0.8 mm—Figure 2). The duration of each UVA and UVC post-treatment varied from 0 to 20 min with a step of 1 min. The duration of the post-treatment that was kept constant was set to 10 min of UVA or UVC radiation for Plate A and Plate B, and 10 min of UVA and 5 min of UVC for Plate C, since preliminary research has shown that the exposure of Plate C to higher level of UV radiation resulted in visible damage in the plate’s surface (i.e., the start of the material degradation).
Since the purpose of this research was to maintain the necessary functional properties of the flexographic printing plate, both UVA and UVC post-treatments were performed on the samples (except the first, referent sample without any post-treatment).
Samples of test prints obtained by means of the printing plate samples were produced under the standard production conditions, respecting the ISO 9001:2008 and ISO 14001:2004 standards. The characteristics of the used anilox were 400 lcm−1, with cell volume of 4.5 cm3m−2. The printing speed was 200 mmin−1. The printing substrate was white PE LD with thickness of 60 µm, and the used printing ink was Gecko ® Base (Hubergroup, Kirchheimu bei München, Germany) solvent (ethanol)-based printing ink for flexible packaging.

2.2. Measurement and Analysis of Printing Plates and Prints

On the printing plate surfaces, contact angles of different referent liquids were measured by means of goniometer Data Physics OCA 30 (Dataphysics instruments, Filderstadt, Germany). Contact angles and known surface free energies of the referent liquids are the parameters which were used to calculate the SFE of the photopolymer surfaces. Three referent liquids of known surface energy were used for the measurements: water, glycerol and diiodomethane.
Contact angle was measured using the Sessile drop method, ten times on each sample, with repeat drops taken on different locations. The volume of the drops was 1 µm3. All measurements of the contact angle were performed at the same moment after the drop touched the photopolymer surface—after 5 s, and the average value was calculated.
The SFE (and its dispersive and polar component) of the photopolymer printing plate surfaces were calculated from obtained contact angles, using the OWRK method, which is applicable for polymer, aluminum and coatings characterization [30,31,32]. Obtained values of total SFE and its components were used to build and optimize ANNs for the prediction of the polar and dispersive SFE of three different photopolymer printing plates after given durations of UVA and UVC post-treatments.
Microscopic images of the fine lines on test prints produced using printing Plates A, B and C were observed via Olympus BX51 microscope, at a magnification of 50×.

2.3. Design of ANNs

In this paper, multilayer perceptron networks were used to predict the SFE of photopolymer flexographic printing plates. Networks were implemented using Keras neural network library in Python programming language. Prediction powers of different MLPs were assessed and compared. All tested networks had two input and two output neurons but differed in number of hidden layers (one or two), number of neurons per layer (5–10) and type of activation function (Keras built-in activation functions “relu”, “softplus”, “elu”, “selu”, “sigmoid”, “tanh”, “softsign” and “softmax”). Model inputs were printing plates’ post-exposure times for UVA and UVC parts of ultraviolet radiation. Model outputs were polar and disperse phases of SFE. Models were trained separately for three different printing plates. For each plate, datasets consisted of 40 measurements where UVA and UVC post-exposure times were varied in range from 0 to 20 min. The datasets were divided into training, validation and test sets using the common 70%, 15% and 15% rule, but minding that measurements taken on the beginning and end of the input range are included in the training set. Training was performed using the Keras built-in “Adam” optimization algorithm and the learning rate was set to 10−3. Considering the dataset size, it was not divided in batches. The number of training epochs was set to 10,000, with early stopping (stopping of training) set to number of epochs without improvement of validation loss metric of 200. Prediction powers of described ANNs were assessed on test sets and results are presented in Section 3.

3. Results and Discussion

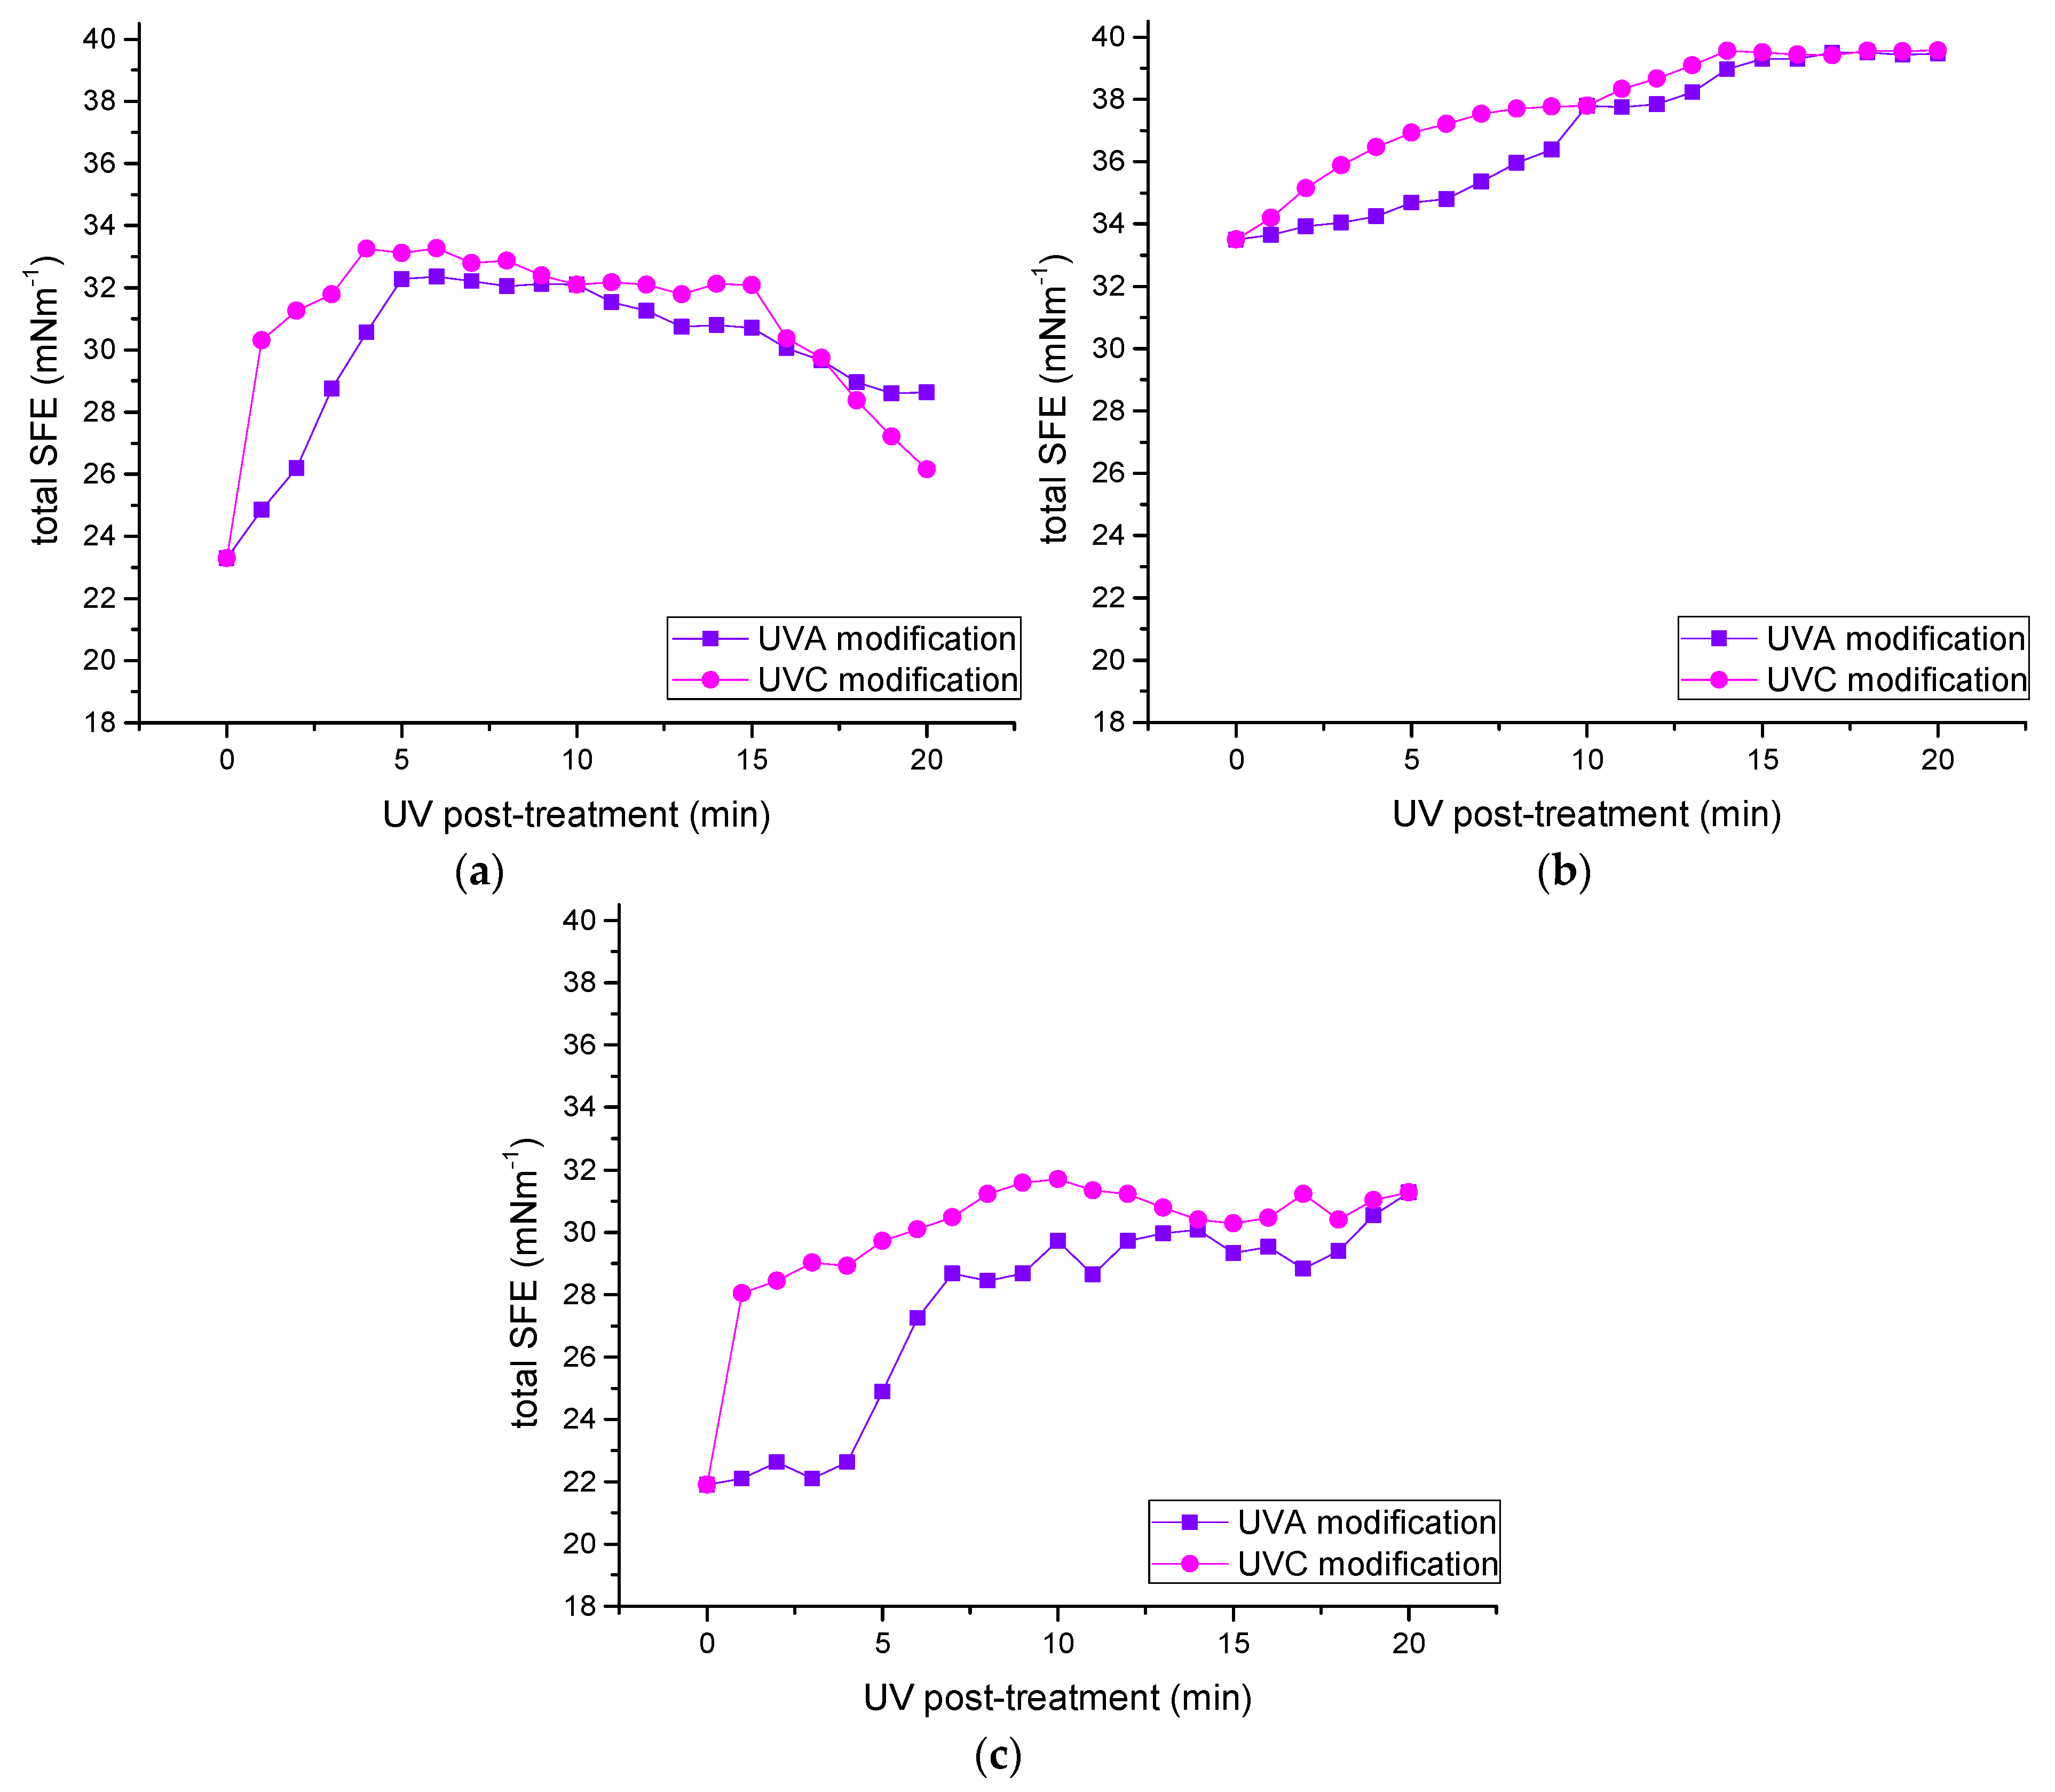
3.1. SFE of Photopolymer Surfaces

Calculations of the total SFE and its dispersive and polar components showed that the variations in UVA and UVC post-treatments have different effects on different photopolymer surfaces. Moreover, the changes in components of SFE caused by prolonged UVC post-treatment were more expressed than changes caused by UVA post-treatment, which was expected since UVC radiation carries more energy.
In all diagrams, the first point presents the SFE and its components with no performed UV post-treatment (0 min of UVA and 0 min of UVC radiation). Total SFE of Plate A reached a maximal value of 32.35 mNm−1 at 6 min of UVA post-treatment and then decreased to 28.6 mNm−1 after 20 min of UVA post-treatment (Figure 3a). Setting the duration of the UVA post-treatment of the photopolymer printing plate from 0 to 20 min caused an increase in total SFE from 34.25 mNm−1 to 39.47 mNm−1 for Plate B, and from 21.9 mNm−1 to 31.28 mNm−1 for Plate C (Figure 3b,c).
The changes in total SFE after prolonged UVA post-treatment are primarily caused by the changes in dispersive SFE (Figure 4). The increase in the total (and dispersive) SFE of the printing plates (Figure 3b,c) can be explained by further crosslinking which occurred in the photopolymer material and indicated that, even after the printing plate is considered to be finished in its production process, further crosslinking caused by UVA radiation took place. The inflexion point of total SFE at 5 min of UVA post-treatment for Plate A (Figure 3a) could be explained by the migration of the protective waxes with low molecular weight in the polymer composition to the surface [33]. When performing the variation of UVC radiation from 0 to 20 min, total SFE of the photopolymer surface for Plate A samples reached a maximal value of 33.27 mNm−1 at 6 min of UVC post-treatment and then decreased to 26.16 mNm−1 for 20 min of UVC post-treatment. Plate C samples displayed similar behavior, reaching a maximal value of total SFE of 31.71 mNm−1 at 10 min of UVC post-treatment and then starting to decrease, which could point to the start of the material degradation [34,35]. Plate B samples displayed a constant increase in total SFE from 33.5 mNm−1 to 39.57 mNm−1. UVC post-treatment (Figure 3a–c) had a stronger effect on all components of SFE. These changes are significant for the graphic reproduction process because of the changes in the wetting of the printing ink on the printing plate and its transfer from the printing plate to the substrate.
Changes of the dispersive SFE (a dominant SFE component of the used photopolymers) (Figure 4) display the same trends as the changes of the total SFE. Even though dispersive SFE is a dominant component influencing total SFE, changes in polar SFE have an interesting trend (Figure 5). Polar SFE displays a decrease, or at least stagnation after an initial increase for almost all samples.
Initial increase in polar SFE is caused by the integration of the oxygen in the surface layer of the photopolymer material [36,37]. However, the decrease in polar SFE after a certain duration of UV post-treatment can also be explained by the process of migration of waxes of low molecular weight to the surface of the material [13], or by the back-bending of the polar groups in the photopolymer surface layer [18].
Since UVA radiation initiates the crosslinking reaction, and UVC terminates it due to the higher energy and generation of ozone, one should use both UV post-treatments and combine their duration in order to achieve the desired SFE of the photopolymer material, applicable for the specific printing ink and printing substrate. Specifically, UVA radiation notably increases the initial dispersive and therefore total SFE of photopolymer plates, and UVC, when long enough, terminates it. Therefore, it is worth mentioning that printing plates that have undergone short UVA post-treatment have lower crosslinking degrees than the plates after cca. 10 min or more of UVA post-treatment, regardless of the prolonged UVC post-treatment. Furthermore, applied UV post-treatments should not diminish the functionality of the photopolymer printing plate in the reproduction process [38,39,40]. Non-linear behavior of SFE components after the varied UV post-treatments, together with different trends of changes present for different photopolymer materials, justify the need for the ANNs as a tool for the prediction of SFE components in relation to the duration of UVA and UVC post-treatment.

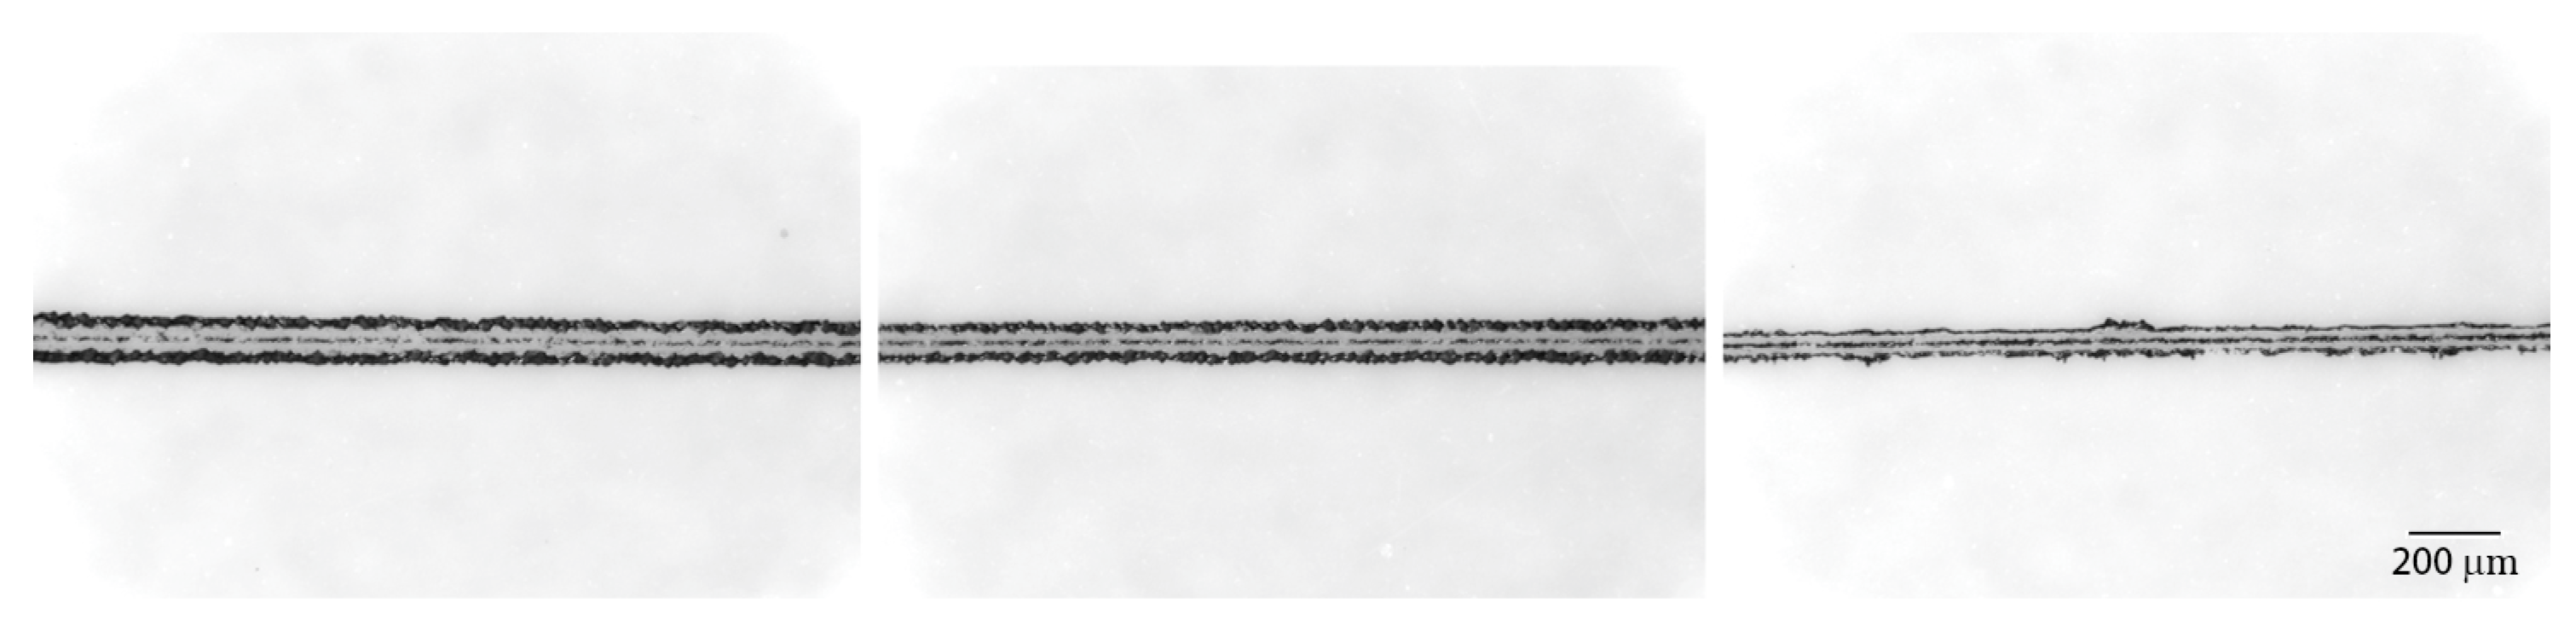
3.2. Microscopy of the Printed Lines

The microscopic images are displayed for the fine printed lines with nominal width of 20 µm (Figure 6, Figure 7 and Figure 8). Of note, all printed lines demonstrated an outlined edge. This is a common occurrence for flexographic prints on polymer substrates, which is a consequence of the printing plate’s mechanical deformation during the printing process. For the same reason, printed lines can have a wavy shape. Images of printed lines obtained from UV post-treated Plate A are presented in Figure 6. It is visible that the print obtained by a printing plate exposed to 2 min of UVA post-treatment (Figure 6, left) presented with curved, discontinuous line, due to the insufficient hardness and low SFE of the printing plate as a result of the short UVA post-treatment, where the crosslinking of the photopolymer material was not completed. A plate exposed to 10 min of UV post-treatments (Figure 6, middle) resulted in a thicker printed line, but its edges are not well defined, due to the poor wetting of the printing ink on the printing plate. In general, Plate A has negligible polar SFE even after prolonged UV post-treatments, which does not enable improved wetting of ink on the plate and its transfer to the substrate. Prolonged UVC post-treatment improved the quality of the printed line’s edge (Figure 6, right).
In Figure 7, one can see the effect of the varied UV post-treatments on fine lines on prints obtained from Plate B. It is apparent that the line printed by means of a printing plate with 2 min of UVA post-treatment (Figure 7, left) resulted in poor ink transfer to the printing substrate. This indicates that the SFE of the photopolymer material was too low at that point in order to ensure the correct wetting of the printing ink on the printing plate‘s surface.
Prolonging the UVA post-treatment resulted in improved definition of the line shape (Figure 7, middle), since the UV post-treatment increased both the hardness and SFE of the plate—the distortion of the line shape occurred in the printing process because of the plate’s elastic deformation after too short a UV post-treatment, since hardness was not increased adequately. Prolonged UVC post-treatment of Plate B (Figure 7, right) resulted in the stable, correctly defined line on the print, since the prolonged UV radiation causes an increase in the photopolymer’s hardness, as well [18].
Figure 8 displays fine lines printed by Plate C. Printed fine lines are straight, regardless of the duration of UV post-treatments, pointing to the stable and correctly formed fine elements on the printing plate.
It is apparent that 2 min of UVA post-treatment (Figure 8, left) resulted in an increased ink amount on the print (and the plate), and wider printed line compared to prolonged UVA and UVC post-treatments (Figure 8, right). The reason is the increased crosslinking degree in the photopolymer after the prolonged UV post-treatment, which resulted in lesser elastic deformation of the printing plate during the printing process.

3.3. Performance of ANNs

Performance of different MLP networks was evaluated using mean squared error (MSE) between model predictions and measurements on test data sets. We consider the number of layers, the number of neurons and the type of activation function as factors influencing the model’s prediction accuracy. In the following report, results are grouped with respect to factors and their levels in such a way that when results are presented for different levels of a given factor, all levels of other factors are included. This way of grouping enables discerning which factors have significant effects. Results where the number of hidden layers is varied between one and two are presented in Figure 9. To isolate the effect of the number of hidden layers, results include all numbers of neurons and types of activation functions. Orange lines in following boxplots (Figure 9, Figure 10 and Figure 11) present median values of MSEs. Boxplots reveal that the number of hidden layers has no significant effect on the prediction accuracy of ANN. While absolute test set MSE metrics differ for three plates, results for different number of layers for each plate are similar.
Results for different numbers of neurons are presented in Figure 10. To isolate the effect of the number of neurons, results include all numbers of layers and types of activation functions. Boxplots reveal that the effect of the number of neurons is not significant. For each plate, all ANNs with different numbers of neurons resulted in similar test set MSE ranges and medians.
Results for different activation functions are displayed in Figure 11. Functions are denoted with capital letters as listed in Table 1. Functions A–D are “linear unit” functions and E-G are sigmoid-shaped functions. To isolate the effect of activation functions, results include all numbers of layers and neurons. Boxplots reveal that the choice of activation function has a significant effect on the test set MSE ranges and medians. Boxplots in Figure 11 reveal that sigmoid-shaped functions performed well for all plates. Linear unit functions performed well in many cases for Plate A and B as indicated by small MSE medians, but they produced large MSE in some cases for those plates (A and B) and generally performed poorly for Plate C. Furthermore, for Plate A and B, “selu” activation performed very well in all cases.
Figure 12 displays the best-performing activation functions for each plate. By best-performing, we mean the activation function which, on a given plate, resulted in the smallest test set MSE for one combination of the number of layers and neurons, not best-performing on average. For Plate A (Figure 12a), the smallest test set MSE was achieved with “selu” activation function, two hidden layers and 9 neurons per layer. For Plate B (Figure 12b), the smallest test set MSE was achieved with “softplus” activation function, two hidden layers and 10 neurons per layer. It is interesting to note that for those two plates, ANNs with one layer and smaller number of neurons performed quite well, with MSEs comparable to the best result. The number of neurons per layer had a much larger impact on ANNs’ performance for one-layered than for two-layered networks. This impact has no visible trend. For instance, in the case of one-layered networks for Plate B (Figure 12b), increasing the number of neurons from 6 to 7 results in drastic increase in MSE, but further increase in the number of neurons from 7 to 8 results in drastic decrease in MSE, with a value close to that for 6 neurons. For Plate C (Figure 12c), the smallest test set MSE was achieved with “sigmoid” activation function, two hidden layers and 7 neurons per layer. For this plate, in most cases two-layered networks performed better than one-layered networks, but it should be noted that the two-layered network with 10 neurons per layer performed worse than the one-layered networks with 6 and 7 neurons.
Table 2 displays performance results for best-performing networks for three plates.
Table 2 presents minimal, maximal and median deviations for dispersive SFE and polar SFE on test set data. The presented values were obtained with the best-performing ANN models for each plate. Deviations are absolute differences between measured and predicted values. It should be noted that dispersive SFE and polar SFE values presented in the table are not pairs for a single SFE point since minimal, maximal and median deviations were calculated separately for dispersive SFE and polar SFE. For all three plates, the predictions are quite accurate. For dispersive SFE, typical SFE estimation errors range between 1 and 3 (see supplementary materials). The maximal deviations of the ANN models presented in Table 2 are within this range, while median errors are well below it. Therefore, the prediction power of the tested models is quite good for dispersive SFE. Deviations of polar SFE are higher than of dispersive SFE when comparing them with polar SFE and dispersive SFE values, respectively. However, these deviations are within the range of errors of SFE calculation. When estimating the SFE of polymers with low polarity, higher deviations of calculated polar SFE are common, since dispersive forces are dominant. In conclusion, performance of ANNs applied in this work can be classified as satisfactory for the application in the real systems.
Choosing the optimal ANN architecture in terms of numbers of layers and neurons as well as the choice of activation function is still the topic of research. Previous research on that topic took various approaches. In works such as [10,11], authors suggest analytical solutions for ANN architecture optimization. In [10], a solution is proposed for finding the optimal number of neurons for MLP network with one hidden layer, but the modeling problem presented in this paper did not exhibit a trend in test set MSE depending on the number of neurons. In this case, MLPs with two hidden layers were shown as preferable over those with one hidden layer since, for two-layered networks, the test set MSE was much more stable over different numbers of neurons per layer. In the modeling case presented in this paper, networks with two hidden layers and 7–10 neurons per layer exhibited the best performance, although the exact best number of neurons differed for the three plates. The effect of the type of activation function was found to be the most significant. While for each plate the best results were achieved with different activation functions, and for plates A and B those were “selu” and “softplus” (linear unit functions), sigmoid-shaped activation functions provided consistent results in terms of test set prediction accuracy over all three plates. Nevertheless, the best results for plates A and B (obtained with “selu” and “softplus” activations) were significantly better than results obtained with sigmoid-shaped activation functions.

4. Conclusions

In this work, the SFE components of three different types of flexographic printing plates were modified by varied UVA and UVC post-treatments. The aim was to build and optimize ANNs for the prediction of printing plates’ dispersive and polar SFE after the set durations of UV post-treatments, prior to the production of the printing plate. In this way, the surface properties of different photopolymer materials used as flexographic printing plates could be tailored to meet the requirements of the specific printing system, i.e., to fine-tune the polar and dispersive SFE for the application of a specific printing ink on a given substrate.
While, for the modeling application presented in this paper, it may not be possible to suggest a single ANN architecture which works optimally for all plates, the results presented in this paper narrow the choices, which are summarized as follows. Networks with two hidden layers are preferable over those with one hidden layer. Candidate activation functions are modified versions of the “relu” activation function, namely “selu” and “softplus”, as well as sigmoid-shaped activation functions. The optimal number of neurons per layer was found to be in the range from 7 to 10. These guidelines narrow the choice of potential ANN architectures for the modeling application presented in this paper, namely the automation of the tailored UV post-treatment of commonly used photopolymer printing plates with different compositions and surface properties. Following the presented guidelines for other similar materials requires testing a smaller number of ANN architectures in search of the most favorable one. If a printer can adjust the polar and dispersive SFE of a printing plate using only UV post-treatments, then the wetting and adhesion with chosen types of printing inks can be adjusted and the print quality can be optimized. Application of the presented ANNs can be expanded to include hardness of the plate or some print properties as outputs, and different printing inks as inputs, thereby expanding the possibilities for improving the print quality in flexography.

Supplementary Materials

The following supporting information can be downloaded at: https://www.mdpi.com/article/10.3390/machines11060618/s1, Table S1: Neural network inputs.

Author Contributions

Conceptualization, T.T. and D.D.; methodology, T.T. and D.D.; software, D.D.; validation, D.D.; formal analysis, T.T., S.M.P. and D.D.; investigation, T.T., D.D. and S.M.P.; resources, T.T. and D.D.; writing—original draft preparation, T.T. and D.D.; writing—review and editing, S.M.P.; visualization, T.T. and D.D.; supervision, S.M.P. All authors have read and agreed to the published version of the manuscript.

Funding

This research received no external funding.

Data Availability Statement

Not applicable.

Conflicts of Interest

The authors declare no conflict of interest.

References

  1. Balaban, P.; Viduka, D.; Ristic, V.; Maksin, M.; Radic, V.; Vladisavljevic, R.; Vulic, M.; Josimovic, M.; Radivojevic, N.Z. Mechanical and barrier properties of flexible packaging materials after the flexo printing process. J. Natl. Sci. Found. Sri. Lanka 2021, 49, 513. [Google Scholar] [CrossRef]
  2. Muthamma, K.; Gouda, B.M.; Sunil, D.; Kulkarni, S.D.; PJ, A. Water-based fluorescent flexo-ink for security applications. Chem. Pap. 2023, 1, 1–8. [Google Scholar] [CrossRef]
  3. Zhong, Z.W.; Ee, J.H.; Chen, S.H.; Shan, X.C. Parametric investigation of flexographic printing processes for R2R printed electronics. Mater. Manuf. Process. 2020, 35, 564–571. [Google Scholar] [CrossRef]
  4. Wolfer, T.; Bollgruen, P.; Mager, D.; Overmeyer, L.; Korvink, J.G. Flexographic and Inkjet Printing of Polymer Optical Waveguides for Fully Integrated Sensor Systems. Procedia Technol. 2014, 15, 521–529. [Google Scholar] [CrossRef] [Green Version]
  5. Morgan, M.L.; Holder, A.; Curtis, D.J.; Deganello, D. Formulation, characterisation and flexographic printing of novel Boger fluids to assess the effects of ink elasticity on print uniformity. Rheol. Acta 2018, 57, 105–112. [Google Scholar] [CrossRef] [Green Version]
  6. Deganello, D.; Cherry, J.A.; Gethin, D.T.; Claypole, T.C. Impact of metered ink volume on reel-to-reel flexographic printed conductive networks for enhanced thin film conductivity. Thin Solid Films 2012, 520, 2233–2237. [Google Scholar] [CrossRef]
  7. Joyce, M.; Pal, L.; Hicks, R.; Agate, S.; Williams, T.S.; Ray, G.; Fleming, P.D. Custom tailoring of conductive ink/substrate properties for increased thin film deposition of poly(dimethylsiloxane) films. J. Mater. Sci. Mater. Electron. 2018, 29, 10461–10470. [Google Scholar] [CrossRef]
  8. Schmitz, C.; Poplata, T.; Feilen, A.; Strehmel, B. Radiation crosslinking of pigmented coating material by UV LEDs enabling depth curing and preventing oxygen inhibition. Prog. Org. Coat. 2020, 144, 105663. [Google Scholar] [CrossRef]
  9. Yagci, Y.; Jockusch, S.; Turro, N.J. Photoinitiated Polymerization: Advances, Challenges, and Opportunities. Macromolecules 2010, 43, 6245–6260. [Google Scholar] [CrossRef]
  10. Izdebska-Podsiadły, J.; Samoraj, M.; Blachowski, K.; Markowski, L.; Godlewski, H.; Dąbrowa, T.; Żołek-Tryznowska, Z. A comparative study of the interaction between the dried ink layer and PLA film used for packaging purposes. Polym. Eng. Sci. 2021, 61, 3118–3124. [Google Scholar] [CrossRef]
  11. Hamblyn, A. Effect of Plate Characteristics on Ink Transfer in Flexographic Printing. Ph.D. Thesis, Swansea University, Swansea, UK, 2015. [Google Scholar]
  12. Andrzejewska, E. Photopolymerization kinetics of multifunctional monomers. Prog. Polym. Sci. 2001, 26, 605–665. [Google Scholar] [CrossRef]
  13. Knöll, R. Photopolymerizable Flexographic Printing Elements Comprising SIS/SBS Mixtures as Binder for the Production of Flexographic Printing Plates. U.S. Patent 6,531,263, 11 March 2003. [Google Scholar]
  14. Cosnahan, T.; Watt, A.A.R.; Assender, H.E. Flexography Printing for Organic Thin Film Transistors. Mater. Today Proc. 2018, 5, 16051–16057. [Google Scholar] [CrossRef]
  15. Izdebska-Podsiadły, J.; Podsiadło, H. Influence of biodegradable solvent-based ink on the flexography print quality of compostable films. Polym. Res. J. 2016, 10, 283–293. [Google Scholar]
  16. Tian, Q.; Liu, Y.; Wang, H. Study on Exposure Characteristics of Ultraviolet (UV) Light-Emitting Diode (LED) for Platemaking of Flexopress. Lect. Notes Electr. Eng. 2022, 896, 220–227. [Google Scholar] [CrossRef]
  17. Andersson, C.; Johnson, J.; Järnström, L. Ultraviolet-induced aging of flexographic printing plates studied by thermal and structural analysis methods. J. Appl. Polym. Sci. 2009, 112, 1636–1646. [Google Scholar] [CrossRef]
  18. Mahović Poljaček, S.; Tomašegović, T.; Leskovac, M.; Jakovljević, S. Neural network-based UV adjustment of the photopolymer surface for modification of coating properties printed in flexography. J. Coat. Technol. Res. 2020, 17, 271–284. [Google Scholar] [CrossRef]
  19. Kalay, O.C.; Karpat, E.; Dirik, A.E.; Karpat, F. A One-Dimensional Convolutional Neural Network-Based Method for Diagnosis of Tooth Root Cracks in Asymmetric Spur Gear Pairs. Machines 2023, 11, 413. [Google Scholar] [CrossRef]
  20. Cavaleri, L.; Asteris, P.G.; Psyllaki, P.P.; Douvika, M.G.; Skentou, A.D.; Vaxevanidis, N.M. Prediction of surface treatment effects on the tribological performance of tool steels using artificial neural networks. Appl. Sci. 2019, 9, 2788. [Google Scholar] [CrossRef] [Green Version]
  21. Steege, T.; Bernard, G.; Darm, P.; Kunze, T.; Lasagni, A.F. Prediction of Surface Roughness in Functional Laser Surface Texturing Utilizing Machine Learning. Photonics 2023, 10, 361. [Google Scholar] [CrossRef]
  22. Ahadian, S.; Moradian, S.; Sharif, F.; Tehran, M.A.; Mohseni, M. Application of artificial neural network (ANN) in order to predict the surface free energy of powders using the capillary rise method. Colloids Surf. A Physicochem. Eng. Asp. 2007, 302, 280–285. [Google Scholar] [CrossRef]
  23. Nakano, T.; Alessandro Bucci, M.; Gratien, J.-M.; Faney, T.; Charpiat, G.; Nakano, T.; Bucci, M.A.; Gratien, J.; Faney, T.; Charpiat, G. Machine Learning Model for Gas-Liquid Interface Reconstruction in CFD Numerical Simulations. Available online: https://hal.science/hal-03721729/document (accessed on 25 April 2023).
  24. Ni, P.; Goto, H.; Nakamoto, M.; Tanaka, T. Neural network modelling on contact angles of liquid metals and oxide ceramics. ISIJ Int. 2020, 60, 1586–1595. [Google Scholar] [CrossRef]
  25. Soori, T.; Moein Rassoulinejad-Mousavi, S.; Zhang, L.; Rokoni, A.; Sun, Y. A machine learning approach for estimating surface tension based on pendant drop images. Fluid Phase Equilibria. 2021, 538, 1130122021. [Google Scholar] [CrossRef]
  26. Roosta, A.; Setoodeh, P.; Jahanmiri, A. Artificial neural network modeling of surface tension for pure organic compounds. Ind. Eng. Chem. Res. 2012, 51, 561–566. [Google Scholar] [CrossRef]
  27. Mulero, Á.; Pierantozzi, M.; Cachadiña, I.; Di Nicola, G. An Artificial Neural Network for the surface tension of alcohols. Fluid Phase Equilib. 2017, 449, 28–40. [Google Scholar] [CrossRef]
  28. Shaikh, M.S.; Shariff, A.M.; Bustam, M.A.; Garg, S.; Qureshi, K.; Shaikh, P.H.; Bhatti, I. Experimental studies and artificial neural network modeling of surface tension of aqueous sodium L-prolinate solutions and piperazine blends. Chin. J. Chem. Eng. 2019, 27, 1904–1911. [Google Scholar] [CrossRef]
  29. Tomašegović, T.; Beynon, D.; Claypole, T.; Mahović Poljaček, S. Tailoring the properties of deposited thin coating and print features in flexography by application of UV-ozone treatment. J. Coat. Technol. Res. 2016, 13, 815–828. [Google Scholar] [CrossRef]
  30. Owens, D.K.; Wendt, R.C. Estimation of the surface free energy of polymers. J. Appl. Polym. Sci. 1969, 13, 1741–1747. [Google Scholar] [CrossRef]
  31. Van Oss, C.J.; Giese, R.F.; Li, Z.; Murphy, K.; Norris, J.; Chaudhury, M.K.; Good, R.J. Contact Angle, Wettability and Adhesion; Mittal, K.L., Ed.; VSP: Utrecht, The Netherlands, 1993. [Google Scholar]
  32. Priselac, D.; Mahović Poljaček, S.; Tomašegović, T.; Leskovac, M. Blends Based on Poly(ε-Caprolactone) with Addition of Poly(Lactic Acid) and Coconut Fibers: Thermal Analysis, Ageing Behavior and Application for Embossing Process. Polymers 2022, 14, 1792. [Google Scholar] [CrossRef]
  33. Mogg, B.T.; Claypole, T.; Deganello, D.; Phillips, C. Flexographic printing of ultra-thin semiconductor polymer layers. Transl. Mater. Res. 2016, 3, 015001. [Google Scholar] [CrossRef] [Green Version]
  34. Lin, J.; Yan, D.; Fu, J.; Chen, Y.; Ou, H. Ultraviolet-C and vacuum ultraviolet inducing surface degradation of microplastics. Water Res. 2020, 186, 116360. [Google Scholar] [CrossRef]
  35. Watuthanthrige, N.D.A.; Reeves, J.A.; Dolan, M.T.; Valloppilly, S.; Zanjani, M.B.; Ye, Z.; Konkolewicz, D. Wavelength-Controlled Synthesis and Degradation of Thermoplastic Elastomers Based on Intrinsically Photoresponsive Phenyl Vinyl Ketone. Macromolecules 2020, 53, 5199–5207. [Google Scholar] [CrossRef]
  36. Takacs, G.A.; Miri, M.J.; Kovach, T. Vacuum UV Surface Photo-Oxidation of Polymeric and Other Materials for Improving Adhesion: A Critical Review. Prog. Adhes. Adhes. 2021, 6, 559–585. [Google Scholar] [CrossRef]
  37. Chylińska, M.; Kaczmarek, H.; Moszyński, D.; Królikowski, B.; Kowalonek, J. Surface Studies of UV Irradiated Polypropylene Films Modified with Mineral Fillers Designed as Piezoelectric Materials. Polymers 2020, 12, 562. [Google Scholar] [CrossRef] [Green Version]
  38. Kramer, P.; Davis, L.; Jones, R. Control of Free-Radical Reactivity in Photopolymerization of Acrylates. Available online: https://www.radtech.org/proceedings/2012/papers/Session%2024%20-%20Kinetics/PKramer_Rutgers.pdf (accessed on 25 April 2023).
  39. Cataldo, F. The action of ozone on polymers having unconjugated and cross- or linearly conjugated unsaturation: Chemistry and technological aspects. Polym. Degrad. Stab. 2001, 73, 511–520. [Google Scholar] [CrossRef]
  40. Tomašegović, T.; Mahović Poljaček, S.; Leskovac, M. UVA and UVC modification of photo polymeric surface and application for flexographic deposition of thin coatings. J. Appl. Polym. Sci. 2016, 133, 43526. [Google Scholar] [CrossRef]
Figure 1. Production of the LAMS-based flexographic printing plate: (a) photopolymer material with PET substrate, (b) back exposure, (c) ablation of LAMS, (d) main exposure, (e) developing, (f) drying, (g) UV post-treatments.
Machines 11 00618 g001
Figure 2. Test image transferred from the digital file to the surfaces of printing plates.
Machines 11 00618 g002
Figure 3. Total SFE of printing plate samples exposed to varied UVA and UVC post-treatments: (a) Plate A, (b) Plate B, (c) Plate C.
Machines 11 00618 g003
Figure 4. Dispersive SFE of printing plate samples exposed to varied UVA and UVC post-treatments: (a) Plate A, (b) Plate B, (c) Plate C.
Machines 11 00618 g004
Figure 5. Polar SFE of printing plate samples exposed to varied UVA and UVC post-treatments: (a) Plate A, (b) Plate B, (c) Plate C.
Machines 11 00618 g005
Figure 6. Microscopic displays of fine printed lines obtained by Plate A after varied UV post-treatments (magnification of 50×): (left)—2 min of UVA and 10 min of UVC, (middle)—10 min of UVA and 10 min of UVC, (right)—10 min of UVA and 20 min of UVC.
Machines 11 00618 g006
Figure 7. Microscopic displays of fine printed lines obtained by Plate B after varied UV post-treatments (magnification of 50×): (left)—2 min of UVA and 10 min of UVC, (middle)—10 min of UVA and 10 min of UVC, (right)—10 min of UVA and 20 min of UVC.
Machines 11 00618 g007
Figure 8. Microscopic displays of fine printed lines obtained by Plate C after varied UV post-treatments (magnification of 50×): (left)—2 min of UVA and 5 min of UVC, (middle)—10 min of UVA and 5 min of UVC, (right)—10 min of UVA and 20 min of UVC.
Machines 11 00618 g008
Figure 9. Performance of ANNs with different number of hidden layers for: (a) Plate A, (b) Plate B, (c) Plate C.
Machines 11 00618 g009
Figure 10. Performance of ANNs with different number of neurons for: (a) Plate A, (b) Plate B, (c) Plate C.
Machines 11 00618 g010
Figure 11. Performance of ANNs with different activation functions for: (a) Plate A, (b) Plate B, (c) Plate C.
Machines 11 00618 g011
Figure 12. Best-performing activation functions for: (a) Plate A, (b) Plate B, (c) Plate C.
Machines 11 00618 g012
Table 1. Activation functions.
ABCDEFG
relusoftpluseluselusigmoidtanhsoftsign
Table 2. Performance of ANNs.
Measured ValuesPredicted ValuesDeviation
Dispersive SFEPolar SFEDispersive SFEPolar SFEDispersive SFEPolar SFE
Plate AMin.32.040.1032.150.090.110.01
Median31.840.1332.550.060.710.06
Max.31.950.1233.190.241.240.12
Plate BMin.36.572.1436.042.130.530.01
Median34.172.2734.792.360.620.09
Max.35.212.8432.002.533.210.31
Plate CMin.24.334.3824.324.400.020.02
Median25.114.8225.484.610.370.21
Max.25.783.4425.104.570.681.13
Disclaimer/Publisher’s Note: The statements, opinions and data contained in all publications are solely those of the individual author(s) and contributor(s) and not of MDPI and/or the editor(s). MDPI and/or the editor(s) disclaim responsibility for any injury to people or property resulting from any ideas, methods, instructions or products referred to in the content.

