Abstract
An experimental study of the process of friction between a steel spherical indenter and a soft elastic elastomer, with a strongly pronounced adhesive interaction between the surfaces of the contacting bodies, is presented. We consider sliding of the indenter at low speed (quasi-static contact) for different indentation depths. The forces, displacements and contact configuration as functions of time were recorded. The most important finding is that under conditions of uni-lateral continuous sliding, the tangential stress in the contact area remains constant and independent on the indentation depth and details of loading. We suggest a simple numerical model in which the elastic substrate is considered as a simple elastic layer (thus reminding a two-dimensional elastic foundation), although with in-plane elastic interactions. It is found that this model leads to the dynamic scenarios which qualitatively resemble the experimentally observed behavior of the considered system.
1. Introduction
Adhesion plays an important role in the physics of contact interaction. There are a number of areas in which adhesion finds practical application, including soldering, painting, granulation, packaging of fertilizers, mechanical manipulation by macroscopic and microscopic objects, etc. [1,2]. Adhesive interaction is used by biological organisms for moving and attaching to surfaces: from microscopic bacteria [3,4] to amphibians and reptiles [5,6]. Recently, adhesive contacts have been the object of intensive experimental (e.g., [7,8,9]), theoretical [9,10] and numerical [8,11,12,13] studies.
The first rigorous theory of adhesion was JKR theory [10], proposed in 1971. It describes a quasi-static normal contact between a solid indenter with a parabolic profile and an elastic half-space under the assumption of vanishing friction at the contact interface. In reality, there is always strong friction in the interface, and the contact force generally has both normal and tangential components. Although there exist several experiments and theories describing the movement of the indenter at an angle to the interface [14], the problem of tangentially loaded adhesive contacts remains the less understood aspect of adhesive contacts. It was observed previously that tangential loading makes the initially axially symmetrical contact more and more asymmetric [14,15]. Its area also changes (usually decreases) due to tangential loading. Reducing the contact area leads to a decrease in contact adhesive strength. In [16], the adhesive contact was studied during tangential shear of bodies that do not have axial symmetry. One example of current interest is a contact between a human finger and a glass plate which attracted interest due to the extensive use of touch screens [17]. Experimental studies clearly show that in both situations of symmetric and asymmetric bodies, tangential loading leads to a decrease in the contact area. In the present study, it is experimentally demonstrated that tangential movement may also lead to an increase in the contact area which occurs under specific loading scenarios. The effect of the increase in the area has previously been observed by us [18]. Another important problem associated with tangential motion is the transition between so-called static and kinetic modes of motion [19], which becomes much more complicated in the presence of strong adhesive interaction.
Even in the case of pure normal contact (indentation in vertical direction without tangential motion), there are a number of unresolved problems. As a matter of fact, all experiments show a behavior that is not described by classical theories such as JKR or DMT [10,20,21]. For example, a hysteresis of the adhesive force is always observed in experiments, when the direction of indentation changes [22,23], while such a hysteresis is absent in JKR (DMT). The JKR (DMT) theory shows instantaneous breakdown of an adhesive contact when the indentation depth reaches the critical value. In contrast to this, in experiments under “fixed grips” (controlled displacement) conditions (for example, motion of the indenter with constant velocity), adhesive force and contact area almost always disappear monotonically [24]. However, under “fixed load” conditions (for example, pull-off of the indenter from the substrate with the help of a soft spring), contact is lost abruptly both in experiments and in theory [25]. There are many other experimentally discovered effects that contradict the classical theories. Tangential contact in the presence of adhesion has been investigated even less often. An interesting fact is that the classic work of Shallamach [26], describing experimental observations of friction between rubber and a rigid indenter, was published in the same year as the classical theory of adhesion JKR [10], which later became very widespread in describing adhesion of soft materials. Various palliative modifications of JKR are used for the description of tangential contacts (see, for example, [27,28]). However, JKR describes a quasi-static contact and is therefore unable to describe the complex dynamic processes of contact restructuring and propagation of elastic waves (so called Shallamach waves) observable in the stationary mode of tangential shear [26]. Despite this, the JKR theory is still widely used, even in application to tangential contact.
In the present paper, we describe the results of experiments in which the sliding of a steel spherical indenter over an elastomer is studied in the presence of an adhesive interaction between the contacting bodies. Special attention is paid to the peculiarities of the stationary slip process and contact restructuring. In the second part of the paper, a numerical model of the sliding process is described. Despite its relative simplicity, it qualitatively reproduces many experimentally observed features of the system under consideration.
2. Methodology of Investigations
2.1. Experimental Technique
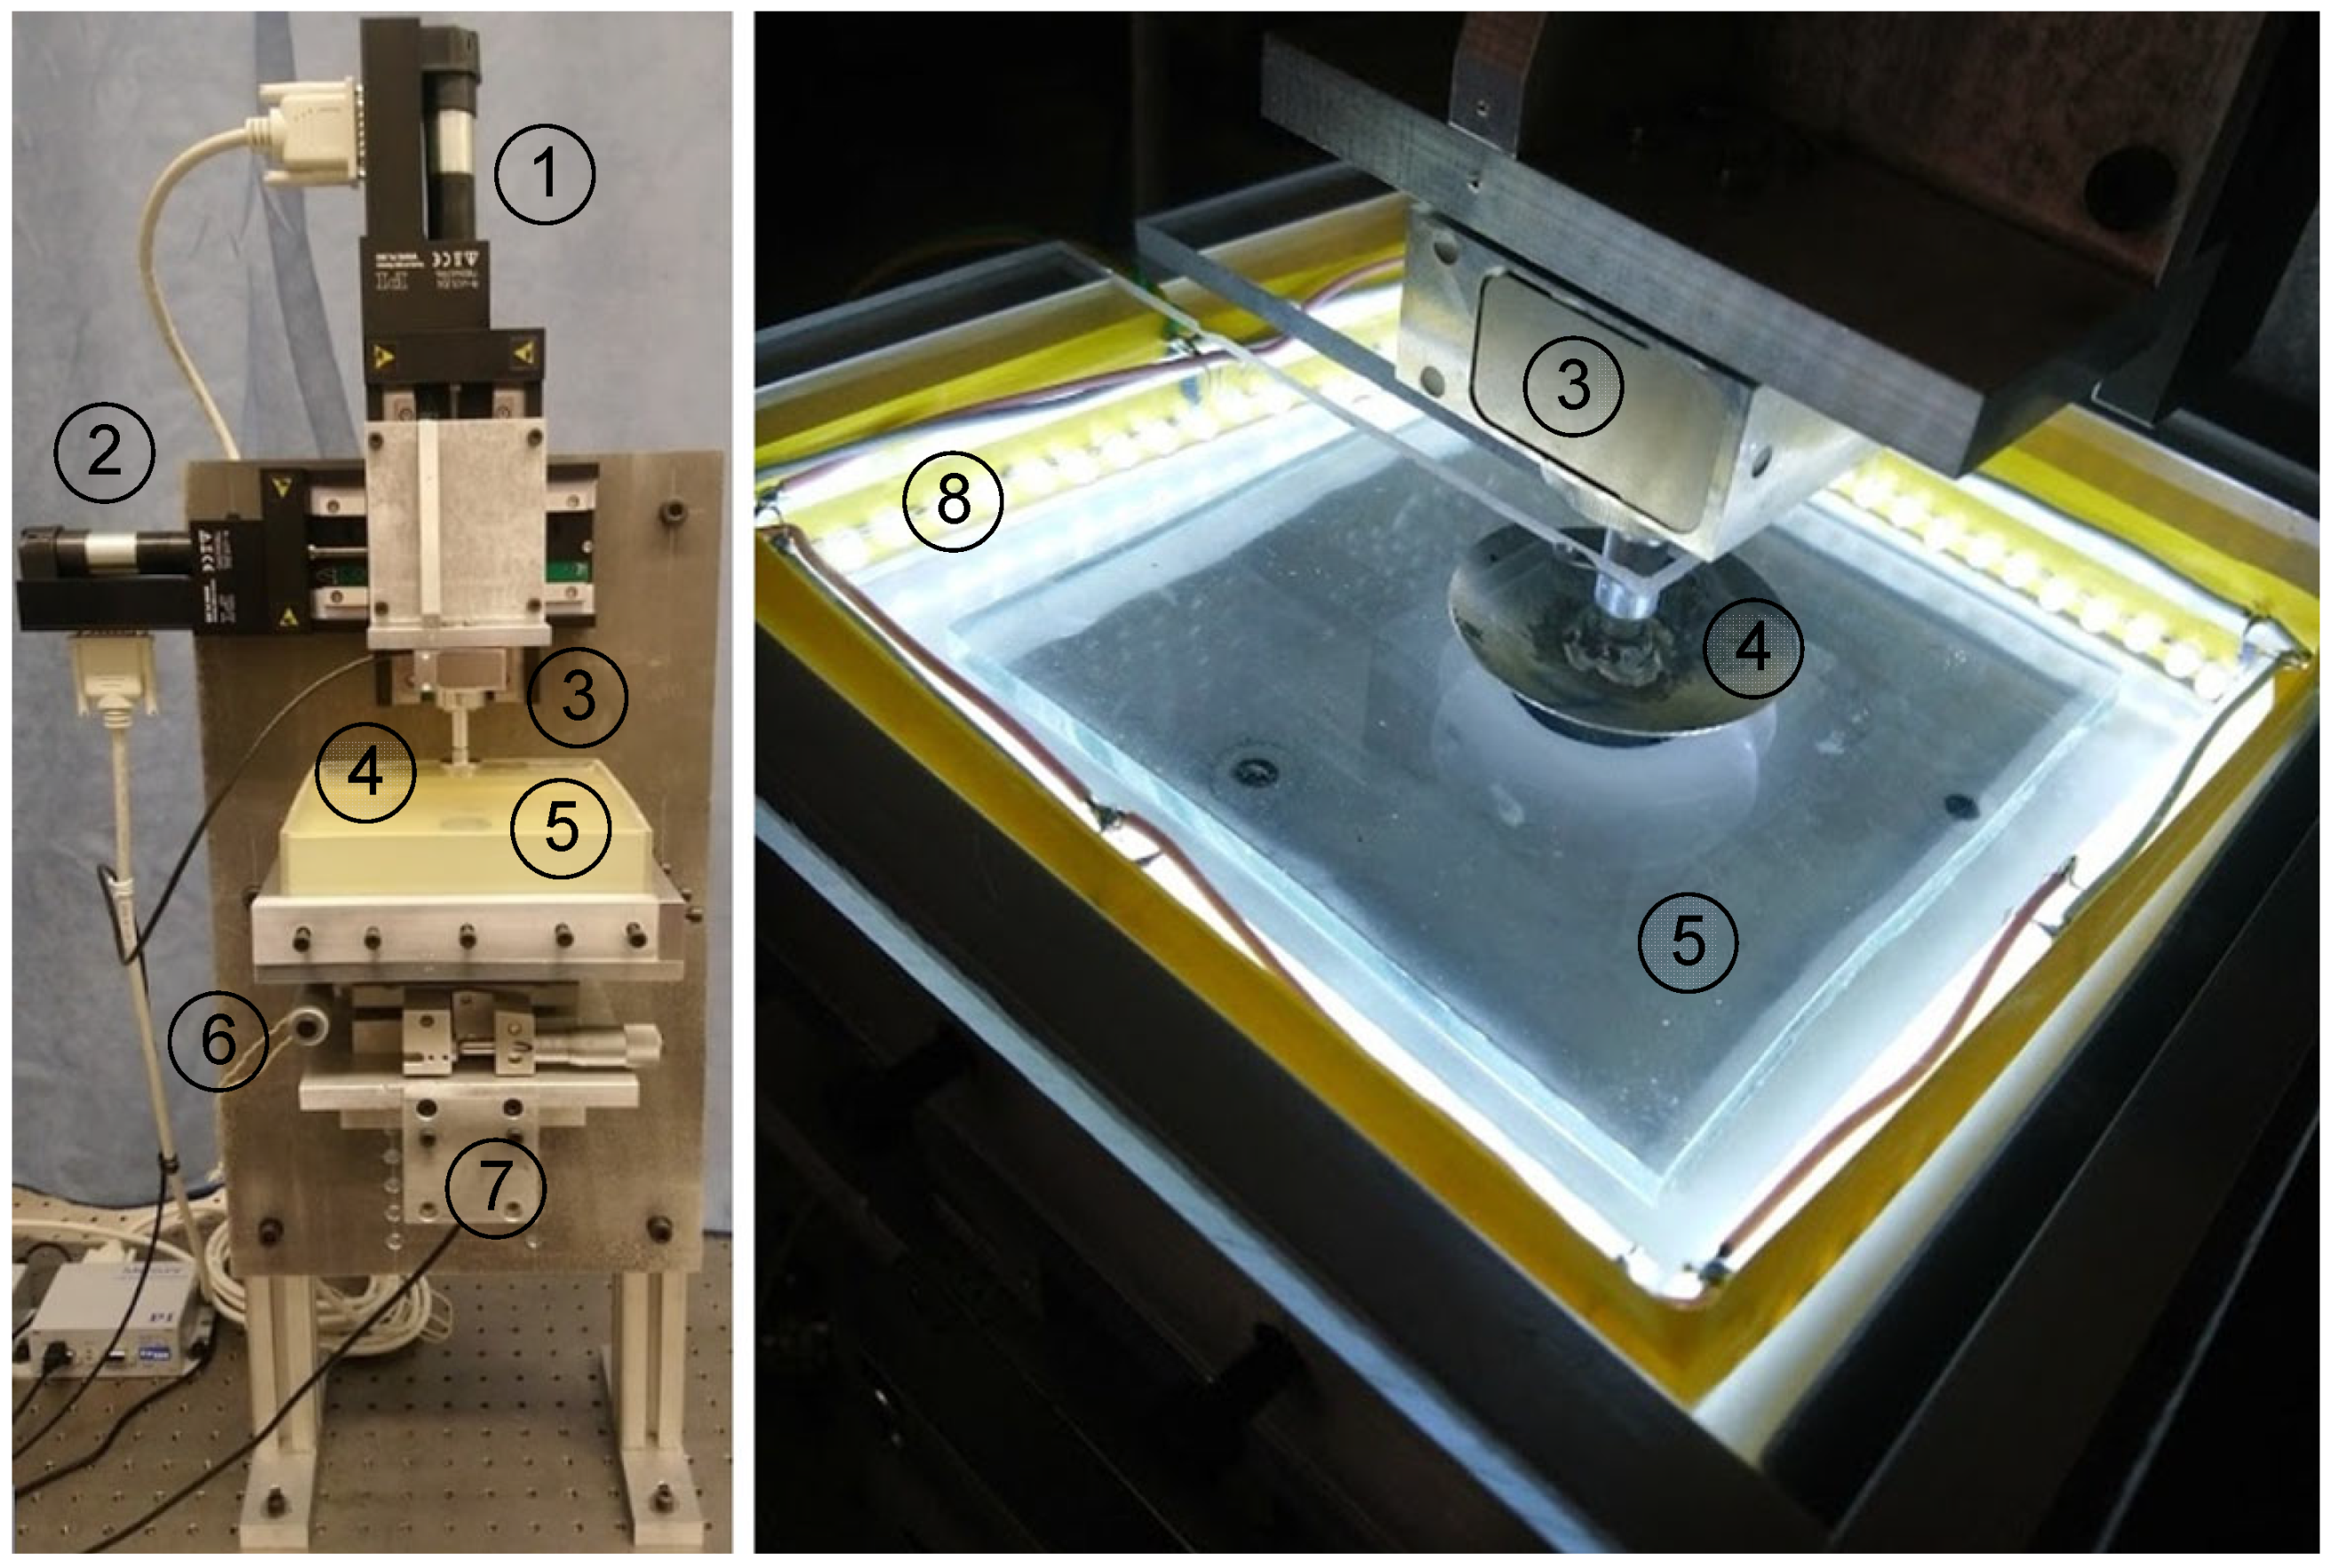
Figure 1 shows the experimental setup used to carry out all experiments described in this manuscript. The left-hand side of the figure shows a general view of the experimental setup, while the right-hand side panel shows an enlarged contact area (for a detailed description of the setup, see [29]). Indentation and tangential loading of the indenter was carried out using PI M-403.2DG drives (1) and (2) connected to each other, controlled by PI C-863 controllers. Contact force measurement was carried out using a three-axis force sensor ME K3D40 (3), which works in the interval of forces ±10 N. The electric signal from the force sensor was amplified by a GSV-1A4 SubD37/2 amplifier. The amplifier was interfaced with the computer via a 16-bit NI USB-6211 ADC. Due to the fact that transparent rubber TARNAC CRG N3005 was used as a substrate (5) in the experiment, direct observation of the contact area was possible, which was carried out using a Conrad USB digital camera with a physical resolution of 1600 × 1200 pixels (located at the position (7)). Number (6) in the left panel of figure shows the tilt mechanism, which allowed us to change substrate orientation; this is important for experiments with a tangential motion of indenter.
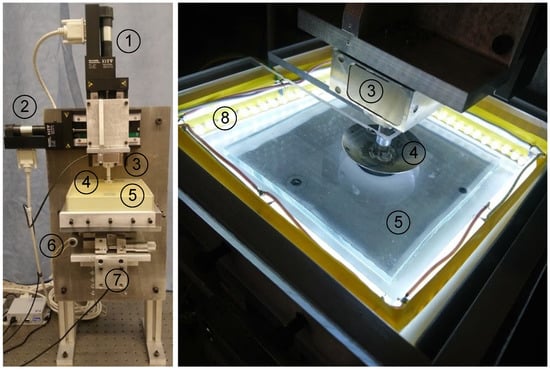
Figure 1.
(left panel) experimental setup; (right panel) close view of the contact area between the steel indenter (4), which is connected with a force sensor (3), and the transparent elastomer sheet (5) with all-round LED illumination (8).
All experiments described below were performed in a similar way. First, an indenter made of steel with a radius R = 22 mm was pressed into the elastomer to a depth dmax in the normal direction. After this, it was shifted in the tangential direction by a distance x = 5 mm. The direction of tangential motion was then changed to the opposite until the indenter returned to the initial position x = 0 mm. Finally, the indenter was pulled out of the elastomer in the normal direction until the contact was completely destroyed. In all phases of the indenter’s motion, displacement-controlled (fixed grips) conditions were applied. The indenter was moved in both (normal and tangential) directions with the same constant velocities v = 1 µm/s with the help of connected motorized linear stages (see left panel of Figure 1). The thickness of the elastomer used was h = 25 mm (5 layers of TARNAC CRG N3005 rubber stacked together, with a thickness of 5 mm each). As has been experimentally found in our previous work [30], this type of rubber has an elastic modulus E ≈ 0.324 MPa and a Poisson ratio ν ≈ 0.48. The indenter was made from steel with a significantly larger elastic modulus E ≈ 2 × 10⁵ MPa. This means that, during interpretation of the experimental results, the indenter can be assumed as an absolutely rigid body, and only the elastomer (rubber layer) deforms during indentation. During the movement of the indenter, the values of all three components of the contact force were stored with an interval of Δt = 1 s, and photographs of the contact area were recorded. It should be noted that the roughness of the indenter’s surface plays a significant role in adhesive contacts; roughness can increase as well as decrease the adhesive properties (strength) of the contact [31]. In the below experiments, an artificial roughness with a small amplitude was specially created on the indenter surface. In this case, due to diffuse scattering of light from the illumination system, the contact area can be visualized as a distinct spot, which makes it possible to determine the size of the contact area using a specially designed computer program [31]. Roughness on the indenter surface was created by hand with the help of sandpaper P800 (averaged grain size about 21.8 μm according to standard classification). In [31], it was found that after scratching of the indenter surface with P800 sandpaper, a roughness with RMS amplitude from 2 to 7 μm is realized, depending on the indenter’s material (before scratching, the indenter was polished and had a surface with reflective properties). In this study, we did not measure parameters of the indenter’s roughness, because investigations of influence of roughness was not the aim of the current work, and in all experiments the same indenter with the same roughness was used.
2.2. Numerical Model
To simulate dynamic behavior of the system under consideration, we considered a numerically generated elastic substrate and a movable hard ball with appropriately defined repulsion and attraction interactions between them. Different ways to construct an elastic substrate are possible. For example, to keep a fixed distance between the particles in the nodes of either a one-dimensional chain, a 2D or 3D mesh of any nature with higher dimensionality 4th order potential with 2 minimums U = (xj − xj±1)2[a − (xj − xj±1)2/2]/2 can be used (see for example the works [32,33,34,35,36,37,38]). An analogous result can be achieved by using a quadratic 2-valley potential U = (xj − xj±1 ± a)2/2, which is treated as a mathematical procedure where every node is attracted according to Hook’s law to a local minimum formed by its neighbors at the distances (xj − xj±1) = ± a [36]. Below, we will use Hook’s law for the nearest and the next neighbors to minimize a number of additional assumptions.
For each node with the indices j, k at mutual displacement of nearest neighbors j ± 1, k, along an arbitrary direction x, can be written as dx1,jk = (xjk − xj±1k − a). For the next neighbors, one can write, respectively: dx2,jk = (xjk − xj±1k±1 − a). These relative displacements produce forces f1,jk = k1dx1,jk and f2,jk = k2dx2,jk, respectively, where k2 = k1/2. Below, we apply the normalized dimensionless variables for the numerical model in which initial (unperturbed) lattice constant a = 1 and elastic constant k1 = 1.
Direct summation over the neighbors gives the complete force:
where, for the cubic lattice, the numbers of the first- and second-type neighbors are N1 = 6, N2 = 12, respectively, and for the square lattice N1 = N2 = 4. The dynamic equations of the system with the forces defined by Equation (1) can be written as follows:
These equations have to be completed by the boundary conditions:
The notation means a component of the force acting on the boundary node, which is formally calculated from a side of the node which is located outside the system, and coincides with the corresponding component of an external force acting on the substrate. For some (open) boundaries these forces are equal to zero. In other cases, these forces are caused either by the interactions of the elastic substrate with the hard adhesive ball, or by an interaction with the solid background, which does not allow the elastic substrate to fall down under the pressure of the ball. Let us note additionally, that the simplicity of Equations (1)–(3) is illusory and they in fact suppose a summation at each time step over all the possible (or even absent) neighbors along each direction of the lattice.
In the general case, mechanical energy is supplied into the elastic system by two different sources. First of all, it is produced due to the mechanical work performed by the ridged sphere interacting with the elastic substrate. Additionally, at nonzero temperature T, the boundaries of the system contact to the thermostats, so the boundary conditions have to be completed by a δ-correlated Langevin source ξ(t, x, z), defined according to the fluctuation-dissipative theorem with zero expected value and autocorrelation function where D = 2kBT and kB is the Boltzmann constant. It leads to the following equations of motion for the elastic subsystem:
Below we will ignore temperature sources of energy ξ → 0. However, taking into account that the kinetic energy (elastic oscillations and waves) is still generated in course of the ball motion, the nonzero dissipative constant γ > 0 is still needed and will be conserved in the equations of motion. In turn, this constant determines a characteristic relaxation time in the system τrelax = 1/γ and can be used as a natural time scale of the model. It is convenient to normalize on it all the time points. Together with two other scales, the lattice constant a = 1 and elastic constant k1 = 1, corresponding to characteristic distance and force, respectively, it defines a set of dimensional units for the problem, which we will use below.
The motion of the ball can be incorporated into the study using the frames of the Prandtl–Tomlinson model [36]. To do this, the original system of the equations of motion must be completed by equations describing the ball’s external force acting on the elastic substrate:
Here, and are the components of external force in horizontal and vertical directions, respectively, with a new elastic coefficient K, and are applied to the ball of mass M. As the external “spring” is rigid and the ball is heavy (K >> 1 and M >> 1), the first of these forces produces a horizontal motion in the ball with a practically constant velocity Vx.
Motion in the vertical direction is also conserved in the equations, because it allows us to smoothly adjust the system numerically to any arbitrary value chosen by us for initial indentation d. For this goal, we move it vertically during the relatively fast (but still continuing nonzero time t0) initial process. So, at every value of d the velocity Vz is defined by the condition Vz = −d/t0. The indentation depth d is measured in the units of a. To obtain a quite realistic configuration of the model setup, we take the radius of the ball Rsphere >> a much larger than a (for definiteness, Rsphere = 80a), while varied typical values of the indentation d will be comparable to a.
The forces in Equation (5) describe total interaction between the ball and segments of the elastic substrate. Each particular interaction here is a combination of the repulsion of an elastic segment from the hard “wall” of the ball’s surface and short-range (adhesive) attraction to the ball in close proximity of its surface. It is convenient to simulate them numerically with the sufficiently sharp, but still continuous potentials. For definiteness, we use strong exponential repulsion:
and short-range attraction in a narrow spherical belt around the surface:
Here, and , while both characteristic distances are much smaller than the radius Rsphere of the spherical ball Rrepuls << Rsphere, Radh << Rsphere. To simulate the effect of adhesion realistically, one has to complete the equations of motion with a condition which specifies when a segment of the substrate follows the ball, being practically glued to it by the adhesion force. Such a condition is supposed to satisfy at least two important features of the adhesion:
It has to attach a given segment of the substrate to the spherical surface |R(x,y,z) − Rsphere| < δRcrit when the distance between them is small enough;
It has to detach the segment from the ball when its deviation from an unperturbed state exceeds a threshold , corresponding to some critical force at a given elastic constant.
Analytically it can be written as a product of two formal conditions:
where θ is the Heaviside step-function, defined by the relations:
Of course, the formally written conditions (8) and (9) only appear to be extremely simple ones. In the real numerical procedure, they have to be checked each time-moment for every force and distance, instantly joining each segment of the substrate with its projection to the ball surface. Moreover, it should be treated in the frames of the numerical procedure, which either solves a set of dynamic equations for the particular segment (if threshold conditions are not satisfied), or shifts it together with the ball, moving according to its own Equation (5).
3. Results and Discussion
3.1. Experimental Results
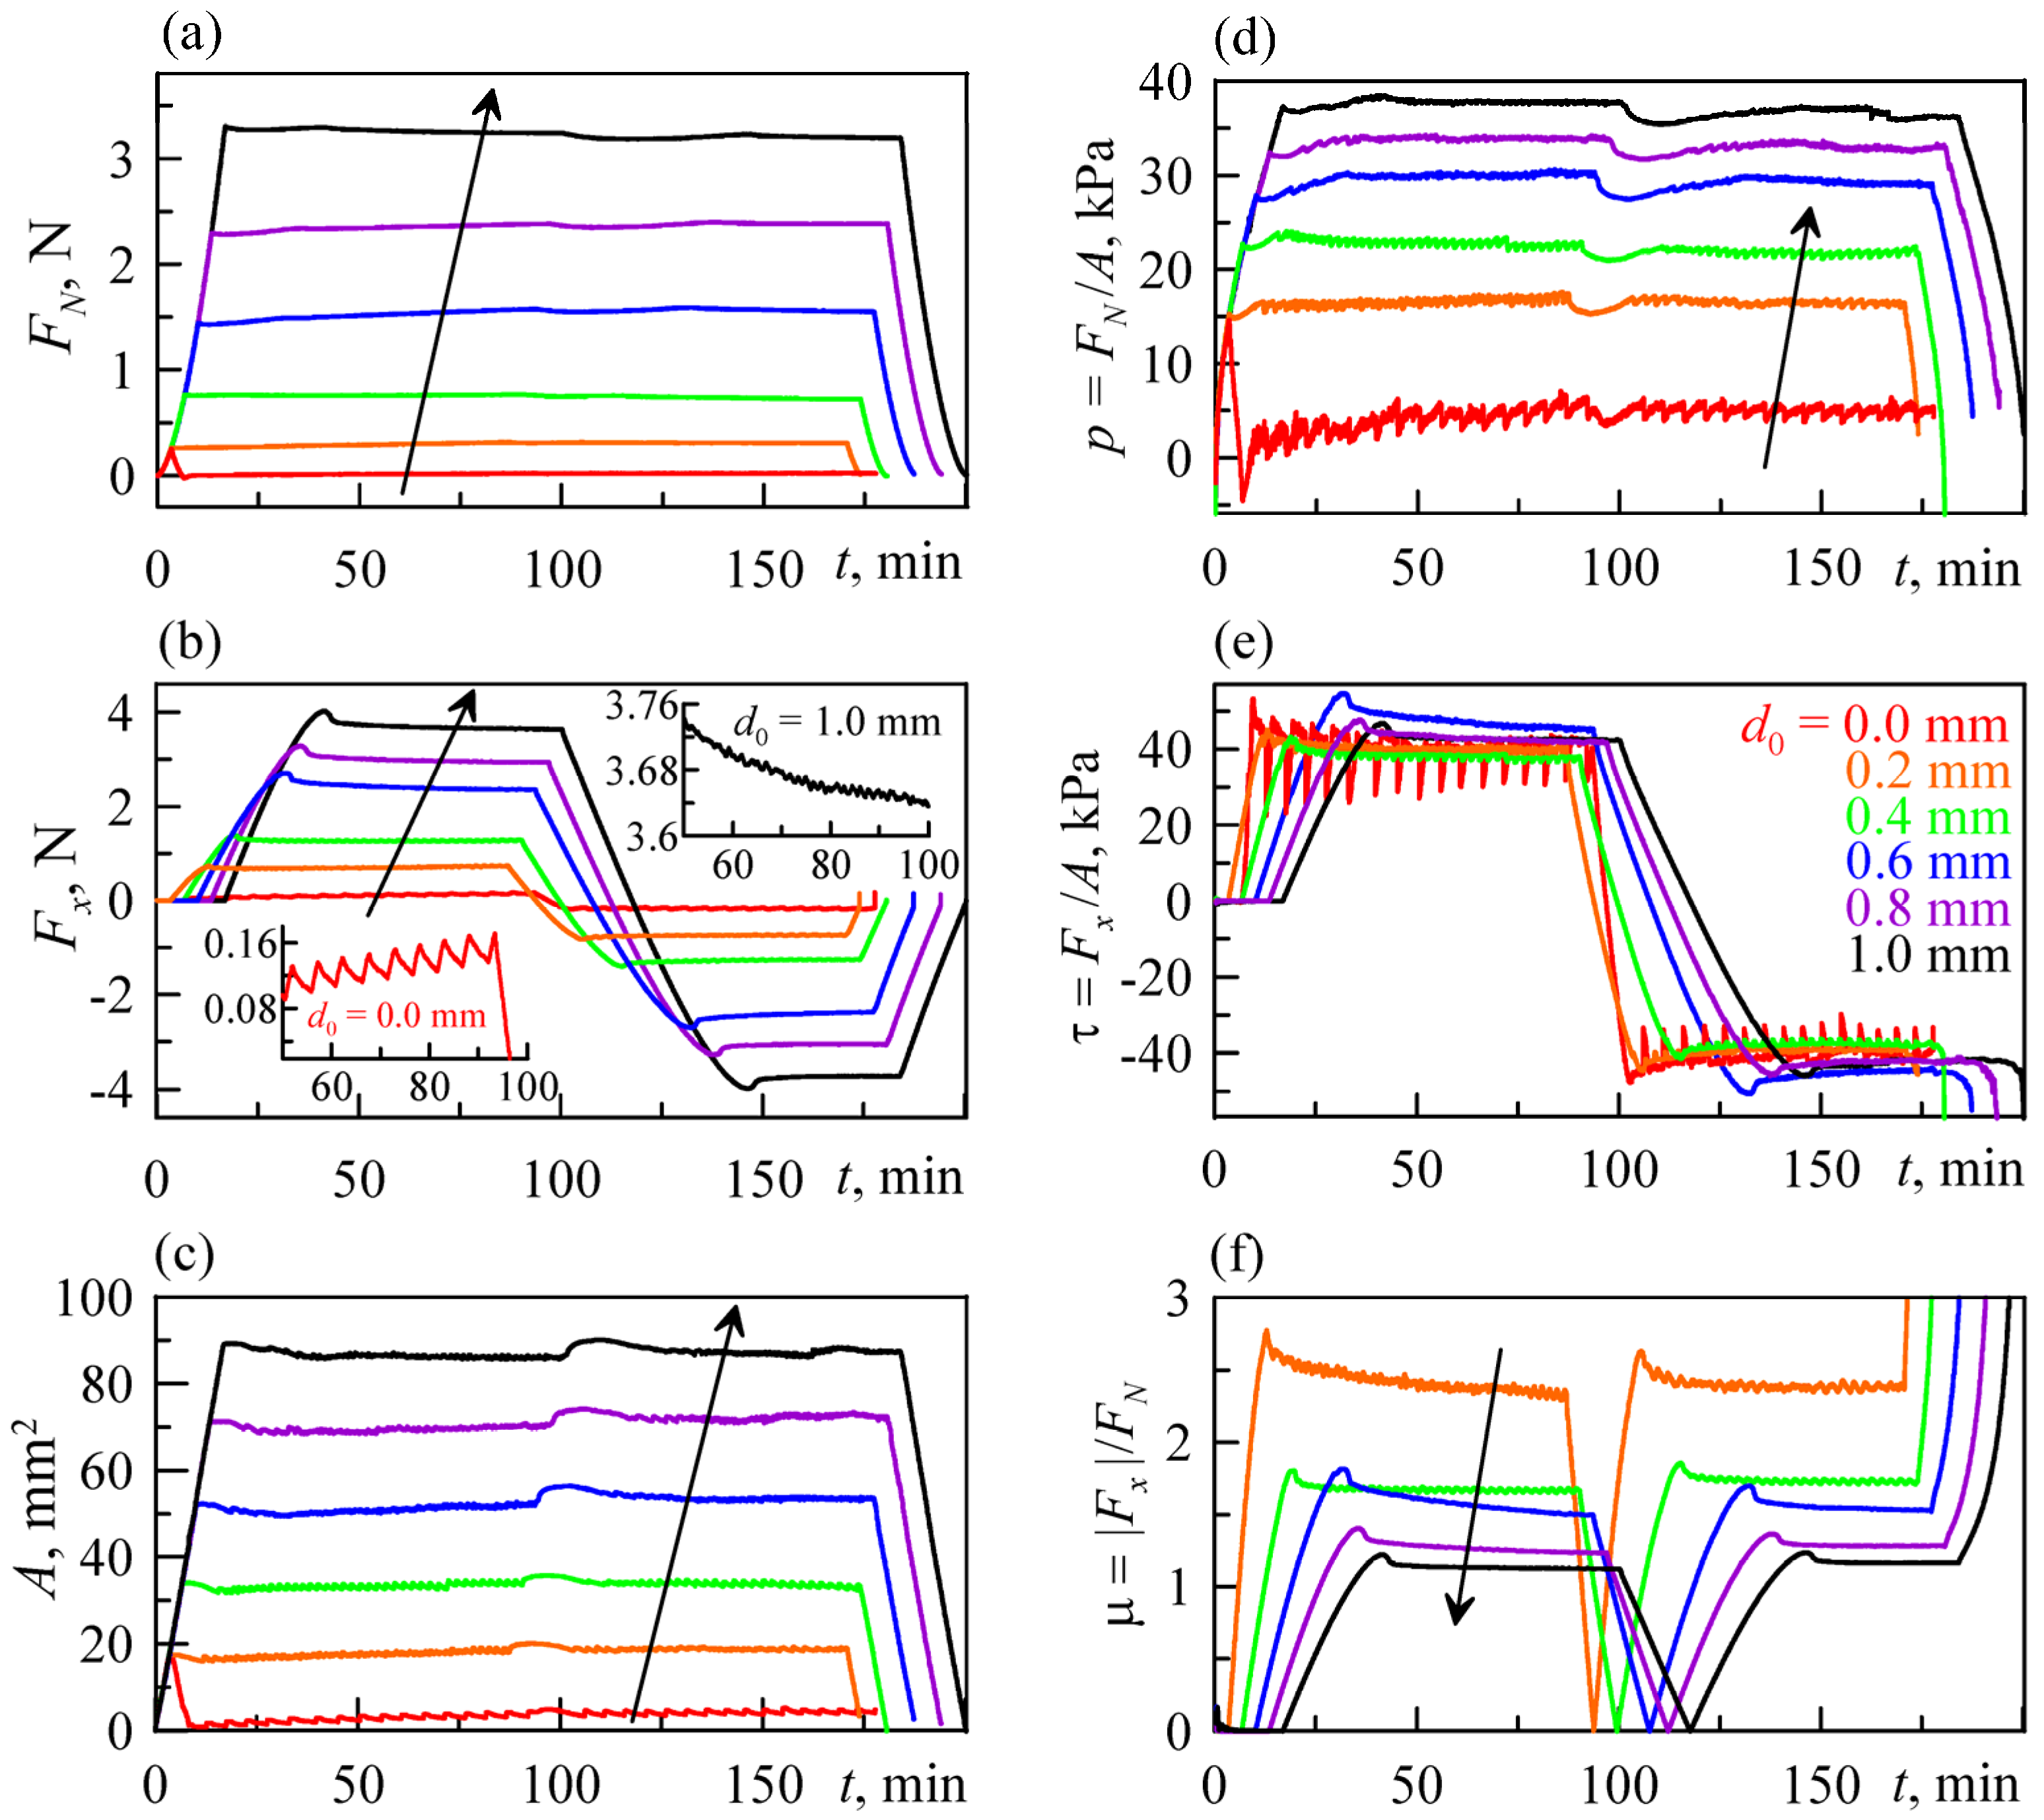
In Figure 2, the measured time dependences of the normal FN and tangential Fx contact force components, as well as the contact area A (panels (a)–(c)) are shown. For more detailed analysis of the friction processes, we calculated the time dependences of such characteristics as the average contact pressure p = FN /A, average shear stress τ = Fx/A and formally defined “friction coefficient” μ = |Fx|/FN (even in cases when tangential force is not proportional to the normal force, and the friction coefficient has no direct physical sense). These quantities are shown as functions of time in panels (d)–(f) of Figure 2.
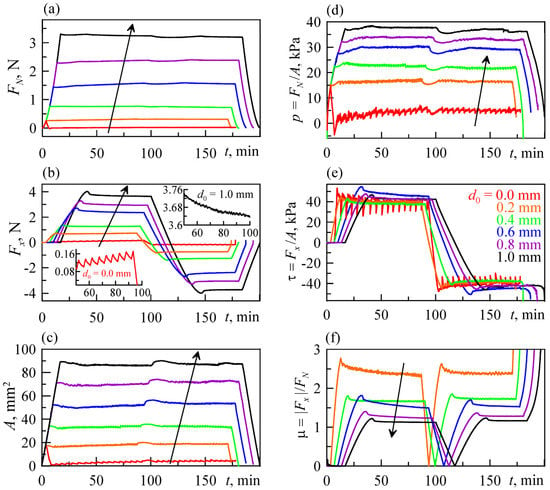
Figure 2.
Dependences of the normal force FN (a), tangential force Fx (b), observed contact area A (c), average contact pressure p (d), nominal tangential stresses τ (e) and formally defined friction coefficient μ (f). The insets to panel (b) show enlarged parts of the dependences for the minimum and maximum values of the indentation depth d0. Each panel of the figure shows 6 dependences, which correspond to the indentation depths d0 = 0.0, 0.2, 0.4, 0.6, 0.8, and 1 mm (except for the panel (f), where there is no dependence for d0 = 0 mm); the direction of increasing depth d0 is shown in the panels by arrows (except for the panel (e)) (see also Videos S1–S6).
Note that in the case d0 = 0 mm, the experiment was performed as follows: the indenter was pressed in the elastomer to a depth of d = 0.2 mm, after which it was raised to the level d0 = 0 mm, and only then a tangential shift was performed. This was done to ensure good contact due to adhesion before the tangential shift. This was necessary due to the fact that at the stage of indentation (an increase in the contact area), the adhesive interaction manifests itself rather weakly, while in the phase of detachment, adhesion plays a decisive role. These features are well observed in experiments on normal indentation [18,39].
In each test at initial indentation to the depth d0, there is no tangential motion. At this stage, tangential force Fx and stresses τ are equal to zero, but normal force FN increases monotonically. As seen from the subplot Figure 2e, at the beginning of the tangential shear, the value of tangential stresses τ = Fx/A increases over the entire contact area. However, when the value of τ reaches a certain critical value τ0, the stationary sliding mode is realized and the stresses remain constant τ = τ0. Moreover, the value of τ0 is practically not affected by the value of the indentation depth d, with an increase in which, however, the friction force Fx increases significantly (see Figure 2b). In the case of constant τ0 in the contact zone, the friction force is determined as (ignoring friction at the contact boundary [18]):
Note that, in each experiment, at around 100 min tangential force and stresses are reduced to zero values, after which these quantities increase again, but with a negative sign. This happens due to the change in direction of the indenter motion.
After the change in the indenter’s direction of motion, the system needs some time to establish stationary motion mode again, in which Fx and τ are (approximately) constants. It can be observed in Figure 2 that, for motion of the indenter in the opposite direction, the same stationary mode is realized, which indicates good repeatability of experiments. In the case under consideration, the friction coefficient μ = |Fx|/FN, determined in a standard way, loses its original meaning, since it becomes dependent on the indentation depth d0 (see Figure 2f). Such a sliding regime with constant stresses is well known and typical for soft adhesive materials [18,40,41,42]. Under the assumptions of the half-space approximation and Hertz contact (in normal direction), the friction coefficient μ = Fx/FN at constant tangential stresses τ0 during tangential shear in the case of positive values of indentation depth d0 can be estimated as [40]
The approximation (11) is only valid in the cases in which the adhesive component of normal force is much smaller than the reaction force of the elastomer, i.e., if the total normal force FN > 0 N. From (11) it follows that at small indentation depth d0 we have a very large “friction coefficient”, up to infinite values at d0 ≈ 0 mm. This appears contradictory, but it is a usual situation, because in the presence of adhesion there is always tangential force during the shear, even at zero normal force. Such a friction mode in adhesive contacts was experimentally observed more than 70 years ago [43]. Note that the formally defined friction coefficient μ = Fx/FN can have negative values in adhesive contacts due to negative normal adhesive force at small indentation depths [44].
Let us discuss separately the case with the indentation depth d0 = 0 mm. In this case, the contact exists only due to adhesion, and a stationary stick-slip motion mode is realized (see Figure 2b). The mechanism of such a regime is as follows: the contact area A monotonically decreases during shearing to a certain critical value due to the destruction of the contact at its leading edge. In this case, the tangential force Fx also decreases according to the prediction of Equation (10). With a further shift, a critical moment comes when the contact area increases sharply due to the abrupt entry into contact with the elastomer at the leading edge. These newly contacted areas do not contribute to the friction force immediately after the onset of contact, since there are no tangential stresses in them. However, with further movement, the “fresh” contact areas are loaded and cause an increase in the friction force. As soon as the tangential stresses in the “fresh areas” of the contact exceed the critical value, the decrease in the contact area at the leading edge begins again, and the process repeats itself. In this stick-slip mode, only contact area A varies abruptly (see the lower curve in Figure 2c), while the friction force Fx varies monotonically.
The behavior described above for the case d0 = 0 mm is also observed at a certain range of small indentation depths d0 > 0 mm and can be traced in detail using the video file attached to this manuscript (Video S1). If the indentation depth is sufficiently large, the pronounced stick-slip mode disappears. Instead, stationary slip is established with a friction force fluctuating around some constant value given by Equation (10). However, the above-described features of the rearrangement of the contact area during shear are preserved at any value of indentation depth d. In the case of large indentation depths, the contact areas in which the elastomer detaches from the plate and comes into contact again are more pronounced at the front and back contact boundaries (most often at the front). In this case, the oscillations of the contact area become small compared to its mean value (see the corresponding dependences A(t) in Figure 2c). Such small variations in the contact size A cannot significantly change the friction force Fx given by Equation (10), therefore, after establishment of the stationary regime, it remains close to a constant (Figure 2b). For all experiments shown in Figure 2, Supplementary Videos are attached which allow detailed tracing of the evolution of contact forces, as well as contact configurations (Videos S1–S6).
Let us mention a few points common to all experiments. All dependences Fx(t) for d0 > 0 mm have a pronounced peak at the beginning of the tangential motion, after which Fx reaches a stationary value. We can call such a peak on Fx(t) the “stiction spike”; this is a well-known phenomenon, in which the height of the peak increases with increasing rest time of the system before the start of tangential motion [45,46], and it may be related to the aging of the contact [47]. The dependences of the contact area A(t) in Figure 2c also show a number of common patterns. In the indentation phase, the area increases linearly up to a certain value. This behavior has a simple explanation; the half-space approximation A = πa2 ≈ πRd. Since the indentation is performed with a constant speed v, the area A increases linearly with the indentation depth d during the indentation stage. It is seen in Figure 2c, where all the curves confirm that, at the beginning, the tangential motion leads to the gradual decrease in the area A. It is confirmed also by other experimental works [14,15]. However, a stationary sliding mode is then established, in which the contact boundary is constantly rebuilt. It is clearly seen in the videos attached to the article (Videos S1–S6). However, immediately after the reversion of the sliding direction (approximately at the time t = 100 min), the contact area increases for some time. It increases to a certain maximum value Amax, which is slightly larger even than the area corresponding to the beginning of the tangential shift of the indenter (except for the curve at d0 = 0 mm).
The increase in the area A with a change in the direction of movement may be associated with the presence of a secondary adhesive hysteresis, which can be easily explained in cases of normal indentation. Namely, during normal indentation, the contact propagates almost without adhesion, but upon subsequent detachment, the adhesion resists to the point of destruction of the contact. With tangential motion, a similar situation occurs. New areas of rubber on the leading edge come into contact almost without adhesion, and zero tangential stresses are initially realized in these areas. At the same time, for separating rubber from the indenter at the trailing edge, the stresses τ must exceed the critical value τ0. When the direction of motion changes, the tangential stresses first decrease to zero, then change their sign until they exceed the critical τ0. The contact is maintained now on the trailing edge. Let us remember that before the change in motion direction it was at the front. While the indenter is moving, the new regions come into contact at the leading edge. This leads to the observed increase in the contact area each time the direction of indenter motion is changed. In general, the motion of the indenter in both directions demonstrates the same contact properties, and some peculiarities exist only at changes of the sliding direction where the transient mode appears.
From the above explanations, one can conclude that an increase in the contact area A during tangential movement is possible, but this requires a specific loading history: the indenter must move in different directions in the horizontal plane, but always move from a certain coordinate by no further than a limited distance Δx. In this case, the contact area should first increase with increasing Δx, and then decrease if Δx becomes higher than the critical value. It is known that, with an increase in the area, the adhesive strength of the contact also increases. One can conclude that the adhesive strength of the contact can be increased due to the action of vibrations with a small amplitude on the contact. However, this assumption has to be checked experimentally. We plan to perform this experiment in our future studies.
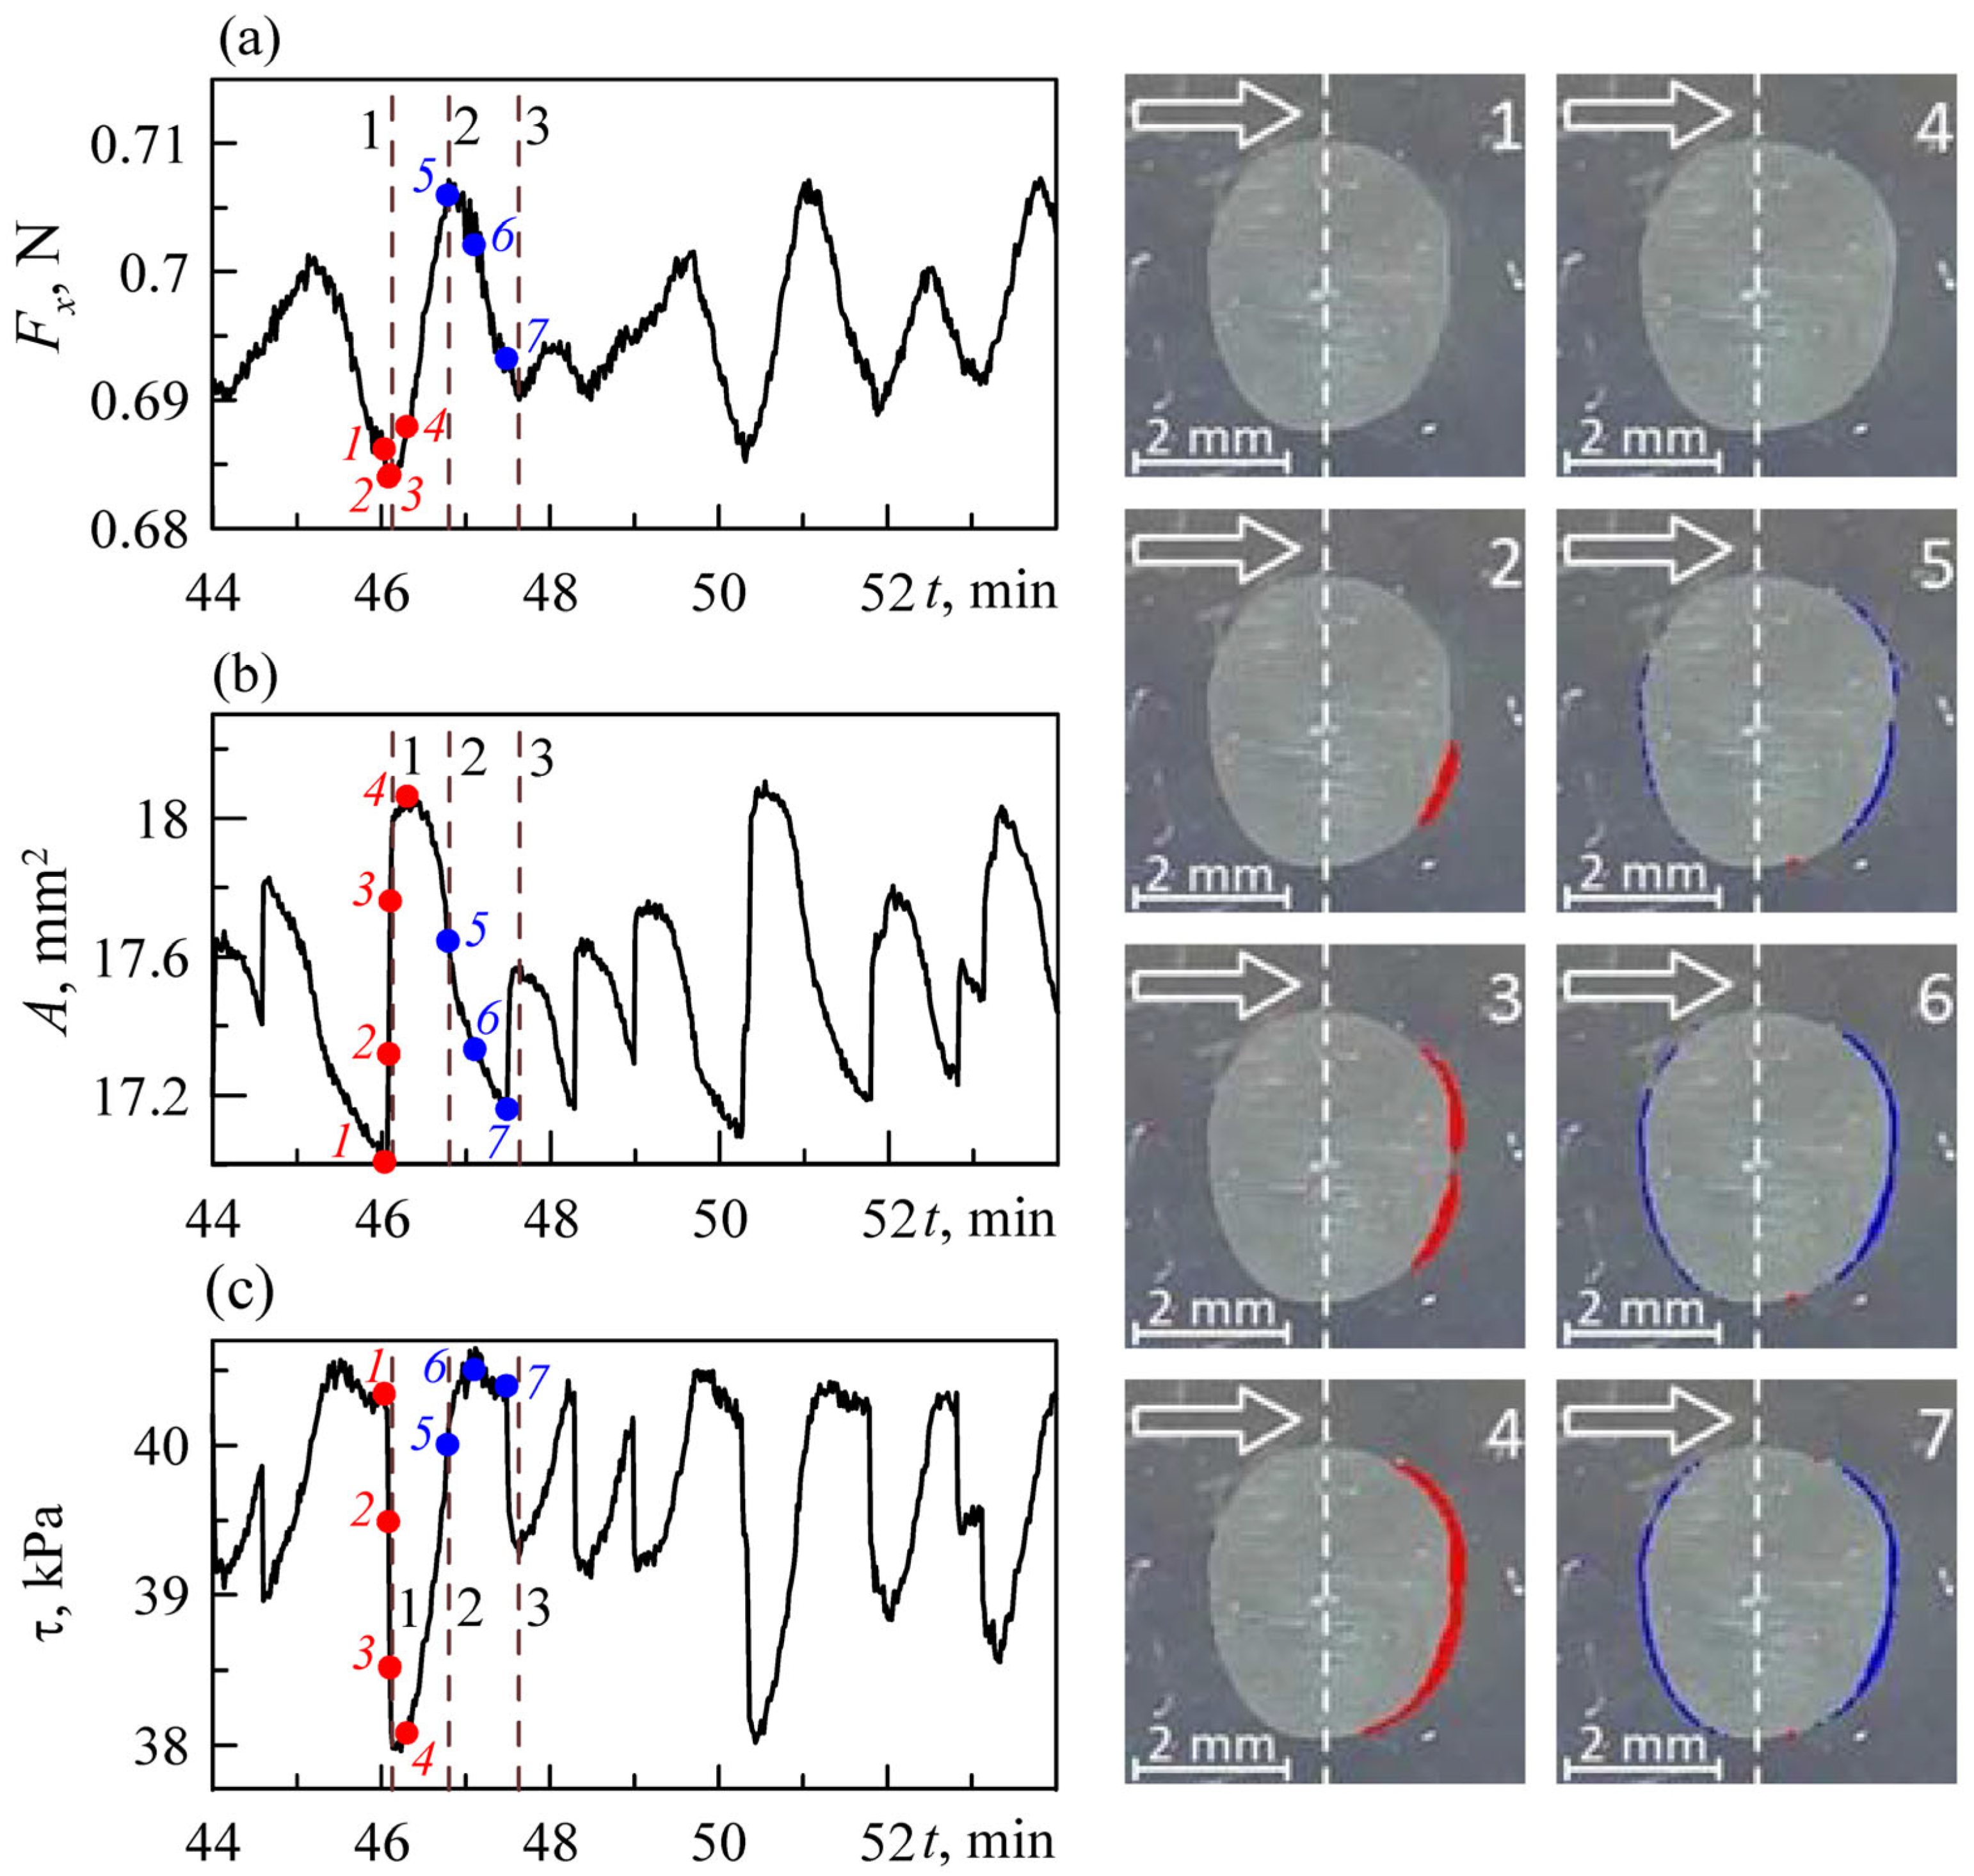
Figure 3 shows enlarged parts of the dependences of tangential force Fx, contact area A and calculated average tangential stresses τ = Fx/A as functions of time t from Figure 2 for the indentation depth d = 0.2 mm. On all dependencies, Figure 3 contains three vertical dashed lines (1, 2, 3) separating the contact propagation phases that we have identified.
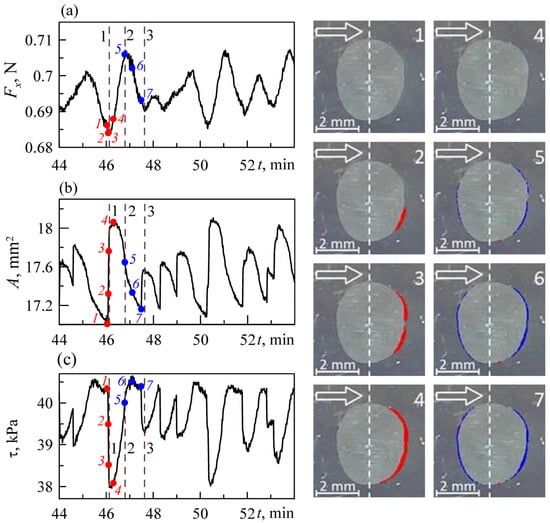
Figure 3.
(Left panel) Enlarged parts of dependences of tangential force Fx (a), contact area A (b) and tangential stresses τ (c) on time t, corresponding to the indentation depth d = 0.2 mm (coincides with the dependences shown in Figure 2, see also Video S2); (right panel)—photographs of the contact area corresponding to points 1–7 on the dependencies in the left panel of the figure. In photos 2–4, the areas of contact change are shown in color compared to photo 1; in photographs 5–7, the areas of contact change are shown in color compared to photograph 4. The areas that come into contact are shown in red, and those leaving the contact are shown in blue. Photo 4 is shown twice: at the bottom of the panel with an illustration of changing contact area, and at the top of the panel without it.
In the vicinity of the dashed line 1, the tangential force Fx is at minimum and the contact propagates with increasing area (points 1–4). For comparison, the left column of right-hand panel of the figure shows screenshots of the contact area where color marks the areas coming into contact. Such marks are absent in the initial picture 1, with which the comparison is made. All the experiments show that the contact propagation happens abruptly after addition of the relatively large sections at the leading edge. As a rule, the friction force Fx at the moment of the next contact jump obtains a local minimum determined by the relation Fx ≈ τ0A (10), because the area before every new propagation of the contact is minimal. Furthermore, after the attachment of new sections of contact, the friction force Fx starts to increase monotonically. This takes place in the range between vertical lines 1 and 2. This is because, immediately after attachment, new sections on the leading edge do not contribute to the friction force, since tangential stresses are absent. However, during the motion, new sections become loaded with tangential stresses, so the friction force increases.
The partial destruction occurs simultaneously with the contact loading. This happens at stages 4–7, which are reproduced in the pictures with corresponding numbers in the right-hand side panel of the figure. The contact area A starts to decrease almost immediately after the moment when its size reaches the maximum value (stage 4), and continues decreasing up to the moment when the friction force reaches its maximum (point 5). After that, Fx begins to decrease (the area between straight lines 2 and 3) due to a decrease in the contact area. The tangential stress jumps shown in Figure 3c are a kind of non-physical artifact, because Figure 3c shows the average value of stresses τ = Fx/A. The formally calculated value τ always sharply decreases when new contact areas attach due to an increase in the area A. There are no tangential stresses in the “new” areas immediately generated after instant contact propagation. To determine the exact behavior of τ, one has to determine its distribution over the contact zone, which is difficult to implement experimentally. Therefore, for a better understanding of the processes of contact propagation, it is necessary to apply either analytical theoretical models or computer simulation, which is presented in the next section of this paper.
From the above description, the following conclusion can be drawn. The friction force is more or less determined by the relation Fx = τA, and the stresses τ are constant values in the stationary sliding mode. However, this is not valid for the relation between the dependences Fx(t) and A(t) in the sense that, in the sliding mode, the friction force is in fact not strictly proportional to the area. In particular, the maxima and minima of Fx(t) and A(t) in Figure 3 do not coincide. For example, point 5 corresponds to the maximum friction force Fx, but the contact area A continues to decrease at this point. The reason for such behavior lies in the inhomogeneous distribution of tangential stresses τ over the contact area. During the shear at the leading edge, new elastomer sections constantly come into contact and the contact area A increases. Sharp changes in the area do not affect the friction force Fx, because τ = 0 in the “fresh” contact areas. Further shift causes a monotonous increase in the stresses τ in such “fresh” sections, and new sections may come into contact, etc.
All this leads to a non-uniform distribution of stresses over the contact plane τ(x, y) and a different contribution of contact areas to the friction force Fx(x, y) = τ(x, y)ΔA. As the indentation depth d increases, the effect of the inhomogeneous distribution Fx(x, y) decreases as well. This happens since the “new” contact areas become negligible compared to the total contact size. In this case, the measured friction force Fx(t) in the stationary sliding mode becomes close to a certain constant value. However, if d is small enough, then the boundary areas of the contact become decisive, and the friction force Fx(t) takes a sawtooth form corresponding to a classic stick-slip mode (see inset to Figure 2b at d = 0.0 mm and Video S1). However, in contrast to the classical stick-slip mode, the friction force Fx(t) does not experience abrupt changes, since there is no fast slip of the indenter, because in our experiment it always moves at a constant velocity v = 1 μm/s. The attachment of new contact areas does not lead to a change in the friction force, but means that the process of reducing the friction force Fx due to a decrease in the contact area A is replaced by a stage of Fx increase due to the loading of the newly contacted areas (see Video S1). Such a behavior has already been discussed by us earlier [18].
The above analysis is based on the concept of a quasi-static contact, i.e., the contact propagation process is considered rather slow. Partially, such conditions are created due to the very low shear rate v of the indenter (in our experiments, this v = 1 μm/s). However, despite the low shear rate, fast processes still occur in the contact zone, which cannot be described in terms of a quasi-static contact. The mentioned processes are associated with the restructuring of the contact, namely, with the attachment of new areas, the separation of rubber from the indenter at the trailing edge, and local slippage in the contact areas in which the tangential stress τ(x, y) exceeds the critical value. Together, all these processes combine to propagate elastic waves in the contact zone, which can be observed with the naked eye. The propagation of elastic waves in the contact zone of a soft elastomer (rubber) and a rigid indenter during tangential motion was observed experimentally more than 50 years ago, and such waves were called Shallamach waves [26]. However, despite the sufficient number of both experimental and theoretical works devoted to study of elastic wave propagation (see, for example, [48,49,50,51]), there is still no complete understanding of this process. This is primarily due to the complexity of the process, which consists of a series of local slips.
In the Videos S1–S6, it is difficult to see the propagation of waves in the contact zone, since a very low indenter velocity was chosen, and the specific work of adhesion was relatively small. However, the waves are well visualized in Video S3 from the Supplementary Materials of our recent work [29]. The only difference between the experimental conditions described in [29] and the present study is that in [29] the surface of the indenter before the experiment was briefly treated with an aqueous solution of ferric chloride FeCl3. In this case, a thin layer was formed on the surface of the indenter, which provides a significant increase in the specific work of adhesion (of more than 10 times). Therefore, in the case of tangential shear, to ensure the conditions for the onset of slippage, it is necessary to achieve higher values of shear stresses and associated strains. Therefore, in the sliding mode, complex dynamic processes of the propagation of elastic waves are clearly observed.
3.2. Numerical Results
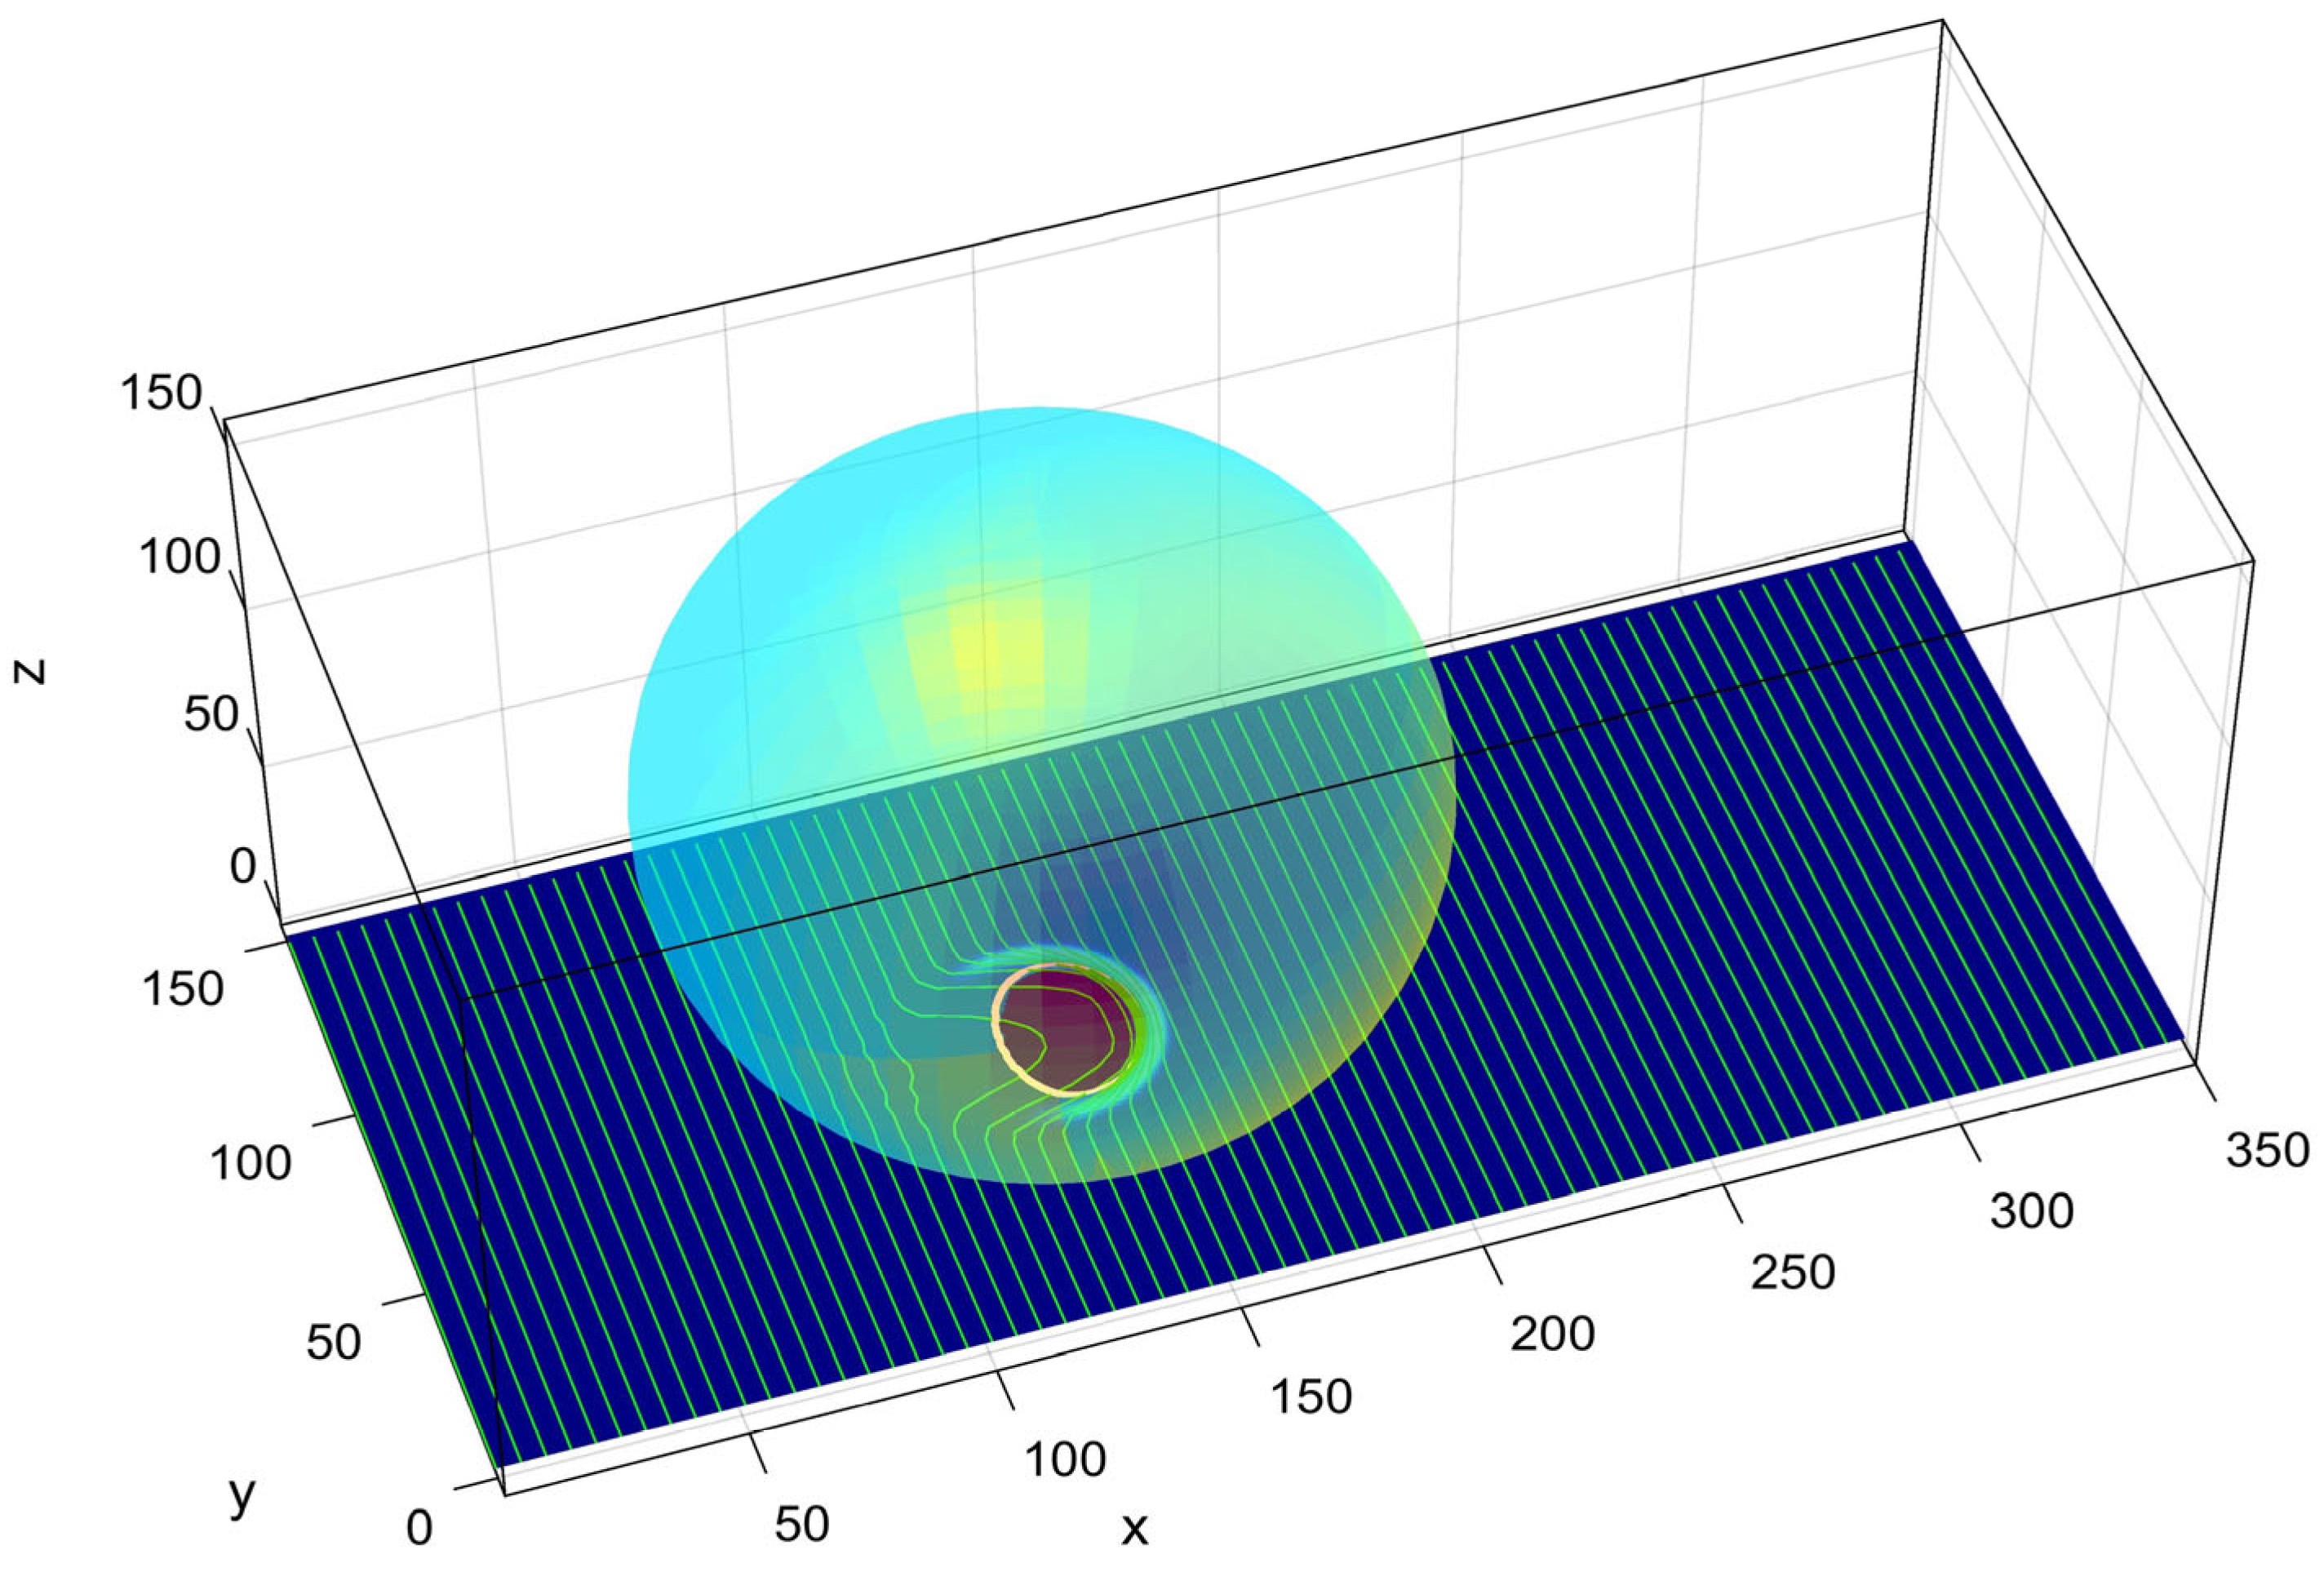
A conceptual image of the numerical model is reproduced in Figure 4. The ball is represented here by a transparent sphere properly positioned on the substrate. The image gives a general impression of the mutual relations between the radius of the ball, indentation depth and contact region used in setup of the numerical model. The deformations of the surface are visualized by the transformable horizontal grid lines plotted over the surface. Bright contours outline a region of sufficiently small distance between the ball and substrate with strong adhesion. This area, which is seen through the transparent sphere inside the contour, is depicted by a dark grey-blue color.
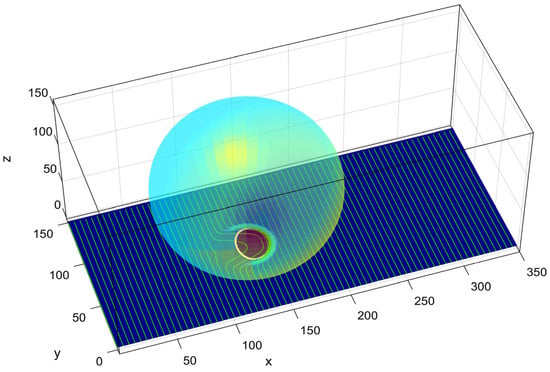
Figure 4.
Conceptual image of the numerical model. The rigid ball is shown by a transparent sphere contacting the substrate. The deformations of the surface are visualized by the transformable horizontal grid lines plotted over the surface. Bright contours outline a region of sufficiently small distance between the ball and substrate with almost perfect adhesion. The corresponding area inside the contour has a dark grey-blue color.
The same configuration for a longer substrate is reproduced in the dynamics in the Supplementary Video S7. This video demonstrates all the effects mentioned in the main text. In particular, quasi-periodic deformations of the surface are clearly seen with the help of the transformable horizontal grid plotted over the surface. To mark a region of sufficiently small distance between the ball and substrate (colored by dark grey-blue) we use a bright contour curve which outlines with almost perfect adhesion. One can notice how this contour varies at the periods when the surface strongly deforms, following the ball due to adhesion and slowly returning back to an almost unperturbed surface between them.
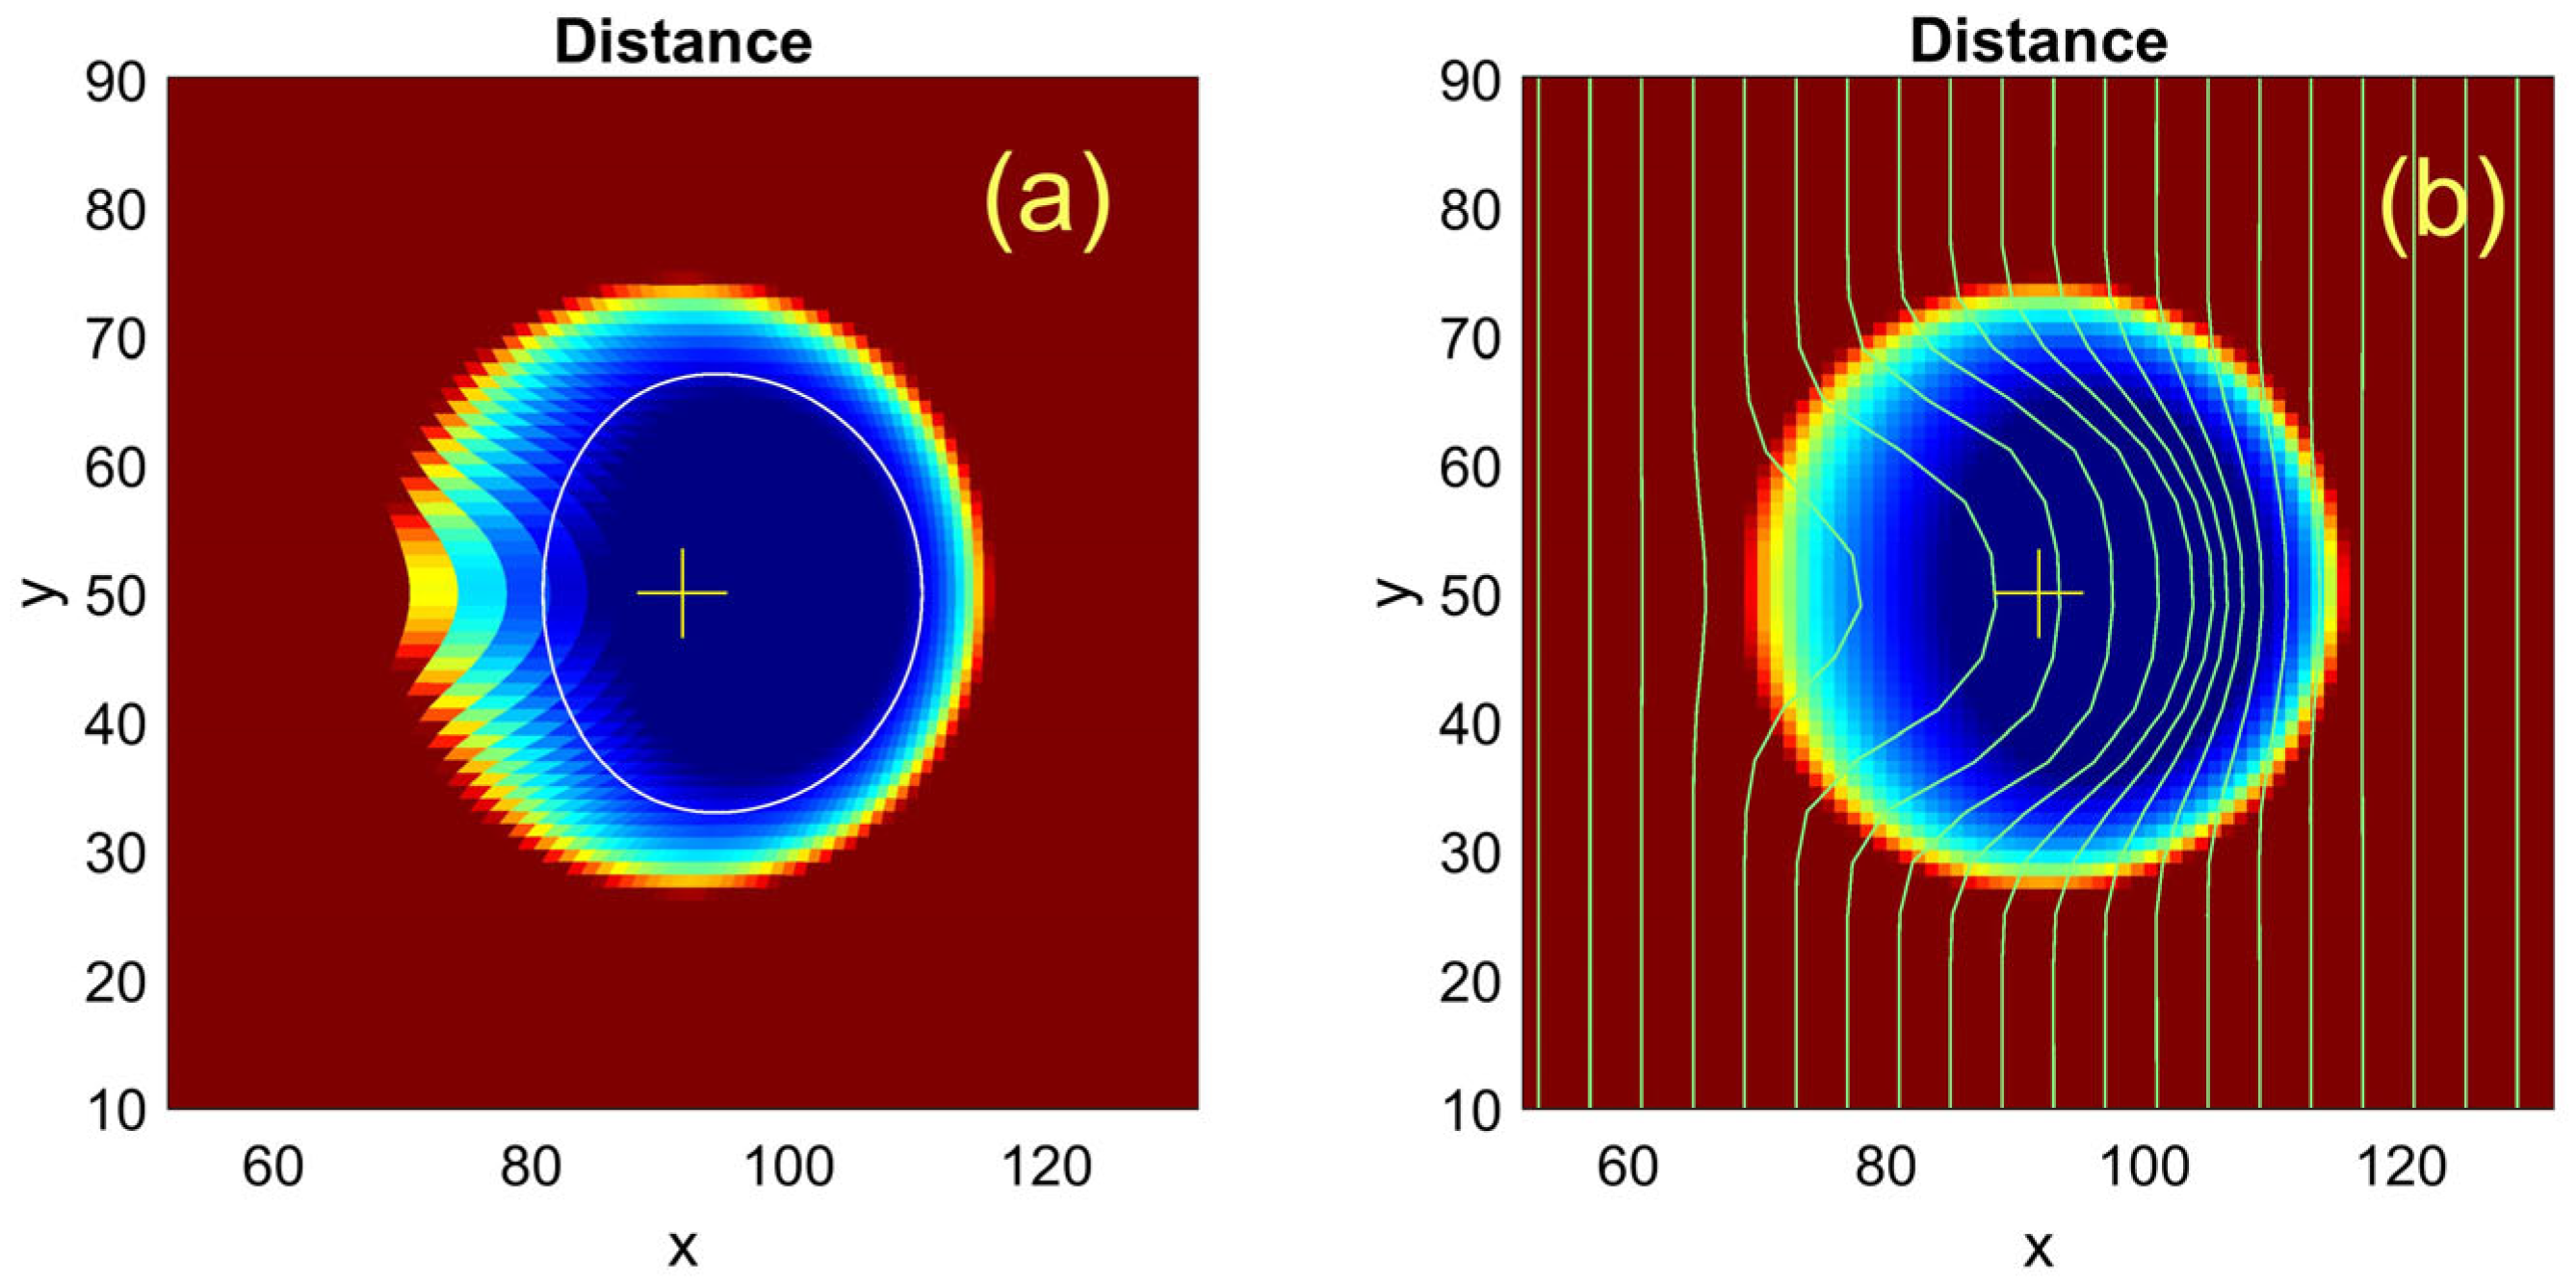
A small square following the contact region is magnified in Figure 5. This figure reproduces the typical instant distribution of the distance between the surface and ball using a standard MatLab “jet” colormap with red and blue colors corresponding to large and small local values of the spatially distributed variables, respectively. The subplot (a) here shows the instant distribution of the distance, found using a fast-scattered procedure. The second subplot (b) reproduces the same map interpolated into the regular equidistant grid, corresponding to the expected (physically measurable) distance. The curves plotted over the colormap in the second subplot illustrate the mutual relation between the elastic deformations of the surface and the distributions visualized in the numerically fast procedure.
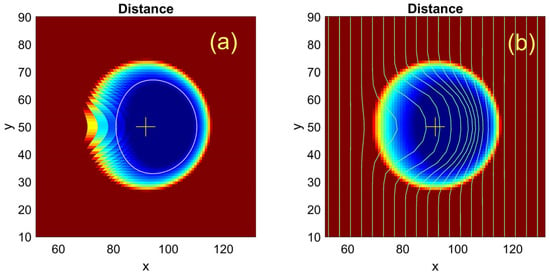
Figure 5.
Typical instant distribution of the distance between the surface and ball shown through fast (scattered) map and the same distance interpolated into the regular equidistant grid (subplots (a) and (b), respectively). The standard “jet” colormap from MatLab is used, where the largest and smallest values correspond to deep red and blue colors, respectively, and all intermediate ones are distributed around the yellow-green part of the spectrum. The curves plotted over the colormap in the second subplot demonstrate a correlation between physical deformations of the surface and distance distribution visualized using a fast numerical procedure.
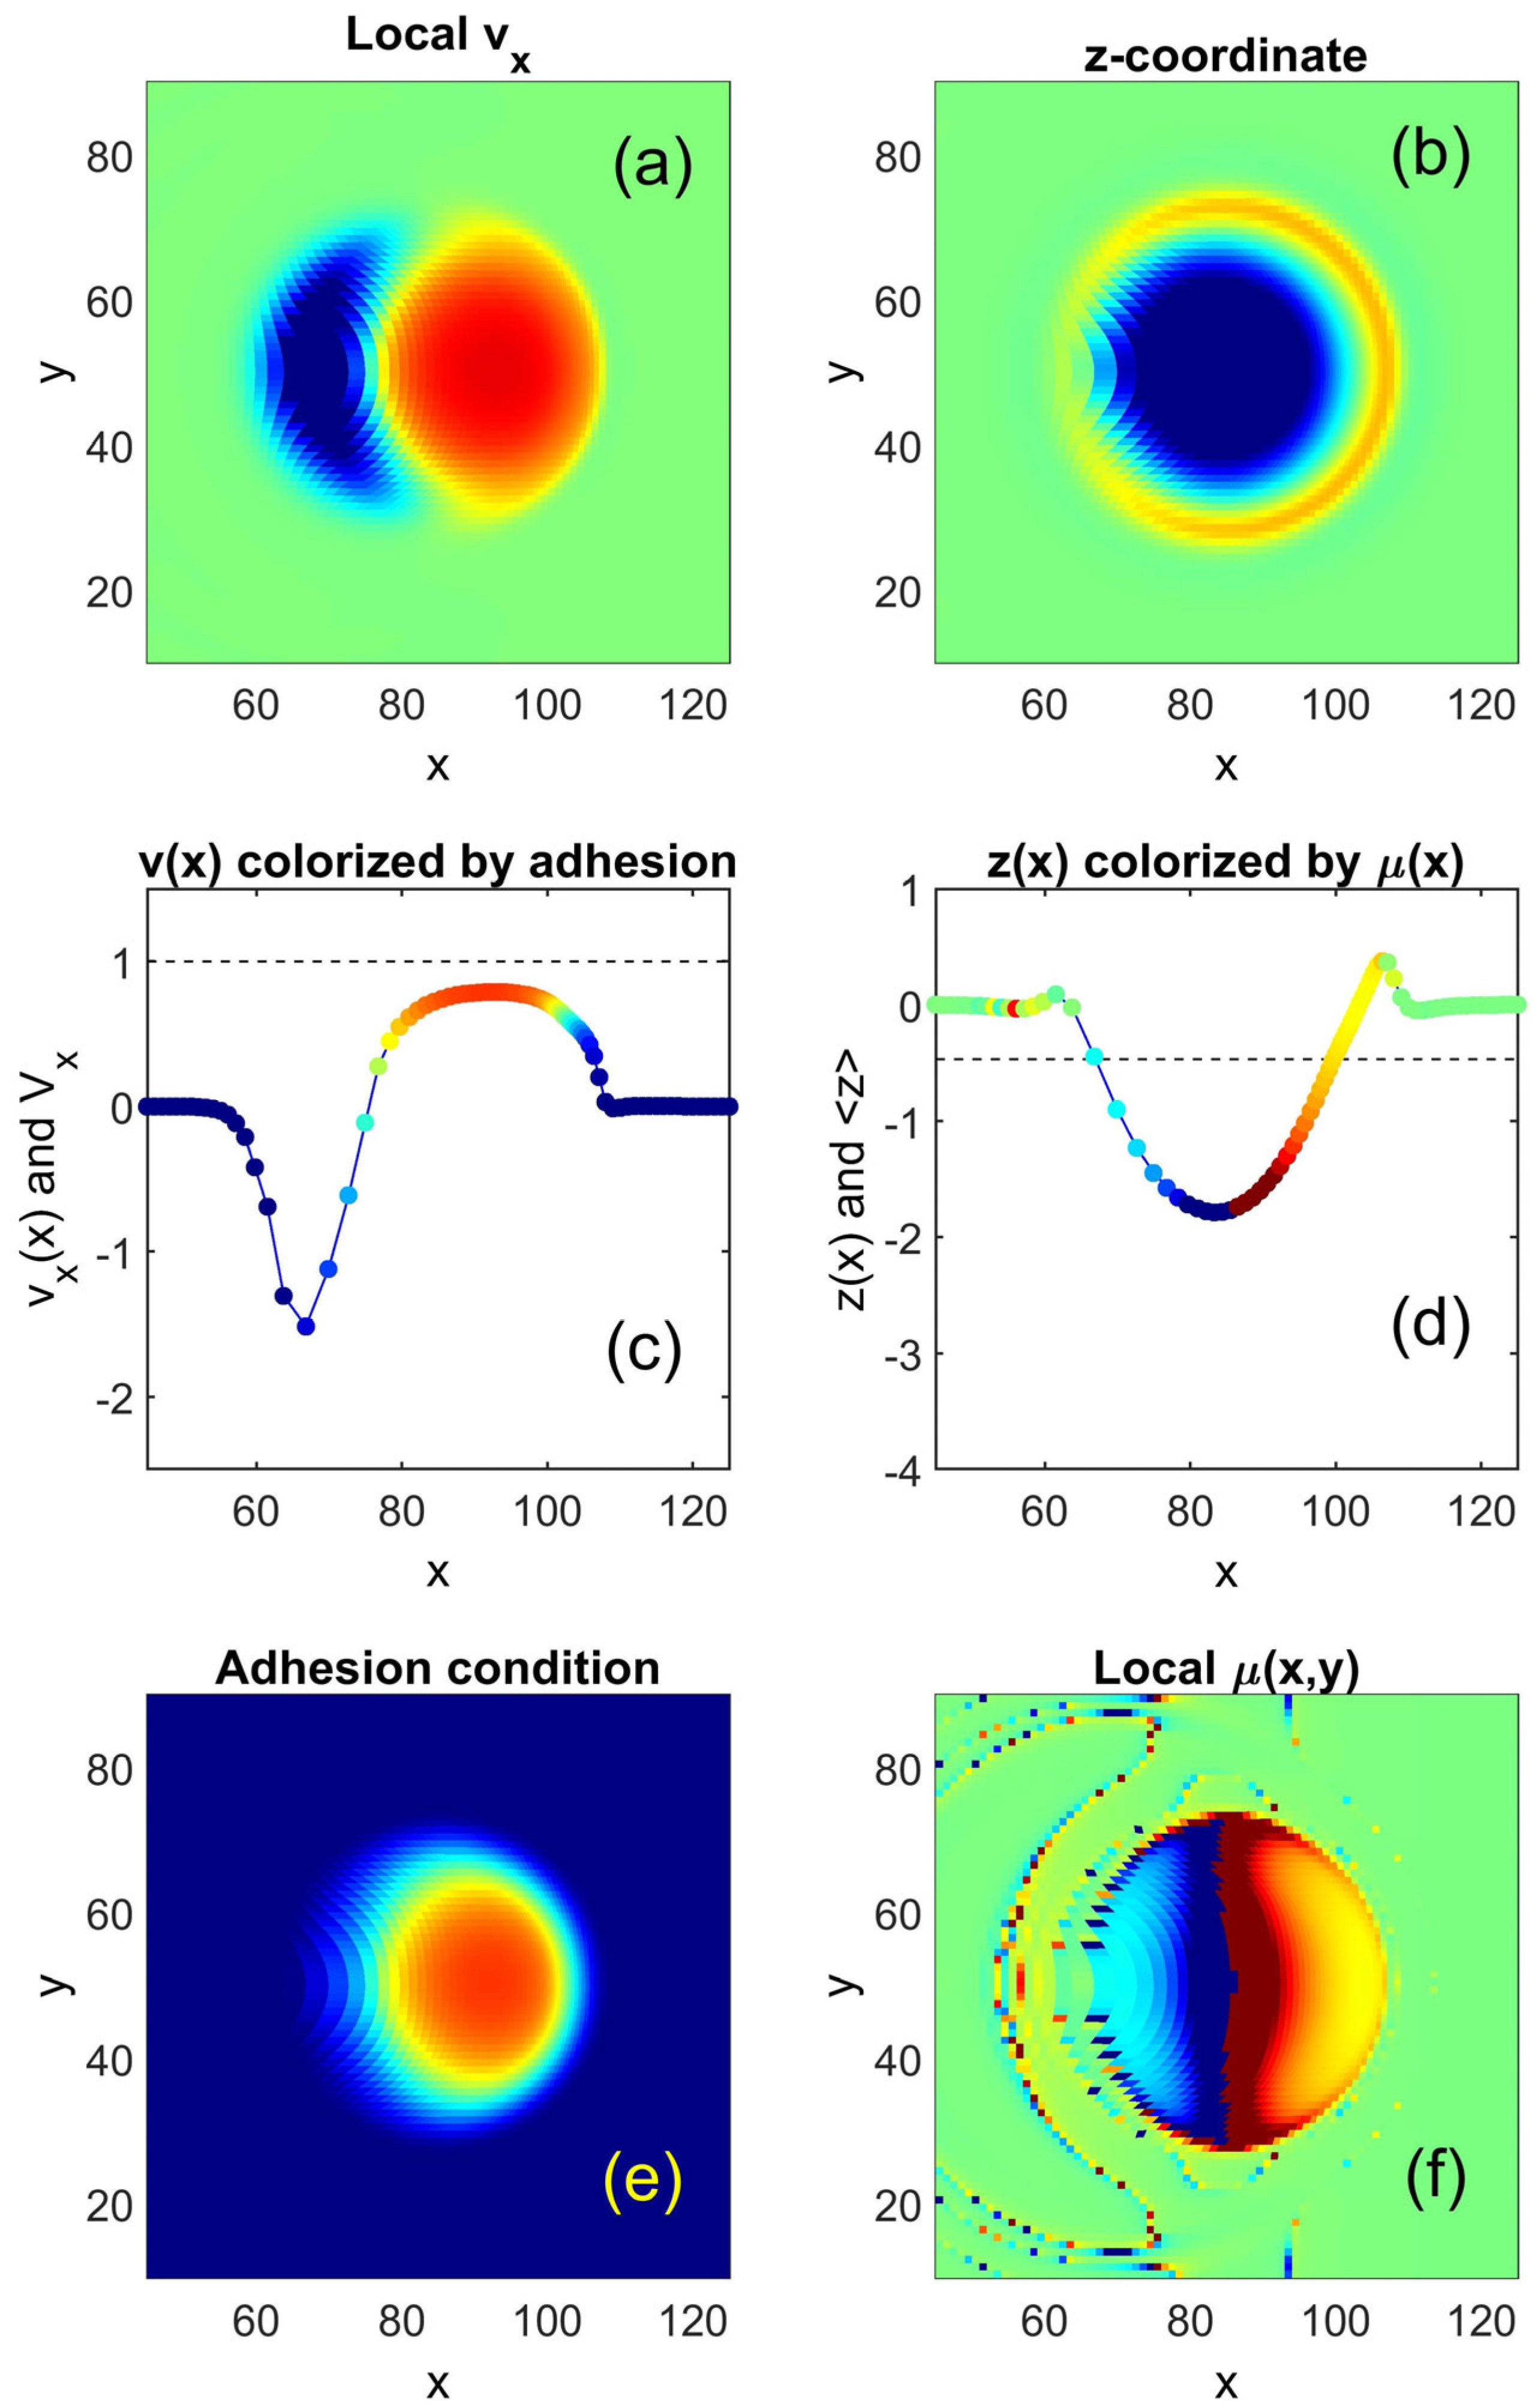
Instant spatial distributions of different physically interesting values are summarized in Figure 6. In particular, the local velocity, vertical coordinates, adhesion condition and formally calculated local friction coefficient μ(x, y) are simultaneously displayed in the subplots (a) and (b) as well as (e) and (f), respectively. Two internal subplots, (c) and (d), mutually combine the information presented in different colormaps because they present specially colorized central one-dimensional cross-sections of the velocity and vertical coordinate. In particular, the colorized curves show how strong local adhesion influences the effective friction coefficient and local horizontal velocity in the corresponding region.
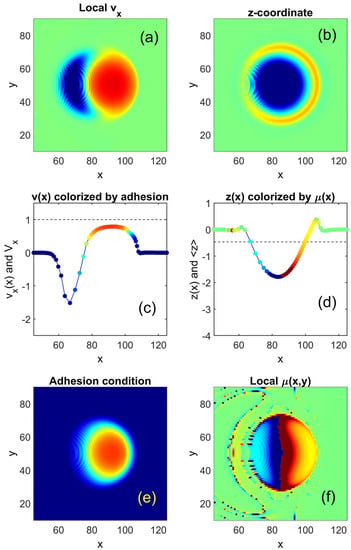
Figure 6.
Instant spatial distributions of the local velocity (a), vertical coordinate (b), adhesion condition (e) and formally calculated local friction coefficient (f). In two internal subplots, central cross-sections of the velocity v(x) (c) and vertical coordinate z(x) (d) are plotted. They illustrate mutual correlation between all the values shown in this figure. In particular, the colorized curves show how strong local adhesion influences the effective friction coefficient and local horizontal velocity in the corresponding region.
It is important to note that, in the frames of the model, the ball is forced “to be hung” at an almost fixed height Z ≈ Z0. Adhesive attraction locally lifts the substrate segments z(x, y) from their equilibrium positions z0(x, y) and formally calculated combination of the local pressure, and such a lifting (vertical component of the force acting on the substrate) becomes negative. As a result, the formally calculated friction coefficient μ(x, y) in such lifted regions becomes negative as well.
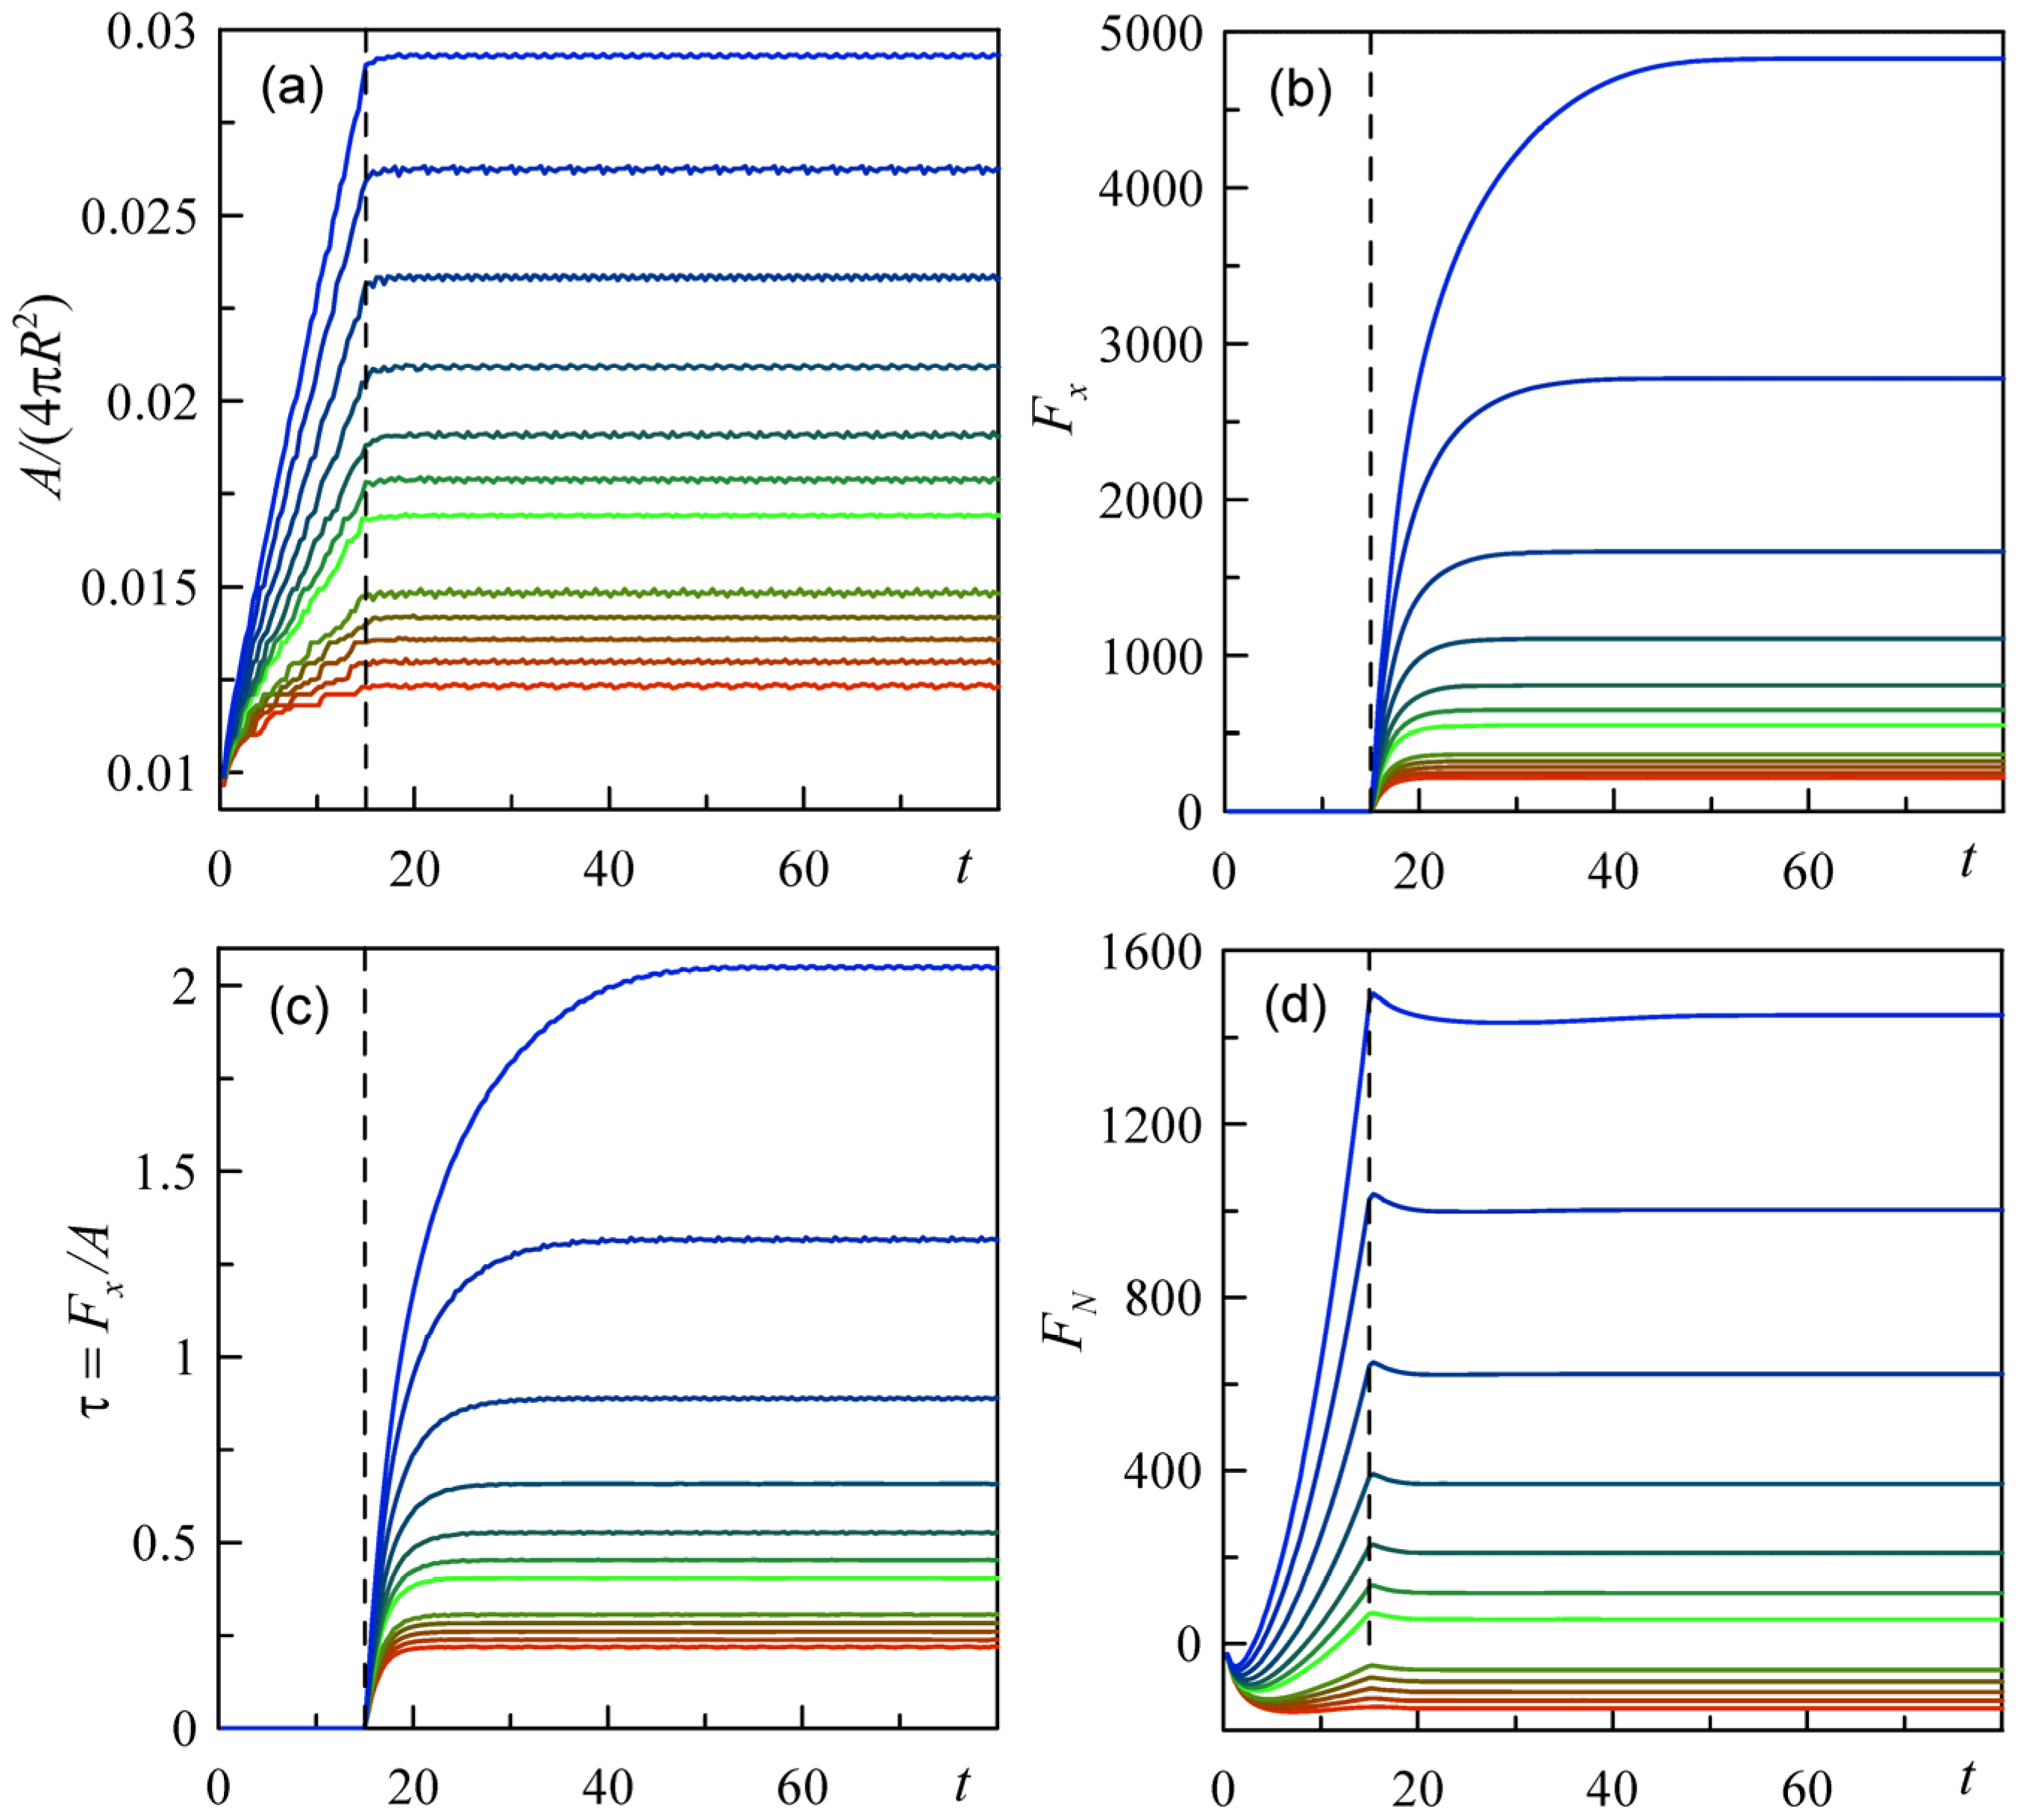
The time dependencies of the integral values of tangential Fx and vertical FN forces and total contact area A are shown in Figure 7. These values are reproduced in the subplots (b), (d) and (a), respectively. Additionally, the mutual relation between the integral values of tangential force and adhesion area is reproduced in the subplot (c). This subplot reproduces the physically important difference in the behavior of systems with small indentation (and the relatively important impact of the adhesion on the total friction) and the systems under deeper indentation where friction is mainly controlled by the ”ordinary” deformations of the substrate by the moving ball in both vertical and horizontal directions.
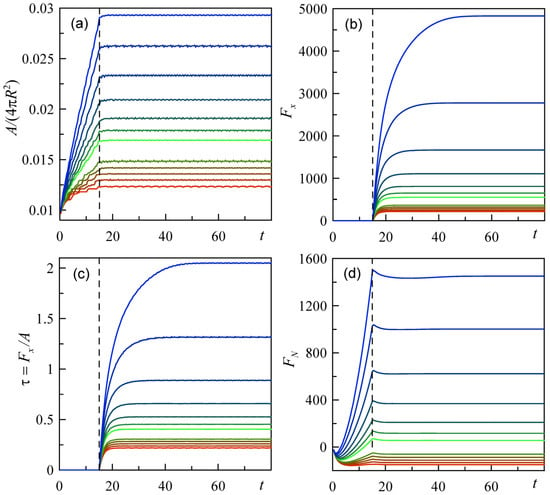
Figure 7.
Time dependencies of the integral values of tangential Fx (b) and vertical FN (d) forces and total contact area A (a). The mutual relation between the integral values of tangential force and contact area τ = Fx/A is reproduced in subplot (c). This plot reproduces the physically important difference in the behavior of the systems with small indentation and relatively large impact of the adhesion into the total friction and systems with deeper indentation, where the adhesion is less important and friction is mainly controlled by the deformation of the substrate by the moving ball.
To visually separate the curves from these two limiting cases, they are shown by colors from red and blue parts of the spectrum, respectively. The intermediate situation where adhesive and ordinary impacts on the friction force are comparable is reproduced by the green curves.
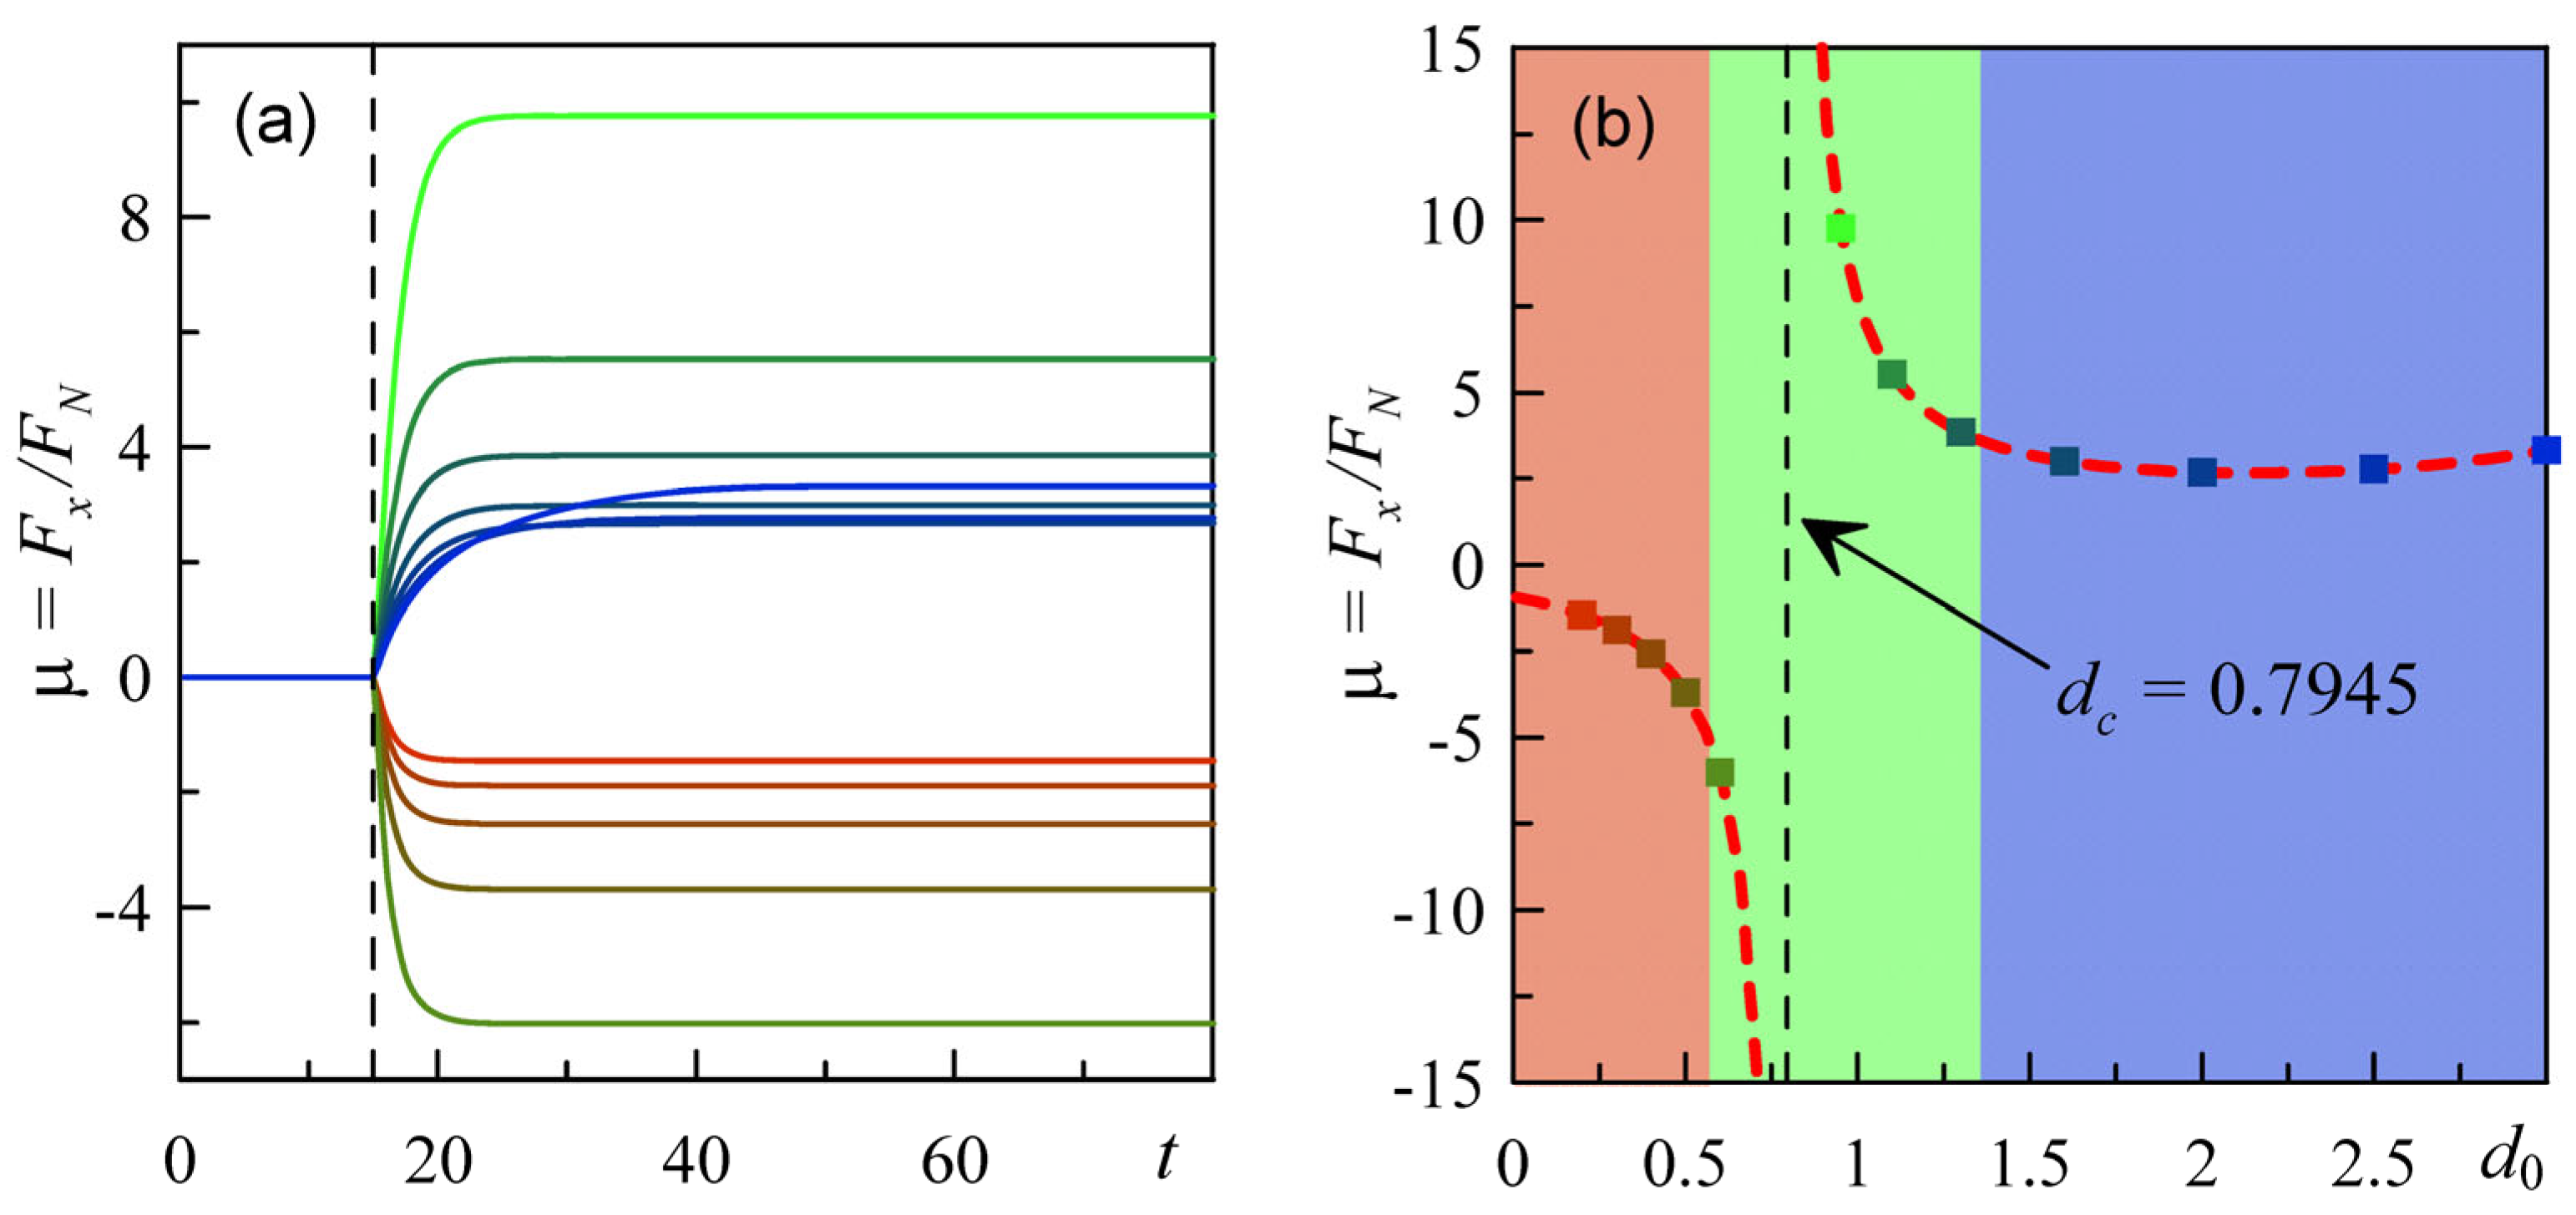
Starting from some (sufficiently strong) indentation, the role of the adhesion becomes practically negligible and normalized to the blue adhesion area curves in subplot (a), which completely deviate one from another. It is expected that in this region the friction coefficient μ = Fx/FN should become constant, and completely cease to depend on the indentation [43]. To confirm this, as well as to calculate the stationary friction in all other regimes, it is interesting to determine an effective friction coefficient, formally calculated as an asymptotic t → ∞ relation between the total tangential and normal forces for all the indentation values.
The time-dependent total friction coefficient obtained at different indentations is shown in Figure 8. In subplot (a) of this figure, three qualitatively different characteristic values of the indentation: weak, intermediate and strong, represented by red, green and blue curves, respectively. The final results, obtained for these regions for the stationary limits of the friction coefficient, are also marked by the colored rectangles in subplot (b). It is seen that, for some intermediate indentation d0 where total vertical and horizontal forces approximately equilibrate one another, the time-dependent integral coefficient μ(t) passes through an instability and globally changes its sign. One can note also that, at strong indentation, the final friction coefficient μ (at t → ∞) does not practically depend on indentation depth d0 (see plot (b)).
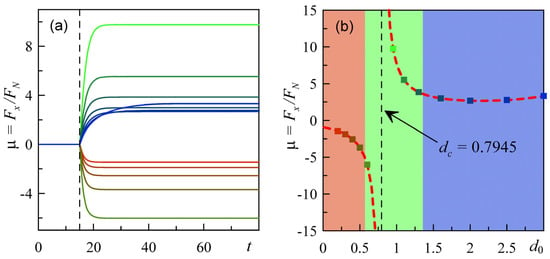
Figure 8.
Time-dependent total friction coefficient obtained at different indentations d0. Characteristic values of the indentation—weak, intermediate and strong—are plotted by the red, green and blue curves, respectively (a), as well as marked by the colored rectangles in the subplot (b). It is seen that, for some intermediate indentation d0, when total vertical and horizontal forces approximately equilibrate one another, the formally calculated integral coefficient passes through an instability at d = dc ≈ 0.7945 during a short-time run and its limit at t→∞ changes its sign.
Supplementary Video S8 reproduces in dynamics the simultaneous evolution of all the physically interesting spatial distributions shown in the previous Figure 4, Figure 5, Figure 6, Figure 7 and Figure 8 at different indentation depths. The correlation between the variations of the densities shown by the artificial colors (in the standard MatLab “jet” colormap), integral parameter values and measurable forces is seen directly. As in Figure 6 above, for a convenient comparison, the lines reproducing cross-sections along the central axis of the velocity and vertical coordinates are colorized by the same colors as the local values of the adhesion and friction coefficient, respectively.
The value of the friction coefficient averaged over whole the system, found as an asymptotic result of a stationary process, is accumulated step by step in the final subplot during the increase in the indentation depth. Quite clear mutual correspondence between different dynamic behaviors of the spatially distributed values, time dependencies and final results for the friction coefficient μ(t → ∞) can be observed in Video S8.
Depending on the relations between substrate elasticity, adhesion and damping constants, as well as indentation depth, the fine structure of the processes shown in Figure 4, Figure 5 and Figure 6 and the corresponding video can be more or less pronounced. In particular, under appropriate conditions (as well as the experimental ones described above), the visual contact area determined by the adhesion conditions can demonstrate strong fluctuations at either the front or back boundary, or even both simultaneously.
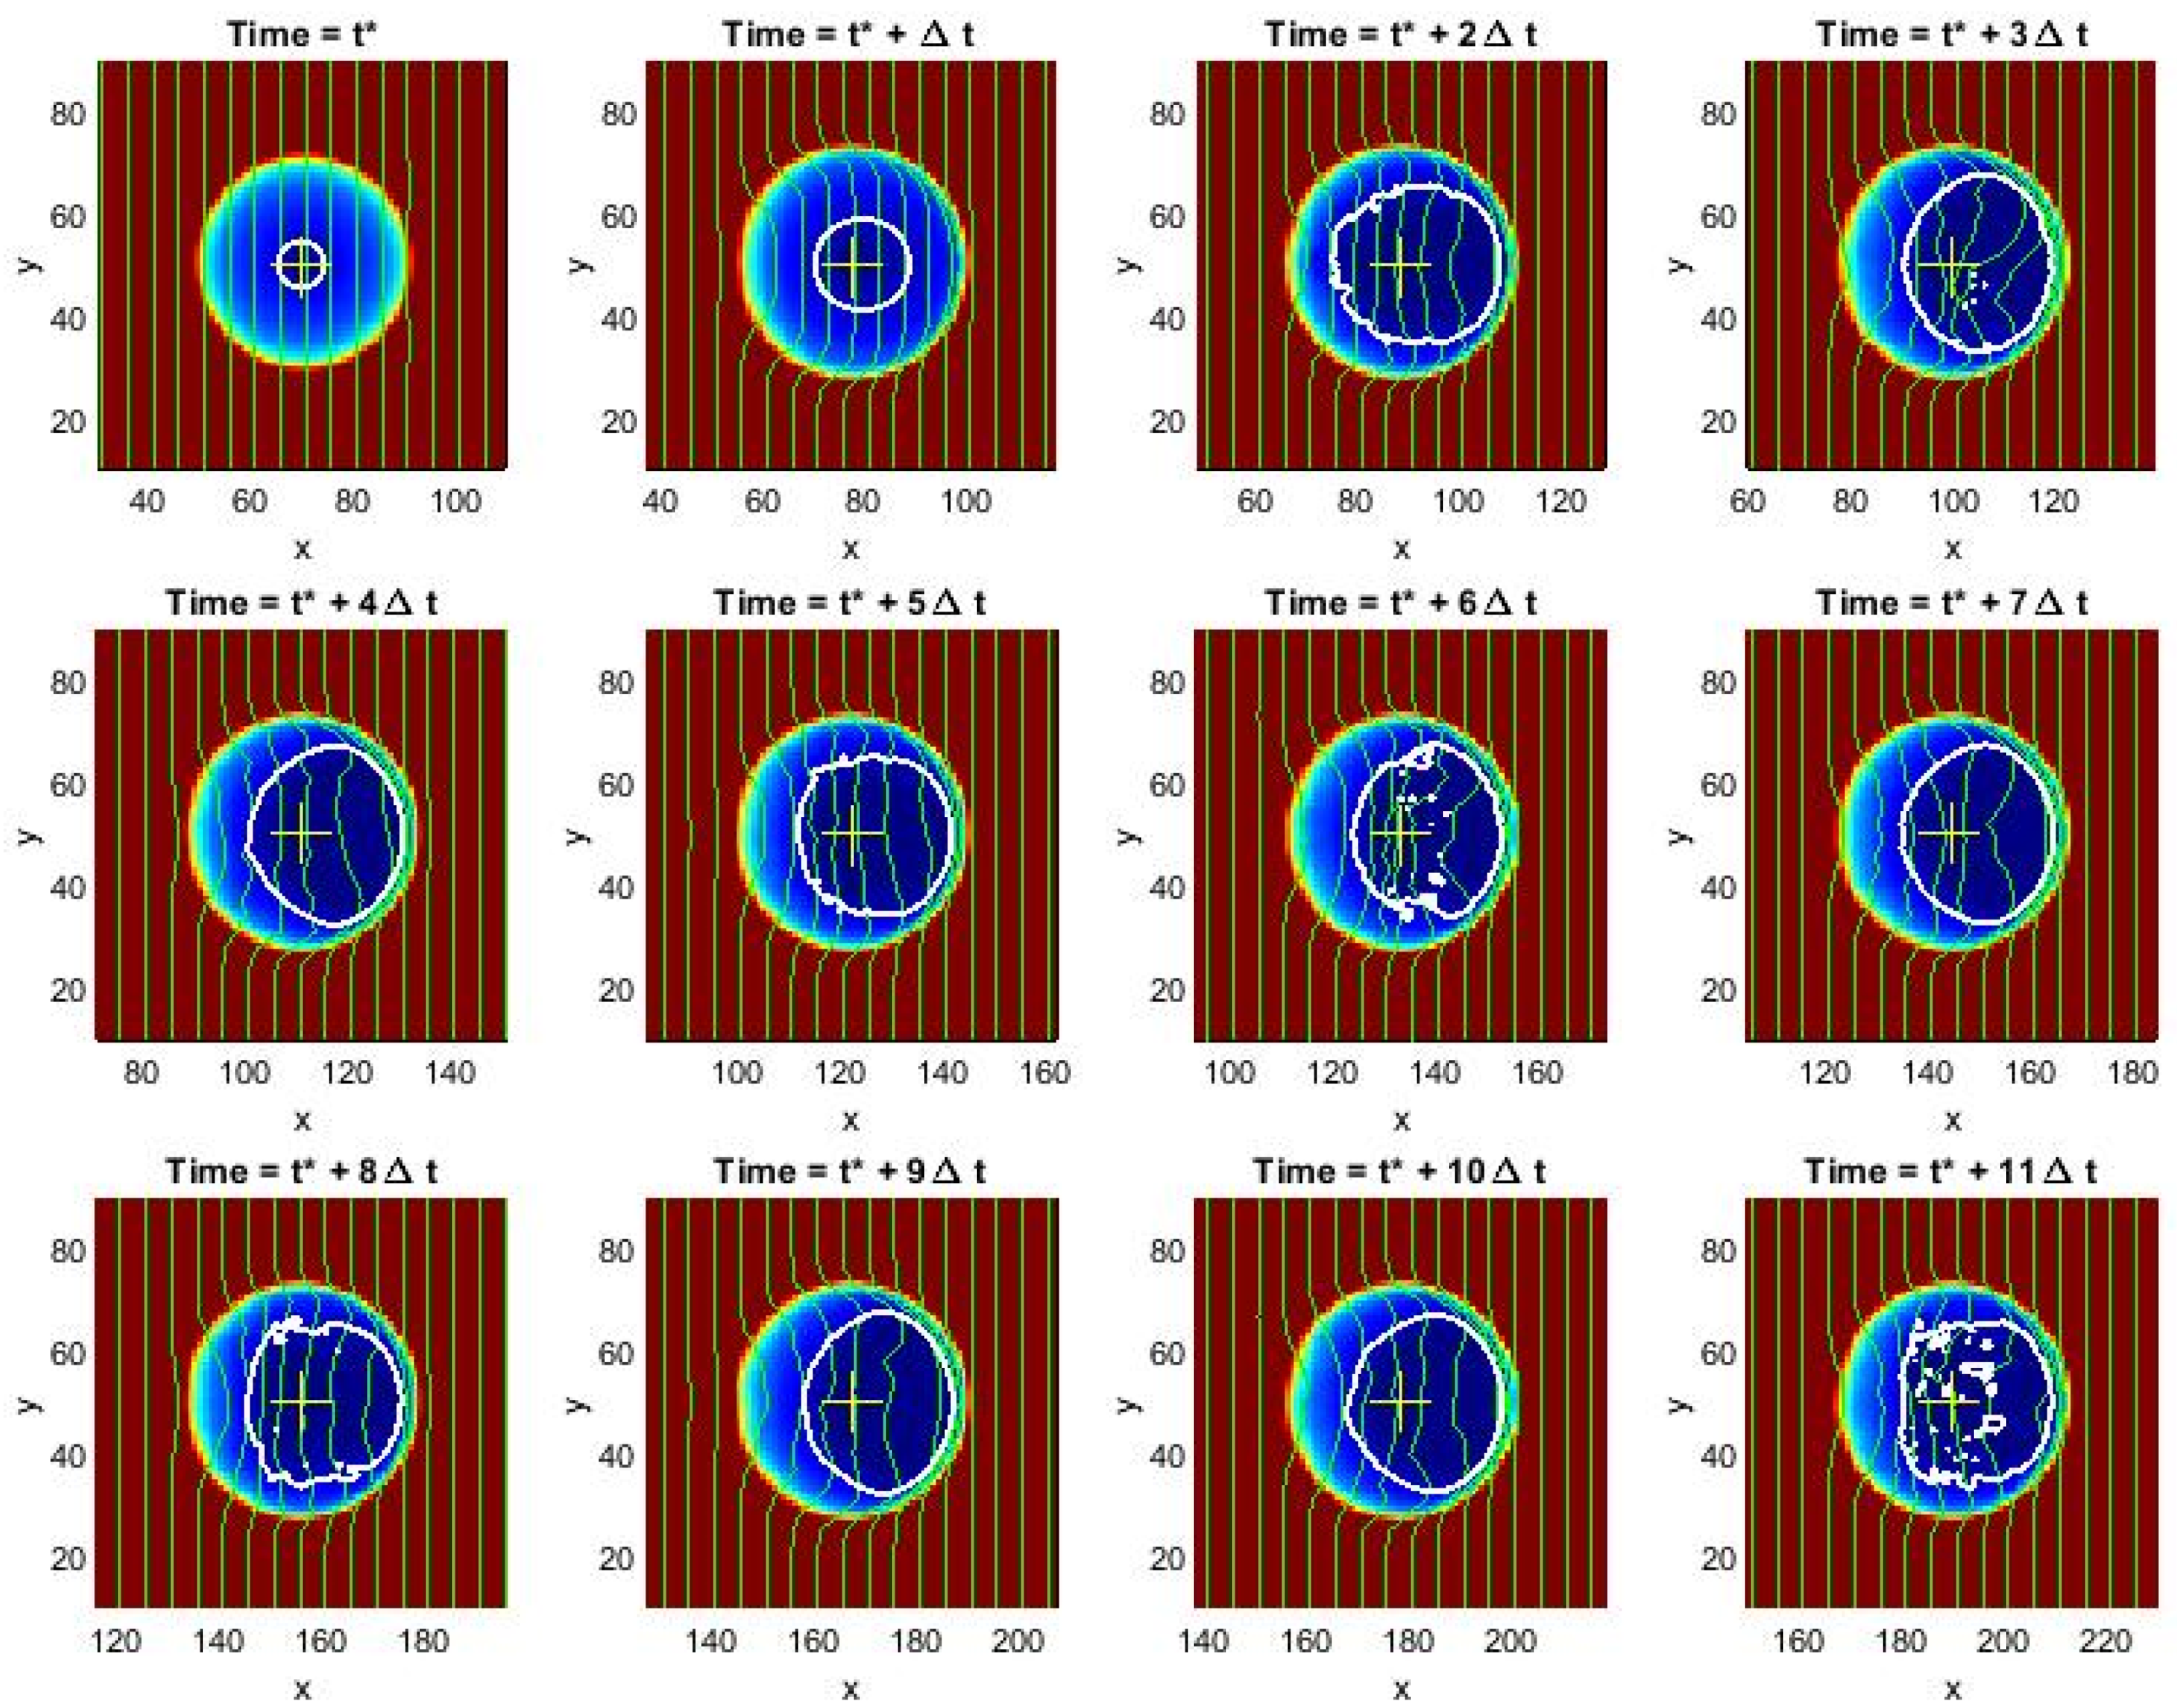
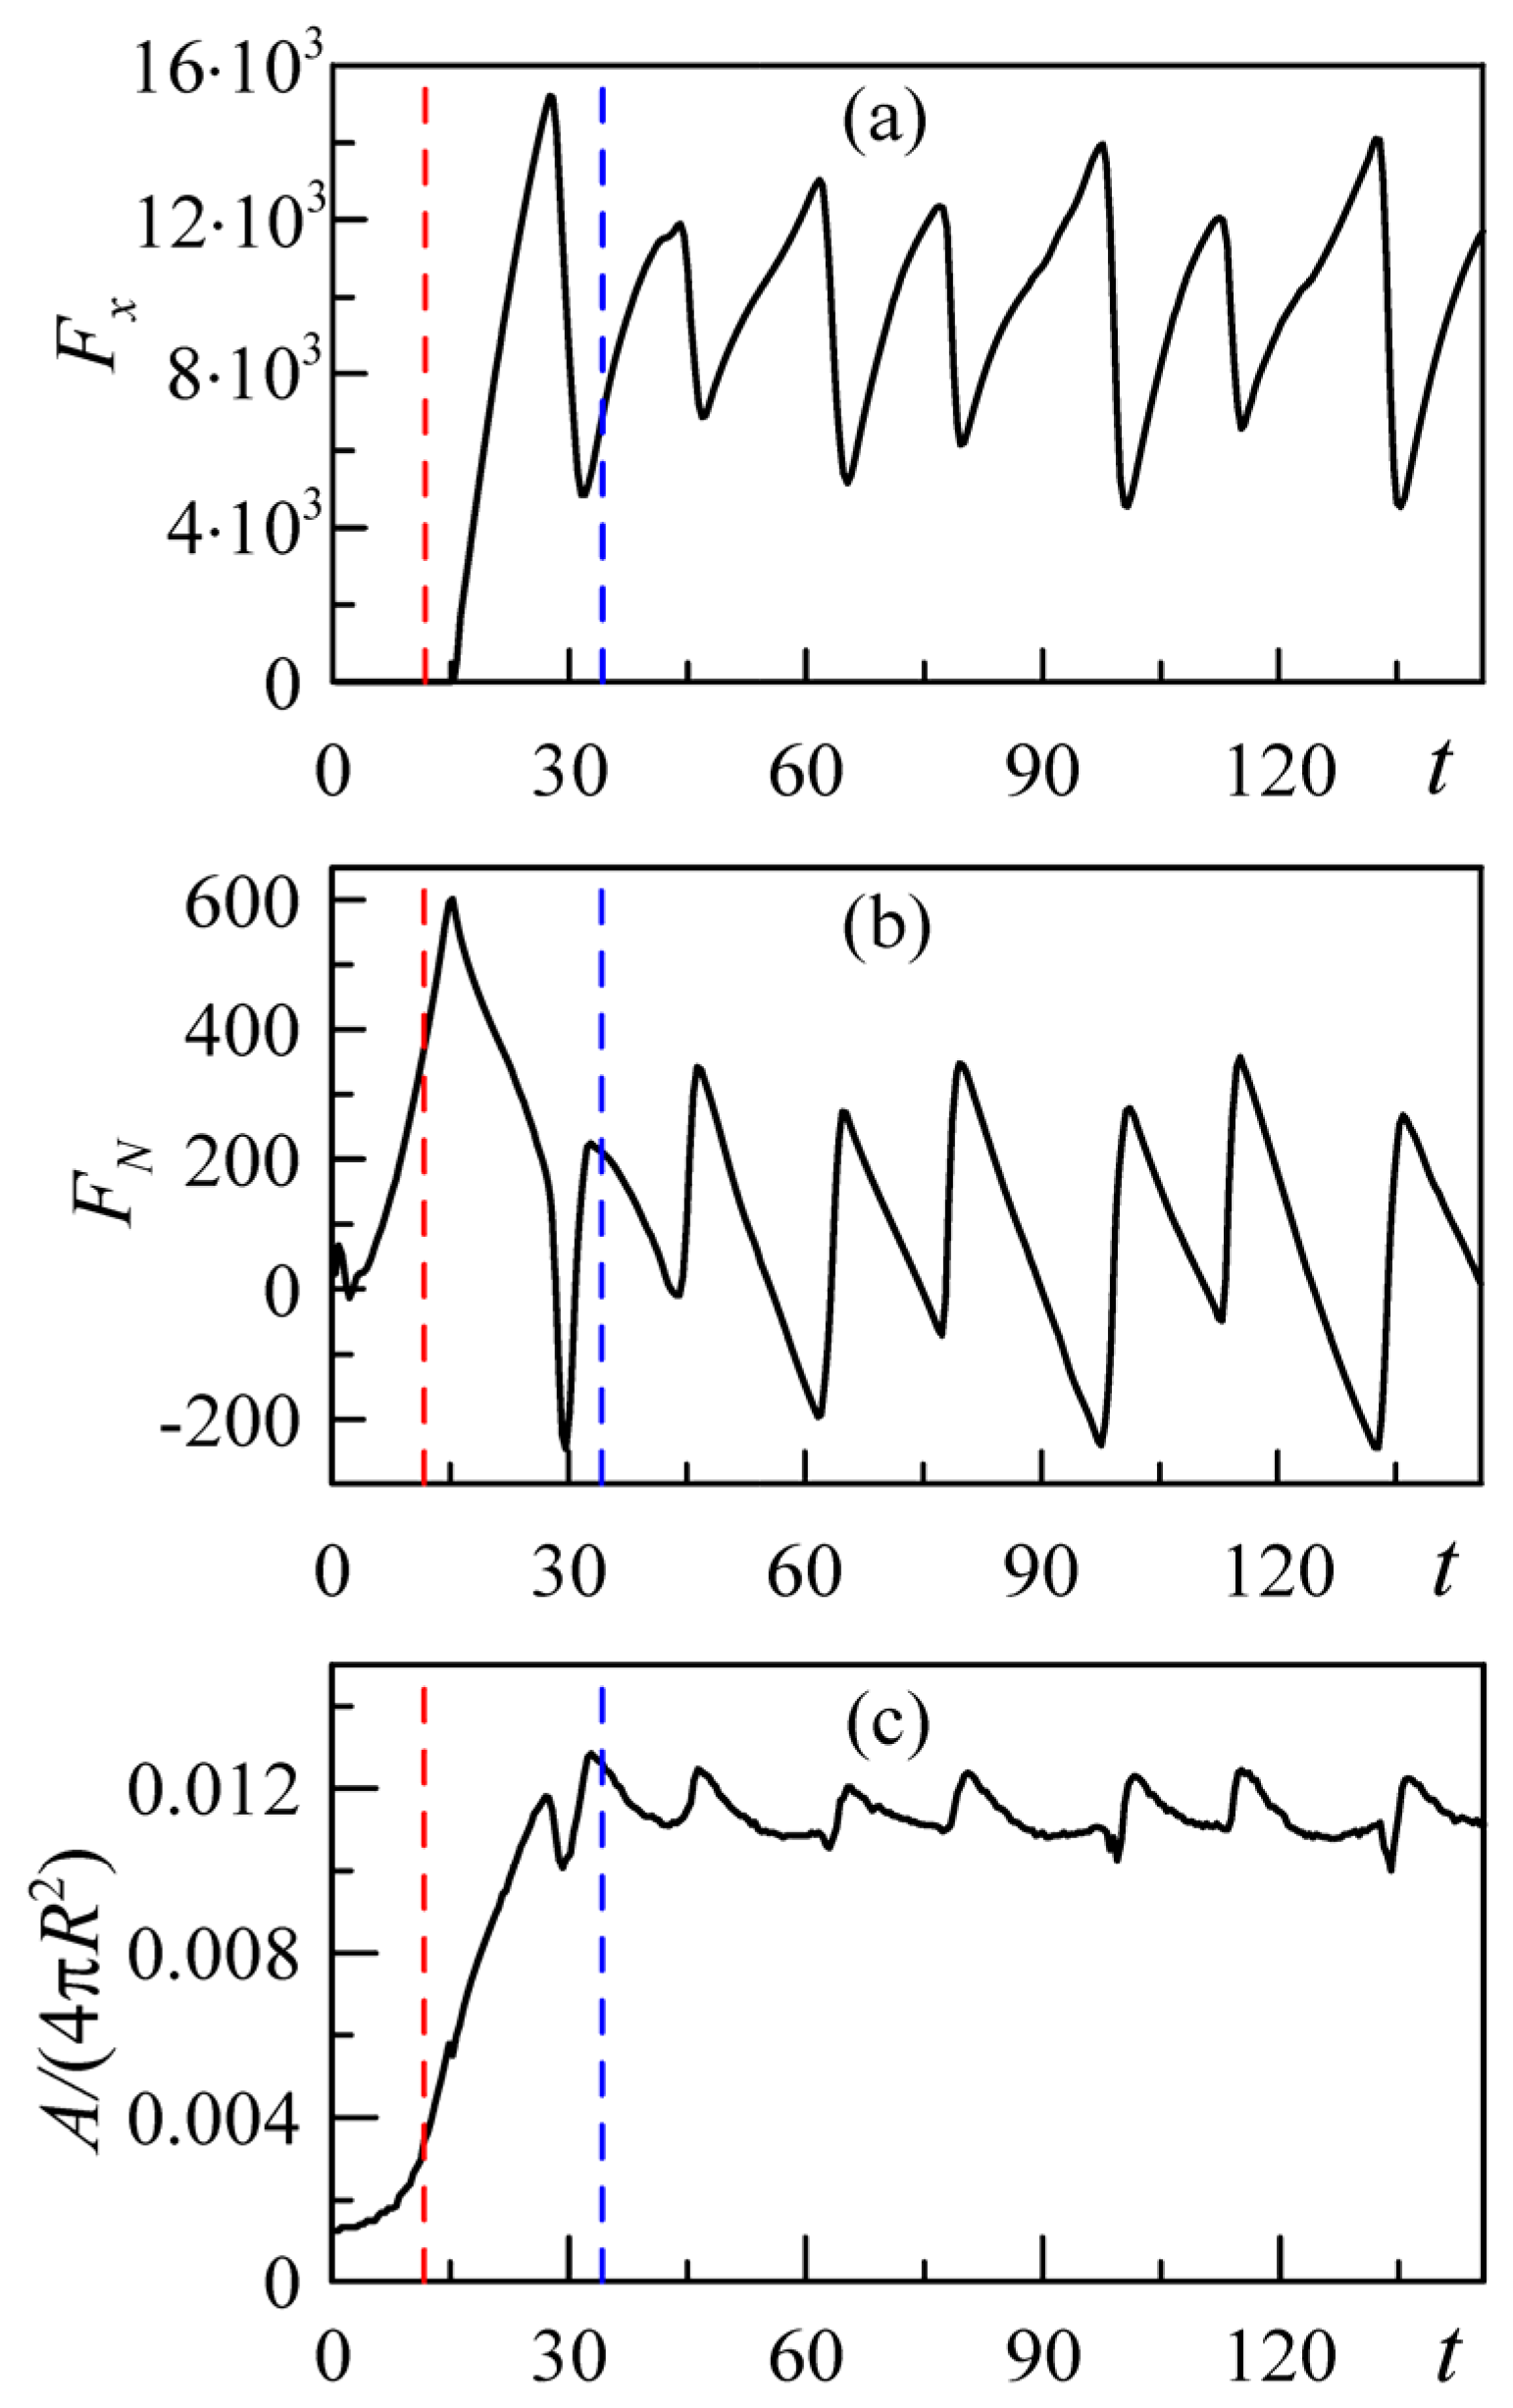
One example of such a case is recorded by us in Video S7; strong fluctuations in the back front are visible. The fine structure of the small area surrounding the contact, as well as the physically measured values, were also studied by us and recorded in Video S9. This video simultaneously records a sequence of instant configurations shown in Figure 9, and time dependencies of the physically measurable values reproduced in Figure 10. The distributions of the distance between the ball and surface around the contact region shown in Figure 9 were accumulated for the equal time intervals Δt starting from the initial moment t* chosen after a transient adjustment of the given indentation was self-consistently finished. One can note that this sequence closely resembles typical experimentally observed configurations.
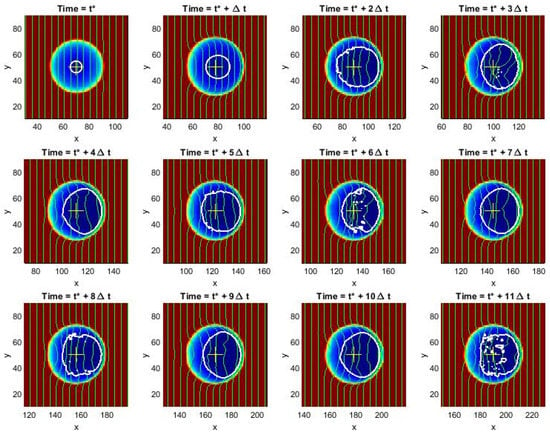
Figure 9.
Sequence of instant configurations of the contact region accumulated for the equal time intervals Δt = 11.25 starting from an initial moment t* = 11.7 close to the end of indentation in the normal direction. The first interval t* + Δt = 22.95 shows the initial adaptation of the surface to the tangential motion. The third snapshot at t* + 2Δt = 34.2 is approximately close to the beginning of a stationary process.
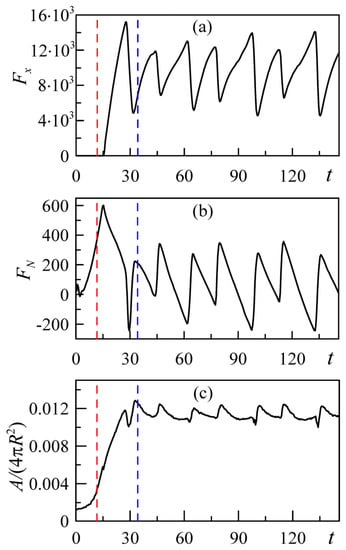
Figure 10.
Time dependencies of the tangential force Fx (a), normal force FN (b) and normalized contact area A (c) corresponding to the sequence of instant configurations of the contact region presented in the previous figure. The starting moment t = t* = 11.7 in each subplot is marked by the first (red) vertical line. The second (blue) vertical line at t = t* + 2Δt = 34.2 marks a moment when the initial transient process is finished and the system starts its quasiperiodic oscillations. One can note also the obvious correlation between such oscillations of the friction and vertical forces, as well as the corresponding variations in contact area.
Corresponding time dependencies of the physically measurable values are plotted in parallel to this simulation. A static presentation of these results is given in Figure 10. The moment in time when the process becomes stationary is marked by the vertical blue line in each subplot of the right panel in Video S9. This is the moment when the transient adjustment at a given indentation has just been finished. Watching the video, one can note also an obvious correlation between the periodic oscillations of friction and vertical forces which self-consistently follow a variation in the area of strong adhesion. It should be noted that Video S9 clearly shows the propagation of elastic waves in the contact area (Shallamach waves [26]) in the stationary mode of tangential shear.
4. Conclusions
To conclude, we combined experimental results and a numerical model, which reproduces some features of the processes experimentally observed during motion of an adhesive ball along an elastic substrate, while we considered a system which can be characterized more as a two-dimensional elastic foundation rather than an elastic half-space or elastic layer. The experimental study of the process of friction between a steel spherical indenter and a soft elastic elastomer, with a strongly pronounced adhesive interaction between the surfaces of contacting bodies, is presented. It is shown that, under conditions of uni-lateral sliding, it is the interface stress which characterizes the contact rather than the coefficient of friction, which loses its meaning. A numerical model is proposed that satisfactorily describes the experimentally observed effects, despite its simplicity and the essential difference in the properties of the considered elastic layer from those used experimentally. It was found that the 3-dimensional model leads to dynamic scenarios which qualitatively reproduce the correct behavior of the physical system. Qualitatively correct images of the processes in the system are accompanied by quite reasonable results for the experimentally measurable values. Numerical experiments in the frame of this model can be used to accompany or sometimes precede time-consuming experimental studies to obtain better preliminary understanding of the adhesive processes, which underlines our physical expectations and are confirmed by visual observations. This means that the experimentally observed behavior can be qualitatively described, even with a simple model.
Supplementary Materials
The following supporting information can be downloaded at: https://www.mdpi.com/article/10.3390/machines11060583/s1, Videos S1–S6: Development of contact configuration, normal and tangential contact forces after normal indentation and subsequent tangential motion. A rough steel spherical indenter with radius of curvature R = 22 mm was indented to the substrate layer of soft transparent rubber TARNAC CRG N3005 with thickness of h = 25 mm. Firstly, the indenter was indented to the depth d0. After that, the indenter was moved in tangential direction to the distance x = 5 mm. Subsequently, it was moved in the opposite direction to the initial coordinate x = 0 mm. Finally, the indenter was lifted up until the contact was completely destroyed. The velocity of the indenter movement both in normal and tangential directions was v = 1 μm/s. The videos present the normal and tangential forces, the averaged contact pressure, the nominal tangential stress, and the formally calculated friction coefficient (for d0 = 0 mm there is no panel with friction coefficient) vs. time (hours) as well as evolution of contact area. The full contact area and the contact areas to the left and to the right from the vertical dashed line are shown. The dashed vertical line corresponds to the center of the contact, obtained during normal indentation, this line moves together with the indenter during its tangential motion. Videos S1–S6 correspond to different indentation depth d0 = 0.0, 0.2, 0.4, 0.6, 0.8, and 1 mm. For d0 = 0 mm, the indenter was immersed in the elastomer to a depth of d = 0.2 mm at the beginning, after which it was raised to the level d0 = 0 mm, and later it was shifted in the tangential direction. Video S7: Conceptual reproduction of the dynamic process. The ball is shown by a transparent sphere which moves along the substrate at typical (intermediate) values of the damping, adhesion and indentation, at which all the effects mentioned in the main text are presented. Quasi-periodic time-dependent deformations of the surface are clearly seen due to the transformable horizontal gridlines plotted over the surface. Bright contours outline a region of sufficiently small distance between the ball and substrate (colored by dark grey-blue) with almost perfect adhesion. Video S8: Simultaneous evolution of all physically interesting spatial distributions shown by the artificial colors of standard MatLab “jet” colormap, integral parameter values and measurable forces. For convenient comparison, the lines reproducing cross-sections along central axis of the velocity and vertical coordinate are colorized by the same colors as the local values of the adhesion and friction coefficient, respectively. The value of the friction coefficient averaged over whole the system, found in asymptotical stationary process, is accumulated in the final subplot as a function of the indentation depth. Video S9: Time evolution of the close view of contact region shown in the “jet” colormap. Horizontal grid plotted over the surface and white contour, which outlines a region of strong adhesion, visualize corresponding spatial distributions in dynamics. “Frozen” static configurations of the contact region are recorded in different subplots (periodically recorded after fixed time intervals Δt between them). The right panel shows time dependencies of the mutually correlated integral tangential and vertical forces, accompanied by the variations in contact area.
Author Contributions
Conceptualization, scientific supervision, project administration, writing—review and editing, V.L.P.; experiments, experimental data analysis and visualization, writing—original draft preparation, I.A.L.; computer modeling, simulation data analysis and visualization, writing—original draft preparation, A.E.F. All authors have read and agreed to the published version of the manuscript.
Funding
This research was funded by Deutsche Forschungsgemeinschaft (Project DFG PO 810-55-3).
Institutional Review Board Statement
Not applicable.
Informed Consent Statement
Not applicable.
Data Availability Statement
The datasets generated for this study are available on request to the corresponding authors.
Conflicts of Interest
The authors declare no conflict of interest.
References
- Kinloch, A.J. Adhesion and Adhesives. Science and Technology; Springer: Dordrecht, The Netherlands, 1987; p. 442. ISBN 978-0-412-27440-4. [Google Scholar] [CrossRef]
- Da Silva, L.F.M.; Öchsner, A.; Adams, R.D. (Eds.) Handbook of Adhesion Technology, 2nd ed.; Springer: Berlin/Heidelberg, Germany, 2018. [Google Scholar] [CrossRef]
- Krachler, A.M.; Orth, K. Targeting the bacteria–host interface. Virulence 2014, 4, 284–294. [Google Scholar] [CrossRef] [PubMed]
- Berne, C.; Ellison, C.K.; Ducret, A.; Brown, Y.V. Bacterial adhesion at the single-cell level. Nat. Rev. Microbiol. 2018, 16, 616–627. [Google Scholar] [CrossRef]
- Gorb, S. Adhesion and Friction in Biological Systems; Springer: Dordrecht, The Netherlands, 2012; p. 280. ISBN 9789400714441. [Google Scholar]
- Autumn, K.; Gravish, N. Gecko adhesion: Evolutionary nanotechnology. Phil. Trans. R. Soc. A 2008, 366, 1575–1590. [Google Scholar] [CrossRef] [PubMed]
- Dalvi, S.; Gujrati, A.; Khanal, S.R.; Pastewka, L.; Dhinojwala, A.; Jacobs, T.D.B. Linking energy loss in soft adhesion to surface roughness. Proc. Natl. Acad. Sci. USA 2019, 116, 25484–25490. [Google Scholar] [CrossRef] [PubMed]
- You, S.; Wan, M.P. Modeling and Experiments of the Adhesion Force Distribution between Particles and a Surface. Langmuir 2014, 30, 6808–6818. [Google Scholar] [CrossRef]
- Ciavarella, M.; Papangelo, A. On the Degree of Irreversibility of Friction in Sheared Soft Adhesive Contacts. Tribol. Lett. 2020, 68, 81. [Google Scholar] [CrossRef]
- Johnson, K.L.; Kendall, K.; Roberts, A.D. Surface energy and the contact of elastic solids. Proc. R. Soc. A Math. Phys. Eng. Sci. 1971, 324, 301–313. [Google Scholar] [CrossRef]
- Sauer, R.A. A Survey of Computational Models for Adhesion. J. Adhes. 2016, 92, 81–120. [Google Scholar] [CrossRef]
- Salehani, M.K.; Irani, N.; Nicola, L. Modeling adhesive contacts under mixed-mode loading. J. Mech. Phys. Solids 2019, 130, 320–329. [Google Scholar] [CrossRef]
- Ringl, C.; Urbassek, H.M. A LAMMPS implementation of granular mechanics: Inclusion of adhesive and microscopic friction forces. Comput. Phys. Commun. 2012, 183, 986–992. [Google Scholar] [CrossRef]
- Waters, J.F.; Guduru, P.R. Mode-mixity-dependent adhesive contact of a sphere on a plane surface. Proc. R. Soc. A Math. Phys. Eng. Sci. 2010, 466, 1303–1325. [Google Scholar] [CrossRef]
- Mergel, J.C.; Sahli, R.; Scheibert, J.; Sauer, R.A. Continuum contact models for coupled adhesion and friction. J. Adhes. 2019, 95, 1101–1133. [Google Scholar] [CrossRef]
- Sahli, R.; Pallares, G.; Ducottet, C.; Ben Ali, I.E.; Al Akhrass, S.; Guibert, M.; Scheibert, J. Evolution of real contact area under shear and the value of static friction of soft materials. Proc. Natl. Acad. Sci. USA 2018, 115, 471–476. [Google Scholar] [CrossRef] [PubMed]
- Valero, M.; Hale, N.; Tang, J.; Jiang, L.; McGrath, M.; Gao, J.; Laszczak, P.; Moser, D. Interfacial pressure and shear sensor system for fingertip contact applications. Heal. Technol. Lett. 2016, 3, 280–283. [Google Scholar] [CrossRef]
- Popov, V.L.; Li, Q.; Lyashenko, I.A.; Pohrt, R. Adhesion and friction in hard and soft contacts: Theory and experiment. Friction 2021, 9, 1688–1706. [Google Scholar] [CrossRef]
- Braun, O.M.; Barel, I.; Urbakh, M. Dynamics of transition from static to kinetic friction. Phys. Rev. Lett. 2009, 103, 194301. [Google Scholar] [CrossRef]
- Derjaguin, B.V.; Muller, V.M.; Toporov, Y.P. Effect of contact deformations on the adhesion of particles. J. Colloid Interface Sci. 1975, 53, 314–326. [Google Scholar] [CrossRef]
- Maugis, D. Adhesion of spheres: The JKR-DMT transition using a dugdale model. J. Colloid Interface Sci. 1992, 150, 243–269. [Google Scholar] [CrossRef]
- Deng, W.; Kesari, H. Depth-dependent hysteresis in adhesive elastic contacts at large surface roughness. Sci. Rep. 2019, 9, 1639. [Google Scholar] [CrossRef]
- Greenwood, J.A. Reflections on and extensions of the Fuller and Tabor theory of rough surface adhesion. Tribol. Lett. 2017, 65, 159. [Google Scholar] [CrossRef]
- Liu, Z.; Lu, H.; Zheng, Y.; Tao, D.; Meng, Y.; Tian, Y. Transient adhesion in a non-fully detached contact. Sci. Rep. 2018, 8, 6147. [Google Scholar] [CrossRef] [PubMed]
- Deng, W.; Kesari, H. Effect of machine stiffness on interpreting contact force-indentation depth curves in adhesive elastic contact experiments. J. Mech. Phys. Solids 2019, 131, 404–423. [Google Scholar] [CrossRef]
- Schallamach, A. How does rubber slide? Wear 1971, 17, 301–312. [Google Scholar] [CrossRef]
- Johnson, K.L. Adhesion and friction between a smooth elastic spherical asperity and a plane surface. Proc. R. Soc. A Math. Phys. Eng. Sci. 1997, 453, 163–179. [Google Scholar] [CrossRef]
- Papangelo, A. On the Effect of Shear Loading Rate on Contact Area Shrinking in Adhesive Soft Contacts. Tribol. Lett. 2021, 69, 48. [Google Scholar] [CrossRef]
- Lyashenko, I.A.; Popov, V.L.; Pohrt, R.; Borysiuk, V. High-precision tribometer for studies of adhesive contacts. Sensors 2023, 23, 456. [Google Scholar] [CrossRef]
- Lyashenko, I.A.; Popov, V.L.; Borysiuk, V. Experimental verification of the boundary element method for adhesive contacts of a coated elastic half-space. Lubricants 2023, 11, 84. [Google Scholar] [CrossRef]
- Lyashenko, I.A.; Pohrt, R. Adhesion between rigid indenter and soft rubber layer: Influence of roughness. Front. Mech. Eng. 2020, 6, 49. [Google Scholar] [CrossRef]
- Fillipov, A.E.; Hu, B.; Li, B.; Zeltser, A. Energy transport between two attractors connected by a Fermi–Pasta–Ulam chain. J. Phys. A Math. Gen. 1998, 31, 7719–7728. [Google Scholar] [CrossRef]
- Filippov, A.E.; Gorb, S.N. Combined Discrete and Continual Approaches in Biological Modelling; Springer: Cham, Switzerland, 2020; p. 317. [Google Scholar] [CrossRef]
- Heepe, L.; Filippov, A.E.; Kovalev, A.E.; Gorb, S.N. Visualization of wave propagation and fine structure in frictional motion of unconstrained soft microstructured tapes. Tribol. Lett. 2017, 65, 146. [Google Scholar] [CrossRef]
- Filippov, A.E.; Popov, V.L. Elastic Energy Transfer and Thermalization in a Lattice and Phenomenon of Thermal Fireballs. Phys. Mesomech. 2022, 25, 523–536. [Google Scholar] [CrossRef]
- Popov, V.L.; Gray, J.A.T. Prandtl-Tomlinson model: History and applications in friction, plasticity, and nanotechnologies. Z. Angew. Math. Mech. 2012, 92, 683–708. [Google Scholar] [CrossRef]
- Prandtl, L. Ein Gedankenmodell zur kinetischen Theorie der festen Körper. J. Appl. Math. Mech. 1928, 8, 85–106. [Google Scholar] [CrossRef]
- Popov, V.L. The Prandtl-Tomlinson Model for Dry Friction. In Contact Mechanics and Friction; Chapter “Prandtl–Tomlinson–Model”; Springer: Berlin/Heidelberg, Germany, 2017; pp. 173–192. [Google Scholar]
- Lyashenko, I.A.; Popov, V.L. Dissipation of mechanical energy in an oscillating adhesive contact between a hard indenter and an elastomer. Tech. Phys. Lett. 2020, 46, 1092–1095. [Google Scholar] [CrossRef]
- Lyashenko, I.A.; Popov, V.L. The influence of adhesion on rolling and sliding friction: An experiment. Tech. Phys. 2022, 67, 203–214. [Google Scholar] [CrossRef]
- Homola, A.M.; Israelachvili, J.N.; McGuiggan, P.M.; Gee, M.L. Fundamental experimental studies in tribology: The transition from “interfacial” friction of undamaged molecularly smooth surfaces to “normal” friction with wear. Wear 1990, 136, 65–83. [Google Scholar] [CrossRef]
- Das, D.; Chasiotis, I. Sliding of adhesive nanoscale polymer contacts. J. Mech. Phys. Solids 2020, 140, 103931. [Google Scholar] [CrossRef]
- McFarlane, J.S.; Tabor, D. Relation between friction and adhesion. Proc. R. Soc. A 1950, 202, 244–253. [Google Scholar] [CrossRef]
- Deng, Z.; Smolyanitsky, A.; Li, Q.; Feng, X.-Q.; Cannara, R.J. Adhesion-dependent negative friction coefficient on chemically modified graphite at the nanoscale. Nat. Mater. 2012, 11, 1032–1037. [Google Scholar] [CrossRef]
- Yamada, S.; Inomata, K.A.; Kobayashi, E.; Tanabe, T.; Kurihara, K. Effect of a Fatty Acid Additive on the Kinetic Friction and Stiction of Confined Liquid Lubricants. Tribol. Lett. 2016, 64, 23. [Google Scholar] [CrossRef]
- Charrault, E.; Banquy, X.; Kristiansen, K.; Israelachvili, J.; Giasson, S. Investigation on the Molecular Shear-Induced Organization in a Molecularly Thin Film of N-hexadecane. Tribol. Lett. 2013, 50, 421–430. [Google Scholar] [CrossRef]
- Li, Z.; Szlufarska, I. Chemical Creep and Its Effect on Contact Aging. ACS Mater. Lett. 2022, 4, 1368–1373. [Google Scholar] [CrossRef]
- Barquins, M. Sliding Friction of Rubber and Schallamach Waves—A Review. Mater. Sci. Eng. 1985, 73, 45–63. [Google Scholar] [CrossRef]
- Rand, C.J.; Crosby, A.J. Insight into the periodicity of Schallamach waves in soft material friction. Appl. Phys. Lett. 2006, 89, 261907. [Google Scholar] [CrossRef]
- Viswanathan, K.; Chandrasekar, S. Fifty years of Schallamach waves: From rubber friction to nanoscale fracture. Phil. Trans. R. Soc. A 2022, 380, 20210339. [Google Scholar] [CrossRef]
- Zhibo, C.; Zhaoqian, S.; Dandan, H.; Genzong, L.; Jian, W.; Benlong, S.; Yuyan, L.; Youshan, W. From small wrinkles to Schallamach waves during rubber friction: In situation experiment and 3D simulation. Polym. Test. 2021, 96, 107084. [Google Scholar] [CrossRef]
Disclaimer/Publisher’s Note: The statements, opinions and data contained in all publications are solely those of the individual author(s) and contributor(s) and not of MDPI and/or the editor(s). MDPI and/or the editor(s) disclaim responsibility for any injury to people or property resulting from any ideas, methods, instructions or products referred to in the content. |
© 2023 by the authors. Licensee MDPI, Basel, Switzerland. This article is an open access article distributed under the terms and conditions of the Creative Commons Attribution (CC BY) license (https://creativecommons.org/licenses/by/4.0/).

