1. Introduction
In recent years, heat and/or fluid transportation have become more important in the cooling of electronic equipment. Studies on applications of the electrohydrodynamic (EHD) phenomenon, caused by corona discharge, have been conducted [
1,
2,
3,
4]. EHD gas flow is induced by the exchange momentum arising from collisions between gas molecules and ions travelling between a high voltage electrode and a grounded electrode (GND), due to the applied electric fields. In this study, an EHD fan is investigated for its potential to replace a gas fan in a thermal management system [
5,
6,
7,
8]. When compared to a traditional gas transportation system containing moving parts, such as a fan or diaphragm, the fact that an EHD fan contains no moving components is an excellent advantage. Therefore, EHD fans have potential in their simple design, low noise, long life, and fast control of gas flow. These attributes are becoming more important, as, for example, in the case of electric and hybrid cars, wherein the cabins are becoming quieter as a result of less engine-related noise, and so fan noise from the air-conditioner becomes relatively more noticeable and, thus, requires reduction. Therefore, the necessity for noiseless fans has gradually increased.
In the last ten years, a variety of EHD fans have been experimentally and analytically investigated and developed [
9,
10,
11,
12,
13,
14,
15,
16,
17,
18,
19,
20,
21,
22]. For example, wire-parallel plate electrode type EHD fans with their high design freedom and potential of practical application have been suggested [
21,
22]. Since visualization and numerical simulation of the internal flow of EHD fans have not yet been conducted, details of the internal flow profile and the flow around the wire electrode have not been clarified. Although there have been attempts at numerical simulations for some EHD fans or pumps, with a variety of electrode and flow channel configurations [
23,
24,
25], numerical simulations have not been conducted for the wire-partially insulated parallel plate electrode type EHD fan.
In this study, the fan characteristics of the wire-partially insulated parallel plate electrode type EHD fan under DC positive applied voltage are investigated. In addition, in order to understand the fan characteristics at certain velocity profiles, the visualizations of air flow in the flow channel and the downstream area near the exit section were observed using a high-speed video camera, tracer particles and a YAG laser sheet. Furthermore, instantaneous and time-averaged velocity profiles, obtained by means of PIV analysis, and two-dimensional steady state air flow, obtained by means of CFD analysis, are compared with the experimental data. These experimental and analytical results are presented and discussed here in detail.
2. Experimental Apparatus
2.1. EHD Fan Characteristic Experiments
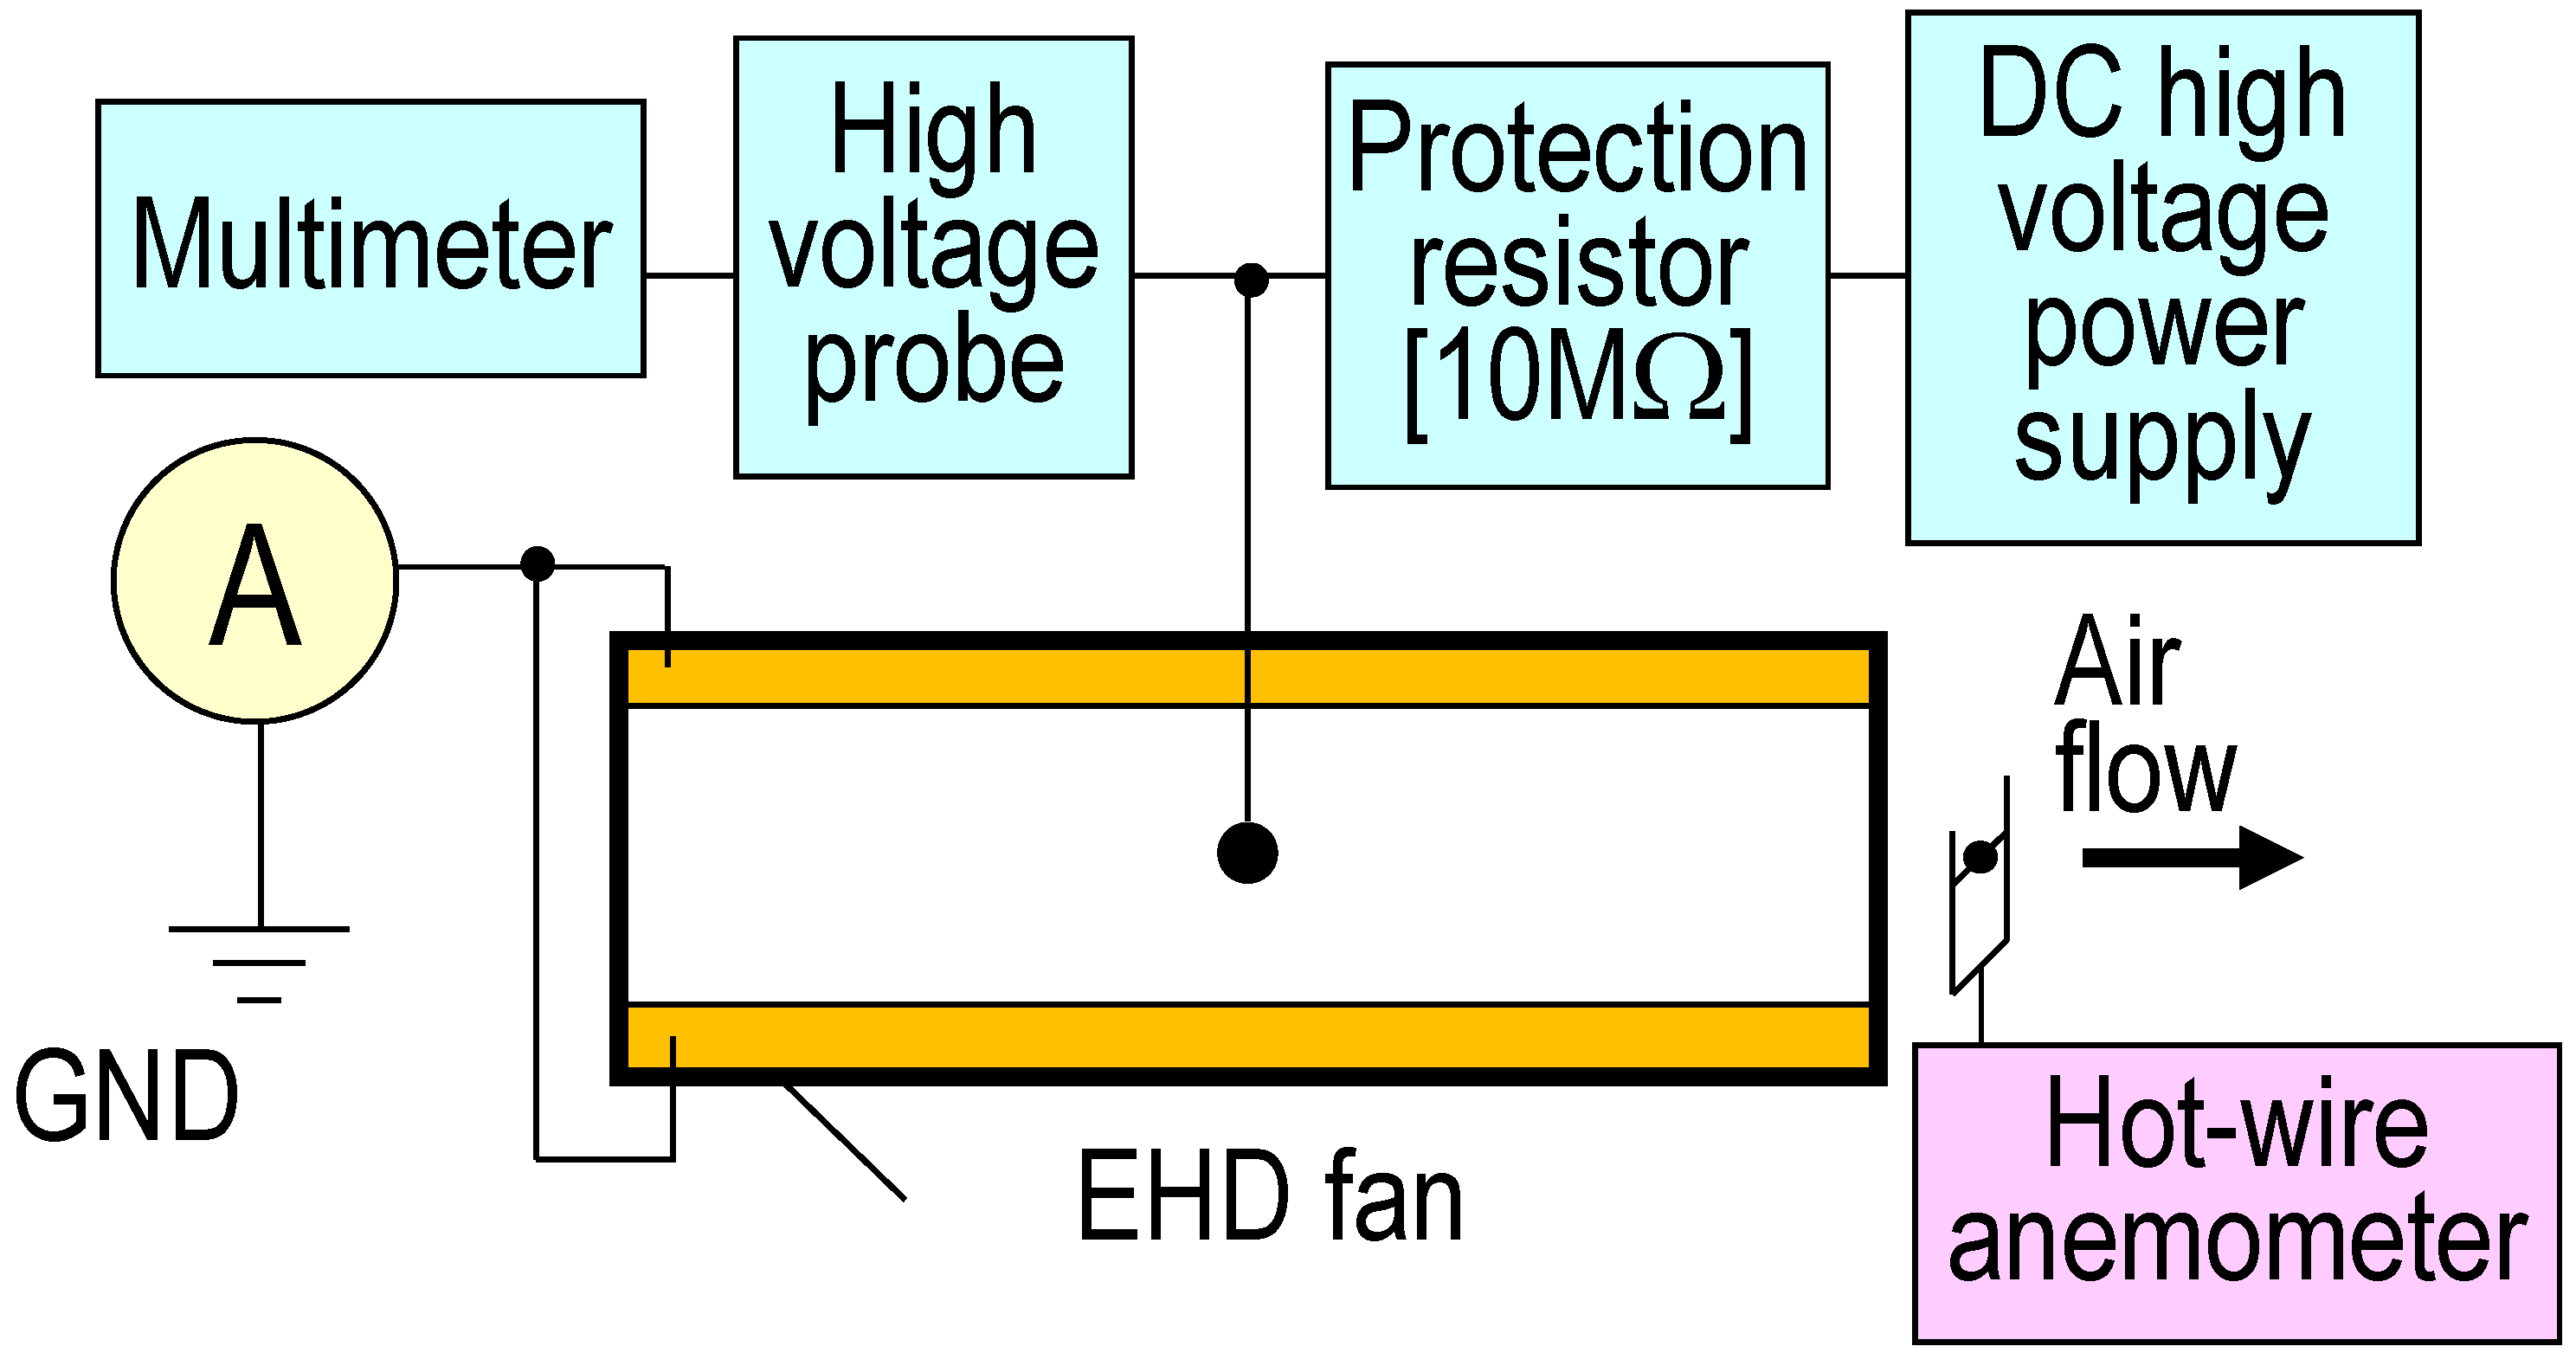
The schematic of the experimental setup used in this study is shown in
Figure 1. In the experiment, air at atmospheric pressure and room temperature was used as a working fluid. The corona discharge was obtained by applications of a high positive voltage at the wire electrode with a DC high voltage power supply (Glassman, model PS/ER20R15.0-10). The applied voltage at the wire electrode and the discharge current to GND electrodes were measured with a high voltage probe (Tektronix, model P6015A, ±3%) and a digital ammeter (Iwatsu, model VOAC86A, ±0.5%). A hot-wire anemometer (Kanomax, model 6006-D0, ±0.1 m/s) was used to measure the air flow velocity profile at an area 10 mm downstream from the flow channel exit. The measurements of the local air flow velocity at the exit area were conducted at each location at intervals of 2 mm and 1 mm on the
x and
y axes, respectively. The volumetric flow rate at the exit section of the EHD fan was estimated by multiplying the cross-sectional area of the flow channel by the averaged air flow velocity.
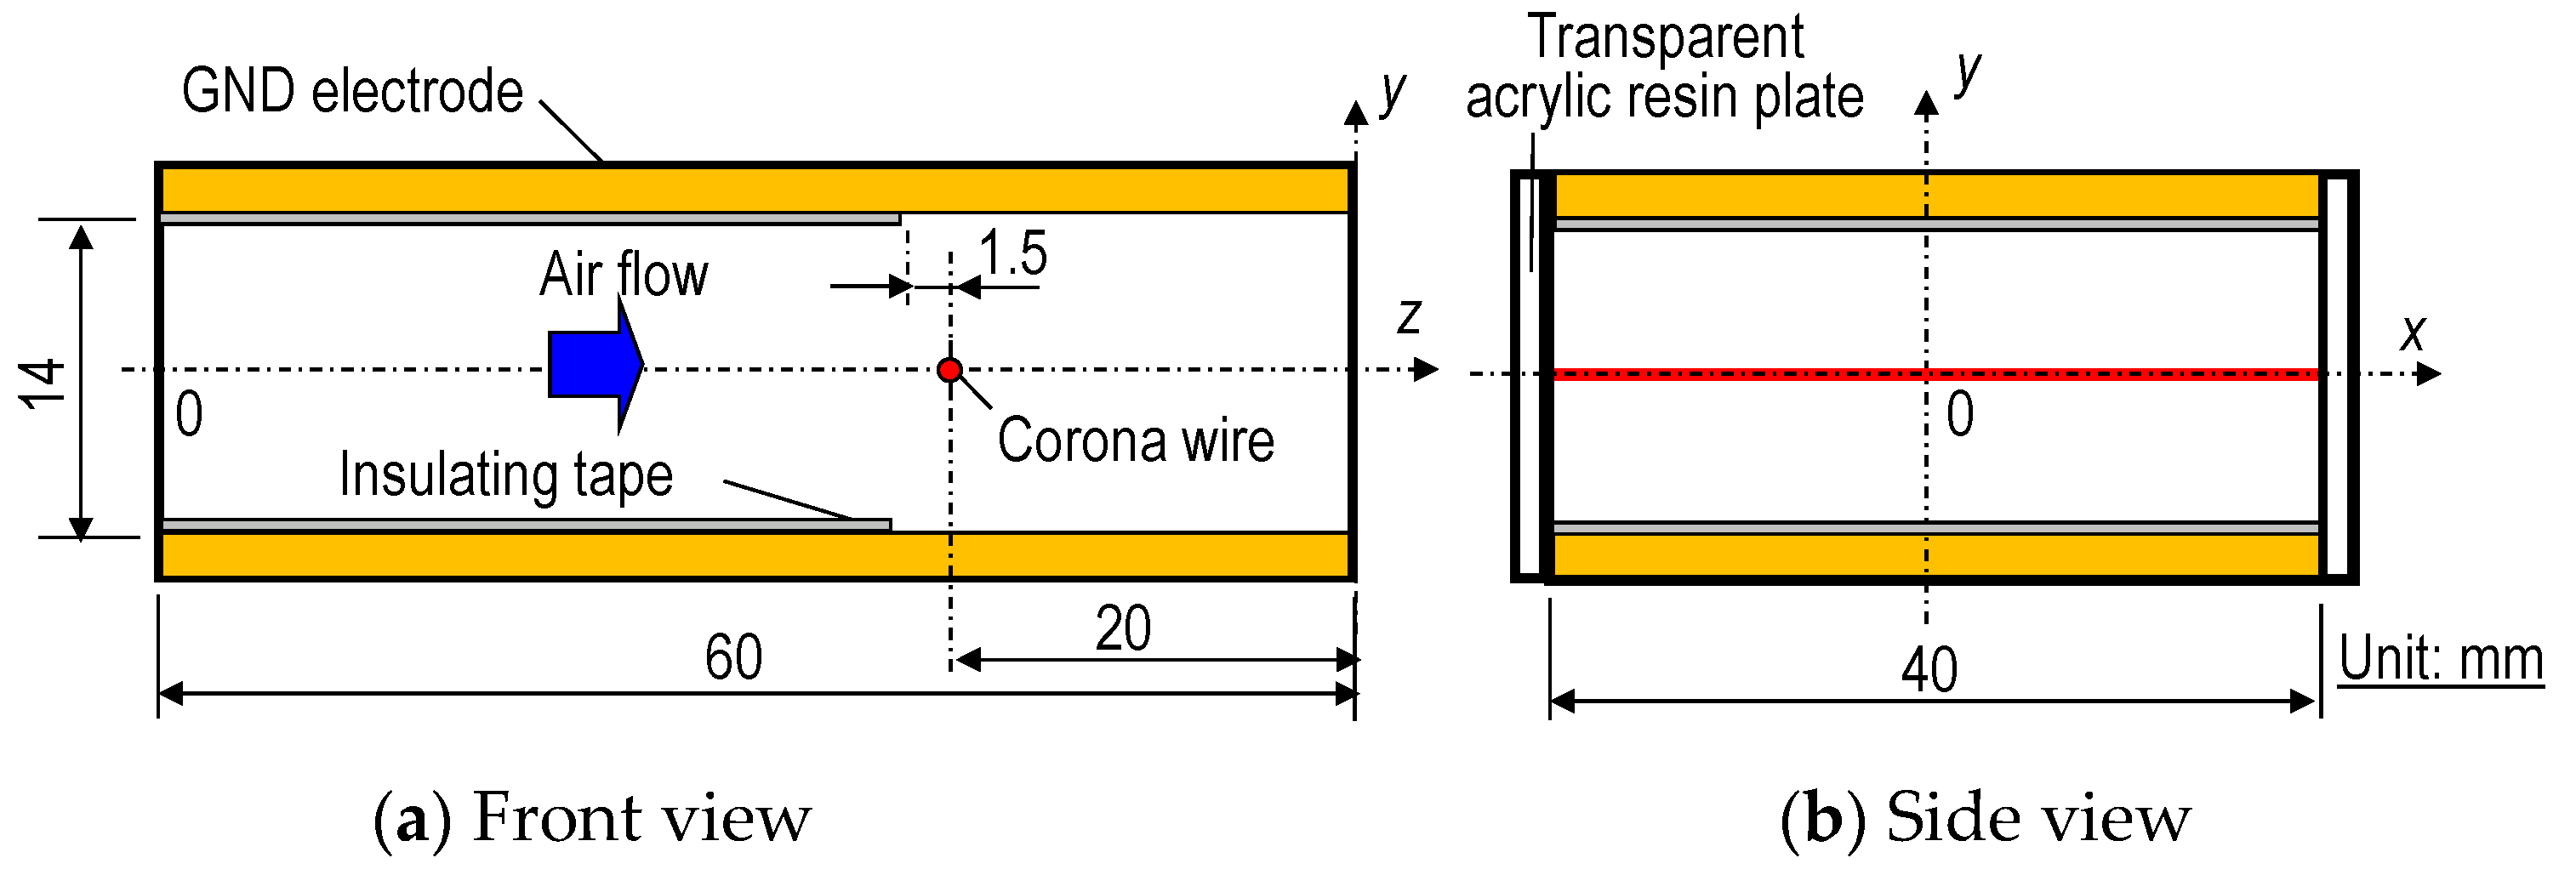
Figure 2 shows the detailed configurations of the wire-partially insulated parallel plate electrode type EHD fan used in this study. The flow channel was rectangular. with 60 mm length, 14 mm height and 40 mm width. The hydraulic diameter of the cross section of the flow channel,
dh corresponded to 20.74 mm. Two brass GND electrode plates were placed above and below the wire electrode as part of the flow channel. The side wall of the flow channel was made of transparent acrylic resin. A 0.1 mm diameter wire electrode, made of stainless steel, was placed at the center of the flow channel parallel to the GND electrodes. In order to induce the net unidirectional air flow, part of the GND electrodes was covered by 0.12 mm thick insulating polyester tape at the location shown in
Figure 2.
2.2. Visualization and PIV Analysis Experiments
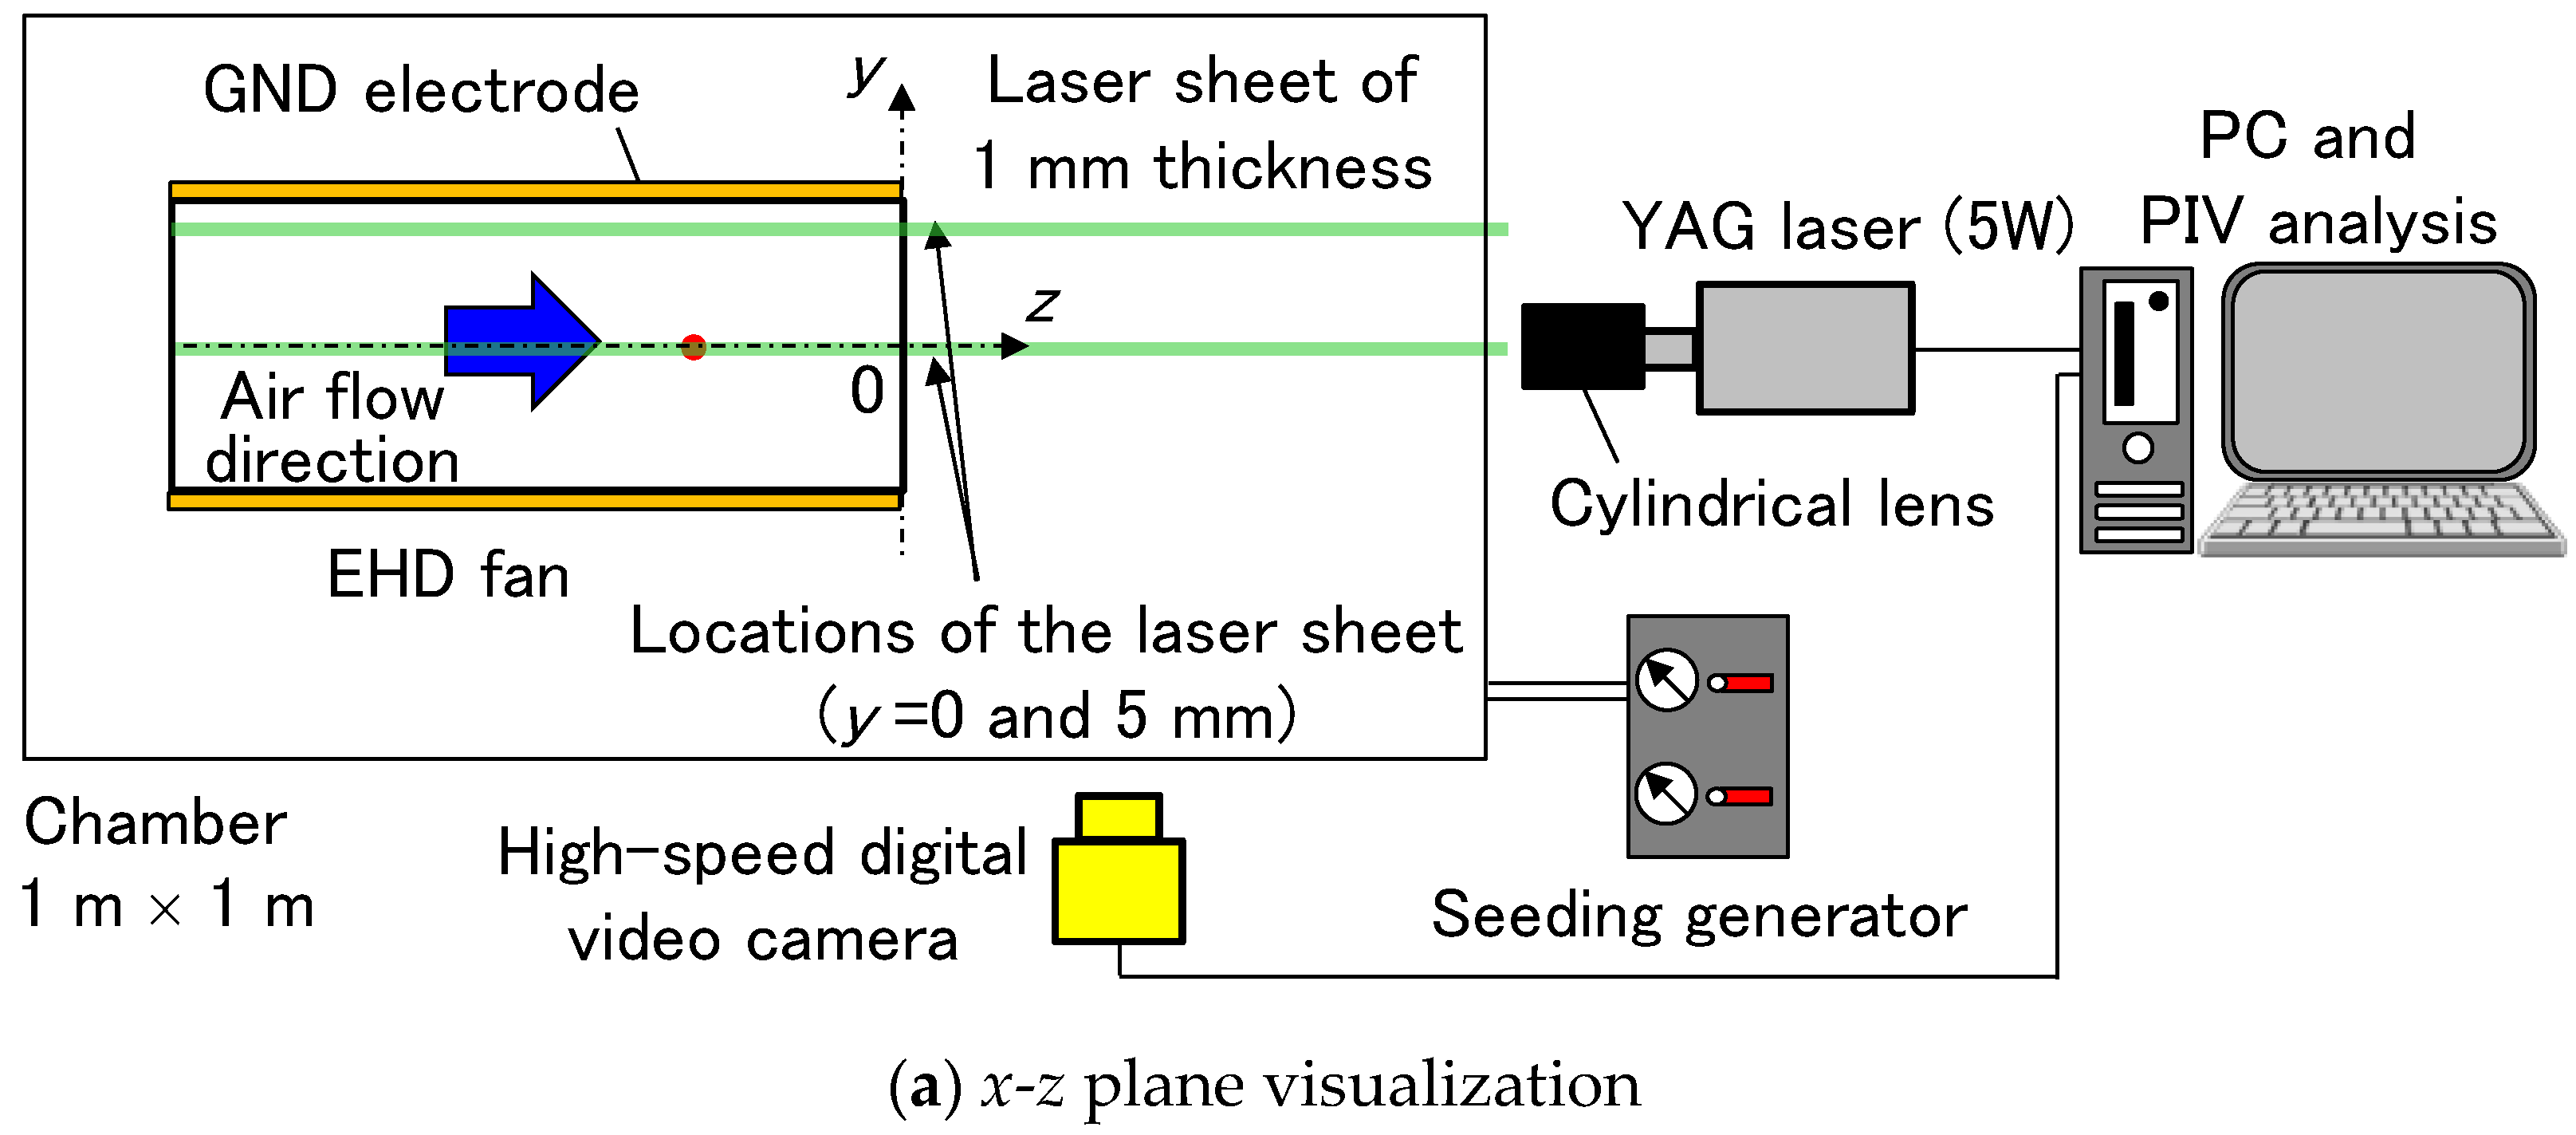
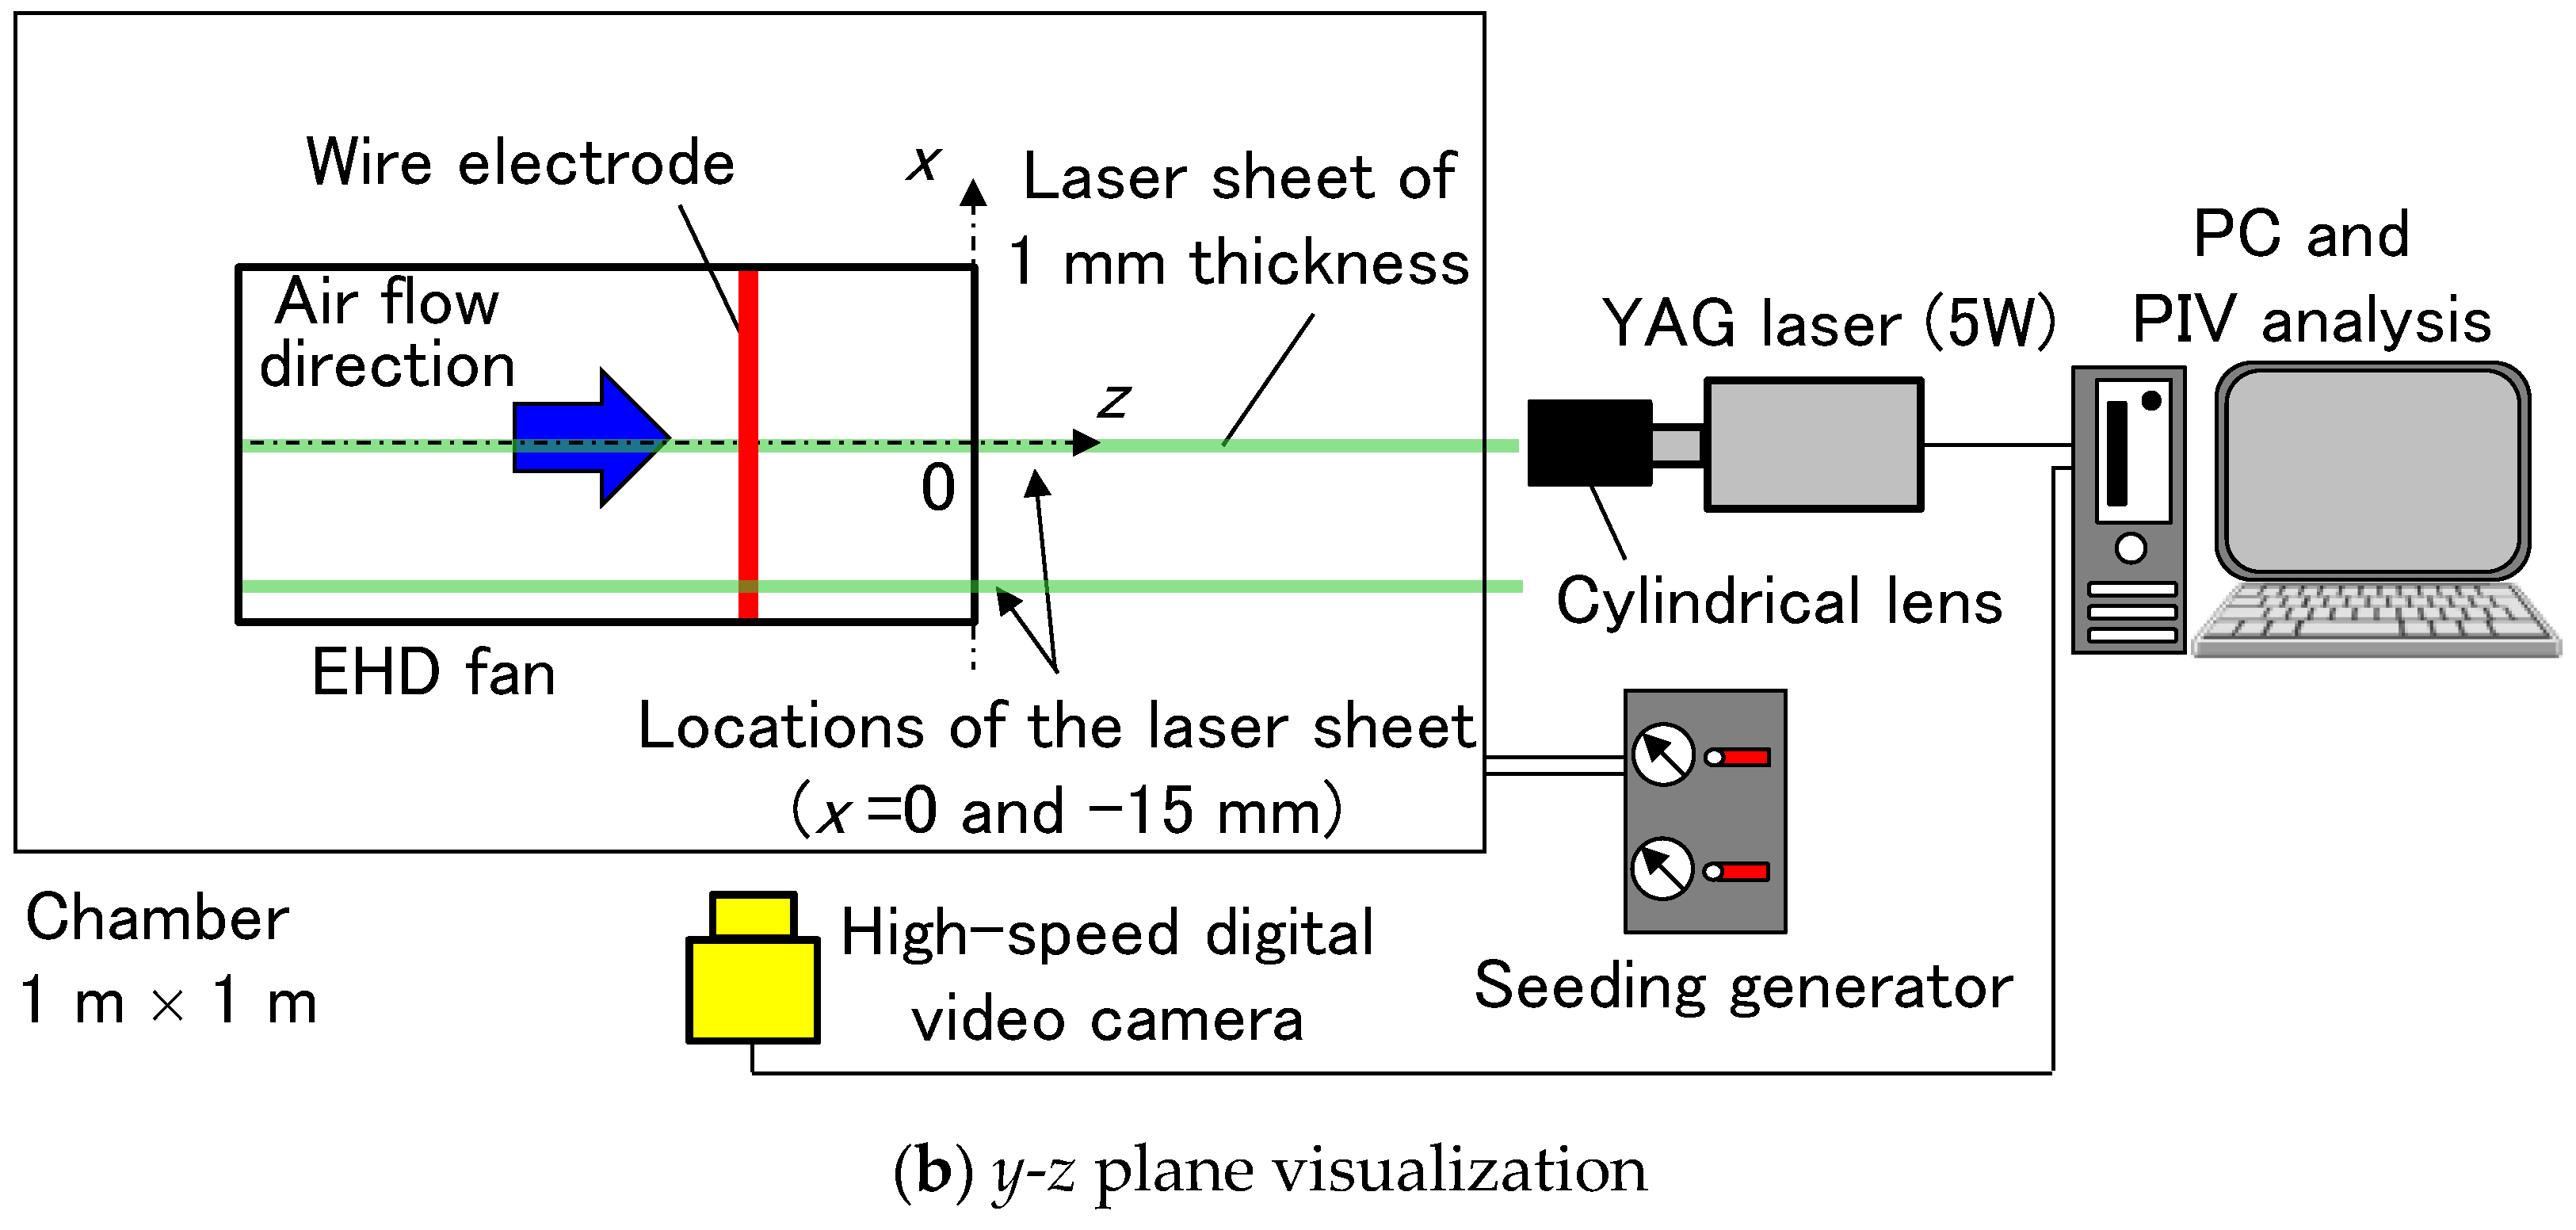
In this study, visualizations of the flow fields in the channel and downstream near the exit area were performed, as shown in
Figure 3. The arrangement consisted of a YAG laser (Seika Digital Image, CDY-5000-A, Bunkyo-ku, Tokyo, Japan) and a high-speed digital video camera (Photron, Nova S9, Bunkyo-ku, Tokyo, Japan). The wavelength of the laser was 532 nm and the size of the laser sheet was 1 mm in thickness. The high-speed video camera was operated at 9000 Hz with 1024 × 1024 pixel resolution. In the experiment, once the EHD fan was in operation, the laser sheet was radiated horizontally, or perpendicularly, to the wire and GND electrodes in the flow channel and near the exit area. Then, oil mist, generated by a seeding generator (Seika Digital Image, CTS-1000, Bunkyo-ku, Tokyo, Japan) as tracer particles with an average diameter of 4 μm, as is generally used for flow visualization, was supplied to the chamber in which the EHD fan was placed. The oil mist was naturally sucked to the inlet of the EHD fan under a steady state in order to obtain the visualized motion images. In addition, after obtaining visualization images, PIV analysis (Seika Digital Image, Koncerto II, Bunkyo-ku, Tokyo, Japan) was conducted by using 5 × 10
3 pairs of the photographs in 111 μs intervals in order to obtain the two-dimensional air flow velocity profiles at 7 and 9 kV for the EHD fan.
3. Experimental Results and Discussions
3.1. The EHD Fan Characteristics
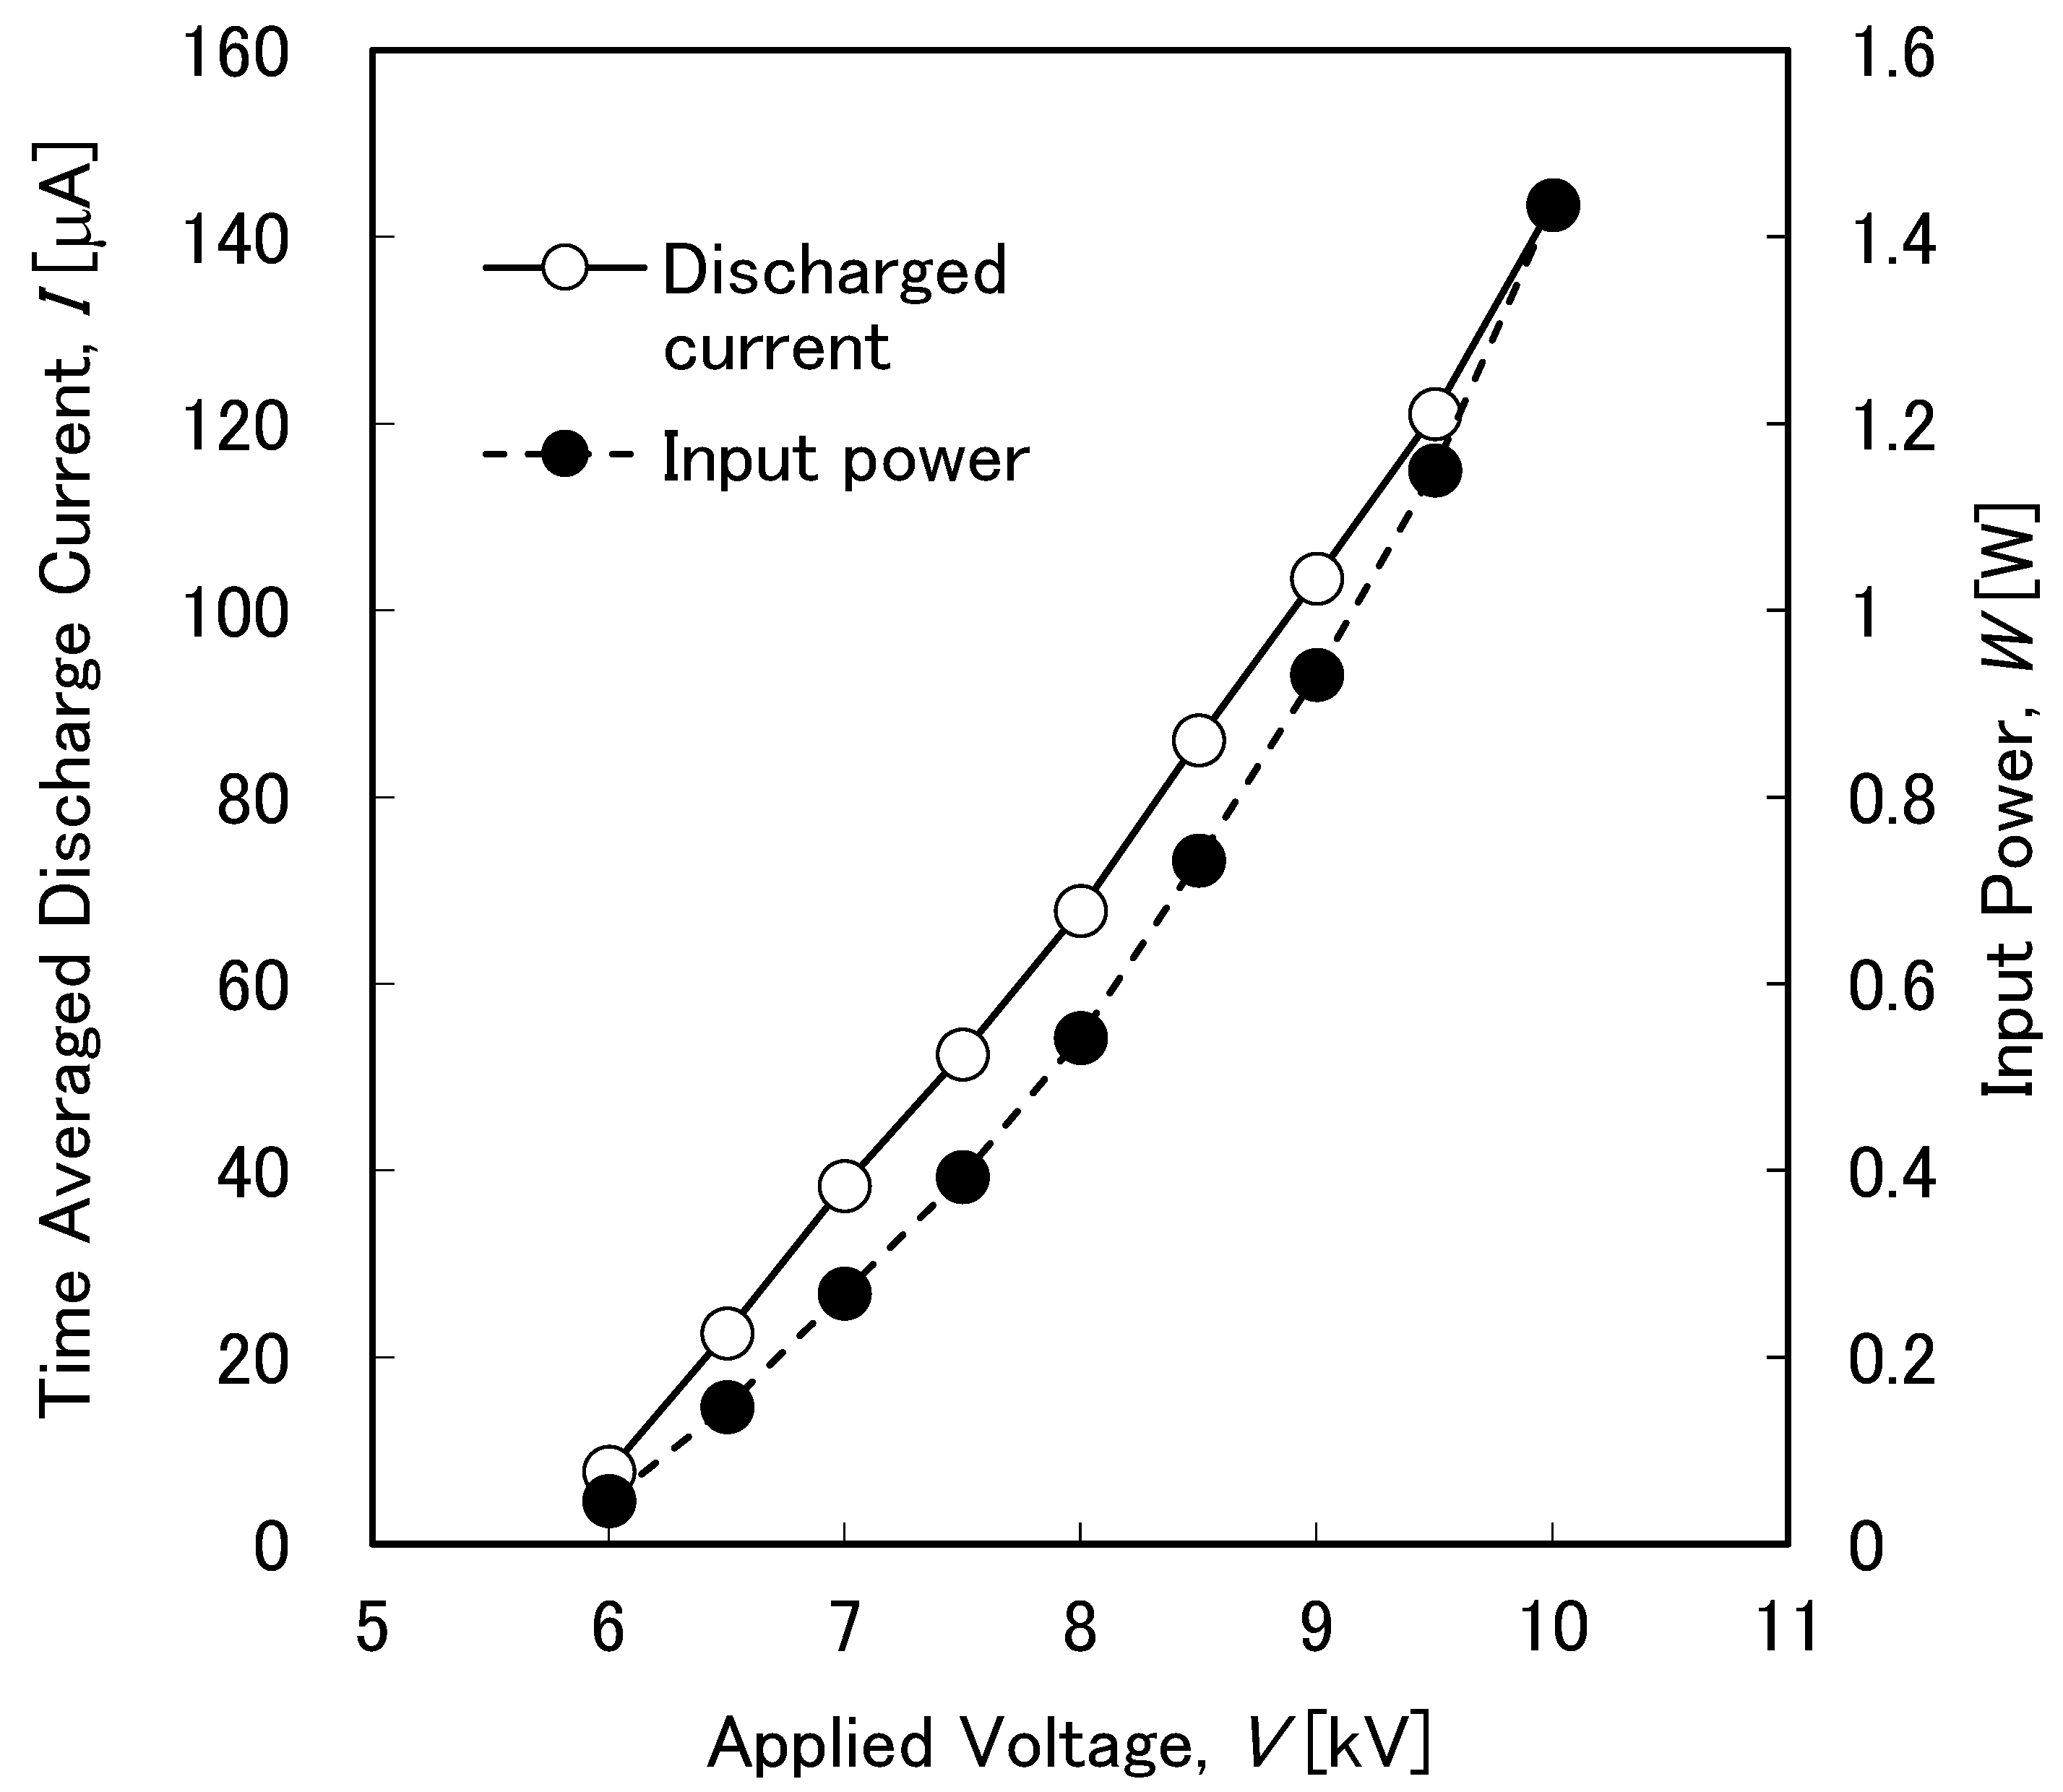
The time-averaged discharge current,
I, and input power,
W, as a function of the positive applied voltage,
V, for the wire-partially insulated parallel plate electrode type EHD fan are shown in
Figure 4. Basically, the time-averaged discharge current quadratically increased with increasing applied voltage. The maximum time-averaged discharge current and input power before onset of the spark discharge reached 144 μA at 10 kV, which was at 1.44 W. A glow corona discharge was observed for all positive applied voltages.
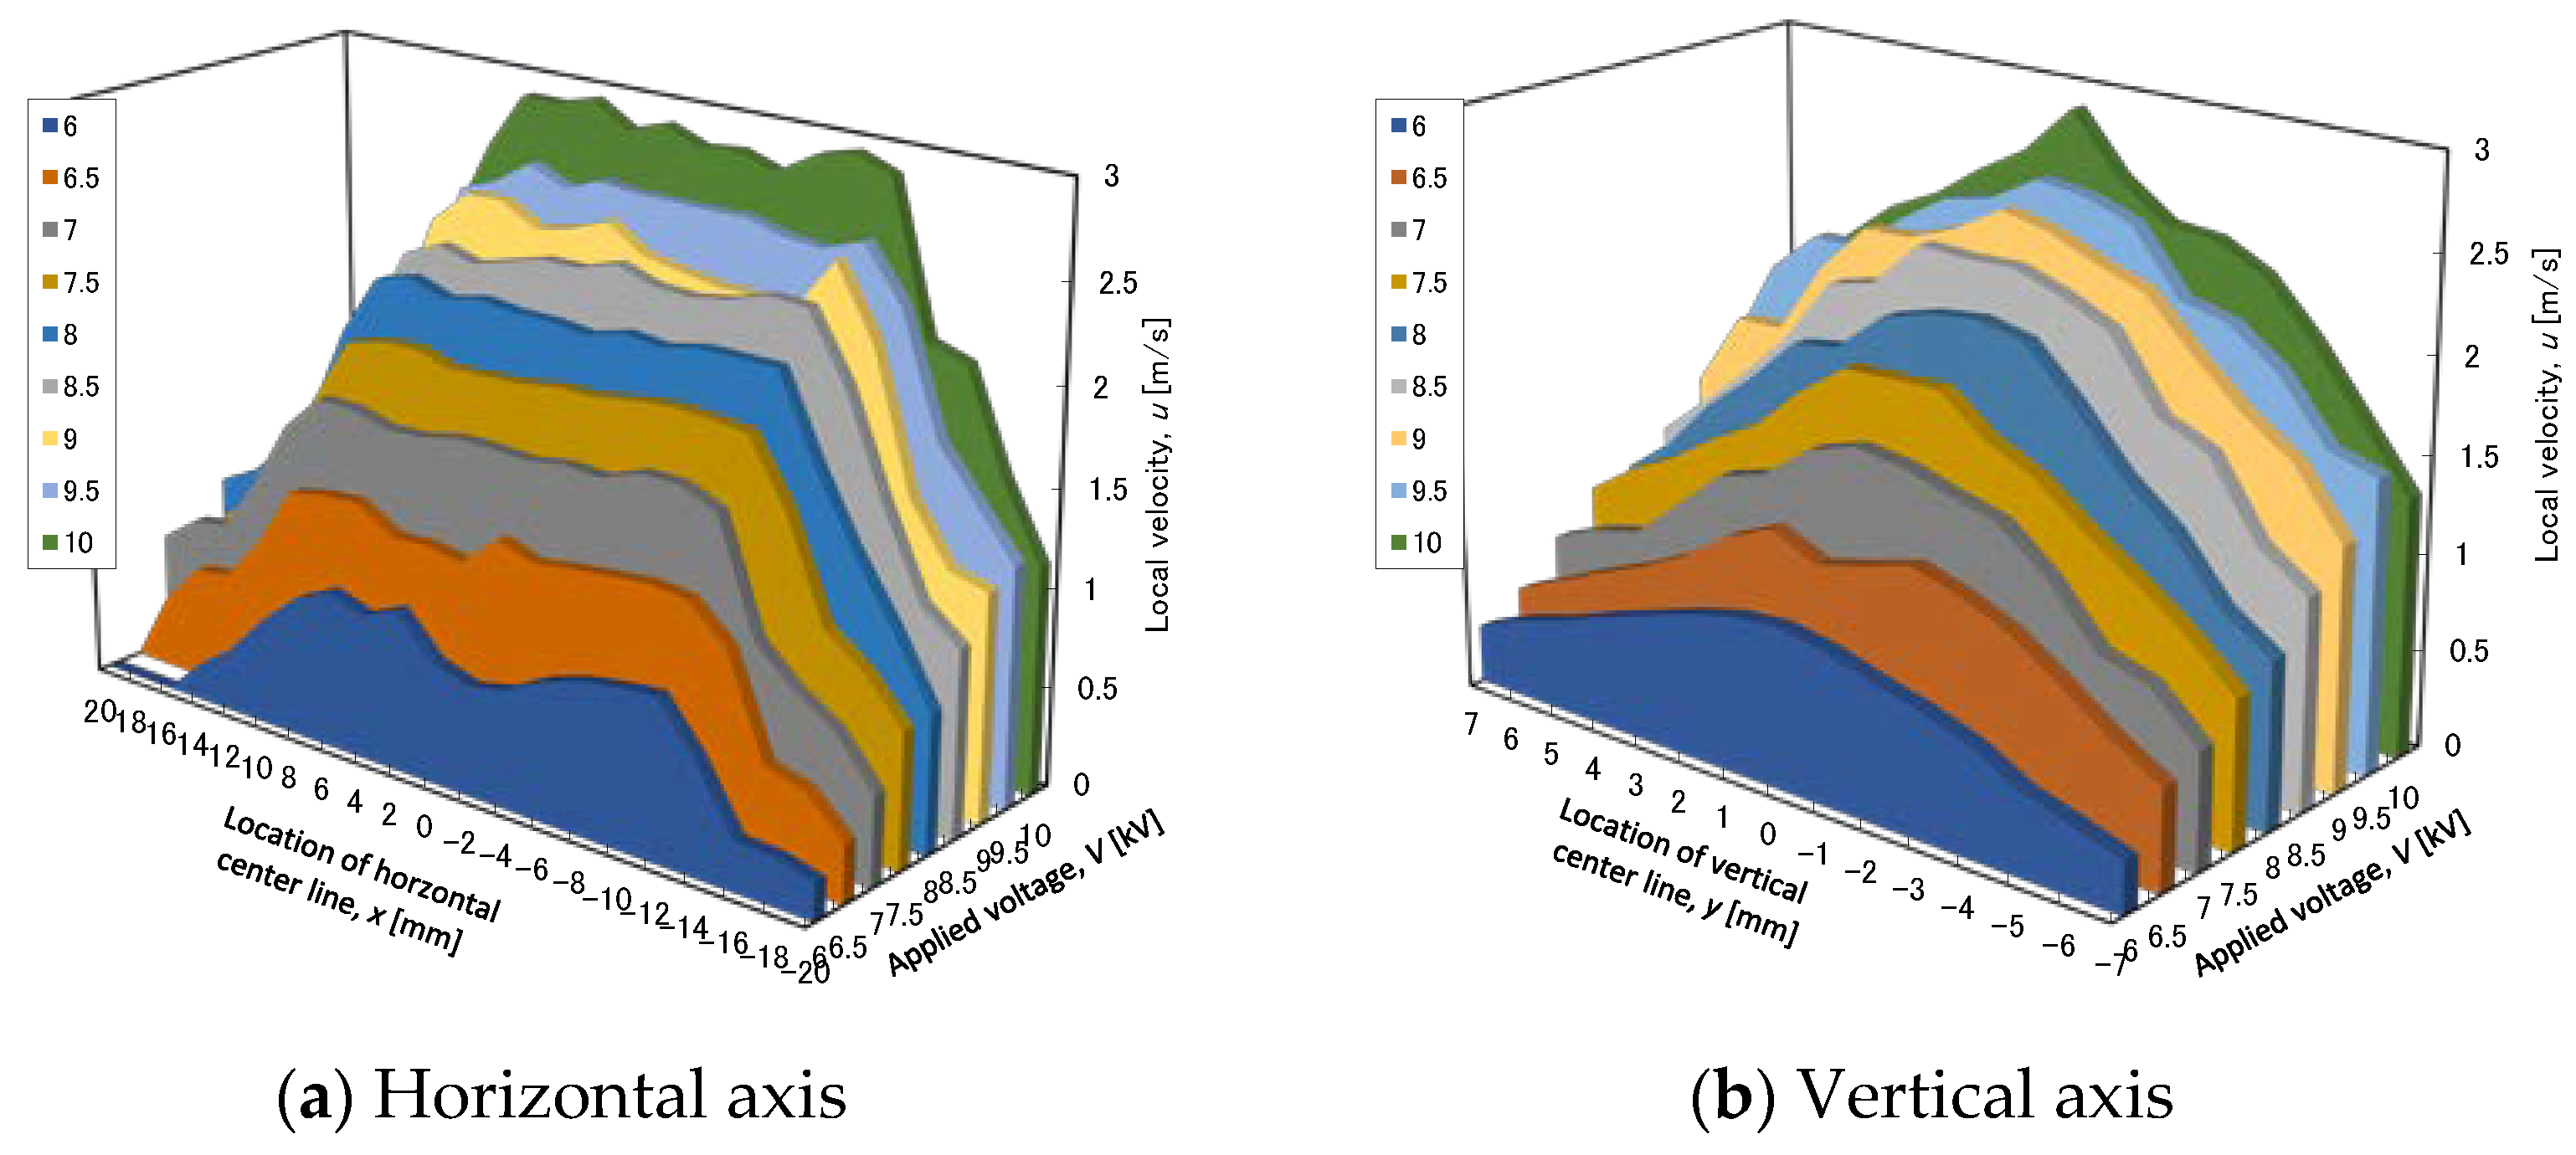
Figure 5a,b provides the experimental results of the velocity profiles for the horizontal and vertical axes of the flow channel at the exit area (
z = 10 mm), respectively. In these figures, the axis refers to the measuring point,
x or
y, positive applied voltage,
V, and local air velocity,
u, respectively. Air flows at the exit area were initiated when the applied voltage was at the onset of corona discharge or slightly higher. The local air velocities on the horizontal and vertical axes at the exit area sharply increased with increasing applied voltage to a maximum value of 2.95 m/s, when the applied voltage reached 10 kV for the wire electrode. While the air velocity profiles on the horizontal axis were relatively uniform in velocity profile, such as the partially turbulent flow in the area between
x = −10 mm and
x = 10 mm, the air velocity profiles on the vertical axis approximated a parabolic profile. Here, the range of the Reynolds numbers (=
Uave ×
dh/
ν) was between 7.25 × 10
2 and 3.07 × 10
3 for the applied voltages, where
Uave is the average velocity at the exit area,
dh is the hydraulic diameter and
ν is the kinematic viscosity of air.
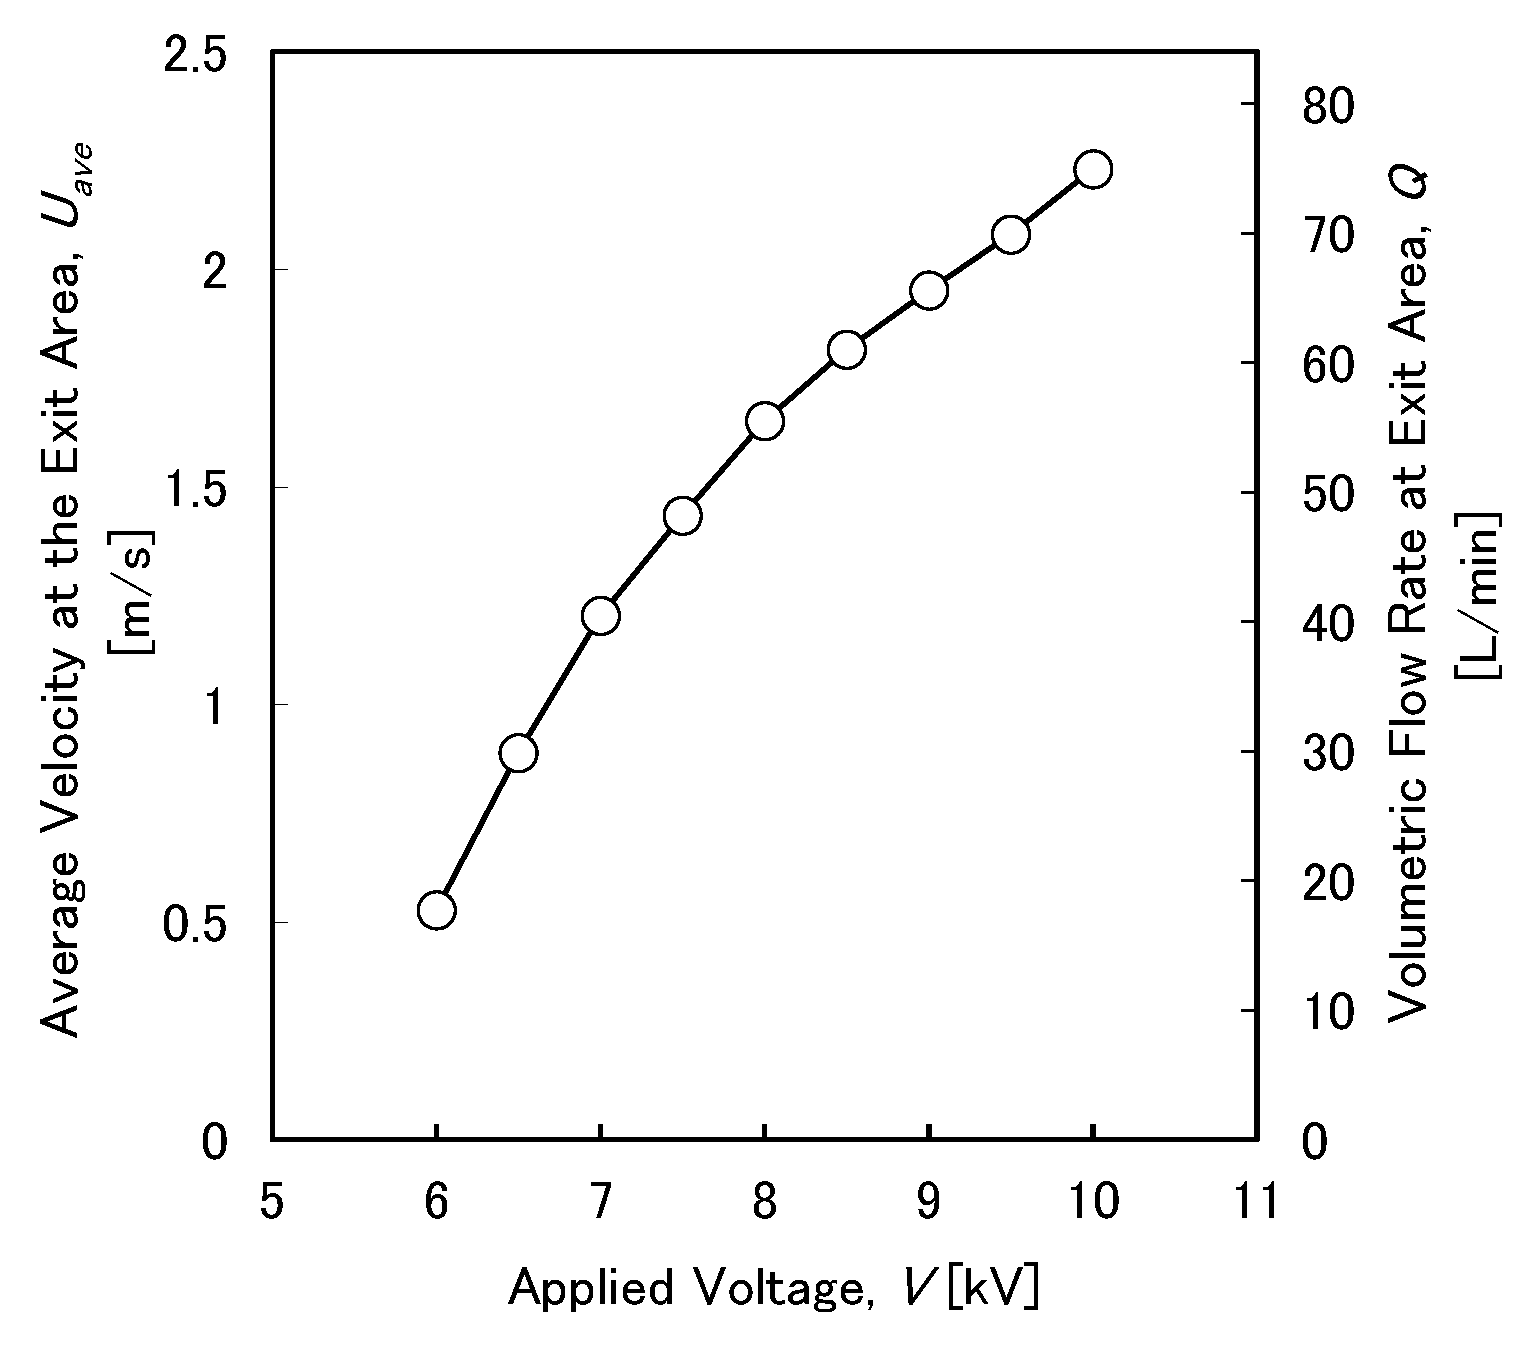
Figure 6 shows the experimental results of the average velocity,
Uave, and the corresponding volumetric flow rate,
Q, at the exit area as a function of the positive applied voltage,
V, for the EHD fan. The volumetric flow rate was determined by multiplying the average velocity and the flow channel cross-sectional area. Although the average velocity and volumetric flow rate sharply increased with increasing applied voltage, the increase gradually became lower under higher applied voltage. The maximum values of average velocity and volumetric flow rate achieved 2.23 m/s and 75.0 l/min at 10 kV, which was equivalent to 1.44 W.
Figure 7 shows the transport efficiency,
ηt, as a function of the applied voltage,
V, for the EHD fan. To evaluate the fan’s performance, transport efficiency was employed, which is defined as the amount of air delivered per unit of input electric power used [
23,
26,
27]. Liter per second per watt l/s/W or liter per joule l/J is generally used for the unit of this parameter. The transport efficiency rapidly decreased with increasing applied voltage. The maximum value was 6.27 l/s/W at 6 kV for the EHD fan. In order to assess the validity of the magnitudes for this parameter, the transport efficiency of the EHD fan was compared with other types of EHD fans and conventional fans [
23,
26]. It was noted that, depending on the applied voltage, the value was almost similar to other types of EHD fans, and was at the same level as, or at a level better than, those of current conventional fans used in personal computers, which had values from 1.79 l/s/W to 3.67 l/s/W [
28].
3.2. Flow Visualization and PIV Analysis
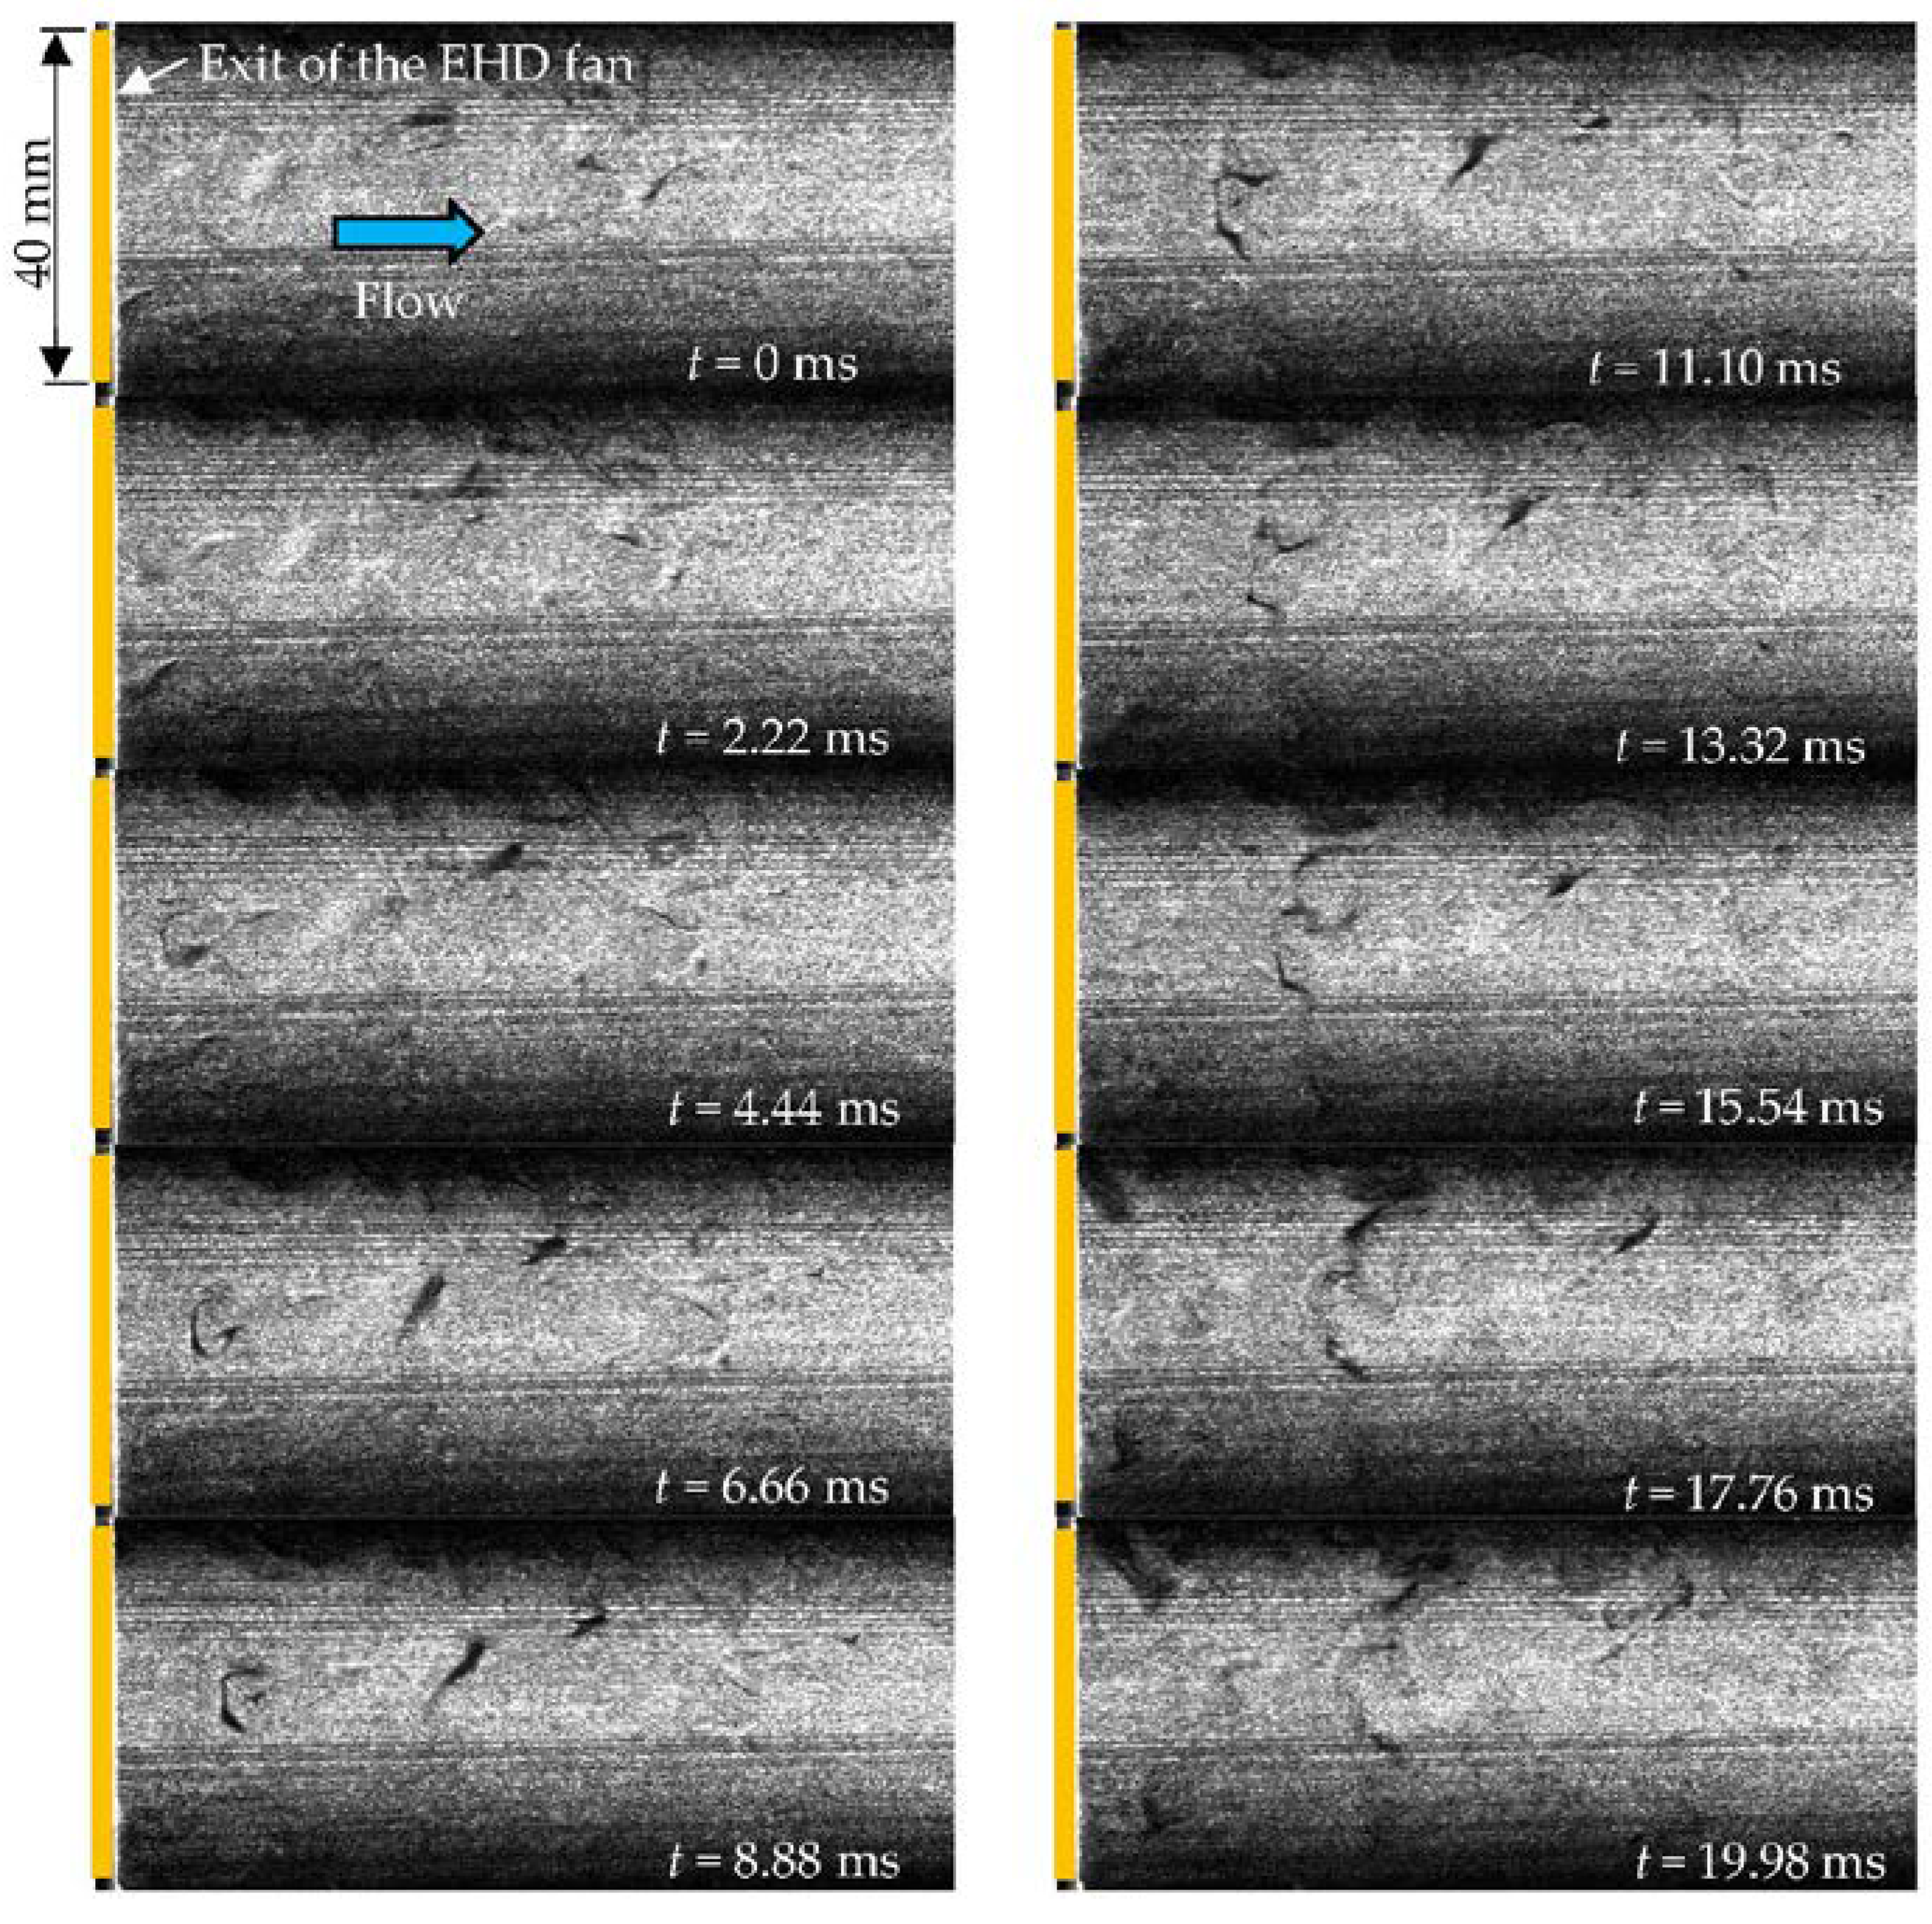
Figure 8 provides photographs of the
x-
z plane (
y = 0 mm) in the downstream area of the flow channel exit of the EHD fan at an applied voltage of 9.0 kV for each 2.22 ms interval from 0 ms to 19.98 ms. The Reynolds number of the flow was 2.68 × 10
3. It can be observed from the photographs that the air which drained from the exit of the EHD fan basically flowed in a one-way direction from left to right. There is no large vortex motion in the images.
Figure 9 provides photographs of the
y-
z plane (
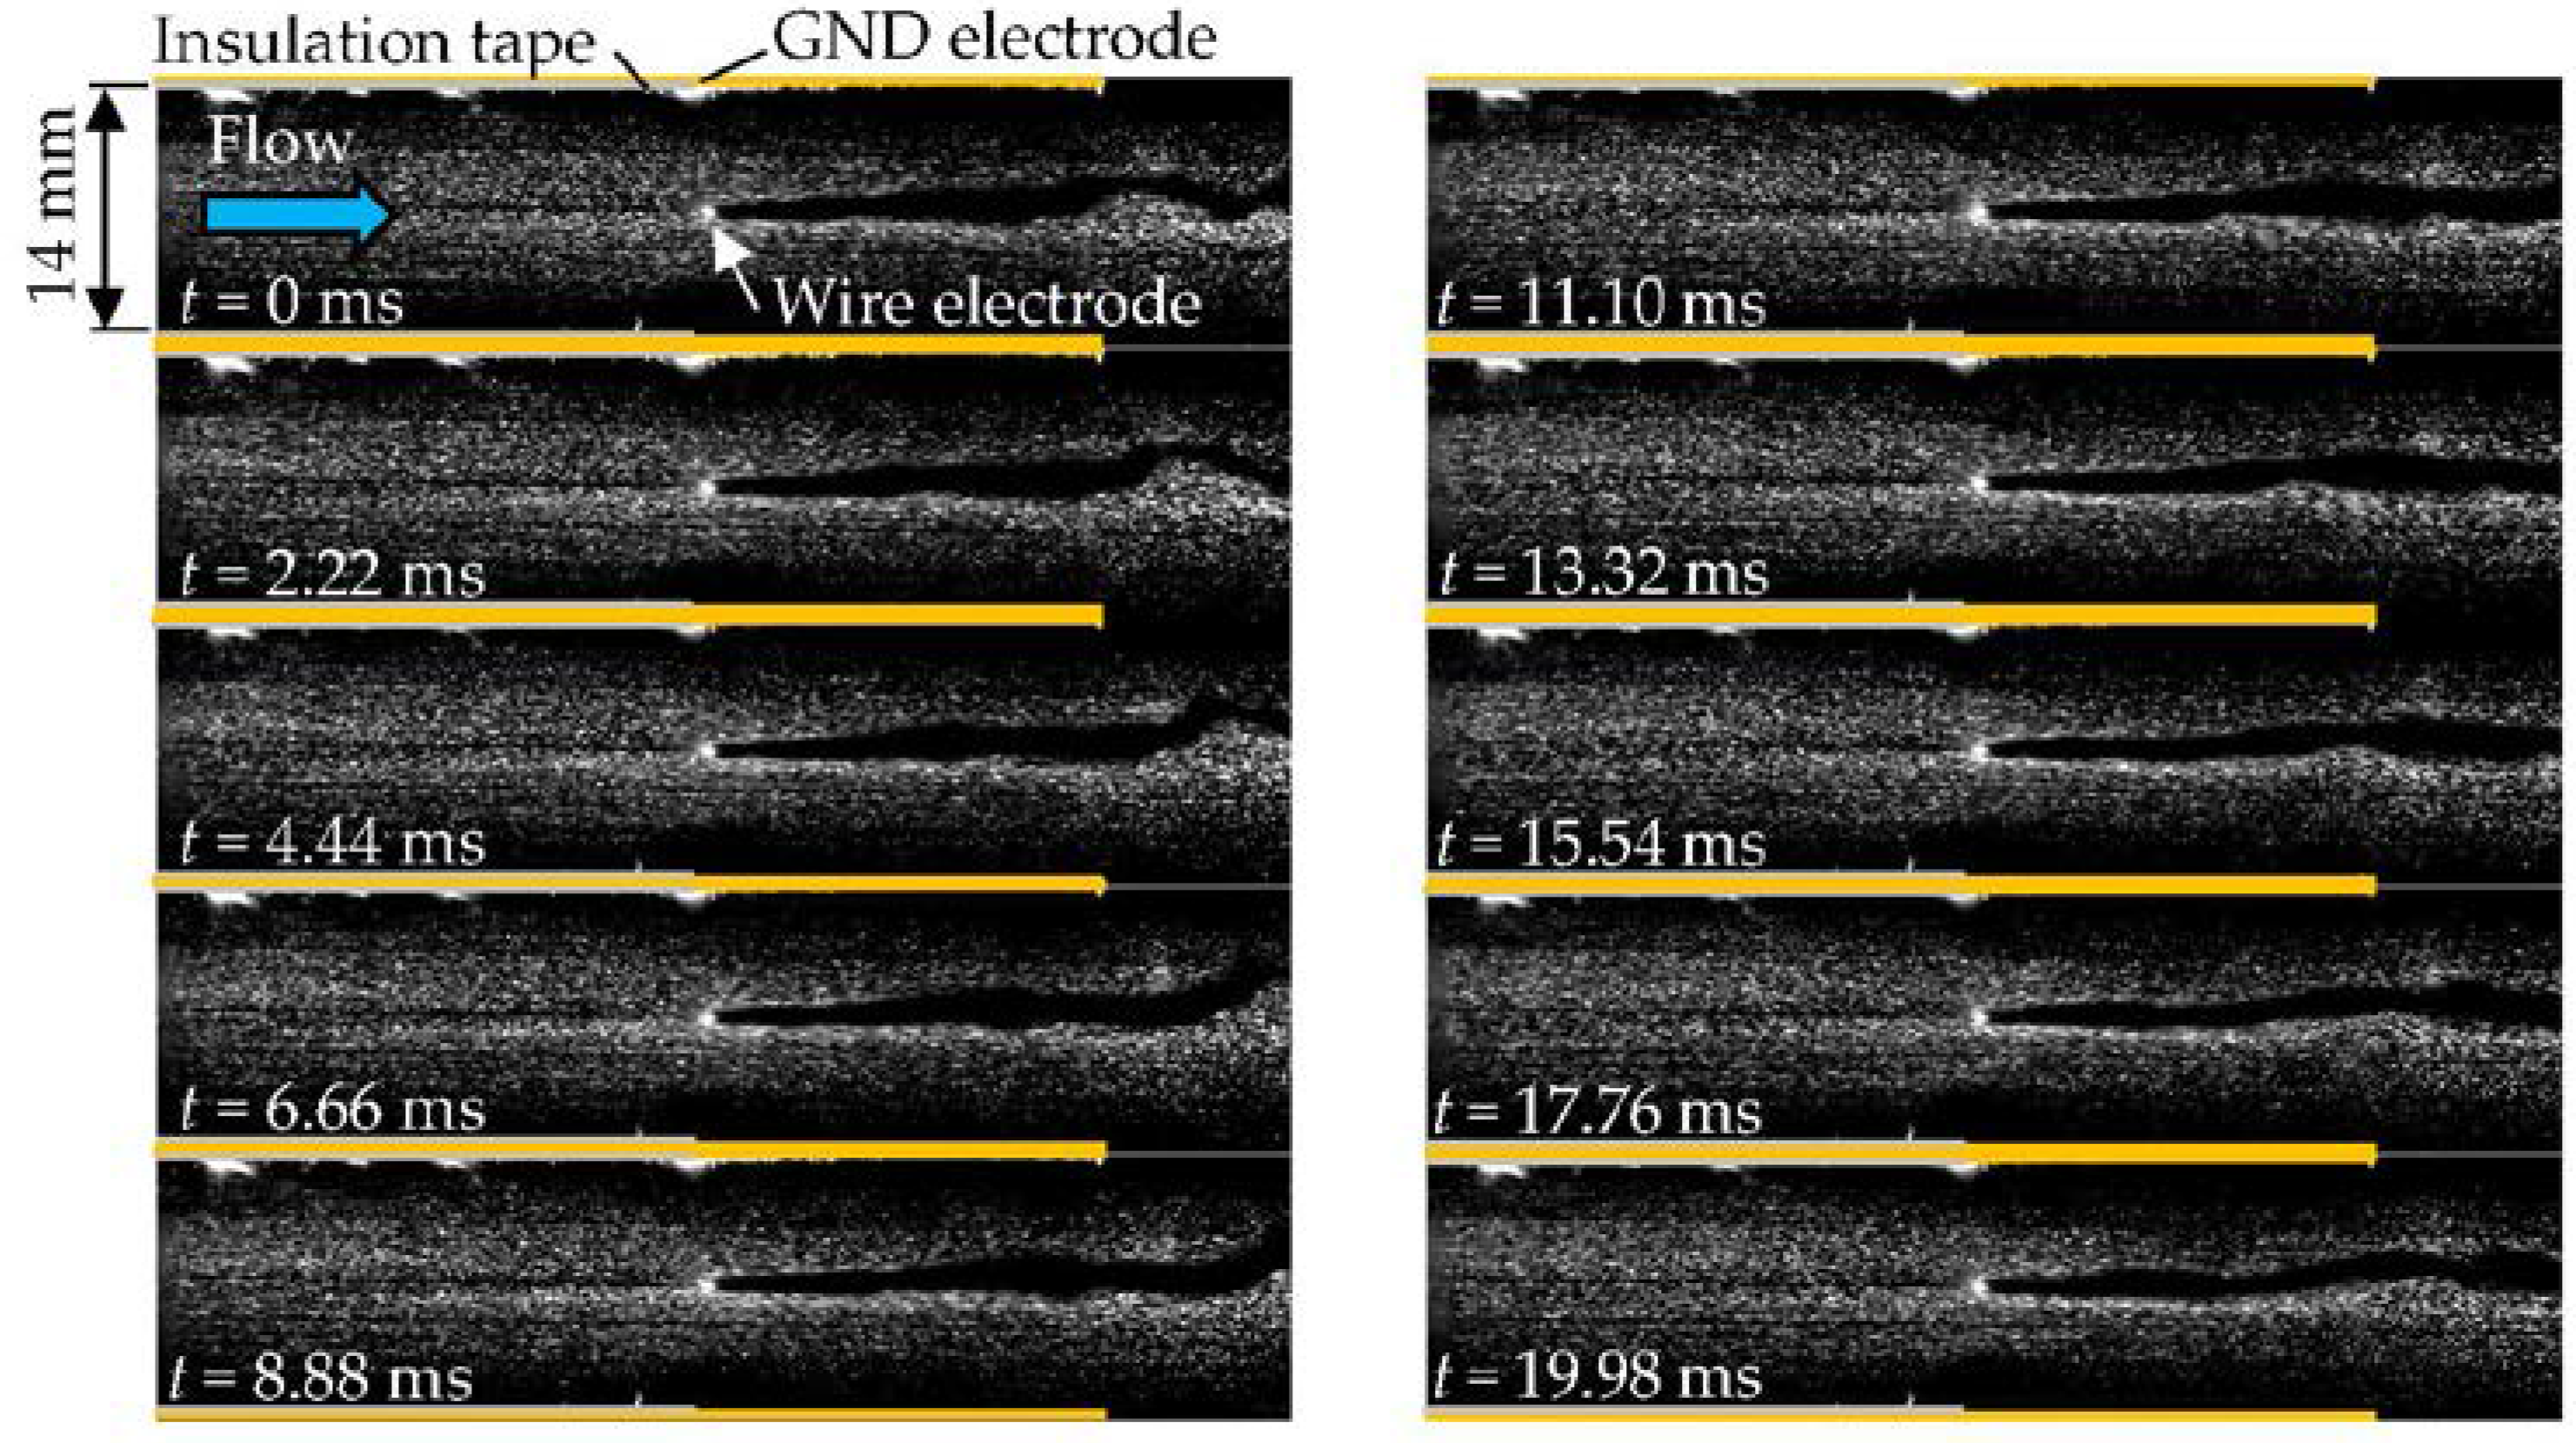
x = 0 mm) in the inside flow channel and the downstream area of the flow channel exit of the EHD fan at an applied voltage of 9.0 kV for each 2.22 ms interval from 0 ms to 19.98 ms. It was observed that there was an area having no oil mist downstream of the wire electrode in the experiments. Although the reason is not clear at present, it may be that oil mists take an electrical charge and move upward and downward simultaneously. Even if the oil mists flowed more to the downstream side, perhaps the oil mist charged to plus was continuously separated either upward or downward, and the separation was maintained due to the same polarity. This needs further investigation. In the upstream area of the wire electrode, the flow experienced little turbulence, as seen in the video from the high-speed camera. However, in the downstream area large-scale turbulence in the flow channel was observed as a wavy motion near the
z axis. The higher the applied voltage, the stronger the wavy motion observed in the experiments.
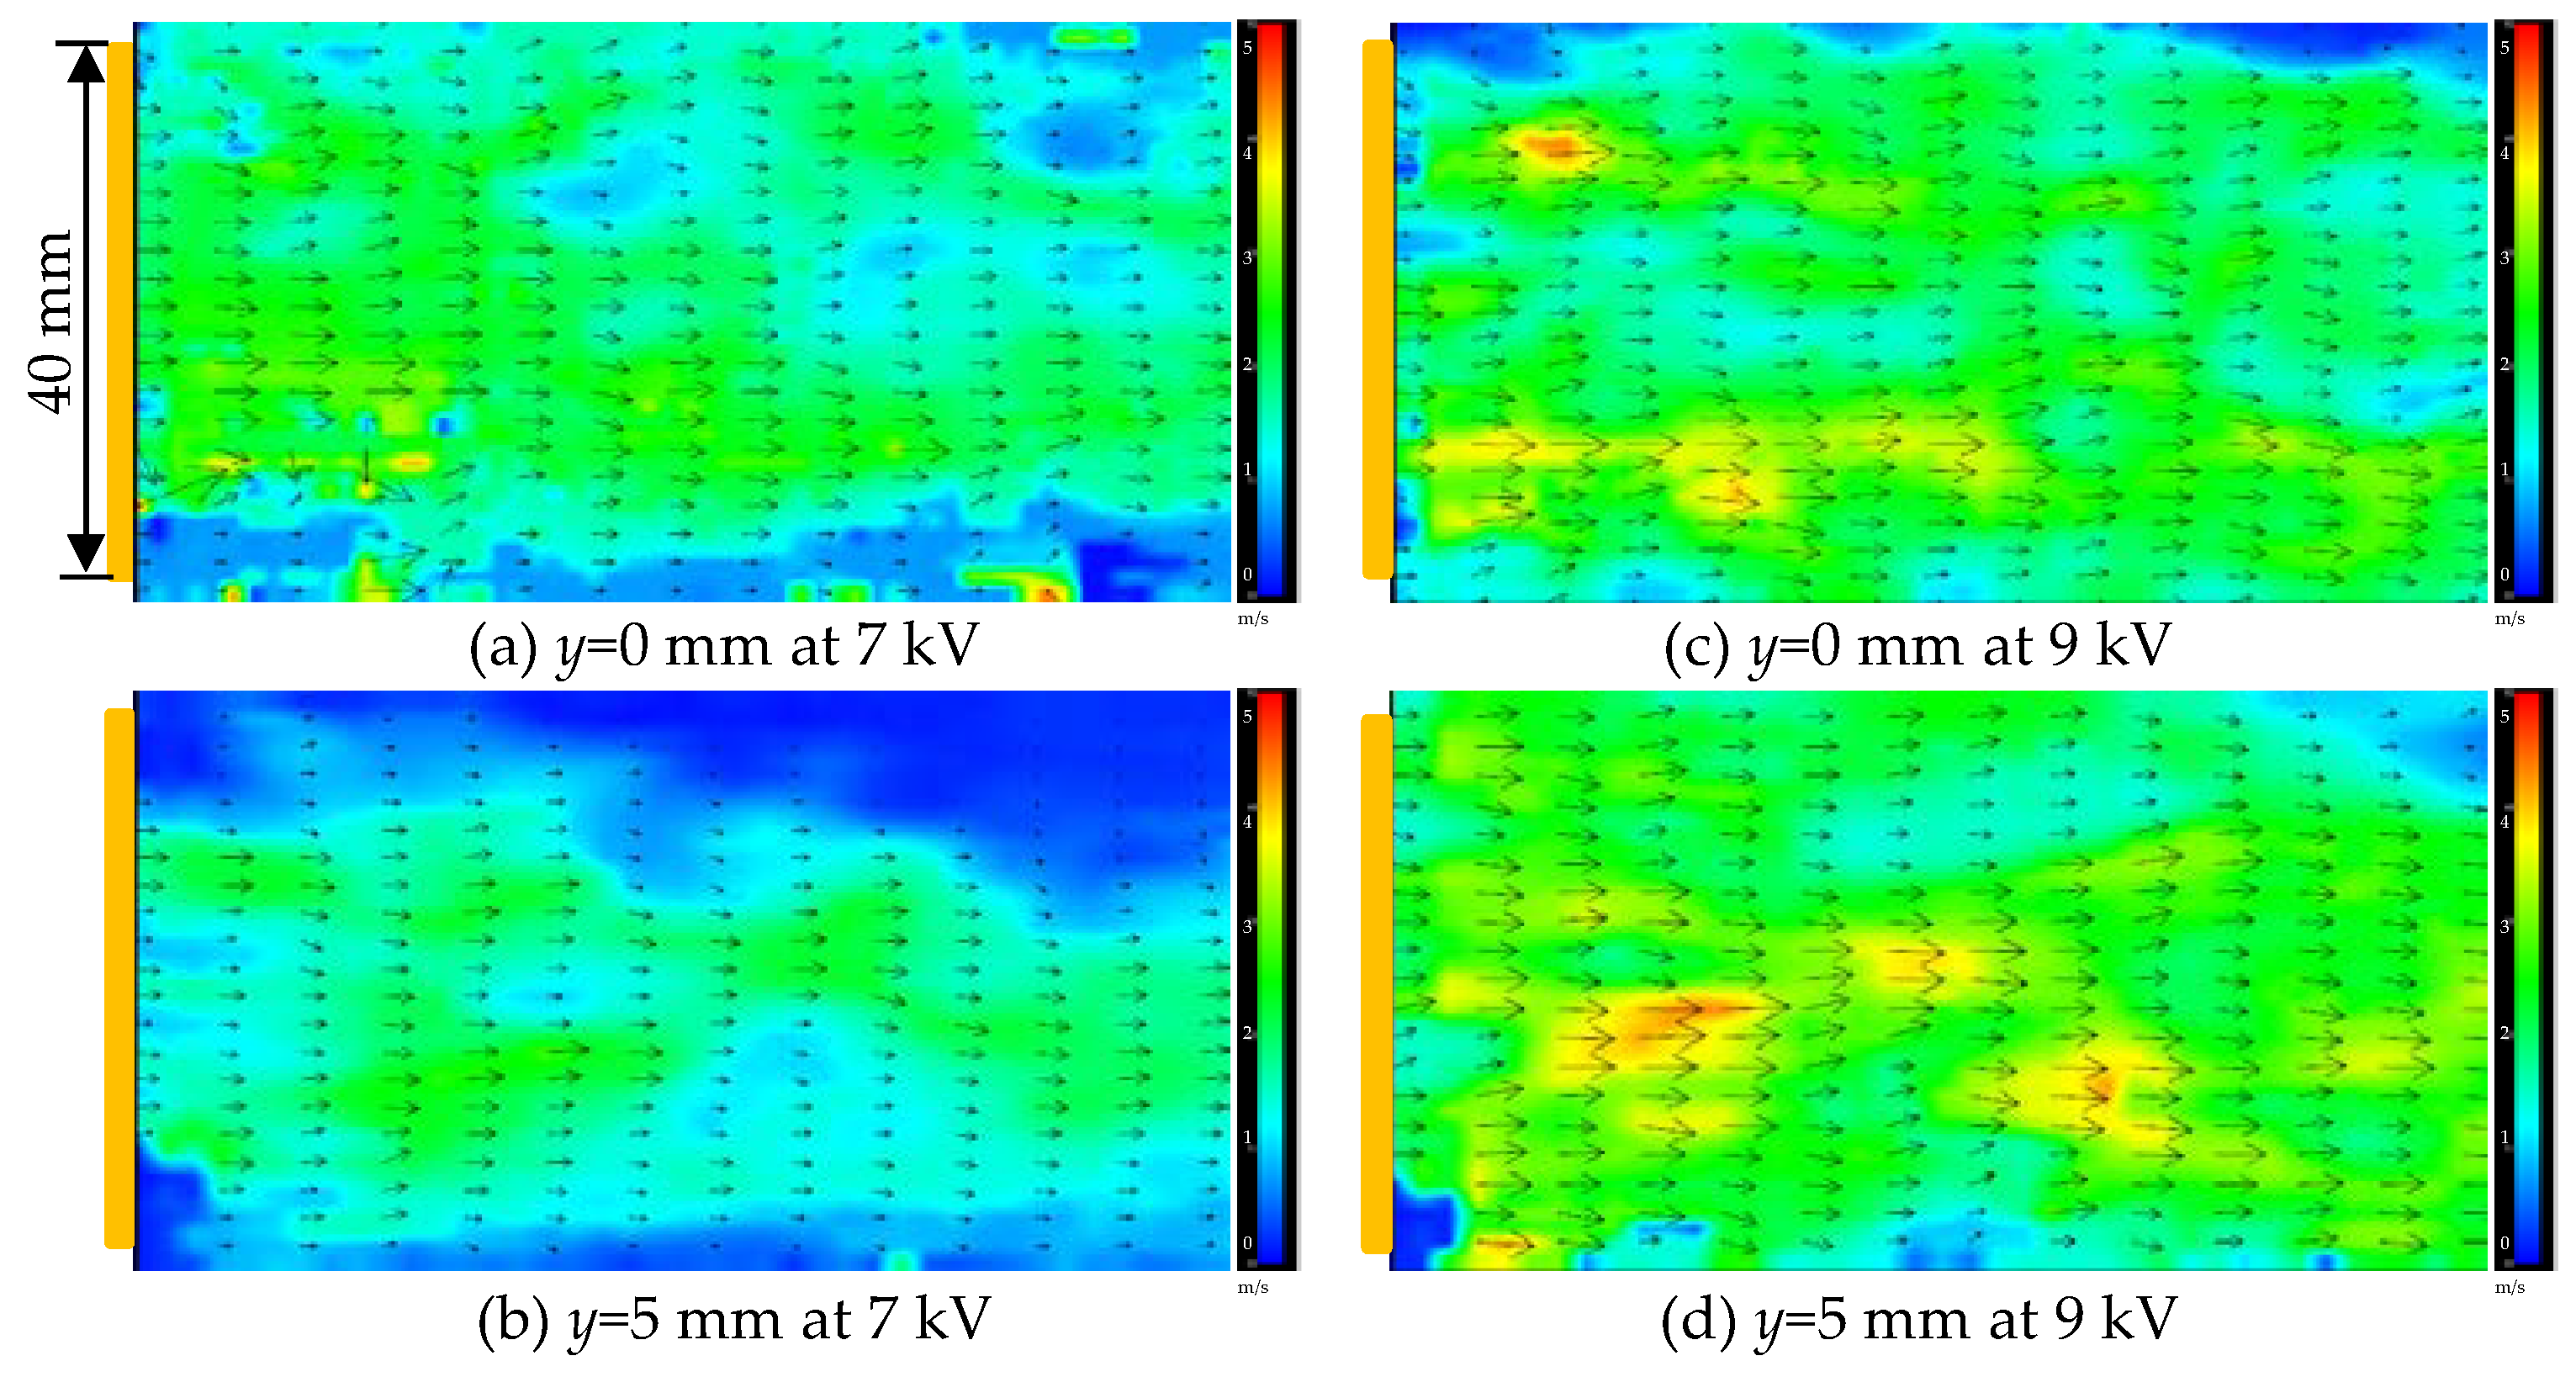
Figure 10a–d provides the instantaneous vector diagrams of the
x-
z planes at
y = 0 mm and 5 mm at different applied voltages of the EHD fan. In the case of the
x-
z plane at
y = 0 mm at 7 kV, the non-uniform velocity profile of the range between 0 m/s to 4 m/s was estimated by means of PIV analysis. This tendency was similarly observed in other locations and with other voltages. Basically, the higher the applied voltage, the higher the velocity vectors which appeared.
Figure 11a–d provides the instantaneous vector diagrams of the
y-
z planes at
x = 0 mm or −15 mm at different applied voltages of the EHD fan. In the case of the
y-
z plane at
x = 0 mm at 7 kV, uniform air velocities were experienced in the area between the left edge of the image and near the wire electrode. The flows at
x = 0 mm, as shown in
Figure 9, separated upward and downward at the wire electrode, and, then, the central flows accelerated toward the exit area. It should be noted that flow toward the non-insulated GND electrodes was only observed near the GND electrodes downstream of the wire electrode. This is because the ionized oil mist particles were attracted to each GND electrode, and then the particles separated into two lines that moved downstream together with the main flow. In the case of
x = −15 mm, regardless of the different applied voltages, the flow strongly separated to upward and downward directions from the wire electrode to GND electrodes. It is probable that these local velocity profiles with different tendencies occurred due to the three-dimensional flow in the channel and exit area of the wire-partially insulated parallel plate electrode type EHD fan.
Figure 12a–d shows the time-averaged local velocity profiles for only 1.21 s on the
x-
z plane and for the
x-
z plane in the flow channel and exit area. In the case of the
x-
z plane at 7 kV, a velocity profile having some difference at the
x axis location was observed. This tendency was basically similar to the case of 9 kV. In the case of the
y-
z plane, an increase in air flow velocity around the wire electrode was observed. This is considered to be the EHD effect.
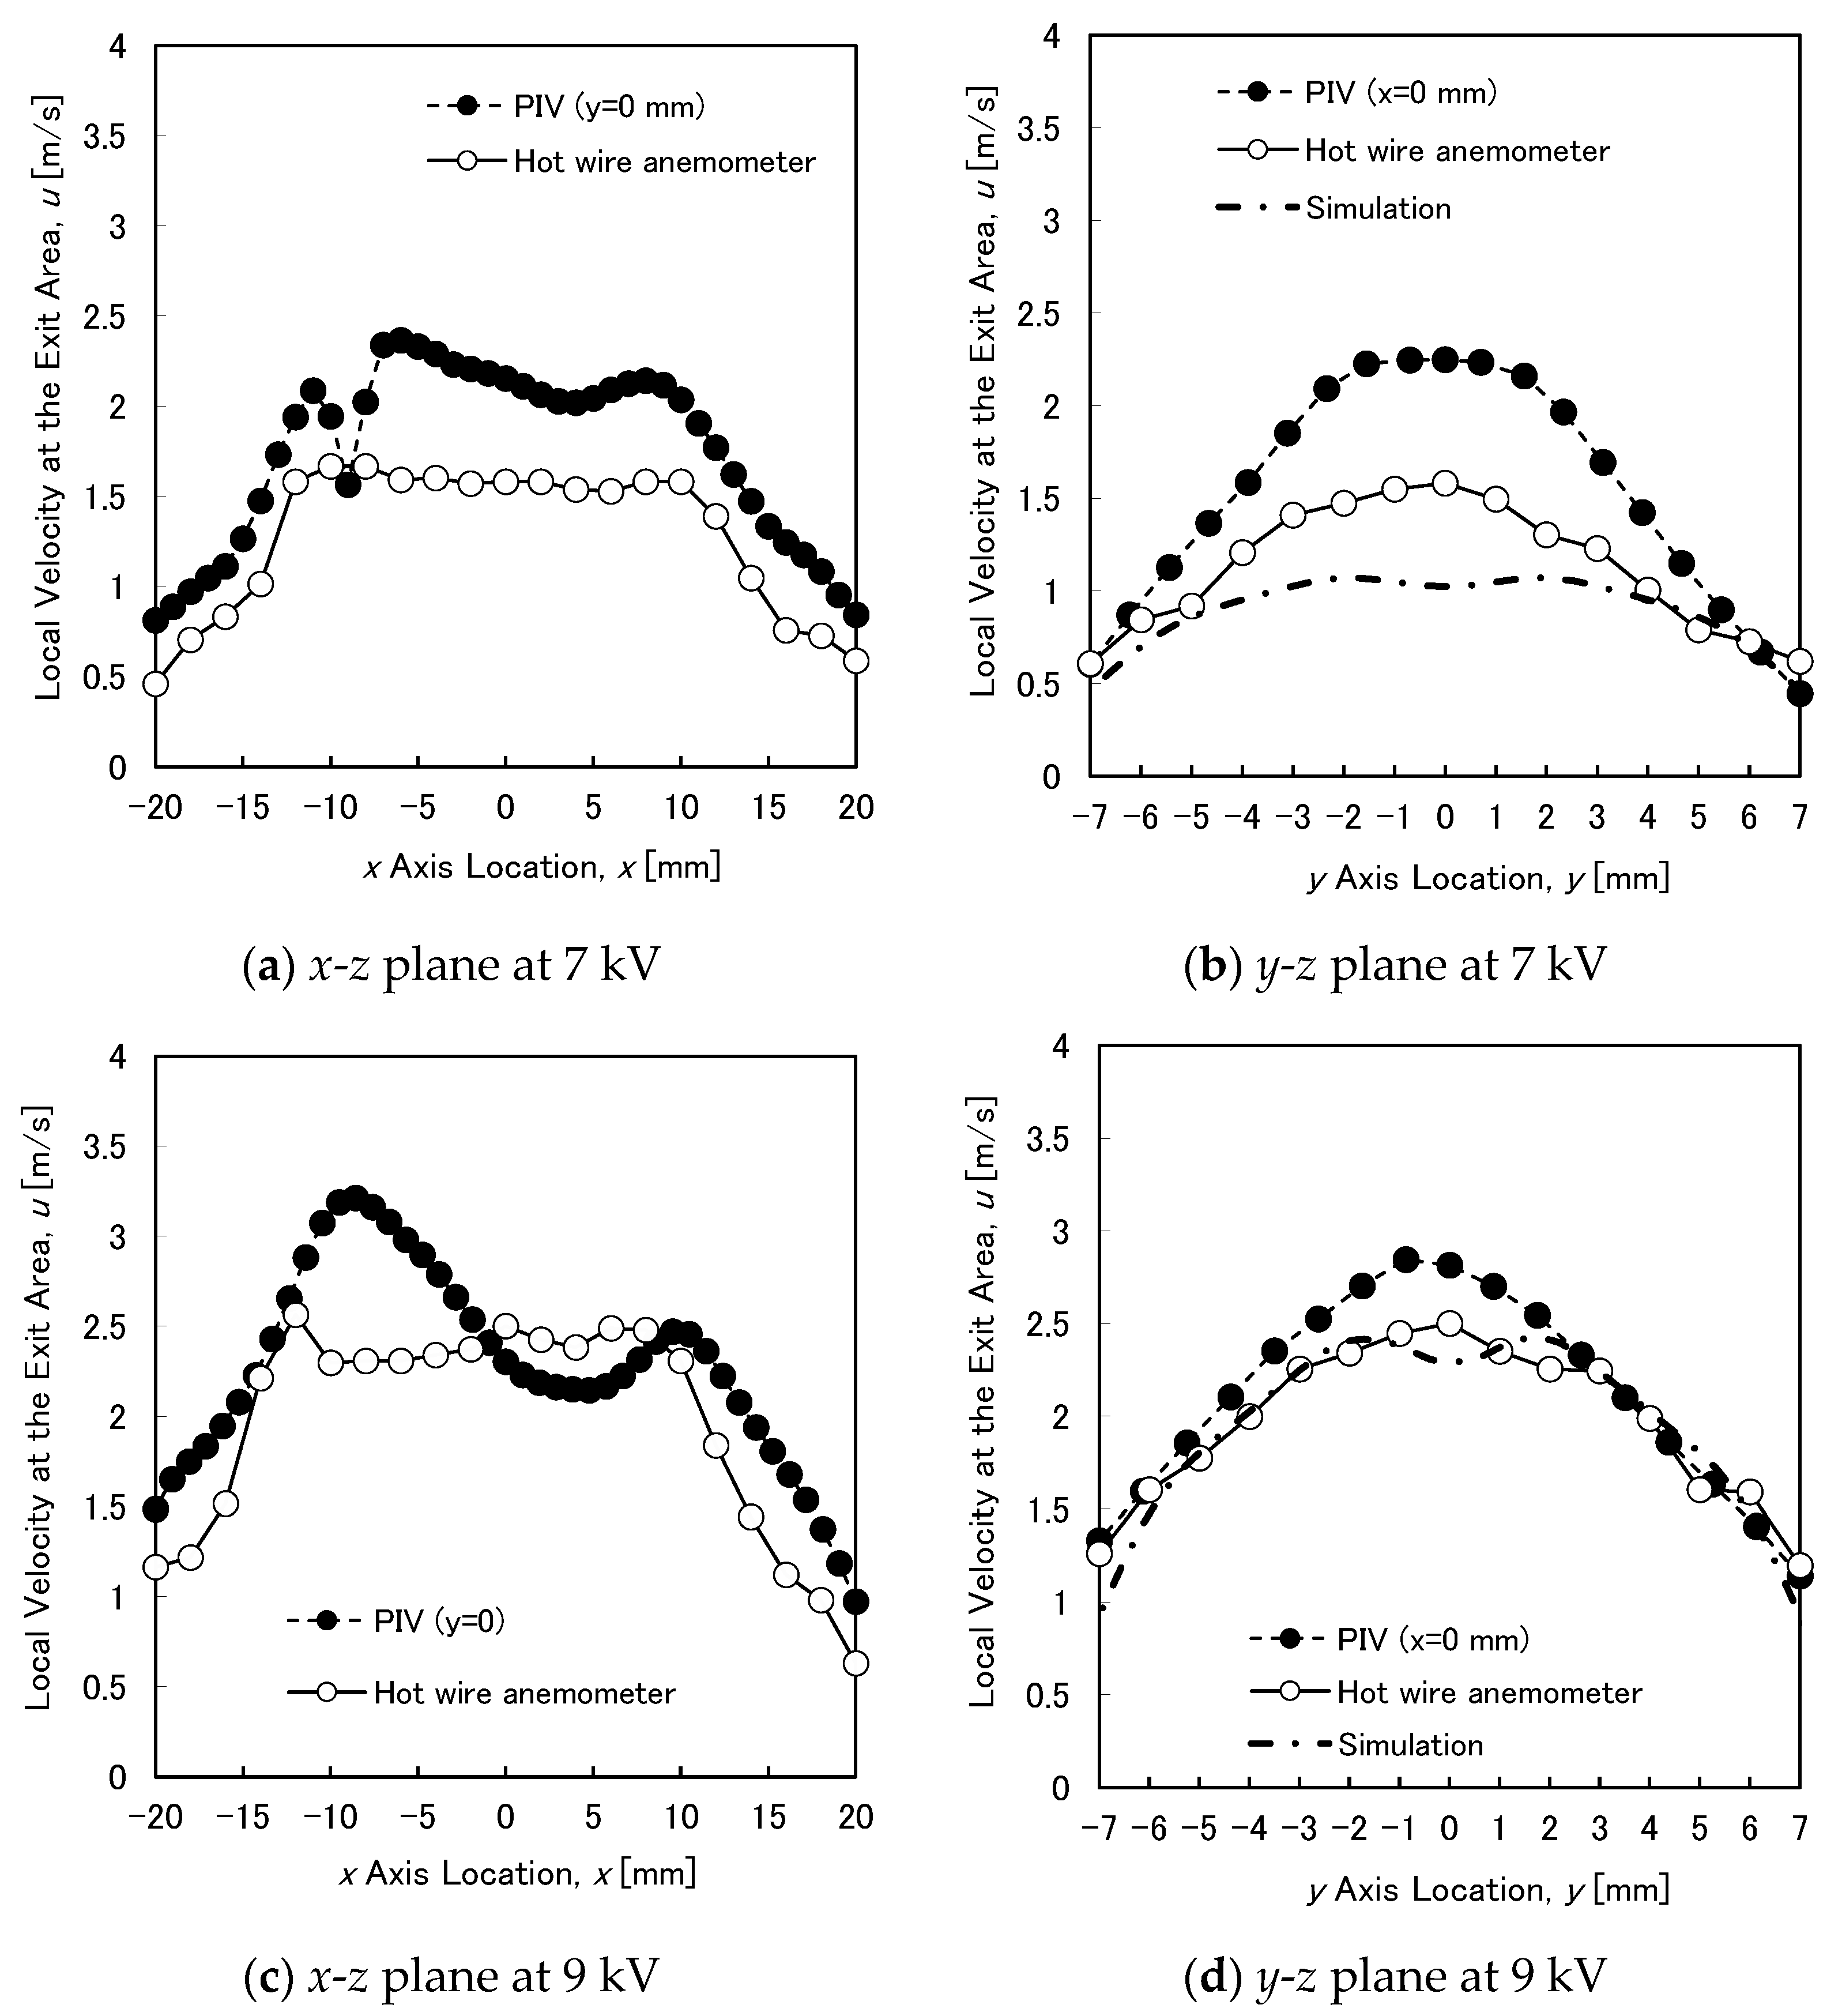
Figure 13a–d shows the local velocity profiles for the horizontal and vertical axes at the exit area (
z = 10 mm) at different applied voltages to the EHD fan. In the case of the PIV analytical results at the
x-
z plane (
y = 0 mm), the average velocity was 1.36 times higher than that of hot-wire anemometer, and the value of the local velocity varied greatly in a wide range from 0.81 m/s to 2.36 m/s. The reason is probably that the time-averaged value was estimated by recording a time length of 1.21 s, depending on the record rate (9000 Hz) of the high-speed video camera. This result could be guessed at from the phenomena mentioned in
Figure 9, where the velocity profile at the downstream area of the wire electrode and flow channel exit had a large time variation. In the case of 9 kV, the velocity profiles of the PIV analysis on the
x and
y axes agreed well with those of the hot-wire anemometer.
4. Simulation by COMSOL Multiphysics
4.1. Governing Equations
For a two dimensional steady-state incompressible flow, the continuity equation, Equation (1), and the Navier–Stokes equation, Equation (2), were solved using COMSOL Multiphysics 6.1, which is a commercial finite element method multiphysics solver.
where
U is the air velocity,
p the pressure,
μg the air viscosity,
E the electric field and
q the space charge density.
Turbulent flow using the standard k-ε turbulent flow model was selected for the flow model in the channel for the simulation because of the observed wavy motion, shown in
Figure 9, even if the range of the Reynolds numbers was between 7.2 × 10
2 and 3.1 × 10
3 in the experiments. The electrical potential and space charge density in the EHD fan were described by Poisson’s equation for electrostatics, Equation (3), and the ion transport equation for charge transport, Equation (4).
Here, V is the electric potential, ε0 the air permittivity and μc the ion mobility. Once the values for space charge density, q and electric field, E were known, the Coulomb force (F = Eq) on the ions, which equals body force in a neutral gas medium, could be calculated. This body force was coupled with the electrostatic equation and the ion transport equation to the Navier–Stokes equation governing the flow of the neutral gas medium.
4.2. Numerical Model
The wire-partially insulated parallel plate electrode geometry permits simplification by employing a two-dimensional model. The program was operated using a personal computer with a 3.70 GHz Inter (R) Core (TM) i9-10900X CPU and 64.0 GB of RAM. Three modules were used in the computation: electrostatics, ion transport equation, and incompressible Navier–Stokes equation.
4.3. Computational Domains and Procedure
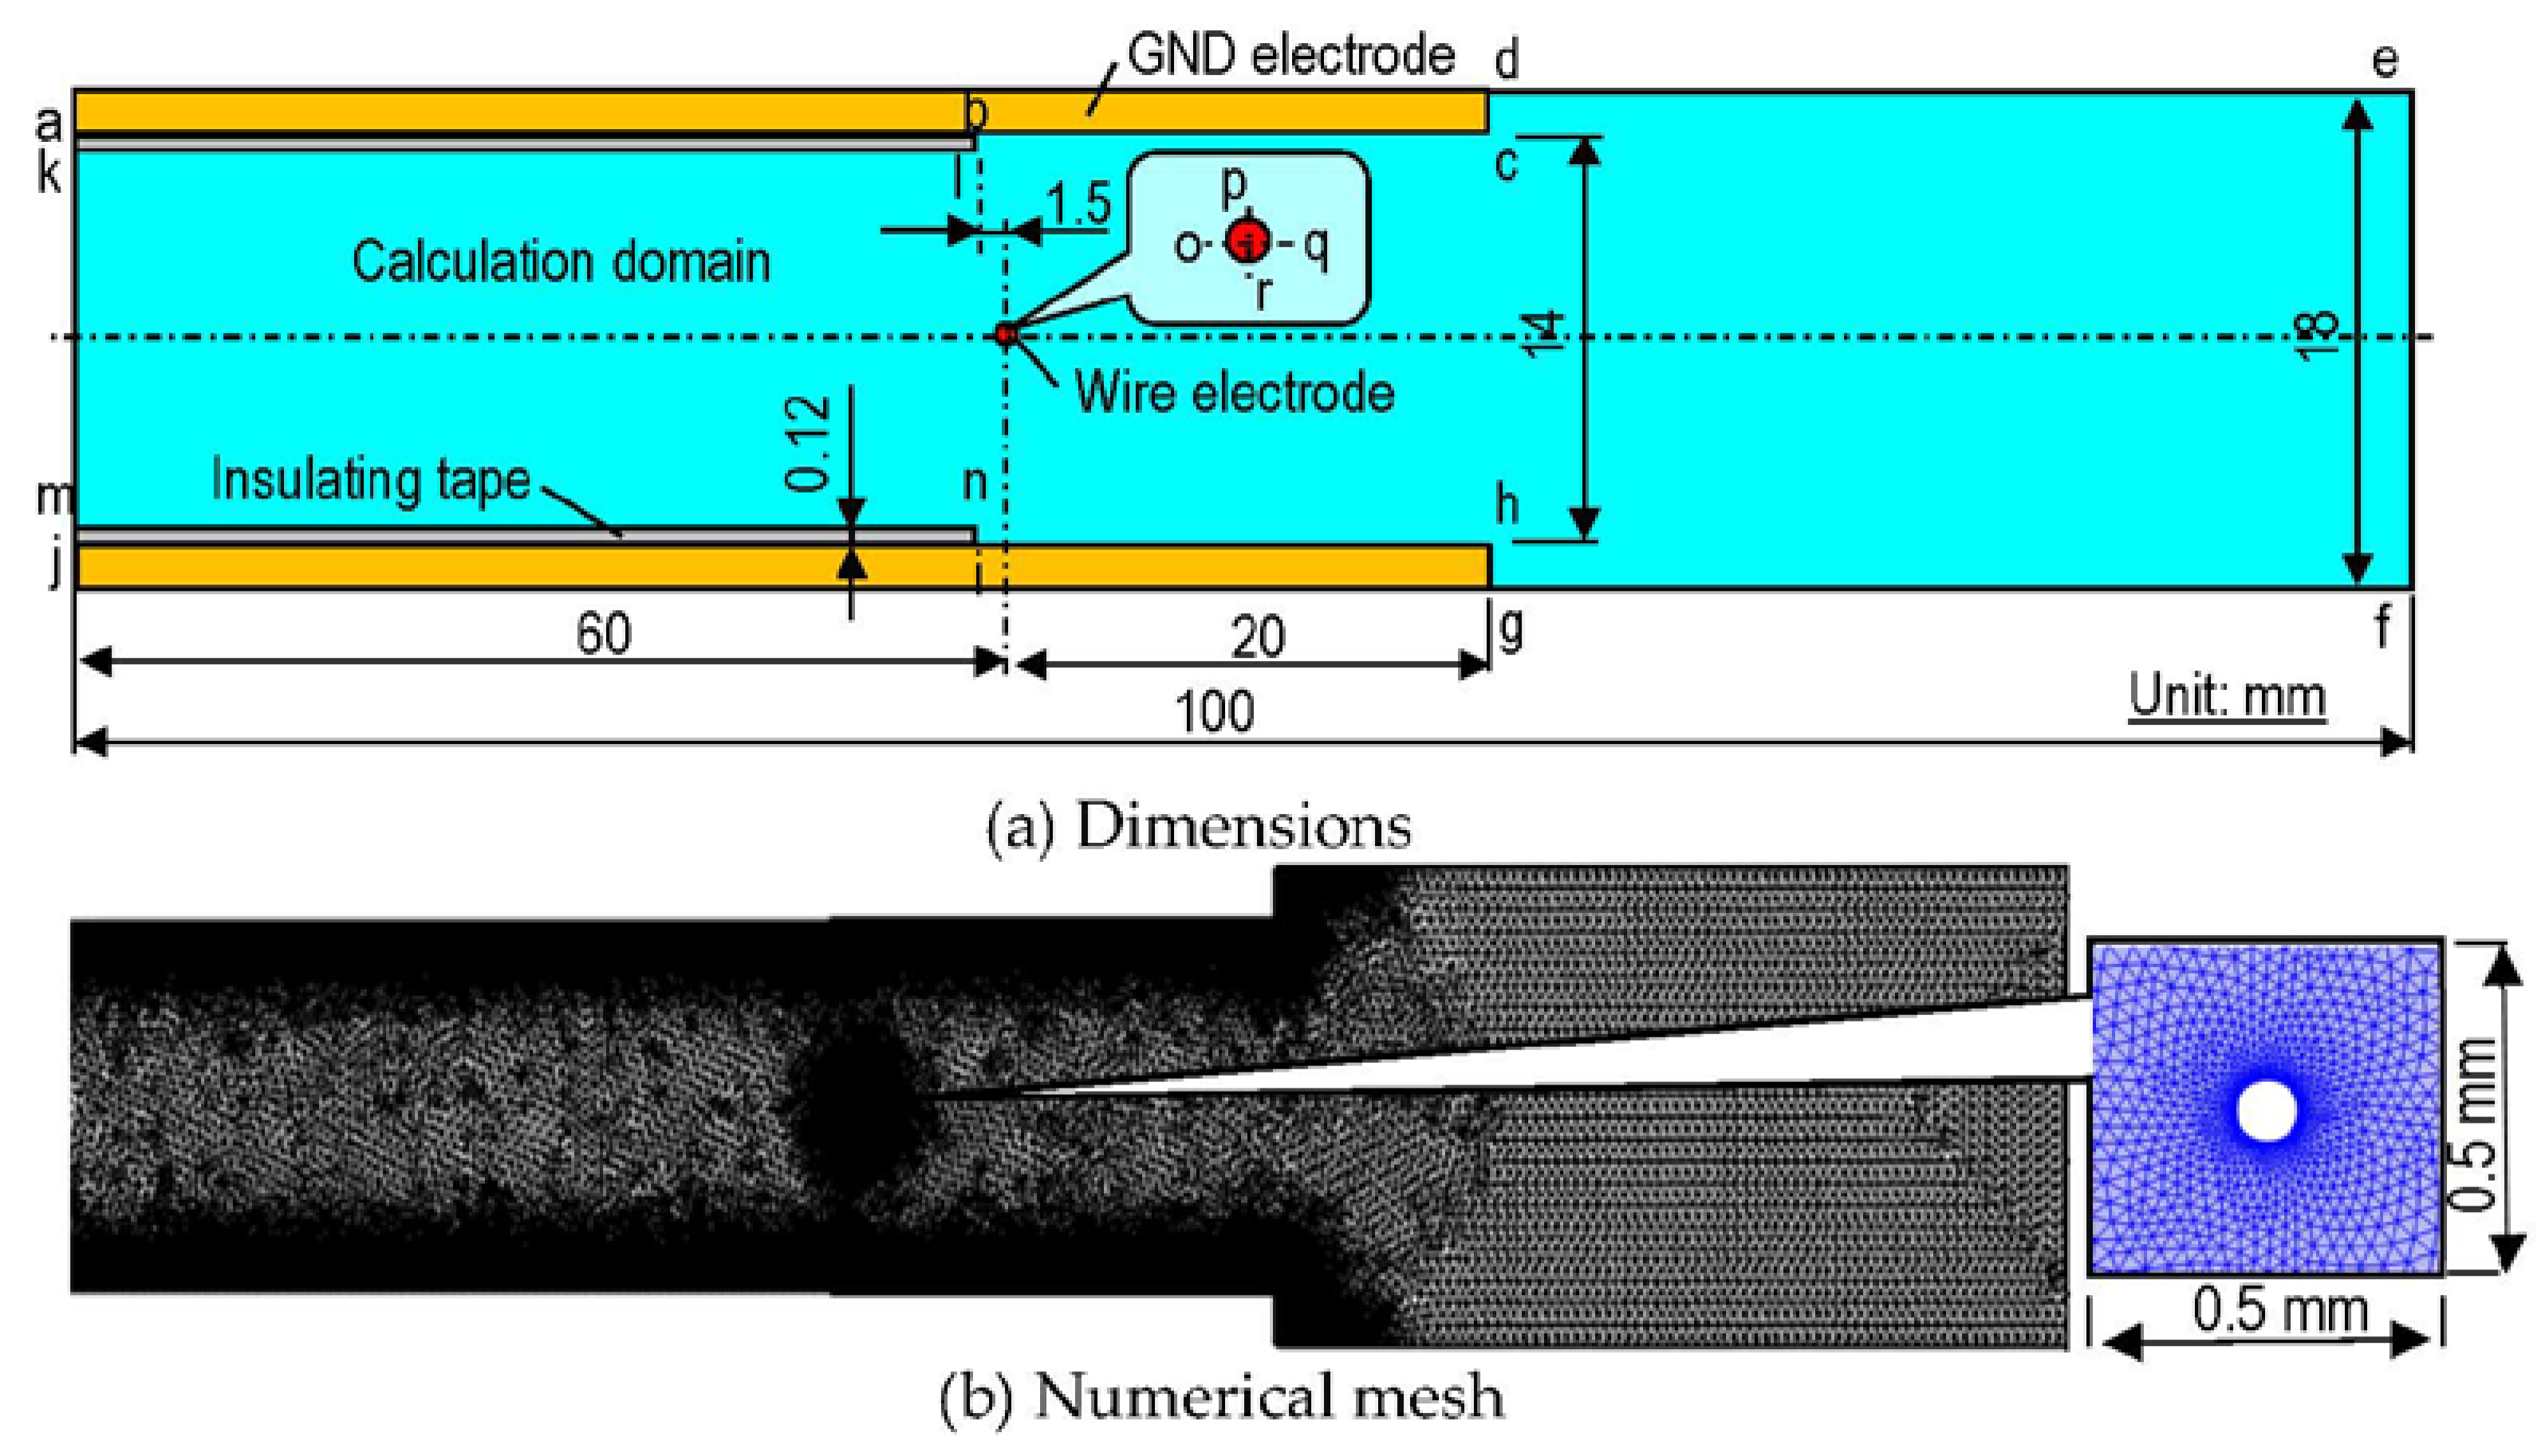
Figure 14 shows the two-dimensional calculation domain in the flow channel. Wall boundaries were GND electrodes, acd and jhg, wire electrode, opqr and insulating tape, klb and mni. Inlet and exit of the flow channel, km and ef, were selected as boundaries without backflow. The open boundaries were de and gf. Details of the boundary conditions for each calculation are presented in
Table 1. The number of the elements was 32,272, as shown in
Figure 14b. In this study, velocity profiles were compared by means of hot-wire anemometer and PIV analysis, and simulations were conducted under the same experimental conditions. In this study, the ion number density,
Nn, was estimated using Equation (5).
Here,
e,
μc and
S are electric charge and ion mobility of air and surface area of wire electrode per unit length, respectively. The absolute value of the electric field on the surface of the wire electrode,
E, was hypothesized to be 10
9 V/m at 10 kV in this simulation, which was similar to the value estimated by Poisson’s equation in the case of the space charge density,
q = 0 C/m
3. The electric fields on the surface of the wire electrode for the other applied voltages were estimated by means of a ratio of the applied voltage for 10 kV. In the case of 10 kV, the ion number density was 1.05 × 10
15 1/m
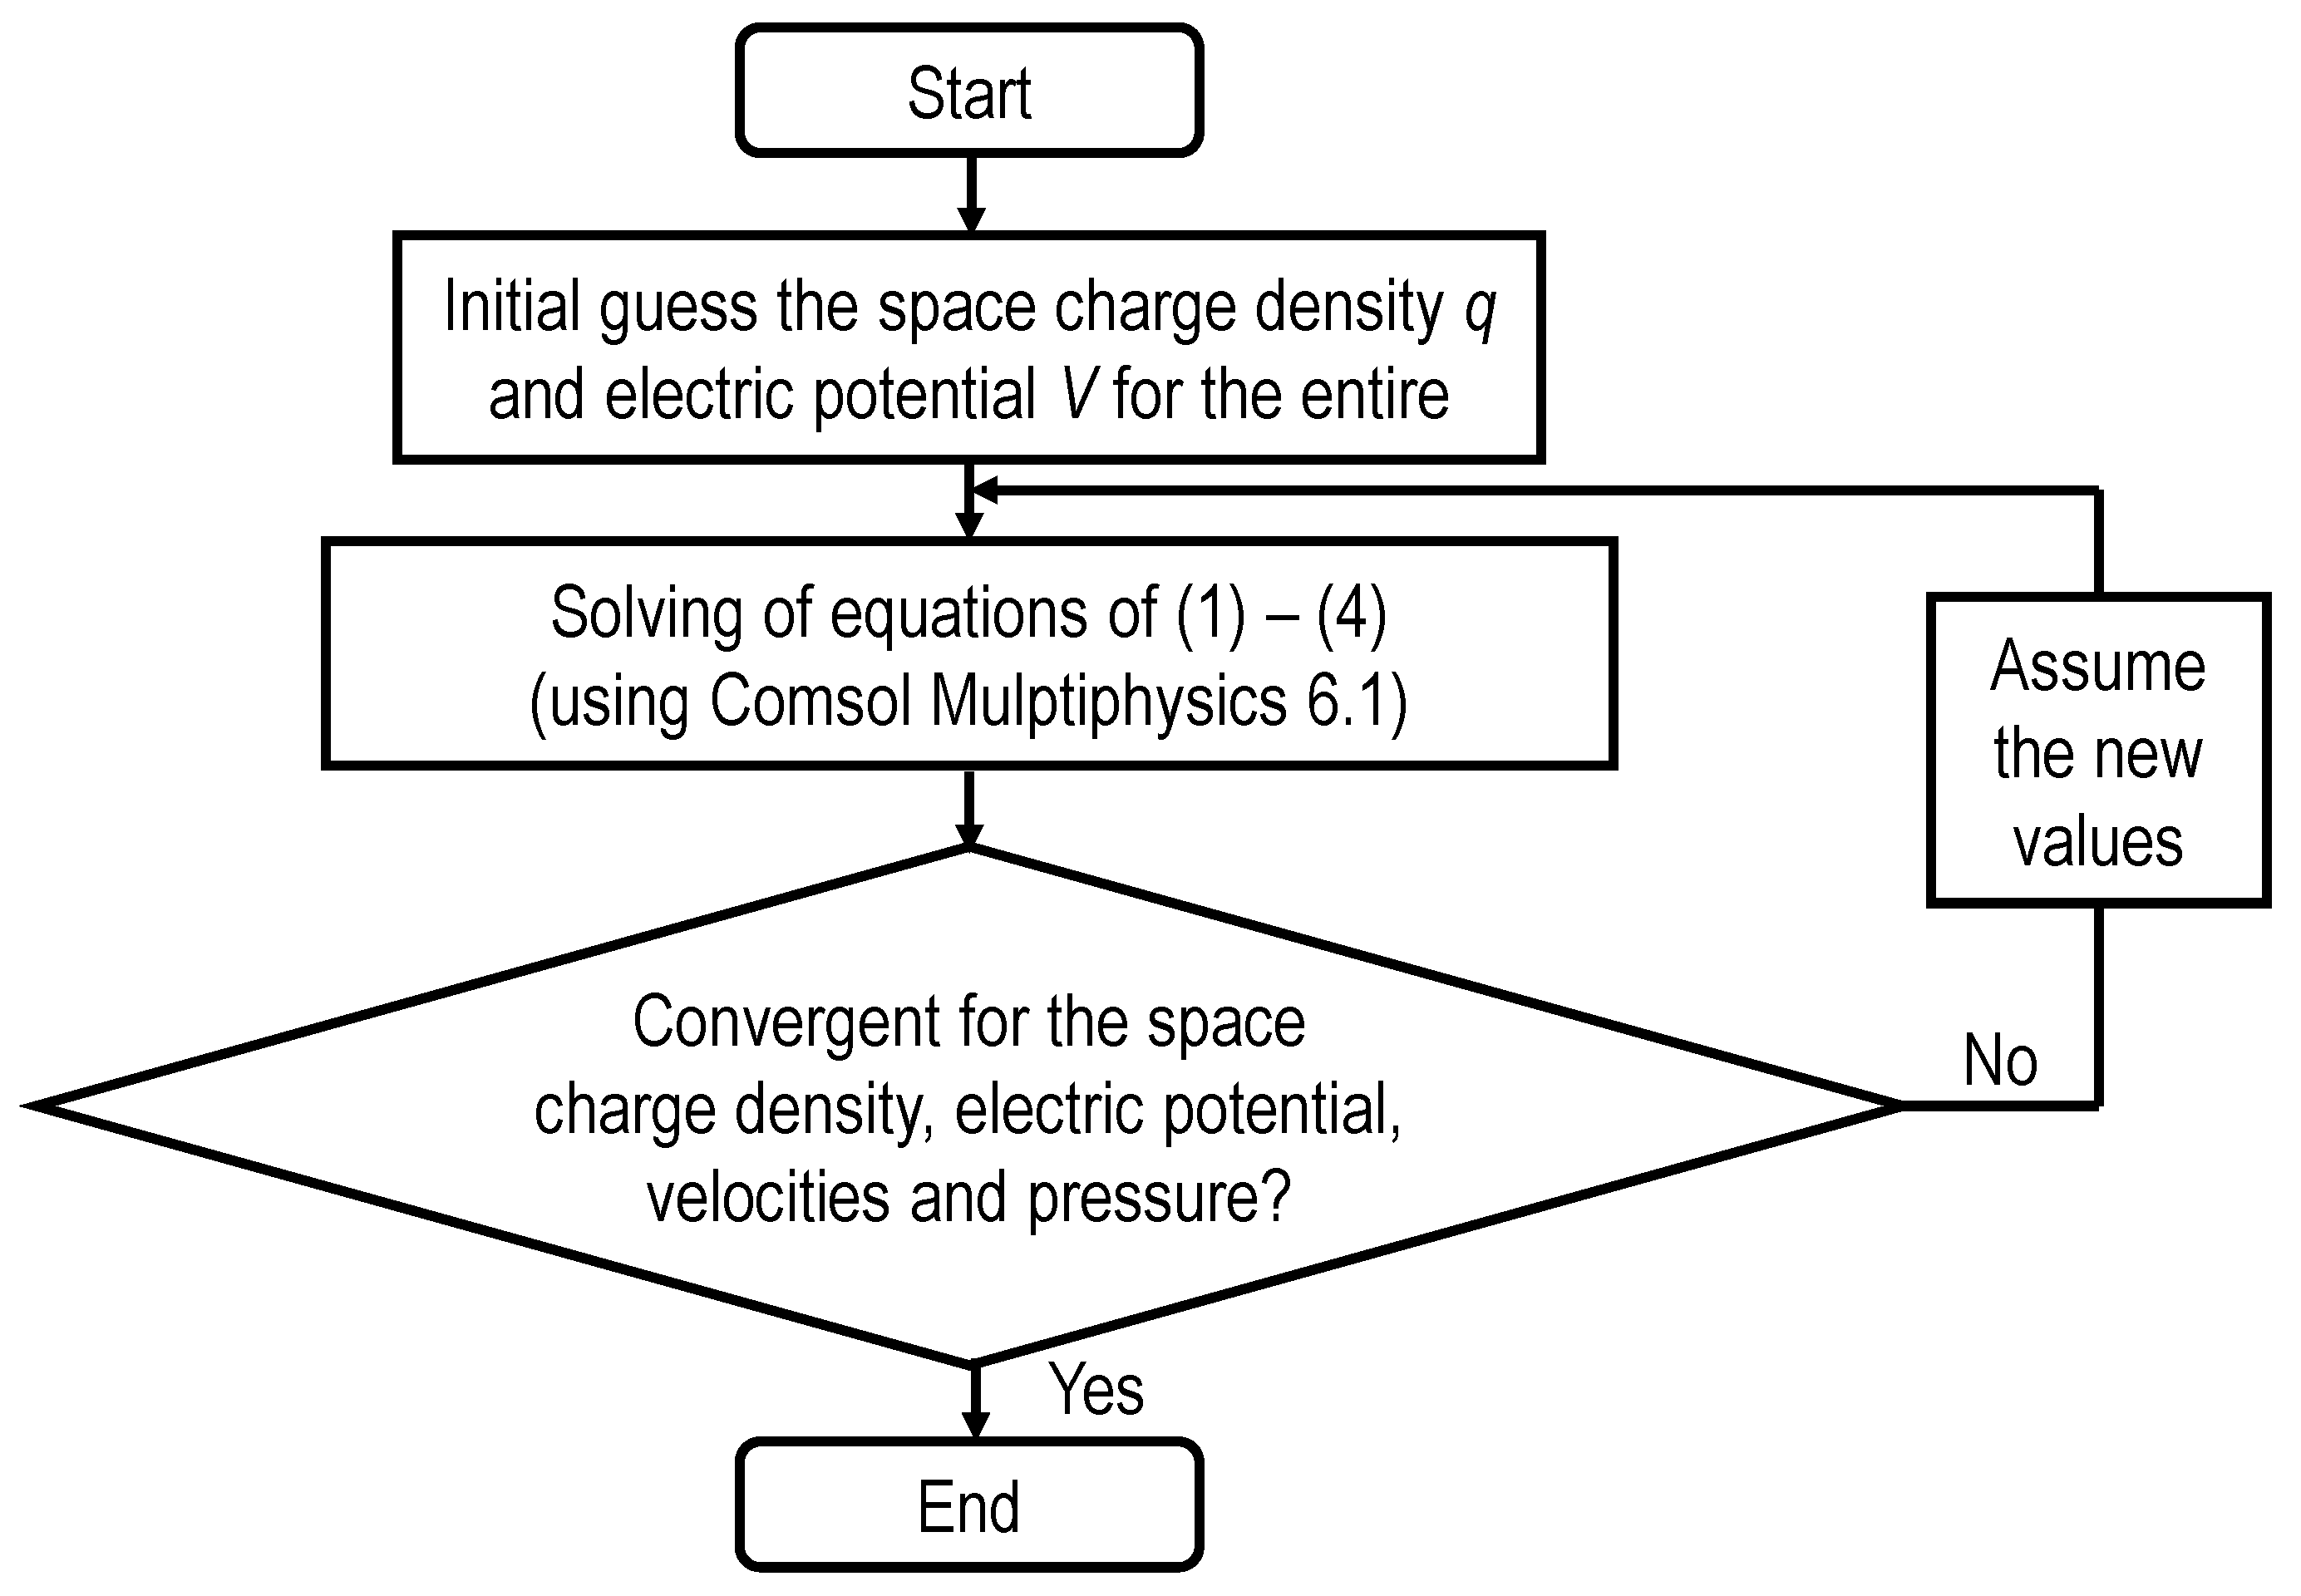
3, which was determined by Equation (5), based on a discharge current of 143.5 μA, as measured in the experiment. The model was implemented in the general procedure, as shown in
Figure 15.
4.4. Simulation Results
Figure 16 shows the steady state velocity profiles in the flow channel of the EHD fan calculated for the applied voltages of 7 kV and 9 kV. The average velocities on the
y axis at the location of 10 mm from the exit of the flow channel were 0.88 m/s and 1.92 m/s, respectively. The maximum velocities obtained upward and downward of the wire electrode were 1.21 and 2.84 m/s, respectively. Each whole flow profile in the channel of the EHD fan was qualitatively similar to the PIV analysis results, as shown in
Figure 12b,d. As shown in
Figure 13b,d, the velocity profiles calculated in the simulation agreed reasonably well with the experimental results using the hot-wire anemometer. Although the calculated velocity profile for the applied voltage of 7 kV was underestimated by a mean relative error of about 19% in the experimental result, the velocity profile for 9 kV was the mean relative error of 3.3%. The main reason was probably the turbulence induced in the downstream area of the wire electrode, shown in
Figure 9.
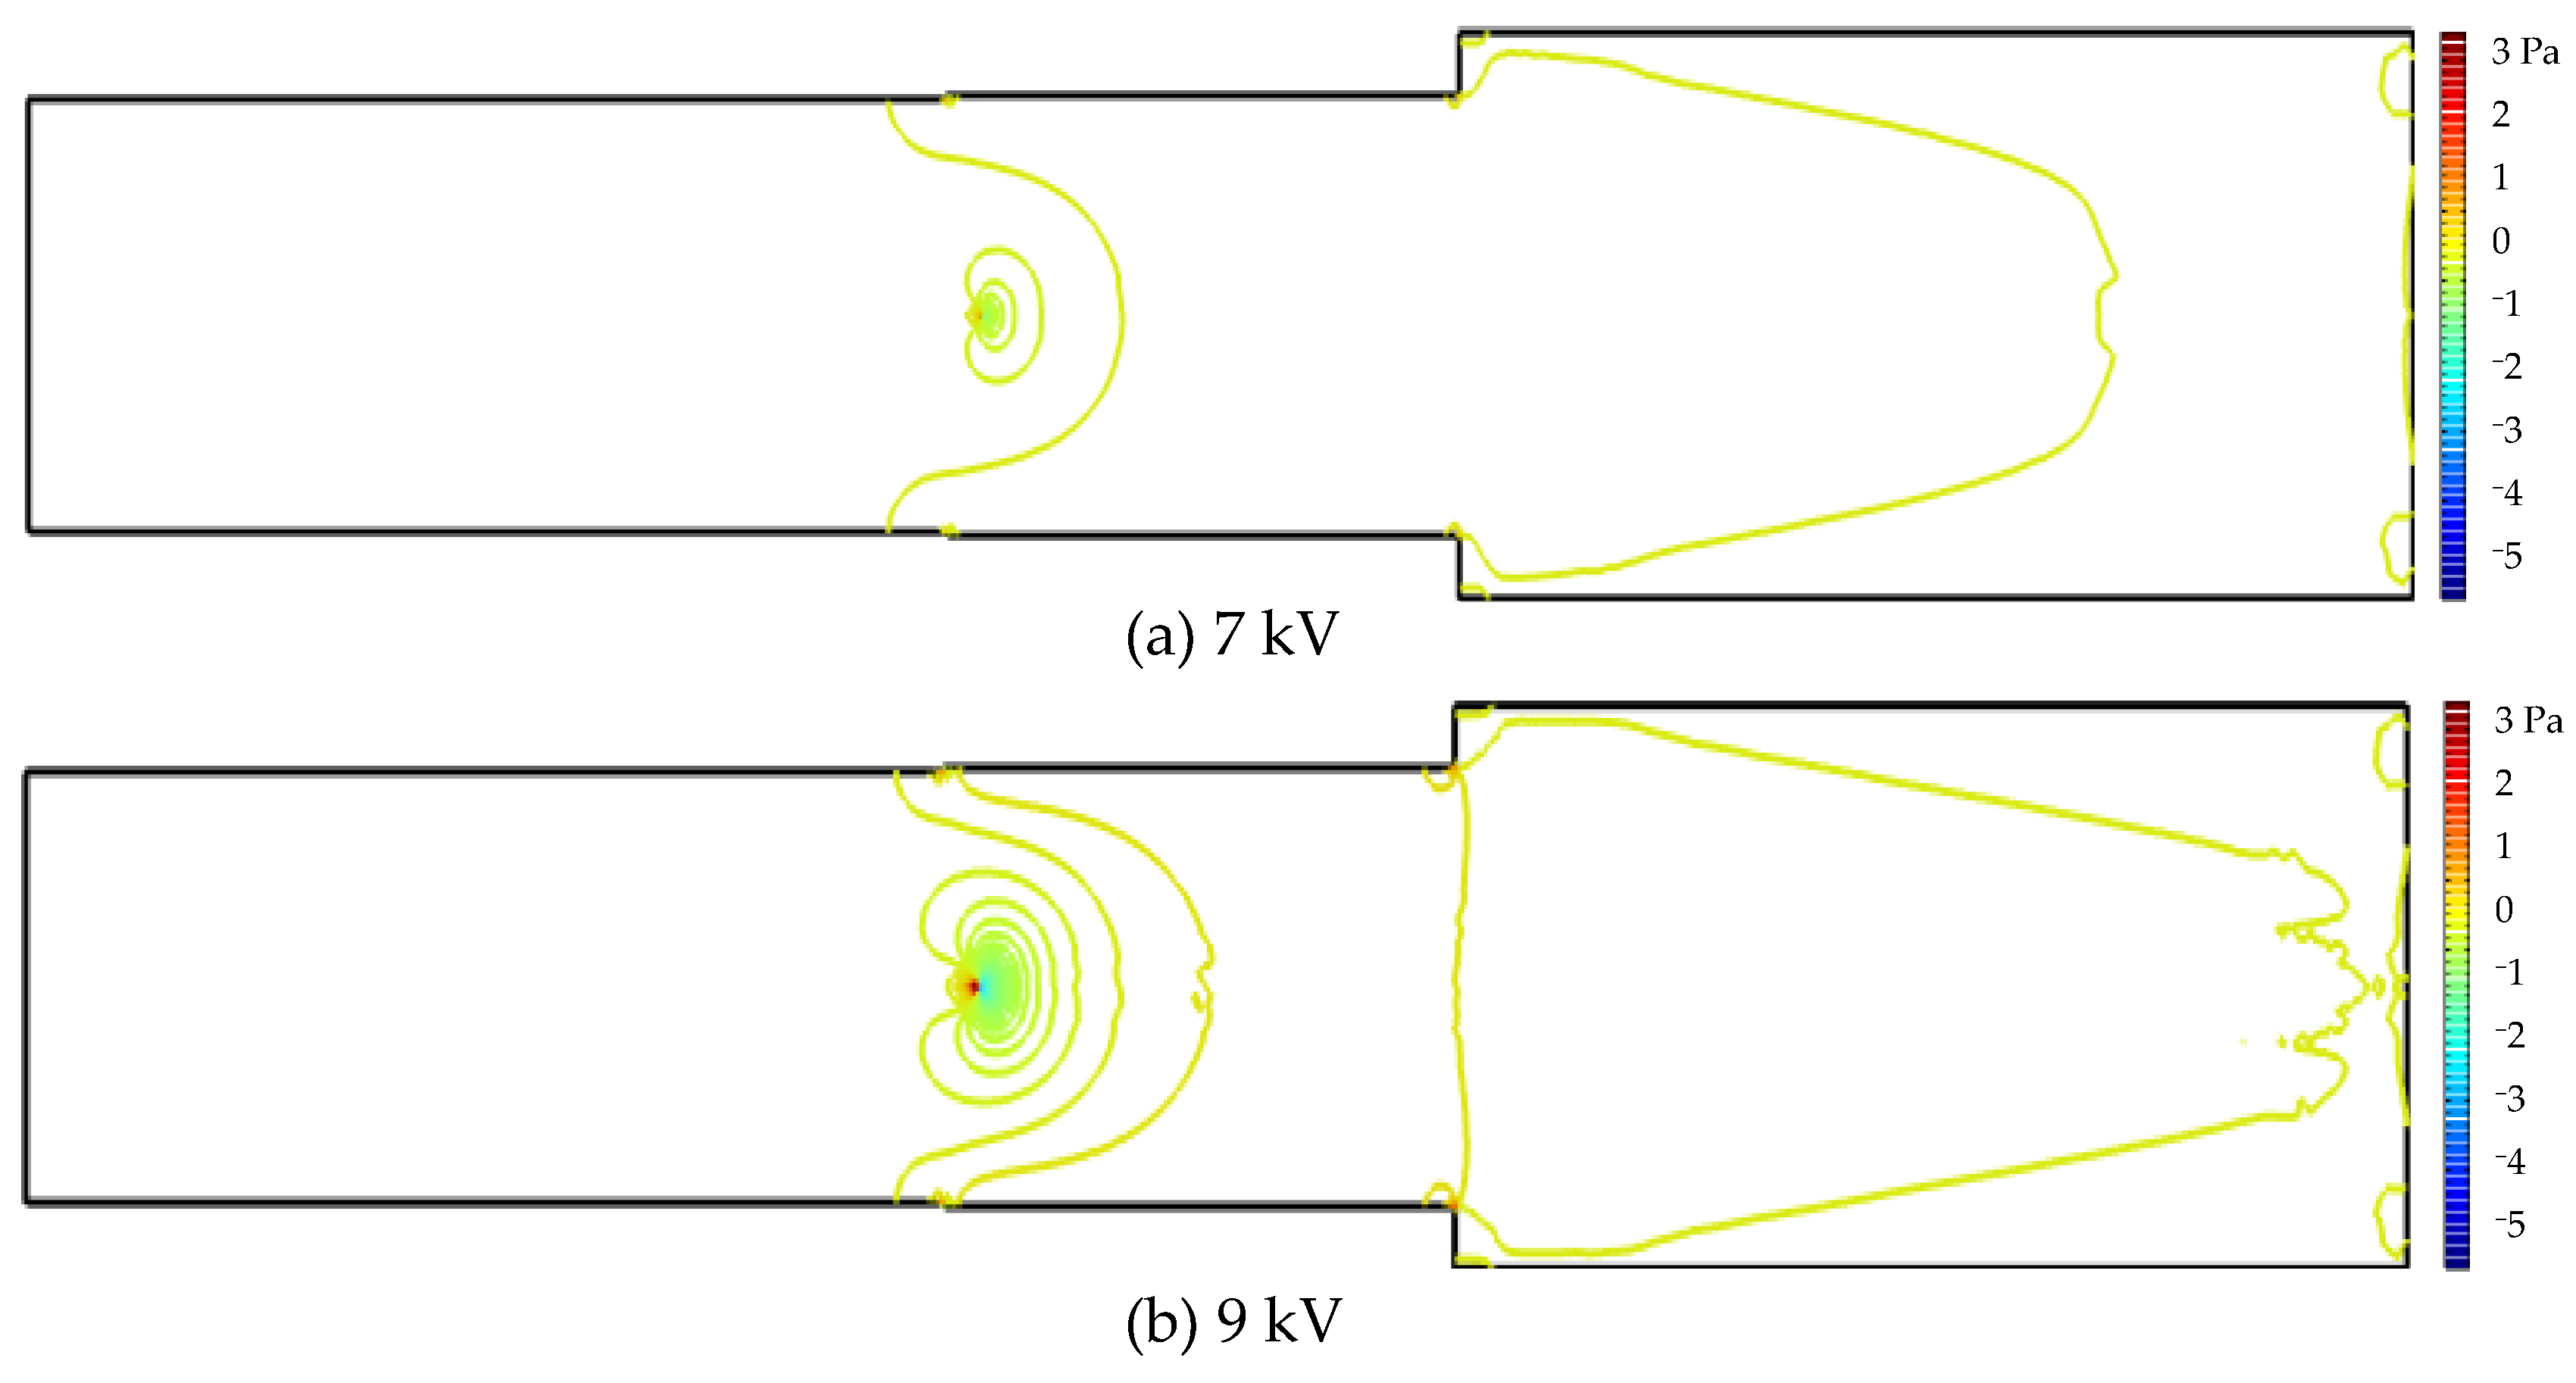
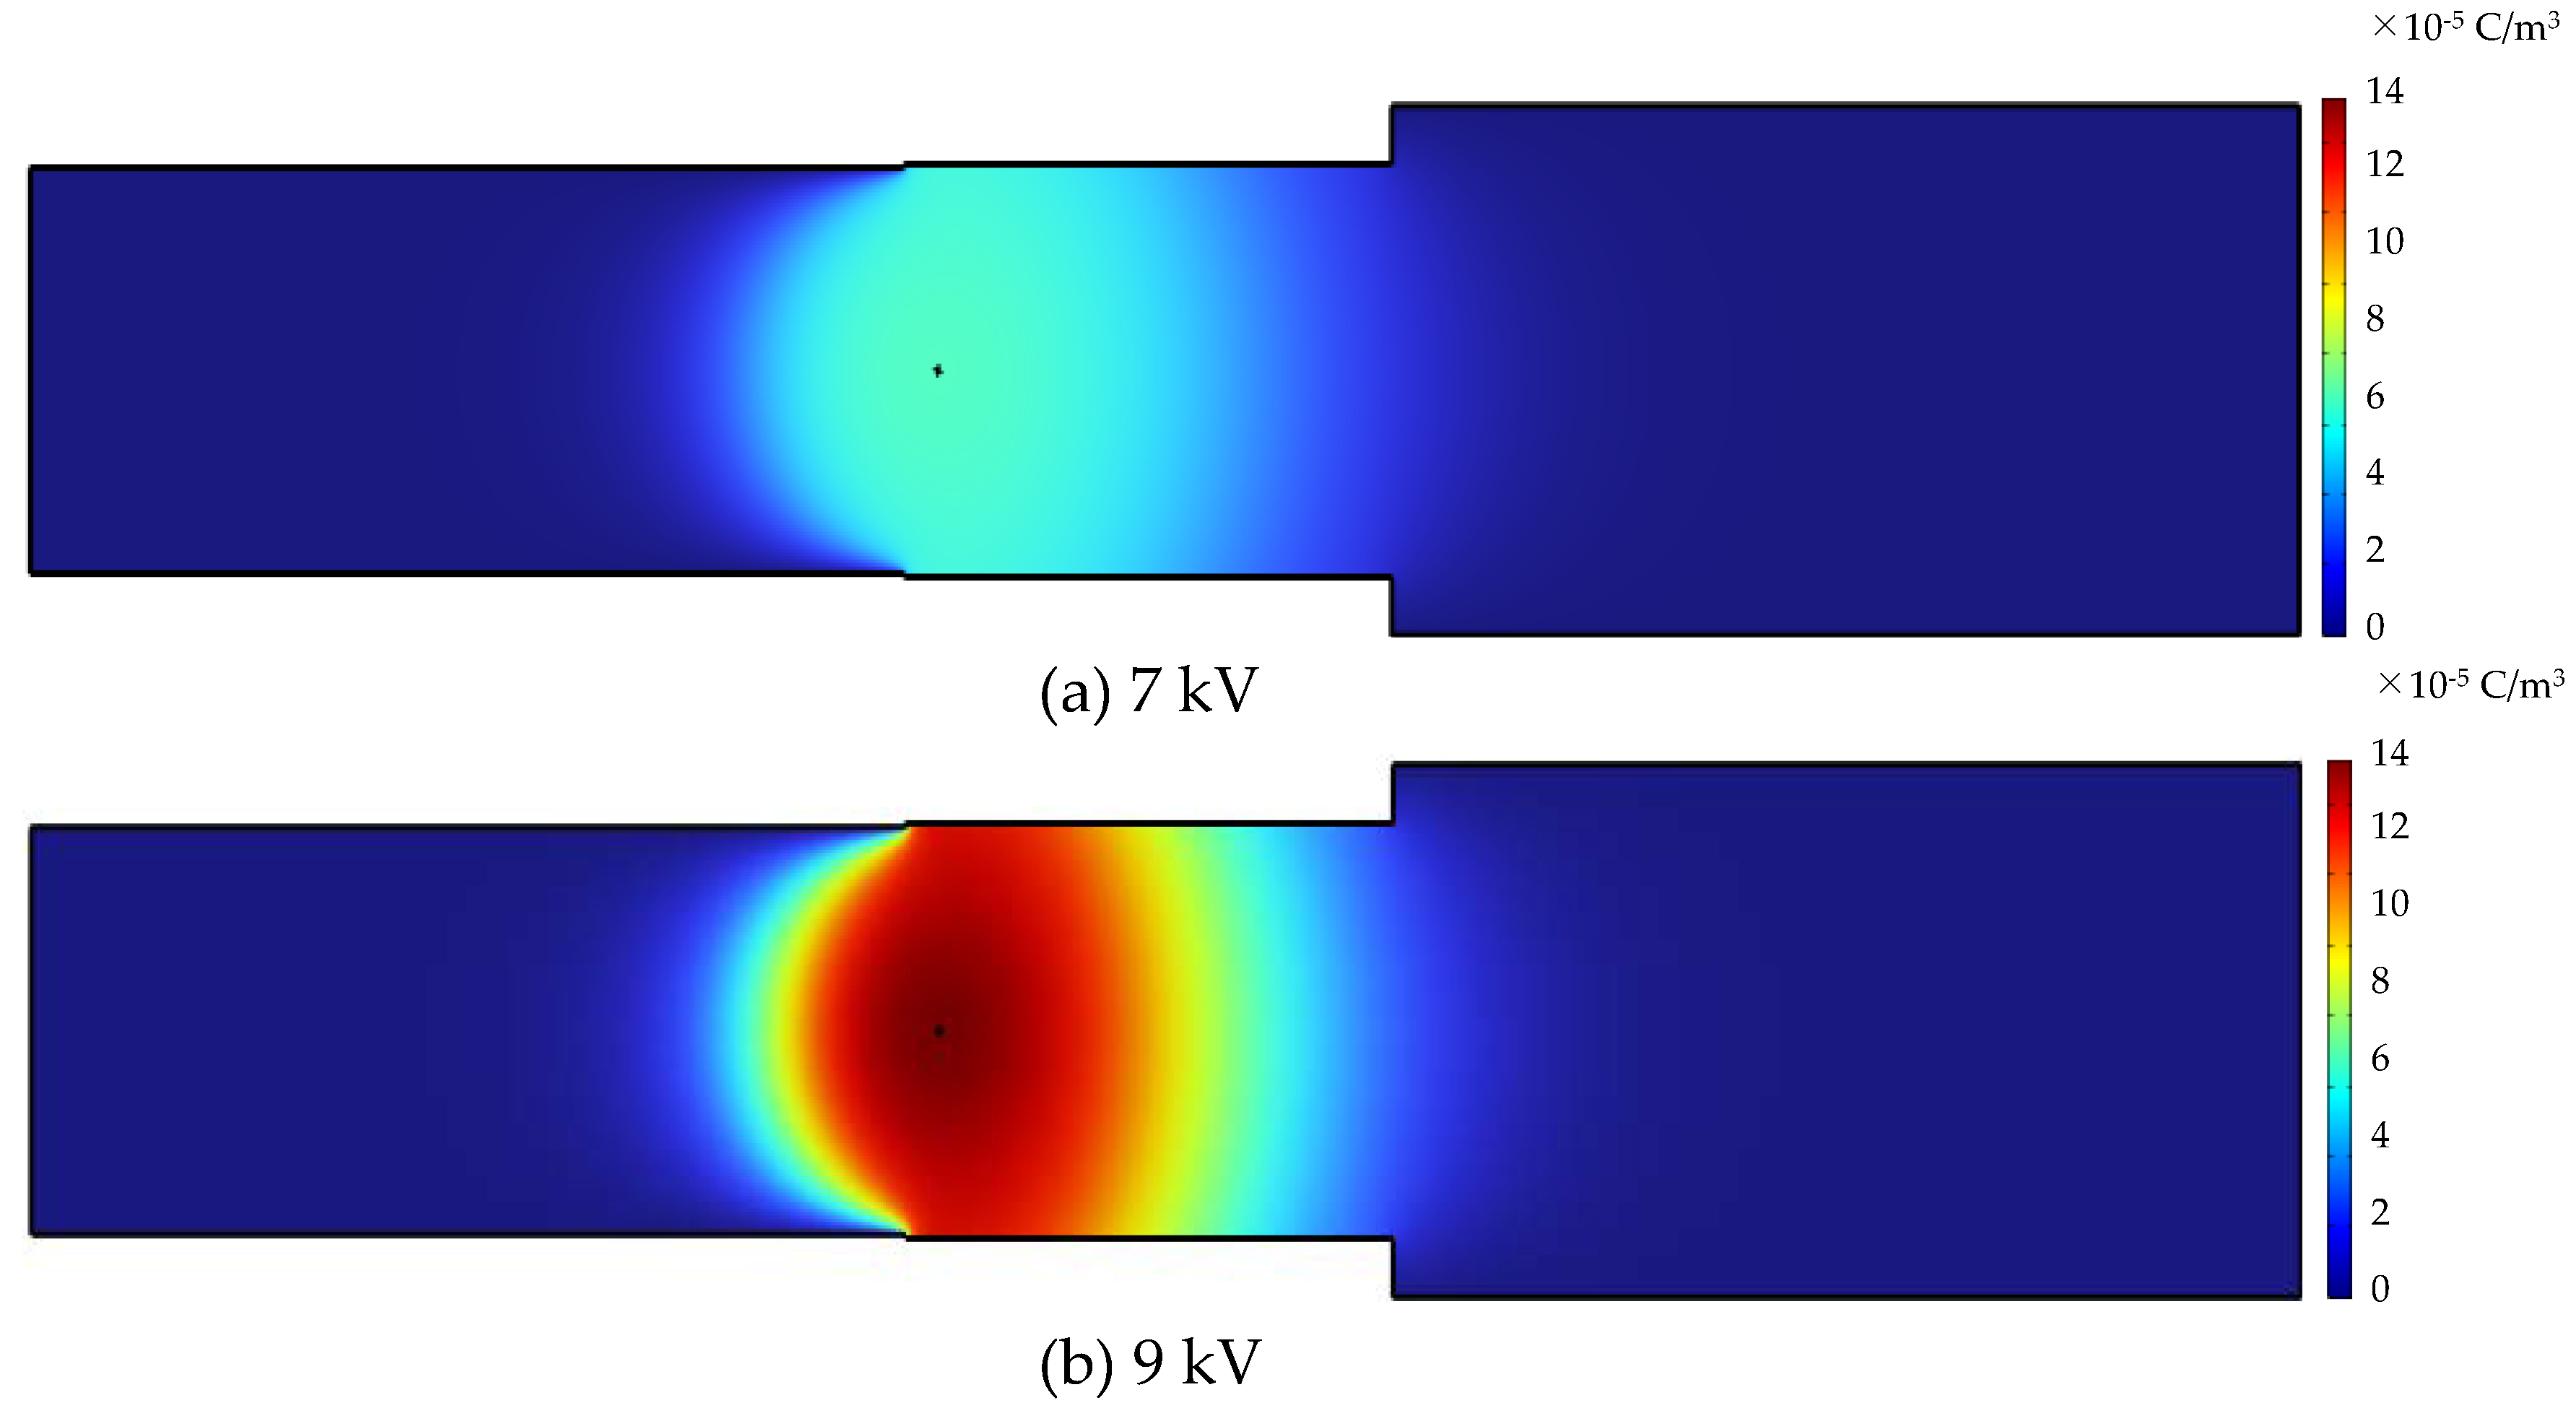
Figure 17,
Figure 18 and
Figure 19 show the comparisons of pressure, electric potential and space charge density profiles of the simulation results at applied voltages of 7 kV and 9 kV. When comparing applied voltages, it was observed that, as higher voltages were applied, larger pressure differences in front of and behind the wire electrode were generated, as shown in
Figure 17. Since the electric potential and electric charge density at an applied voltage of 9 kV were higher than those at 7 kV, this meant that the higher the voltage applied in the wire electrode, the stronger the body force caused by the Coulomb force acting on the whole flow in the channel of the EHD fan.
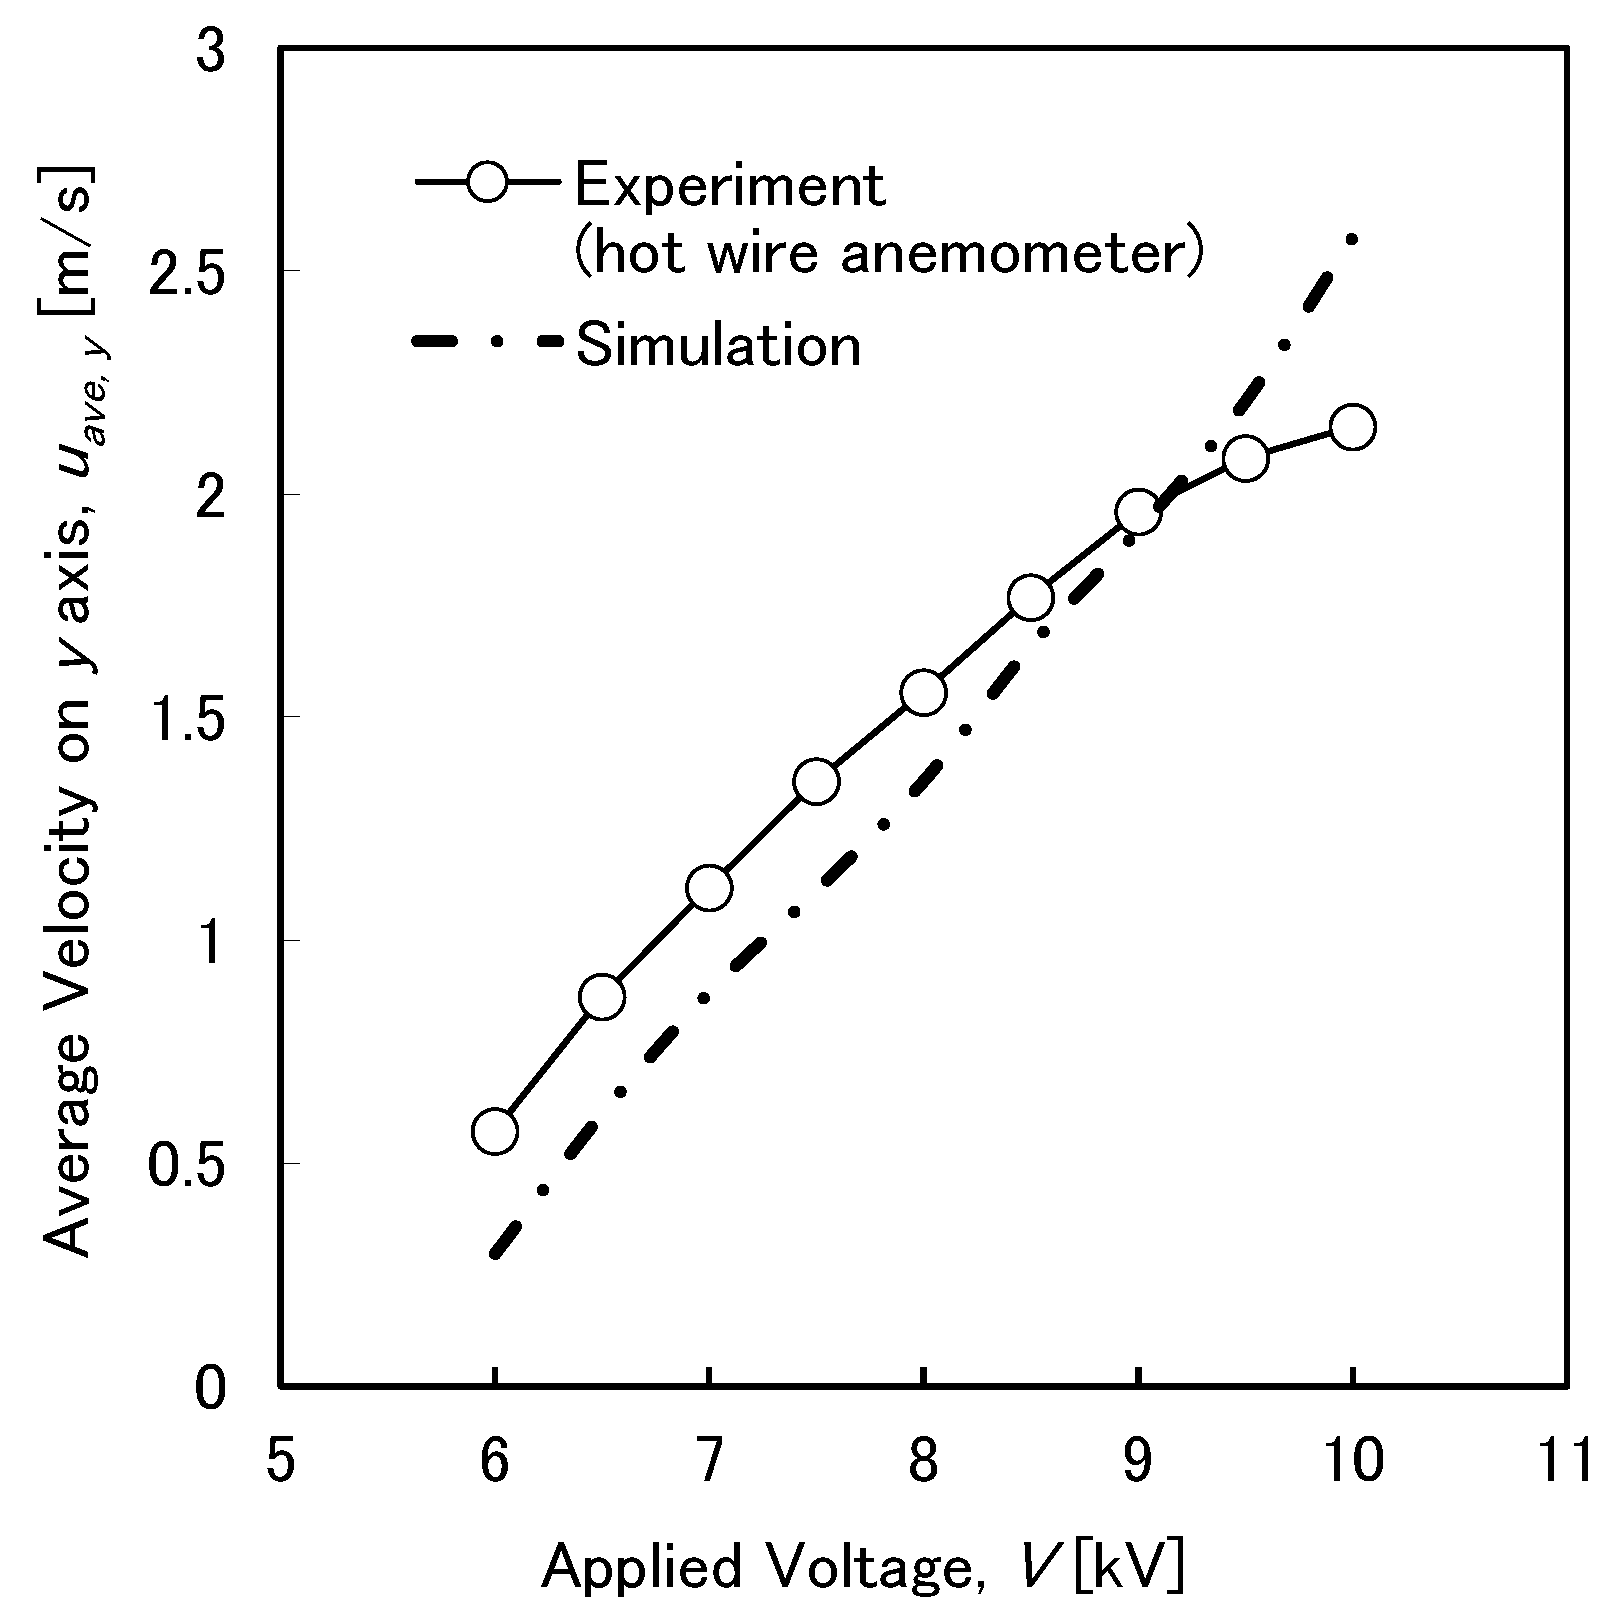
Figure 20 shows the comparison of average velocities on the
y axis at the exit area (
z = 10 mm) for the experiments with the hot-wire anemometer and the simulations for the EHD fan. The average velocities of simulation results for any given voltage were quantitatively in agreement with the experimental results at a mean relative error of −12.6% and a root mean square error of 22.7%. As a whole, the velocities calculated by the simulation were a little lower than those of the experiment at an applied voltage of 9 kV or less. On the other hand, the average velocities at an applied voltage of 9.5 kV or more in the simulation were overestimated. This was probably because at the higher applied voltage, larger energy loss, associated with an increase in air temperature arose, due to the corona discharge in the experiment. It is noted that this flow model should be improved in the future by considering the flow condition of the low Reynolds number and/or the energy loss for each applied voltage in a simulation in order to obtain a quantitatively more accurate velocity profile in reference to the visualization results of internal flow and PIV analytical results.
5. Conclusions
In this work, an experimental investigation was conducted to study discharge and flow characteristics under DC positive applied voltages for a wire-partially insulated parallel plate electrode type EHD fan in a rectangular flow channel. Particularly, velocity profiles on the x and y axes were obtained, and the volumetric flow rate and transport efficiency were evaluated from the experimental results. In addition, in order to obtain the velocity profiles in the flow channel and the downstream area near the channel exit, the visualizations of the air flow were obtained by using PIV analysis. Furthermore, details of the steady state velocity profile, electrostatic field, and so on, were estimated by means of CFD analysis. These experimental and analytical results are presented and discussed in detail in this paper. The main results showed that:
(a) A maximum average air velocity of 2.23 m/s, by means of hot-wire anemometer at an applied voltage of 10 kV (input power of 1.44 W) for the EHD fan, corresponding to a volumetric flow rate of 75.0 l/min, was achieved;
(b) The average air velocity and volumetric flow rate almost logarithmically increased with increasing applied voltage;
(c) From the visualization and PIV analysis of the air flow in the channel and near the channel exit of the EHD fan, the velocity of the air flow mainly increased in the z axis direction immediately following the downstream wire electrode, and periodic oscillation of the main stream was observed toward the channel exit direction.
(d) The air flow downstream of the wire electrode near the side wall of the flow channel was quite different from that on the y–z plane.
(e) By means of a two-dimensional simulation with COMSOL Multiphysics 6.1 for the EHD fan, air flow profiles in the flow channel and near the exit area, induced by corona discharge, qualitatively corresponded with the experimental results. In addition, average velocities quantitatively agreed with the experimental results. However, in order to improve the accuracy of calculation for the velocity profile, a simulation for the EHD fan, which considers the oscillation of internal flow and three-dimensional flow, together with the flow condition of the low Reynolds number and/or the energy loss for each applied voltage, should be attempted through CFD analysis in the future.
