Article

Design and Finite-Element-Based Optimization for a 12-Slot/10-Pole IPM Motor with Integrated Onboard Battery Charger for Electric Vehicle Applications

1
Department of Electrical Engineering, Alexandria University, Alexandria 21544, Egypt
2
CEMSE Division, King Abdullah University of Science and Technology, Thuwal 23955, Saudi Arabia
3
Research and Development Center, Arab Academy for Science, Technology and Maritime Transport, Al-Alamein 5060305, Egypt
*
Author to whom correspondence should be addressed.
Machines 2023, 11(5), 534; https://doi.org/10.3390/machines11050534
Submission received: 14 March 2023 / Revised: 24 April 2023 / Accepted: 4 May 2023 / Published: 8 May 2023
(This article belongs to the Special Issue Electrical Machines in Electric Vehicles)

Abstract

:
Permanent magnet (PM) machines with fractional slot concentrated windings (FSCW) constitute a notably remarkable proposition for electric vehicles. Additionally, an integrated onboard battery charger (IOBC) provides another superiority as it exploits the components of the powertrain to charge the battery without any additional components. Interior permanent magnet (IPM) motor arises as a credible choice due to its high torque density, resulting from the high saliency ratio. The optimal design of an IPM motor has been extensively presented from different perspectives, but the optimal design of a motor employed for IOBC application for both propulsion and charging modes has not been studied extensively. In this paper, the design and optimization of a 12-slot/10-pole IPM motor with IOBC are studied under both propulsion and charging modes. A finite-element-based optimization with the aid of a genetic algorithm technique is proposed to obtain the optimal machine by maximizing the average torque and minimizing the torque ripple, core losses, and magnet size.

1. Introduction

The transportation sector, having one of the highest proportions of green gases emissions, is transitioning toward electric vehicles (EVs) to reduce fossil fuel usage and its harmful emissions [1]. In 2020, the EV market had a share of 4.1% of total car sales, selling 3 million electric cars. This share reached 9% in 2021, and over 6 million vehicles were sold, making up all net growth of global car sales that year [2]. Despite these achievements, EV growth is still slow due to charging issues. Chargers can be either off-board or onboard. While off-board chargers offer high-power delivery in a short period, their installation cost is high, leading to a lack in these stations [3]. On the other hand, onboard battery chargers (OBCs) are relatively cheaper and allow vehicles to be plugged-in directly to either a single-phase or three-phase grid, but the charging process is slow [4]. To enhance the functioning of an OBC, IOBC has recently been introduced, which uses existing drivetrain components for charging. Motor windings are used as the reactive elements, and the propulsion inverter is used as a bidirectional dc/ac converter. Thus, there will be no need for separate charging units [5].
Typical machines used in EV traction are induction machine (IM), interior permanent magnet (IPM) synchronous motor [6], surface mount permanent magnet (SPM) synchronous motor, synchronous reluctance motor (SynRM) [7], and switched reluctance motor (SRM) [8]. Induction motors (IM) are characterized by ruggedness, availability, standard control schemes, and de-excitation in case of inverter fault—ensuring safety [9]. On the other hand, there are losses in both the rotor and stator, generating heat and lowering motor efficiency. Switched reluctance motors (SRM) are robust and thus applicable for severe conditions and fault-tolerance operations. Nonetheless, they have a low power factor, produce high acoustic noise, and need a special inverter and a higher number of power cables to ensure independent phase winding on the stator [7]. As for permanent magnet synchronous motors, they can operate at a broad torque-speed range at remarkably high torque and power densities. Their drawbacks are the high cost, scarcity of rare-earth elements used in permanent magnet manufacturing, and their need for special control techniques. In particular, IPM synchronous motors are marked with a high salience ratio that results in much higher torque over the speed range than SPM synchronous motors. Moreover, IPMs are less sensitive to PM temperature than SPMs [9].
A traction motor can be either a three-phase or a multi-phase motor. Multi-phase machines are preferable due to their advantageous attributes such as lower power rating per phase, due to higher phase number, lower torque ripple, due to enhanced magnetomotive force (MMF) distribution in the air gap, fault-tolerance operation, due to higher degrees of freedom, and higher torque density, due to harmonic current injection [10]. On the contrary, these machines require more complicated design and control schemes. Advancements in power electronics and control fields have fortunately mitigated these complexities. Numerous machine configurations were proposed including a nine-phase machine [11], an asymmetrical six-phase machine [12], a symmetrical six-phase machine [13], and a five-phase machine [14].
During the design phase of the traction motor, some criteria must be considered as constant power speed range (CPSR), vibration and acoustic noise, winding factor, torque and power density, demagnetization capability, motor losses, and MMF distribution [15]. Fractional slot concentrated winding (FSCW) has great merits as it meets many of these criteria; it has a high-power density, wide flux weakening range, higher efficiency at lower speeds, high slot fill factor, low cogging torque, shorter end windings, and a fault-tolerance capability. However, one of the main problems of FSCW is the high core losses at high speeds. This is a result of non-uniform air gap flux density distribution. This distribution introduces sub- and super-harmonics that induce eddy currents in the rotor. Consequently, eddy currents overheat magnets, which may cause demagnetization. Additionally, the interaction between low-order harmonics results in noise and vibration [16]. Methods have been proposed in the literature to overcome the demerits of FSCW and optimize their usage [17,18].
Design optimization is one of the principal stages in the design process as it enhances machine performance, where several criteria are to be met, considering certain constraints. Desired criteria are formulated into an optimization or cost function. The optimization function can be of a single objective or multiple objectives. Sometimes, multimodality is introduced in the design in which there is more than one optimal solution, among which one is globally optimum. In this case, it is a best practice to have access to as many locally optimal solutions as possible to choose from based on the tradeoff among various criteria. From a machine design perspective, the optimum solution tries to maximize average torque, power, and efficiency while minimizing losses, torque ripple, and cogging torque by varying machine dimensions such as slot opening, magnet dimensions, and the split ratio [19].
Several papers in the literature covered machine design, in particular IPM, from different viewpoints. An adaptive-sampling-based multimodal design optimizes a V-shaped IPM by minimizing active parts’ weight and losses [20]. Differential evolution (DE) is used with finite element analysis (FEA) to obtain a wider CPSR considering the saturation effect [21]. Particle swarm optimization (PSO) with intelligent particle number control is used to minimize total harmonic distortion (THD) in the back electromotive force (back emf) in IPM [22]. A genetic algorithm, with the aid of deep learning, is used to optimize IPM through the introduction of a convolutional neural network (CNN), thus reducing finite element analysis time to one-tenth of the original duration [23].
In the literature, [
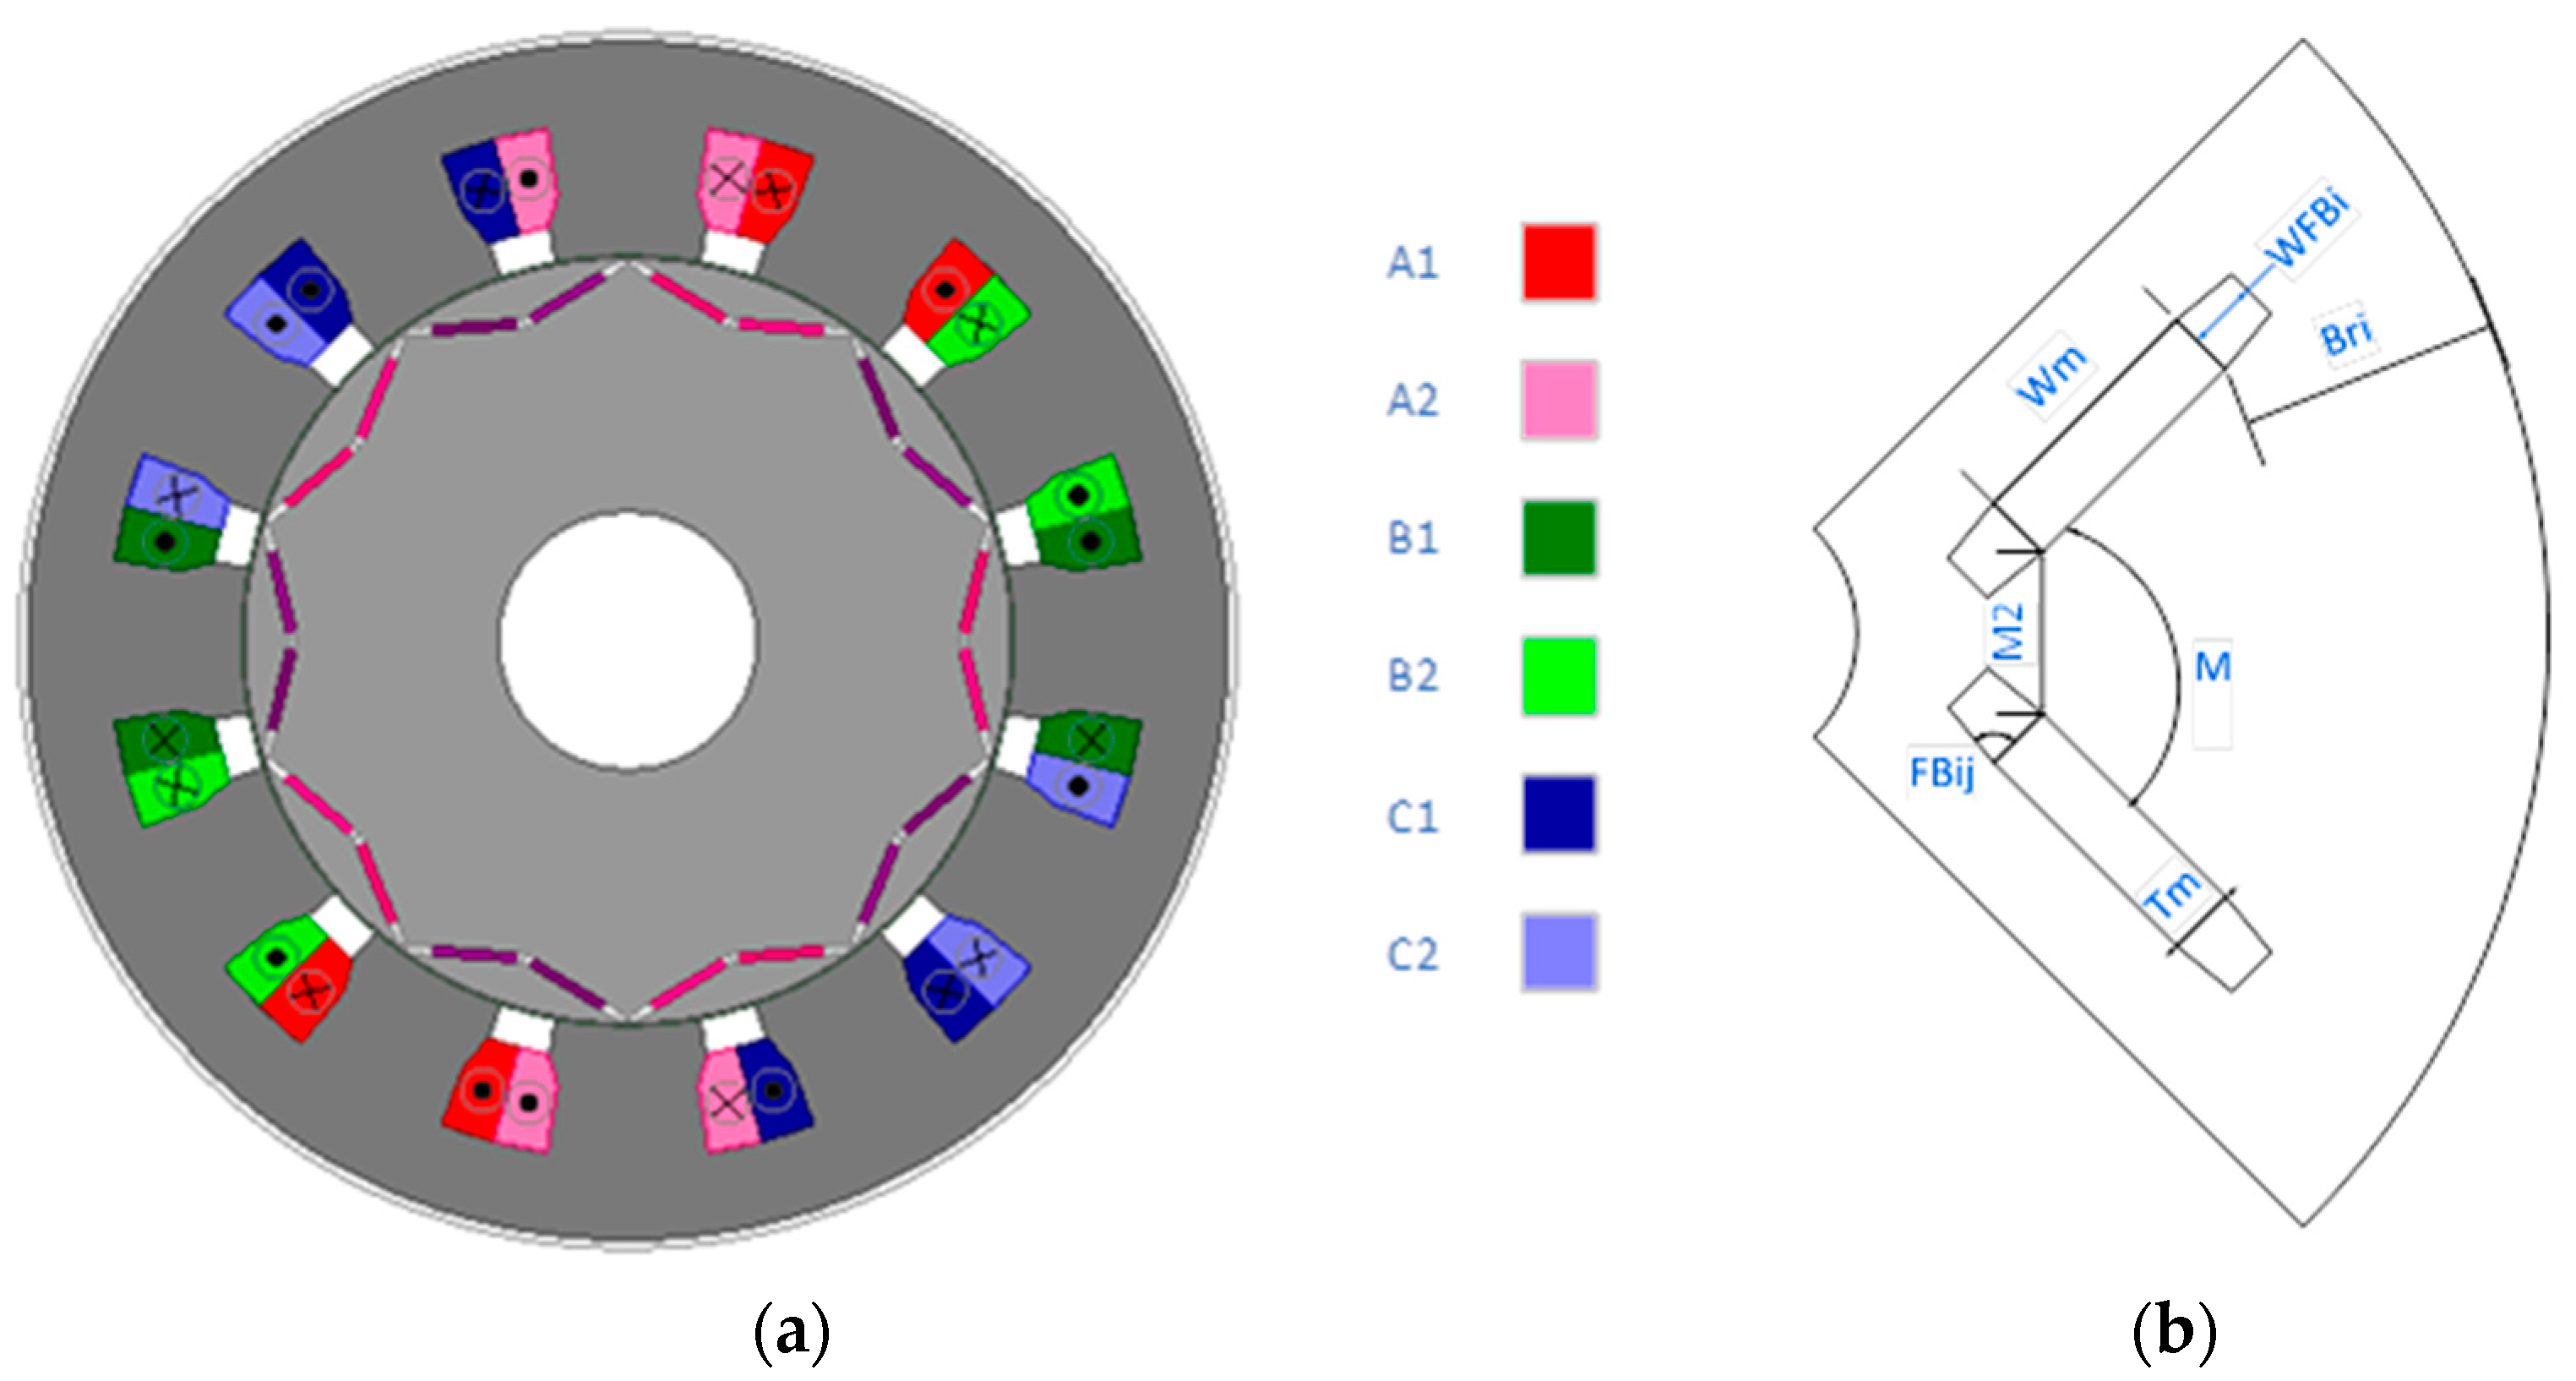
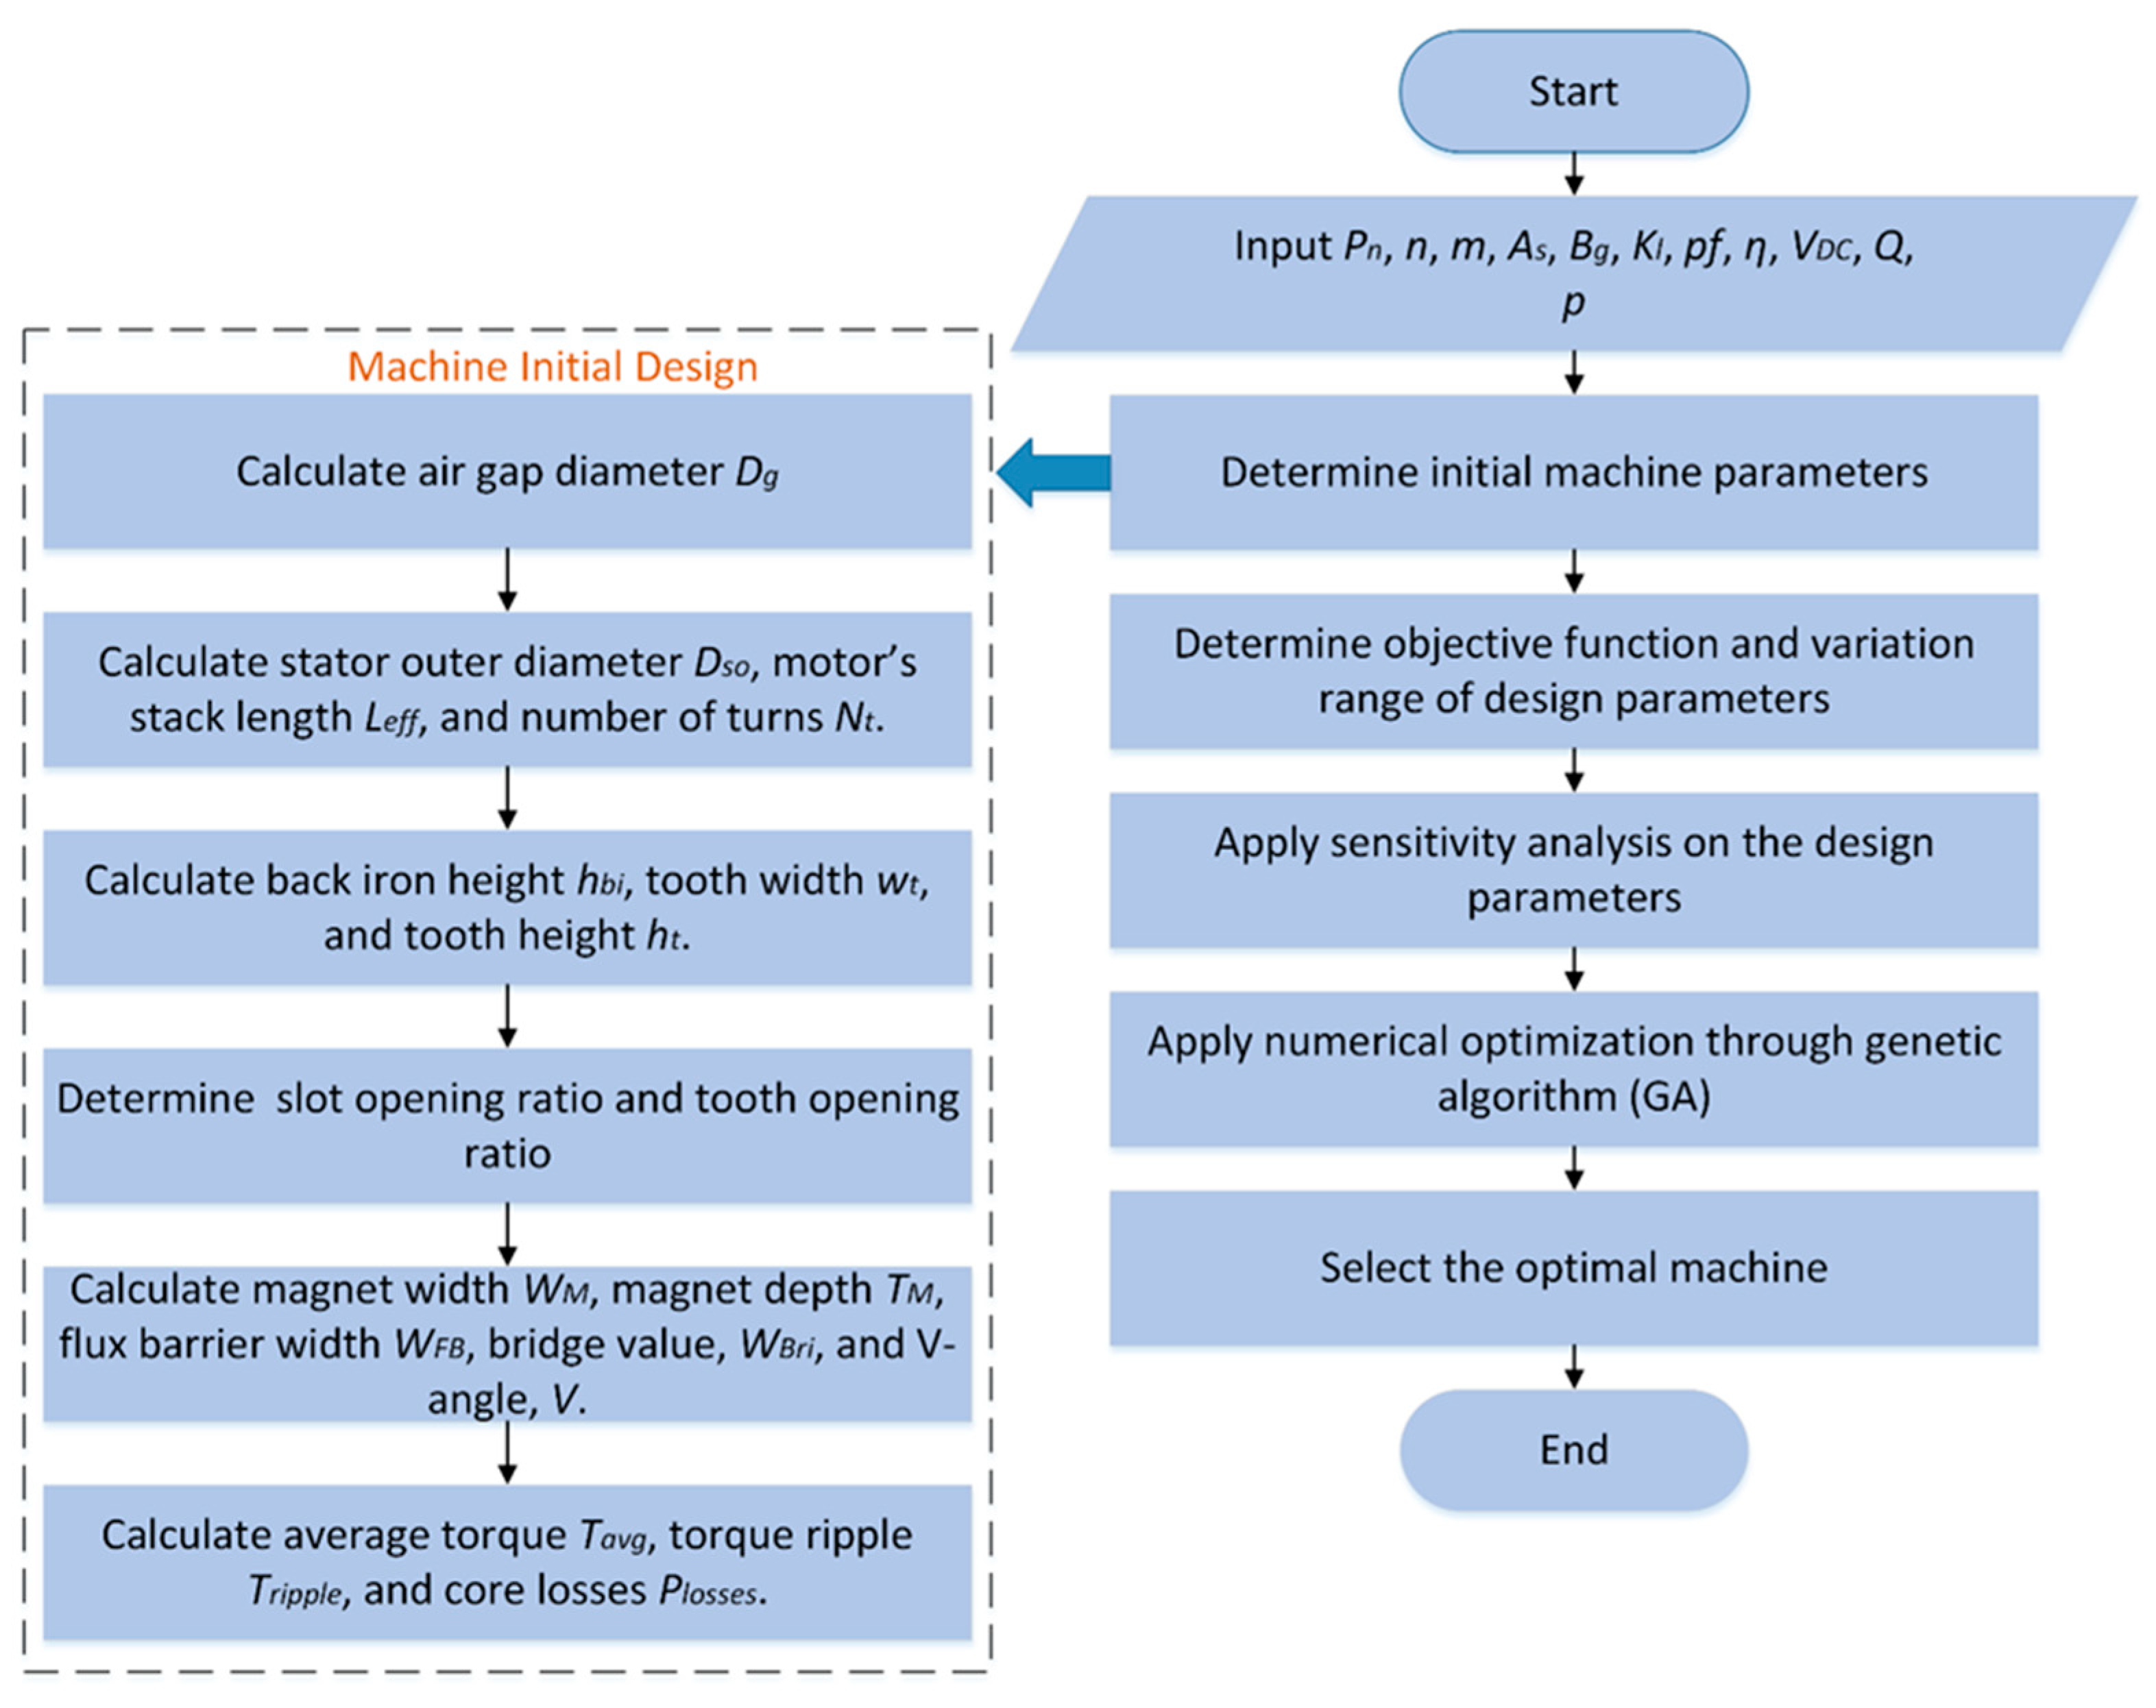
24] designs and analyses an SPM synchronous motor for IOBC application and optimizes the design using the analytical method. This paper follows the same approach but uses an IPM synchronous machine and optimizes the design using finite element optimization. This paper aims to provide a comprehensive study for optimally designing a 15 kW six-phase 12-slot/10-pole IPM synchronous machine for IOBC application under both propulsion and charging modes. First, a preliminary design is calculated according to sizing equations [25] to obtain the air gap diameter, and then the outer diameter and stack length are calculated from the predefined split ratio and aspect ratio, respectively. Back iron thickness and slot specifications are calculated from [26]. After that, magnet dimensions and positions are calculated to avoid saturation and ensure reasonable flux densities. Thereafter, sensitivity analysis is carried out to highlight the effect of various decision variables and their contributions. Then, the optimization process is performed using the finite element method (FEM) along with a genetic algorithm (GA) to choose the best design meeting the objective function and fulfilling the desired criteria. During propulsion mode, it is required to maximize the torque and minimize both the torque ripple and the losses. Lower torque ripples ensure smoother operation and a more stable movement, and lower losses indicate higher efficiency. During charging mode, since the net torque is nullified, the main aim is to reduce the torque ripple and the losses. As the torque ripple decreases, vibration and noise will decrease. As for the losses, ventilation is needed to reduce the losses. More losses mean poorer ventilation, so it is required to reduce losses. Our additional goal is to reduce the magnet’s size in order to reduce its cost. Finally, the optimal machine performance is experimentally verified.

2. System Overview

This section illustrates the six-phase integrated on-battery charger (OBC) under study, which is shown in Figure 1a. The integrated OBC comprises a six-phase machine, an inverter, and a battery pack with its DC-DC converter preserving the DC bus voltage at the required value. The winding configuration used is the asymmetrical six-phase winding, where the spatial angle between the two three-phase winding sets is 30 ° . The transition between propulsion mode and charging mode is achieved through a simple hardware reconfiguration.
In the propulsion mode, the switch S 1 is open, disconnecting the grid, and the switches S 2 S 5 are closed, connecting the two sets in the series and thus creating a single neutral point. Each winding group is supplied through a separate three-phase inverter. On the contrary, during charging mode, the switch S 1 is closed, and the switches S 2 S 5 are open, connecting the machine to the grid. Synchronization with the grid is commonly carried out using a standard phase-locked loop. This configuration ensures that the phase sequence of a winding set is the opposite of the other set (grid currents a g , b g , c g supply the first set through the order a 1 b 1 c 1 and the second set through the order b 2 c 2 a 2 ). As a result, the field produced in each winding set is opposite to the other set, and the resultant torque-producing component vanishes, producing zero torque. The charging mode is accompanied by torque ripple, but it is within the accepted range. The spatial angle between the two winding groups during the charging mode is 210 ° [27]. Figure 1b,c show the phasor diagrams of the machine under propulsion and charging modes, respectively.

3. Machine Design

This section presents the various stages of the machine design process of a typical six-phase integrated OBC. These stages are selecting a base machine, proposing the design flowchart, implementing the sizing equations, and selecting a multi-objective optimization strategy.

3.1. Selecting Base Machine

Among several PM motors used for electric and hybrid electric vehicles, an IPM machine is chosen. There are several topologies of rotor magnet configurations for the IPM motors as radial, circumferential, V-shape, U-shape, and delta shape. The V-type topology is chosen as it is known for having high torque over a wide speed range [28]. The IPM motor topology and its parametric model are depicted in Figure 2. The key parameters of the model include the magnet width, W m , the magnet thickness, T m , the clearance between the two magnets, M 2 , the bridge between the magnet and rotor surface, W B r i , the V-angle between the two magnets, V , and flux barrier width, W F B i , where i takes a value of one or two; one indicates the upper flux barrier, and two indicates the lower flux barrier. The flux barrier’s two angles are represented as F B i j ; where j represents a value of one or two, the two base angles are kept constant. The two base angles are considered symmetrical for simplicity. First, an initial design is assigned to the machine based on specific predetermined inputs, requirements, and constraints [29,30], as shown in Table 1. Then, an FE simulation takes place to ensure that the initial design satisfies the required objectives. Finally, the design undergoes a sensitivity analysis and an optimization process to enhance its performance, achieve any unmet requisites, and ensure the design is optimal from both cost and operation perspectives.

3.2. Sizing Equation

In the preliminary design stage, it is compulsory to define some fundamental motor parameters. One of the primary parameters is the air gap diameter D g that is calculated from the sizing Equation (1) [25]; hence, stator outer diameter and machine effective length can be computed as follows:
P n = 2 π 3 4 K w K l η B g A s f p D g 3
K l = L e f f D g
λ = D g D s o
where P n is the motor-rated power in watts (W), K w is the winding factor, η is the desired output efficiency, B g is the average air gap flux density in Tesla (T), A s is the stator electrical loading in ampere per millimeter squared (A/mm2), f is the frequency in hertz (Hz), and p is the number of pole pairs. The ratio between effective length and air gap diameter is defined as the aspect ratio K l , whereas the ratio between the air gap diameter and stator outer diameter is defined as the split ratio λ . The winding factor can be obtained through a series of equations presented in [26], or simply from tables given in [31]. The rest of the motor geometrical parameters can be derived analytically as starting parameters to initiate the optimization process [29].

3.3. Design Flow Chart

The design process is demonstrated in Figure 3. The process commences by selecting the number of motor phases, m , slot/pole combination, stator electrical loading, A , average air gap flux density, B g , aspect ratio, K l , and split ratio, λ . Consequently, the air gap diameter, D g , can be calculated, and thus the stator outer diameter, D s o , and the machine’s effective length, L e f f , can be computed. Magnet size is determined based on the required flux density under each of the machine poles. Referring to electromagnetic principles, back iron thickness, h b i , tooth height, h t , and tooth width, w t , can be computed by applying Equations (5)–(7) [26].
h b i = B g π D g 2 B b i p
h t = D s o D g 2 h b i
w t = B g π D g B t Q
B b i is the flux density in the back iron, B t is the flux density in the tooth, and Q is the number of slots. Motor input voltage can be calculated based on DC bus voltage and the inverter modulation index expressed in Equation (7). Motor current and the number of turns can then be calculated using Equations (8) and (9), respectively.
V p e a k = m i V D C = 1 2 cos ( π 2 m ) V D C
I p e a k = 2 P n η m V p e a k cos θ
N t = V p e a k K e Q B g f p 1 λ 2 D s o 2
m i is the modulation index, V D C is the DC bus voltage, V p e a k is the rated peak voltage, cos θ is the desired power factor, I p e a k is the rated peak current, N t is the number of turns, and K e is the EMF factor.

3.4. Rotor Design

Rotor design constitutes a principal importance in the design of an IPM. In IPM, the magnet bars are inserted into the rotor. There are various topologies for IPM rotors as V-shape single-layer IPM, V-shape double-layer IPM, W-shape IPM, segmented IPM, Delta-shape IPM, and many others [32,33]. The proposed design is the V-shape single-layer IPM. The V-shape IPM shows higher average torque, higher power factor, and lower torque ripple compared to the other configurations [34,35]. Moreover, the V-shape shows the lowest mass needed to achieve a specific torque level among the other topologies [33].
The basic design starts with the flux continuity equation [36]. In the ideal case,
ϕ g = ϕ m
where ϕ m is the flux produced by the magnet, and ϕ g is the flux crossing the air gap. Practically, not all the magnet flux reaches the air gap due to leakage flux. As a result,
ϕ g = k l ϕ m
where k l is called the leakage factor and varies from 0.9 to 1. k l is chosen as 0.9 in the worst-case scenario. The flux densities in terms of cross-sectional areas are
ϕ g = B g A g ;   ϕ m = B m A m
where B g is the air gap flux density, A g is the air gap cross-section, B m is the magnet flux density, and A m is the magnet cross-sectional area and where
A m = W m L e f f
yields
k l B m W m L e f f = B g A g
The magnetomotive force provided by the magnets is equal to the MMF received by the air gap if the MMF requirement of the stator and rotor iron is considered negligible.
H m T m = H g g
H m is the magnet field intensity, and H g is the air gap field intensity. To compensate for the MMF drop of the rotor, we introduce the reluctance factor, k r , which ranges from 1 to 1.15. It is selected as 1.15.
H m T m = H g g k r
The normal B–H curve relating H and B is given by
B = B r H c H + B r
where B r is the remnant flux density, and H c is the coercivity. The operating point ( H m , B m ) is typically at 90 % of the remnant flux density [36]. The selected magnet is NdFe 30 whose B–H curve is given in the datasheet [37]. Substituting into Equations (12)–(17) gives the initial dimensions for the magnet, namely, 21 and 2.1 mm for W m and T m , respectively.

4. Sensitivity Analysis and Optimization

Evaluation of any motor depends basically on its performance. Several performance metrics assess the motor to determine whether it suits the application or not. As for EV applications, the most significant performance metrics are the average torque, torque ripple, and core losses. Being notably present and influential in FSCW machines, MMF space harmonic components introduce torque ripples, thus increasing the machine’s noise and vibration levels. As a result, one main task is to lessen torque ripples. In addition, another chief goal is to minimize core losses to reduce thermal stresses and avoid magnet thermal demagnetization. One principal step in obtaining and controlling these performance metrics is to perform sensitivity analysis.
Sensitivity analysis plays a vital role in the optimization and evaluation processes, and the design process in general. It determines the impact of changing each parameter on the outcome of each objective. There are numerous methods and techniques used to implement sensitivity analysis [38,39]. The technique used in this study is the variance-based sensitivity indices technique. The decision variables chosen for the sensitivity analysis are the magnet width, W m , the magnet thickness, T m , the clearance between the two magnets, M 2 , the bridge between the magnet and rotor surface, W B r i , the V-angle between the two magnets, V , and the flux barrier widths, W F B 1 and W F B 2 .

4.1. Variance-Based Sensitivity Analysis

To achieve an accurate study and account for the interaction between parameters, we use the variance-based sensitivity analysis method. The indices resulting from our use of this method indicate the effect of parameters on motor performance. The sensitivity indices denoted by ρ y x i are given by
ρ y x i = σ 2 ( E y x i ) σ 2 ( y )
where E y x i is the average value y when x i is held constant, σ 2 ( E y x i ) is the variance of E y x i , and σ 2 ( y ) is the variance of y [40].
The indices calculated are ρ T m e a n p r o p x i , ρ T r i p p l e p r o p x i , ρ T r i p p l e c h a r x i , ρ c o r e p r o p x i , ρ c o r e c h a r x i , where they indicate the sensitivity indices for average torque in propulsion mode, torque ripple in propulsion mode, torque ripple in charging mode, core losses in propulsion mode, and core losses in charging mode. The sensitivity function aggregating all these indices is given by
H x i = λ 1 ρ T m e a n p r o p x i + λ 2 ρ T r i p p l e p r o p x i + λ 3 ρ T r i p p l e c h a r x i + λ 4 ρ c o r e p r o p x i + λ 5 ρ c o r e c h a r x i
λ shows the weight of each index. The indices are weighted equally, and each λ weighs 0.2. Table 2 shows the initial values of those parameters and their variation ranges. The output sensitivity indices are presented in Table 3. Each value in this table corresponds to the contribution of the parameter to the objective “index”. It is clearly seen that W M , W B r i , M 2 , and V a n g l e have a larger effect on the overall objective than the rest of the parameters. The bar charts representing the sensitivity analysis of each design parameter are shown in Figure 4.

4.2. Finite Element (FE) Based Optimization

A finite-element-based optimization process is performed to enhance the design of the machine and achieve better results. The FE-based optimization process is carried out with the use of two simulation platforms, namely, Ansys Maxwell and Optislang. Ansys Maxwell is responsible for the design and FEA, while Optislang is responsible for the optimization process. A preliminary design is set first, considering the machine geometry and specifications, the material used, and the excitation. Next, the FEA is prepared by running the simulation to calculate the initial values. Then, Ansys Maxwell is integrated with Optislang to initiate the optimization process. The initial stage in the optimization process is to set the decision variables and geometrical parameters of the machine relating to its performance and objectives. This can be seen as selecting the inputs and outputs of the process. Geometrical dimensions, namely the magnet width, the magnet thickness, the magnet clearance, the magnet bridge, the V-angle, and the two flux barrier widths, are chosen as the inputs, and the performance metrics, namely the average torque, the torque ripple, the losses, and the magnet size, are chosen as the outputs. After that, the sensitivity analysis, presented in Section 4.1, takes place to determine the relation between each input and the outputs and the effects of the inputs on the outputs. The state, whether it is constant or variable, the type, whether it is continuous or discrete, and the range of variation of each input is then determined. The sampling method and the number of iterations for the sensitivity analysis are set. In this paper, the sampling method used is the Adaptive Metamodel of Optimal Prognosis (AMOP), which tries to search for the optimal input variable set and the most appropriate approximate model. The number of iterations is adjusted to 30 to compromise the computational time for the used computer. The used computer has an AMD A8-6410 APU with AMD Radeon 2.00 GHz processor and 8 GB RAM. A metric called the coefficient of prognosis (CoP), a measure indicating the model quality, is set to 0.95. The next step is deciding the required objectives and the problem constraints. The objectives are stated through an optimization function to be minimized. The proposed objective function is
F x i = T a v e r a g e T a v e r a g e ( X i ) + P c o r e p r o p u l s i o n ( X i ) P c o r e p r o p u l s i o n + T r i p p l e p r o p u l s i o n ( X i ) T r i p p l e p r o p u l s i o n + P c o r e c h a r g i n g ( X i ) P c o r e c h a r g i n g + T r i p p l e c h a r g i n g ( X i ) T r i p p l e c h a r g i n g + M s i z e ( X i ) M s i z e
The proposed objective function is subject to
T a v e r a g e 96 N . m
T r i p p l e 8 %
K C u 40 %
J 4 m m 2
X i m i n X i X i m a x
where T a v e r a g e ( X i ) , P c o r e p r o p u l s i o n ( X i ) , T r i p p l e p r o p u l s i o n ( X i ) , P c o r e c h a r g i n g ( X i ) , T r i p p l e c h a r g i n g X i , and M s i z e ( X i ) are the optimized values for the average output torque, core losses during propulsion, torque ripple during propulsion, core losses during charging, torque ripples during charging, and magnet size, respectively, and where T a v e r a g e , P c o r e p r o p u l s i o n , T r i p p l e p r o p u l s i o n , P c o r e c h a r g i n g , T r i p p l e c h a r g i n g , and M s i z e are the corresponding initial values, J is the current density measured in A / m m 2 , and K C u is the copper fill factor. X i corresponds to the decision variables used in the sensitivity analysis study, with their ranges described in Table 2. The initial values are calculated through FE simulation. These constraints ensure the chosen machine will operate under the desired conditions properly. Finally, the optimization process is initiated. The optimization algorithm used is the genetic algorithm (GA). GA is a well-known and well-established heuristic optimization method in electric machine design [19,20,41,42,43,44,45,46,47,48]. The process starts with a random initial population, which represents the preliminary design. The minimum and maximum number of generations are set to 20 and 100, respectively. Then, the fitness of the population is evaluated. The evaluation is reflected in assessing the objective function. After that, the population undergoes three stages, namely, selection, crossover, and mutation. In the selection stage, mating parents are chosen. The selection method used is the stochastic method with a linear ranking of parents. The number of parents is set to six. In the crossover stage, mating takes place. A crossover with a multipoint that has two points is used. In the mutation stage, variations are made to ensure convergence will be reached. A self-adaptive mutation with a rate of 43% is chosen. The fitness of the new population after these stages is tested. The three stages and the fitness evaluation are repeated until convergence is achieved. This can be checked when the variation in the fitness function is lower than a tolerance. The parameters of GA are selected as the default values of the software, which were found satisfactory for this design case. The number of iterations is adjusted to be suitable for the computational capabilities of the computer used and to ensure that the errors are maintained within acceptable limits. Figure 5 depicts the GA flowchart. Figure 6 presents the optimization results of the six objectives under the two modes of operation. Final machine specifications are listed in Table 4.

5. Optimal Machine Versus Initial Machine

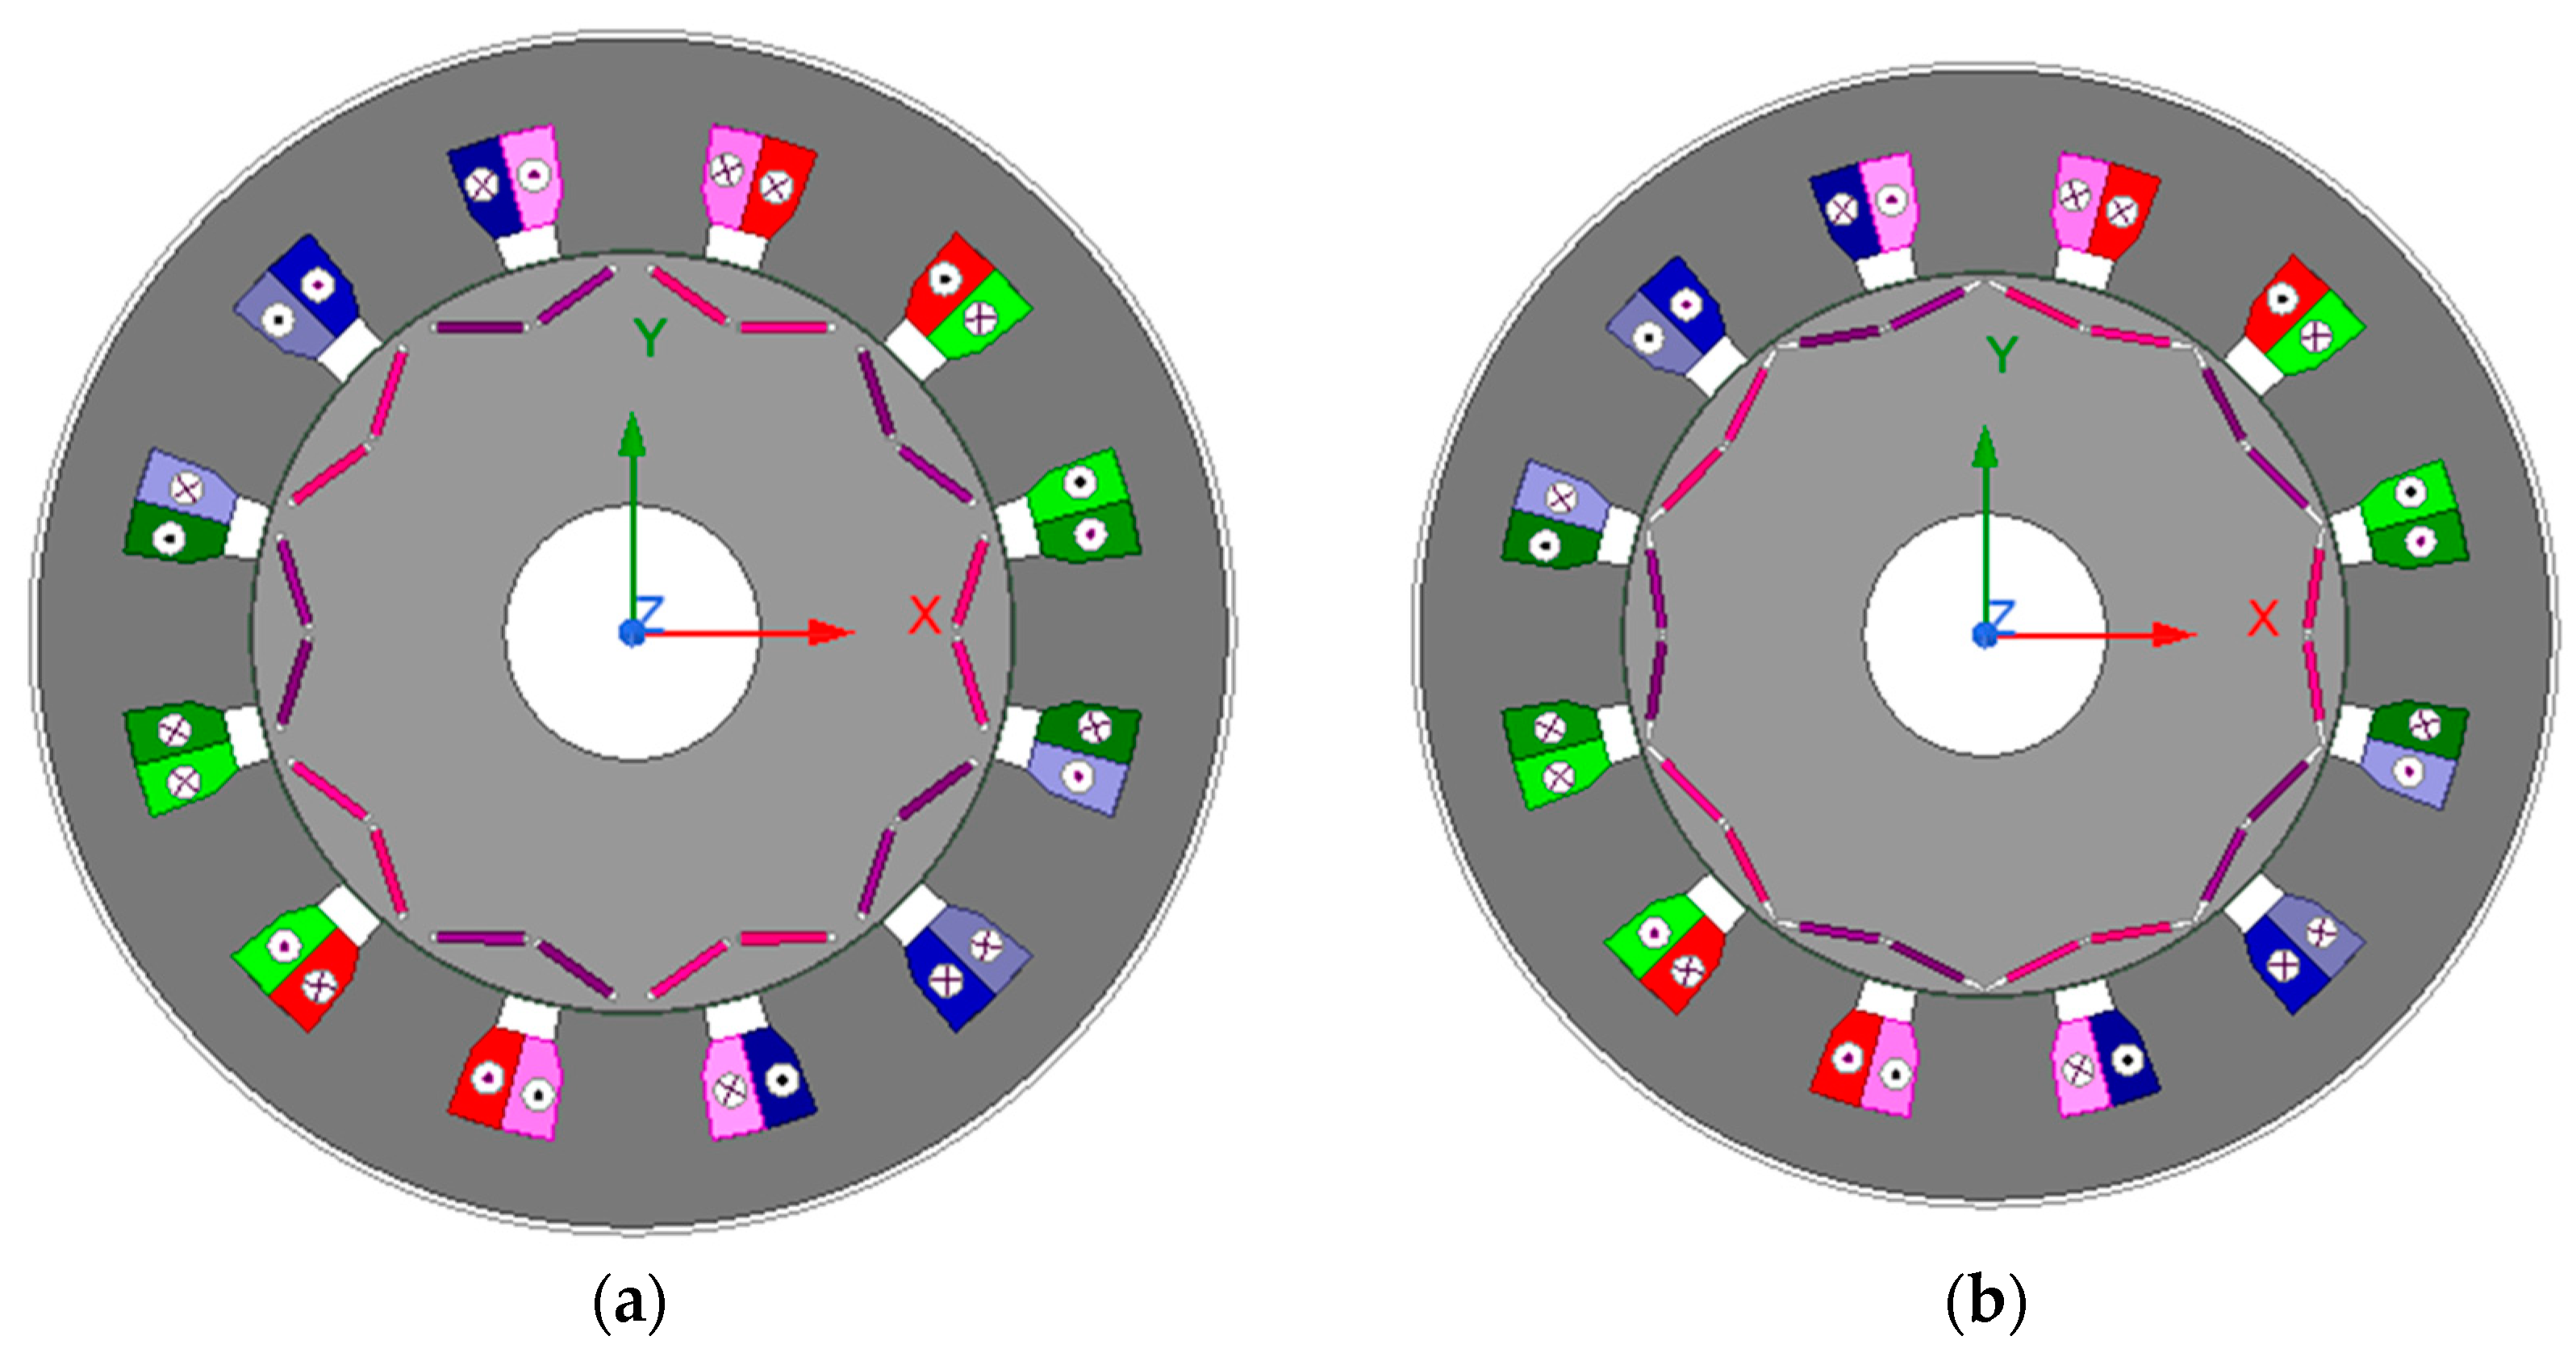
Figure 7 gives the configurations of the initial and optimized designs. It is clearly seen that the V-angle has increased from 125 ° to 153 ° , which consequently produces more torque. The magnet width has decreased from 21 to 20 mm, and the magnet thickness has changed slightly from 2.2 to 2 mm. This results in an overall decrease in magnet size. Moreover, the flux barriers have increased from 1.5 to 5.9 mm and from 1 to 1.5 mm for upper and lower barriers, respectively, thereby producing more reluctance torque.
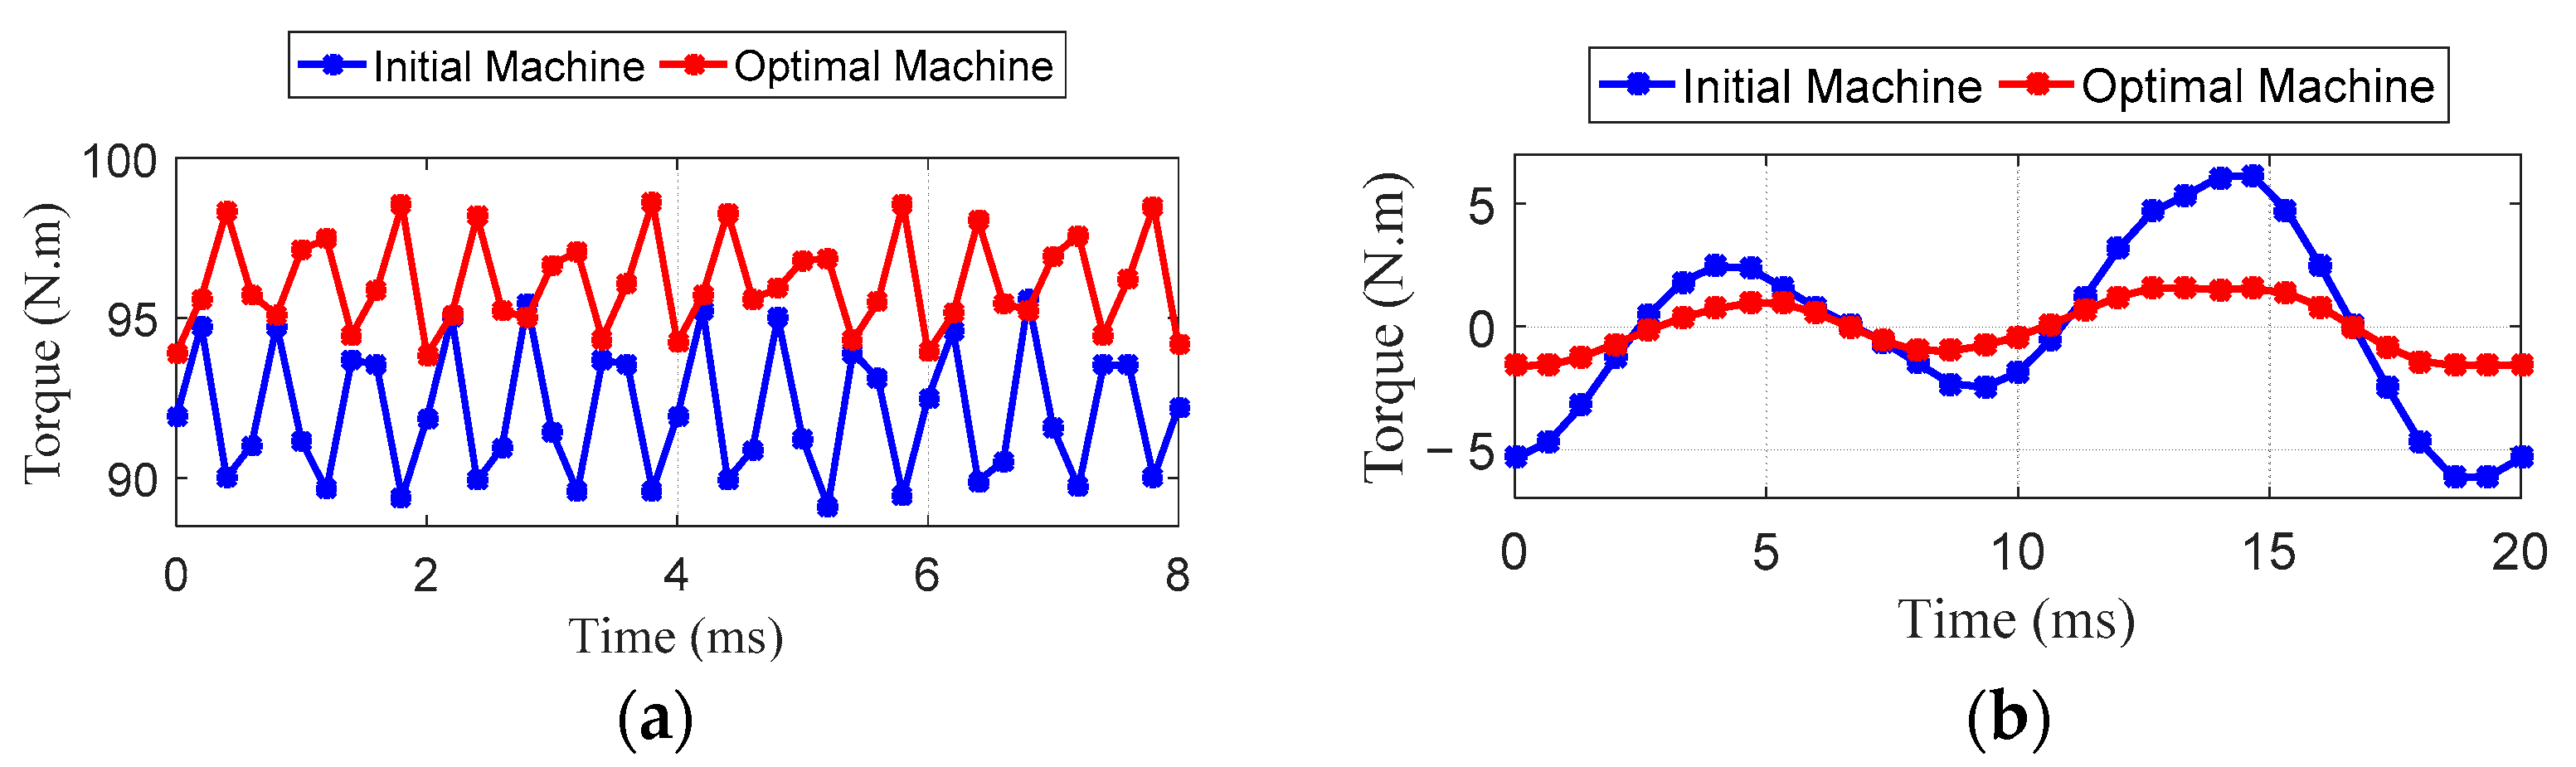
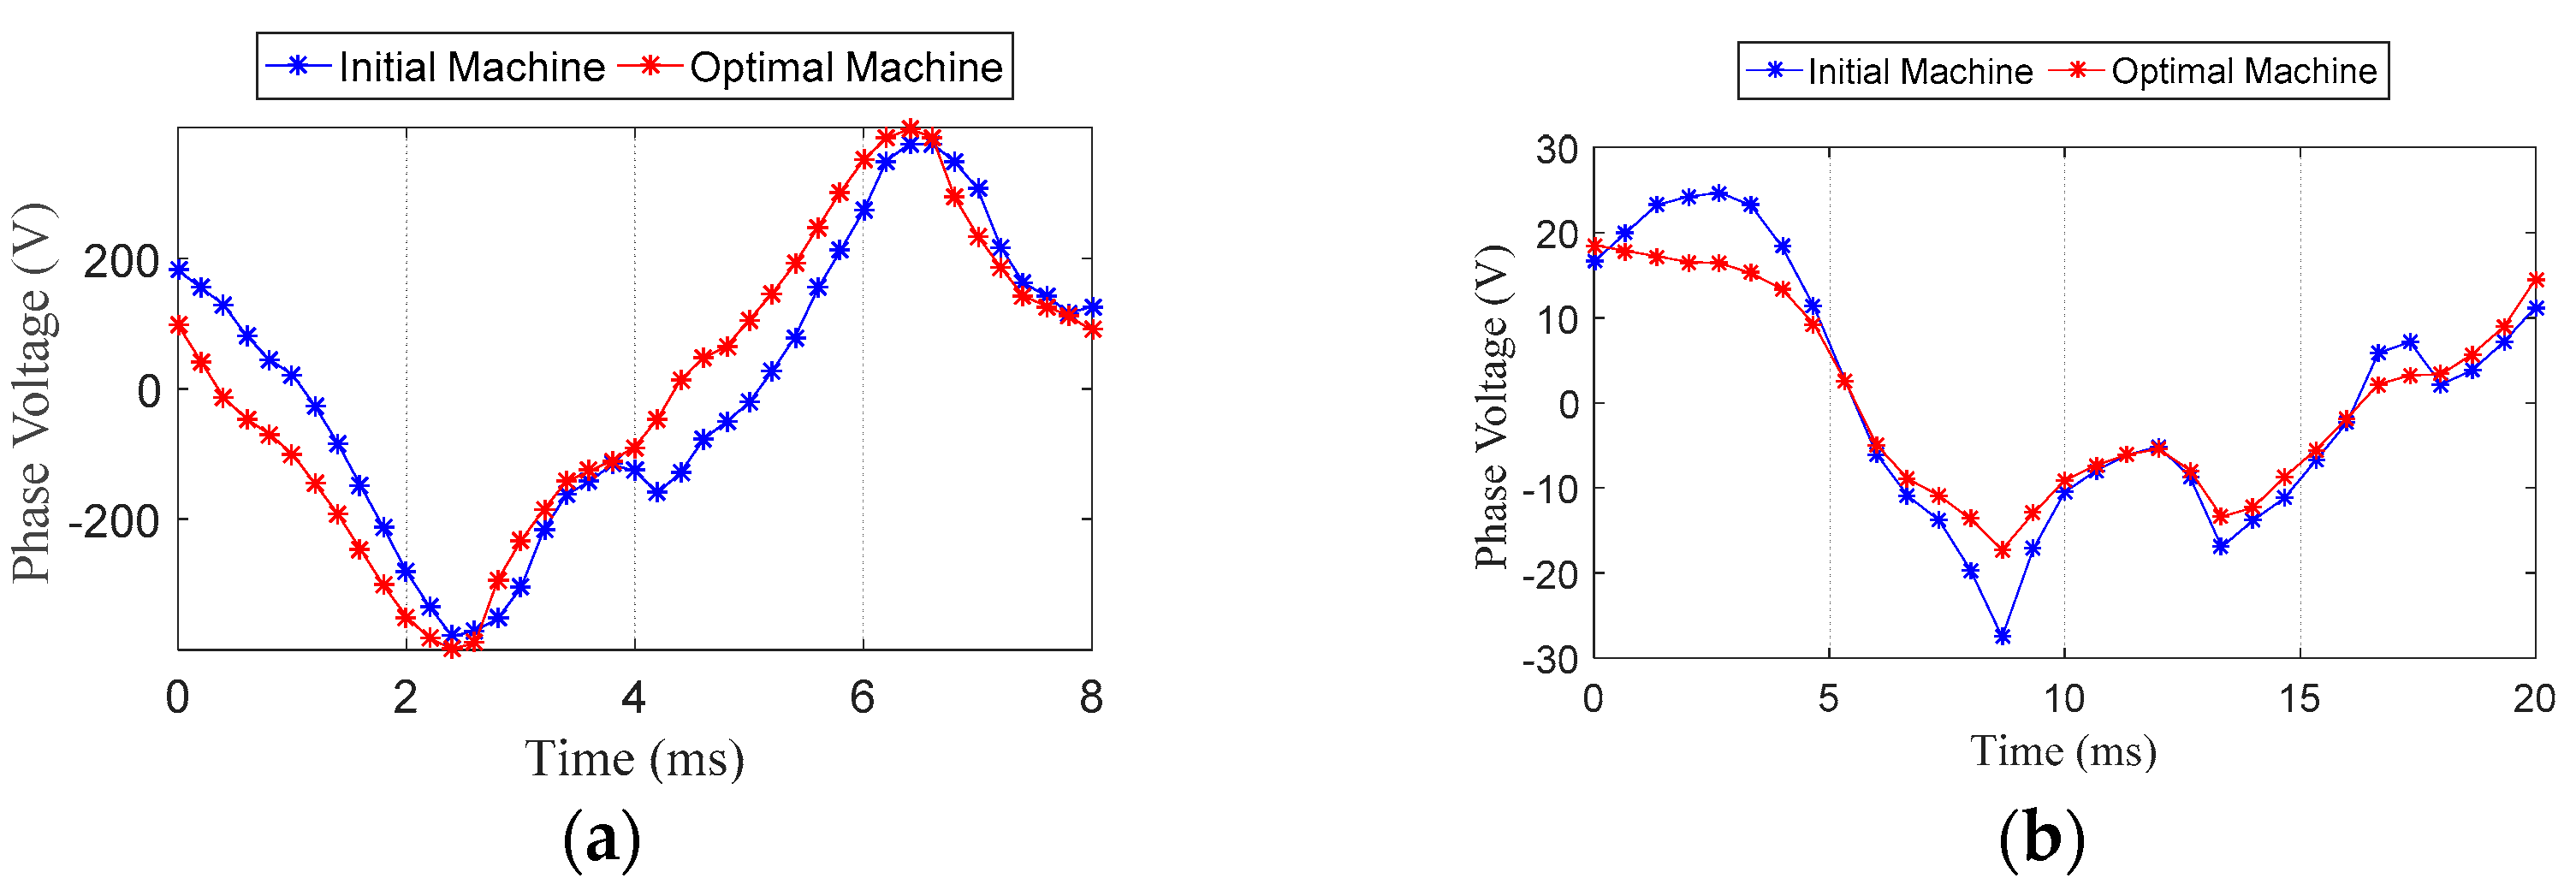
Table 5 compares the initial and optimal machines. It is clearly seen that the optimal machine has enhanced the proposed model. In propulsion mode, there is an increase in torque of about 4 N.m accompanied by a decrease in torque ripple of about 2 N.m. Moreover, there is a notable decrease in core losses of about 26 W. The decrease in the magnet clearance and magnet width and the increase in the V-angle contribute to this reduction, as suggested by the sensitivity analysis results. The phase voltage reaches 225 V in the optimal machine, compared to 215 V in the initial machine. As for charging mode, there is a reduction in torque ripple of about 11 N.m and in core losses of about 9 W. The phase voltage decreases by about 3 V. Additionally, the size of each magnet has decreased by about 850 m m 3 , hence reducing the cost of each magnet. Figure 8 and Figure 9 present the torque and the phase voltage, respectively, under propulsion and charging modes, respectively. The magnet used is NdFe-B. The knee of the demagnetization curve of the magnet operating at 125 ° is near −800 kA/m [37]. The maximum field intensity over the magnet area under the maximum phase current was found as −664 kA/m, as illustrated in Figure 10. Hence, there is no chance the armature reaction undercharging will demagnetize the magnets. Needless to say, the torque-producing component undercharging is ideally zero. Hence, the MMF harmonic components produced under charging represent only non-producing torque components [49]. Figure 11 represents the efficiency map of the optimal machine. It is clear that the machine operates at rated speed with high efficiency (about 95%) and can reach over 80% efficiency at CPSR.

6. Experimental Validation

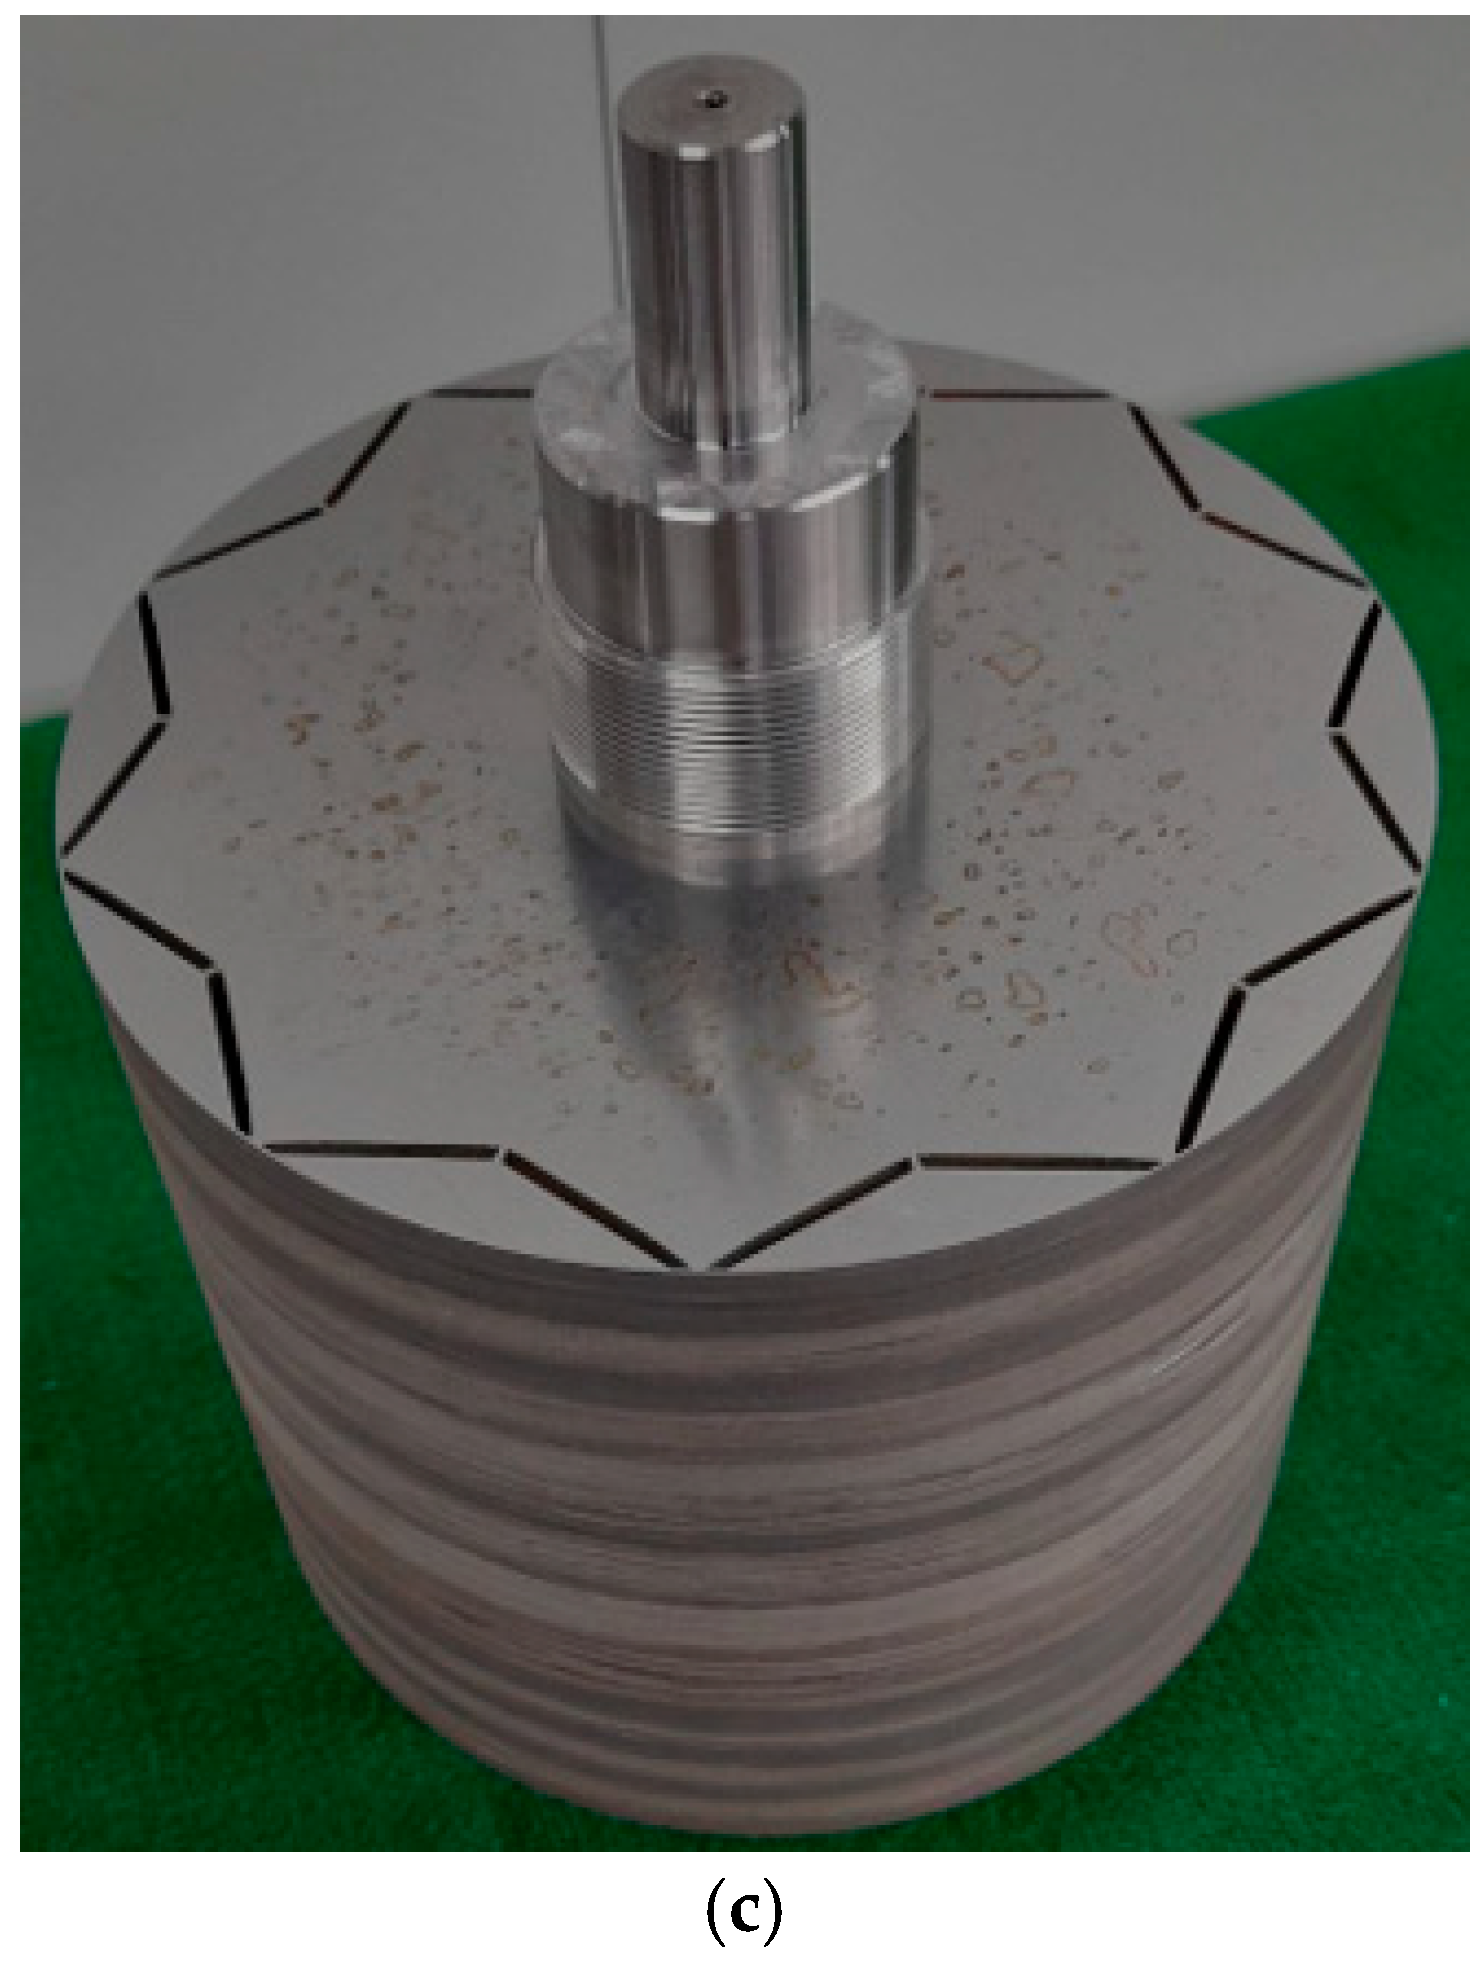
A crucial and principal step in the design process is to verify the precision of the proposed design and the optimization approach through experimental tests. A 12-slot/10-pole IPM is fabricated and shown in Figure 12, and experimental investigations, under both the propulsion and the charging modes, are conducted using the test bench illustrated in Figure 13. The experiments and the FE simulations are performed at the rated speed of the motor, 1500 rpm, and at a DC bus voltage of 600 V. The field-oriented control (FOC) technique is implemented to drive the motor in the propulsion mode [50]. FOC is implemented as follows:
  • The Park’s transformation is utilized to transform motor currents into measured i d and i q . i d is aligned with the rotor magnetic field, and i q is π / 2 ahead of i d . i q reference is controlled by a PI closed-loop speed controller, while i d reference is nullified to obtain maximum allowable torque.
  • The d-axis and q-axis current controllers generate the voltage references. The inverse Park’s transformation is employed to calculate the actual voltage values that are fed to the sinusoidal pulse width modulated (SPWM) inverter to feed the motor in propulsion mode.
In addition, predictive current control is used for the charging process [51,52]. This technique must ensure that:
  • The grid current components are controlled in a way that maximizes the reference direct component i d * , thereby maintaining maximum charging level, canceling out the reference quadrature component i q * , and assuring the grid-side operation with a unity power factor. The reference sequence current components are regulated based on the reference grid current components.
  • The inverse Park’s transformation is employed to calculate the x y reference currents, i x y * and the reference α β grid current, i α β * , which have the same value, with the grid being synchronized with the inverter using a phase-locked loop (PLL).
  • A zero-average torque is generated by setting the stator α β currents, i α β , and the zero sequence current components, i 0 + 0 , to zero.
A dSpace microlab box 1200 model is used to implement the control strategy of the asymmetrical six-phase currents in both propulsion ( δ = 30 ° ) and charging modes ( δ = 210 ° ). Figure 1a,b show the asymmetrical six-phase phasor diagram of the propulsion and the charging modes, respectively. The experimental outcomes of the two operation modes are discussed in the subsequent subsections.

6.1. Propulsion Mode of Operation

The IPM motor is tested experimentally under the propulsion mode to check its performance. The IPM motor is mechanically coupled to a dynamometer. A battery emulator is used to feed the motor through a 40 kW, six-phase inverter. A measurement board is connected to the inverter to obtain results. The dSpace is responsible for the control technique implementation. A data acquisition unit is used for data processing, and an oscilloscope is used to visualize the data. First, the IPM motor is rotated, and the terminal voltages are measured to calculate the no-load back electromotive force (EMF). Then, the other motor is used as a load while exciting the IPM motor with the rated current, and the torque is measured using a torque sensor. Finally, the IPM motor is tested under step response to measure its dynamic response.
The experimental and the simulated no-load back EMF are shown in Figure 14. Obviously, there is a good match between the two values with a slight increase in the experimental results peak, namely the experimental results peak is 236 V, and the FE results peak is 230 V, with the experimental peak voltage value as the base. Additionally, Figure 15 presents the steady-state experimental torque values. Experimentally, the motor delivers about 95.77 N.m, compared to the simulated case where the motor outputs an average torque of 96.1 N.m due to the mechanical losses and vibrations that were not incorporated in the simulation. The simulated torque ripple during propulsion is 4.6 N.m, while the reported experimental torque ripple is about 0.1 N.m. This strange reported value is because of the limitations in the torque sensor capability. The torque sensor has a limited frequency of 10 Hz, corresponding to 100 ms. This sampling time is much greater than the current time period, and thus the whole torque variations are not captured. The stator currents during the propulsion mode are depicted in Figure 16. The motor-rated current, namely, 17.54 A rms, is set as the base. Figure 17 presents the experimental dynamic response of the machine. Plainly, the controller can efficiently respond to a speed change from 0 to 1500 rpm in about 1 s. Table 6 compares the experimental and the simulated results.

6.2. Charging Mode of Operation

As well as experimenting with the machine under the propulsion mode, an experiment is conducted under the charging mode. A grid emulator is used to imitate the grid during the charging process, and the dSpace is used to control the charging control algorithm. The data are obtained, processed, and displayed. During the charging mode, the grid current is 1.93 of the stator current. The motors rated current is taken as the base for current measurements, and all measurements are reported to be pu values. The three-phase grid line currents are presented in Figure 18, which are perfectly balanced. While Figure 19 shows the two winding sets and the grid currents. Only one phase from each winding set and the corresponding grid line current are presented for simplicity and clarity. Figure 20 presents the grid voltage and current in pu, with the grid current as the current base and the grid voltage as the voltage base. It is clearly seen that the unity power factor state can be achieved under maximum charging levels, charging with the rated conditions. Furthermore, the vibration level is checked. It is clearly seen that the motor does not rotate during charging, which indicates a zero-average torque, but it experiences a torque ripple that may cause mechanical problems based on its amplitude. This torque ripple amplitude can simply be investigated by checking the vibration level on the mechanical assembly. This has been carried out in the experiments using an accelerometer (IMI 622B01 ICP®®). The vibration level is shown in Figure 21. ISO 10816-3 standards provide guidance for evaluating vibration severity in machines [53]. This machine is considered a machine of class II (from 15 kW up to 300 kW). For class II, vibration is good in the range of (0–1.4 mm/s rms) and satisfactory in the range of (1.4–2.8 mm/s rms). The vibration level recorded during charging under full-load current is 2.7 mm/s rms, which is considered satisfactory and can maintain operation without vibrational issues.

7. Conclusions

This paper presents an optimal design of an asymmetrical 12-slot/10-pole IPM motor accompanied by a multi-objective optimization under propulsion and charging modes. Six key performance metrics constitute the optimization objectives (namely, average torque during propulsion, torque ripples under propulsion, torque ripples during charging, core losses during propulsion, core losses during charging, and magnet size), where the objectives are optimized with numerical genetic algorithm along with finite element analysis (FEA). The effect of various IPM parameters, specifically bridge value, V-angle, magnet width, magnet thickness, and magnet clearance on performance metrics, has been studied. The following inferences can be deduced:
  • For the propulsion mode, average torque is directly proportional to magnet width, magnet thickness, and V-angle. On the contrary, it is inversely proportional to the bridge value and magnet clearance.
  • For the propulsion mode, torque ripple is inversely proportional to the bridge value. On the other hand, regarding the variations in magnet width, magnet thickness, V-angle, and magnet clearance, some ranges show an increase in torque ripples while others show a decrease in torque ripples.
  • In the charging mode, torque ripple is directly proportional to the bridge value and magnet clearance. Conversely, it is inversely proportional to V-angle, magnet width, and magnet thickness.
  • In the propulsion mode, core losses are inversely proportional to the bridge value and magnet clearance. On the other hand, they are directly proportional to magnet thickness and magnet width. Additionally, they show variations in the changing V-angles.
  • For the charging mode, core losses are directly proportional to the bridge value and magnet clearance. In contrast, they are inversely proportional to V-angle, magnet width, and magnet thickness.
Finally, a prototype of the machine is constructed to validate the proposed design with the desired specifications. The prototype shows a match with acceptable accuracy to the results given by the FE simulation. The torque in the propulsion mode has an error of only 0.34%. The back EMF shows a match of about 97.45%. Only the torque ripple cannot be measured accurately due to sensor limitations.

Author Contributions

Conceptualization, A.T.A.-W., Z.U. and A.S.A.-K.; methodology, A.T.A.-W. and M.S.H.; software, A.T.A.-W. and Z.U.; validation, A.T.A.-W. and Z.U.; formal analysis, A.T.A.-W., A.S.A.-K. and N.A.E.; investigation, A.T.A.-W. and S.A.; resources, A.S.A.-K., M.S.H. and S.A.; data curation, A.T.A.-W. and Z.U.; writing—original draft preparation, A.T.A.-W., A.S.A.-K. and M.S.H.; writing—review and editing, A.T.A.-W., A.S.A.-K., N.A.E. and S.A.; visualization, A.T.A.-W. and Z.U.; supervision, A.S.A.-K. and S.A.; project administration, N.A.E., A.S.A.-K., M.S.H., and S.A.; funding acquisition, A.S.A.-K., M.S.H. and S.A. All authors have read and agreed to the published version of the manuscript.

Funding

This research was funded by ITIDAs ITAC collaborative funded project under the category type of advanced research projects (ARP) and grant number ARP2020.R29.7.

Institutional Review Board Statement

Not applicable.

Informed Consent Statement

Not applicable.

Data Availability Statement

Data is contained within the article.

Acknowledgments

This work was achieved by the financial support of ITIDAs ITAC collaborative funded project under the category type of advanced research projects (ARP) and grant number ARP2020.R29.7.

Conflicts of Interest

The authors declare no conflict of interest.

Nomenclatures

W m Magnet Width (mm)
T m Magnet thickness (mm)
M 2 Clearance between the two magnets (mm)
B r i The bridge between the magnet and rotor surface (mm)
V V - angle   between   the   two   magnets   (°)
W F B i Flux   barrier   width ,   W F B i ,   where   i takes on a value of 1 or 2, 1 indicates the upper flux barrier, and 2 indicates the lower flux barrier. (mm)
F B i j The   flux   barrier s   two   angles ,   F B i j ,   where   j   takes   a   value   of   1   or   2 ,   representing   the   two   base   angles ,   which   are   kept   constant   ( ° )
P n Rated power (W)
K w Winding factor
K l Aspect ratio “Stack length to air gap diameter ratio”
η Efficiency (%)
B g Air gap flux density (T)
A s Stator’s electrical loading (A/mm)
f Frequency (Hz)
p Number of pole pairs
D g Stator’s outer diameter (mm)
D s o Stator’s inner diameter (mm)
L e f f Stack length (mm)
λ Split ratio “Stator’s inner diameter to outer diameter ratio”
h b i Back iron thickness (mm)
B b i Back iron flux density (T)
h t Tooth height (mm)
w t Tooth width (mm)
B t Tooth flux density (T)
Q Number of the stator’s slots
V p e a k Rated peak voltage (V)
m i Modulation index
V D C DC bus voltage (V)
m Number of phases
I p e a k Rated peak current (A)
cos θ Power factor
K e EMF factor
N t Number of turns
K C u Copper fill factor
J Current   density   ( A / m m 2 )

References

  1. Austmann, L.M. Drivers of the electric vehicle market: A systematic literature review of empirical studies. Financ. Res. Lett. 2021, 41, 101846. [Google Scholar] [CrossRef]
  2. Paoli, L.; Gül, T. Electric Cars Fend off Supply Challenges to More Than Double Global Sales; IEA: Paris, France, 2022. [Google Scholar]
  3. Alshahrani, S.; Khalid, M.; Almuhaini, M.J. Electric vehicles beyond energy storage and modern power networks: Challenges and applications. IEEE Access 2019, 7, 99031–99064. [Google Scholar] [CrossRef]
  4. Sreeram, K.; Surendran, S.; Preetha, P.J. A Review on Single-Phase Integrated Battery Chargers for Electric Vehicles. In Information and Communication Technology for Competitive Strategies (ICTCS 2021); Springer: Singapore, 2023; pp. 751–765. [Google Scholar]
  5. Valente, M.; Wijekoon, T.; Freijedo, F.; Pescetto, P.; Pellegrino, G.; Bojoi, R. Integrated on-board ev battery chargers: New perspectives and challenges for safety improvement. In Proceedings of the 2021 IEEE Workshop on Electrical Machines Design, Control and Diagnosis (WEMDCD), Modena, Italy, 8–9 April 2021; pp. 349–356. [Google Scholar]
  6. Gundogdu, T.; Zhu, Z.-Q.; Chan, C.C. Comparative Study of Permanent Magnet, Conventional, and Advanced Induction Machines for Traction Applications. World Electr. Veh. J. 2022, 13, 137. [Google Scholar] [CrossRef]
  7. Yang, Z.; Shang, F.; Brown, I.P.; Krishnamurthy, M.J. Comparative study of interior permanent magnet, induction, and switched reluctance motor drives for EV and HEV applications. IEEE Trans. Transp. Electrif. 2015, 1, 245–254. [Google Scholar] [CrossRef]
  8. Huynh, T.-A.; Chen, P.-H.; Hsieh, M.-F. Analysis and Comparison of Operational Characteristics of EV Traction Units Combining Two Different Types of Motors. IEEE Trans. Veh. Technol. 2022, 71, 5727–5742. [Google Scholar] [CrossRef]
  9. Pellegrino, G.; Vagati, A.; Boazzo, B.; Guglielmi, P.J. Comparison of induction and PM synchronous motor drives for EV application including design examples. IEEE Trans. Ind. Appl. 2012, 48, 2322–2332. [Google Scholar] [CrossRef] [Green Version]
  10. Salem, A.; Narimani, M.J. A review on multiphase drives for automotive traction applications. IEEE Trans. Transp. Electrif. 2019, 5, 1329–1348. [Google Scholar] [CrossRef]
  11. Subotic, I.; Bodo, N.; Levi, E.; Jones, M.J. Onboard integrated battery charger for EVs using an asymmetrical nine-phase machine. IEEE Trans. Ind. Electron. 2014, 62, 3285–3295. [Google Scholar] [CrossRef]
  12. Haghbin, S.; Lundmark, S.; Alakula, M.; Carlson, O.J. Grid-connected integrated battery chargers in vehicle applications: Review and new solution. IEEE Trans. Ind. Electron. 2012, 60, 459–473. [Google Scholar] [CrossRef]
  13. Subotic, I.; Levi, E.; Bodo, N. A fast on-board integrated battery charger for EVs using an asymmetrical six-phase machine. In Proceedings of the 2014 IEEE Vehicle Power and Propulsion Conference (VPPC), Coimbra, Portugal, 27–30 October 2014; pp. 1–6. [Google Scholar]
  14. Subotic, I.; Bodo, N.; Levi, E.J. An EV drive-train with integrated fast charging capability. IEEE Trans. Power Electron. 2015, 31, 1461–1471. [Google Scholar] [CrossRef] [Green Version]
  15. Zhou, C.; Huang, X.; Li, Z.; Cao, W.J. Design consideration of fractional slot concentrated winding interior permanent magnet synchronous motor for EV and HEV applications. IEEE Access 2021, 9, 64116–64126. [Google Scholar] [CrossRef]
  16. Fan, X.; Zhang, B.; Qu, R.; Li, D.; Li, J.; Huo, Y.J. Comparative thermal analysis of IPMSMs with integral-slot distributed-winding (ISDW) and fractional-slot concentrated-winding (FSCW) for electric vehicle application. IEEE Trans. Ind. Appl. 2019, 55, 3577–3588. [Google Scholar] [CrossRef]
  17. Tessarolo, A.J. A quadratic-programming approach to the design optimization of fractional-slot concentrated windings for surface permanent-magnet machines. IEEE Trans. Energy Convers. 2017, 33, 442–452. [Google Scholar] [CrossRef]
  18. Dajaku, G.; Spas, S.; Gerling, D.J. Advanced optimization methods for fractional slot concentrated windings. Electr. Eng. 2019, 101, 103–120. [Google Scholar] [CrossRef]
  19. Gundogdu, T.; Komurgoz, G.J.S.; Optimization, M. A systematic design optimization approach for interior permanent magnet machines equipped with novel semi-overlapping windings. Struct. Multidiscip. Optim. 2021, 63, 1491–1512. [Google Scholar] [CrossRef]
  20. Vidanalage, B.D.S.G.; Toulabi, M.S.; Filizadeh, S.J. Multimodal design optimization of V-shaped magnet IPM synchronous machines. IEEE Trans. Energy Convers. 2018, 33, 1547–1556. [Google Scholar] [CrossRef]
  21. Ma, Q.; Ayman, E.-R. Finite Element-based Multi-objective Design Optimization of IPM Considering Saturation Effects for Constant Power Region of Operation. In Proceedings of the 2020 IEEE Energy Conversion Congress and Exposition (ECCE), Detroit, MI, USA, 11–15 October 2020; pp. 1411–1417. [Google Scholar]
  22. Lee, J.H.; Song, J.-Y.; Kim, D.-W.; Kim, J.-W.; Kim, Y.-J.; Jung, S.-Y.J. Particle swarm optimization algorithm with intelligent particle number control for optimal design of electric machines. IEEE Trans. Ind. Electron. 2017, 65, 1791–1798. [Google Scholar] [CrossRef]
  23. Sasaki, H.; Igarashi, H. Topology optimization of IPM motor with aid of deep learning. Int. J. Appl. Electromagn. Mech. 2019, 59, 87–96. [Google Scholar] [CrossRef] [Green Version]
  24. Metwly, M.Y.; Ahmed, M.; Hemeida, A.; Abdel-Khalik, A.S.; Hamad, M.S.; Belahcen, A.; Ahmed, S.; Elmalhy, N.A.J. Investigation of Six-Phase Surface Permanent Magnet Machine with Typical Slot/Pole Combinations for Integrated Onboard Chargers Through Methodical Design Optimization. IEEE Trans. Transp. Electrif. 2022, 9, 866–885. [Google Scholar] [CrossRef]
  25. Huang, S.; Luo, J.; Leonardi, F.; Lipo, T.A.J. A general approach to sizing and power density equations for comparison of electrical machines. IEEE Trans. Ind. Appl. 1998, 34, 92–97. [Google Scholar] [CrossRef] [Green Version]
  26. Bianchi, N.; Bolognani, S.; Frare, P.J. Design criteria for high-efficiency SPM synchronous motors. IEEE Trans. Energy Convers. 2006, 21, 396–404. [Google Scholar] [CrossRef]
  27. Hemeida, A.; Metwly, M.Y.; Abdel-Khalik, A.S.; Ahmed, S.J.E. Optimal Design of A 12-Slot/10-Pole Six-Phase SPM Machine with Different Winding Layouts for Integrated On-Board EV Battery Charging. Energies 2021, 14, 1848. [Google Scholar] [CrossRef]
  28. Yang, Y.; Castano, S.M.; Yang, R.; Kasprzak, M.; Bilgin, B.; Sathyan, A.; Dadkhah, H.; Emadi, A.J. Design and comparison of interior permanent magnet motor topologies for traction applications. IEEE Trans. Transp. Electrif. 2016, 3, 86–97. [Google Scholar] [CrossRef]
  29. Pyrhonen, J.; Jokinen, T.; Hrabovcova, V. Design of Rotating Electrical Machines; John Wiley & Sons, Ltd.: Chichester, UK, 2014; ISBN 978-1-118-58157-5. [Google Scholar]
  30. Hemeida, A. Electromagnetic and Thermal Design of Axial Flux Permanent Magnet Synchronous Machines. Ph.D. Thesis, Ghent University, Ghent, Belgium, 2017. [Google Scholar]
  31. Yokoi, Y.; Higuchi, T.; Miyamoto, Y.J. General formulation of winding factor for fractional-slot concentrated winding design. IET Electr. Power Appl. 2016, 10, 231–239. [Google Scholar] [CrossRef] [Green Version]
  32. Murali, N.; Ushakumari, S. Performance comparison between different rotor configurations of PMSM for EV application. In Proceedings of the 2020 IEEE Region 10 Conference (TENCON), Osaka, Japan, 16–19 November 2020; pp. 1334–1339. [Google Scholar]
  33. Wang, A.; Jia, Y.; Soong, W.J. Comparison of five topologies for an interior permanent-magnet machine for a hybrid electric vehicle. IEEE Trans. Magn. 2011, 47, 3606–3609. [Google Scholar] [CrossRef]
  34. Hu, Y.; Zhu, S.; Liu, C.; Wang, K.J. Electromagnetic performance analysis of interior PM machines for electric vehicle applications. IEEE Trans. Energy Convers. 2017, 33, 199–208. [Google Scholar] [CrossRef]
  35. Liu, X.; Chen, H.; Zhao, J.; Belahcen, A.J. Research on the performances and parameters of interior PMSM used for electric vehicles. IEEE Trans. Ind. Electron. 2016, 63, 3533–3545. [Google Scholar] [CrossRef]
  36. Krishnan, R. Permanent Magnet Synchronous and Brushless DC Motor Drives; CRC Press: Boca Raton, FL, USA, 2010. [Google Scholar]
  37. Bunting-e-Magnets. Available online: https://e-magnetsuk.com/wp-content/uploads/2020/11/Neodymium-Material-Data-Sheet.pdf (accessed on 18 February 2023).
  38. Carlier, A.; Geris, L. Sensitivity analysis by design of experiments. In Uncertainty in Biology; Springer: Cham, Switzerland, 2016. [Google Scholar]
  39. Rodriguez-Fernandez, M.; Banga, J.R.; Doyle, F.J., III. Novel global sensitivity analysis methodology accounting for the crucial role of the distribution of input parameters: Application to systems biology models. Int. J. Robust Nonlinear Control 2012, 22, 1082–1102. [Google Scholar] [CrossRef] [Green Version]
  40. Cao, D.; Zhao, W.; Ji, J.; Wang, Y. Parametric equivalent magnetic network modeling approach for multiobjective optimization of PM machine. IEEE Trans. Ind. Electron. 2020, 68, 6619–6629. [Google Scholar] [CrossRef]
  41. Bianchi, N.; Bolognani, S. Design optimisation of electric motors by genetic algorithms. IEE Proc. Electr. Power Appl. 1998, 145, 475–483. [Google Scholar] [CrossRef]
  42. Cho, D.-H.; Jung, H.-K.; Lee, C.-G.J. Induction motor design for electric vehicle using a niching genetic algorithm. IEEE Trans. Ind. Appl. 2001, 37, 994–999. [Google Scholar]
  43. Çunkaş, M.; Akkaya, R.J. Design optimization of induction motor by genetic algorithm and comparison with existing motor. Math. Comput. Appl. 2006, 11, 193–203. [Google Scholar] [CrossRef]
  44. Desai, C.; Williamson, S.S. Optimal design of a parallel hybrid electric vehicle using multi-objective genetic algorithms. In Proceedings of the 2009 IEEE Vehicle Power and Propulsion Conference, Dearborn, MI, USA, 7–10 September 2009; pp. 871–876. [Google Scholar]
  45. Hamiti, T.; Gerada, C.; Rottach, M. Weight optimisation of a surface mount permanent magnet synchronous motor using genetic algorithms and a combined electromagnetic-thermal co-simulation environment. In Proceedings of the 2011 IEEE Energy Conversion Congress and Exposition, Phoenix, AZ, USA, 17–22 September 2011; pp. 1536–1540. [Google Scholar]
  46. Jannot, X.; Vannier, J.-C.; Marchand, C.; Gabsi, M.; Saint-Michel, J.; Sadarnac, D.J. Multiphysic modeling of a high-speed interior permanent-magnet synchronous machine for a multiobjective optimal design. IEEE Trans. Energy Convers. 2010, 26, 457–467. [Google Scholar] [CrossRef]
  47. Mahmoudi, A.; Kahourzade, S.; Abd Rahim, N.; Hew, W.P.J. Design, analysis, and prototyping of an axial-flux permanent magnet motor based on genetic algorithm and finite-element analysis. IEEE Trans. Magn. 2012, 49, 1479–1492. [Google Scholar] [CrossRef]
  48. Rahideh, A.; Korakianitis, T.; Ruiz, P.; Keeble, T.; Rothman, M.J. Optimal brushless DC motor design using genetic algorithms. J. Magn. Magn. Mater. 2010, 322, 3680–3687. [Google Scholar] [CrossRef]
  49. Metwly, M.Y.; Abdel-Majeed, M.S.; Abdel-Khalik, A.S.; Hamdy, R.A.; Hamad, M.S.; Ahmed, S.J. A review of integrated on-board EV battery chargers: Advanced topologies, recent developments and optimal selection of FSCW slot/pole combination. IEEE Access 2020, 8, 85216–85242. [Google Scholar] [CrossRef]
  50. Wang, Z.; Chen, J.; Cheng, M.; Chau, K.J. Field-oriented control and direct torque control for paralleled VSIs fed PMSM drives with variable switching frequencies. IEEE Trans. Power Electron. 2015, 31, 2417–2428. [Google Scholar] [CrossRef]
  51. Abdel-Majeed, M.S.; Shawier, A.; Abdel-Khalik, A.S.; Hamad, M.S.; Sedky, M.M.; Elmalhy, N.A.J. General current control of six-phase-based non-isolated integrated on-board charger with low order harmonic compensation. Sustainability 2022, 14, 1088. [Google Scholar] [CrossRef]
  52. Shawier, A.; Habib, A.; Mamdouh, M.; Abdel-Khalik, A.S.; Ahmed, K.H.J. Assessment of predictive current control of six-phase induction motor with different winding configurations. IEEE Access 2021, 9, 81125–81138. [Google Scholar] [CrossRef]
  53. Romahadi, D.; Xiong, H.; Pranoto, H. Intelligent system for gearbox fault detection & diagnosis based on vibration analysis using bayesian networks. IOP Conf. Ser. Mater. Sci. Eng. 2019, 694, 012001. [Google Scholar]
Figure 1. Six-phase integrated OBC’s scheme and operation modes’ phasor diagram. (a) Asymmetrical six-phase topology, (b) Propulsion mode current phasor diagram, and (c) Charging mode current phasor diagram.
Machines 11 00534 g001
Figure 2. Motor Configuration. (a) 2D projection, (b) Parametric model.
Machines 11 00534 g002
Figure 3. Design flowchart.
Machines 11 00534 g003
Figure 4. Sensitivity analysis outcomes.
Machines 11 00534 g004
Figure 5. Genetic algorithm (GA) flowchart.
Machines 11 00534 g005
Figure 6. Optimization results of the six objectives under the two modes of operation: (a) propulsion mode and (b) charging mode.
Machines 11 00534 g006aMachines 11 00534 g006b
Figure 7. Motor configuration (a) initial design and (b) optimal design.
Machines 11 00534 g007
Figure 8. Torque curves under the two modes of operation: (a) propulsion mode and (b) charging mode.
Machines 11 00534 g008
Figure 9. Phase voltage curves under the two modes of operation: (a) propulsion mode and (b) charging mode.
Machines 11 00534 g009
Figure 10. The demagnetization of the optimal design underrated operation.
Machines 11 00534 g010
Figure 11. Efficiency map of the optimal machine.
Machines 11 00534 g011
Figure 12. Designed motor prototype, (a) cross-section, (b) stator, and (c) rotor.
Machines 11 00534 g012aMachines 11 00534 g012b
Figure 13. Test bench setup. (a) Propulsion subsystem: (i) 12/10 IPM synchronous machine, (ii) Load motor, (iii) Torque sensor, (iv) 20 kW Dynamo system, and (v) Data acquisition “DAQ” box. (b) Grid and battery emulator and (c) Driving controller and visualization: (i) dSpace microlab box 1200, and (ii) Oscilloscope, and (d) Inverter subsystem: (i) 40 kW six-phase inverter, (ii) Measurement board, and (iii) Interface board.
Machines 11 00534 g013
Figure 14. Measured and simulated back EMF.
Machines 11 00534 g014
Figure 15. Electromagnetic torque during the propulsion mode.
Machines 11 00534 g015
Figure 16. The stator currents under the propulsion mode.
Machines 11 00534 g016
Figure 17. Experimental step speed response.
Machines 11 00534 g017
Figure 18. Experimental grid currents.
Machines 11 00534 g018
Figure 19. Experimental windings and grid phase currents.
Machines 11 00534 g019
Figure 20. Experimental grid current and grid voltage.
Machines 11 00534 g020
Figure 21. Experimental vibration levels.
Machines 11 00534 g021
Table 1. IPM machine design specifications.
Rated power (kW)15
Rated speed (rpm)1500
Peak line current (A)17.54
Inputs
Number of phases6
Number of slots12
Number of poles10
Air gap flux density (T)0.8
Aspect ratio “Stack length to air gap diameter ratio”0.822
Stator electrical loading (A/mm)15
Constraints
Required flux density (T)1.5
DC bus voltage (V)600
Current   density   ( A / m m 2 ) 5
Copper fill factor0.5
Table 2. IPM motor design parameters’ ranges.
Design VariableRangeInitial Value
V a n g l e (   ° )80–160145
W M (mm)18–2221
T M (mm)1–32.2
W B r i (mm)1–4.53
M 2 (mm)2–43
W F B 1 1–71.5
W F B 2 1–3.51
Table 3. Sensitivity analysis results.
Parameter/Objective ρ T m e a n p r o p ρ T r i p p l e p r o p ρ c o r e p r o p ρ T r i p p l e c h a r ρ c o r e c h a r H x i
W B r i −0.312−0.479−0.0850.190.0520.224
V a n g l e 0.18−0.199−0.216−0.112−0.120.215
M 2 −0.218−0.375−0.0570.140.4620.221
T M 0.4120.0670.093−0.252−0.1110.187
W M 0.464−0.0240.0990.401−0.2330.244
W F B 1 0.2840.272−0.010.0490.2880.141
W F B 2 0.2830.159−0.0090.0370.3130.122
Table 4. IPM motor’s specifications.
ParameterSymbolValue
Slot/Pole combination N s / 2 p 12-slot/10-pole
Stator outer diameter ( m m ) D s o 279.4
Stator   inner   diameter ( m m ) D g 241.6
Stack length ( m m ) L e f f 147.7
Air   gap   length   ( m m ) g 1
Back iron width ( m m ) Y s b 18.9
Shaft   diameter   ( m m ) D s h a f t 50
Rotor outer diameter ( m m ) D r o 178.6
V - angle   ( d e g ) V a n g l e 153
Magnet width ( m m ) W M 20
Magnet   depth   ( m m ) T M 2
Number of turns per coil N t 31
Rated   rms   current   ( A ) I r 12.3
Winding layer/Coil pitch Double layer/single
Clearance   between   magnets   ( m m ) M 2 2.8
Bridge spacing ( m m ) W B r i 2.9
Width   of   flux   barrier   1   ( m m ) W F B 1 5.9
Angle of flux barrier 1-1 ( d e g ) F B 11 85
Angle   of   flux   barrier   1 - 2   ( d e g ) F B 12 85
Width of flux barrier 2 ( m m ) W F B 2 1.5
Angle   of   flux   barrier   2 - 1 ( d e g ) F B 21 80
Angle of flux barrier 2-2 ( d e g ) F B 22 80
Table 5. Optimal and initial machines.
Parameters
ParameterInitialOptimal
Magnet Width 21   m m 20   m m
Magnet Thickness 2.2   m m 2   m m
Upper Flux Barrier Width 1.5   m m 5.9   m m
Lower Flux Barrier Width 1   m m 1.5   m m
Magnet Clearance 3   m m 2.85   m m
Magnet Bridge 3   m m 2.9   m m
V-angle 145 ° 163 °
Objectives
ObjectiveInitialOptimal
T a v e r a g e 92.06   N . m 96.1   N . m
P c o r e p r o p u l s i o n 215.47   W 188.87   W
T r i p p l e p r o p u l s i o n 6.46   N . m 4.6   N . m
P c o r e c h a r g i n g 47.48   W 38.22   W
T r i p p l e c h a r g i n g 14.31   N . m 3.16   N . m
M s i z e 6758   m m 3 5910   m m 3
V p h r m s p r o p u l s i o n 215.9   V 225.6   V
V p h r m s c h a r g i n g 14.4   V 11.27   V
Table 6. Experimental and simulated machines results.
ObjectiveExperimentalSimulated
T a v e r a g e 95.77   N . m 96.1   N . m
T r i p p l e p r o p u l s i o n 0.08   N . m “Due to sensor limitations” 4.6   N . m
B a c k   E M F p e a k 230   V 236   V
Disclaimer/Publisher’s Note: The statements, opinions and data contained in all publications are solely those of the individual author(s) and contributor(s) and not of MDPI and/or the editor(s). MDPI and/or the editor(s) disclaim responsibility for any injury to people or property resulting from any ideas, methods, instructions or products referred to in the content.

