Article

Optimization Research for the Adjusting Device of the Mechanical Vertical Drilling Tool Based on the Adjusting Torque

1
School of Engineering and Technology, China University of Geosciences (Beijing), Beijing 100083, China
2
Key Laboratory of Deep Geological Drilling Technology, Ministry of Natural Resources, Beijing 100083, China
*
Author to whom correspondence should be addressed.
Machines 2023, 11(5), 509; https://doi.org/10.3390/machines11050509
Submission received: 3 April 2023 / Revised: 16 April 2023 / Accepted: 19 April 2023 / Published: 24 April 2023
(This article belongs to the Section Machine Design and Theory)

Abstract

:
The utilization of the adjusting device has been shown to significantly enhance the precision and stability of the mechanical vertical drilling tool. However, the inappropriate size of the structural parameters of the adjusting device will greatly affect its performance. Therefore, further improvements are necessary in order to optimize its performance. In order to achieve this, a thorough examination of the working principle and the various factors that influence the adjusting device is crucial. Through simulation and experimental methods, the function of the adjusting device was evaluated and potential solutions for the negative adjusting torque were proposed. By selecting appropriate values for the influencing factors, a more desirable adjusting torque with a reduced range of negative values can be obtained. Through a comparative analysis, the difference before and after optimization was evaluated. Furthermore, it was determined that the negative adjusting torque was caused by a reflux, primarily due to the diameter of the inlet and the flux area of the lower orifices. After optimization, the range of the adjusting torque that was beneficial to the adjusting device was extended to 15°~0°, providing a practical application in the drilling industry and serving as guidance for further optimization of the mechanical vertical drilling tool.

1. Introduction

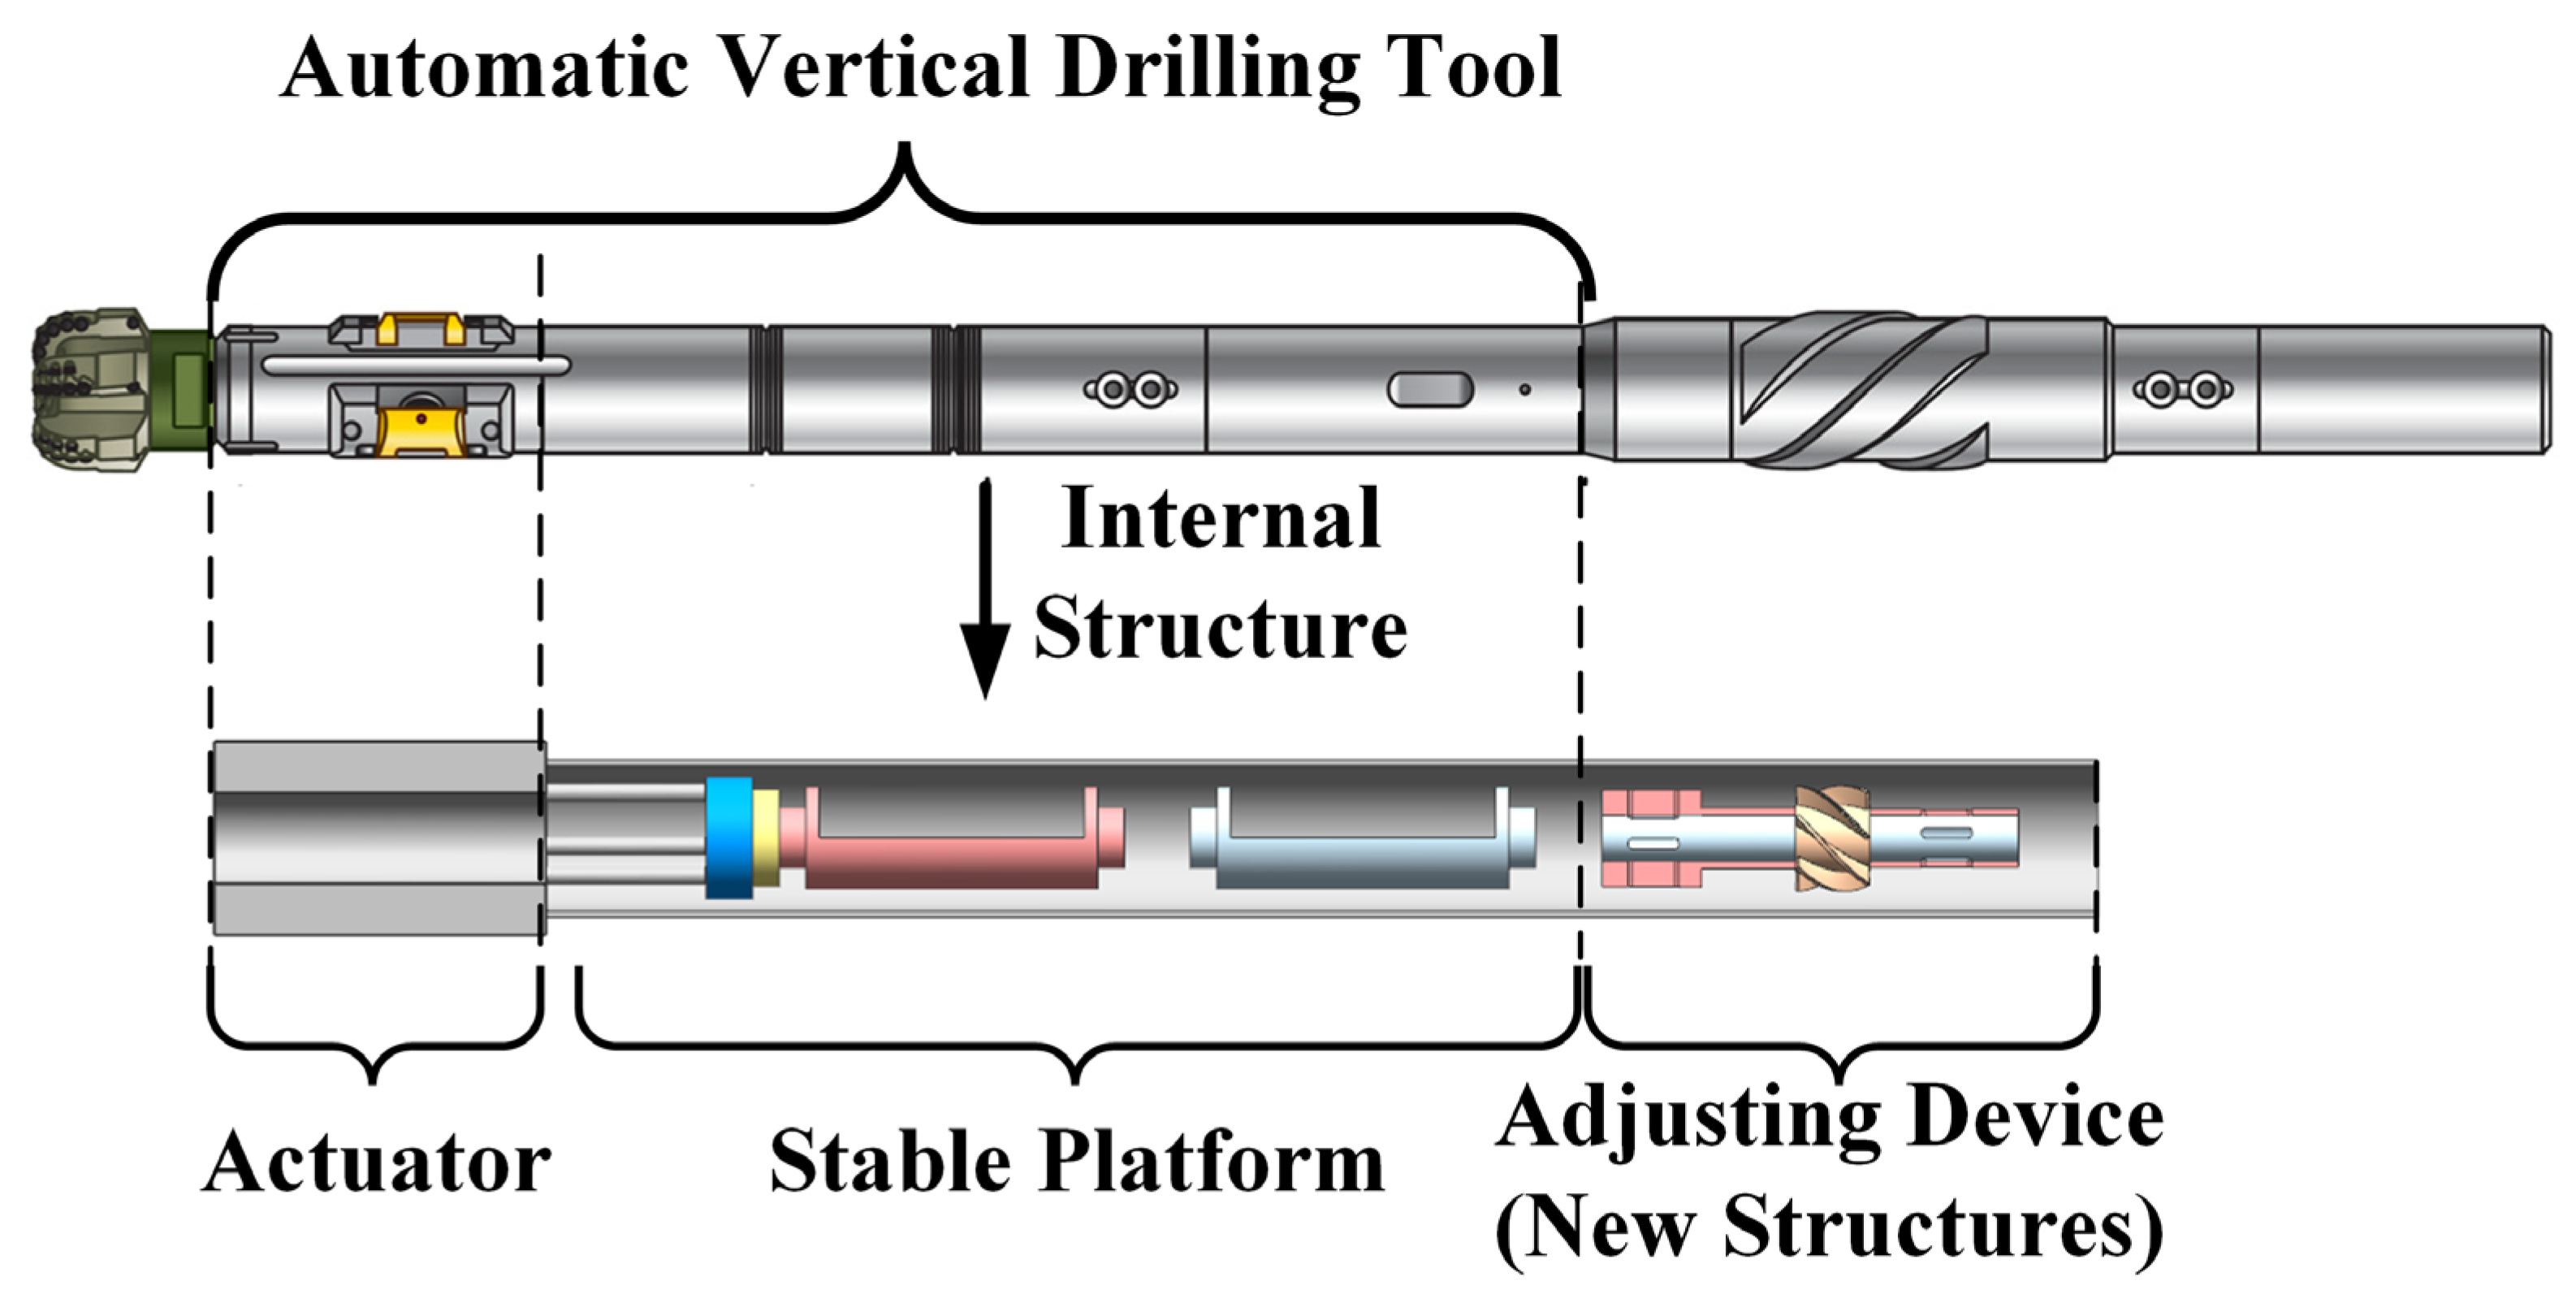
In recent years, in response to the increasing depth of boreholes in drilling and the corresponding requirements for supporting technologies, such as ultra-high-speed drilling in deep wells, the mechanical automatic vertical drilling tool (MVDT) has undergone rapid development [1,2,3,4], as shown in Figure 1. The MVDT utilizes the eccentric torque of the eccentric block in the stable platform to automatically prevent and correct the deviation of the wellbore downhole [5,6,7]. However, the internal frictional resistance can impede the effectiveness of the eccentric torque and negatively impact the deviation control accuracy of the MVDT [8,9]. which can produce the control error. This error can be expressed as an angle [10], referred to as the deflection angle (φ). While φ is affected by frictional resistance and cannot be completely eliminated, it can be mitigated through the implementation of an adjusting device.
The adjusting device, which is mounted on top of the MVDT and connected to the eccentric block, comprises two cylinder valves and a turbine [11]. φ is converted into the difference in the rotation angle between the valves. Additionally, the turbine provides torque, which reduces φ in a closed-loop manner by balancing the frictional resistance. As a result, the stability and accuracy of the MVDT are enhanced.
In previous experiments, we have manufactured two sets of MVDT prototypes, one with a regulating device and one without, by collecting the pushing force of the actuator in both prototypes and then comparing the deviation correction effect of the two prototypes [12]. The research has demonstrated that the adjusting device has a positive impact on the MVDT. However, it was also found that although the stability of the MVDT improved with the addition of the adjusting device, the improvement is still limited.
As the adjusting device is a newly developed device composed of multiple structures, there is currently limited research on the device as a whole. However, many scholars have conducted preliminary research on the development of the device. Mokaramian et al. simulated the mechanical power of turbines and proposed optimized parameters for turbines [13]. Li et al. developed a dynamic model of the stable platform’s eccentric block, investigated the impact of torsional vibration on the eccentric block, and proposed an optimized design for a stable platform with a turbine [14,15]. Jinasena et al. proposed a mathematical model that can serve as an online return flow rate measurement and loss detection tool in conventional drilling [16]. Wang et al. presented a theoretical model for measuring friction and designed a set of measurement rigs to investigate the frictional characteristics of PDC bearings, and pointed out that the friction force at the upper plate valve is the main factor affecting the accuracy of the eccentric system [17,18]. Chai et al. studied the influence of φ on the MVDT trajectory by establishing a trajectory model for MVDT, and pointed out the relationship between the friction torque of the plate valve and the gravity torque of the eccentric block [10]. Although many scholars have studied specific issues within the adjusting device, there is limited research on how to improve the overall effectiveness of the device, and further research on the device as a whole is still needed.
Based on the above issues, this paper conducts a comprehensive study on the adjusting device in order to improve its performance. The working characteristics of the adjusting device are described, and its performance issues are identified through simulation. The structure of the adjusting device is optimized, and optimal parameters are proposed. By comparing the performance of the adjusting device before and after optimization, the reasons for its poor performance are discussed. Finally, the performance of the adjusting device can be improved, and suggestions and references are provided for further research on the MVDT.

2. Design Solution

In this section, the working principle of the adjusting device is first described and the influencing factors are revealed.

2.1. Working Principle of the Adjusting Device

Prior to explaining the principle of the adjusting device, it is necessary to understand the working principle of the entire drilling tool, as the adjusting device is located inside the tool. The schematic diagram of the MVDT equipped with the adjusting device is shown in Figure 1. When the drilling tool tilts, the two eccentric blocks in the stable platform will deflect under the influence of gravity. However, due to the frictional resistance, the eccentric block closer to the actuator will deviate from the correct inclination position and ultimately come to rest at φ from the lower side of the borehole. Since this eccentric block is connected to the plate valve and serves to transmit the inclination signal to the actuator, the accuracy of the drilling tool’s tilt correction will decrease when φ appears. On the other hand, since the eccentric block located further away from the actuator is installed in an oil chamber with lower resistance, its deviation position is very close to the ideal lower side of the borehole. This eccentric block does not transmit inclination signal but only serves to indicate the ideal position of the eccentric block used for signal transmission, with φ representing the difference between the ideal and actual positions of the eccentric block used for signal transmission [9,10].
When the two eccentric blocks have different deflection positions, the adjusting device can balance the friction torque by providing a closed-loop torque acting on the eccentric blocks affected by the friction torque, thereby reducing φ and ultimately improving the borehole deflection correction accuracy. To achieve this goal, the two eccentric blocks are, respectively, fixedly connected to the internal and external cylinder valves in the adjusting device. Among them, the external cylinder valve is fixedly connected to the eccentric block that is affected by the frictional resistance, so the deflection position of the external cylinder valve will also be influenced by the frictional resistance and thus deflect φ. At the same time, since the internal cylinder valve is fixedly connected to the eccentric block in the low-resistance oil chamber, the internal cylinder valve will hardly be affected by the frictional resistance and thus deflect. Therefore, the relative deflection error of the two eccentric blocks is transformed into the relative deflection error of the internal and external cylinder valves [11], which is φ.
Furthermore, both the internal cylinder valve and the external cylinder valve are designed with multiple upper orifices and lower orifices, which enables the change in the flow direction of the fluid [19]. As φ changes, the flux area of the upper orifices (SU) and the flux area of the lower orifices (SL) follow an inverse relationship; as SU increases, SL decreases, and vice versa.
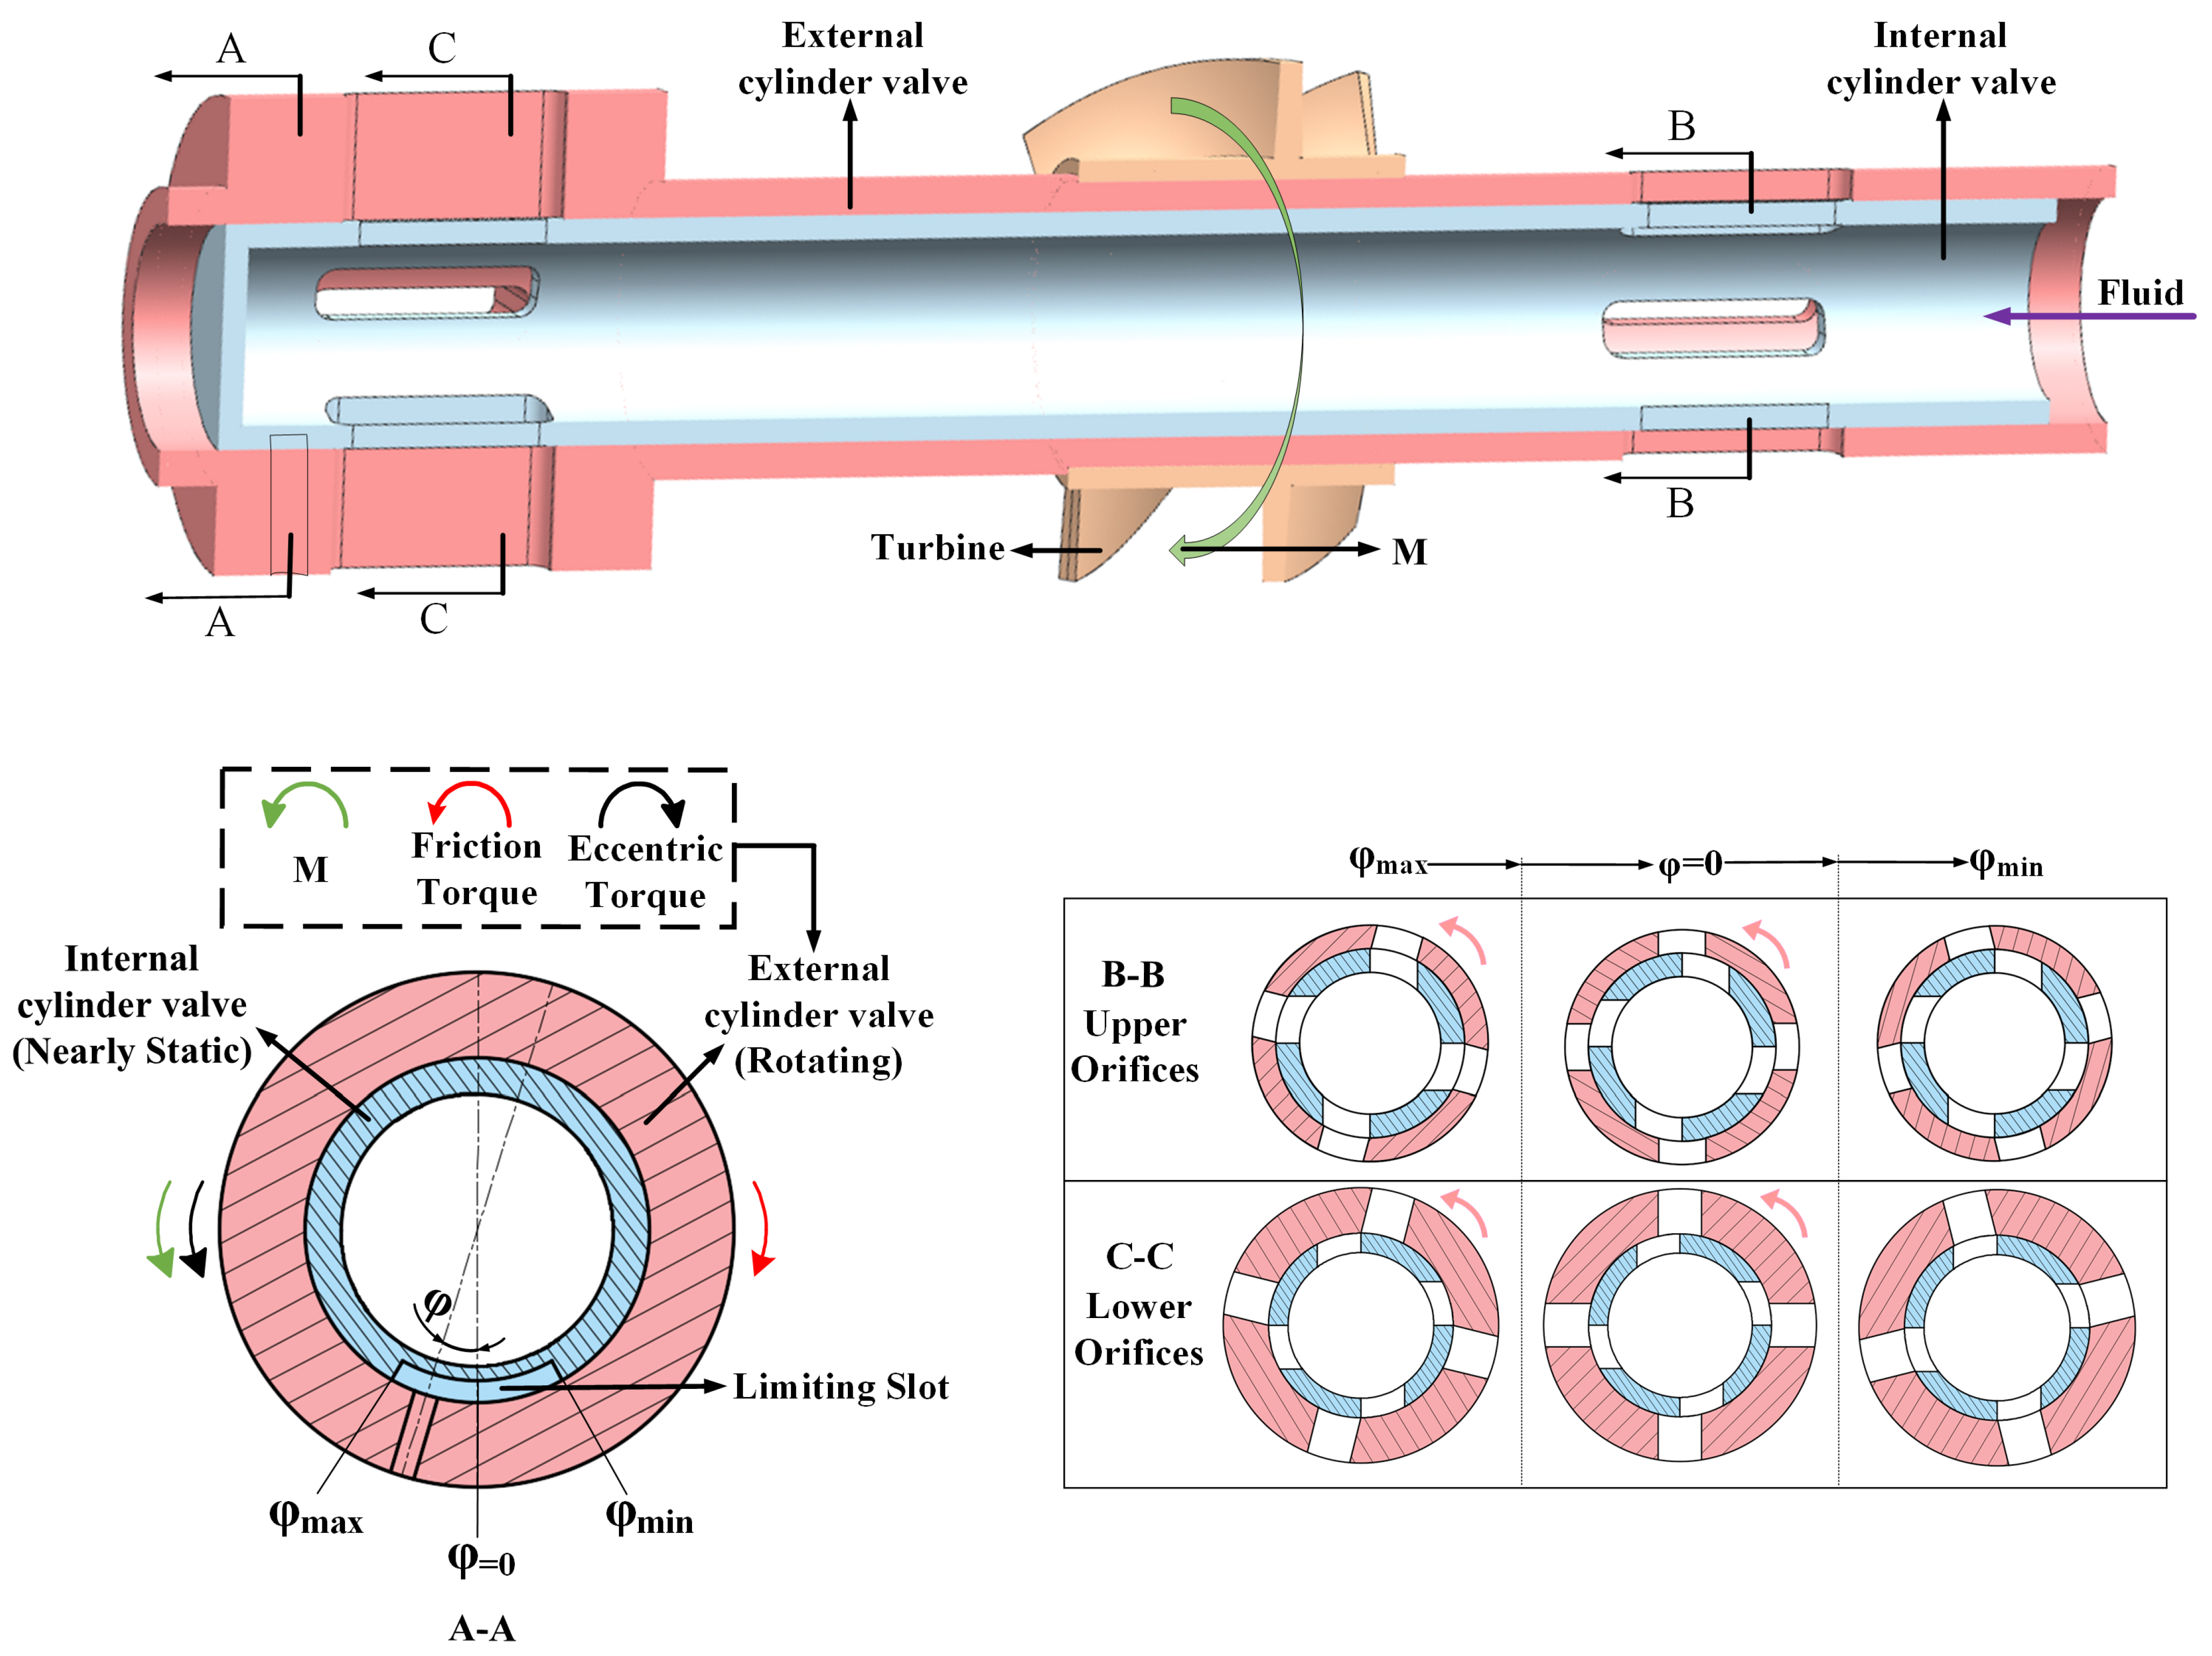
In addition, the turbine is attached to the external cylinder valve and is subject to the fluid from the upper orifices, resulting in an adjusting torque denoted by M. M that can be used to balance the frictional torque. It should be noted that once the rotating direction of the MVDT and the turbine have been established, the friction torque and direction of M are also determined [20]. The friction torque is constant due to rotational friction, and the direction of M is designed to be counter to the direction of the friction torque. To simplify the research, the direction of the friction torque is set clockwise, the direction of φ is considered positive when the external cylinder valve (or the eccentric block) is deflected solely by the friction torque, and the direction of M is considered positive when it is in opposition to the direction of the friction torque. It should be noted that the constant direction of the friction torque hardly allows φ to become negative, and in order to avoid a dead point, a limiting slot is designed in the internal cylinder valve to limit the maximum range of φ, assuming that the absolute values of φmax and φmin are equal. This is shown in view A-A of Figure 2. As φ increases in the positive direction, SU will increase while SL will decrease, as shown in views B-B and C-C in Figure 2.
Given the above conditions, the complete operational process of the regulating device is as follows: when the drilling tool is inclined, both eccentric blocks will deflect under the influence of gravity, but one of them will experience an increase in the positive direction of φ due to the effect of frictional resistance. This will gradually increase SU and decrease SL. At this point, the fluid flows more readily through the upper orifices [21,22]. After flowing through the upper orifices, the fluid impacts on the turbine and causes M to increase in a positive direction [23]. M is then applied through the external cylinder valve to the eccentric block that is affected by friction torque. It overcomes the friction torque on the eccentric block, corrects its deflection position, and gradually brings φ closer to zero.
As φ decreases, the external cylinder valve will also deflect to the correct position under the influence of the fixed connection. This causes SU to decrease and SL to increase, allowing the drilling fluid to flow more easily through the lower orifices. This will gradually reduce M until it is almost equal to the friction torque, at which point φ and M will hardly change. The deflection position of the external cylinder valve and the eccentric block will approach a stable state that is closer to the ideal position. Subsequently, the actuator will receive a more accurate inclination signal and will gradually steer the drilling direction to become perpendicular. Thereafter, the adjusting device will not function until the next time the drilling tool tilts. This process occurs in a continuous cycle. The adjusting device provides a closed-loop M to balance the friction torque, thereby enhancing the precision and stability of the MVDT.

2.2. Influencing Factors of the Structure

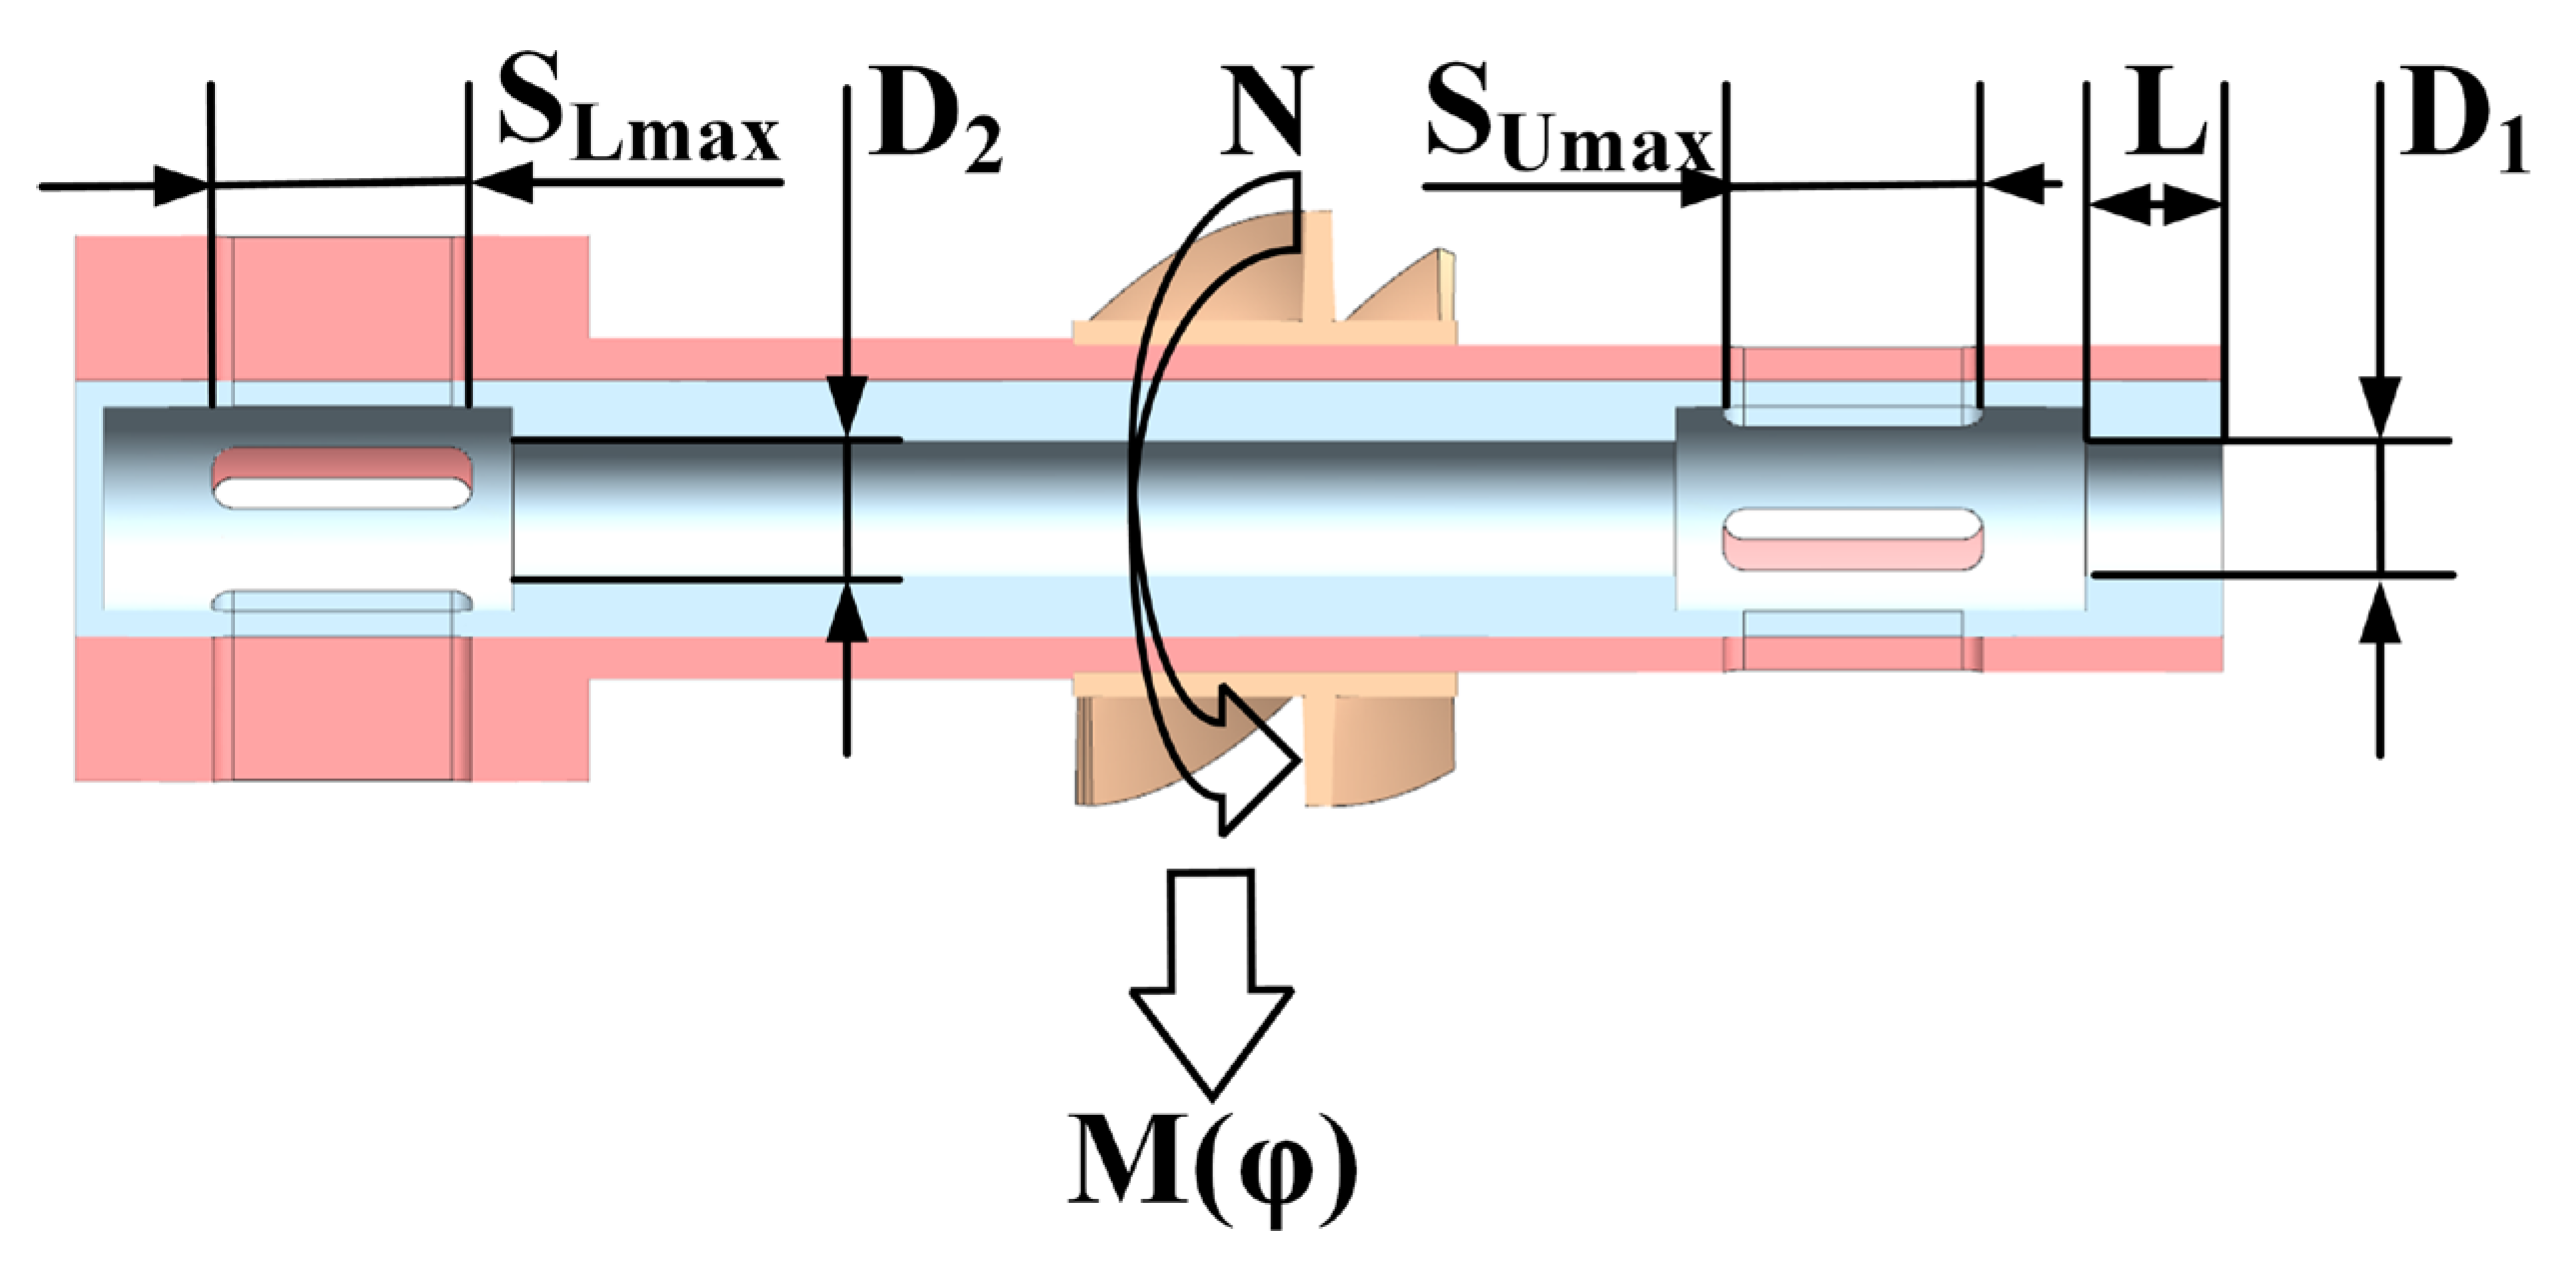
M is effective when it exceeds the friction torque, and its magnitude is primarily influenced by variations in φ. Consequently, M can be employed as a metric for assessing the performance of the adjusting device, with φ being the primary factor influencing M. Furthermore, other factors that are associated with the adjusting device also have an impact on M and should be studied, as demonstrated in Figure 3.
The turbine plays a direct role in determining M, but the impact of turbines has been well established in prior research [24,25,26,27]. The effect of the turbine on M can be determined once its structure is established. However, since the turbine and the external cylinder valve rotate at the same speed (N), N also affects the fluid velocity as it passes through the turbine [28].
Additionally, it should be noted that due to the presence of the limiting slot, the turbine will only rotate within the range of φmin < φ < φmax. Since M changes continuously with φ, the resultant force acting on the external cylinder valve (or the eccentric block affected by frictional resistance) will also vary continuously, indicating that N is not a constant. Therefore, before investigating the influence of other structural parameters of the adjusting device on M, the effect of N on M should be eliminated first.
Moreover, the structural parameters of the adjusting device need to be taken into consideration. The flow rate at the turbine is a factor [29] in the M, which relates to the adjusting torque as follows:
M Q U
where QU is the flow rate at the turbine (QU is also the flow rate at the upper orifices. QL is the flow rate at the lower orifices, which will be mentioned later). An increase in QU results in an increase in M. In the adjusting device, as φ changes, the primary factor influencing QU is the relationship between SU and SL [30].
To simplify the description, the opening areas of the upper and lower orifices in the internal cylinder valve are denoted as SU1 and SL1, respectively. Similarly, the opening areas of the upper and lower orifices in the external cylinder valve are denoted as SU2 and SL2, respectively. When φ varies, SU equals the area of the overlap between SU1 and SU2. In particular, when φ reaches φmax, SU reaches its maximum value, which is equal to the maximum value of SU1 and SU2 (abbreviated as SUmax). At the same time, if it is assumed that the maximum value of SL1 and SL2 is SLmax, then the relationship between SL, SL1, SL2, and SLmax is also similar to the above rule, as flowing Equations (4) and (5). The SUmax and SLmax were shown in Figure 3. At this point, under the condition that φ m a x is equal to φ m i n , the above parameters can be expressed by the following equation:
S U = ( 1 2 + φ 2 φ m a x ) S U m a x
S L = ( 1 2 φ 2 φ m a x ) S L m a x
S U m a x = m a x S U 1 , S U 2
S L m a x = m a x S L 1 , S L 2
Therefore, the effect of SUmax and SLmax on M needs to be investigated due to their effect on QU.
Furthermore, it is well known that the head loss will affect the flow rate in the flowline [31]; therefore, QU will also be affected by the head loss caused by the structure of the adjusting device, and it needs to be considered in the effect on M. In hydromechanics, the head loss can be expressed as follows:
h w = λ l d × u 2 2 g
where h w is the head loss, it can indicate the extent of flow loss. λ and u are viscosity and velocity, respectively.
Although both parameters can affect h w , they are not structural parameters of the adjusting device, and the research on the effect of head loss on flow rate is already mature [32]. Therefore, we will not further study these parameters in this paper. However, l and d refer to the length and diameter of the flow pipe, respectively. This means that the length or width of some structures in the adjusting device will also affect QU, and their impact on M cannot be ignored. Considering the limitation of the overall size of the MVDT, as well as the linear loss of fluid pressure and the local loss in the adjusting device [33], we selected the length of the inlet (L), the diameter of the inlet (D1), and the diameter of the center flow channel inside the internal cylinder valve (D2) as important parameters affecting the effectiveness of the device, which need to be carefully selected when optimizing the structure of the adjusting device.
In summary, M is influenced by φ as well as other structural parameters of the adjusting device such as N, D1, L, D2, SUmax, and SLmax. However, the exact influence of these parameters on M remains unclear and requires further investigation, and the relationship between them will be studied through simulation. In addition, due to the interdependent relationship between various components of the adjusting device, it has become difficult to directly measure the precise values of M and φ through experiments. Therefore, we conducted experiments on the MVDT prototypes and indirectly obtained the variation of φ under the influence of M.

3. Validation and Methodology

In this section, a three-dimensional finite element model (FE model) is presented, which is solved using computational fluid dynamics simulation (CFD simulation). The variation of M with φ (M(φ) for short) is examined. The impact of various influencing factors is analyzed, and the optimal values are determined. To confirm the efficacy of the adjusting device after optimization, prototype experiments were conducted.

3.1. Validation of FE Model Simulation

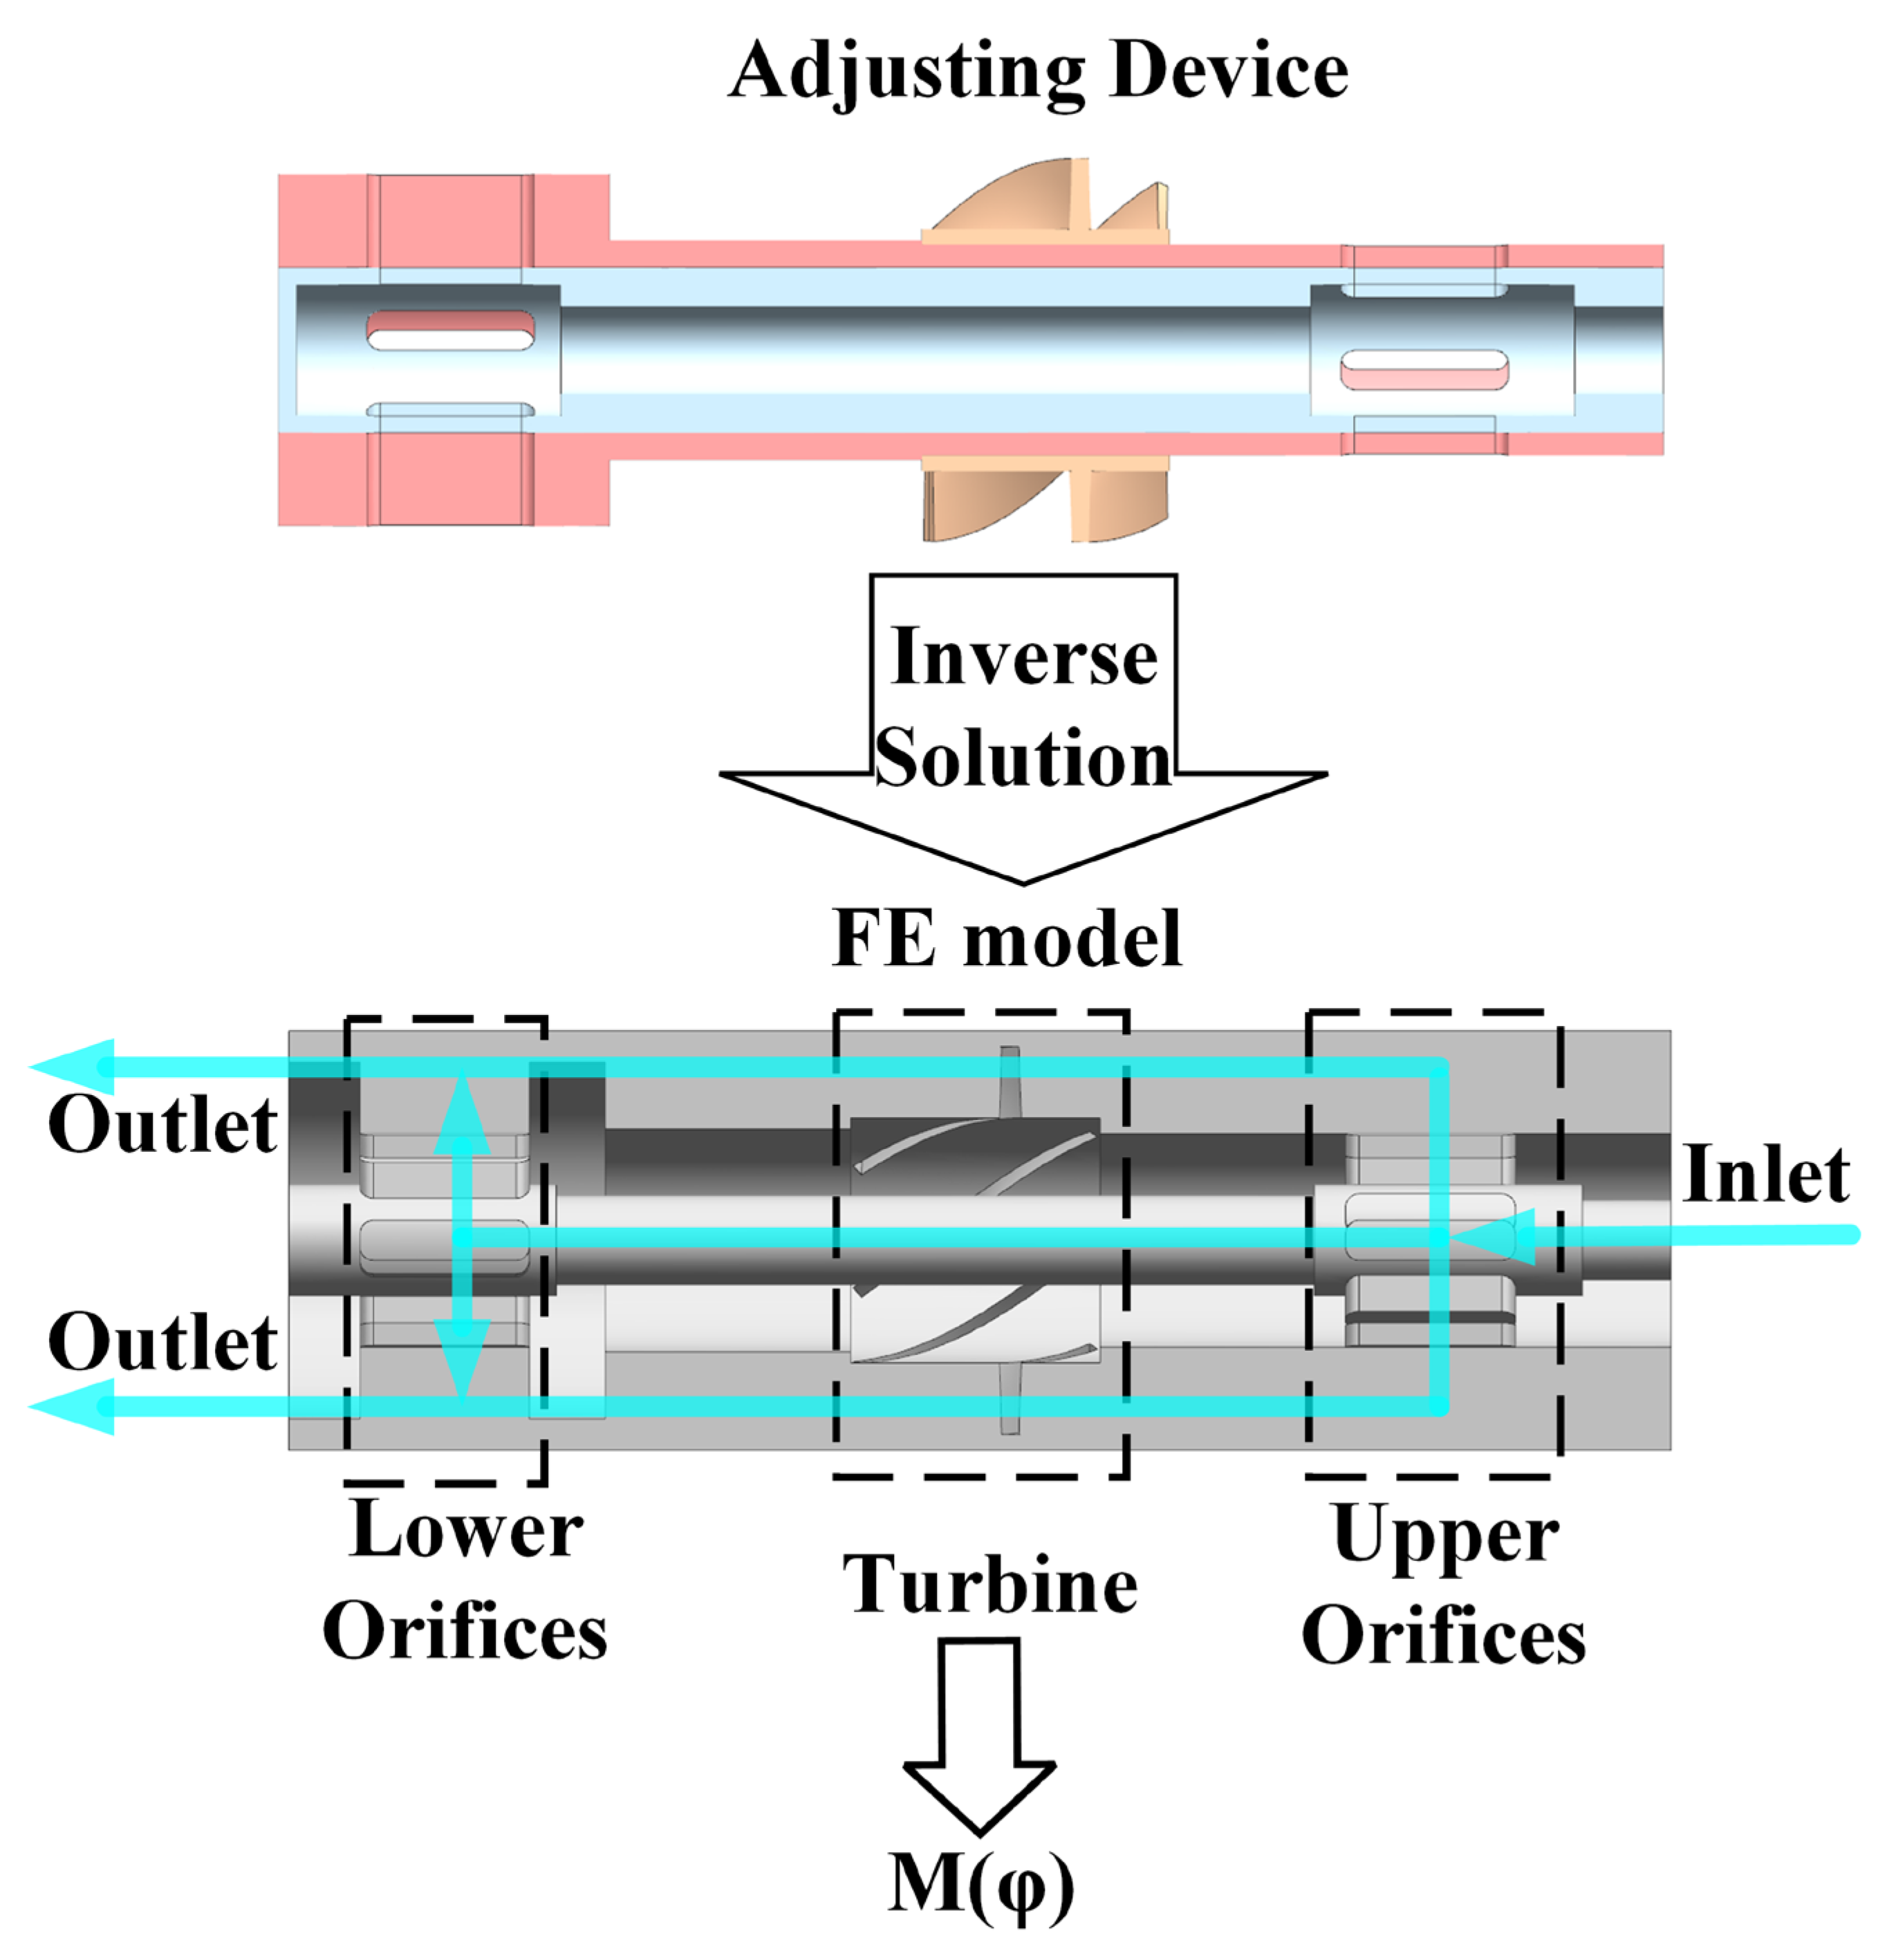
In order to investigate the effect of the adjusting device in the fluid environment of the downhole, the FE model is established. The FE model is a fluid domain obtained through the inverse solution of the adjusting device, as depicted in Figure 4.
After the fluid enters the inlet of the FE model, M(φ) can be obtained by monitoring the torque at the wall where the turbine is present [34]. In addition, the maximum range of φ is chosen to be −15° to 15°. The boundary conditions [35] for the simulation are shown in Table 1.
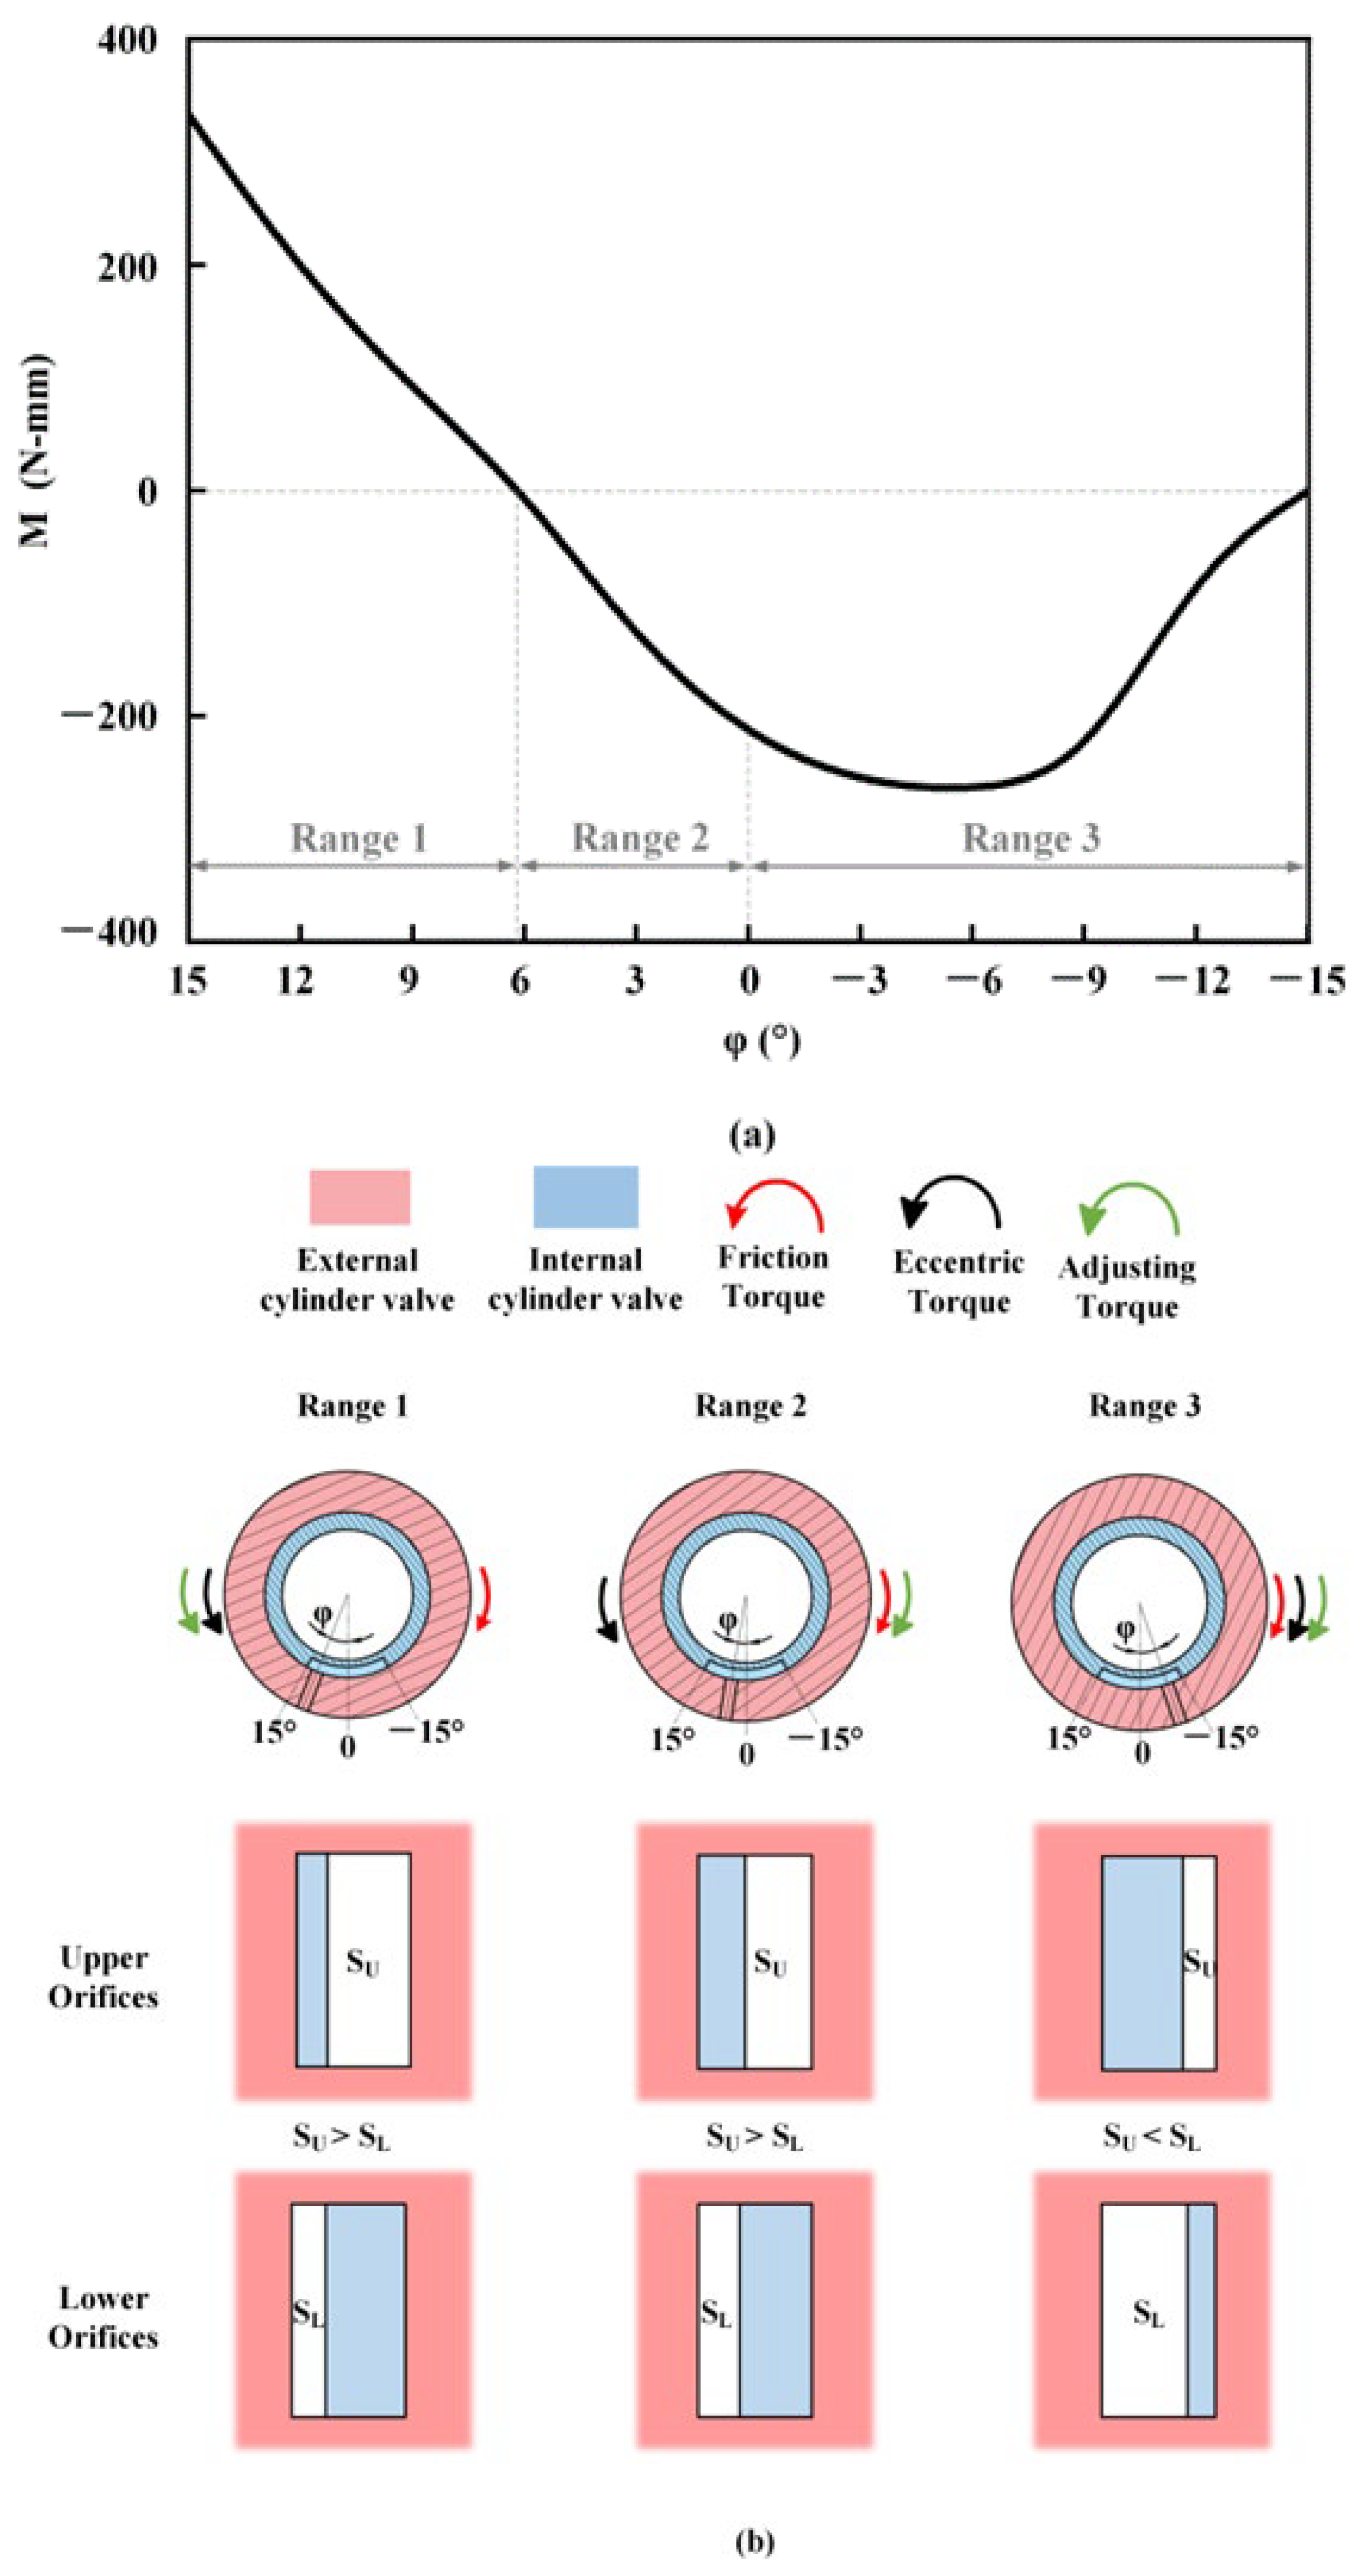
The results of the simulation are presented in Figure 5a. As φ varies from 15° to −15°, the variation of M(φ) is observed to be monotonic, with a minimum value followed by an increase to zero. Furthermore, the values of M(φ) can be divided into three ranges. In ranges 1 and 2, SU is found to be greater than SL. Conversely, when M(φ) is within range 3, the magnitudes of SU and SL are observed to be inversely proportional to those observed in ranges 1 and 2. Figure 5b illustrates the variations of SU and SL, corresponding to Figure 2, and their values can be calculated using Equations (2) and (3).
M(φ) is positive when it falls within range 1, which allows it to balance the friction torque as designed. At this point, φ will tend toward zero under the combined influence of M and the eccentric torque, thereby improving the stability and accuracy of the MVDT.
In addition, although SU is similarly greater than SL in range 2, M(φ) is negative and its direction is the same as the friction torque. This indicates that φ has a tendency to move away from zero under the combined effect of the friction torque and M(φ). However, as mentioned in Section 2, the occurrence of negative values for M(φ) is extremely rare in range 2. Even if the negative value of M(φ) may exist due to the turbine being too close to the lower orifices or the kinetic energy of the fluid flowing out of the lower orifices being too large, this negative value should be small rather than large, as shown in Figure 5. The occurrence of large negative values of M(φ) will affect the effectiveness of the regulating device, so the causes of this phenomenon need to be further studied.
Additionally, M(φ) has large negative values in range 3. Although the direction of M(φ) is the same as the friction torque, φ will still approach zero under the combined effect of the three torques. However, this does not align with the design principle of the adjusting device, as the hands of the turbine are not in the optimal position.
In summary, based on the working principle of the adjusting device, M(φ) is in line with expectations in range 1 and φ can be reduced by the effect of M. However, the presence of unexpected negative M values is not only unreasonable, but it also impacts the effectiveness of the adjusting device. Therefore, it is important to minimize negative M values and further investigate the factors that influence the adjusting device to resolve this issue.

3.2. Solutions for Negative Adjusting Torque

To obtain the desired M(φ) and solve the problem of negative M, the impact of influencing factors as described in Section 2.2 was researched. To simplify the study, a suitable range of values was chosen for each influence factor, as shown in Table 2.
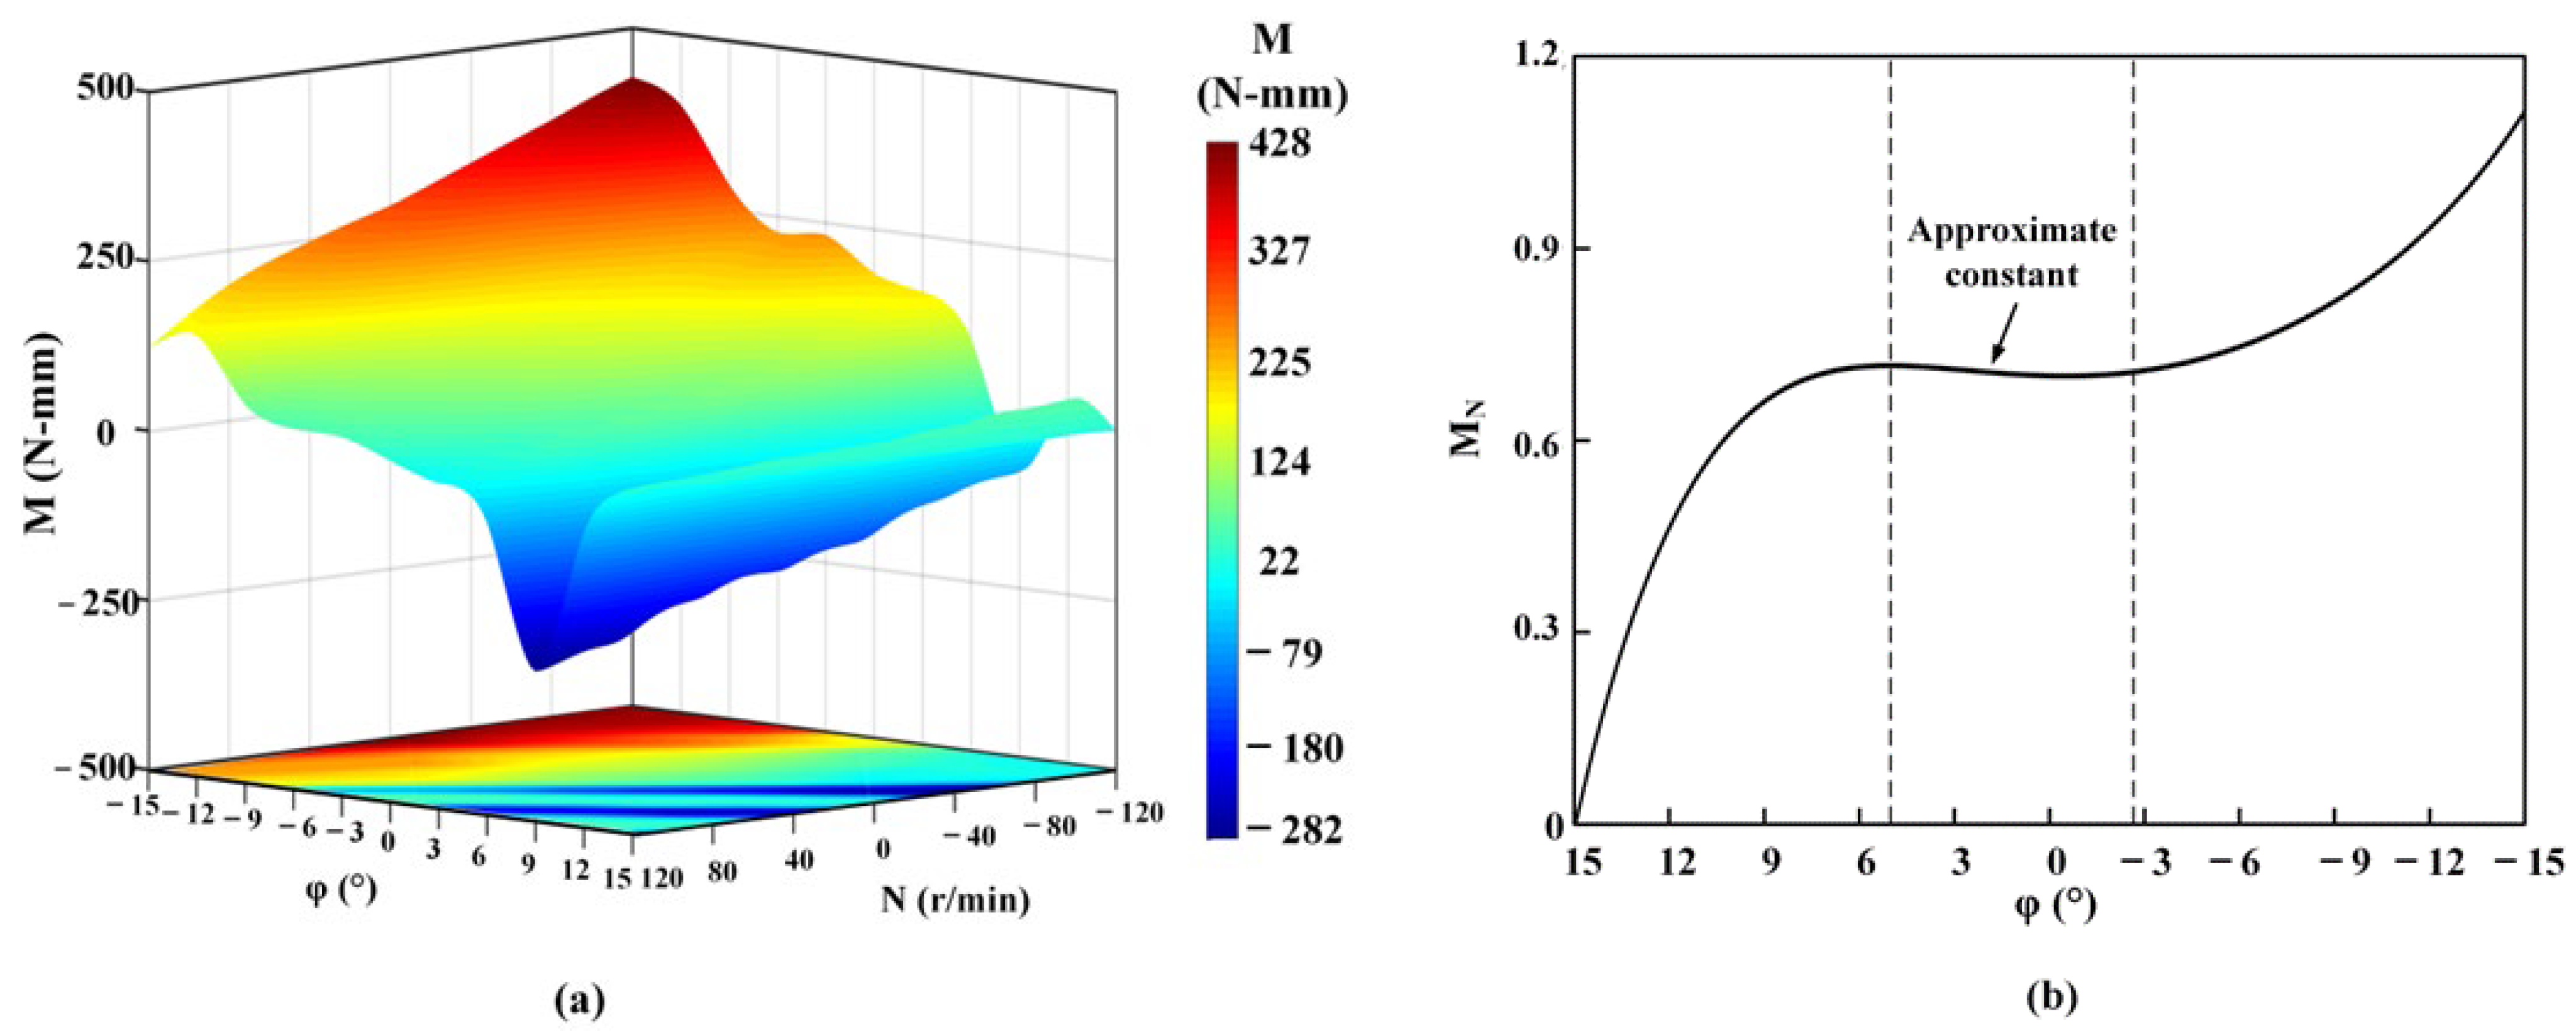
The influence of N on M(φ) (denoted as M(φ,N)) should be excluded first. The result of M(φ,N) is shown in Figure 6a, and the partial derivative of N with respect to M(φ,N) (MN for short) is shown in Figure 6b.
The results of the simulation indicate that when the variable N is held constant, the variation of M(φ,N) with respect to φ exhibits a similar trend to that described in Section 3.1. Furthermore, when φ is held constant, M(φ,N) gradually decreases as N transitions from negative to positive values. This can be attributed to the fact that when the direction of N is opposite to that of M, there is a greater resistance that must be overcome in order to rotate the turbine, resulting in a larger value of M(φ,N).
In addition, the rate of change in M(φ,N) with respect to N, denoted as MN, increases as φ transitions from a positive value to a negative value. As φ approaches zero, MN tends to approach a constant value. This observation suggests that at this point, there is a linear relationship between N and M(φ,N), indicating that N has a consistent effect on M(φ,N). However, as φ gradually approaches zero, the impact of N on the performance of the adjusting device is limited.
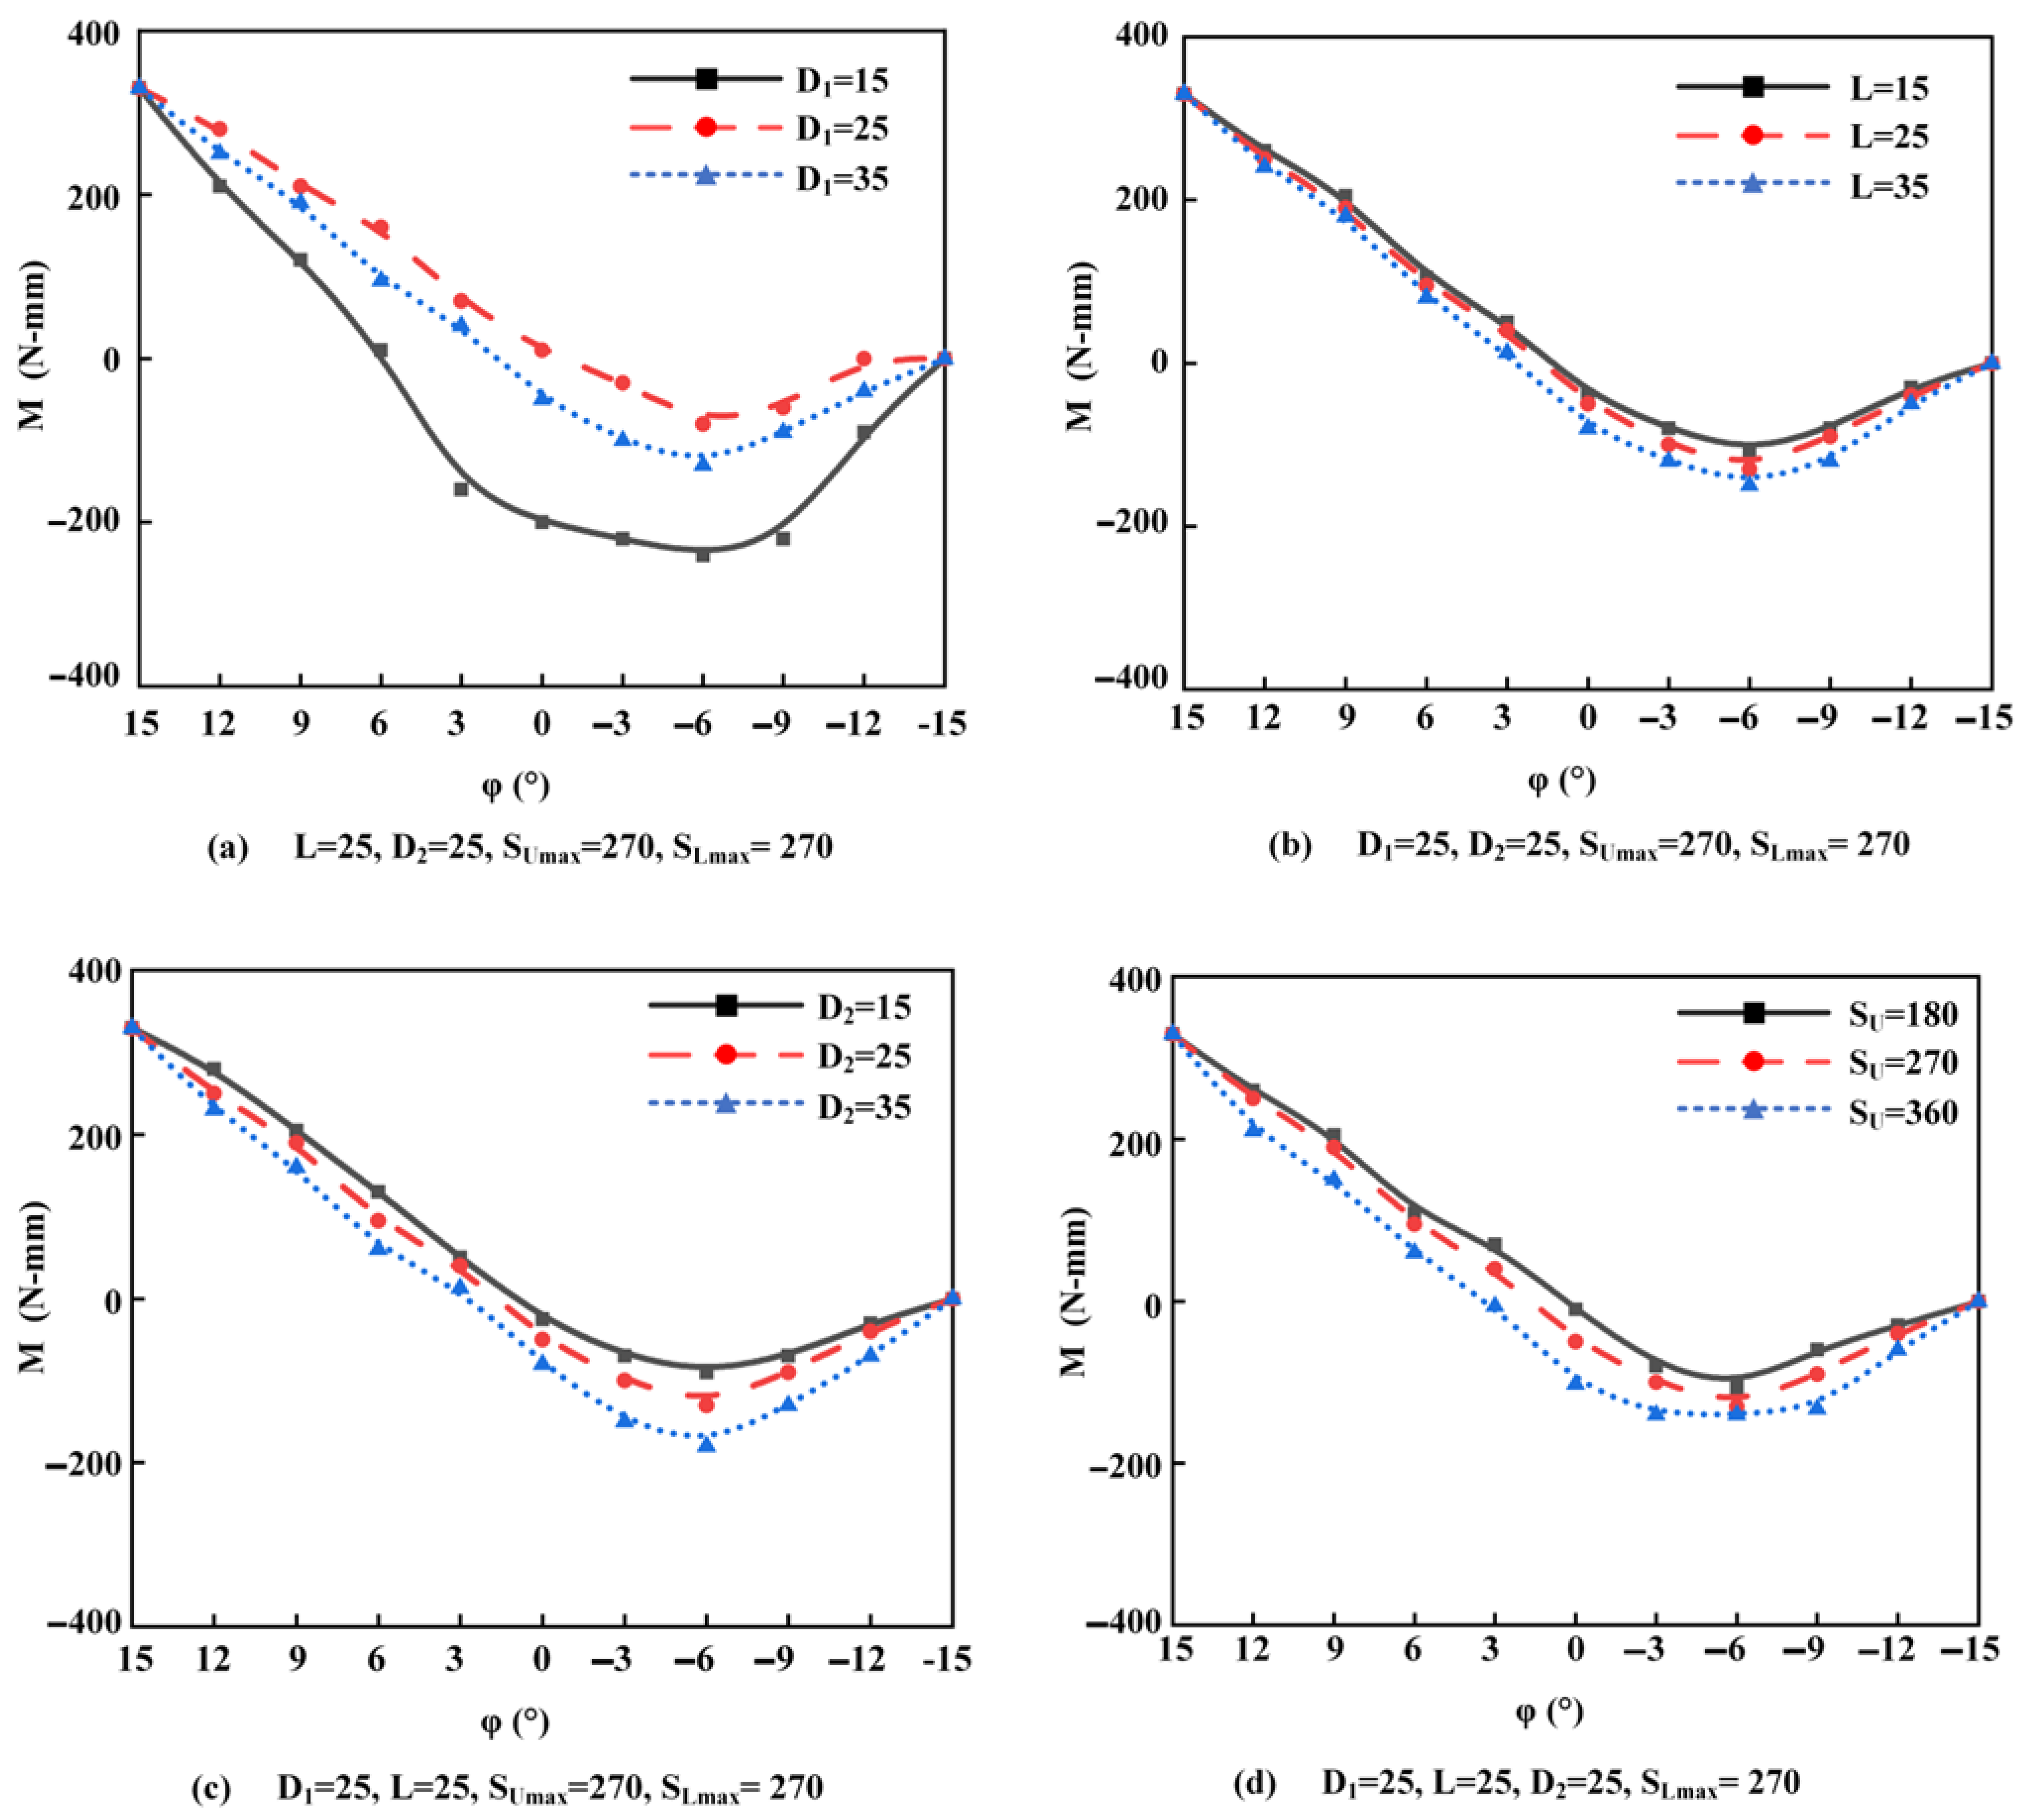
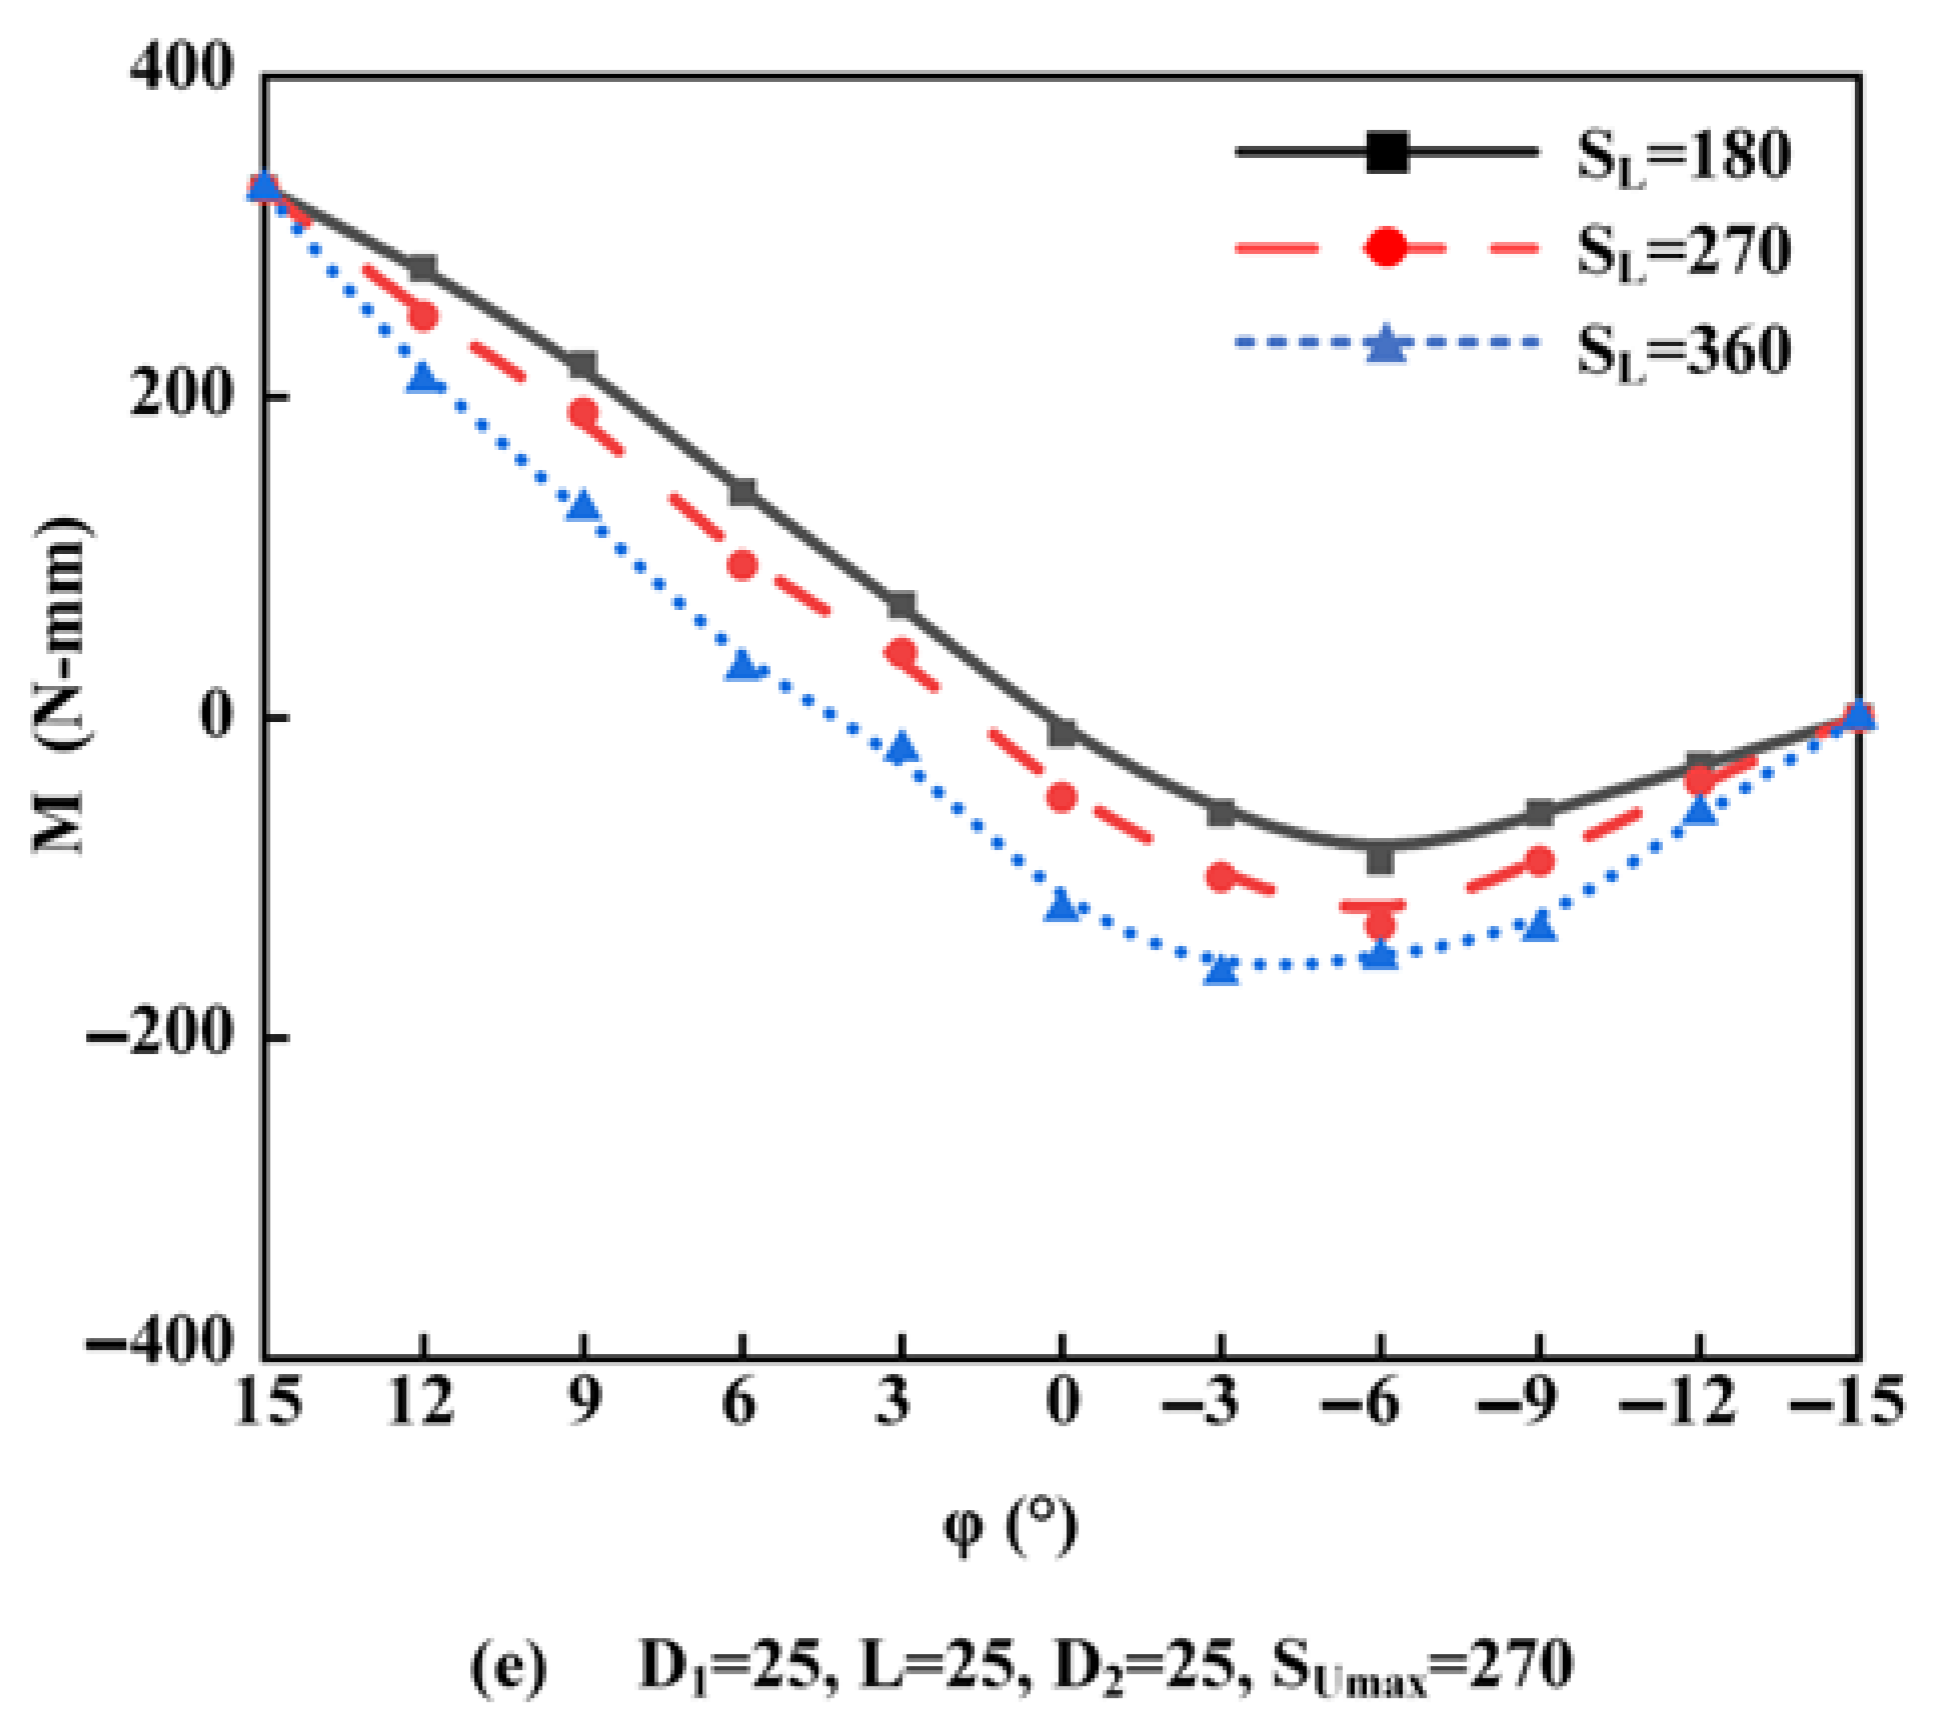
Subsequently, to investigate the effect of others factors on M(φ), the result under a single variable was obtained by simulation, as shown in Figure 7.
M(φ) demonstrates a consistent variation in response to different single variables. As φ ranges from 15° to −15°, M(φ) decreases from a consistent value to its respective minimum and subsequently increases to zero. The variation of M(φ) is monotonically increasing. However, it should be noted that different single variables have distinct impacts on the values of M(φ) and the negative regions thereof. In order to simplify the research, the effect of each factor will be examined, specifically when φ is equal to zero.
The orthogonal experiment’s method was used to investigate the effects of D2, L, and D2 on M(φ), as these factors do not change with φ. The method allows for the determination of the weights of these factors and their preferred values through the use of range analysis. The factors were denoted as x and different values for each factor were denoted as y (y = 1, 2, 3). The results of M(x,y) were obtained at different x and y values and are shown in Table 3 and Table 4.
The results of the range method analysis are presented in Table 5. The summation of M(x,y) is denoted as K(x,y). The average of K(x,y) is represented as k(x,y), which can be used to determine the optimal values of each factor. R(x) represents the range of k(x,y) and reflects the weight of the influence of x on M. The equation relations can be represented as follows:
K x , y = i = 1 n = 3 M x , i
k x , y = K x , y 3
R x = k x , y m a x k x , y m i n
The results of the orthogonal experiments indicate that when φ = 0, the preferred values of x can be obtained by selecting k(x,y) values that are positive and close to zero. Additionally, the influence weight of x is greater when R(x) is larger. The data in Table 5 show that the most significant influencing factor is D1, and M can be significantly affected by making adjustments to it. These preferred values will be used in further research.
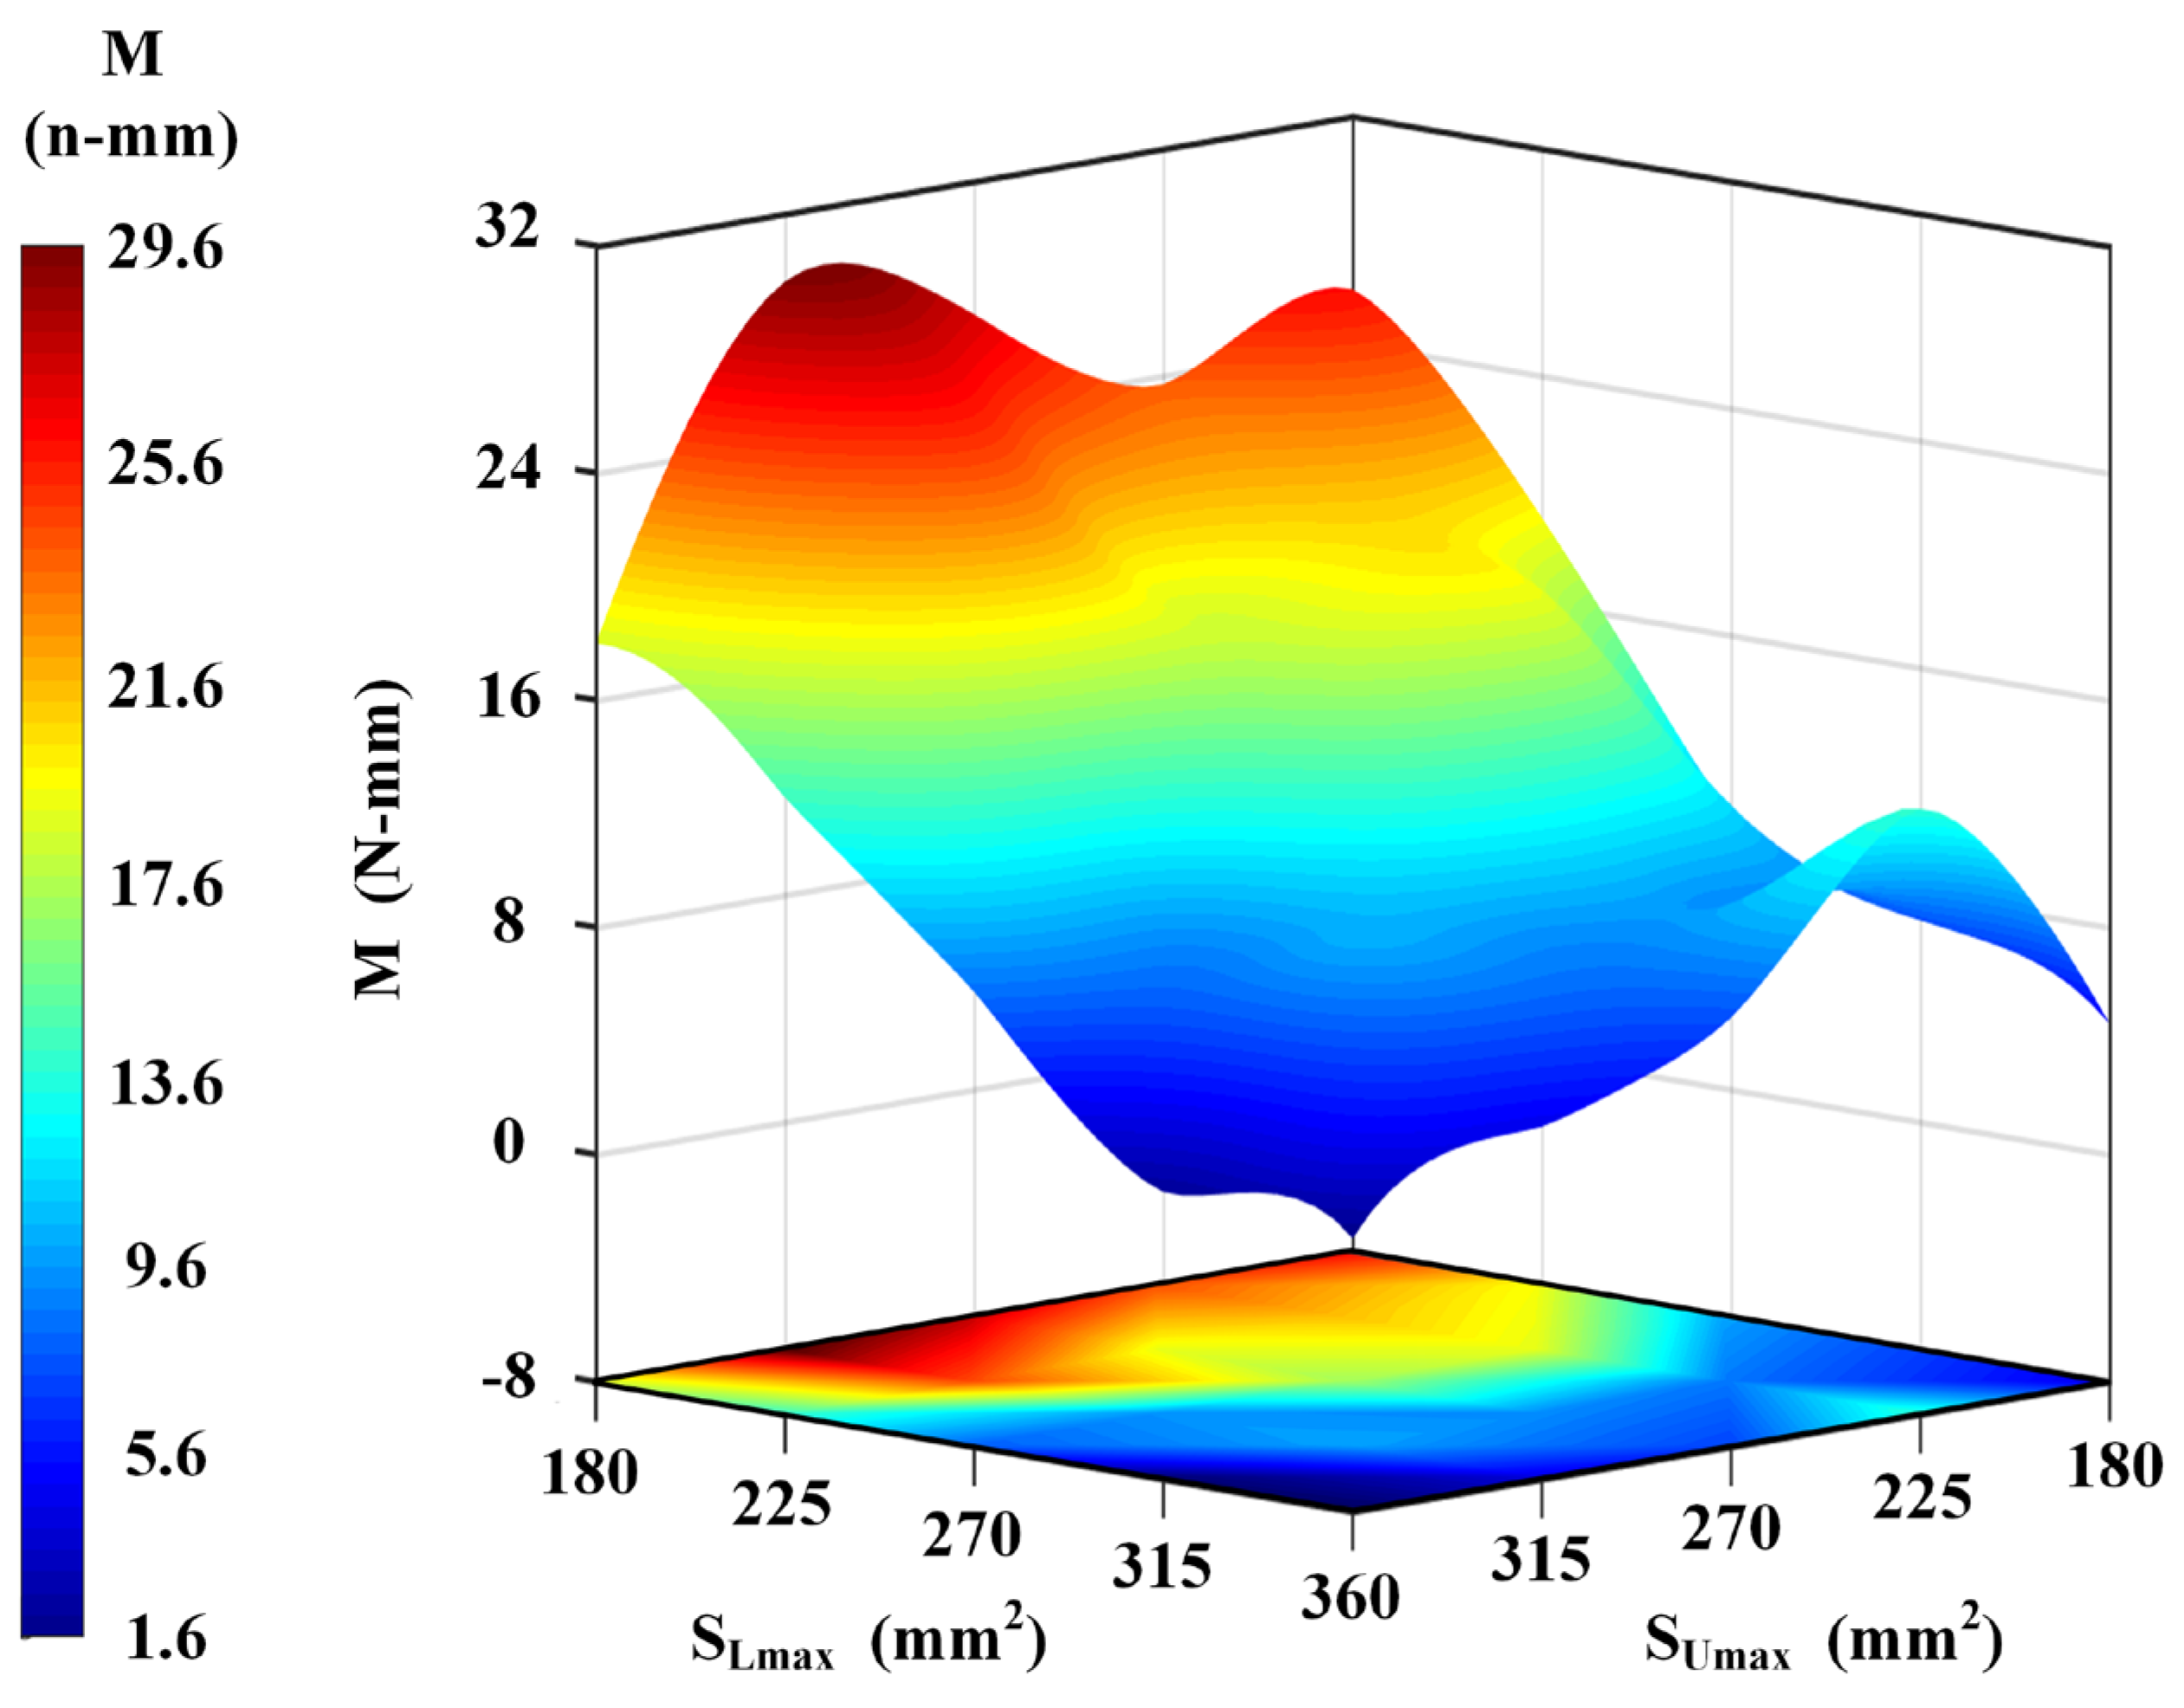
Furthermore, M is directly affected by SUmax and SLmax. When φ is constant, the influence of SUmax and SLmax on M is shown in Figure 8.
The simulation results indicate that both SUmax and SLmax exert significant effects on M. When SUmax remains constant, M decreases as SLmax increases, and the change in M is obvious at any value of SUmax. According to Equation (3), when φ is constant, SL decreases with decreasing SLmax. Consequently, the resistance of fluid flowing out from the lower orifice will increase, and it will be more likely to flow out from the upper orifice, thereby affecting the turbine and increasing M. On the other hand, when SLmax remains constant, M undergoes irregular changes with the change in SUmax, although this change is not as pronounced as the degree of M changing with SLmax. This is particularly evident at SLmax = 180 and SLmax = 360. Since the upper orifice is close to the entrance of the adjusting device, when SUmax changes and SU changes, not only will the resistance of the fluid flowing out of the upper orifice change, but also the magnitude and direction of the fluid velocity will be affected. Under the combined action of multiple factors, M will change with the change in SUmax, and the pattern of the change is not as obvious as that of M changing with SLmax.
Based on simulation results, when φ is equal to zero, M has the maximum value at SLmax of 180 mm. Therefore, 180 mm is selected as the optimal parameter for SLmax. At the same time, since the influence of SUmax on M is not as obvious as that of SLmax, and if SUmax is too large or too small, it will affect the positioning relationship between the turbine and the outer sleeve valve. Therefore, considering the need for the overall size of the regulating device and simplifying the subsequent experimental processing steps, the optimal parameters for SUmax and SLmax are selected, as shown in Table 6.
It should be noted that SUmax and SLmax are not equal after optimization, which means that when SU equals SL, φ will be less than zero. According to Equations (2) and (3), at this point, φ is approximately −4°, while before optimization, SU is equal to SL when φ = 0. Therefore, by increasing SUmax and decreasing SLmax, the fluid can flow more easily out of the upper orifice, thereby reducing the negative value of M(φ).
In summary, the influencing factors above were optimized by simulation and their preferred values are used in the next analysis.

3.3. Validation by Experiment Test

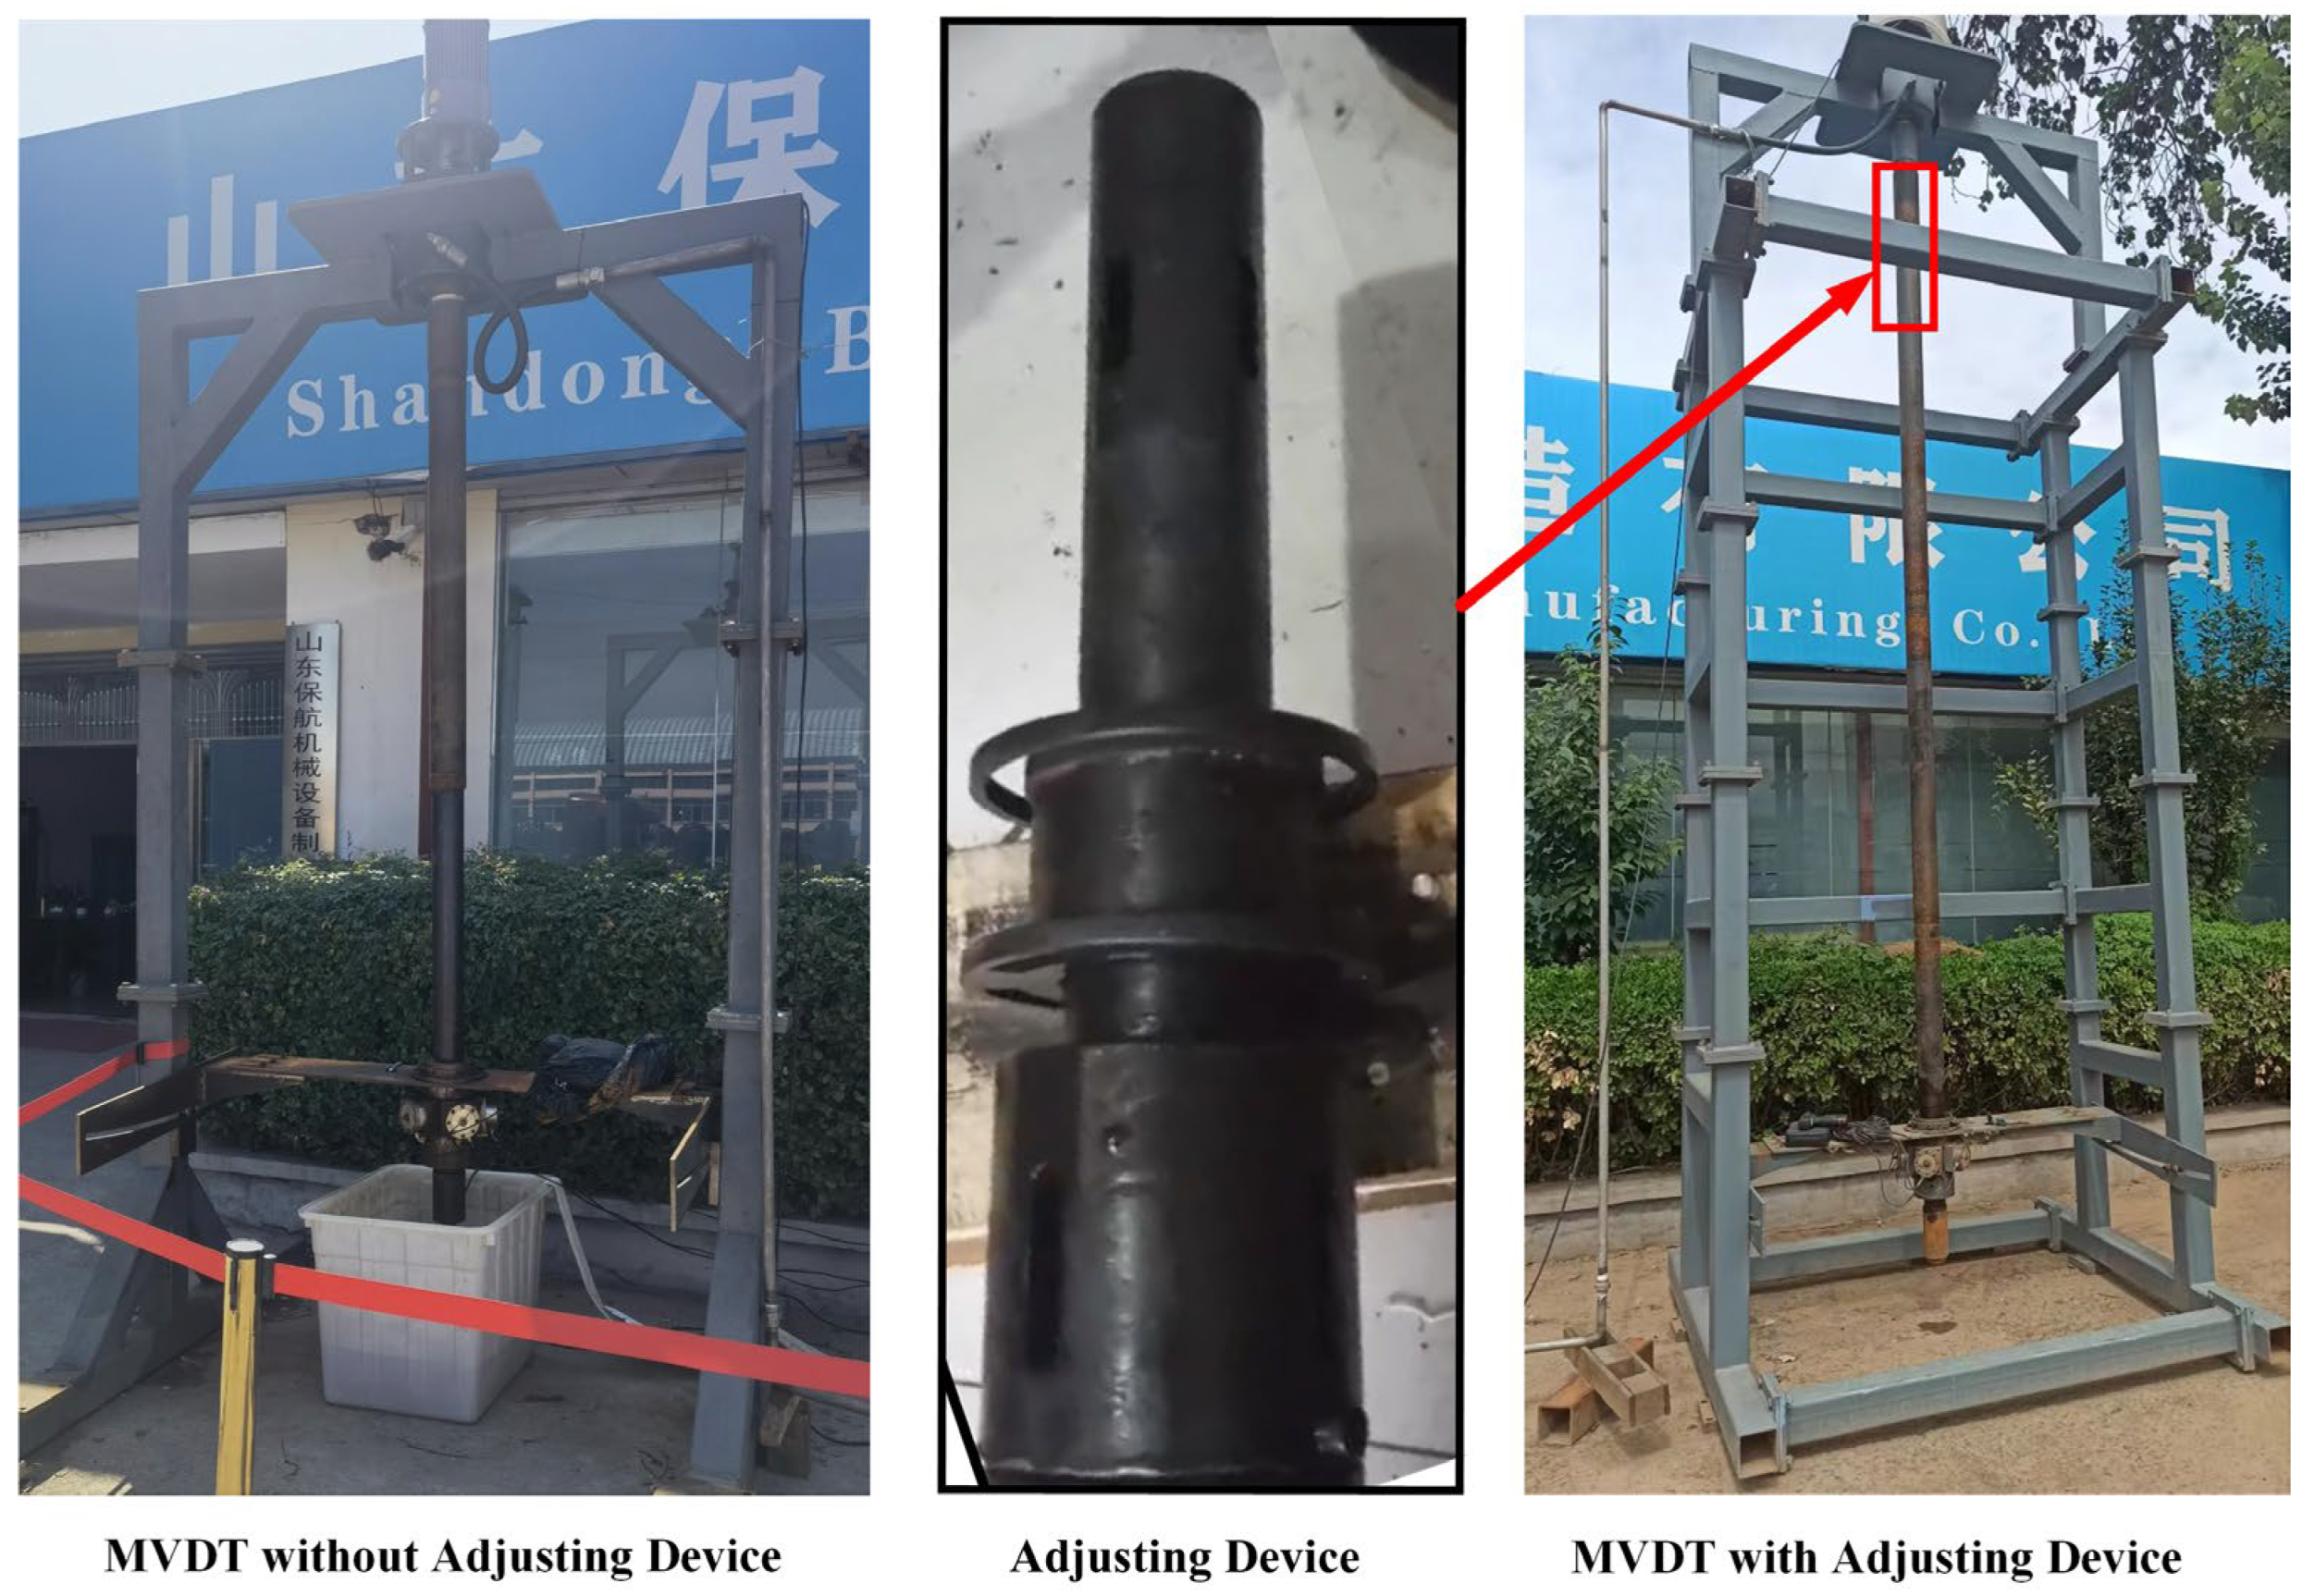
In order to verify the efficacy of the adjusting device, two prototypes of the MVDT were tested, as depicted in Figure 9. The structures of the prototypes were largely identical, with the exception of the adjusting device. The experimental setup for the MVDT was designed to simulate subterranean operating conditions and it also allowed for the measurement of the inclination angle of the well, providing insight into the deviation control accuracy of the MVDT [15].
By performing experiments using the two prototypes of the MVDT, three types of experimental results can be obtained: the first one is the well inclination correction effect of the prototype without the adjusting device; the second one is the well inclination correction effect of the prototype with the adjusting device prior to optimization; and the last one is the well inclination correction effect of the prototype with the optimized adjusting device installed. By comparing these three sets of experimental results, we can ascertain whether the adjusting device can enhance the well inclination correction effect of the MVDT and whether the optimized design of the adjusting device can improve the performance of the MVDT.
Due to the complexity of disassembling the prototypes and the interdependent nature of the components, it is challenging to directly measure M. However, by utilizing statistical and computational methods, it is possible to obtain φ from experimental data. Therefore, we utilized two characteristics of the MVDT and combined them with the measured thrust data of the actuator in the experiment to calculate φ.
MVDT exhibits two characteristics. As described in the introduction, when the MVDT is tilted, the actuator generates pushing forces in different directions, but the magnitude of the pushing force at the higher side of the wellbore is larger than that at the lower side. In addition, due to the periodic rotation of MVDT, the pushing forces in each direction will produce peaks and valleys with different phases over time. The pushing force in a direction will increase when the corresponding flow path of the actuator is connected by the plate valve [9,17,36].
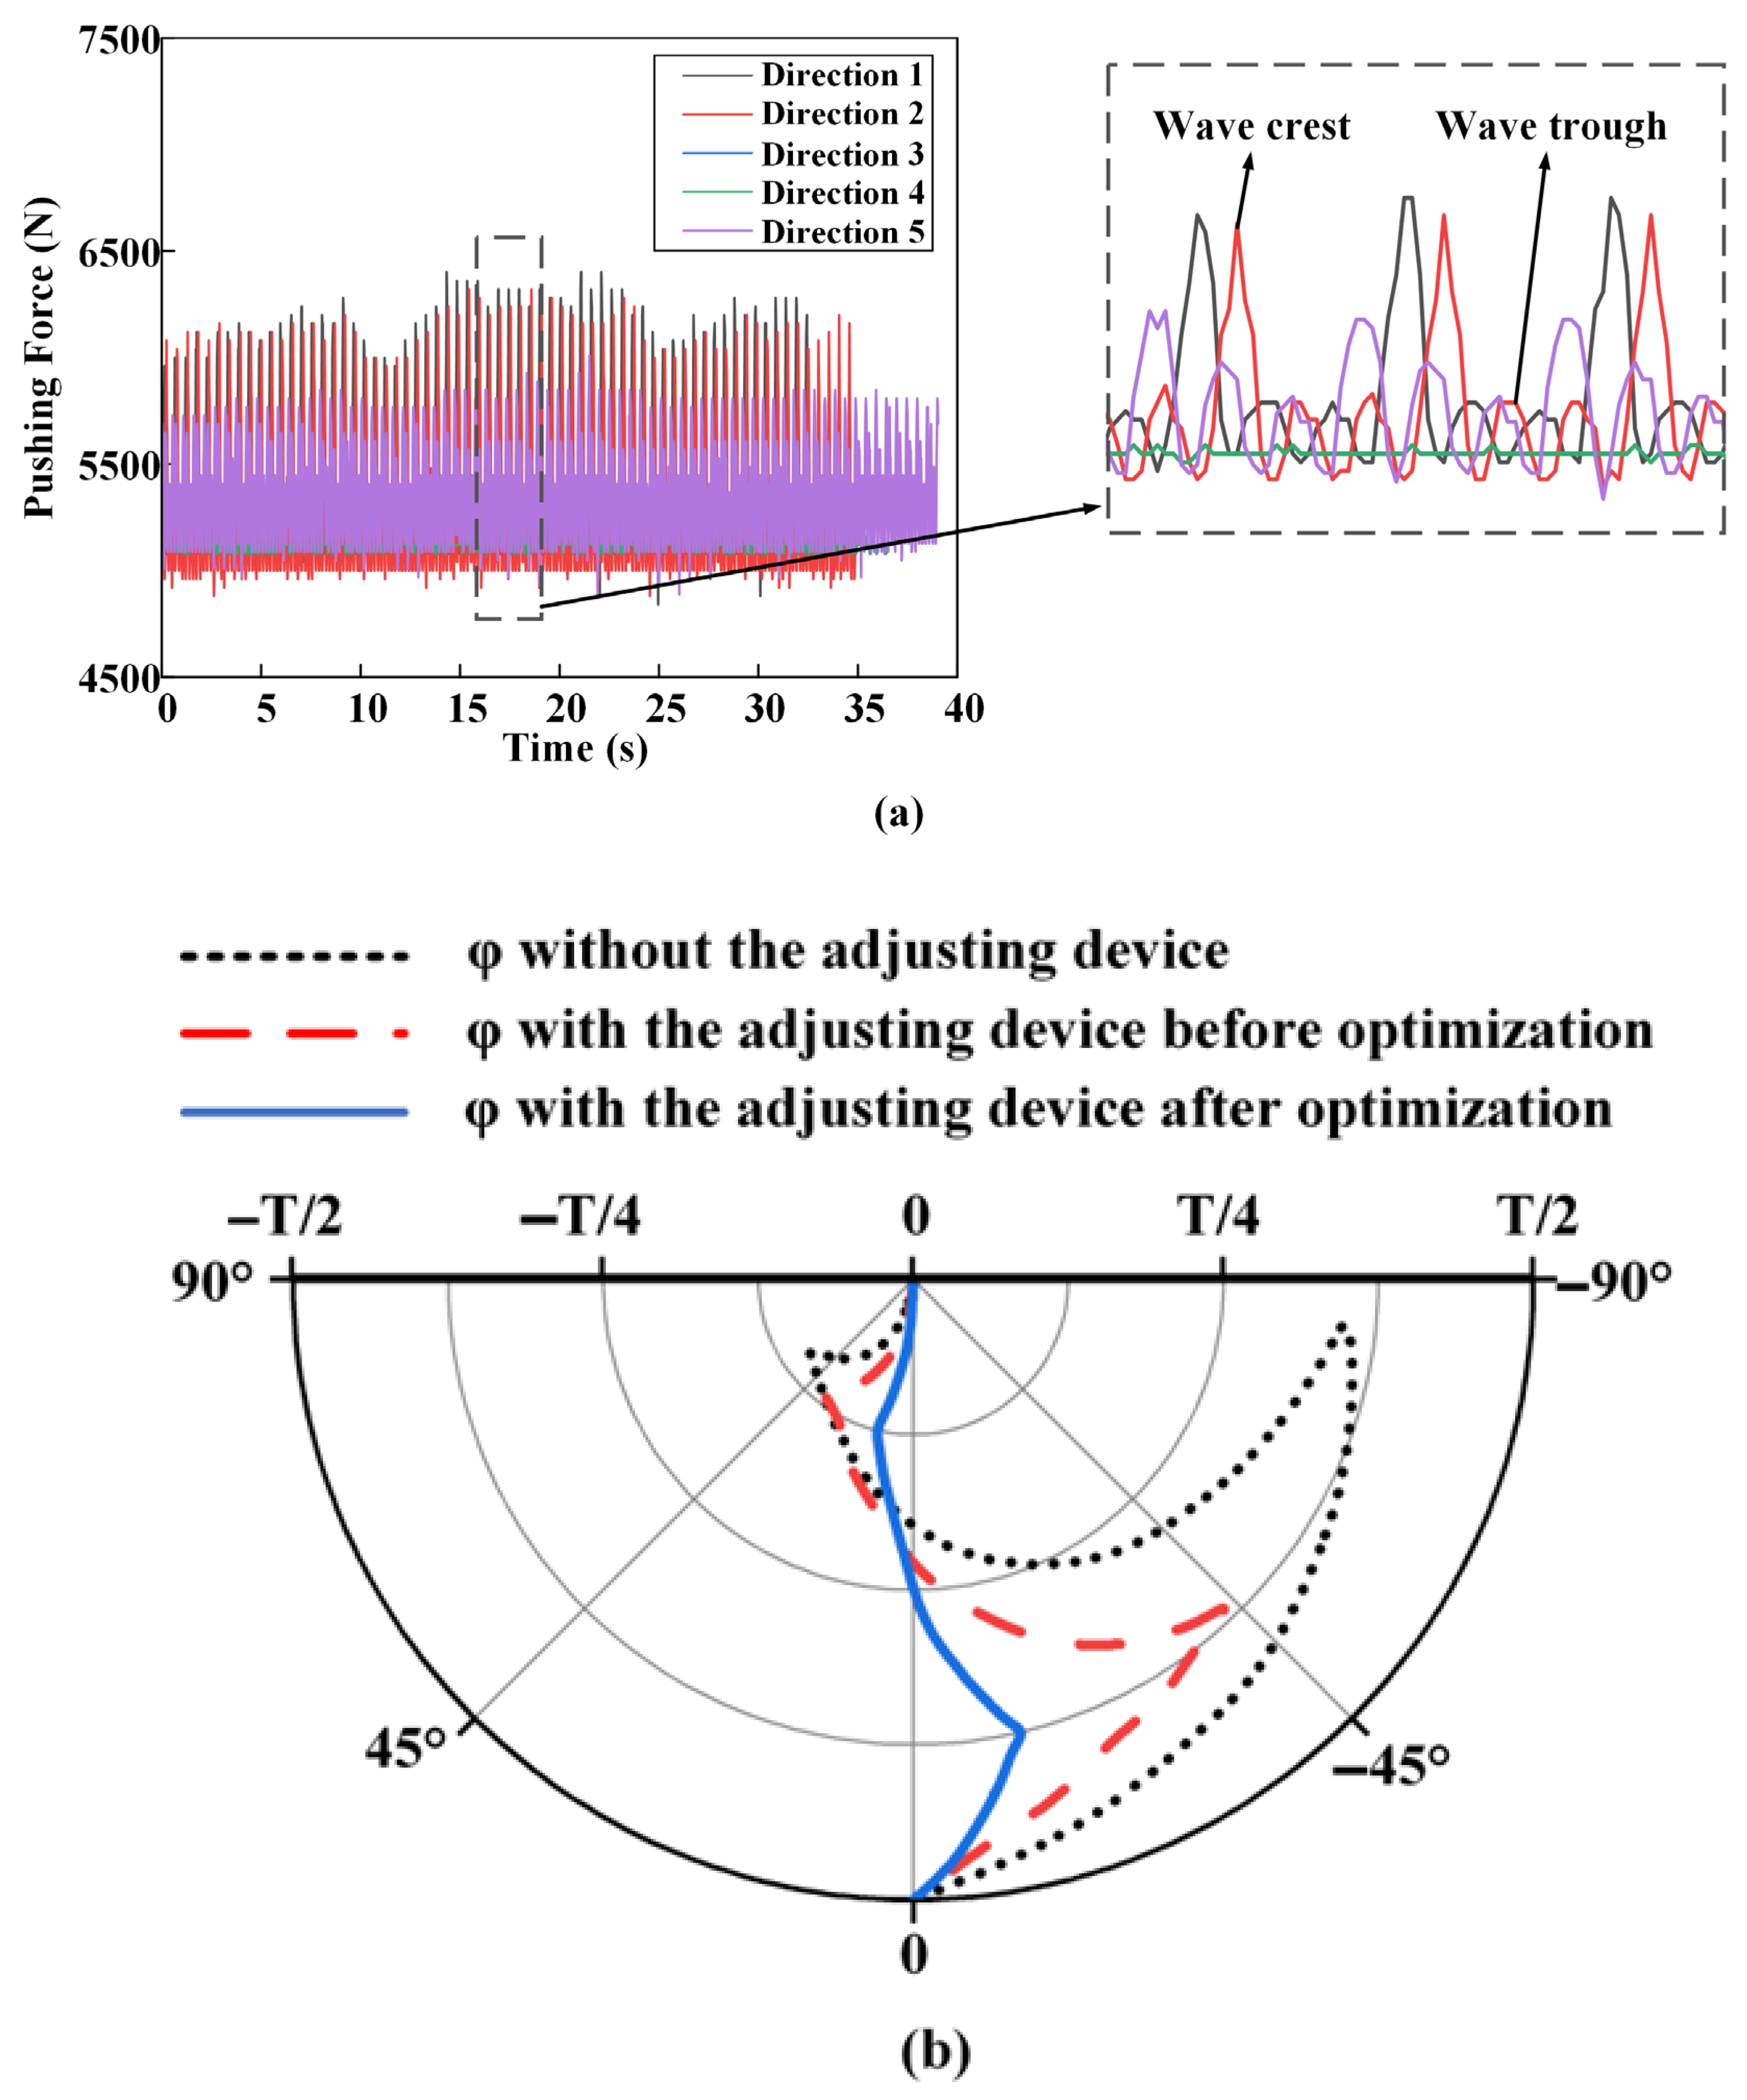
Due to the abundance of experimental data, we present only a set of pushing force data from one particular experiment, as shown in Figure 10a. The data demonstrates the different wave crests and troughs of pushing force in various directions over time. It can be observed that there is a distinct difference in the magnitude of the pushing force between the higher side and lower side of the wellbore. Moreover, for the directions 1, 2, and 5 of pushing forces located on the higher side of the wellbore (direction 3 and 4 located on the lower side of the wellbore), their time phase, peak magnitude, and duration of peak are all different as time progresses.
Using the aforementioned characteristics, we have calculated the relationship between φ and time in previous research [12], as shown in Figure 10b. This variation is periodic due to the uniform rotating speed of the MVDT. Under the three different experimental conditions in Figure 10b, φ shows a similar pattern of variation. It first reaches a positive maximum, then a negative maximum, before ultimately returning to zero.
From Section 2.1, it can be inferred that the smaller the range of variation of φ and the closer its maximum value is to zero, the better the performance of the MVDT. As shown in Figure 11b, when there is no adjusting device, the range of φ is the largest, particularly when φ is negative. This suggests that although the MVDT without an adjusting device can correct wellbore deviation, its performance still needs improvement.
The red dashed line in Figure 10b indicates that the range of φ is significantly reduced when the pre-optimized adjusting device is added. The maximum value of φ, when positive, decreased from approximately 60° to approximately 40°, and from approximately 90° to approximately 50° when negative. This observation serves as evidence of the regulating torque’s impact on φ and its ability to enhance the precision of the MVDT. However, it should be noted that the range of φ remains substantial and the improvement in the adjusting device on the MVDT is constrained prior to optimization.
The black curve in Figure 10b indicates that the range of φ is significantly reduced with the optimized adjusting device, especially when φ is negative. By implementing a solution for values of the negative M, φ is limited to a range of approximately ±15° under the influence of M′. This reduction in the range of φ serves as evidence of the effectiveness of the optimization on the adjusting device, and it ultimately enhances the accuracy and stability of the MVDT system.

4. Results and Discussions

In this section, the effect of solutions for negative M is discussed. The reasons for negative M are investigated by comparing the results before and after optimization.
The present study sought to further investigate the underlying mechanisms responsible for the observed effects of the proposed solutions. To this end, the simulation results obtained in Section 3.1 were compared against the results obtained with the preferred values of each influencing factor. Additionally, the parameters of QU and QL were examined in order to gain further insights into the reason for the negative M. For the purposes of clarity and concision, the parameters of M, QU, and QL were denoted prior to optimization, and M′, QU, and QL were used to denote the parameters following optimization.
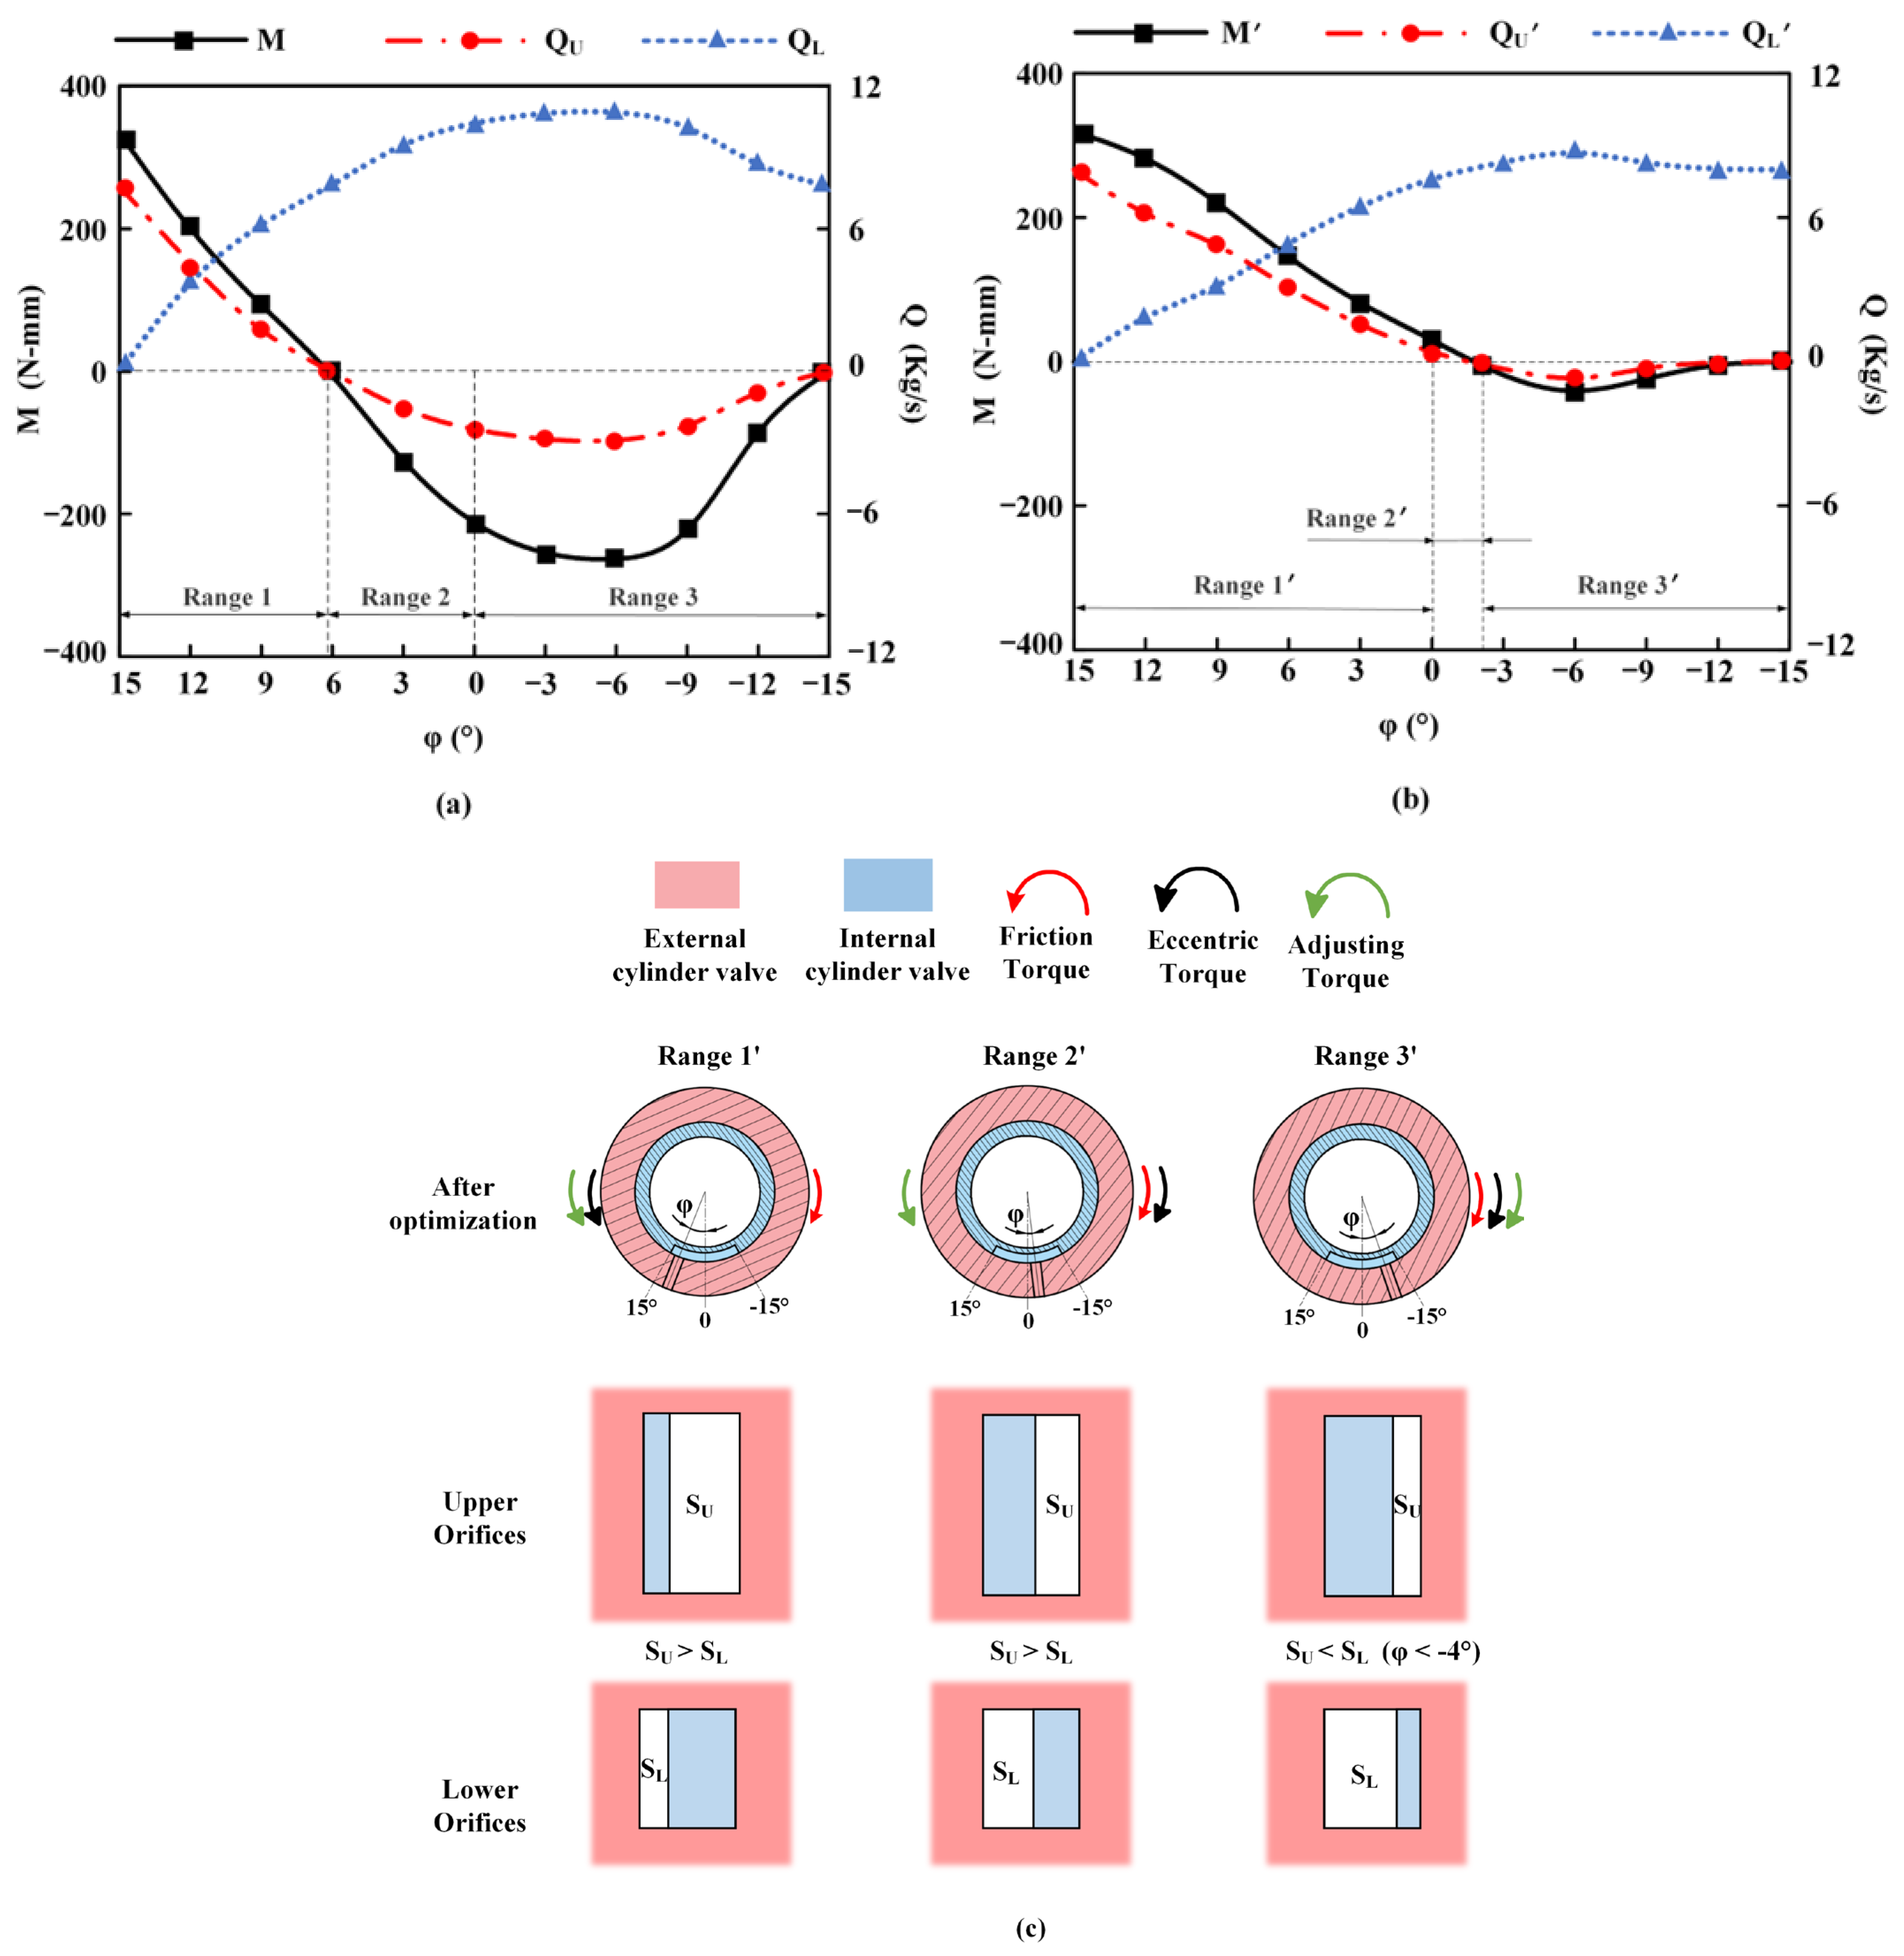
Same as M, M′ can also be divided into three ranges, as shown in Figure 11. The difference is that when φ is in range 1′, SU is larger than SL. When φ is in range 2′, SU is still greater than SL, and in range 3′, SU is only smaller than SL when −4° < φ < −15°, as described in Section 3.2. Due to fluid inertia, it is unavoidable for M of M′ to be non-zero when SU equals SL, irrespective of whether the adjusting device is optimized or not.
However, From Figure 11a, it can be observed that prior to optimization, when M equals zero, the value of φ is approximately 6°, while φ is zero when SU equals SL according to the calculation of Equations (2) and (3), resulting in a difference of 6° between the two values. However, after optimization, Figure 11b shows that when M equals zero, the value of φ is approximately −2.5°, while φ is approximately −4° when SU equals SL, resulting in a difference of 1.5° between the two values. This indicates that, regardless of whether the adjusting device is optimized or not, the difference between the value of φ when the adjusting torque is zero and when SU equals SL is not equal. However, after optimization, this difference is smaller. This also allows for a larger effective range for M′. Figure 11c illustrates the variations of SU and SL at different stages for a convenient comparison of their magnitudes. As described in Section 3.2, SU is greater than SL in both range 1′ and range 2′, while in range 3, SU is smaller than SL when φ is approximately less than −4°.
An analysis of the results of the optimized solution revealed that when M′ is within the range 1′, it is positive and exhibits a similar effect to that of M within range 1, whereby it enables φ to approach zero. However, compared to M, the decrease in M′ is more gradual. This is because, at the same φ, the degree to which the optimized SU is greater than SL is greater than that before optimization, and combined with the adjustment of the structure parameters such as D1 to their optimal values, this leads to a slower rate of change in M′. Since M(φ) is continuous, when M and M′ approach zero, a gentler range of φ change is needed for M′ to reach zero, which is also reflected in the fact that range 1′ (15°~0°) in the figure is larger than range 1 (approximately 15°~6°). Additionally, it was noted that M′ maintains a relatively high value when φ is smaller (approximately 6°~0), indicating that M′ is capable of balancing the friction torque and adjusting φ when M is not.
Moreover, when M′ is within range 2′, despite the direction of M′ being opposite to that of the friction torque, φ will still move away from zero as a result of the combined effects of the friction torque and the eccentric torque. However, range 2′ is significantly smaller than range 2, indicating that the effect of the adjusting device is reduced in both ranges. Furthermore, the absolute value of M′ is less than that of M. Given that the interior of the adjusting device constitutes a closed flow field environment, it is not possible to completely eliminate the negative M, but it can be mitigated through optimization. Therefore, the aforementioned results demonstrate that the negative effect of M′ is less pronounced.
In range 3′, the optimization of the adjusting device resulted in a decrease in the absolute value of M′ in comparison to that of M. Despite the combined effect of the three torques leading to φ approaching zero, a negative value of M′ is still present. In order to further investigate the reasons for the emergence of negative M and M′, the flow rate of the orifices was observed.
The conservation of mass principle dictates that the sum of QU and QL (or QU and QL) must equal the total mass flow. This serves as a validation of the simulation results. QU and QU are considered to be positive when the fluid flows out of the external cylinder valve, from the inlet, through the upper orifices. Similarly, QL and QL are considered to be positive when the fluid flows out of the external cylinder valve and through the lower orifices. Conversely, their values will be negative when the fluid is flowing in the opposite direction.
The trend of QU and QU is similar to that of M and M′, and they both exhibit negative values within the same range. This suggests the presence of a fluid phenomenon within the adjusting device, specifically reflux [37]. The reflux is responsible for the negative value of M, and it occurs in range 2, range 3, and range 3′. The reflux expands the range 2 and diminishes the effectiveness of the adjusting device. Therefore, further investigation into the causes of reflux is necessary. The chart of the flow field conditions in the adjusting device when φ = 0 has been observed, as depicted in Figure 12.
Prior to optimization, it was observed, as depicted in Figure 12(a1), that the majority of fluid flows directly from the inlet to the lower orifices and subsequently out of the adjusting device. However, a portion of the fluid, known as the reflux, flows in the opposite direction, back through the turbine, and out of the upper orifices from the lower orifices. This results in a change in the direction of M. Subsequently, the reflux circulates out of the adjusting device. Following optimization, it was noted, as illustrated in Figure 12(a2), that the reflux was significantly mitigated. As a result, the turbine was not impacted by the reflux, highlighting the effectiveness of the implemented solutions.
The results indicate that the proposed solutions have a significant impact on the performance of the adjusting device. It was observed that, under a constant total flow rate, the fluid velocity at the inlet is highly influenced by the value of D1. When D1 is smaller, the fluid velocity increases, resulting in a higher inertia [38]. This can lead to the phenomenon of reflux, where the fluid does not flow out of the upper orifices from the internal cylinder valve, even if SU is greater than SL. This explains the limited effect of changes in SU and L on the parameter M. Additionally, it was found that a reduction in D2 and SL increases the fluid resistance and reduces the occurrence of reflux.
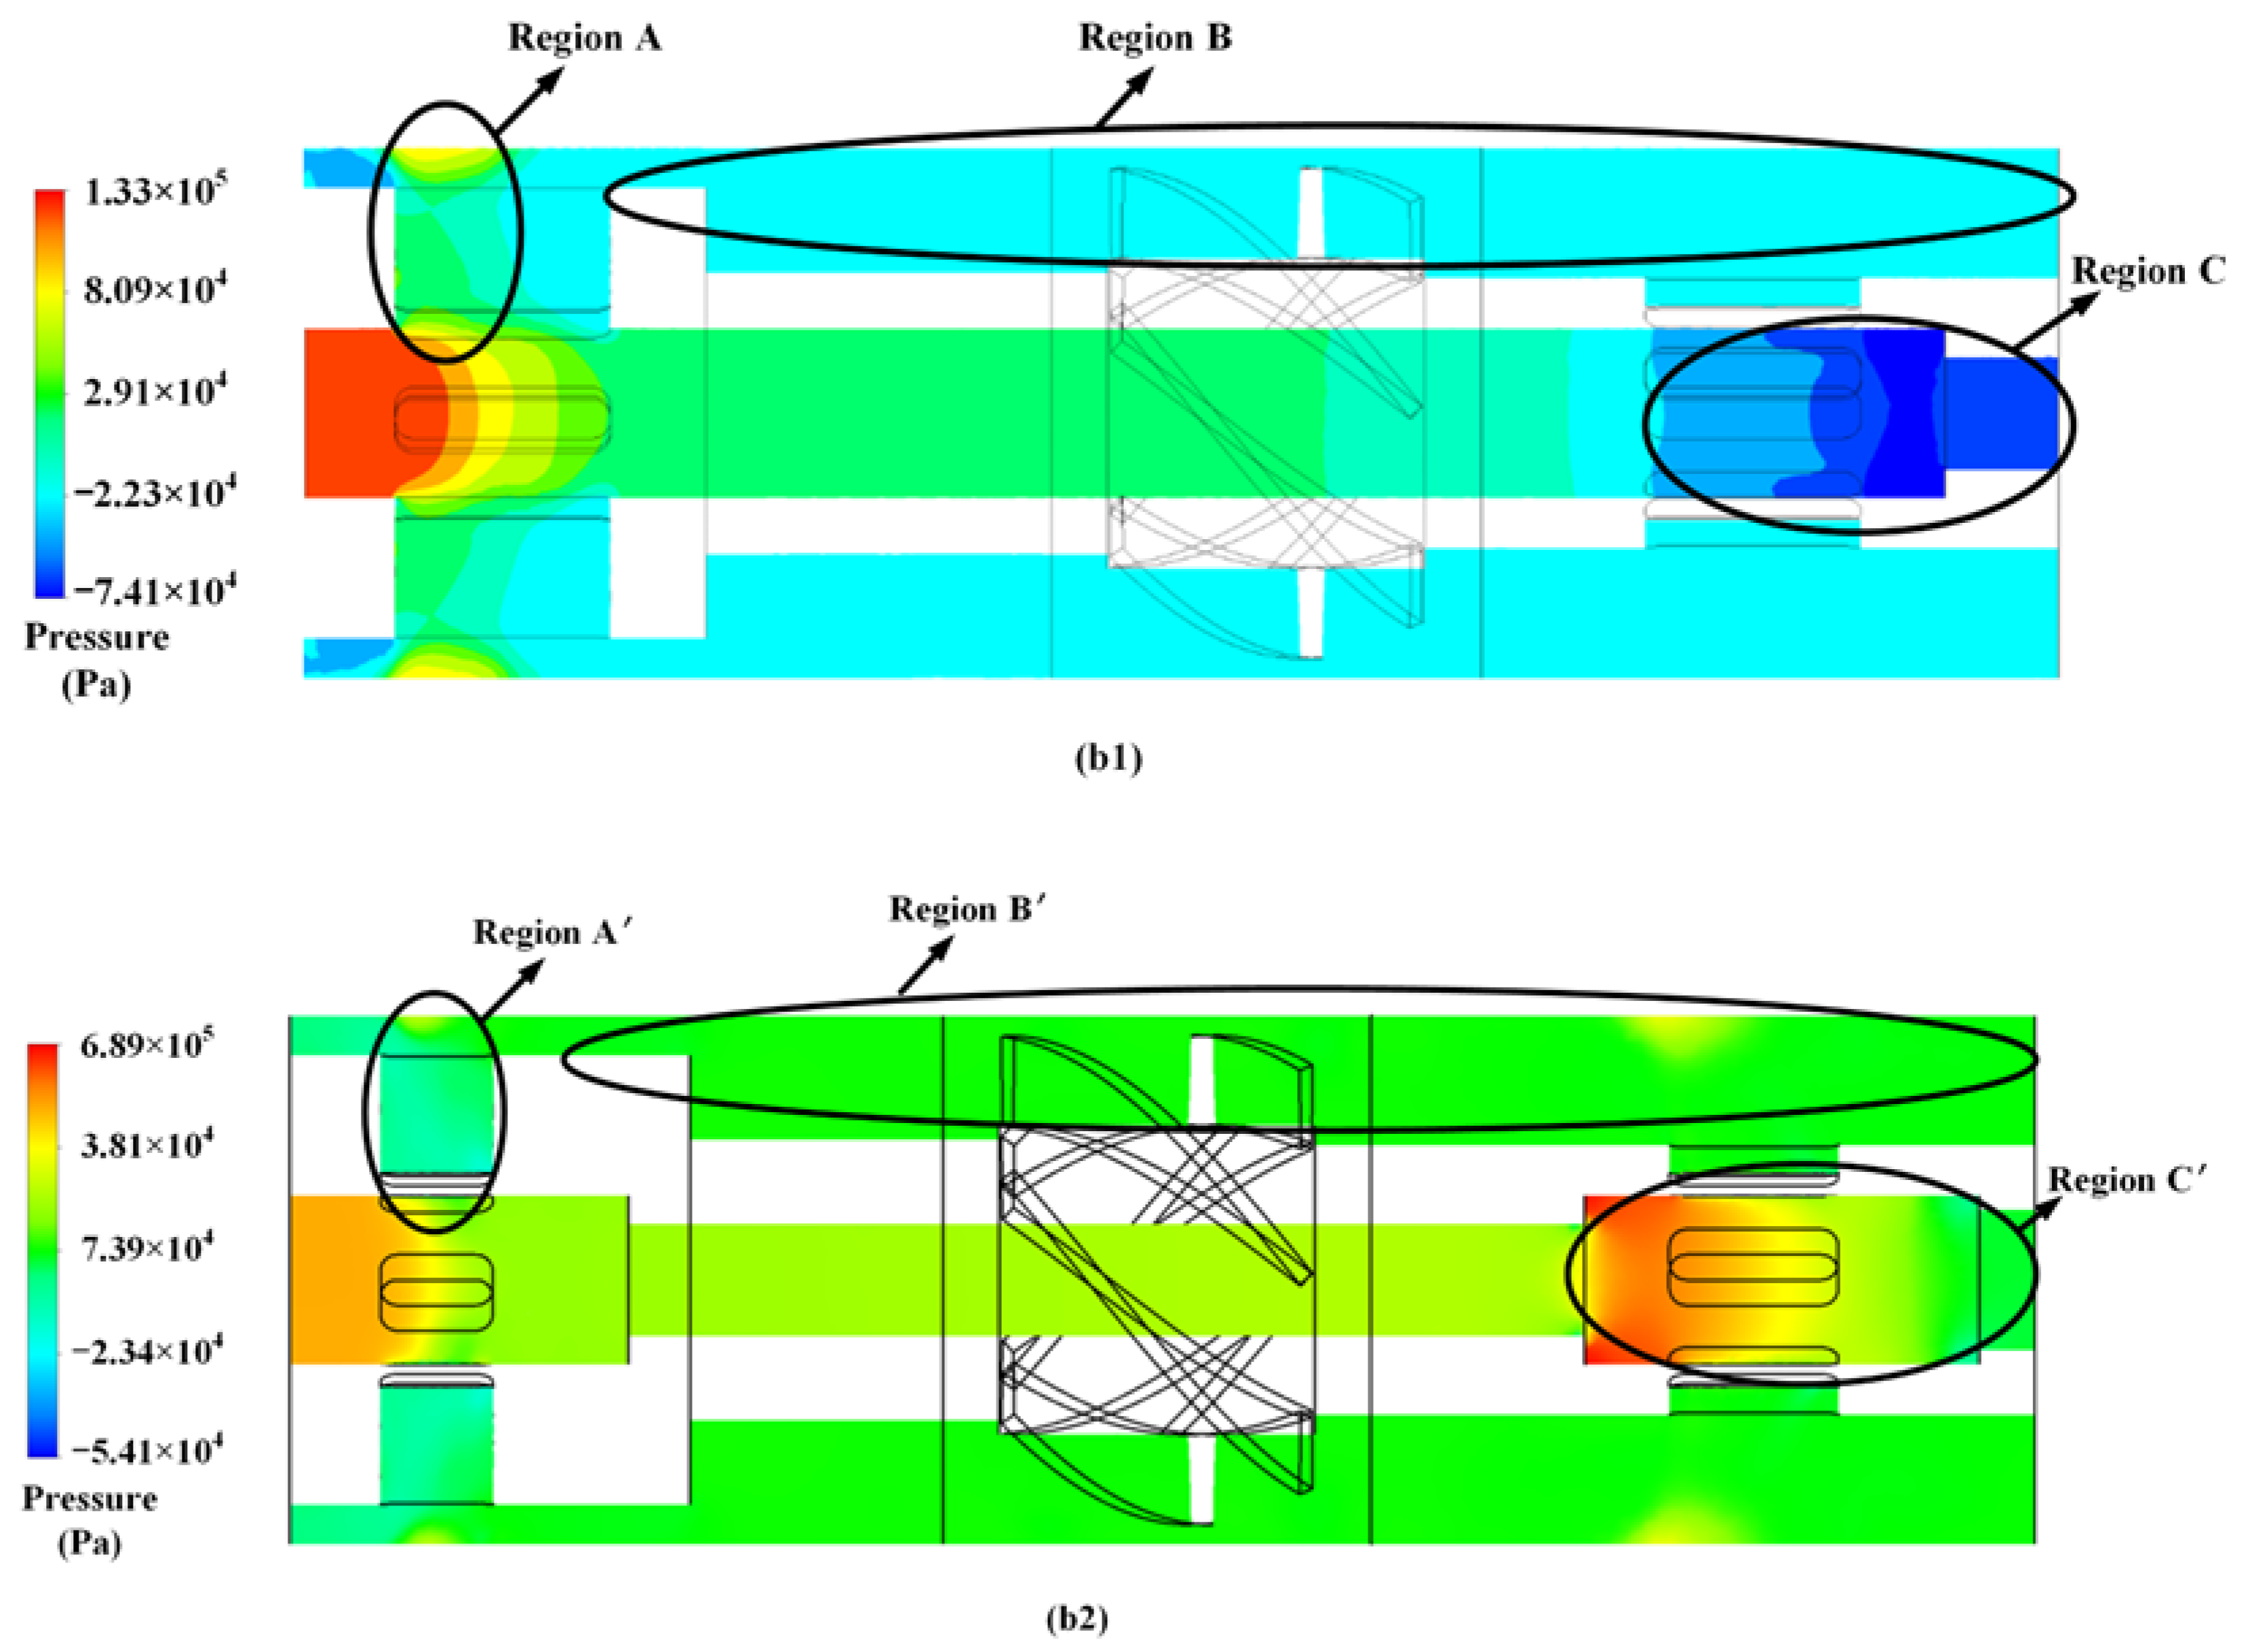
Additionally, to gain a deeper understanding of the underlying causes of reflux, an analysis of the pressure patterns within the adjusting device was conducted, as depicted in Figure 12(b1,b2). For the sake of brevity, the pressure region in proximity to the lower orifices prior to optimization has been designated as region A (with region A′ denoting the corresponding region after optimization). Similarly, the region in which the turbine is located has been referred to as region B (or region B′), and the pressure region in the vicinity of the upper orifices has been labeled region C (or region C′). A comparison of the average pressures across these regions reveals a hierarchy of values, with region C′ > region B′ > region A′ > region A > region B > region C.
It is well established that fluid flow is directed from regions of higher pressure to regions of lower pressure, and that the pressure of a fluid decreases as the flow rate increases [39]. Prior to optimization, the reflux fluid flows from region A to region B as it exits the lower orifices due to the pressure differential between the two regions. Additionally, the increased fluid velocity at the inlet results in a decrease in the pressure in region C, potentially even reaching negative values [40]. The negative pressure in region C also impacts the fluid in regions A and B, contributing to the phenomenon of reflux. As a result, M assumes negative values within ranges 2 and 3 as a consequence of the reflux.
After optimization, there is no negative pressure in region C′, and the pressure in region A′ and region B′ has a more uniform distribution. Moreover, the higher pressure in region C′ makes the fluid flow more easily from region C′ to region B′. Although negative M still exists in range 3′, the impact of the reflux on the adjusting device has been significantly reduced after optimization, and the performance of the adjusting device has improved.
In summary, by optimizing the adjusting device, the reflux phenomenon has been significantly weakened. A more desirable M can be obtained to balance the friction torque. The performance of the adjusting device has been significantly improved. The solutions of the negative M contribute to the effectiveness of the adjusting device and can improve the stability and accuracy of MVDT, which can provide recommendations for the following research.
5. Conclusions and Suggestions

In this study, the working principle of the adjusting device is examined, and the factors that influence its function are analyzed. The performance of the device is evaluated through simulations and experiments, and solutions for the negative adjusting torque are proposed. Additionally, a comparison of the device’s performance before and after optimization is provided.
The adjusting device can influence the accuracy of the mechanical vertical drilling tools (MVDT) by generating the adjusting torque. The flow areas of the upper and lower orifices will change with the variation of the deflection angle, thus producing adjusting torque in a closed loop. However, improper structural parameters of the adjusting device can lead to negative fluid pressure in the adjusting device and can cause fluid reflux. The reflux can cause a negative adjusting torque and impact the performance of the adjusting device.
The optimization of factors affecting the adjusting device can reduce the negative adjusting torque and achieve a more desirable adjusting torque. The diameter of the inlet and the flux area of the lower orifices have a large effect on the adjusting torque, and their preferred values were selected as 25 mm and 180 mm2, respectively. After optimization, the effective range of the adjusting torque will increase to about [−15°, 0]. In addition, experiment tests have shown that the pre-optimized adjusting device can improve the performance of the MVDT, but with limited effect. With the addition of the optimized adjusting device, the negative values of the deflection angle are significantly reduced, and its overall range can be controlled within [−15°, 15°], verifying the accuracy of the simulation. This indicates that optimizing the adjusting device can improve the performance of MVDT and provide a reference for further research on MVDT.

Author Contributions

Conceptualization, C.M., K.Z. and B.L.; Methodology, C.M. and K.Z.; Software, C.M.; Validation, C.M., Y.W., C.Y. and L.C.; Investigation, C.M., Y.W., C.Y. and L.C.; Writing—Original Draft Preparation, C.M. and K.Z.; Writing—Review & Editing, C.M. and K.Z.; Funding Acquisition, K.Z. and B.L. All authors have read and agreed to the published version of the manuscript.

Funding

This research was funded by the National Natural Science Foundation of China (Grant No. 42202346), the National Key R&D Program of China (Grant No. 2021YFA0719104), the National Key R&D Program of China (Grant No. 2018YFC0603405), the National Key R&D Program of China (Grant No. 2016YFE0202200), and the Key Topics of Shandong Provincial Engineering Laboratory of Application and Development of Big Data for Deep Gold Exploration (Grant No. SDK202213).

Data Availability Statement

Data sharing is not applicable.

Conflicts of Interest

The authors declare no conflict of interest.

References

  1. Yang, J.; Zhang, X. Reserch & applying of new useful technology for drilling and explosing deep vertical sliaft. J. Henan Polytech. Univ. (Nat. Sci.) 2007, 26, 430–434. [Google Scholar] [CrossRef]
  2. Liu, W.; Li, X.L.; Wang, Q.; Li, L. Application of Vertical-drilling Technology in Northeast Sichuan. Oil Field Equip. 2008, 37, 75–77. [Google Scholar] [CrossRef]
  3. Gao, M.; Zhang, K.; Zhou, Q.; Zhou, H.; Liu, B.; Zheng, G. Numerical investigations on the effect of ultra-high cutting speed on the cutting heat and rock-breaking performance of a single cutter. J. Pet. Sci. Eng. 2020, 190, 107120. [Google Scholar] [CrossRef]
  4. Zhang, H.; Cheng, Y.; Li, Q.; Yan, C.; Han, X. Numerical analysis of wellbore instability in gas hydrate formation during deep-water drilling. J. Ocean Univ. China 2018, 17, 9. [Google Scholar] [CrossRef]
  5. Su, Y.N. The design and control ways of the downhole automatic closed loop of vertical drilling tool. Acta Pet. Sin. 2001, 22, 87–91. [Google Scholar] [CrossRef]
  6. Lu, Y.D.; Zeng, L.C.; Zheng, F.L.; Kai, G.S. Dynamic simulation and research on hydraulic guide system of automatic vertical drilling tool. Mater. Res. Innov. 2015, 19 (Suppl. 6), S6-170–S6-174. [Google Scholar] [CrossRef]
  7. Li, L.; Xue, Q.; Liu, B.; Zhao, L.; Li, X. Design and mechanical analysis of a new automatic vertical drilling tool used in a slim borehole. IOP Conf. Ser. Earth Environ. Sci. 2017, 64, 012017. [Google Scholar] [CrossRef]
  8. Ma, Y.; Xia, H.; Fu, J.; Yang, P. A new design of automatic vertical drilling tool. Petroleum 2015, 1, 264–268. [Google Scholar] [CrossRef]
  9. Wang, J.; Hu, Y.; Liu, Z.; Li, L.; Liu, B.; Huang, L. Dynamic Characteristics and Key Parameter Optimization of Mechanical Automatic Vertical Drilling Tools. Shock. Vib. 2021, 2021, 8813984. [Google Scholar] [CrossRef]
  10. Chai, L.; Zhang, K.; Yang, D.; Liu, B.; Zhang, D. Integral Modeling for Deviation Correction Trajectory of the Mechanical Vertical Drilling System. Machines 2021, 9, 161. [Google Scholar] [CrossRef]
  11. Zhang, K.; Chai, L.; Liu, B.L.; Xue, Q.L.; Wang, L.; Wang, J. A Mechanical Force-Increasing Stable Platform for Automatic Vertical Drilling Tools. China Pet. Machinery 2020, 48, 1–11. [Google Scholar]
  12. Ma, C.; Zhang, K.; Liu, B.; Wang, Y.; Chai, L.; Zhang, L.; Li, R. Research on the stability of a new mechanical automatic vertical drilling tool with the torque-increasing device (based on the variation of deflection angles of the stable platform). J. Pet. Sci. Eng. 2023. submitted. [Google Scholar] [CrossRef]
  13. Mokaramian, A.; Rasouli, V.; Cavanough, G. Turbodrills design and performance analysis for efficient drilling in hard rocks. Int. Conf. Pet. Miner. Resour. 2012, 81, 76. [Google Scholar] [CrossRef]
  14. Li, L.X.; Xue, Q.L.; Liu, B.L. Analysis and Optimal Design of Control Performance in Automatic Mechanical Vertical Drilling Tool. Geol. Sci. Technol. Bull. 2018, 37, 268–274. [Google Scholar] [CrossRef]
  15. Li, L.; Xue, Q.; Liu, B.; Wang, J.; Li, X. The dynamics of eccentric block in a fully mechanical vertical drilling tool under the effect of torsional vibration. Adv. Mech. Eng. 2018, 10, 1687814018770497. [Google Scholar] [CrossRef]
  16. Jinasena, A.; Kaasa, G.O.; Sharma, R. Improved Real–Time Estimation of Return Flow Rate of Drilling Fluids by Model Adaptation for Friction Parameter. IEEE Sens. J. 2019, 19, 9314–9323. [Google Scholar] [CrossRef]
  17. Wang, J.; Xue, Q.; Liu, B.; Li, F.; Zhang, Z. Numerical Study on the Characteristics and Effects of Gap Flow in Two Parallel Rotating Disks. Math. Probl. Eng. 2020, 12, 1–14. [Google Scholar] [CrossRef]
  18. Wang, J.; Xue, Q.; Liu, B.; Li, L.; Li, F.; Zhang, K.; Zang, Y. Experimental measurement on friction performance of PDC bearings for oil drilling under different working conditions. Measurement 2020, 163, 107988. [Google Scholar] [CrossRef]
  19. Werner, B.; Myrseth, V.; Saasen, A. Viscoelastic properties of drilling fluids and their influence on cuttings transport. J. Pet. Sci. Eng. 2017, 156, 845–851. [Google Scholar] [CrossRef]
  20. Païdoussis, M.P.; Price, S.J.; Langre, E.D. Fluid-Structure Interactions: Cross-Flow-Induced Instabilities; Cambridge University Press: Cambridge, UK, 2011; pp. 103–114. [Google Scholar]
  21. Hirsch, C. Fluid Flow Phenomena. Eur. J. Mech.—B/Fluids 2001, 20, 428–430. [Google Scholar] [CrossRef]
  22. Dullien, F. Porous Media: Fluid Transport and Pore Structure; Academic Press: New York, NY, USA, 2013; pp. 58–87. [Google Scholar]
  23. Munk, D.J.; Kipouros, T.; Vio, G.A.; Steven, G.P.; Parks, G.T. Topology optimisation of micro fluidic mixers considering fluid-structure interactions with a coupled Lattice Boltzmann algorithm. J. Comput. Phys. 2017, 349, 11–32. [Google Scholar] [CrossRef]
  24. Azevedo, H.; Araújo, A.M.; Bouchonneau, N. A review of wind turbine bearing condition monitoring: State of the art and challenges. Renew. Sustain. Energy Rev. 2016, 56, 368–379. [Google Scholar] [CrossRef]
  25. Zhou, Z.; Benbouzid, M.; Charpentier, J.-F.; Scuiller, F.; Tang, T. Developments in large marine current turbine technologies—A review. Renew. Sustain. Energy Rev. 2017, 77, 852–858. [Google Scholar] [CrossRef]
  26. Gang, X.; Yang, T.; Liu, H.; Ni, D.; Ferrari, M.L.; Li, M.; Luo, Z.; Cen, K.; Ni, M. Recuperators for micro gas turbines: A review. Appl. Energy 2017, 197, 83–99. [Google Scholar] [CrossRef]
  27. Jawahar, C.P.; Michael, P.A. A review on turbines for micro hydro power plant. Renew. Sustain. Energy Rev. 2017, 72, 882–887. [Google Scholar] [CrossRef]
  28. He, Y.; Wang, Y.; Zhang, D.; Xu, Y. Optimization design for turbodrill blades based on a twisting method—ScienceDirect. J. Pet. Sci. Eng. 2021, 205, 108892. [Google Scholar] [CrossRef]
  29. Durst, F. Fluid Mechanics: An Introduction to the Theory of Fluid Flows; Springer: Berlin/Heidelberg, Germany, 2008; pp. 36–57. [Google Scholar]
  30. Rybak, A.T.; Temirkanov, A.R.; Lyakhnitskaya, O.V. Dynamics of Synchronous Hydromechanical Drive in Mobile Machine. Russ. Eng. Res. 2018, 38, 702–704. [Google Scholar] [CrossRef]
  31. Duncan, W.J.; Thom, A.S.; Young, A.D. Mechanics of Fluids; Edward Arnold: London, UK, 1970; pp. 55–72. [Google Scholar]
  32. Qin, L.; Zhou, F.; Yang, J.X.; Wu, R.Z.; Lu, L. Numerical study of flow distribution and pressure loss in multi-branch pipeline based on merging and splitting. J. South China Univ. Technol. (Nat. Sci. Ed.) 2021, 49, 109–119. [Google Scholar] [CrossRef]
  33. Tavoularis, S. Measurement in Fluid Mechanics; Cambridge University Press: Cambridge, UK, 2009; pp. 95–110. [Google Scholar]
  34. Deligant, M.; Podevin, P.; Descombes, G. CFD model for turbocharger journal bearing performances. Appl. Therm. Eng. 2011, 31, 811–819. [Google Scholar] [CrossRef]
  35. Li, H.; Bachynski-Poli, E.E. Validation and application of nonlinear hydrodynamics from CFD in an engineering model of a semi-submersible floating wind turbine. Mar. Struct. 2021, 79, 103054. [Google Scholar] [CrossRef]
  36. Ma, C.; Zhang, K.; Chai, L.; Liu, B.; Zhou, Q. Research on the internal flow field law of mechanical automatic vertical drilling tool actuator. Chin. J. Eng. Des. 2022, 29, 384–393. [Google Scholar] [CrossRef]
  37. Yousefi, S.; Safdari, J.; Karimi-Sabet, J.; Norouzi, A. Prediction of the pressure, velocity and axial mass flux profiles within a high-speed rotating cylinder in total reflux condition via modified dsmcFoam solver. Bulg. Chem. Commun. 2020, 52, 467–480. [Google Scholar]
  38. Roberson, J.A.; Crowe, C.T. Engineering Fluid Mechanics; Springer: Berlin/Heidelberg, Germany, 1975; pp. 43–57. [Google Scholar]
  39. Dillmann, A.; Heller, G.; Schroder, W.; Klaas, M.; Kreplin, H.-P. New Results in Numerical and Experimental Fluid Mechanics; Springer: Berlin/Heidelberg, Germany, 2010; pp. 88–92. [Google Scholar]
  40. Schobeiri, M.T. Fluid Mechanics for Engineers—A Graduate Textbook; Springer: Berlin/Heidelberg, Germany, 2010; pp. 64–67. [Google Scholar]
Figure 1. Structure of the automatic vertical drilling tool.
Machines 11 00509 g001
Figure 2. Structure and working principle of the adjusting device.
Machines 11 00509 g002
Figure 3. The influencing factors of the adjusting device.
Machines 11 00509 g003
Figure 4. View of FE model and the process of the CFD simulation.
Machines 11 00509 g004
Figure 5. M(φ) and the movement position of both values under D1 = 15, L = 25, D2 = 35, SU = 360, and SL = 360. (a) shows the curve of M as a function of φ, and (b) illustrates the forces on both valves in different ranges of M(φ) and compares the sizes of SU and SL.
Machines 11 00509 g005
Figure 6. M(φ,N) and MN under D1 = 35, L = 35, D2 = 35, SU = 360, and SL = 360; (a) is the three-dimensional curves of M(φ,N) obtained by simulation and fitted; (b) is the view of MN.
Machines 11 00509 g006
Figure 7. M(φ) influenced by single variable.
Machines 11 00509 g007aMachines 11 00509 g007b
Figure 8. M influenced by SUmax and SLmax under φ = 0, D1 = 25, L = 15, and D2 = 15.
Machines 11 00509 g008
Figure 9. Photographs of MVDT prototypes and the adjusting device. The Chinese in the picture is the experimental site (Shandong Baohang Machinery Equipment Manufacturing Co., Weifang, China).
Machines 11 00509 g009
Figure 10. Experimental results of the MVDT prototypes are presented in Figure (a) showing the pushing force variation in various directions obtained from a set of experimental data. (b) displays the variation of φ obtained from the experiments performed on the MVDT prototypes under three different conditions.
Machines 11 00509 g010
Figure 11. The adjusting torque and the flow rate of the orifices, and the movement position of both values. (a) is before optimization under D1 = 15, L = 25, D2 = 35, SU = 360, and SL = 360; (b) is after optimization under D1 = 25, L = 15, D2 = 15, SU = 310, and SL = 180. (c) indicates the direction of the torques in the different ranges after optimization; (c) illustrates the optimized forces on both valves and the relative sizes of SU and SL in different ranges.
Machines 11 00509 g011
Figure 12. Comparison between the flow field chart in FE model before and after optimization under φ = 0 (values of factors under before optimization: D1 = 15, L = 25, D2 = 35, SU = 360, and SL = 360; after optimization: D1 = 25, L = 15, D2 = 15, SU = 310, and SL = 180). (a1,a2) each represent the streamline before and after optimization. (b1,b2) each represent the pressure cloud atlas before and after optimization.
Machines 11 00509 g012aMachines 11 00509 g012b
Table 1. The boundary conditions for the CFD simulation.
Boundary ConditionValue
External temperature (°C)20
Atmospheric pressure (Mpa)0
Mass flow inlet (kg/s)8
Pressure outlet (Mpa)0
Density (kg/m3)998.2
Dynamic viscosity (N·s/m2)0.001003
Table 2. Range of values for the influencing factors.
Influencing FactorsRange of Value
φ (°)−15~15
N (r/min)−120~120
D1 (mm)15~35
L (mm)15~35
D2 (mm)15~35
SUmax (mm2)180~360
SLmax (mm2)180~360
Table 3. Factor serial numbers under φ = 0.
yx
D1 (mm)L (mm)D2 (mm)
1151515
2252525
3353535
Table 4. Scheme of orthogonal experiment under φ = 0.
Number of
Experiments
yResult
x = D1x = Lx = D2M(x,y) (N-mm)
11119.5
2123−58.9
3132−71.1
42136.7
522213.3
623152.9
731219.1
832129
93335.4
Table 5. Range method results of orthogonal experiment under φ = 0.
xD1LD2
y123123123
K(x,y)−120.572.953.535.3−16.6−12.891.4−38.7−46.6
k(x,y)−40.224.317.811.8−5.5−4.330.5−12.9−15.6
R(x)64.517.346.1
Preferred value251515
Influence weightD1 > D2 > L
Table 6. Preferred values of SUmax and SLmax.
ParametersPreferred Values (mm2)
SUmax310
SLmax180
Disclaimer/Publisher’s Note: The statements, opinions and data contained in all publications are solely those of the individual author(s) and contributor(s) and not of MDPI and/or the editor(s). MDPI and/or the editor(s) disclaim responsibility for any injury to people or property resulting from any ideas, methods, instructions or products referred to in the content.