Article

Field Evaluation of Piezoelectric Energy Harvesters on Bridge Structure

1
Department of Civil and Environmental Engineering, School of Engineering, Rutgers, The State University of New Jersey, New Brunswick, NJ 08814, USA
2
Center for Advanced Infrastructure and Transportation, Rutgers, The State University of New Jersey, New Brunswick, NJ 08814, USA
3
Bureau of Research, New Jersey Department of Transportation, Trenton, NJ 08625, USA
*
Author to whom correspondence should be addressed.
Machines 2023, 11(4), 462; https://doi.org/10.3390/machines11040462
Submission received: 23 March 2023 / Revised: 3 April 2023 / Accepted: 3 April 2023 / Published: 7 April 2023
(This article belongs to the Special Issue Applications of Piezoelectric Devices and Materials)

Abstract

:
This study aims to develop and evaluate vibration-based piezoelectric energy harvesters for generating power from a bridge structure. New designs of multiple-degree-of-freedom (DOF) cantilevers were proposed and evaluated in a laboratory and on a full-scale bridge. It was found that all cantilever designs showed potential of generating 35 V voltage outputs under a simple sinusoidal vibration scenario in the laboratory. Field testing results showed that the match between the vibration frequencies of bridge structure and the resonant frequencies of cantilevers significantly affected the voltage output from the piezoelectric energy harvester under moving tire loads. Through adding more DOF on the same cantilever, the voltage attenuation from peaks generated by the cantilever turned to be less significant after each load passing, leading to greater energy outputs in some cases. With adjusting the mass combination in the 3-DOF cantilever design, the voltage output and energy production reached 11.1 V and 58.2 μJ under one single loading pulse, respectively, which was higher than 9.2 V and 14.9 μJ obtained from the best scenario of 1-DOF cantilevers. The study findings indicate the potential of developing multi-band piezoelectric energy harvesters for harvesting energy from bridge vibrations.

1. Introduction

The method of harvesting energy from traffic loads on roadways and bridges relying on piezoelectric materials has been widely developed in recent years, coming up with different customized transducer designs [1]. Among all piezoelectric-based energy harvester designs, most of them developed by current studies were activated under compression loading. Different techniques have been used to amplify power outputs to a level of 0.1–10 W, such as transferring displacements from the vertical to the horizontal direction [2,3,4], bending beams in different directions [5,6], stacking multiple piezoelectric units in a series connection [7,8], or adding magnetic interactions [9]. However, compression-based energy harvesters require large structure pavement deformation to generating significant high-power output, which is usually achieved by embedment in roadway pavements subject to traffic loading [10]. There exists the conflict between considerable power outputs from energy harvesters and the integrity of roadway pavement [11].
Instead of utilizing vertical loads directly from vehicles on compression-based energy harvesters, an alternative piezoelectric-based energy harvesting design is collecting kinetic energy from vibrating structures. Vibration-based energy harvesters have minimal impacts against the host structures due to no required embedded installation [7,12]. Many researchers have developed piezoelectric cantilevers for energy harvesting from transportation infrastructure vibrations, either on the roadside [13] or under bridges [14,15,16,17,18]. Compared to roadside application, bridges can be better candidates for generating electric power via vibrations, given the multiple acceleration peaks with higher amplitudes created by multiple vibration modes [14,19].
The current designs of vibration-based energy harvesters on bridges are mainly built as single-beam cantilevers attached with flexible piezoelectric elements (e.g., macro-fiber composites). Instead of generating electricity from a bulk piezoelectric element under compressive deformation, a vibration-based energy harvester produces electricity through bending, which is particularly designed for overcoming the brittleness issue from traditional piezoelectric materials. Based on the laboratory testing results from previous studies, the power outputs from single-degree-of-freedom (DOF) cantilevers were found consistently at a level of 10 μW [16,17,20], which were further varied depending on loading frequencies, acceleration, piezoelectric element designs and arrangements, and external resistances. Such a power output level from vibration-based energy harvesters shall be sufficient to operate low-power electronic sensors or wireless data transfer, which require less than 10 µJ per each node operation [21,22]. Peigney and Siegert (2013) conducted a series of field tests on a single-beam cantilever installed on a prestressed concrete highway bridge [15]. The power output was estimated by the time duration required to fully charge an energy harvesting board. As a result, fully charging the EH300 took 210 s, corresponding to an average power of 0.024 mW. Tong et al. (2017) conducted a preliminary study of using a single-beam cantilever as a wireless sensor for bridge health monitoring purposes [23]. The cantilever worked as a self-powered sensor to create a voltage signal under bridge vibrations and wirelessly transmit the signal via a gateway system that was assembled with communication modules and (temperature and humidity) sensor interfaces.
Due to the complication and the uncertainty of vibration modes encountered in the field, single-beam cantilevers may not fully utilize bridge vibrations for the purpose of energy harvesting since their single resonant frequencies can only match one of the vibrational frequencies on bridges. A similar challenge happens in other application fields, such as the field of acoustical engineering: most sounds have multiple vibrational frequencies, and the energy can only partially be collected by a single-DOF cantilever. To overcome the challenge of piezoelectric energy harvesting from low-frequency vibration sources in an ambient environment, broadband energy harvesters have been developed with multiple bimorphs in different lengths or tip masses [24,25,26] or a 2-DOF system with dual mass configurations [27]. However, the application of these new concepts of vibration energy harvesters on real civil infrastructure, such as bridges, has not been studied.
To further evaluate broadband energy harvesters for bridge application, this study proposed multiple-DOF cantilever designs for energy harvesting from bridge vibrations and investigated their performance using laboratory testing and a field evaluation. The unique contributions are the innovative design of a 3-DOF cantilever and field tests on a full-scale bridge under dynamic wheel loads. Given that the voltage output from each cantilever was not only determined by the cantilever itself but also decided by its match with specific bridge acceleration features, the vibration features of each cantilever and the host bridge structure were, respectively, measured in the laboratory and the field. The energy harvesting performances from these three cantilever designs were then tested under a full-scale bridge with dynamic loads. After collecting the resonant frequencies of each cantilever and the vibration frequencies of the full-scale bridge, the connection between frequency match and the final voltage/energy output was analyzed. Based on the comparison of energy harvesting performance from different cantilever designs, the optimization strategy on the purpose of maximizing power output under a complex bridge vibration scenario was proposed in this study.

2. Piezoelectric-Based Cantilevers for Bridge Vibration Conditions

2.1. Vibration Features of a Bridge

The vibration features of roadways and bridges are quite different due to their different structural features. For common roadways with asphalt pavements, the level of accelerations ranges from 0.001 to 0.1 g, which is decided by pavement structure, distance from wheel patch, and vehicular load [28]. Compared to roadways, bridges have more features that can lead to multiple vibration modes, such as bridge types, dimensions (especially bridge span), sensor install locations, and traffic loadings (speed and vehicular loads). Take a ladder-deck composite bridge, for example. It has several vibration modes, such as bending modes, torsional modes, and transversal vibrating modes. Due to different trigger factors, those vibration modes have various vibration frequencies ranging from less than 5 Hz to more than 10 Hz. Compared to that of a roadway, bridge acceleration is overall higher, at a level of 0.1–1 g in general [14,29]. Given more stable vibration frequencies (insensitive to traffic conditions) and high accelerations in a fixed bridge structure, vibration-based energy harvesters can be preferred over compression-based energy harvesters for bridge applications.

2.2. Cantilever Design Options

Cantilevers are made to match their resonant frequencies with the vibration frequencies of the host structure by adjusting the cantilever dimensions or the mass combination. Considering the potential advantages of a cantilever with different degrees of freedom (DOF), three cantilever designs were fabricated and tested in this study, including the 1-DOF, 2-DOF, and 3-DOF cantilevers. The 1-DOF cantilever was the most widely used and tested in previous studies. As further revised versions, the 2-DOF and 3-DOF cantilever designs were fabricated using laser-cutting techniques by creating more internal beams and allowing to set more masses. Those internal beams with attached masses made the cantilevers acquire more degrees of freedom with more resonant frequencies, aiming to better match the real multiple vibration frequencies in the field. Figure 1 shows the pictures of three cantilevers. One hole was drilled at one end of the cantilever and used to fix the cantilever between the sensor and the shaker through a bolt in the laboratory. MFC1, MFC2, and MFC3 were designated as the one close to the hole, the one in the middle, and the one close to the mass tip on the main beam, respectively.
The baseline of outline dimensions for all three cantilever designs was 170 × 70 × 1 mm3, and the baseline of Mass 1 (the mass tip on the main beam) was 10 g. Mass 2 on 2-DOF and 3-DOF cantilevers was 21 g, while Mass 3 on the 3-DOF cantilever was 32 g. To test the cantilevers with more design parameters, the cantilevers in two extra outline dimensions with different scales (1.1, 1.2) were further fabricated and tested. A series of mass combinations was also individually added onto the cantilevers to acquire more different resonant frequencies. The total number of mass combinations included 3 × 3 mass options for 2-DOF cantilevers and 3 × 3 × 1 mass options for 3-DOF cantilevers. The cantilevers with specific design parameters are summarized in Table 1.
The piezoelectric elements attached on the cantilevers were macro-fiber composites (MFCs) M2814-P2. They were flexible with a high d31 constant (2.1E + 02 pC/N). The size of each M2814-P2 was 28 × 14 mm2. The electrodes on each MFC were connected with wires via conductive epoxy adhesives. To minimize energy loss from the interface between the MFCs and the cantilevers, cyanoacrylate super glue was used as the bonding method. Meanwhile, to conveniently change different masses on the cantilevers, rubber adhesive double-sided tape was used to stick masses onto the cantilevers. For the purpose of consistently comparing the performance of different cantilevers, all three cantilever designs were attached by three MFCs at the same locations.

3. Experimental Program

3.1. Laboratory Tests

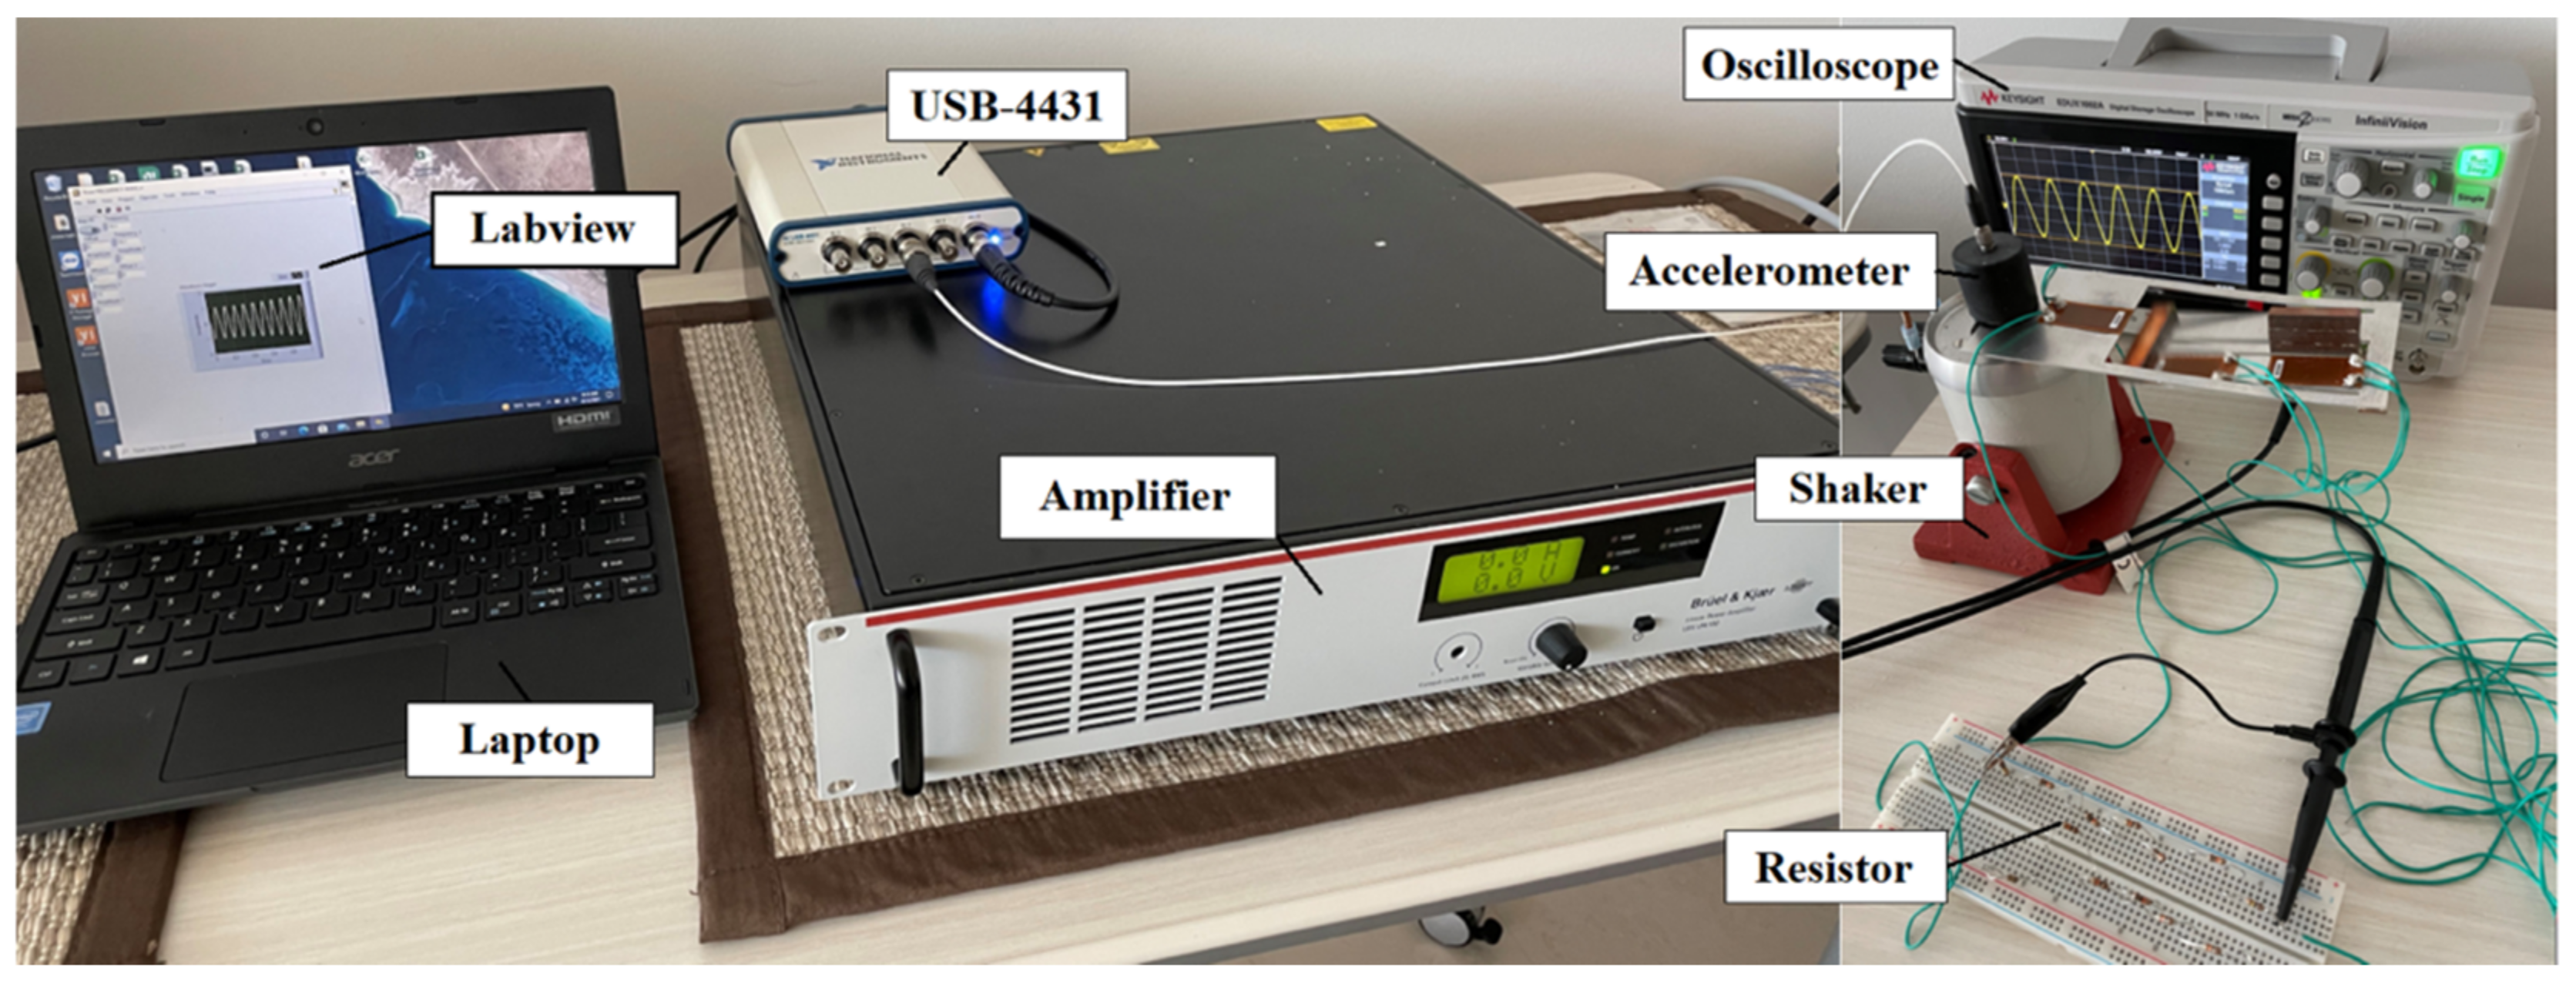
In the laboratory, this study built a shaking system consisting of a permanent magnet shaker, (LDS V201, Brüel and Kjær), an amplifier (LDS LPA100, Brüel and Kjær), a data acquisition system (USB-4431, National Instruments, Austin, USA), an integrated circuit-piezoelectric accelerometer (393B05, PCB Piezotronics, Depew, NY, USA) and a laptop (TravelMate B, Acer, Taipei, Taiwan). The integrated circuit-piezoelectric accelerometer was mounted on the top of the shaker to measure the acceleration of the shaker for controlling purposes. The voltage signal to run the shaking system was generated via one laptop connected to the data acquisition system. Specifically, the signal was first customized via the Labview program with setting frequencies and amplitudes in the laptop. The well-defined signal was then transmitted into one input channel of the USB-4431 to generate a low-voltage output signal and further be amplified by LDS LPA100 to operate the LDS V201 shaker. The USB-4431 was also used to collect the acceleration information from the 393B05 accelerometer via its one input channel. On the other side, the voltage output generated by the piezoelectric patch on the cantilever was measured and recorded by an EDUX1002A oscilloscope with a sampling rate of 1 GSa/s. The entire laboratory setup is shown in Figure 2.
All cantilevers in different designs listed in Table 1 were tested under this laboratory setup. The vibrational signal created in the shaker was in a sinusoidal form. Its acceleration amplitude was controlled as 0.4 g at a low-frequency level, and the range of vibrational frequencies varied from 1 to 25 Hz with a 0.1 Hz interval. As outputs, the peak-to-peak voltage outputs and the corresponding resonant frequencies from cantilevers having different design parameters were captured. Those that measured information from cantilevers were further combined with the bridge vibration patterns measured in the field to better analyze and explain the field performance of cantilevers under full-scale bridge tests.

3.2. Full-Scale Bridge Tests

Full-scale evaluation of energy harvesters was conducted using the Bridge Evaluation and Accelerated Structural Testing System (BEAST) in this study, located on the campus of Rutgers University in New Jersey. The BEAST is designed to evaluate bridge deck performance deration under realistic environmental, live load, and maintenance-related influences. The full-scale bridge includes a four-girder, a composite steel stringer with an 8-inch concrete deck. and the test span was 50 feet long by 28 feet wide. Traffic loading could be applied through a tandem axle group in the range of 20 to 60 kips and up to 20 mph.
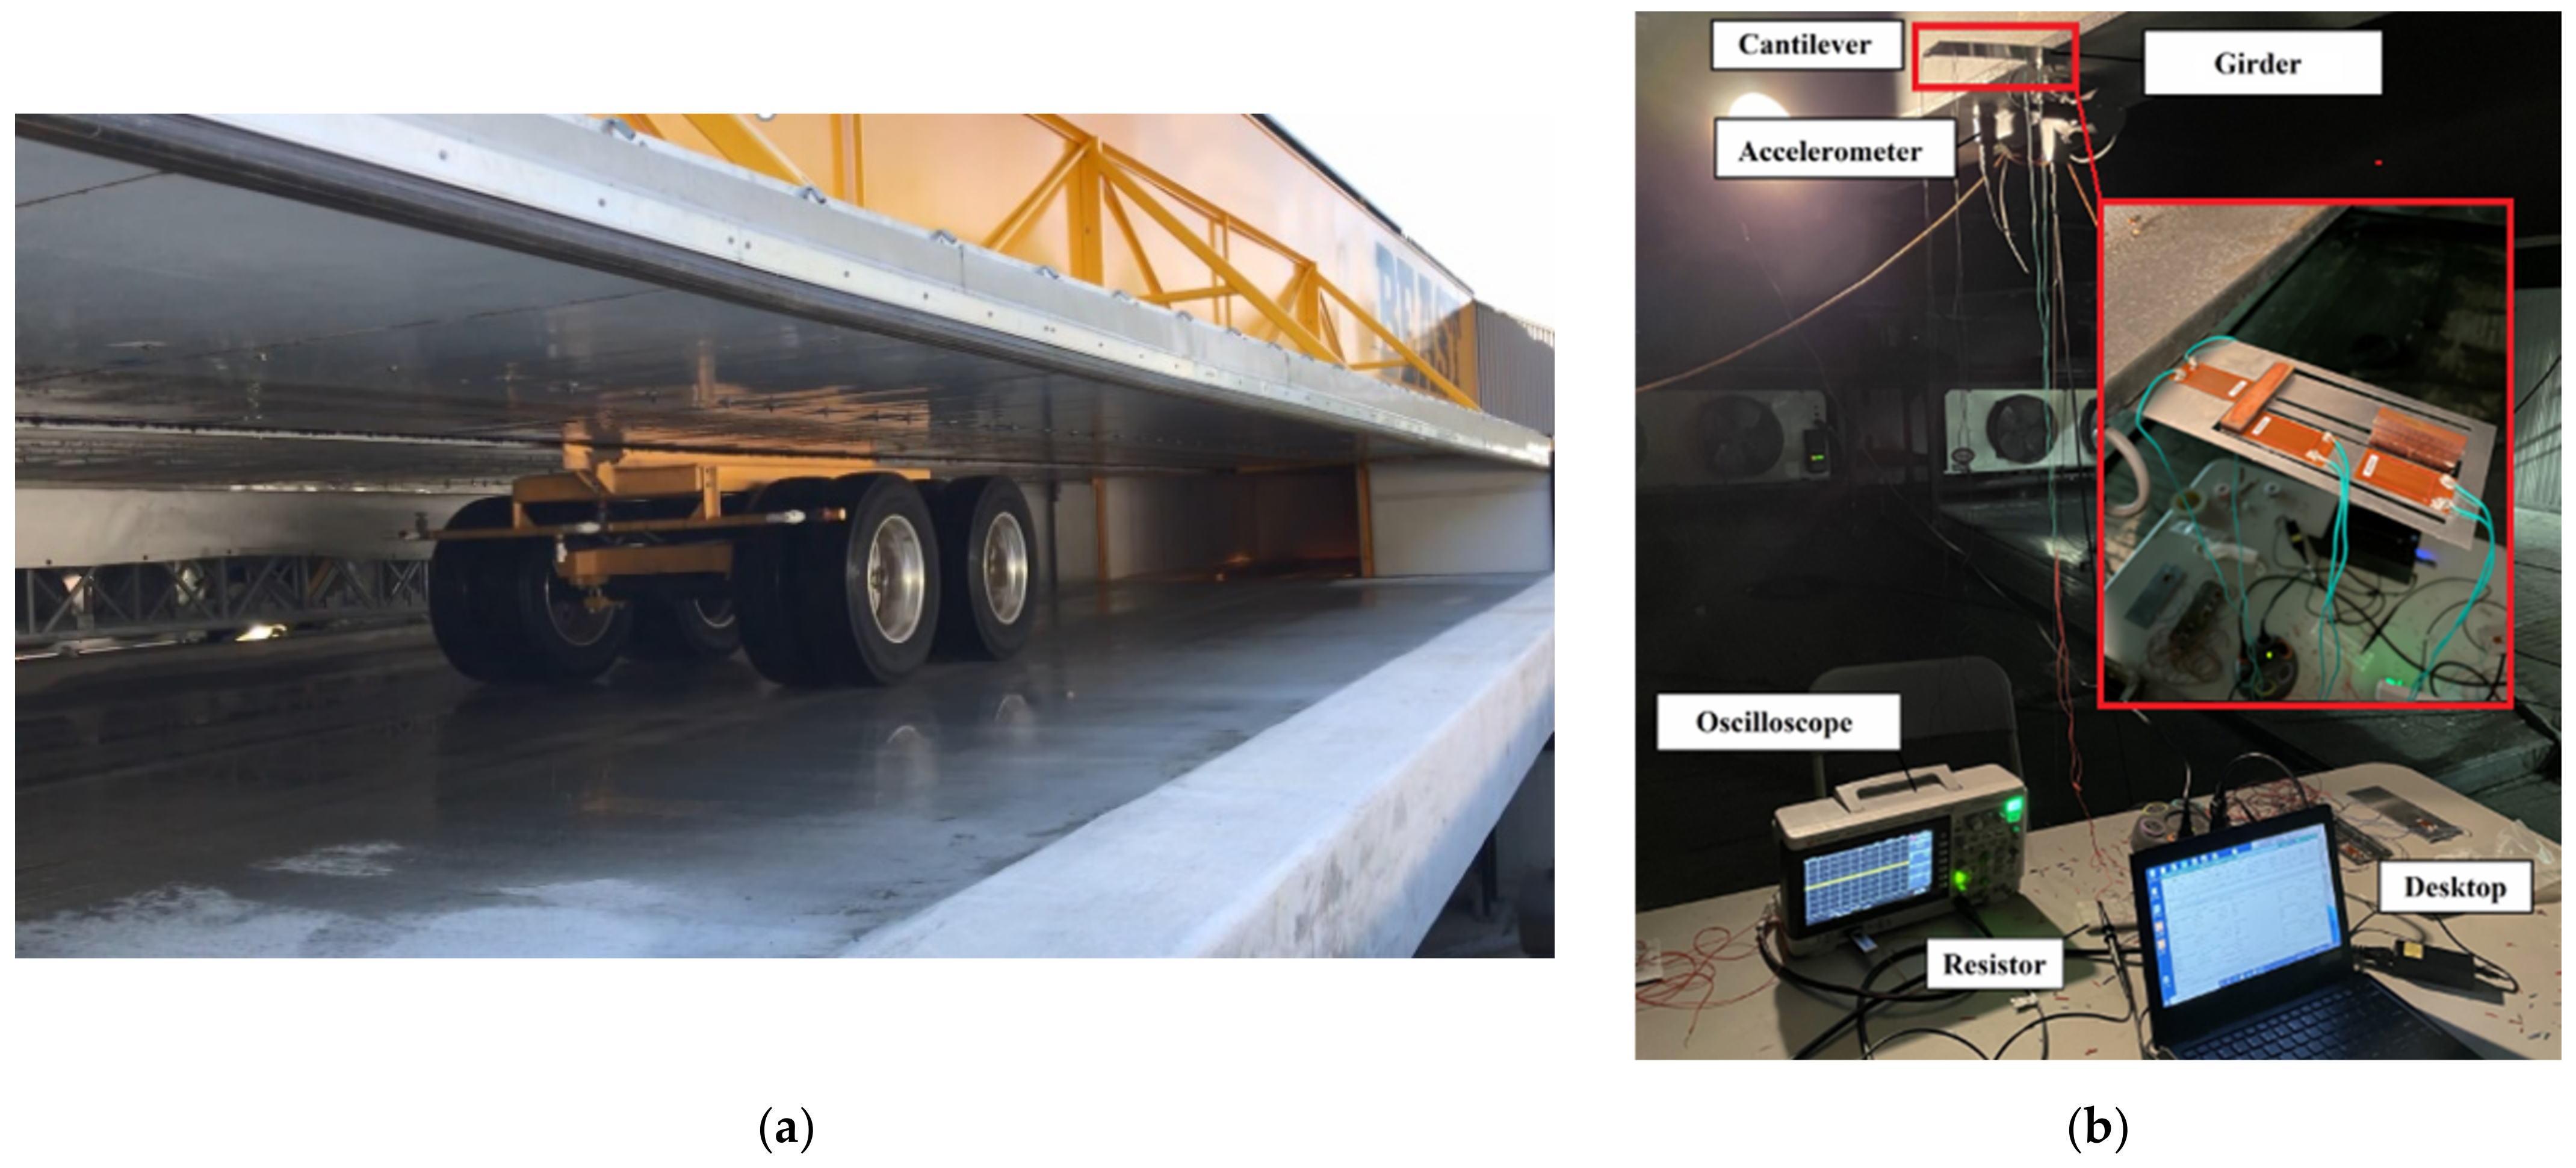
Figure 3 shows the tandem axle loading on the bridge deck and the energy harvesting system with cantilevers attached on the steel girder. The cantilevers were fixed on the girder by a strong magnet. The corresponding accelerations on testing locations were simultaneously measured by an accelerometer. The peak-to-peak voltage outputs from MFCs were captured by an oscilloscope. The total energy created under each loading impact was estimated and used the key indicator for evaluating energy harvesting performance.
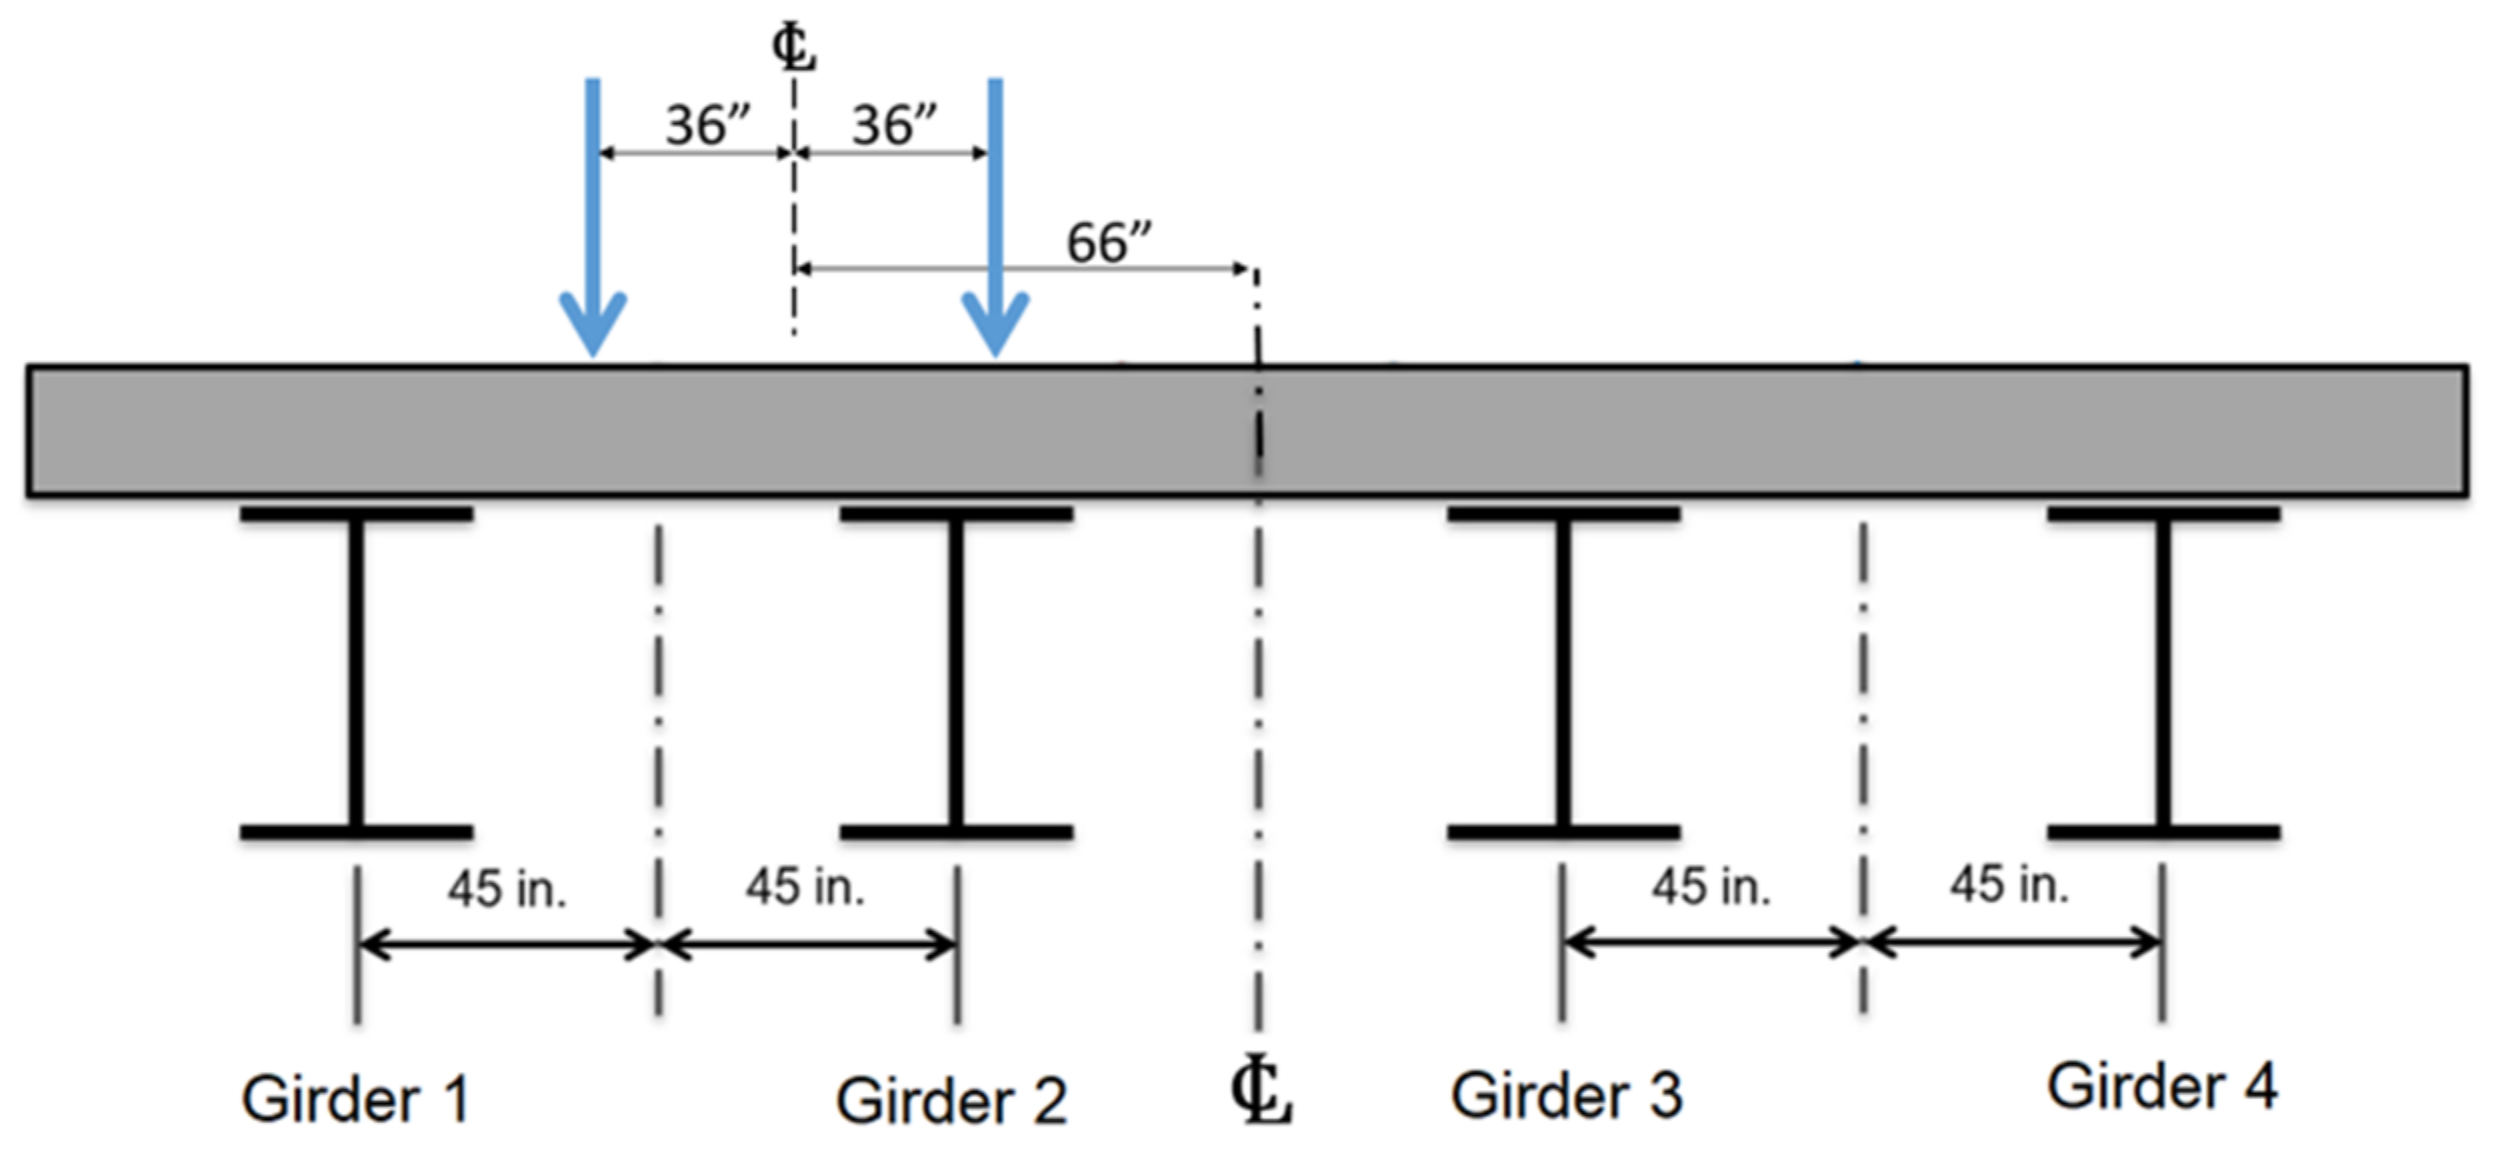
To simulate the real bridge vibration conditions, this study applied a dynamic load of 60 kips moving over a concrete bridge deck supported by steel girders in the BEAST. The specific location of moving load was on the side of Girder 1 and Girder 2, as displayed in Figure 4. For the testing parameters selected in this study, two loading speeds were used, including 6 mph and 12 mph; and three installation locations were selected during the field tests, including 1/2 span of Girder 1 and 1/2 and 1/4 spans of Girder 2.

3.3. Energy Calculation

Considering the power outputs from cantilevers under moving traffic loads were in a pulse form rather than in a sinusoidal form, the power outputs were dynamic and varied by specific time periods. Instantaneous power outputs at peak voltage outputs can be an acceptable indicator, but do not reflect the total collectable and usable energy from the cantilevers. Therefore, the total energy generated over each loading cycle (two pulses) was calculated for evaluating the energy harvesting ability of MFCs on the cantilever, as shown in Equation (1).
E r = t 0 t 0 + T V o u t 2 R e x t e r n a l d t
where t0 is the starting time; T is the time duration of voltage signal collection; Rexternal is the external resistor; Vout is the recorded voltage output signal; and dt is the time sampling interval.

4. Laboratory Test Results of Piezoelectric Cantilevers

4.1. Voltage Outputs and Resonant Frequencies of Different Cantilevers

Prior to testing multiple cantilevers in different dimensions in a full-scale under-a-bridge model, the voltage outputs from different cantilevers were measured in the laboratory for capturing their potential voltage outputs and the corresponding resonant frequencies. Combining with the acceleration information collected in the field, the laboratory results were further used to compare and explain the performances of different cantilevers under specific vibrational conditions created in the full-scale bridge.
Based on laboratory test results, the peak-to-peak voltage outputs with the corresponding resonant frequencies from MFCs on different cantilevers are summarized through Table 2, Table 3 and Table 4, respectively, for 1-DOF, 2-DOF, and 3-DOF cantilevers. The sizes of scale 1 for all three cantilever designs were in a consistent outline dimension of 170 × 70 × 1 mm3, regarded as baselines in this study. For those baseline cantilevers, the mass tips on all main beams were consistently 10 g, while the mass tips on the second beams (of 2-DOF and 3-DOF cantilevers) and the one on the third beam (of 3-DOF cantilever) were, respectively, 21 g and 32 g. Each cantilever was also attached by three MFCs at the same locations on the cantilever. The peak-to-peak voltage outputs from MFCs were measured under an external resistance of 250 kΩ.
As can be seen from Table 2, the MFCs on the 1-DOF cantilever had only one resonant frequency (at 16.5 Hz), while the MFCs on the 2-DOF and 3-DOF cantilevers had two resonant frequencies (at 11 Hz and 12 Hz) and three resonant frequencies (at 7.1 Hz, 11.4 Hz, and 21.3 Hz), respectively. For voltage peaks captured from these baseline cantilever designs, MFCs on the 1-DOF cantilever generated higher voltage outputs as they were located closer to the support end, while MFCs on the 3-DOF cantilever generated individual peak voltage outputs under corresponding resonant frequencies. This finding reflects that only with the 3-DOF cantilever design all three MFCs made their own significant contributions on energy harvesting under three different vibrational modes. Moreover, a maximum voltage output of 42.2 V was generated from MFC3 on the 3-DOF cantilever, which was higher than the one of 38.2 V from the 1-DOF cantilever, indicating the potential of power outputs from the 3-DOF cantilever higher than those from the 1-DOF cantilever in the same outline dimension.
As the outline dimension of cantilevers was increased as shown in Table 2, the resonant frequencies of each MFC were consistently dropped, while the corresponding voltage outputs were not proportionally increased in most cases (except the MFC1s on 1-DOF and 2-DOF cantilevers). Compared to 2-DOF and 3-DOF cantilevers, the 1-DOF cantilever showed higher sensitivity of voltage changes due to the outline dimension adjustment, which reflected that the proportional change of cantilever size was more efficient for the 1-DOF cantilever than the other two cantilever designs.
Compared to the outline dimension, the mass combination more efficiently adjusted the resonant frequencies of specific vibration modes in the 2-DOF and 3-DOF cantilevers, as shown in Table 3 and Table 4. Moreover, relying on multiple vibration modes, 3-DOF cantilevers showed a wide range of resonant frequencies, covering from 6 to 30 Hz, which had the potential to match the vibrational frequency range from the real bridge structure.

4.2. Optimal Resistive Loads

For evaluating the maximum potential power outputs from the MFCs, the optimal resistive load shall be pre-determined prior to performing any further power output measurements. In theory, the optimal resistive load, Ro, shall be equal to the internal resistance of the piezoelectric element itself for acquiring the maximum power output. Given that each piezoelectric element can be treated as a capacitor, its internal resistance equals to its impedance under an alternating current circuit, which can be calculated in Equation (2).
Z = 1 2 π f C
where Z is the impedance of the piezoelectric element; C represents the capacitance of the piezoelectric element; and f represents the operating vibrational frequency.
The capacitance of MFC used was given by the manufacturer as 43 nF. The major vibrational frequencies observed in bridge vibrations were in the range between 15 and 30 Hz. Based on Equation (2), the optimal resistive load was expected to be in the range of 140 to 280 kΩ. To verify those optimal resistive load selections, the power outputs from one MFC on the 1-DOF cantilever were calculated under a range of resistive loads from 50 to 1000 kΩ in the laboratory. The experimental results are shown in Figure 5. As can be seen from Figure 5, the measured optimal resistive loads under 15 Hz and 30 Hz vibrational frequencies were, respectively, at 280 kΩ and 140 kΩ, which matched the estimation results from Equation (2). Moreover, due to the resonant frequency of that 1-DOF cantilever being close to 16.5 Hz, the maximum power output from the MFC under 15 Hz was much higher than the one under 30 Hz (1.12 mW versus 0.08 mW). Given that multiple vibration frequencies were possibly observed in the bridge experienced in the field, the power outputs under both 280 kΩ and 140 kΩ of resistive loads were measured in full-scale tests for comparison purposes to select the proper one for real application.

5. Accelerations and Voltage Outputs on a Full-Scale Bridge

5.1. Accelerations Measured at Test Locations of a Bridge

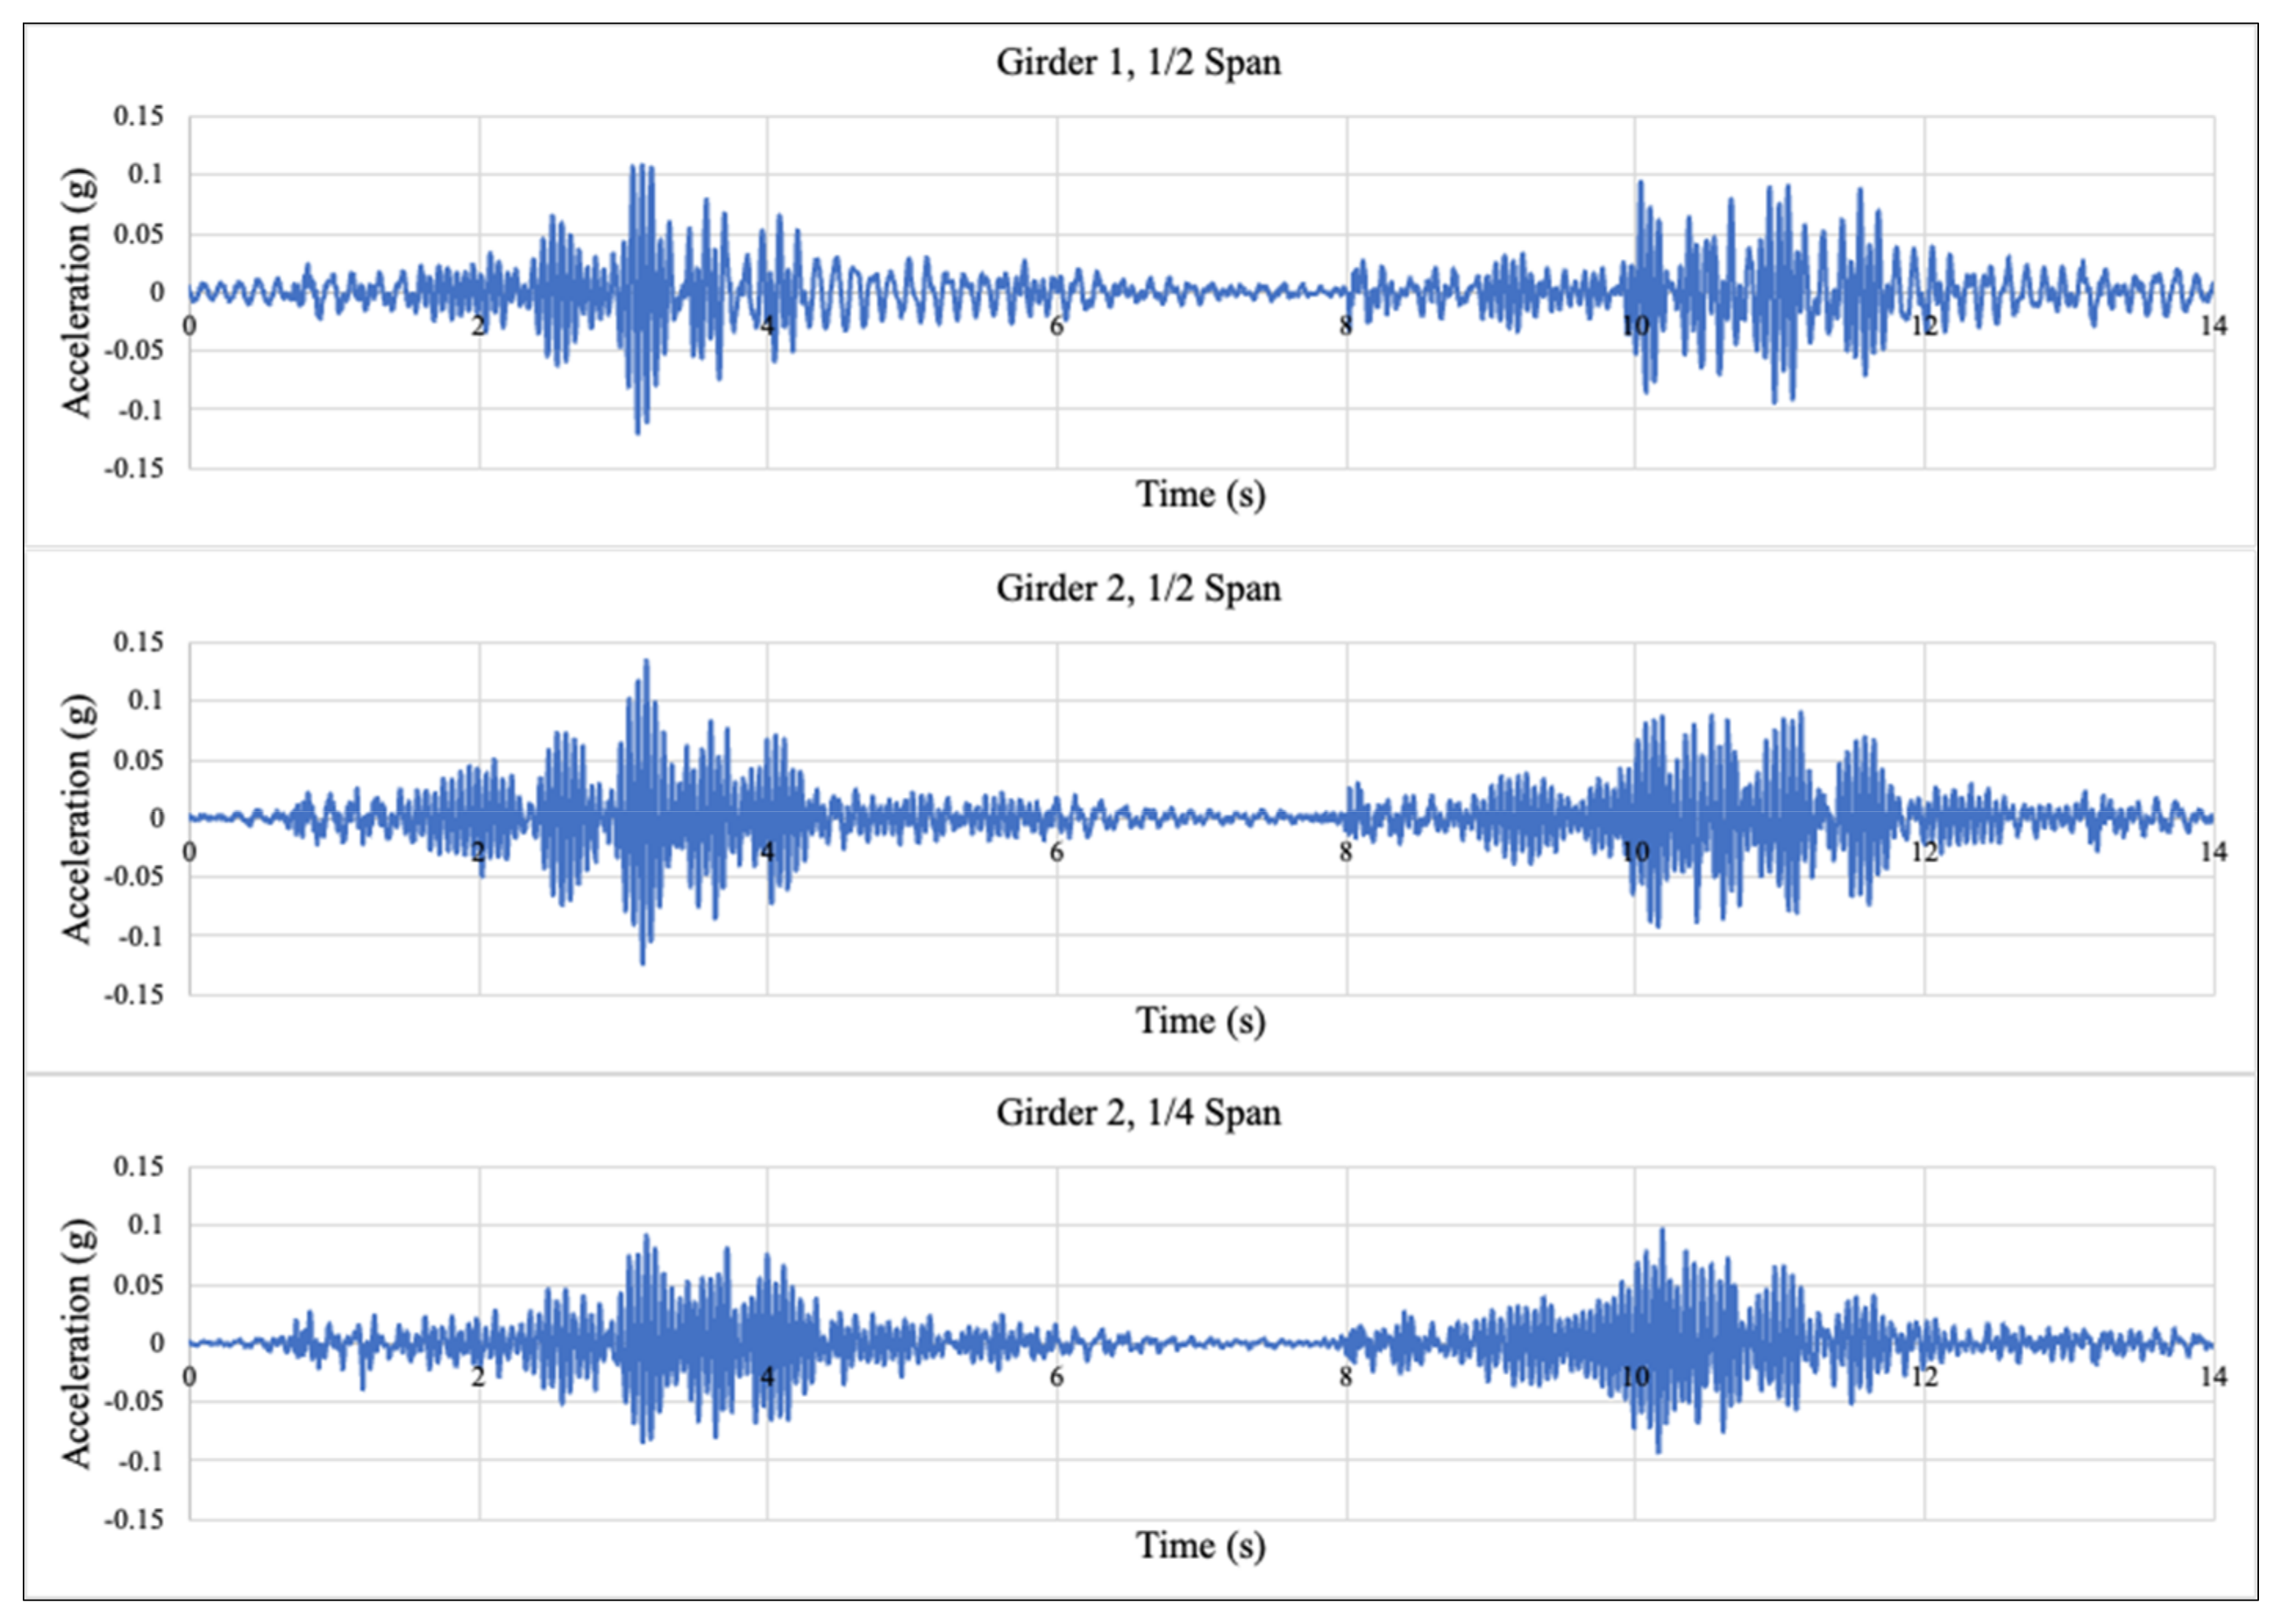
As one key group of outputs from field tests, the acceleration signals in time domain on three different locations (½ span of girder 1; ½ and ¼ span of girder 2) in the BEAST were collected under two loading speeds (12 mph and 6 mph). The measured results under one round pass of moving loading are shown in Figure 6 and Figure 7. As can be seen, an average of 0.1 g peak acceleration was observed over those three locations, while higher loading speed caused greater peak acceleration in general. An interaction between loading speeds and locations on the acceleration signals was also found: under the loading speed of 12 mph, the highest acceleration of 0.2 g was captured on ½ span of girder 1, followed by a 0.15 g acceleration on ½ span of girder 2 and a 0.1 g acceleration on ¼ span of girder 2; however, once the loading speed was slowed to 6 mph, the accelerations over these three locations decreased to 0.1 g.
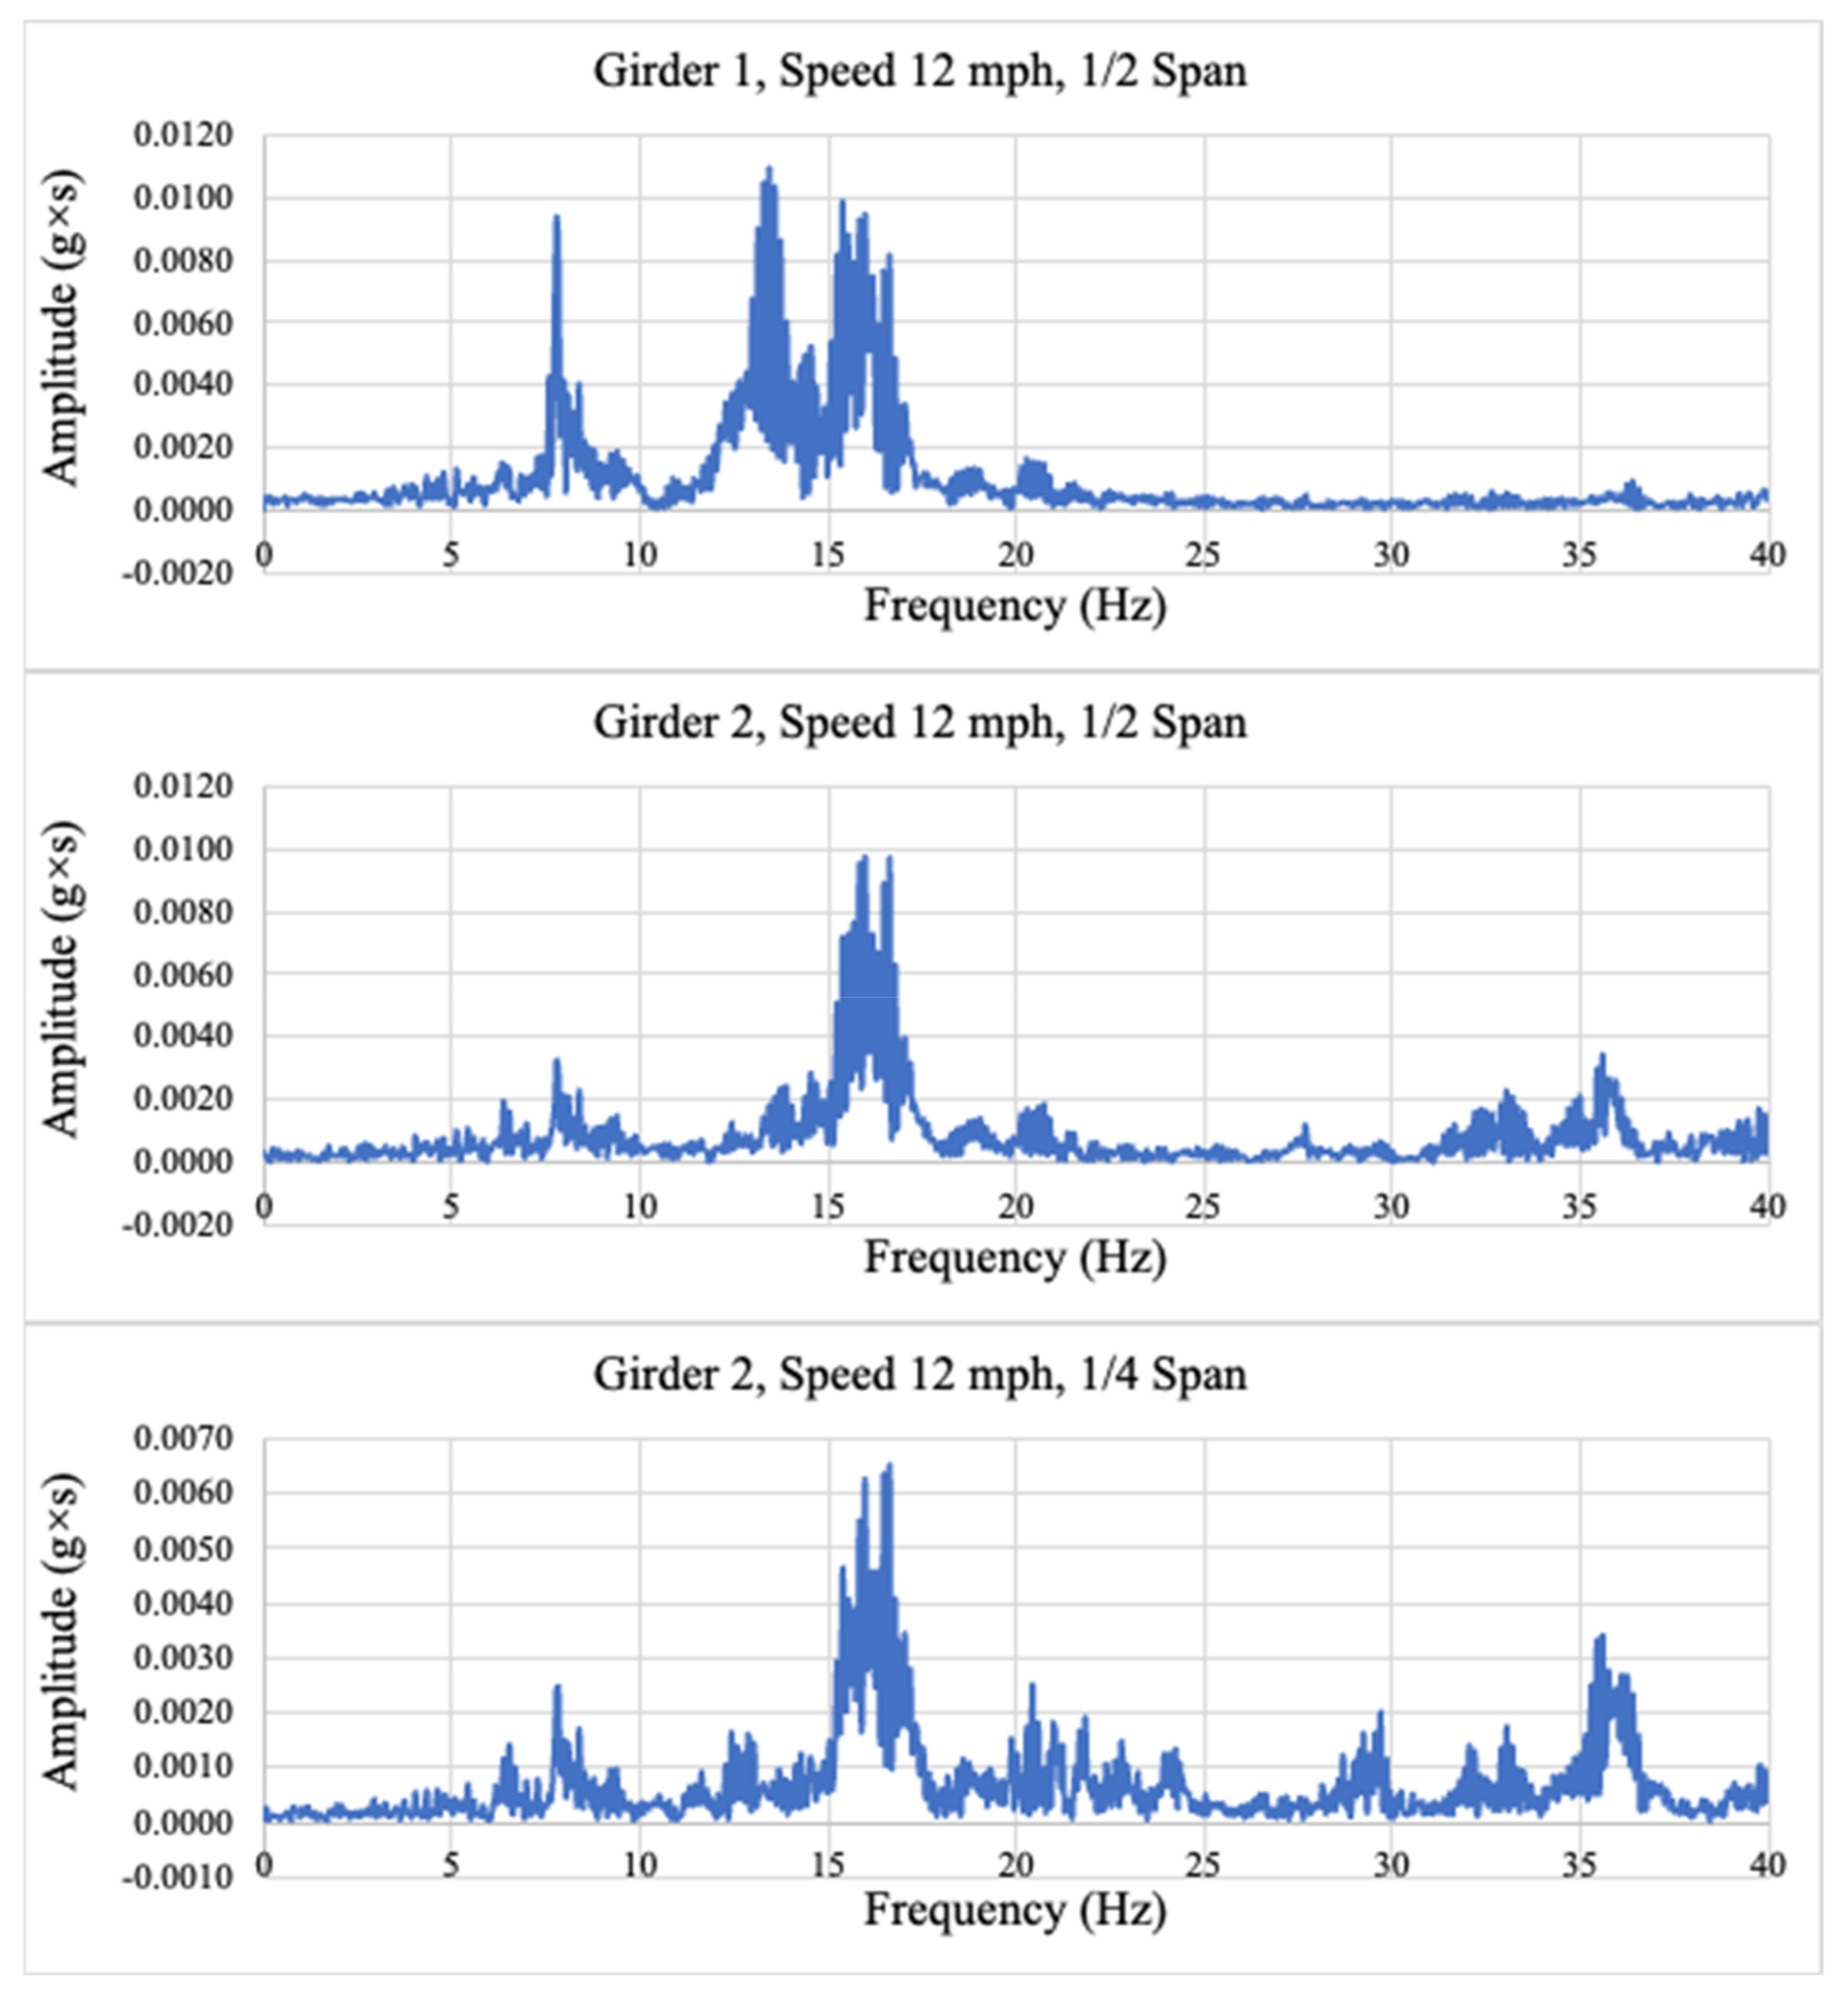
For better observation of the detailed signal components (peak accelerations and corresponding frequencies), the acceleration signals at two different speeds in the frequency domain were further obtained by Fourier transform, as shown in Figure 8 and Figure 9. As can be seen, three significant acceleration peaks were observed on ½ span of girder 1, which were 7.8 Hz, 13.6 Hz, and 16 Hz at 12 mph and 7.8 Hz, 16 Hz, and 18 Hz at 6 mph. For the acceleration peaks observed on girder 2, an acceleration peak at 16 Hz was consistently observed under all scenarios, while another acceleration peak was close to 16.5 Hz at 12 mph and 18 Hz at 6 mph. As the loading speed was increased from 6 mph to 12 mph, the frequency of one vibration mode was sensitively changed from 18 Hz to 16.5 Hz for girder 2 and from 18 Hz to 13.6 Hz for girder 1. The acceleration peaks at different frequencies show that a resonant frequency at 16 Hz can be a general one for the entire BEAST structure since it was consistently captured under any vibration scenarios.

5.2. Voltage Outputs from Different Cantilevers

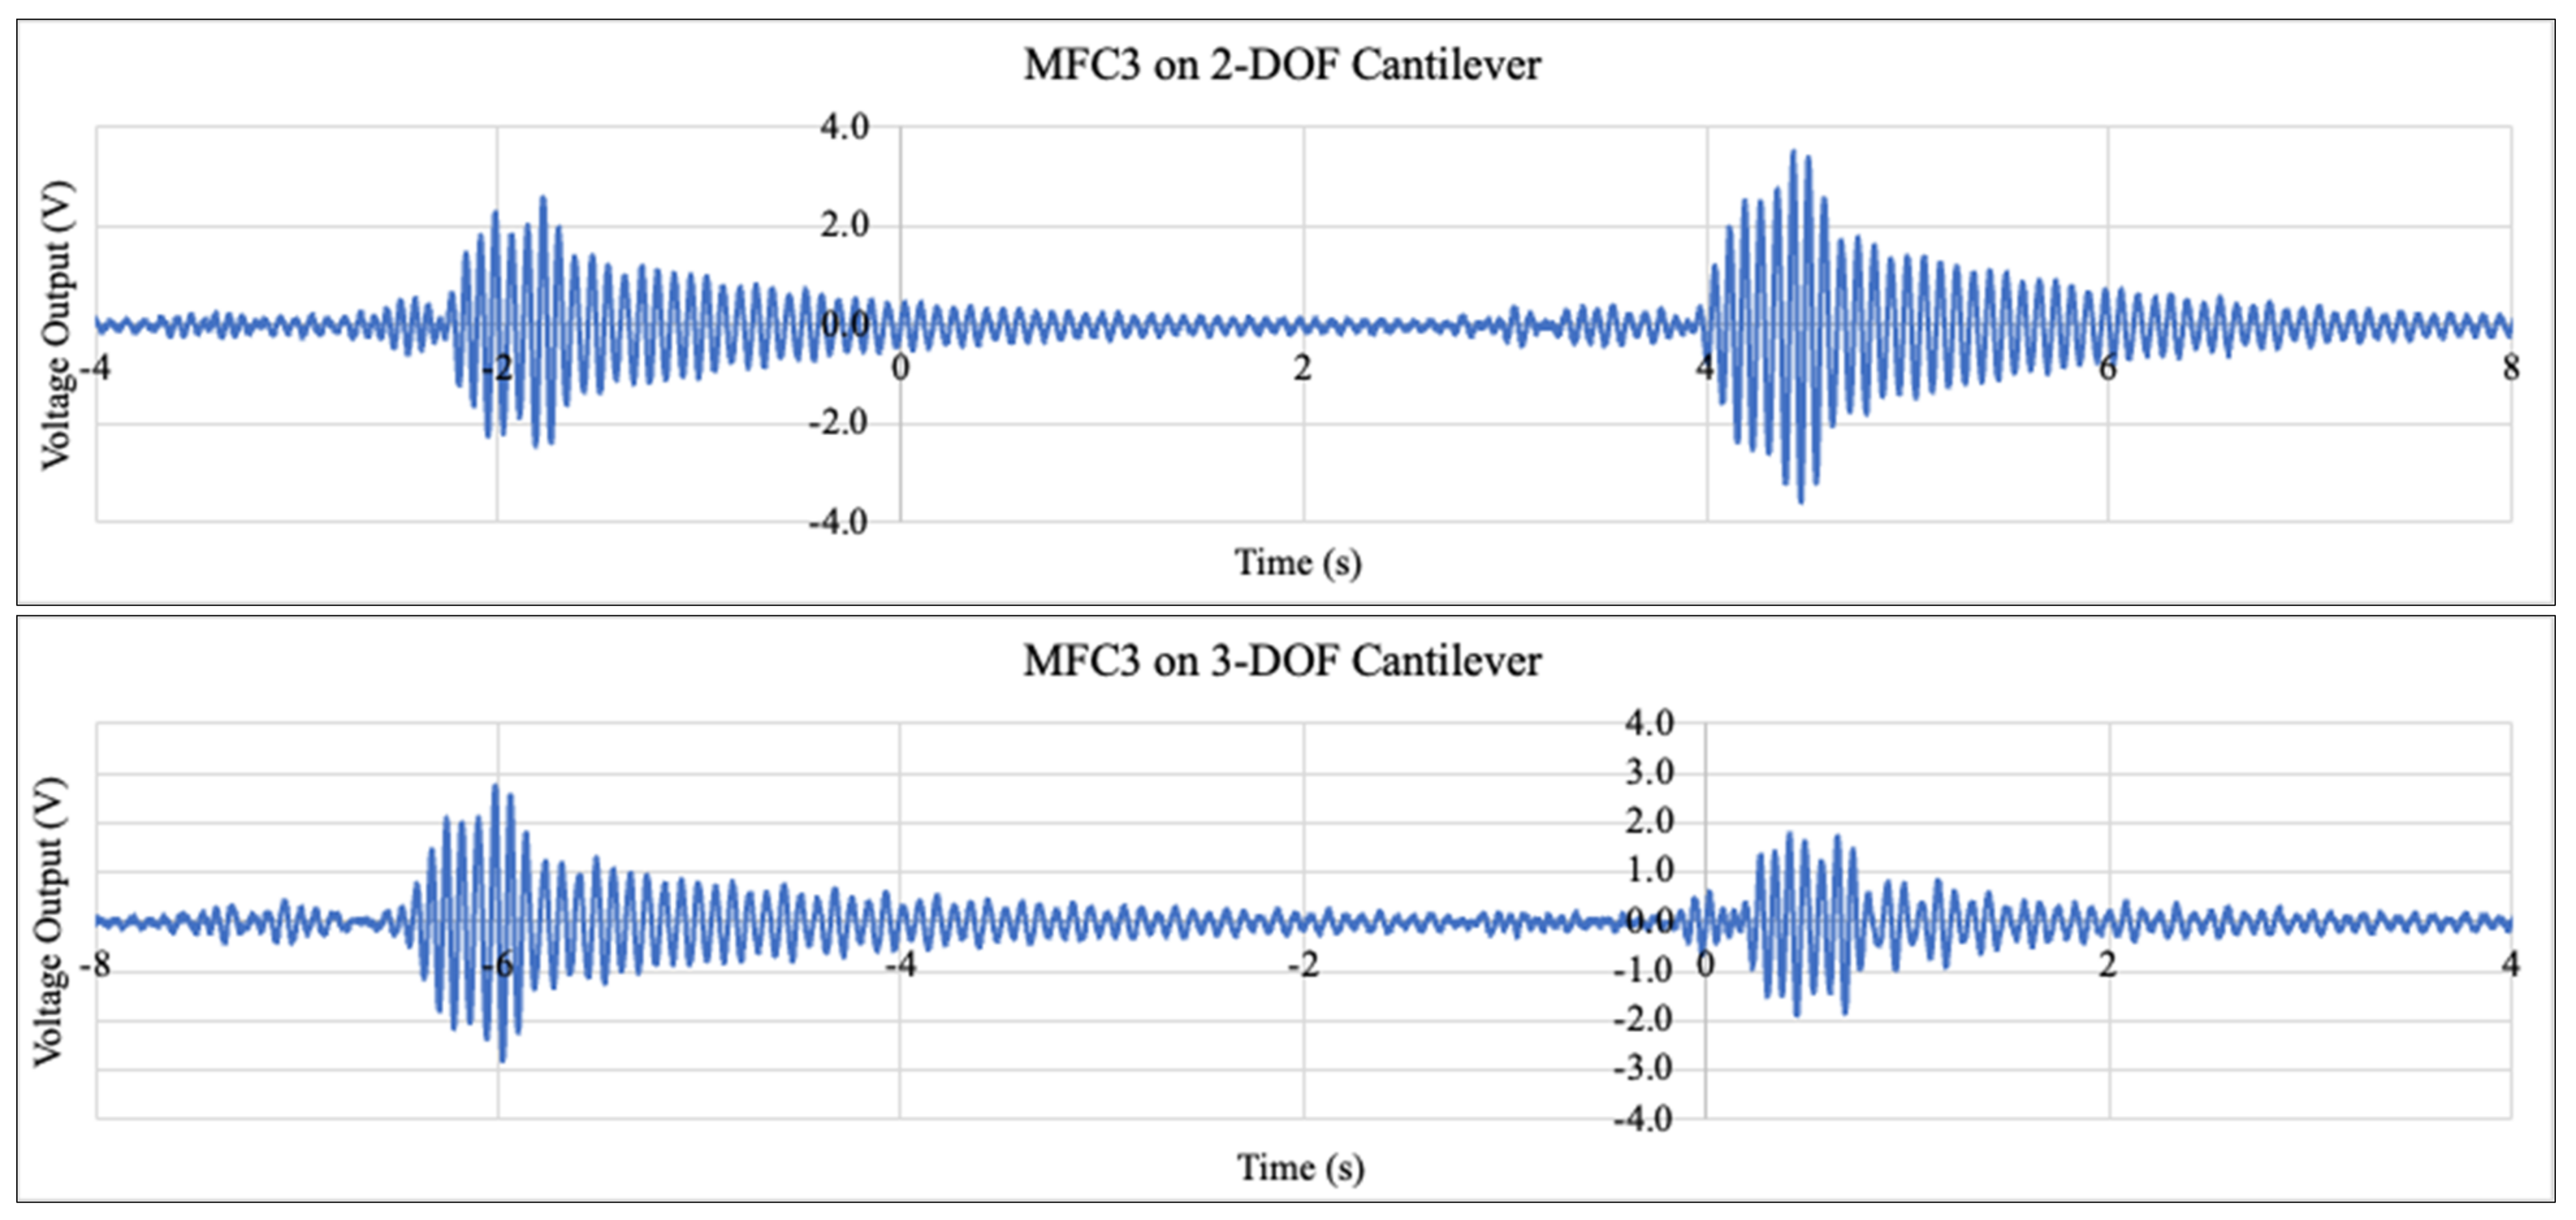
The voltage outputs from each MFC on each cantilever design under dynamic loads in the BEAST were recorded by an oscilloscope within a 20 s time period. Figure 10 displays examples of voltage output signals received from MFCs on 1/2 span of girder 1 at 12 mph. As can be seen, once the DOF of the cantilever was changed from single one to multiple ones, not only the magnitudes of voltage outputs but also the signal forms were changed. For the 1-DOF cantilever, although the peak voltage output was higher than those from the 2-DOF and 3-DOF cantilevers, the voltage output decreased sharply from its peak within 1–2 s. For the 2-DOF and 3-DOF cantilevers, even with the lower peak voltage outputs than that from the 1-DOF cantilever, their voltage peaks were attenuated more gradually, mainly due to the simultaneous vibrations from multiple beams under multiple-frequency vibrations of the bridge girder.
Such different signal forms from the cantilevers with different DOF indicated that the peak voltage or power output may not be the best indicators for evaluating energy harvesting performance of cantilevers, especially considering that the pulse under real traffic loading varies in time periods. To more comprehensively evaluate the energy harvesting performance from cantilevers, the total energy produced by each MFC under one loading pulse was calculated using Equation (1).
Throughout all testing cases, it was found that the total energy created by one MFC with a lower peak voltage output could be greater than that by another MFC with a higher peak voltage output in some cases. Take two cases for example. Case One was from a 1-DOF cantilever with Mass 1 of 10 g, while Case Two was from a 2-DOF cantilever with Mass 1 of 0 g and Mass 2 of 14 g. Both cantilevers had the same outline size and were placed on ¼ span of girder 2 under a loading speed of 12 mph. As shown in Figure 11, although the peak voltage output from the MFC in the first case was lower than that in the second case (1.2 V versus 1.9 V), the calculated total energy per loading pulse in the first case was greater than that in the second case (3.9 μJ versus 2.5 μJ). The major reason of generating more energy from the 2-DOF cantilever than the 1-DOF cantilever was the additional beam that kept vibrating for a relatively longer time even after the tire loading passed over the bridge girder.

6. Energy Harvesting Performance under Bridge Vibrations

6.1. Effect of Loading Speeds

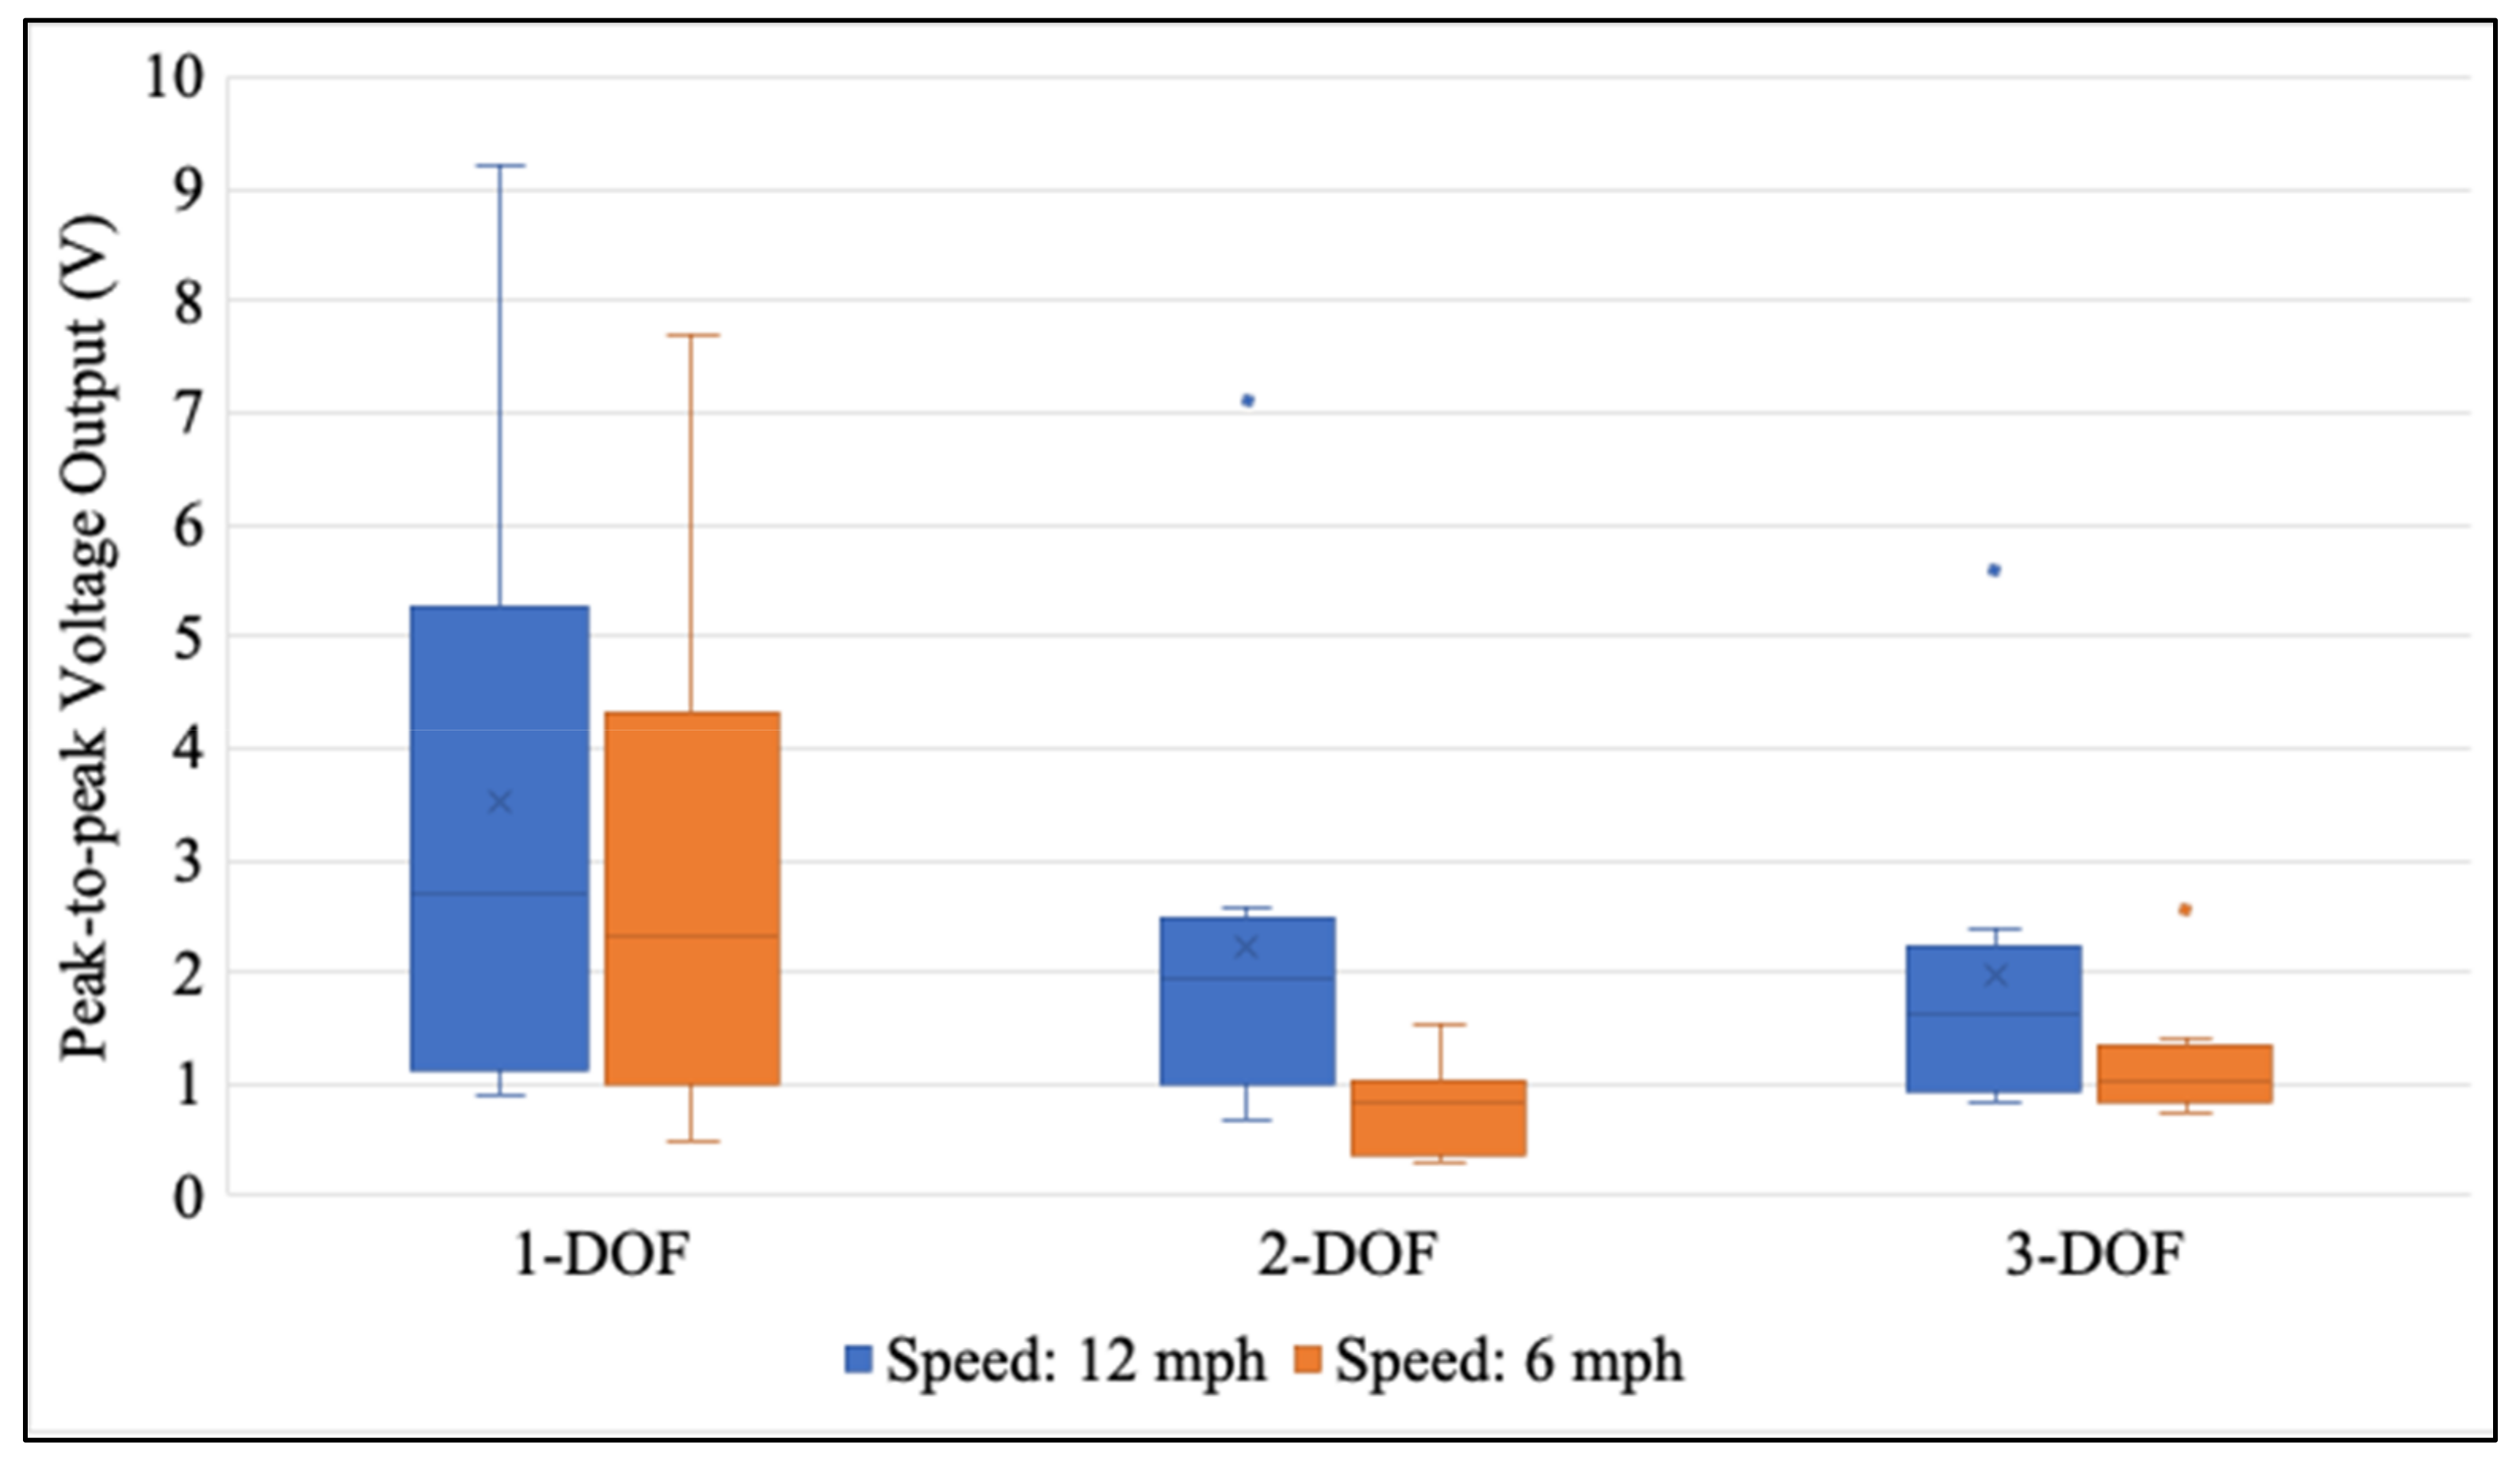
As observed from acceleration signals collected under different loading speeds (shown in Figure 6 and Figure 7), increasing loading speed caused higher accelerations along the girders. Given that the magnitude of the acceleration signal from the vibration source can directly affect the voltage output from a cantilever, higher loading speed was expected to generate greater power output. Figure 12 compares the voltage outputs from different cantilever designs at 12 mph and 6 mph overall. Under each loading speed, the measurement results were from MFCs on the baseline cantilever designs at all three installation locations. As can be seen, once the loading speed decreased from 12 mph to 6 mph, the voltage output from all cantilever designs (1-DOF, 2-DOF, or 3-DOF) consistently dropped overall.

6.2. Effect of Installation Locations

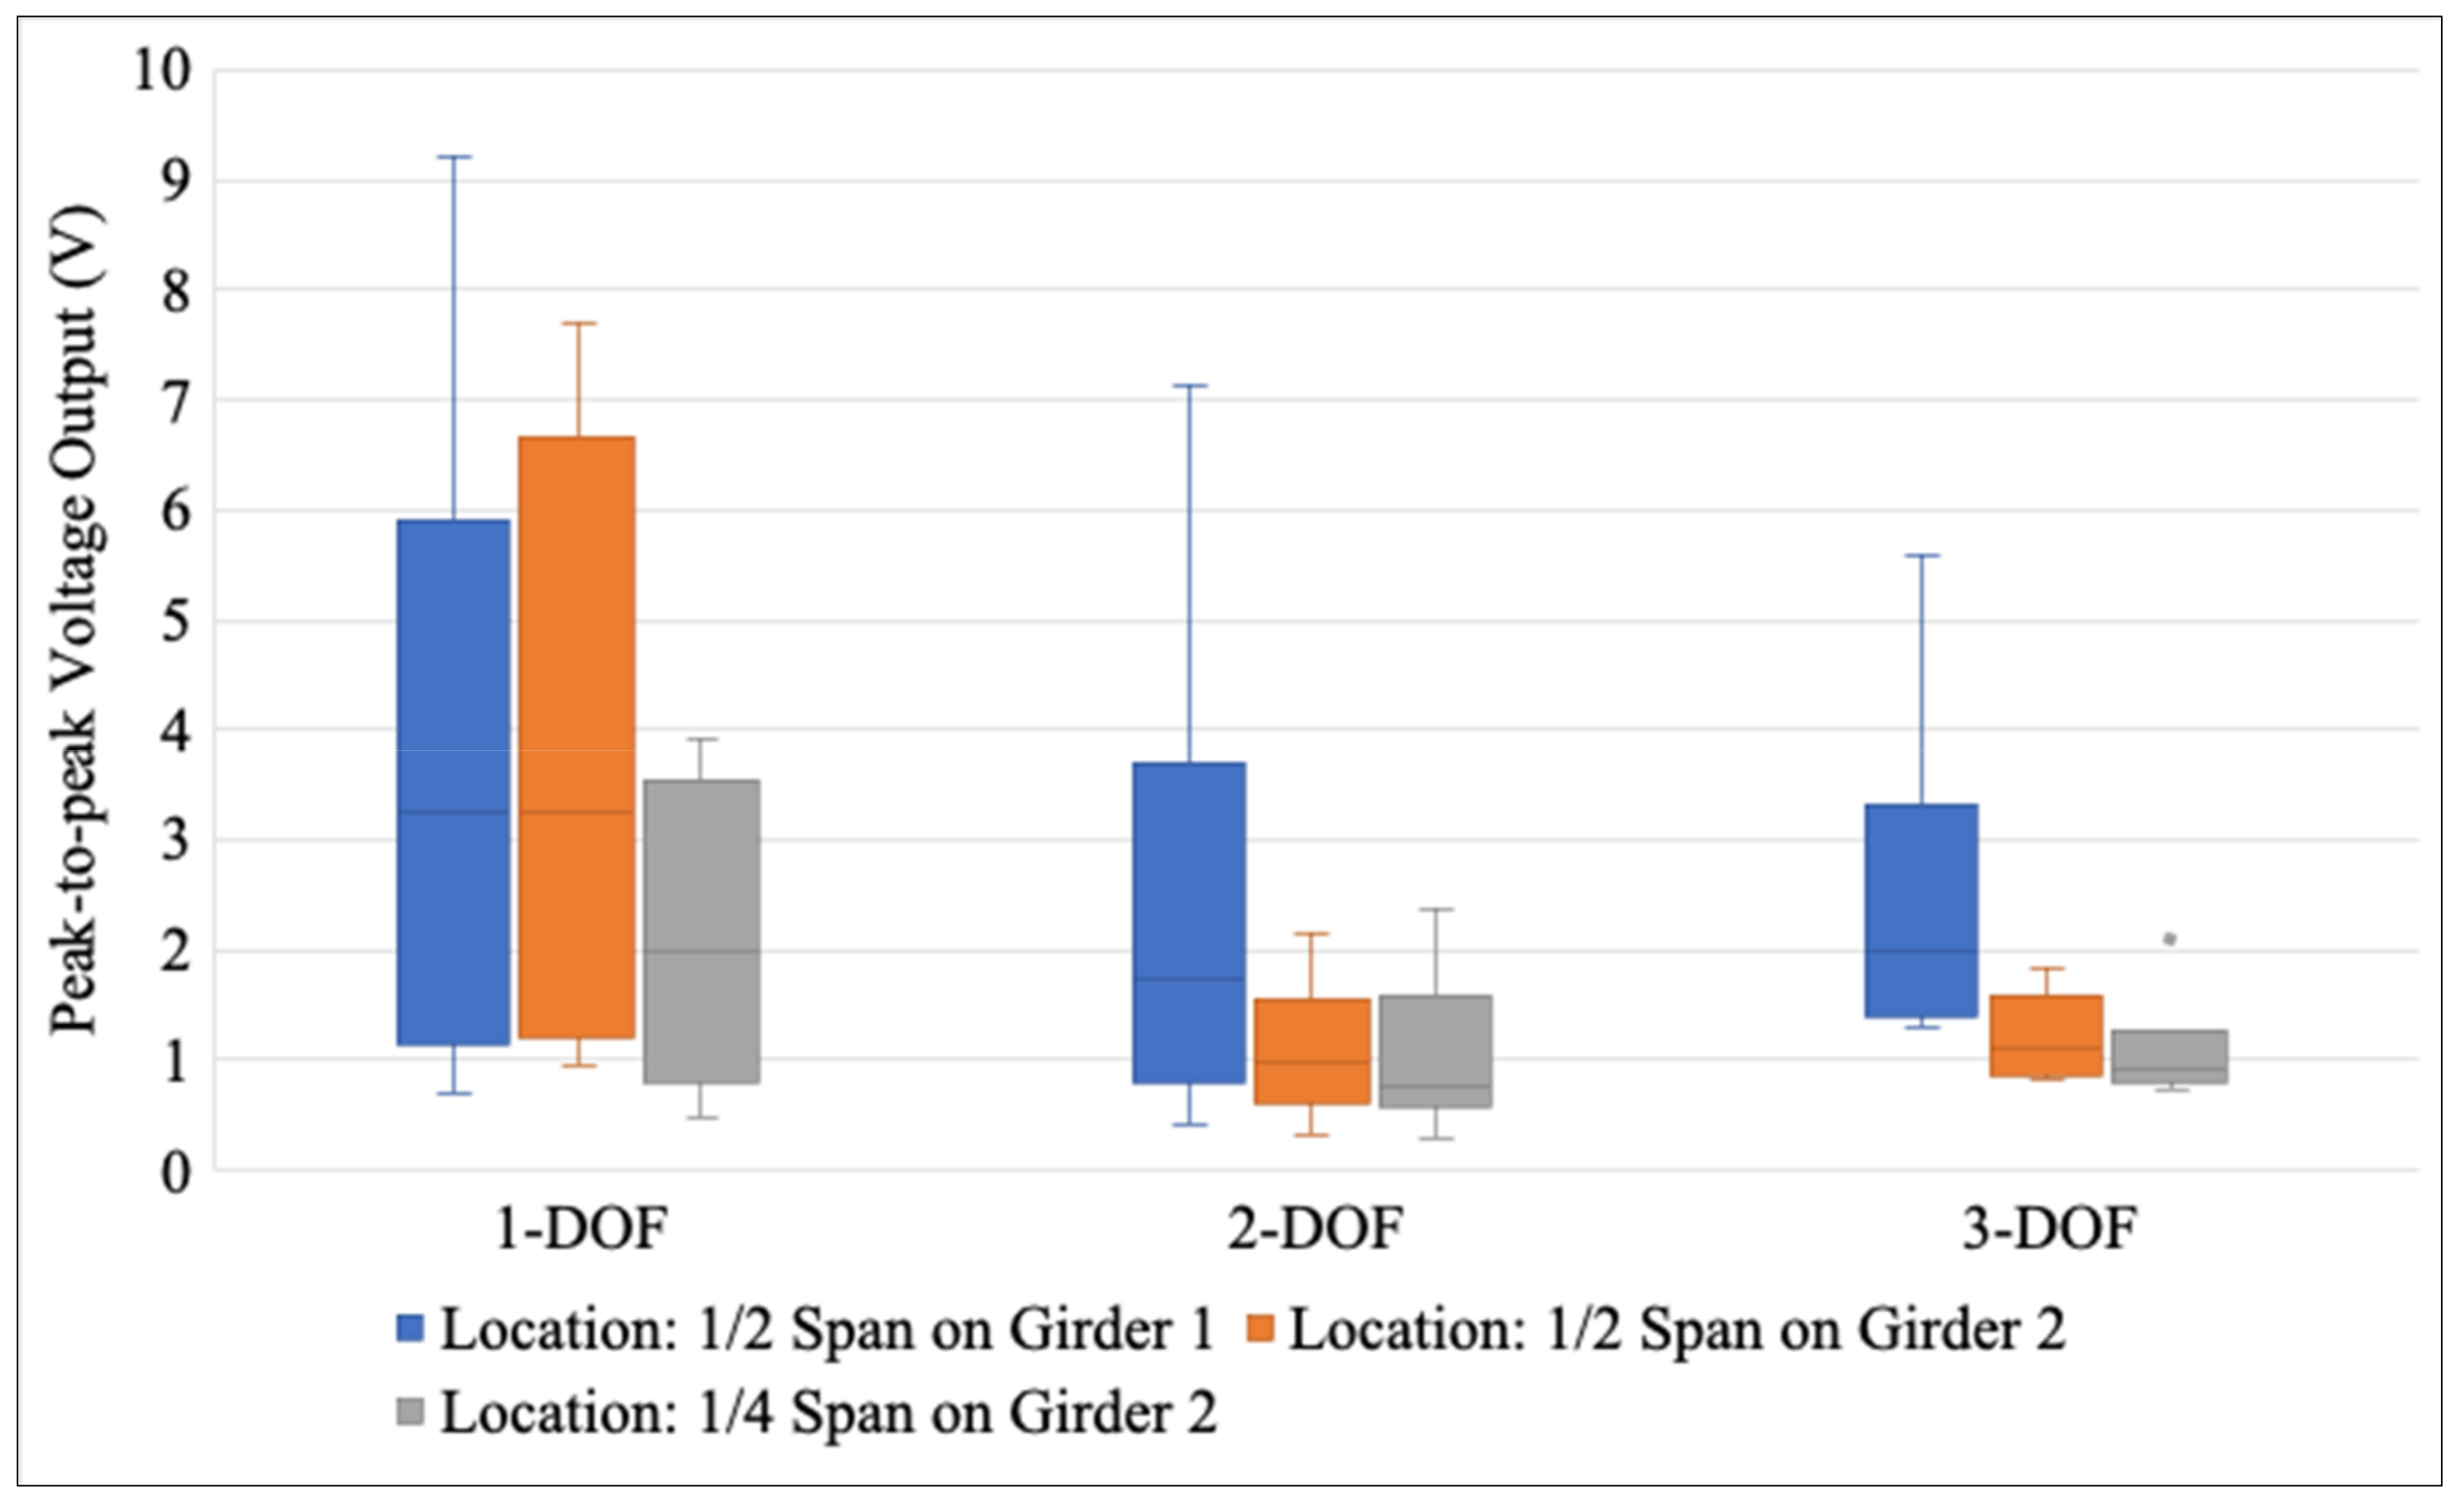
For the location selection of cantilever installation, two major changing factors could potentially affect the power outputs in different ways. One factor was the acceleration peaks, which was higher at ½ span of girder 1 in this case, followed by those at ½ span and ¼ span of girder 2 (as shown in Figure 6). Another factor was the pattern of vibration frequencies, which had one more peak at ½ span of girder 1 (at 7.8 Hz) than at ½ span and ¼ span of girder 2 (as shown in Figure 8 and Figure 9). The acceleration peaks could positively affect the voltage output, while the vibration frequency could negatively affect the voltage output in different ways. Figure 13 shows the measurement results at each installation location of the baseline cantilever designs under two loading speeds. On each cantilever design at each installation location, the voltage output from each individual MFC was separately measured. Although girder 1 did have higher acceleration peaks, the voltage outputs from the 1-DOF cantilevers installed at girder 1 were similar to those from the 1-DOF cantilevers installed at girder 2. This finding reflects that multiple vibration frequencies on girder 1 changed the voltage outputs from 1-DOF cantilevers. In other words, the number of vibrational frequencies affected the voltage outputs from cantilevers more significantly than the acceleration magnitudes at the installation location did.
On the other hand, the voltage outputs from 2-DOF and 3-DOF cantilevers at girder 1 were consistently higher than those at girder 2, which meant that the negative effect from the additional peak at girder 1 on energy harvesting performance turned to be insignificant for multiple-DOF cantilevers. This finding indicates the advantages from multiple-DOF cantilever designs under multiple-resonant-frequency scenarios.

6.3. Effect of Mass Combinations on Cantilevers

The masses on the cantilever are easy to be changed to improve energy harvesting performance. For exploring the energy harvesting potential of multiple-DOF cantilevers over a single-DOF cantilever, different mass combinations were used on 2-DOF and 3-DOF cantilevers. For unbiased comparison purposes, all cantilevers were in the same outline dimension with a maximum 10 g mass tip on the main beam (Mass 1). Figure 14 shows the voltage outputs from MFCs on 2-DOF and 3-DOF cantilever designs with different mass combinations. For the measurements at each case, the voltage outputs from three MFCs at three installation locations were included. The range of voltage outputs from the 1-DOF cantilever with a mass tip up to 10 g were measured under three locations and used for comparison.
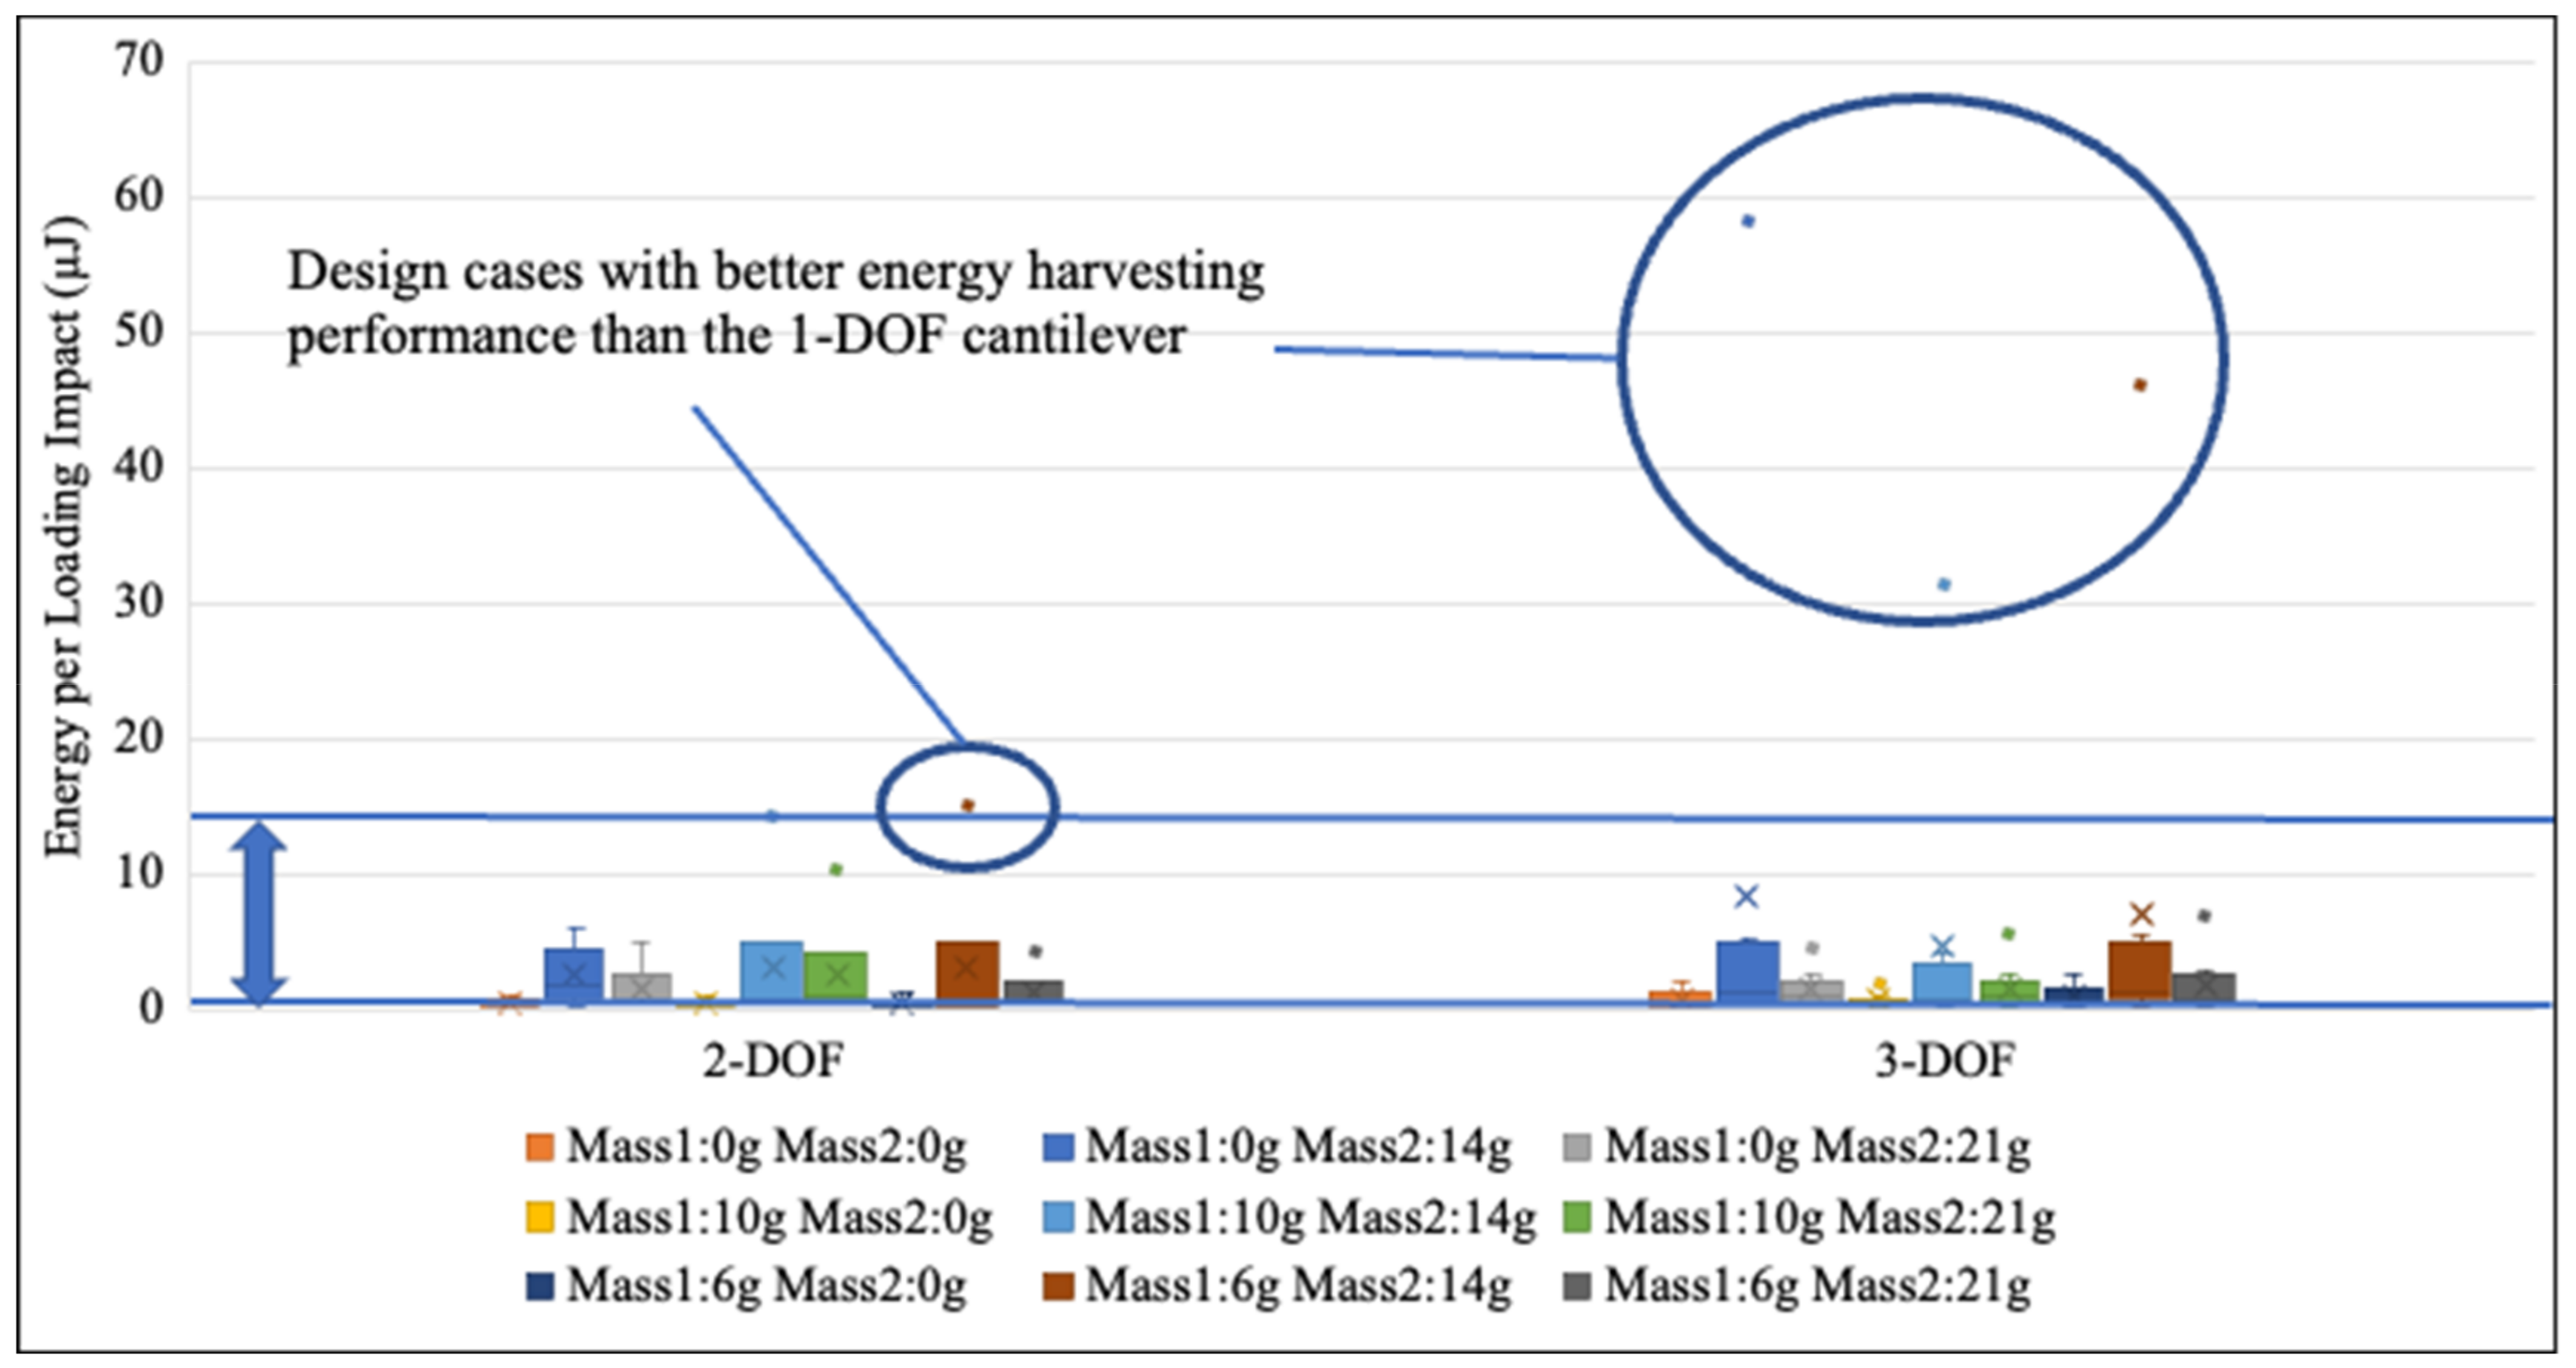
As shown in Figure 14, multiple cases with mass combinations in 3-DOF cantilevers generated higher voltage outputs than the 1-DOF cantilever (9.2 V in maximum under three locations), including 6 g Mass 1 and 14 g Mass 2 (11.1 V), 0 g Mass 1 and 14 g Mass 2 (10.9 V), and 10 g Mass 1 and 14 g Mass 2 (9.7 V). The energy for each scenario was further calculated, as shown in Figure 15. It was found that more cases in 2-DOF and 3-DOF cantilever designs generated competitive energy outputs against the 1-DOF design (14.9 μJ in maximum among three locations). As explained in Section 5.2, those additional cases with relatively high energy outputs were contributed by multiple vibration modes of cantilevers. In general, the findings from Figure 14 and Figure 15 showed the energy harvesting potential of optimized multiple-DOF cantilever designs over the single-DOF cantilever design with the same outline dimension. By further checking the resonant frequencies of 3-DOF cantilevers in mass combinations with the highest energy outputs (0 g, 6 g, 10 g Mass 1 and 14 g Mass 2) in Table 4, it was found that those three corresponding resonant frequencies were, respectively, in ranges of 7.2–7.8 Hz, 13.5–13.3 Hz, and 21–31 Hz. Two of those resonant frequencies matched the vibration frequencies of 7.8 Hz and 13.6 Hz on girder 1 (as seen in Figure 8). The one creating the highest energy of 58.2 μJ (0 g Mass 1 and 14 g Mass 2) did have resonant frequencies of 7.8 Hz and 13.5 Hz, which were closest to the vibration frequencies on girder 1. This finding confirmed that matching multiple resonant frequencies of a cantilever with the vibration frequencies of a bridge structure can lead to considerable high energy output for the multiple-DOF cantilever.

6.4. Effect of Resistive Load

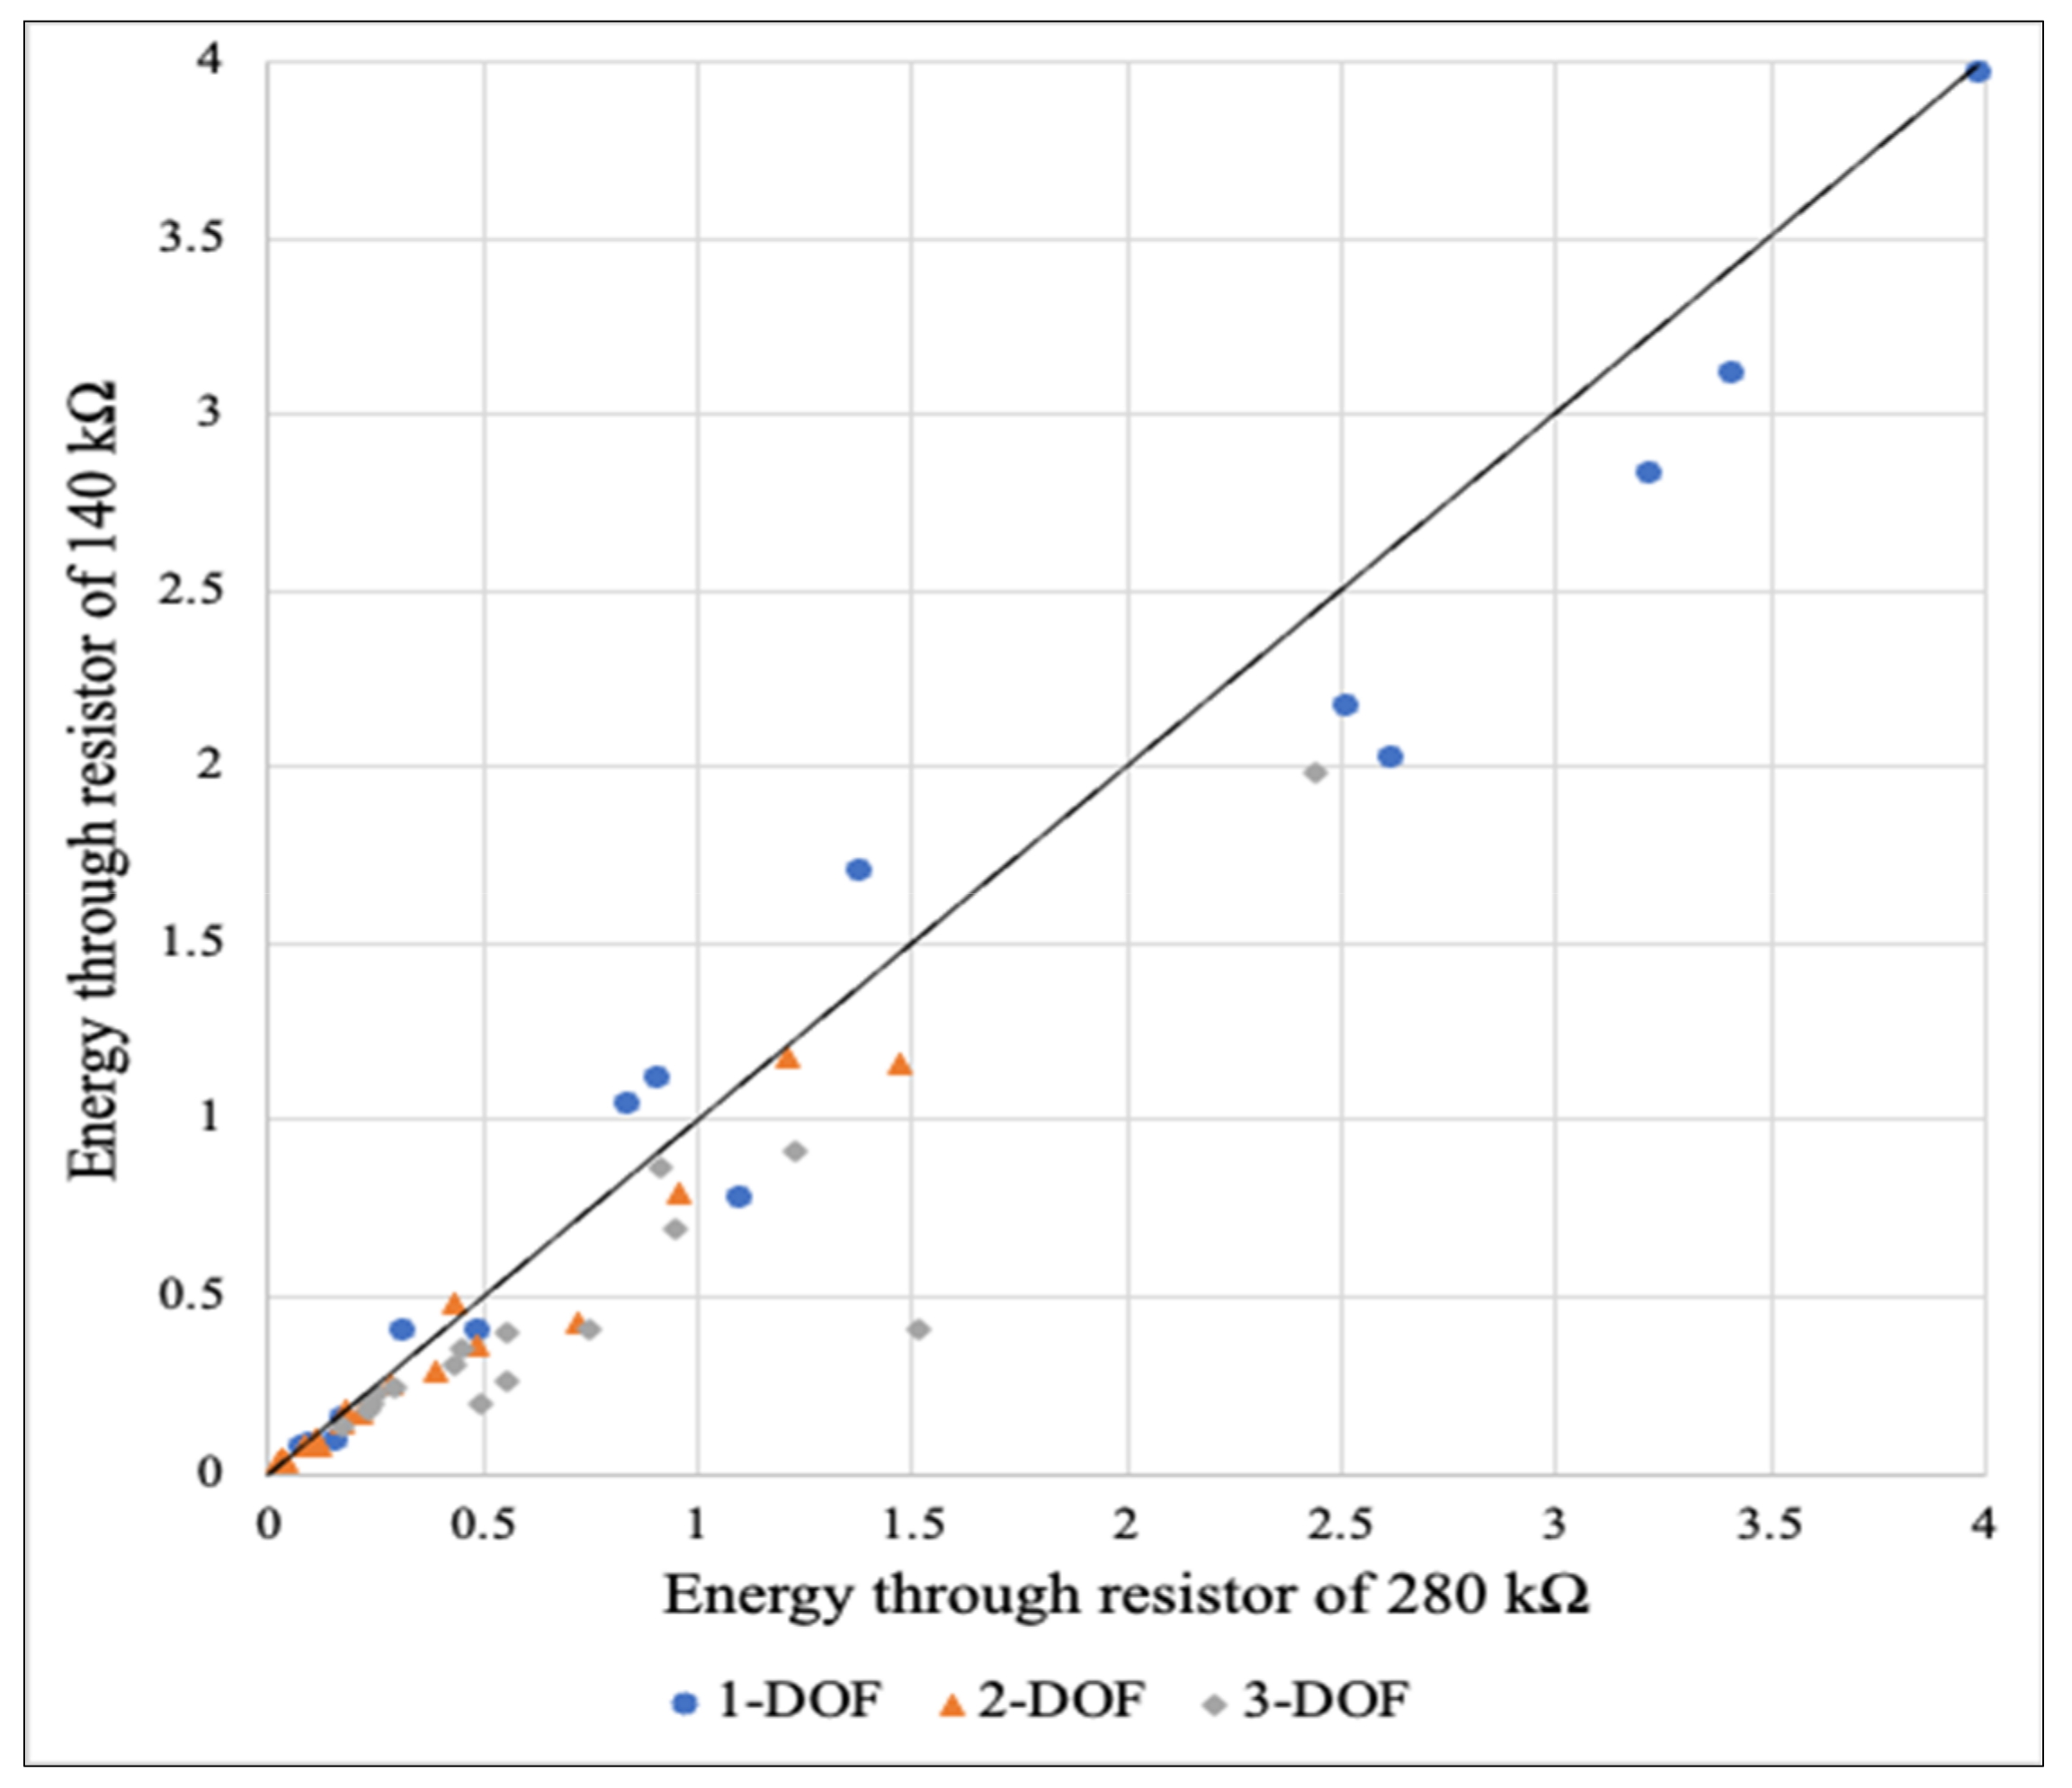
Given that resistive load can directly affect the power output from each MFC under a certain vibrational frequency, the effect of two different resistive loads (140 Ω and 280 Ω ) was evaluated in a full-scale evaluation using baseline cantilever designs under all three locations and two loading speeds. The energies consumed through those resistors are displayed in Figure 16.
As can be seen, the resistive load of 280 kΩ consumed similar or more energy generated from the MFCs than the resistive load of 140 kΩ did in most cases. Since 280 kΩ was the optimal resistance under a vibration of 15 Hz (as seen in Figure 5), more energy consumed by the resistive load of 280 kΩ than by that of 140 kΩ could be explained by the major vibration frequencies on girders which are mainly distributed within a range of 13–18 Hz (as shown in Figure 8 and Figure 9). This finding also illustrates that selecting a proper resistive load for collecting the generated energy from MFCs depends on the overall vibration condition (specific vibration frequencies) at the installation location.

7. Conclusions

This study proposed multiple-degree-of-freedom (DOF) cantilever designs for piezoelectric energy harvesting from bridge vibrations. Cantilevers with 1-DOF, 2-DOF, and 3-DOF designs in different dimensions were tested in a laboratory for resonant frequencies and further evaluated on a full-scale bridge. The voltage outputs of piezoelectric energy harvesters were affected by the matching level between the resonant frequencies of piezoelectric elements on the cantilever and the structural vibration frequencies. If multiple resonant frequencies of the cantilever were adjusted to partially match vibration frequencies of the bridge girder, the energy output from the multiple-DOF cantilever was significantly improved to be competitive against that from the 1-DOF cantilever.
Loading speed and the installation location affect the structure’s vibration and thus the voltage output of piezoelectric energy harvesters. Voltage attenuation from peaks was less significant under moving tire loading when more DOF were added on the cantilever, which contributed to more energy output. On the perspective of design optimization on cantilevers, adjusting the mass combination was effective for improving energy harvesting performance of 2-DOF and 3-DOF cantilevers. Meanwhile, the proper selection of resistive load affected total energy from the piezoelectric energy harvester.
In general, the study findings showed the potential of developing a multi-band piezoelectric energy harvesters for low-frequency vibrations encountered on bridge infrastructure. In future work, design optimization strategies of adjusting the multiple-DOF cantilever designs to create ideal resonant frequencies for best matching of bridge vibrations shall be developed. Since more complicated vibration scenarios are expected under multiple vehicles, the advantage of optimized multiple-DOF cantilever designs needs to be further studied under real traffic conditions.

Author Contributions

L.G., Data Curation, Investigation, Formal Analysis, Original draft preparation; H.W., Supervision, Methodology, Writing-Reviewing and Editing; J.B., Investigation; G.V., project management. All authors have read and agreed to the published version of the manuscript.

Funding

This research was funded by New Jersey Department of Transportation, grant number TO 361—Energy Harvesting on New Jersey Roadways.

Data Availability Statement

Data will be available upon the reasonable request.

Conflicts of Interest

The authors declare no conflict of interest.

References

  1. Guo, L.; Wang, H. Non-intrusive movable energy harvesting devices: Materials, designs, and their prospective uses on transportation infrastructures. Renew. Sustain. Energy Rev. 2022, 160, 112340. [Google Scholar] [CrossRef]
  2. Shin, Y.-H.; Jung, I.; Noh, M.-S.; Kim, J.H.; Choi, J.-Y.; Kim, S.; Kang, C.-Y. Piezoelectric polymer-based roadway energy harvesting via displacement amplification module. Appl. Energy 2018, 216, 741–750. [Google Scholar] [CrossRef]
  3. Jasim, A.; Yesner, G.; Wang, H.; Safari, A.; Maher, A.; Basily, B. Laboratory testing and numerical simulation of piezoelectric energy harvester for roadway applications. Appl. Energy 2018, 224, 438–447. [Google Scholar] [CrossRef]
  4. Chen, C.; Sharafi, A.; Sun, J.-Q. A high density piezoelectric energy harvesting device from highway traffic—Design analysis and laboratory validation. Appl. Energy 2020, 269, 115073. [Google Scholar] [CrossRef]
  5. Jung, I.; Shin, Y.-H.; Kim, S.; Choi, J.-Y.; Kang, C.-Y. Flexible piezoelectric polymer-based energy harvesting system for roadway applications. Appl. Energy 2017, 197, 222–229. [Google Scholar] [CrossRef]
  6. Hwang, W.; Kim, K.-B.; Cho, J.Y.; Yang, C.H.; Kim, J.H.; Song, G.J.; Song, Y.; Jeon, D.H.; Ahn, J.H.; Hong, S.D.; et al. Watts-level road-compatible piezoelectric energy harvester for a self-powered temperature monitoring system on an actual roadway. Appl. Energy 2019, 243, 313–320. [Google Scholar] [CrossRef]
  7. Wang, C.H.; Wang, S.; Li, Q.J.; Wang, X.; Gao, Z.; Zhang, L. Fabrication and performance of a power generation device based on stacked piezoelectric en-ergy-harvesting units for pavements. Energy Convers. Manag. 2018, 163, 196–207. [Google Scholar] [CrossRef]
  8. Cao, Y.S.; Zhang, F.; Sha, A.; Liu, Z.; Hao, Y.; Hao, Y. Energy conversion models and characteristics under various inner connections of a novel packaged piezoelectric transducer for pavements. Energy Convers. Manag. 2021, 245, 114563. [Google Scholar] [CrossRef]
  9. Zhang, H.; Qin, W.; Zhou, Z.; Zhu, P.; Du, W. Piezomagnetoelastic energy harvesting from bridge vibrations using bi-stable characteristics. Energy 2023, 263, 125859. [Google Scholar] [CrossRef]
  10. Guo, L.; Wang, H.; Soares, L.; Lu, Q.; Brito, L. Multi-physics modelling of piezoelectric pavement system for energy harvesting under traffic loading. Int. J. Pavement Eng. 2021, 23, 3647–3661. [Google Scholar] [CrossRef]
  11. Jasim, A.; Wang, H.; Yesner, G.; Safari, A.; Szary, P. Performance Analysis of Piezoelectric Energy Harvesting in Pavement: Laboratory Testing and Field Simulation. Transp. Res. Rec. J. Transp. Res. Board 2019, 2673, 115–124. [Google Scholar] [CrossRef]
  12. Wang, L.; Tong, X.; Yang, H.; Wei, Y.; Miao, Y. Design and analysis of a hollow triangular piezoelectric cantilever beam harvester for vibration energy collection. Int. J. Pavement Res. Technol. 2019, 12, 259–268. [Google Scholar] [CrossRef]
  13. Trafford, R.; Russo, D.; Clark, C.; Shin, S.; Schmalzel, J.L. Characterization of Piezoelectric Cantilever Beams for use in Roadside Vibration Energy Harvesting. In Proceedings of the 2019 IEEE Sensors Applications Symposium, Sophia Antipolis, France, 11–13 March 2019; pp. 1–6. [Google Scholar] [CrossRef]
  14. Camara, A.; Ruiz-Teran, A. Multi-mode traffic-induced vibrations in composite ladder-deck bridges under heavy moving vehicles. J. Sound Vib. 2015, 355, 264–283. [Google Scholar] [CrossRef] [Green Version]
  15. Peigney, M.; Siegert, D. Piezoelectric energy harvesting from traffic-induced bridge vibrations. Smart Mater. Struct. 2013, 22, 095019. [Google Scholar] [CrossRef] [Green Version]
  16. Karimi, M.; Karimi, A.; Tikani, R.; Ziaei-Rad, S. Experimental and theoretical investigations on piezoelectric-based energy harvesting from bridge vibrations under travelling vehicles. Int. J. Mech. Sci. 2016, 119, 1–11. [Google Scholar] [CrossRef]
  17. Cahill, P.; Jaksic, V.; Keane, J.; O’Sullivan, A.; Mathewson, A.; Ali, S.F.; Pakrashi, V. Effect of road surface, vehicle, and device characteristics on energy harvesting from bridge–vehicle interactions. Comput.-Aided Civ. Infrastruct. Eng. 2016, 31, 921–935. [Google Scholar] [CrossRef] [Green Version]
  18. Li, M.; Jing, X. Novel tunable broadband piezoelectric harvesters for ultralow-frequency bridge vibration energy harvesting. Appl. Energy 2019, 255, 113829. [Google Scholar] [CrossRef]
  19. Khan, F.; Ahmad, I. Review of Energy Harvesters Utilizing Bridge Vibrations. Shock. Vib. 2015, 2016, 1–21. [Google Scholar] [CrossRef] [Green Version]
  20. Ali, S.F.; Friswell, M.I.; Adhikari, S. Analysis of energy harvesters for highway bridges. J. Intell. Mater. Syst. Struct. 2011, 22, 1929–1938. [Google Scholar] [CrossRef]
  21. Gaglione, A.; Rodenas-Herraiz, D.; Jia, Y.; Nawaz, S.; Arroyo, E.; Mascolo, C.; Soga, K.; Seshia, A.A. Energy neutral operation of vibration energy-harvesting sensor networks for bridge applications. In Proceedings of the International Conference on Embedded Wireless Systems and Networks, Madrid, Spain, 14–16 February 2018; pp. 1–12. [Google Scholar]
  22. Sazonov, E.; Li, H.; Curry, D.; Pillay, P. Self-Powered Sensors for Monitoring of Highway Bridges. IEEE Sens. J. 2009, 9, 1422–1429. [Google Scholar] [CrossRef] [Green Version]
  23. Tong, X.; Song, S.; Wang, L.; Yang, H. A preliminary research on wireless cantilever beam vibration sensor in bridge health monitoring. Front. Struct. Civ. Eng. 2017, 12, 207–214. [Google Scholar] [CrossRef]
  24. Xue, H.; Hu, Y.; Wang, Q.-M. Broadband piezoelectric energy harvesting devices using multiple bimorphs with different operating frequencies. IEEE Trans. Ultrason. Ferroelectr. Freq. Control 2008, 55, 2104–2108. [Google Scholar] [CrossRef] [PubMed]
  25. Qi, S.; Shuttleworth, R.; Oyadiji, S.O.; Wright, J. Design of a multiresonant beam for broadband piezoelectric energy harvesting. Smart Mater. Struct. 2010, 19, 094009. [Google Scholar] [CrossRef]
  26. Chen, S.; Ma, L.; Chen, T.; Liu, H.; Sun, L.; Wang, J. Modeling and verification of a piezoelectric frequency-up-conversion energy harvesting system. Microsyst. Technol. 2017, 23, 2459–2466. [Google Scholar] [CrossRef]
  27. Tang, X.; Zuo, L. Enhanced vibration energy harvesting using dual-mass systems. J. Sound Vib. 2011, 330, 5199–5209. [Google Scholar] [CrossRef]
  28. Ye, Z.; Lu, Y.; Wang, L.B. Investigating the pavement vibration response for roadway service condition evaluation. Adv. Civ. Eng. 2018, 2018, 2714657. [Google Scholar] [CrossRef]
  29. Museros, P.; Moliner, E.; Martínez-Rodrigo, M. Free vibrations of simply-supported beam bridges under moving loads: Maximum resonance, cancellation and resonant vertical acceleration. J. Sound Vib. 2013, 332, 326–345. [Google Scholar] [CrossRef]
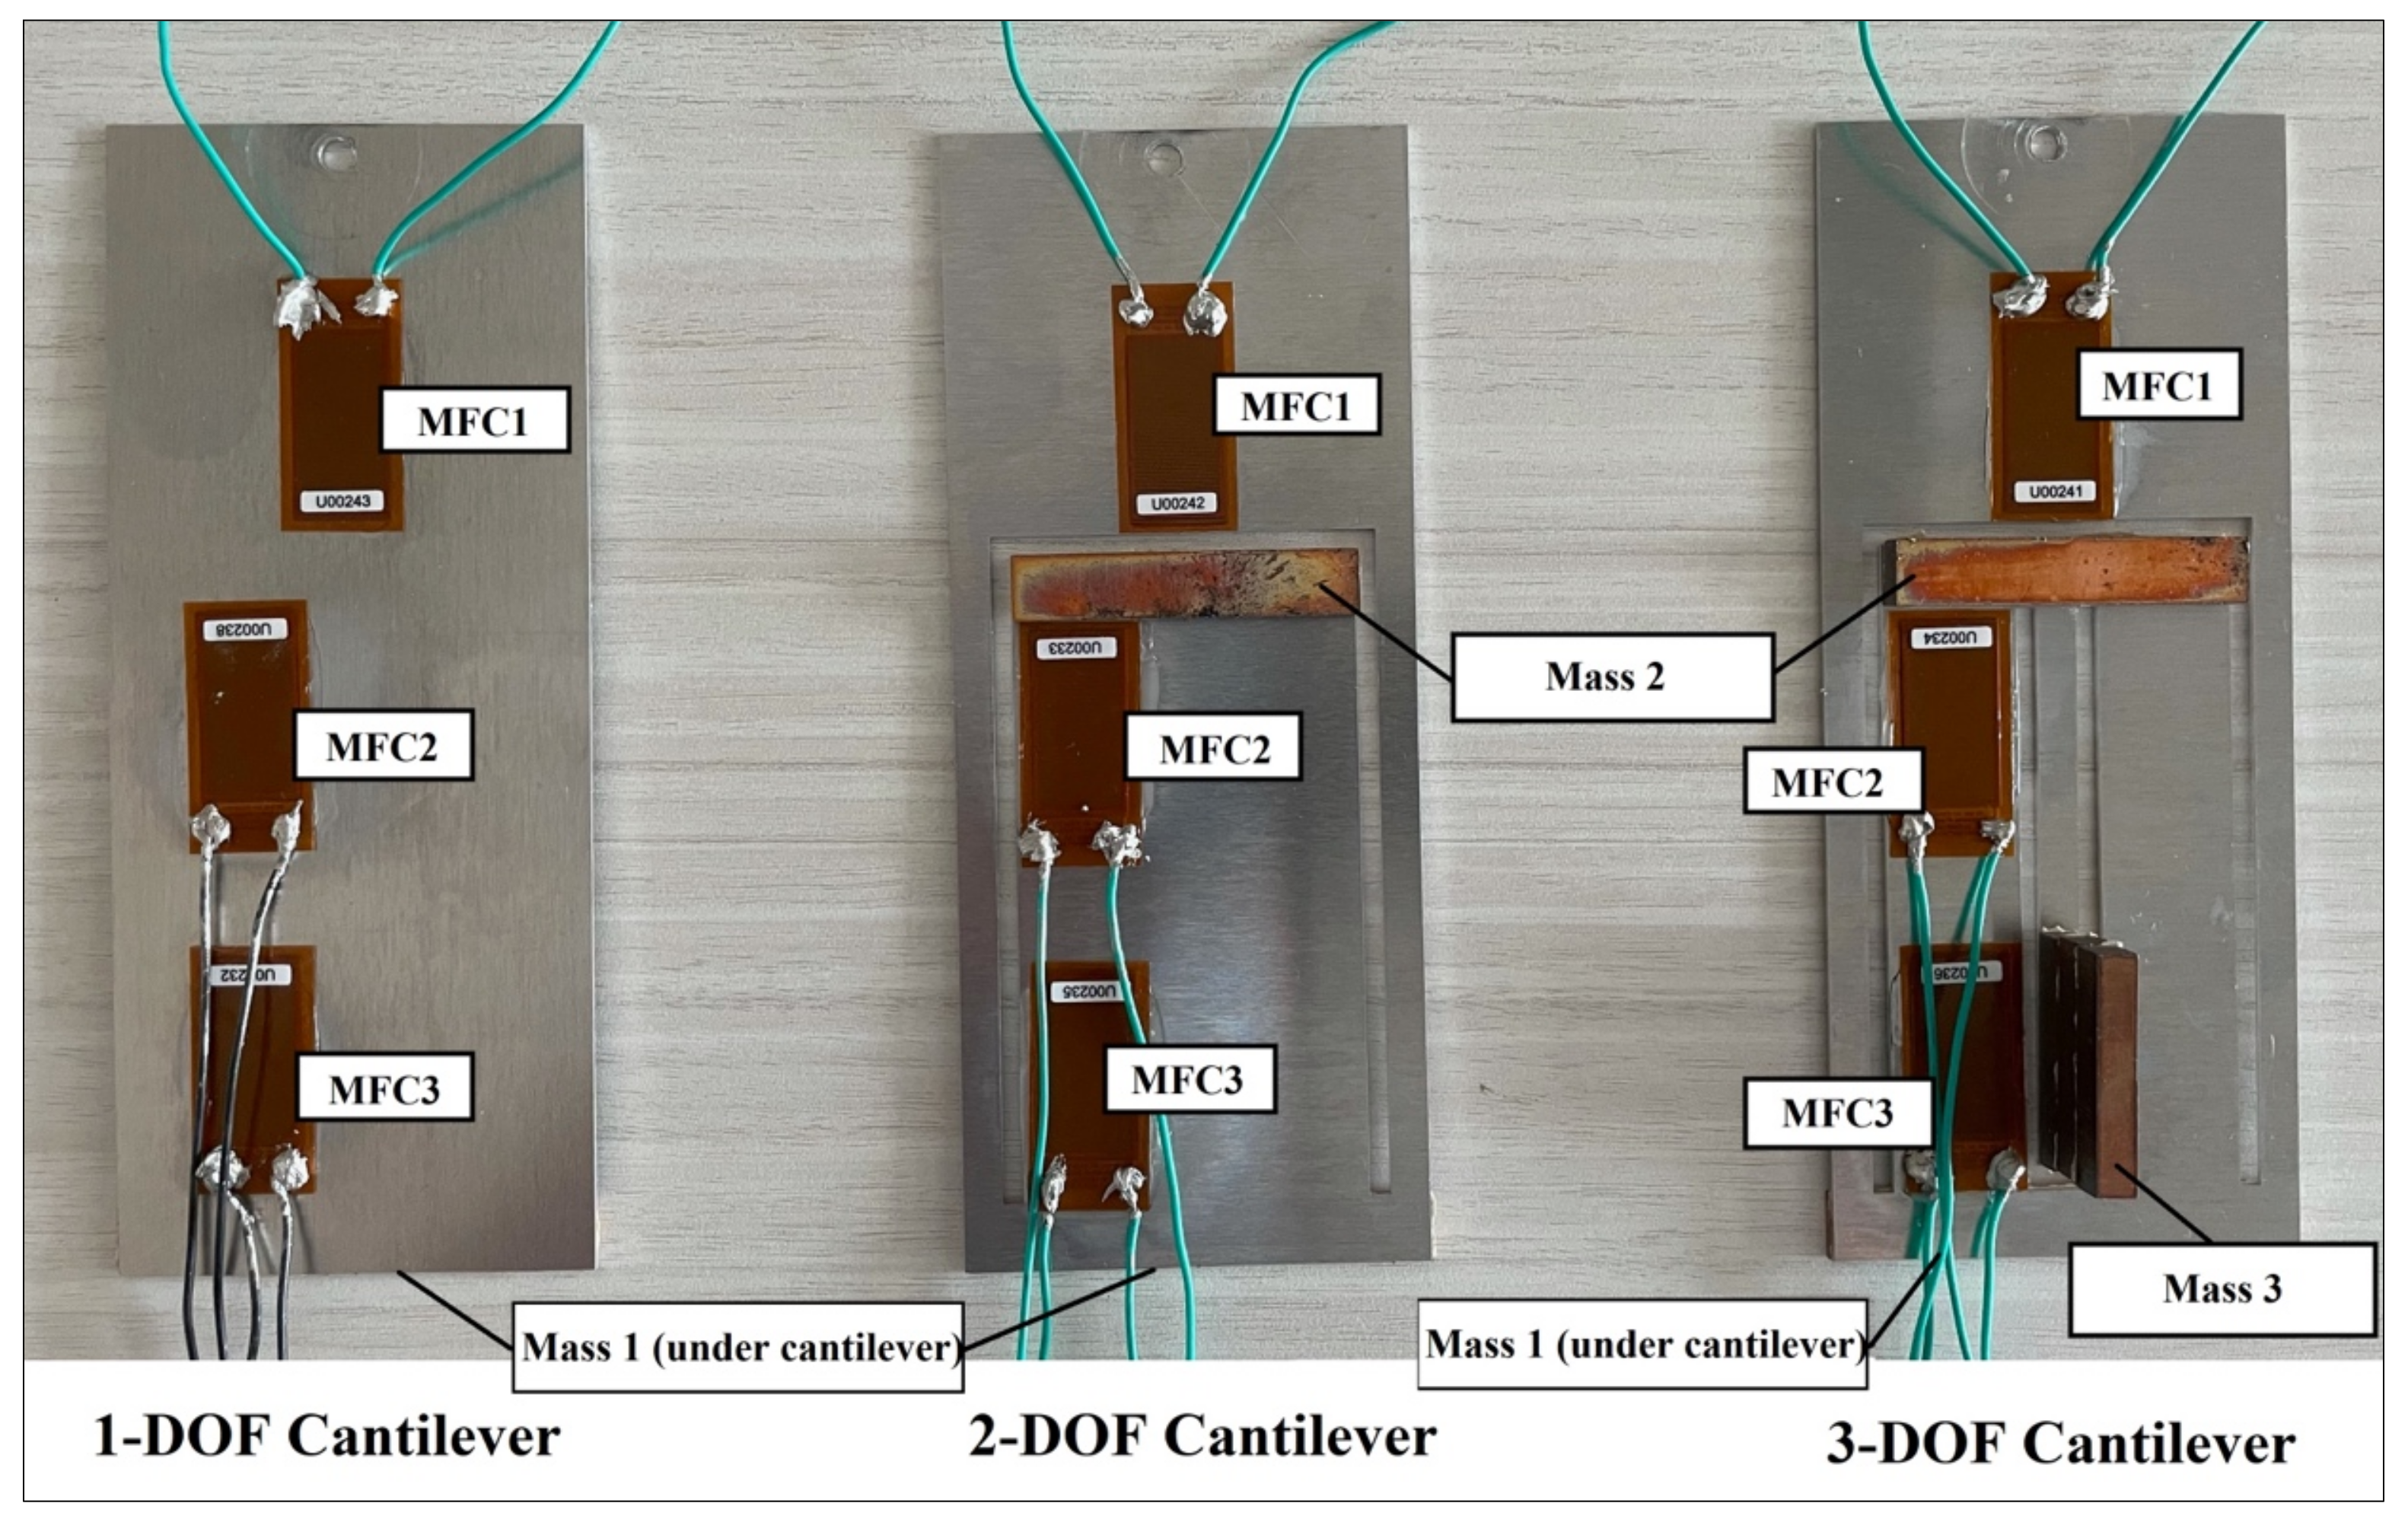
Figure 1. Cantilever designs considered in this study.
Machines 11 00462 g001
Figure 2. Laboratory setup for evaluating cantilever energy harvesters.
Machines 11 00462 g002
Figure 3. Full-scale test on bridge (a) tandem axle loading on bridge deck; and (b) energy harvesting system with cantilevers attached on a steel girder.
Machines 11 00462 g003
Figure 4. Location of moving load on bride deck.
Machines 11 00462 g004
Figure 5. Power outputs under different resistive loads at (a) 15 Hz and (b) 30 Hz.
Machines 11 00462 g005
Figure 6. Accelerations of bridge girder under one round pass of moving loading at 12 mph.
Machines 11 00462 g006
Figure 7. Accelerations of bridge girder under one round pass of moving loading at 6 mph.
Machines 11 00462 g007
Figure 8. Amplitude of bridge girder vibration after Fourier transform at 12 mph.
Machines 11 00462 g008
Figure 9. Amplitude of bridge girder vibration after Fourier transform at 6 mph.
Machines 11 00462 g009
Figure 10. Voltage output signals measured by MFCs on cantilevers under a loading speed of 12 mph and an external resistive load of 280 kΩ at mid-span of Girder 1.
Machines 11 00462 g010aMachines 11 00462 g010b
Figure 11. Voltage output signals measured by MFCs on cantilevers in two selected cases.
Machines 11 00462 g011aMachines 11 00462 g011b
Figure 12. Voltage outputs from cantilevers under loading speeds of 12 mph and 6 mph.
Machines 11 00462 g012
Figure 13. Peak-to-peak voltage outputs at different locations.
Machines 11 00462 g013
Figure 14. Peak-to-peak voltage outputs from cantilevers with different masses.
Machines 11 00462 g014
Figure 15. Energy per loading impact from cantilevers with different masses.
Machines 11 00462 g015
Figure 16. Energy through resistive loads 140 kΩ and 280 kΩ.
Machines 11 00462 g016
Table 1. Design parameters of three cantilevers.
1-DOF2-DOF3-DOF
Baseline outline dimension (mm3)170 × 70 × 1
Baseline mass group (g)Mass 1: 10Mass 1: 10
Mass 2: 21
Mass 1: 10
Mass 2: 21
Mass 3: 32
Outline dimension by scale 1.1 and 1.2 (mm3)187 × 77 × 1
204 × 84 × 1
Mass combinations (g) Mass 1: 0, 6, 10
Mass 2: 0, 14, 21
Mass 1: 0, 6, 10
Mass 2: 0, 14, 21
Mass 3: 32
Table 2. Summary of peak voltage outputs resonant frequencies from cantilevers in different outline dimensions.
1-DOFRF1 (Hz)Peak 1 (V)2-DOFRF1 (Hz)Peak 1 (V)RF2 (Hz)Peak 2 (V)
Size,
scale
MFC1MFC2MFC3Size, ScaleMFC1MFC2MFC3MFC1MFC2MFC3
116.538.219.16.3111.016.52.06.612.06.29.436.0
213.051.0N/AN/A29.822.7N/A5.811.08.8N/A10.5
311.456.7N/AN/A39.026.9N/A8.09.817.1N/A47.0
3-DOFRF1 (Hz)Peak 1 (V)RF2 (Hz)Peak 2 (V)RF3 (Hz)Peak 3 (V)
Size,
scale
MFC1MFC2MFC3MFC1MFC2MFC3MFC1MFC2MFC3
17.117.311.71.311.48.815.542.221.38.215.15.7
26.016.314.72.210.54.713.743.018.05.618.54.8
35.616.17.31.29.57.23.134.616.36.410.34.0
Table 3. Summary of peak voltage outputs and resonant frequencies from 2-DOF cantilevers with different mass combinations.
2-DOF Peak 1 (V) Peak 2 (V)
Mass 1 (g)Mass 2 (g)RF1 (Hz)MFC1MFC2MFC3RF2 (Hz)MFC1MFC2MFC3
0016.712.51.15.229.52.94.125.0
6012.510.71.02.427.56.04.023.9
10011.013.70.51.913.72.40.41.4
01413.315.78.029.517.75.62.25.6
61412.012.52.26.814.05.08.428.5
101411.311.70.82.313.86.410.037.0
02111.714.510.137.817.57.41.64.2
62111.715.96.625.512.09.04.617.1
102111.016.52.06.612.06.29.436.0
Table 4. Summary of peak voltage outputs and resonant frequencies from 3-DOF cantilevers with different mass combinations.
3-DOF (Mass 3:32 g) Peak 1 (V) Peak 2 (V) Peak 3 (V)
Mass 1 (g)Mass 2 (g)RF1 (Hz)MFC1MFC2MFC3RF2 (Hz)MFC1MFC2MFC3RF3 (Hz)MFC1MFC2MFC3
007.820.914.56.024.512.116.530.225.010.512.931.0
607.320.012.52.022.712.120.912.925.08.06.032.0
1007.119.314.92.020.74.816.16.025.08.88.832.0
0147.820.115.33.213.59.223.347.531.06.410.14.4
6147.319.311.73.213.48.412.940.223.08.820.96.4
10147.214.510.12.813.38.413.342.621.010.925.38.8
0217.820.914.52.811.78.422.554.331.08.011.64.0
6217.317.712.92.811.59.620.551.523.08.419.37.2
10217.117.311.71.311.48.815.542.221.38.215.15.7
Disclaimer/Publisher’s Note: The statements, opinions and data contained in all publications are solely those of the individual author(s) and contributor(s) and not of MDPI and/or the editor(s). MDPI and/or the editor(s) disclaim responsibility for any injury to people or property resulting from any ideas, methods, instructions or products referred to in the content.