Article

Induction Motor Noise Source Separation and Identification Based on Adaptive Scale-Space Mode Extraction

1
School of Mechanical Engineering, Shenyang University of Technology, Shenyang 110870, China
2
Liaoning Society for Vibration Engineering, Shenyang 110819, China
3
College of Mechanical Engineering, Ningbo University of Technology, Ningbo 315336, China
4
Ningbo Kunbo Measurement and Control Technology Co., Ltd., Ningbo 315200, China
*
Author to whom correspondence should be addressed.
Machines 2023, 11(4), 449; https://doi.org/10.3390/machines11040449
Submission received: 3 February 2023 / Revised: 20 February 2023 / Accepted: 22 February 2023 / Published: 3 April 2023
(This article belongs to the Section Electrical Machines and Drives)

Abstract

:
Separating induction motor noise sources can provide an important reference basis for induction motor condition detection, noise reduction treatment, and fault diagnosis. Induction motors have different types of noise sources that partially overlap, and most radiate outward through the housing, so it is difficult to separate these noise sources. Therefore, a single-channel induction motor noise source separation and identification method, based on adaptive scale-space modal extraction (ASSME) is proposed. Firstly, the adaptive scale-space mode extraction method is proposed by constructing the electromagnetic feature scale space and the adaptive penalty factor. The simulation results show that this method solves over-decomposition problems in the classical scale-space variational mode decomposition and the difficulty in balancing the harmonic and shock modes. Secondly, motor noise experiments are conducted to construct blind source separation multi-channel inputs using the adaptive scale-space modal extraction method, judging the validity of the modal components using correlation and the variance contribution rate. Finally, robust independent component analysis (RobustICA) is used to extract independent noise components and identify these noise sources by power spectral density and envelope analysis. The results show that the multi-channel input signals obtained by the proposed method are more accurate and practical than those obtained by other methods. The independent components extracted through this noise source separation method are: electromagnetic noise of different orders, aerodynamic noise, and switching frequency noise.

1. Introduction

The motor is an essential component of rotating machinery, and its acoustic noise characteristics are one of the important indicators of its performance [1,2,3]. Accurate separation and identification of induction motor noise sources can provide an important reference for induction motor condition monitoring, noise reduction, and fault diagnosis [4,5,6]. With the development of modern motors toward high power density, high torque quality, and low noise, the harmonic components of the motor air-gap magnetic field have grown more complex, and the analysis of noise sources has also become more challenging [7,8,9].
With continuous research on motor noise mechanisms and modern digital signal processing methods, noise source separation and identification based on experimental data is developing rapidly. The noise signal in most directions is similar, since the electromagnetic noise radiates through the housing [10,11,12]. Therefore, the conventional blind source separation of induction motor noise in overdetermined or well-posed situations is challenging. In 1998, Huang [13] proposed the empirical mode decomposition (EMD) method, which provides a new technique for single-channel blind source separation. The objective of the empirical mode decomposition method is to obtain a set of stationary linear and meaningful intrinsic mode functions by decomposing the original mixed signal. Mourad and Deng mapped the intrinsic mode functions obtained from EMD as pseudo-multiple inputs for pre-processing modules to the single-channel blind source separation algorithm [14,15]. In 2012, Du et al. [16] combined EMD and independent component analysis (ICA) to overcome the problem of separating and extracting diverse sources in the case of single-channel measurements and successfully identified diesel engine noise sources. However, the EMD method exhibits serious mode aliasing and the end effect; therefore, researchers have proposed ensemble empirical mode decomposition [17] and local mean decomposition [18]. In 2015, Bi et al. [19] separated the exhaust, combustion, and piston slap noise of gasoline engines by combining EEMD with robust independent component analysis, demonstrating the low cost, high efficiency, and robustness of RobustICA in noise source separation. Because of the proposed variational mode decomposition method (VMD), Yao and Zhou transformed the VMD and its optimization algorithm from a single-channel engine noise signal to a multi-channel signal, and they combined VMD with the RobustICA method to separate and identify multiple noise sources [20,21]. Yang et al. [22] used the genetic algorithm to optimize the equilibrium parameters and IMF numbers, then combined the sparse Bayesian limit machine learning and VMD methods to propose an intelligent engine knock detection system. These methods demonstrated that the VMD method has more mathematical theoretical support and better performance in transforming the intrinsic mode functions obtained from single-channel signals than the classical recursive EMD method.
Although these studies have shown that constructing multi-channel inputs is one of the most successful methods for solving blind source separation problems in underdetermined situations, there have been few applications for motor noise source separation. The scale-space theory was first applied to empirical wavelet decomposition (EWT) for spectrum division [23,24]. Meanwhile, in many studies of VMD preset parameters, researchers found that the scale-space method divided the spectrum with better flexibility, accuracy, and economy when processing large-scale data. Ma et al. [25] determine the preset number of modes using the scale-space method to divide the spectrum and combine the correlation coefficient and the Teager energy operator. Huang et al. [26] proposed an improved scale-space VMD method, based on the work of Ma, to optimize the spectrum division in scale-space and obtain the mode decomposition layer and penalty factor for VMD. Wang et al. [27] proposed a combination of fault feature mapping methods to solve the problem of mode over decomposition in classical scale-space and used the aggregation factor to solve the problem of low adaptivity of a single penalty factor. In addition, from the results of these studies, it can be found that determining the number of preset modes based on the scale-space theory shows better performance in distinguishing harmonic and shock modes. Therefore, this method is suitable for the single-channel blind source separation of motor noise.
The above approach demonstrates the advantages of scale-space theory for noise source separation. However, the VMD method based on the scale-space theory has some deficiencies in applying motor noise source separation. First, motor noise mainly includes electromagnetic, mechanical, and aerodynamic noise. Electromagnetic harmonic noise is the typical component typically [5]. The classical scale-space mode decomposition method may cause the absence of some motor electromagnetic noise features in the smoothing process. Second, this method may produce mode over-decomposition in complex frequency bands, which is not conducive to extracting motor noise harmonics and shock modes. Third, a smaller penalty factor is beneficial to extract the fault pulse signal, while a larger penalty factor is beneficial to extract the motor electromagnetic harmonic noise signal. Therefore, a single penalty factor can’t balance motor noise source separation and identification requirements.
Therefore, this article proposes the adaptive scale-space mode extraction method (ASSME) and extracts the independent noise components of the ASSME results. First, this article proposes an electromagnetic feature scale-space method, which indirectly determines the number of modes and estimates the center frequency of motor noise by combining scale-space theory and electromagnetic features by transforming frequency domain information into Markovian transition fields (MTF). Second, by combining the electromagnetic characteristic scale-space results with the adjustment of penalty factors, the penalty factors of different modal components of motor noise are determined to obtain the accurate IMF components. Third, the IMF components of motor noise are evaluated using correlation coefficients and variance contribution rates, and the independent components of the effective IMF components are extracted using RobustICA. Finally, since electromagnetic noise and other noise sources may overlap in the time and frequency domains, power spectral density and envelope spectrum analysis is performed on the independent noise components to accurately identify induction motor noise sources.

2. Methodologies

2.1. Markov Transition Field

The Markov Transformation Field is based on the first-order Markov chain to obtain the Markov transfer matrix [28]. The current element in the state transfer matrix is independent of the previous element. The MTF can retain more sequence information during the transformation process, ensuring the continuity of the information features in the frequency domain during scale-space construction. In this article, MTF is introduced into the scale space to ensure the correlation between the corresponding image and frequency while reducing the loss of information in the frequency domain.
Both the smoothing process in the classical scale-space approach and the MTF transformation in ASSME can be considered as the compression of the frequency domain information [29], but the MTF transformation of frequency domain signals requires a priori assumptions on the data structure [30]. Moreover, the classical scale space treats the spectrum as a histogram to find meaningful modes. In this article, the spectrum is considered as a sequence of frequency-amplitude signals, and the relationship between frequency and system characteristics is ignored to find meaningful modes. Suppose the frequency domain sequence X = { x 1 , x 2 , x 3 , x n } and the state space S = { S 1 , S 1 , S n } have the following relationship:
P i j = p { S i S j } = p { X T + 1 = S j X T = S i }
and
P i j = p { S j S i } = p { X T = S j X T + k = S i }
If the above conditions are allowed, information about the distribution of meaningful modes will be obtained. In other words, assuming that the frequency domain signal has Markovianity, we can obtain information about the modes and the number of modes in the signal. The frequency domain signals X = { x 1 , x 2 , x 3 , x n } can be divided equally into Q bins, and each x i contains a bin q j ( j [ 1 , Q ] ) . The Markov matrix W can be constructed from a first-order Markov chain. The expression is as follows:
W = [ w 11 w 12 w 1 Q w 21 w 22 w 2 Q w Q 1 w Q 2 w Q Q ]
w i j = p { x t q i | x t 1 q j }
where w i j is the probability that point x from the current bins q i will appear in the bins q j . The matrix W is extended to a Markov transition field M by introducing frequency domain information. The dataset is divided into Q intervals along the frequency axis, with data points at frequencies i and j belonging to corresponding bins q i and q j . M i j indicates the probability of the transformation from q i to q j . The expression is as follows:
M = [ w i j x 1 q i , x 1 q j w i j x 1 q i , x n q j w i j x 2 q i , x 1 q j w i j x 2 q i , x n q j w i j x n q i , x 1 q j w i j x n q i , x n q j ]
MTF not only sums up a segment of the signal, but also extracts the information changes in the frequency domain, avoiding the information loss from the smoothing process, which allows the scale space to obtain more accurate information about the intrinsic modes of the noisy signal. The flow of MTF is shown in Figure 1.

2.2. Electromagnetic Feature Scale Space

The scale-space theory is widely applied in the multi-scale feature extraction of graphs [31], such as graph searching [32], image matching [33], and other fields. The scale-space theory has apparent advantages in determining the number of harmonics and shock modes, but the method retains the problem of over-decomposition, so this article proposes an electromagnetic characteristic scale space. Suppose the MTF function is I(x,y). Then the scale space of the function is as follows:
L ( x , y , σ ) = G ( x , y , σ ) I ( x , y )
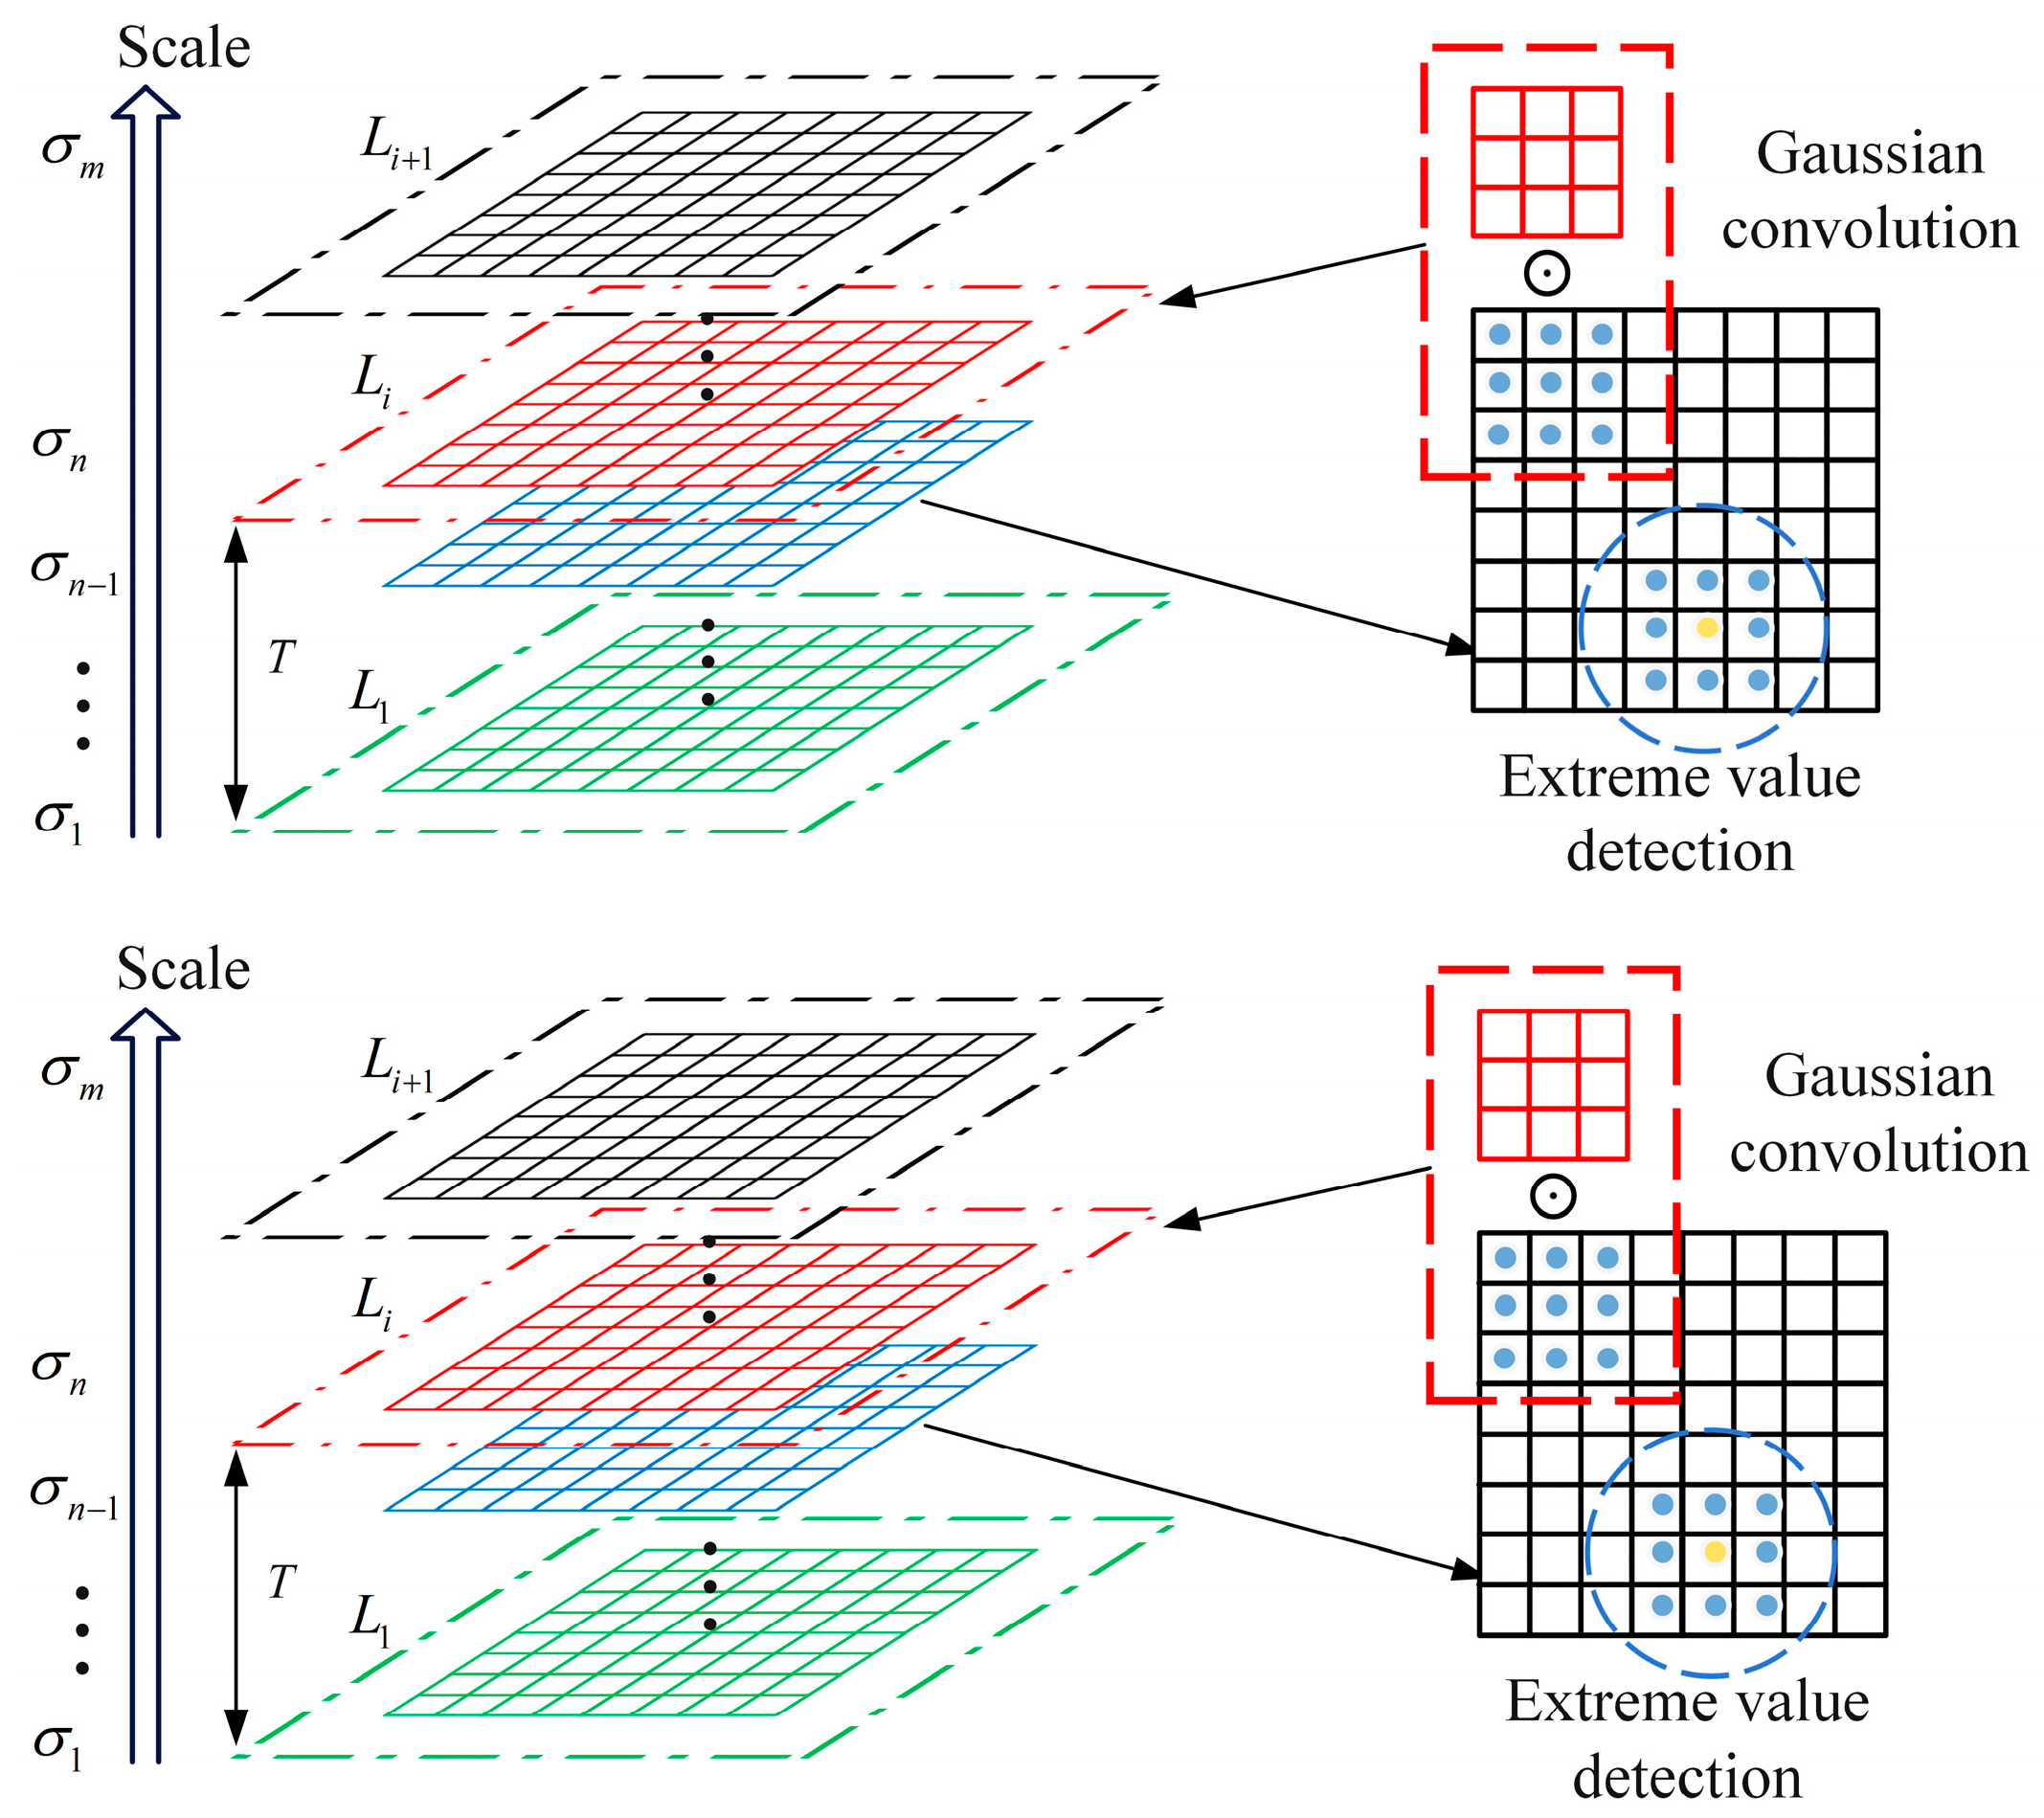
where (x,y) is the spatial coordinate of the image pixel location, σ is the scale parameter, and G ( x , y , σ ) is the variable scale Gaussian kernel function used to implement the linear scale transformation. The Gaussian convolution kernel with a non-zero distribution is convolved with the original image. Therefore, the value of each pixel is a weighted average of the neighboring pixel values. Figure 2 shows the construction of the MTF scale space. The Gaussian convolution kernel is expressed as follows:
G ( x , y , σ ) = 1 2 π σ 2 e ( x + y ) 2 / 2 σ 2
In complex motor noise signals, some full-band interference frequencies may significantly affect the movement of local extremes. Furthermore, according to the theory of radial electromagnetic forces in induction motor high spatial harmonics, the radial electromagnetic force waves fr, generated by the interaction of stator and rotor spatial harmonics, are an important component:
f r = [ n 2 ( s 2 / p ) ( 1 s ) ± 2 ] f c
where n2 = ±1, ±2···, s2 is the number of rotor slots, p is the number of motor pole pairs, s is the slip ratio, and fc is the fundamental frequency. Therefore, four times the current fundamental frequency is mapped in the scale-space plane as the detection bandwidth to avoid the effects of local extreme position shifts and uncertain parameters. The choice of electromagnetic characteristic frequency as the minimum detection limit ensures that each intrinsic mode function contains electromagnetic noise information of complete order.
In addition, since the number of local extremes decreases continuously with the deepening of the scale space, this article defines a scale-space order by each decrease in the number of local extremes and collects the number of image layers with reduced extremes as the length of the scale-space order Di. Di is expressed as follows:
D i = { d | L 1 L i } , i = 1 , 2 , 3
where d is the number of scale-space layers from L1 to Li, L i = { E i } = { e 0 , e 1 , e 2 , e k } is the i-th scale order, and { E i } represents the set of local extremes bands along the x-axis in the y-direction at the i-th scale-space order. Meanwhile, according to the electromagnetic feature mapping principle, ei is the effective polar band condition, as follows:
e i e i 1 4 f c
Therefore, the problem of determining the predetermined number of modes is converted into the problem of finding the minimum scale-space order Li larger than the threshold T, in other words, the minimum Li problem when Di > T. The Otsu method is an algorithm for determining the threshold value for image binarization segmentation and is considered the best algorithm for threshold selection in the scale-space method [34]. The determination of the threshold T in ASSME is all performed using the Otus method.

2.3. Adaptive Penalty Factor

In decomposing the real-valued signal f decomposition into a series of intrinsic modes, the VMD method, as an orthogonal signal decomposition method, can be solved as a constrained variational problem. By introducing penalty factors α and Lagrange multipliers τ , the constrained variational problem is rewritten as an unconstrained variational problem:
L ( u k , ω k , α k , τ ) = α k k = 1 K t [ ( δ ( t ) + j π t ) * u k ] e j ω k t 2 2 + f k = 1 K u k 2 2 + τ , f u k
where u k is the k-th intrinsic mode function. ω k is the central frequency of the k-th IMF, K is the modes’ number, δ is the Dirac distribution, and * represents the convolution.
The above method determines the preset number of modes K and the approximate center frequency ω k . The preset number of modes K can be used directly as an input parameter to the VMD, while the penalty factor α k determines the accuracy of IMFs [26]. Therefore, this article adaptively determines the penalty factor α for each IMF using adaptive aggregation factors combined with the predicted center frequency and sampling frequencies. The aggregation factor is as follows:
ζ k = i = 1 N | i f s N | u k ( i ) | 2 ω k | u k ( i ) | 2 | f s i = 1 N | u k ( i ) | 2
where fs is the sampling frequency, ω k is the central frequency of the k-th IMF, and the initial value for ω k is ei. N is the length of the original signal, Based on the constructed aggregation factors, the adaptive penalty factors are as follows:
α k = ( 1 1 + e log 10 ζ k 0.5 ) f s
After the initial penalty factor is determined artificially, α k and λ k are continuously changed over iterations to determine the appropriate bandwidth for the IMF. The iteration stops when the relative error is less than the convergence tolerance ε. The iteration-stopping condition is as follows:
k u ^ k n + 1 u ^ k n 2 2 / u ^ k n 2 2 < ε

3. Adaptive Scale-Space Mode Extraction

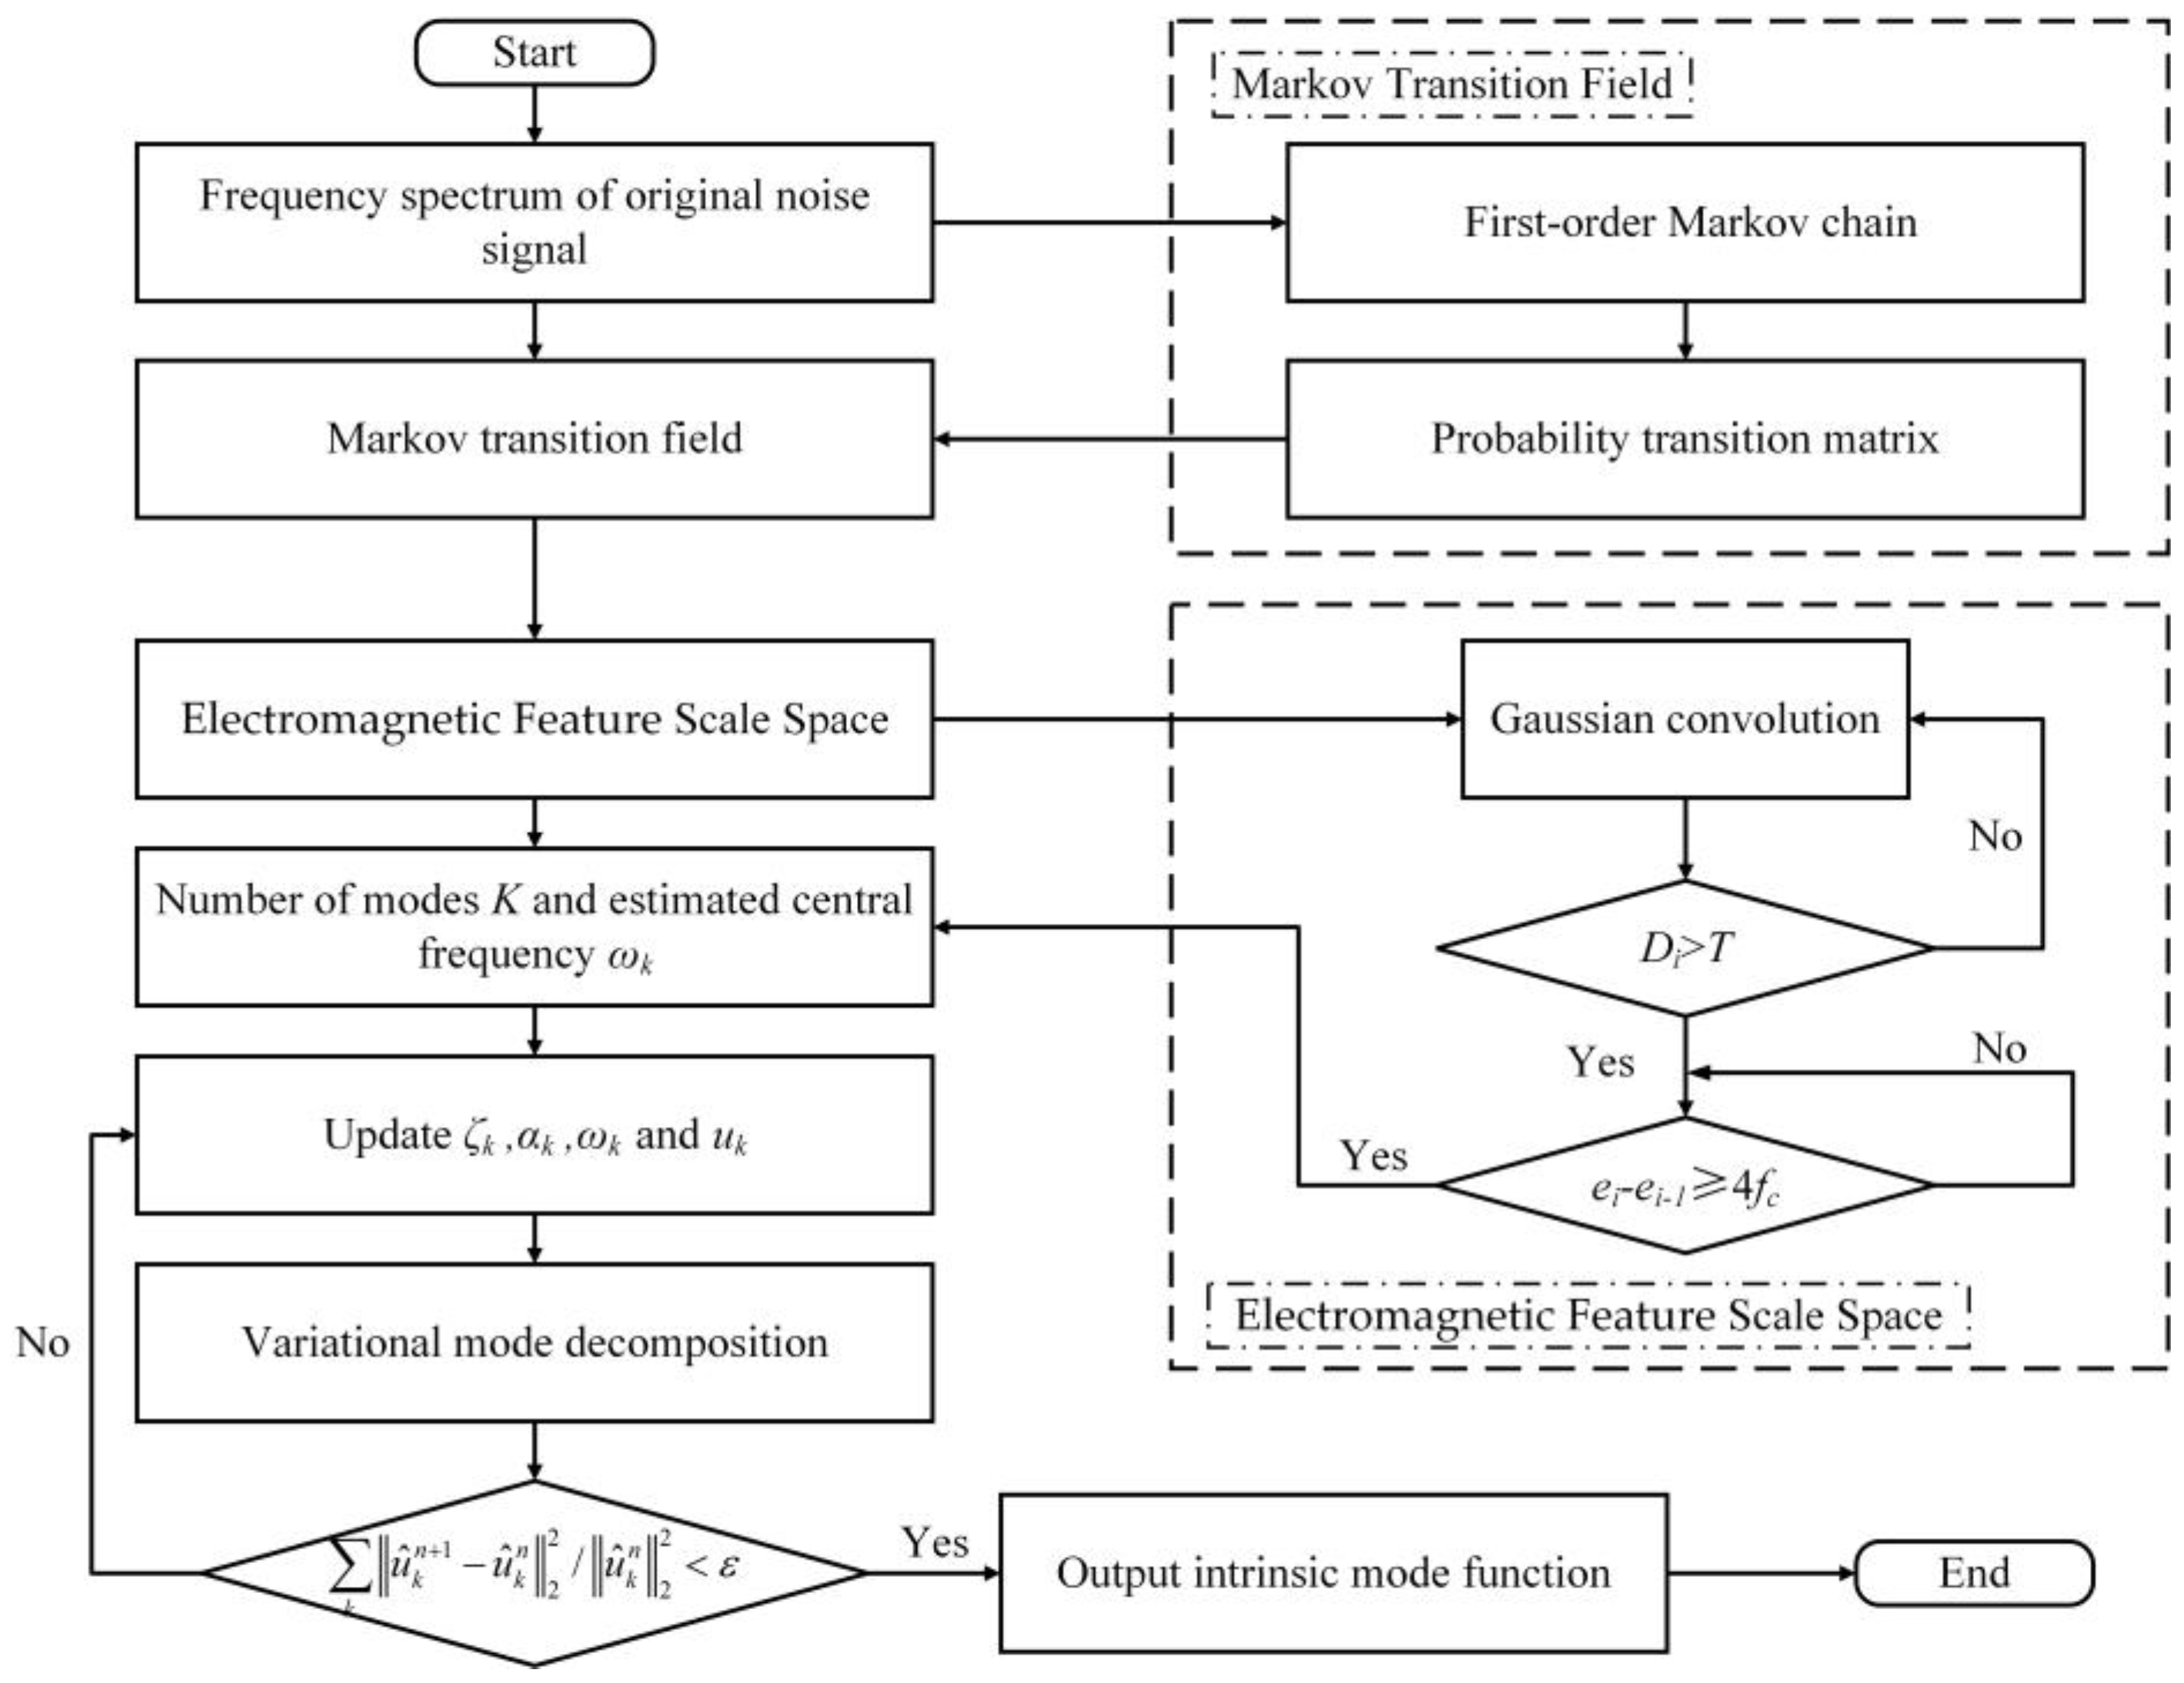
According to the theory of single-channel blind source separation, the VMD method decomposes the single-channel signal into multi-channel virtual observation IMF that can be used for blind source separation in underdetermined situations. Nevertheless, the preset number of modes K and the penalty factor α determine the accuracy of the IMF. If the preset modal number K is smaller than the actual IMF number, some frequency components will be filtered out as noise or incorporated into adjacent IMFs. Conversely, if the preset mode number K is larger than the actual IMF number, it will result in duplicate IMFs or IMFs with additional components. Determining K and α is the crucial challenge in applying the VMD method to separate motor noise sources. In order to determine the K and α of the actual motor noise signal, the adaptive scale-space mode extraction method is proposed in this article. The Markov transition field and the electromagnetic feature scale space are introduced in this method to determine the K value. The adaptive penalty factor α is constructed using aggregation factors. The flow chart of the ASSME method is shown in Figure 3.

3.1. Parameters Selection

Taking σ = k σ 0 , k = ±1, ±2 ···, in the scale parameter, the initial scale parameter σ 0 is taken based on a special property that the Gaussian function approximates the Gaussian difference function when σ 0 = 1.6, and it performs better [32].
Due to the limitations of the VMD algorithm, the initial penalty factor α 0  must be determined. In general, the initial penalty factor is 1000 when the signal source is unknown, and it can be appropriately increased or decreased when the study needs to focus on harmonic or shock signals. In our case, the initial penalty factor α 0 is set as 1000.
Although the preset number of modes K and penalty factors α have been determined, the VMD or ASSME still require preset parameters, including the Lagrange multiplier τ and the convergence tolerance ε . The Lagrange multiplier τ is used to enforce the constraint, whose value indicates the tolerance to noise and affects the fidelity of the additive noise-related data. To avoid ignoring the effect of the Lagrange multiplier τ , τ is set as 0.001. The convergence criterion ε is a stop-iteration threshold to limit reconstruction, and we set ε = 1 × 10⁻⁷.

3.2. Simulation

The simulation signal is constructed in this article in regards to possible electromagnetic noise, aerodynamic noise, and fault noise frequencies of induction motors at a fundamental frequency of 20 Hz, and the pattern decomposition results obtained by ASSME are compared with the classical scale-space VMD method (CSSVMD) and the classical scale-space EWT method (CSSEWT). The simulated signal expressions are as follows:
{ s 1 = 0.1 cos ( 2 π 300 t ) s 2 = 0.1 cos ( 2 π 600 t ) s 3 = 0.1 cos ( 2 π 1000 t ) s 4 = 0.4 e 100 t cos ( 2 π 1400 t ) s 5 = 0.05 ( 1 + cos 20 π t ) cos ( 240 π t ) y = s 1 + s 2 + s 3 + s 4 + s 5 + η
where y is a mixed noise signal, s 1 , s 2 , and s 3 are harmonic noise signals with different frequencies, s 4 is a fault shock signal, s 5 is an amplitude-modulated signal, η is Gaussian white noise, and η approximates the broadband fan noise in the induction motor. The MTF scale space of the simulated signal is shown in Figure 4a, and all the extreme bands of the minimum scale-space order are marked. The final number of actual extreme bands is shown in Figure 4b by mapping four times the fundamental frequency in the lower triangular matrix of the MTF scale space. The spectrum of the ASSME results is shown in Figure 5.
There are some points to note in Figure 4. Firstly, different from the time domain signal, the frequency domain signal is non-negative. Therefore, the MTF is symmetrical for the red diagonal dashed line in the figure, and the symmetry position corresponds to the same frequency features. Second, in constructing the MTF scale space, the corresponding positions on both sides of the symmetry axis appear slightly different, but it is considered that the features on both sides of the axis are the same. Third, the pollution caused by the background noise is evident from the MTF. In contrast, the feature frequencies are clearly distinguished from the background noise, and the broadband signal is more significantly reflected in the MTF.
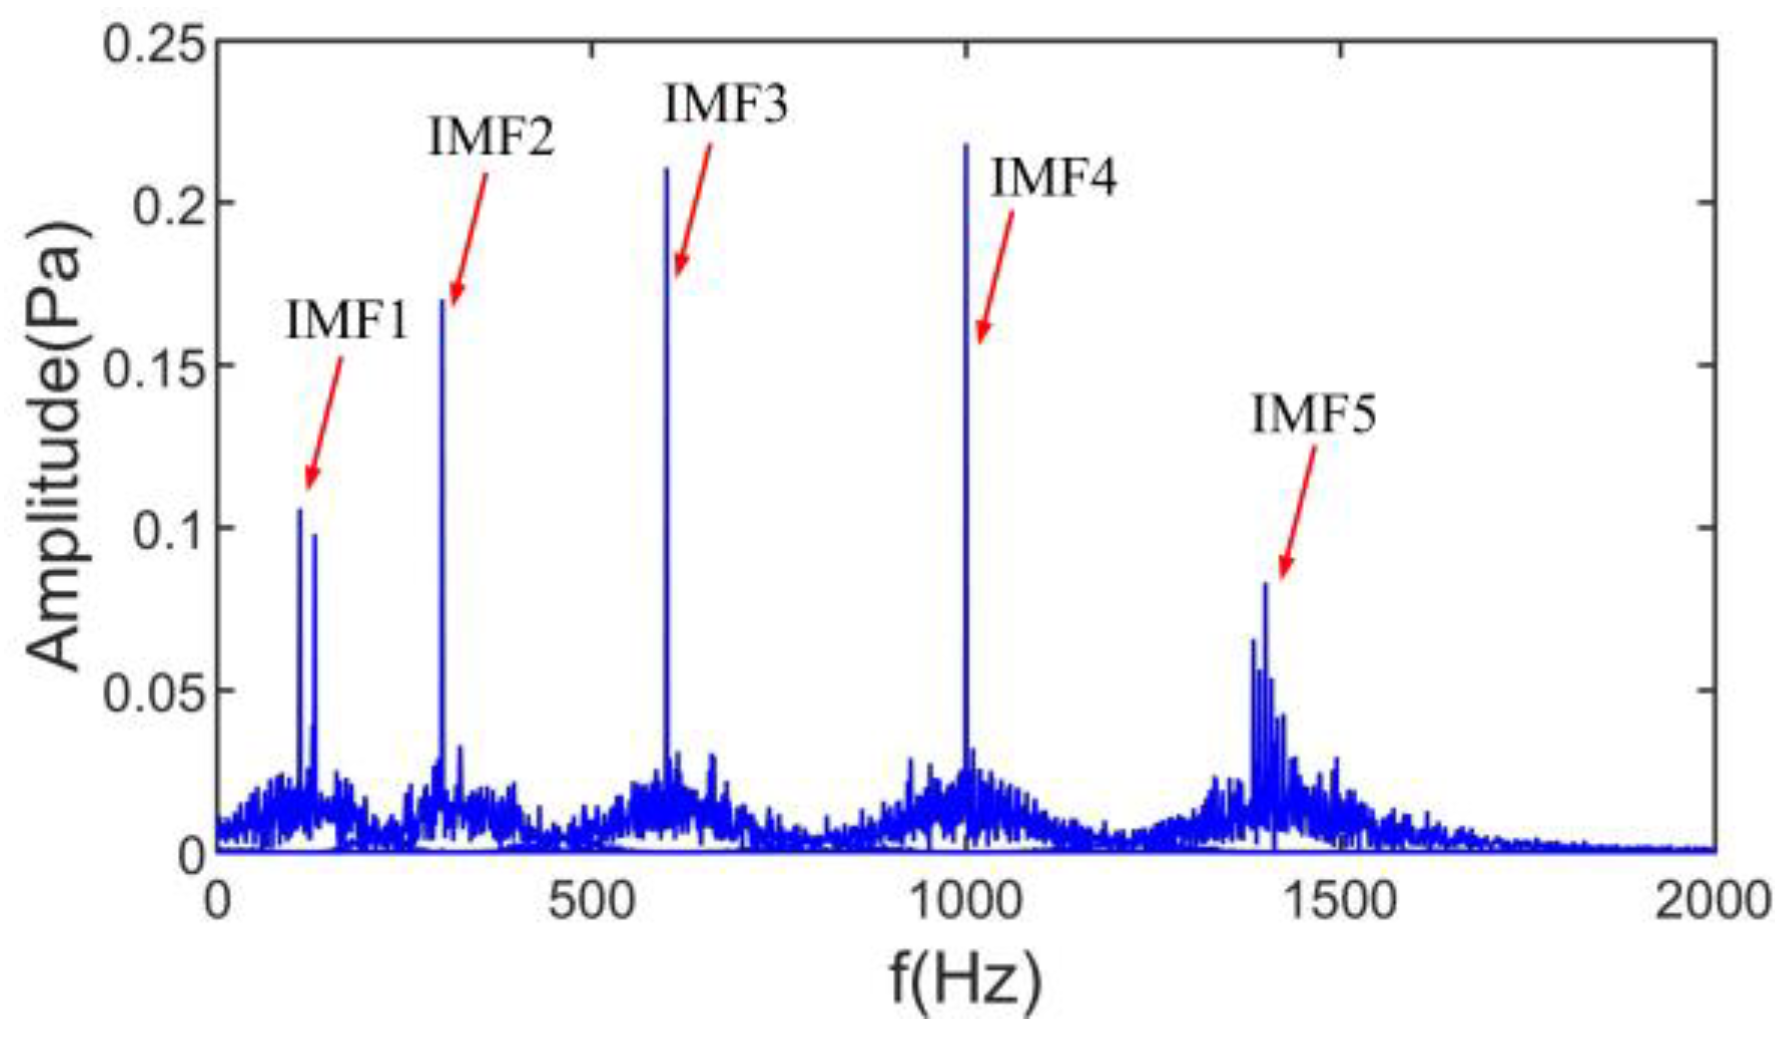
As seen from the spectrum of the ASSME decomposition results in Figure 5, the ASSME obtains the exact number of IMFs, and the IMFs coincide with the corresponding component frequencies in Equation (15).
Figure 6 shows the spectral partitioning results of CSSVMD and CSSEWT. Figure 6a shows that the CSSVMD decomposition number is still very different from the original signal number, even though a larger initial scale parameter has been used. The CSSEWT in Figure 6b contains incorrect segmentations, which will directly lead to large errors in the noise source separation.
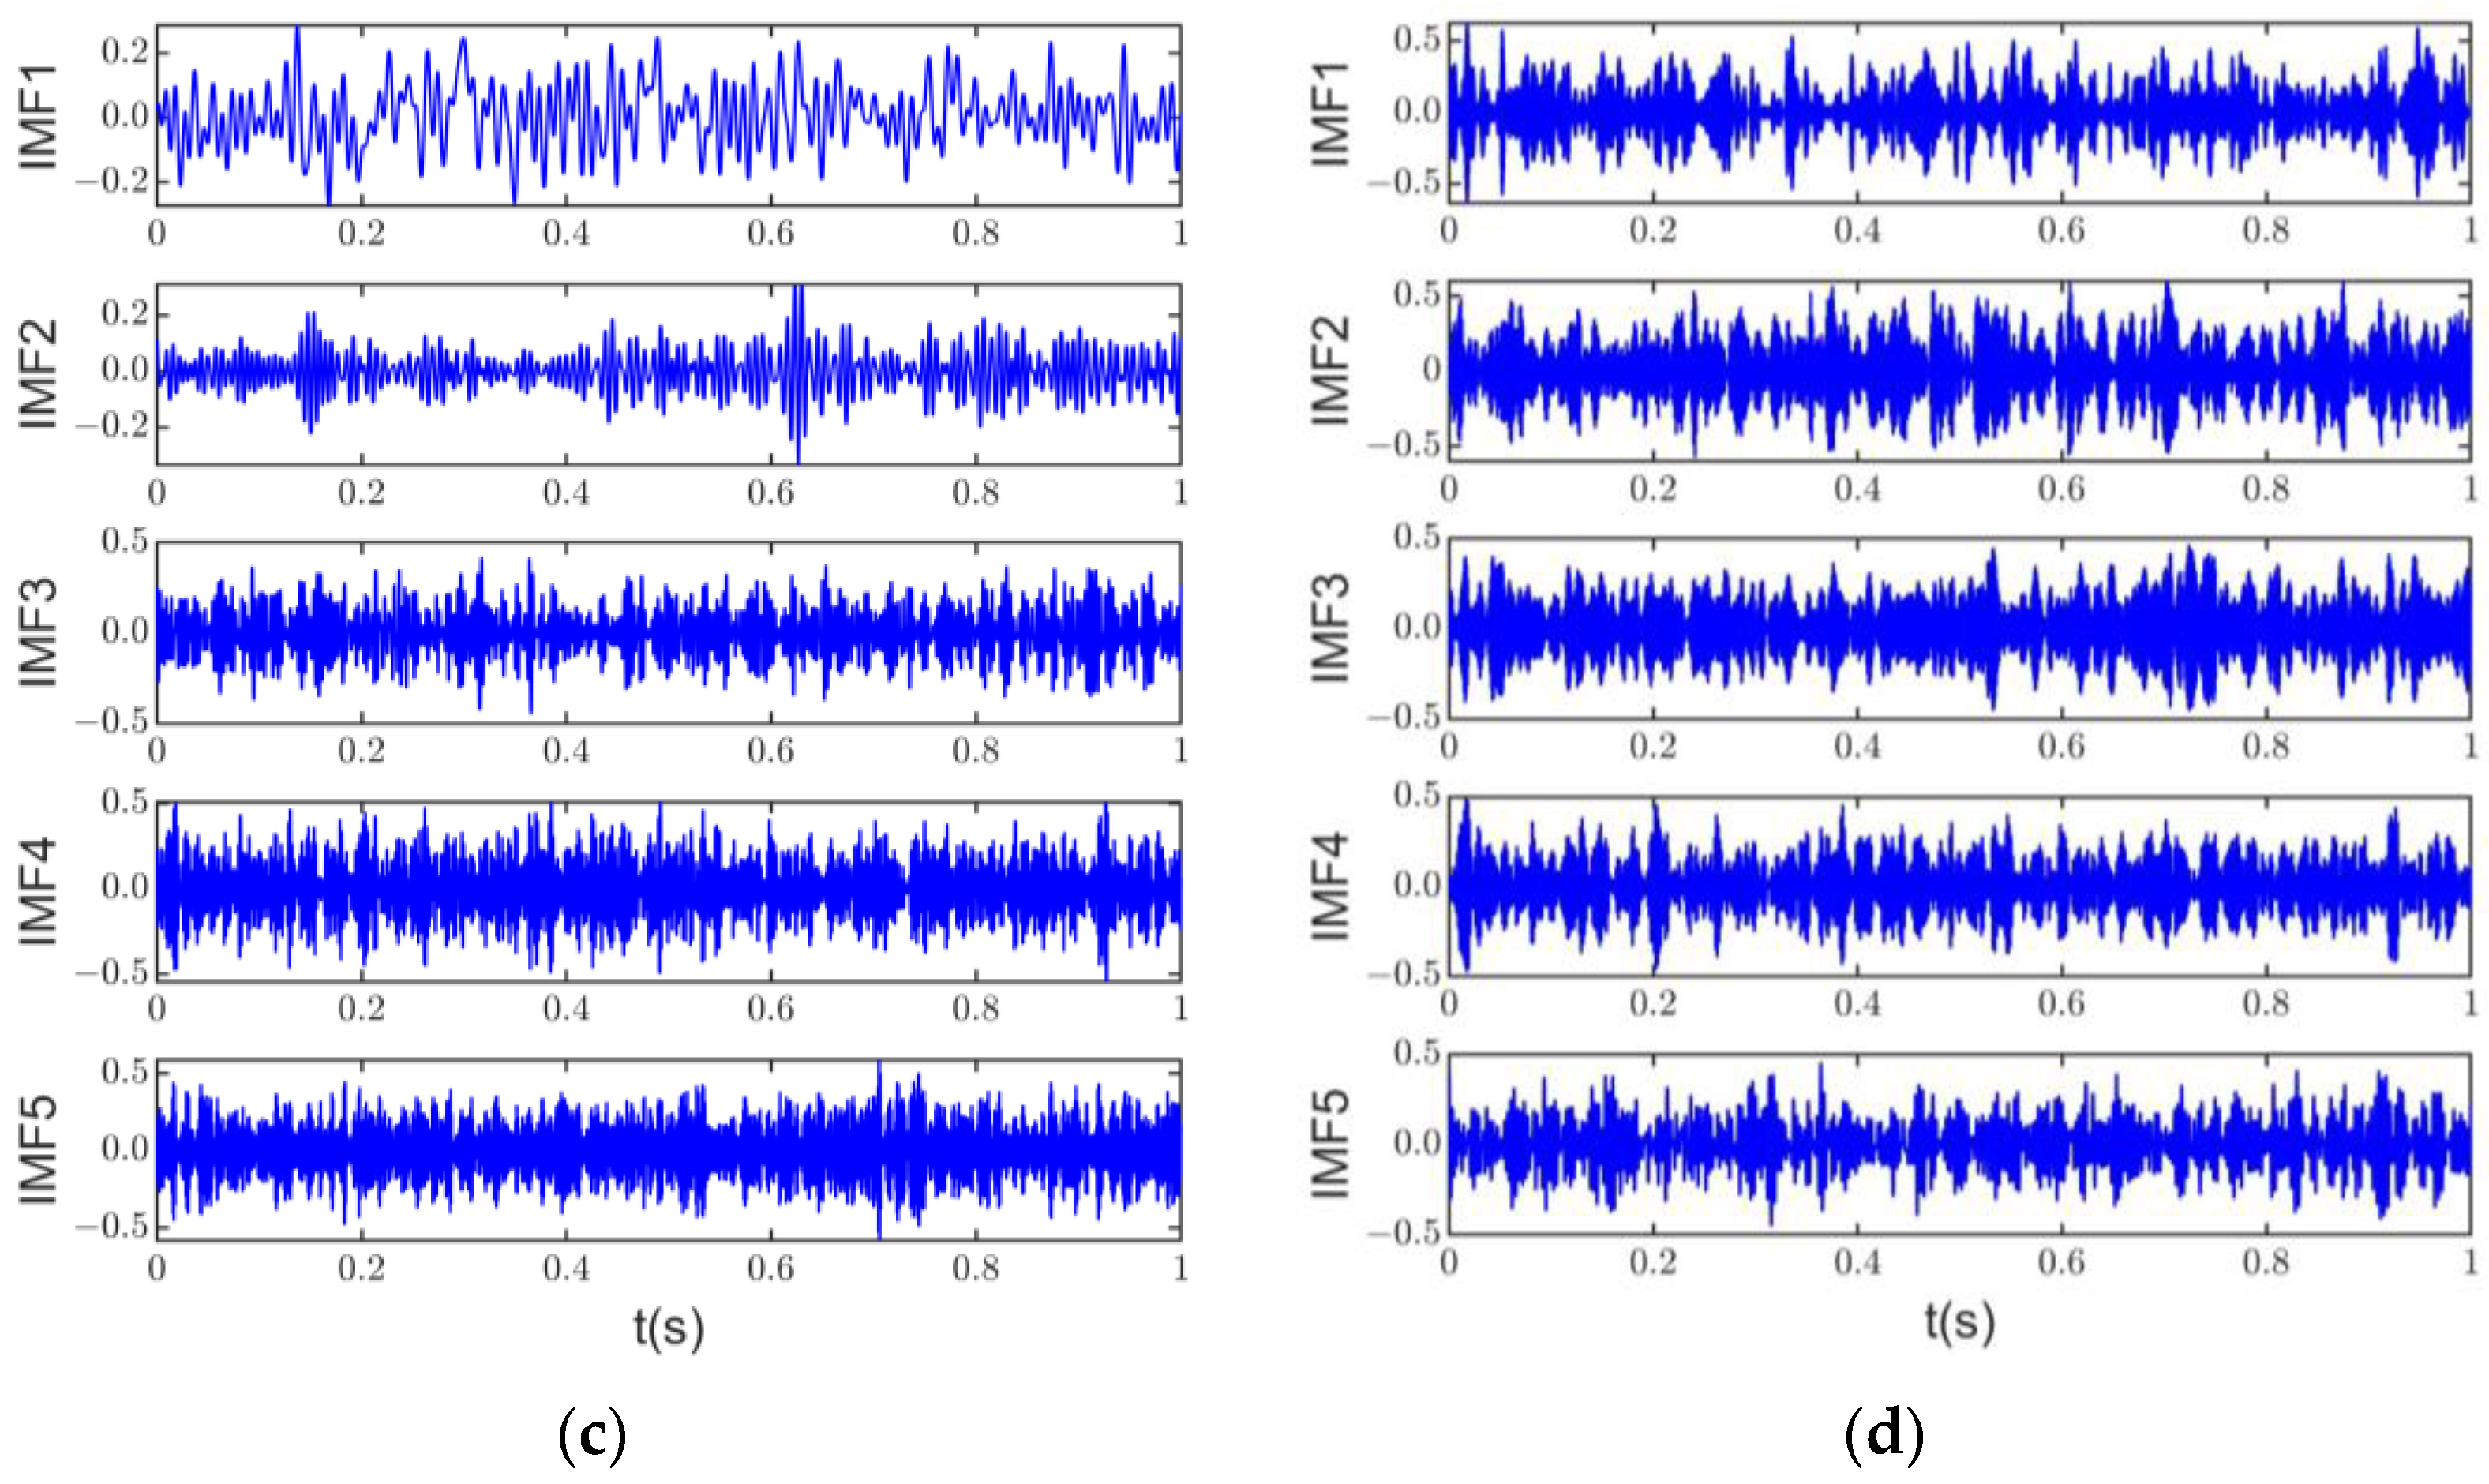
Figure 7a shows the time domain signals of each component of the original signal, and Figure 7b–d show the decomposition results of the original signal by ASSME, CSSEWT, and CSSVMD. In order to observe the results of the method in this article more clearly, s1, s2, and s3 in the original signal time scales and the corresponding IMF time scales in the ASSME results are set to 0.2 s. Figure 7b shows that the exact separation results of the ASSME method are close to the corresponding components of the original signal, satisfactorily preserving the frequency information and waveform. The five IMF time domain signals, with better correlation obtained by CSSVMD, are shown in Figure 7c, and the shocking phenomenon cannot be observed. The CSSEWT decomposition results in Figure 7d also differ significantly from the original signal. In conjunction with Figure 6b, it can be seen that IMF1, IMF2, and IMF5 of CSSEWT are heavily aliased.
Simulation results show that the classical scale space does not perform well in motor noise source separation and cannot correctly distinguish noise signals with complex harmonic and shock components. The classical scale space combined with VMD and EWT algorithms exhibits extensive over-decomposition phenomena and cannot guarantee the validity of the signal. However, signal validity is a prerequisite for the accurate separation and identification of noise sources. The ASSME method avoids the absence of harmonic signals in the smoothing process, and the electromagnetic feature mapping can effectively avoid the occurrence of broadband over-decomposition. Therefore, the ASSME method is more suitable for induction motor noise source separation and identification. The effectiveness of the proposed method will be further verified in the following experiments.

4. Separation and Identification of Induction Motor Noise Source

4.1. Tests and Datasets

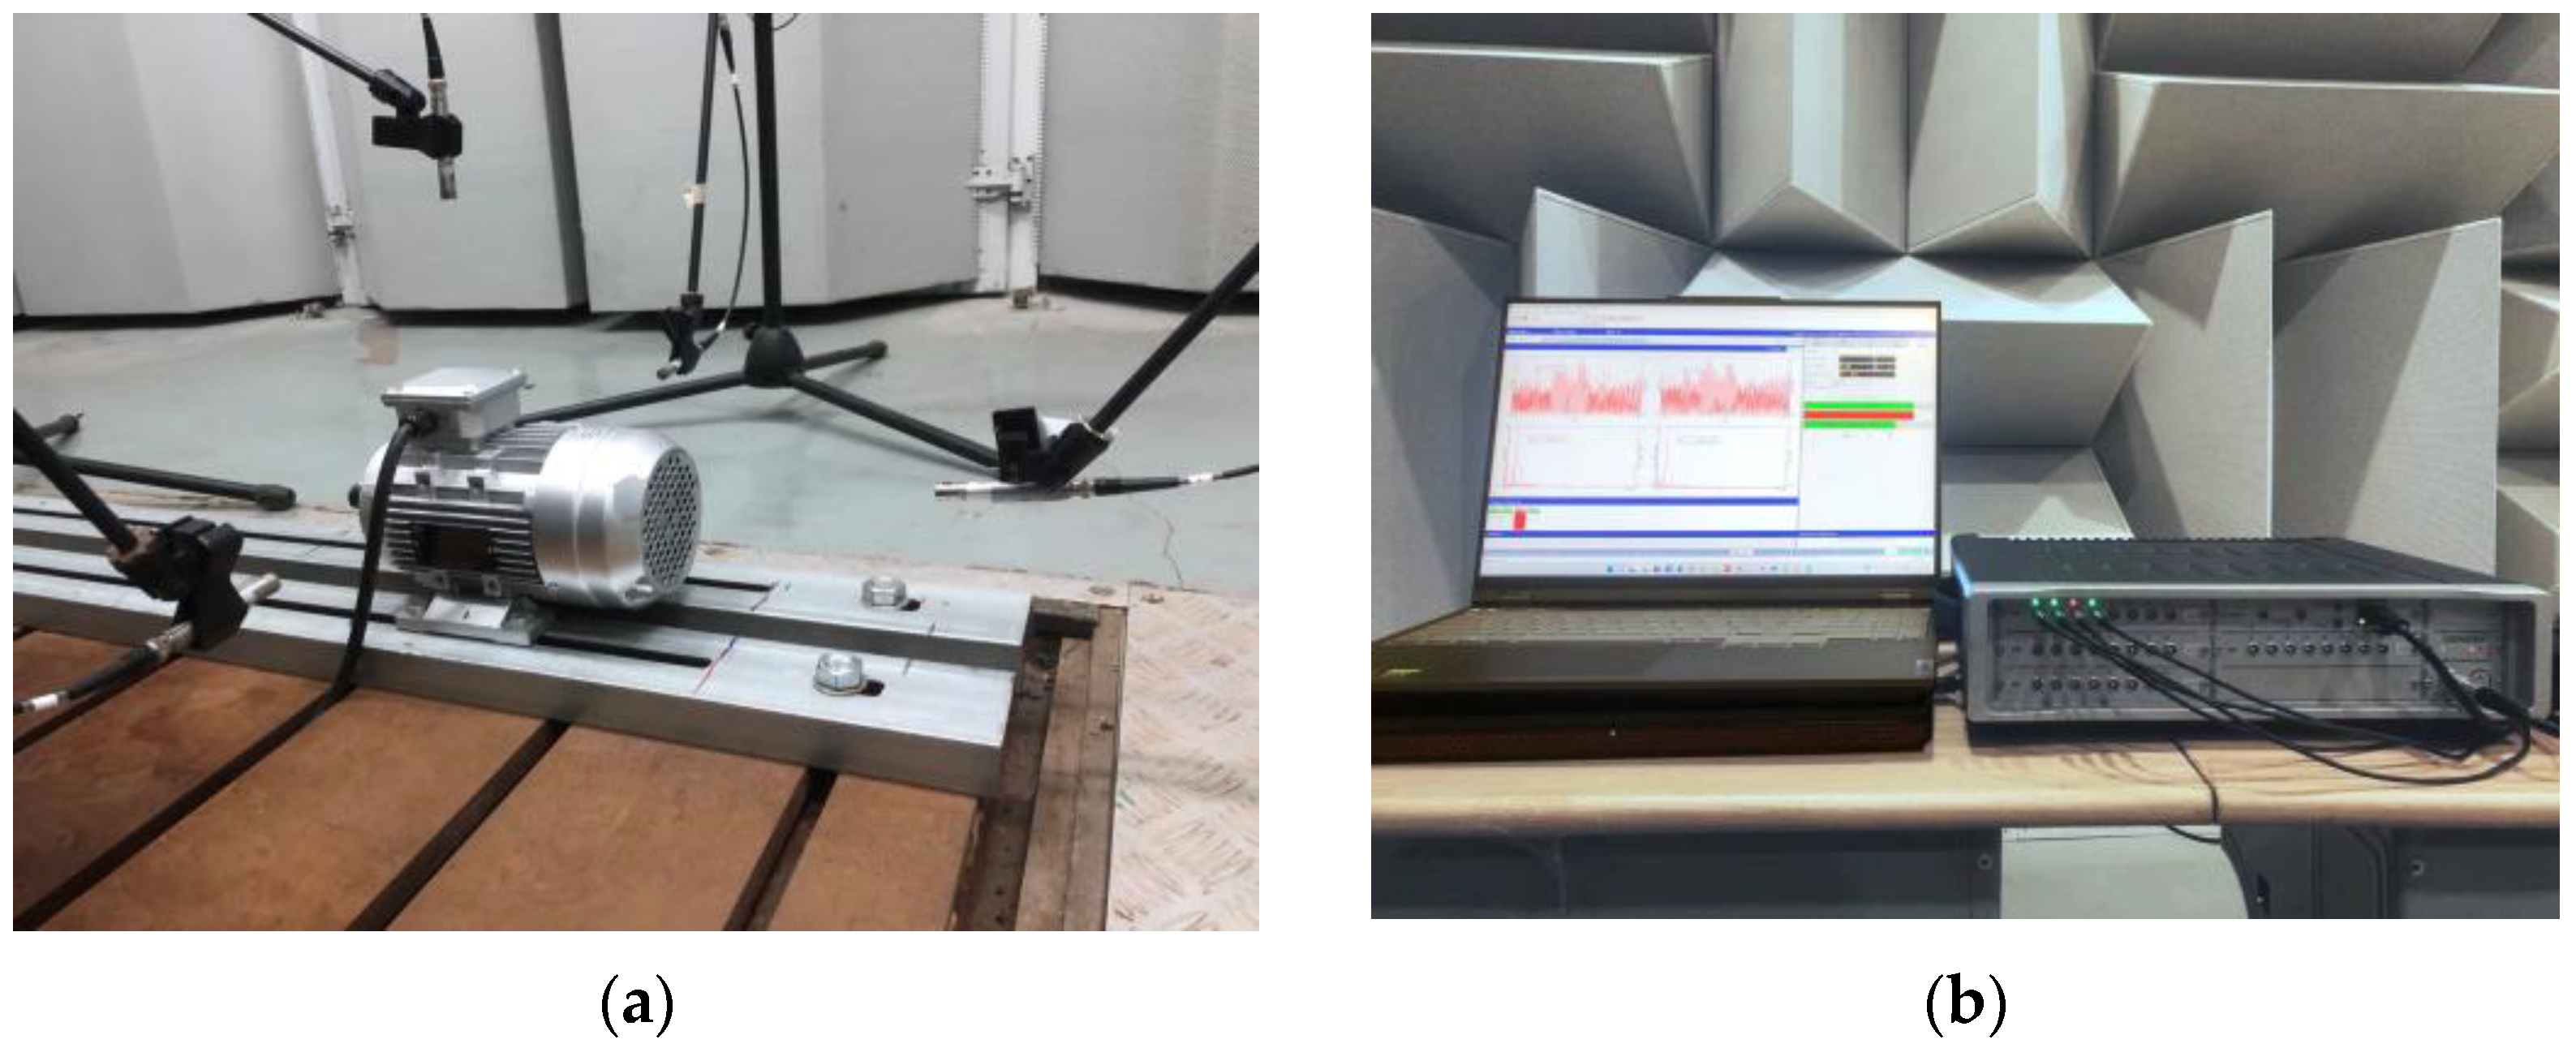
Induction motor noise tests were carried out in a semi-anechoic laboratory. The background noise pressure level is below 20 dBA. The experimental equipment consists of an induction motor, the LMSSCM205 multi-analyzer system, an MPA201 microphone, and a computer, as shown in Figure 8. The test induction motor parameters are shown in Table 1.
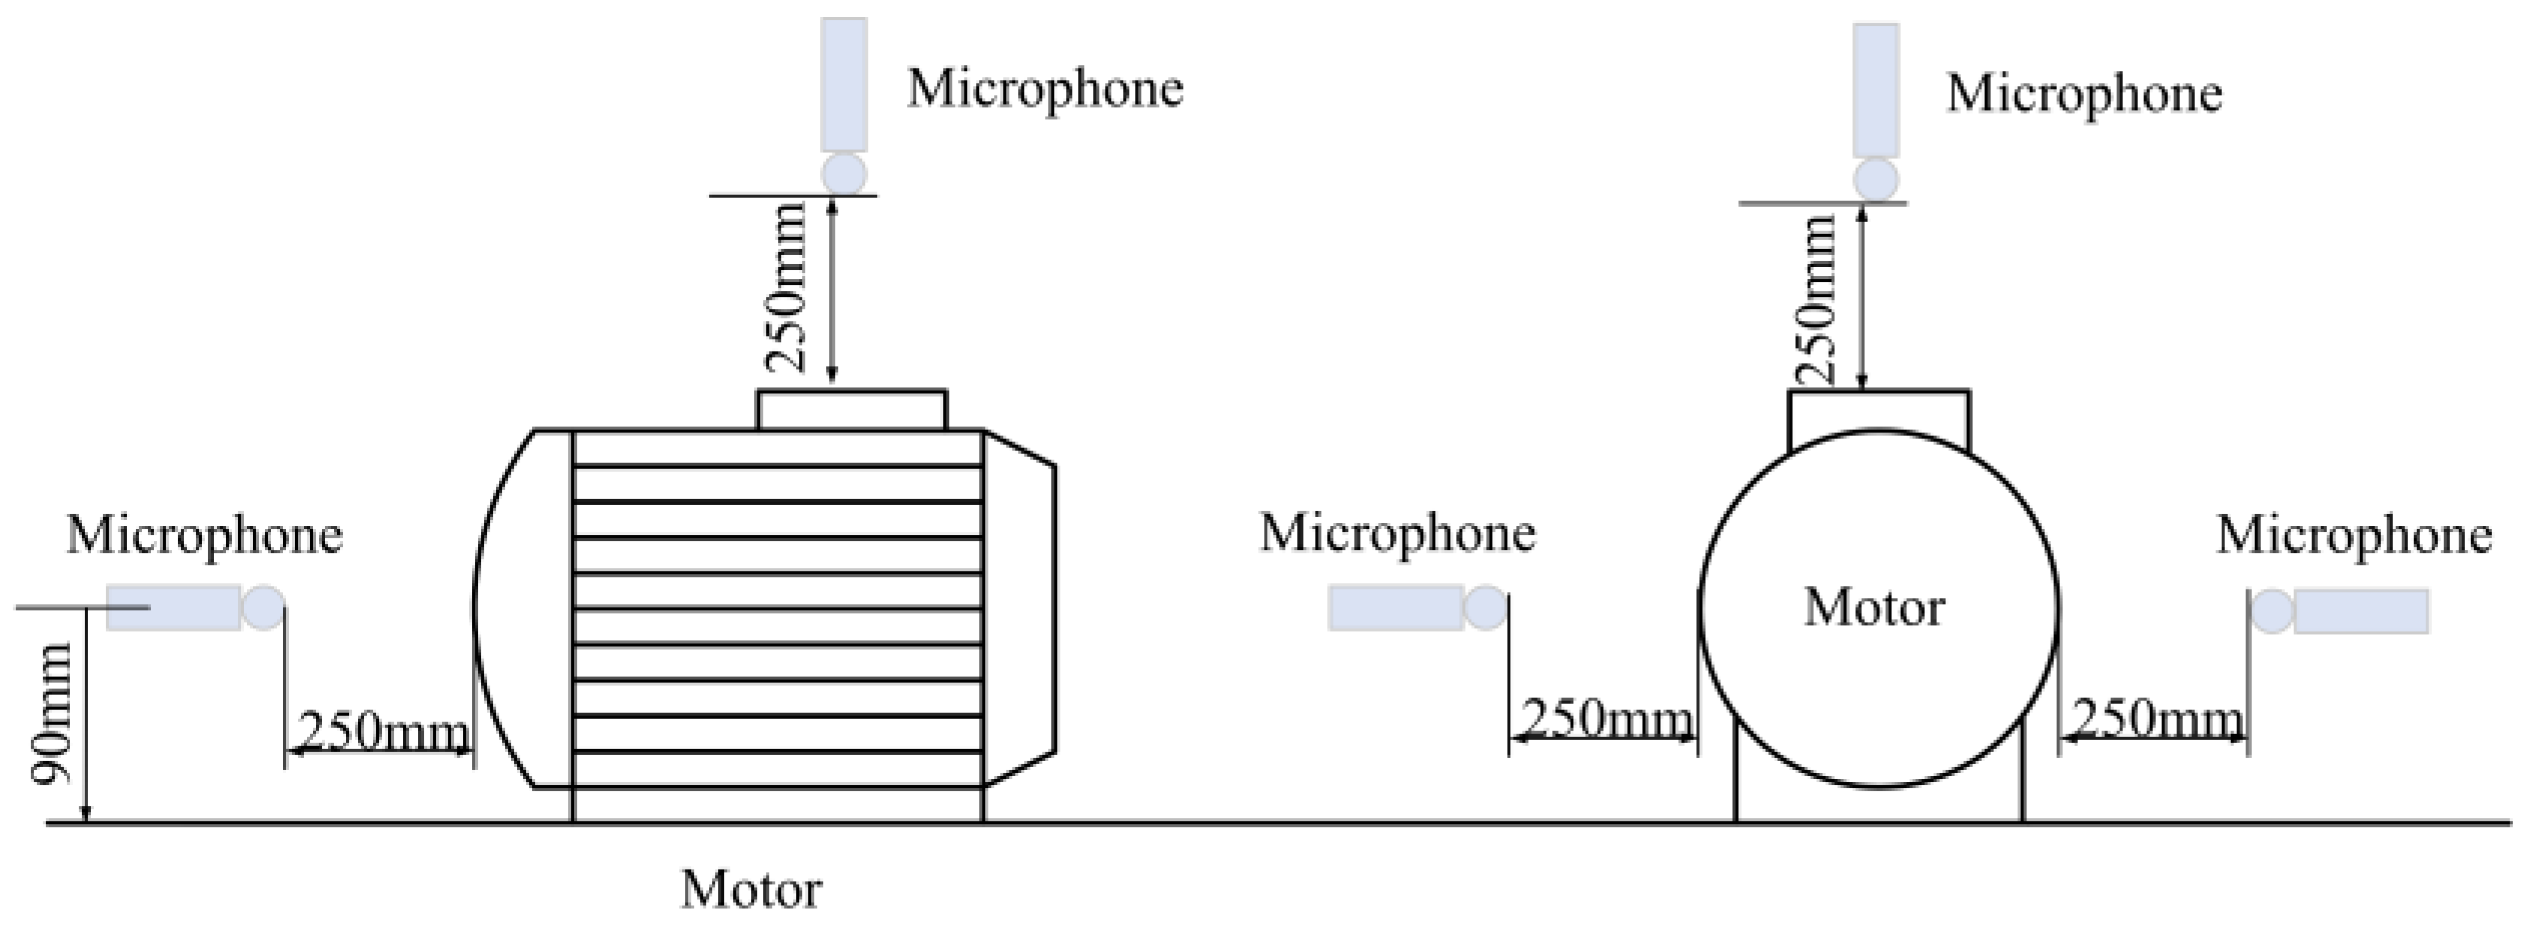
Four microphones were used to sample the signal. One of the microphones was positioned above the motor. Two were positioned on either side of the motor axis, with one behind the fan to distinguish aerodynamic noise. All four microphones were mounted 250 mm away around the motor’s housing. Figure 9 shows the distribution of the microphones.
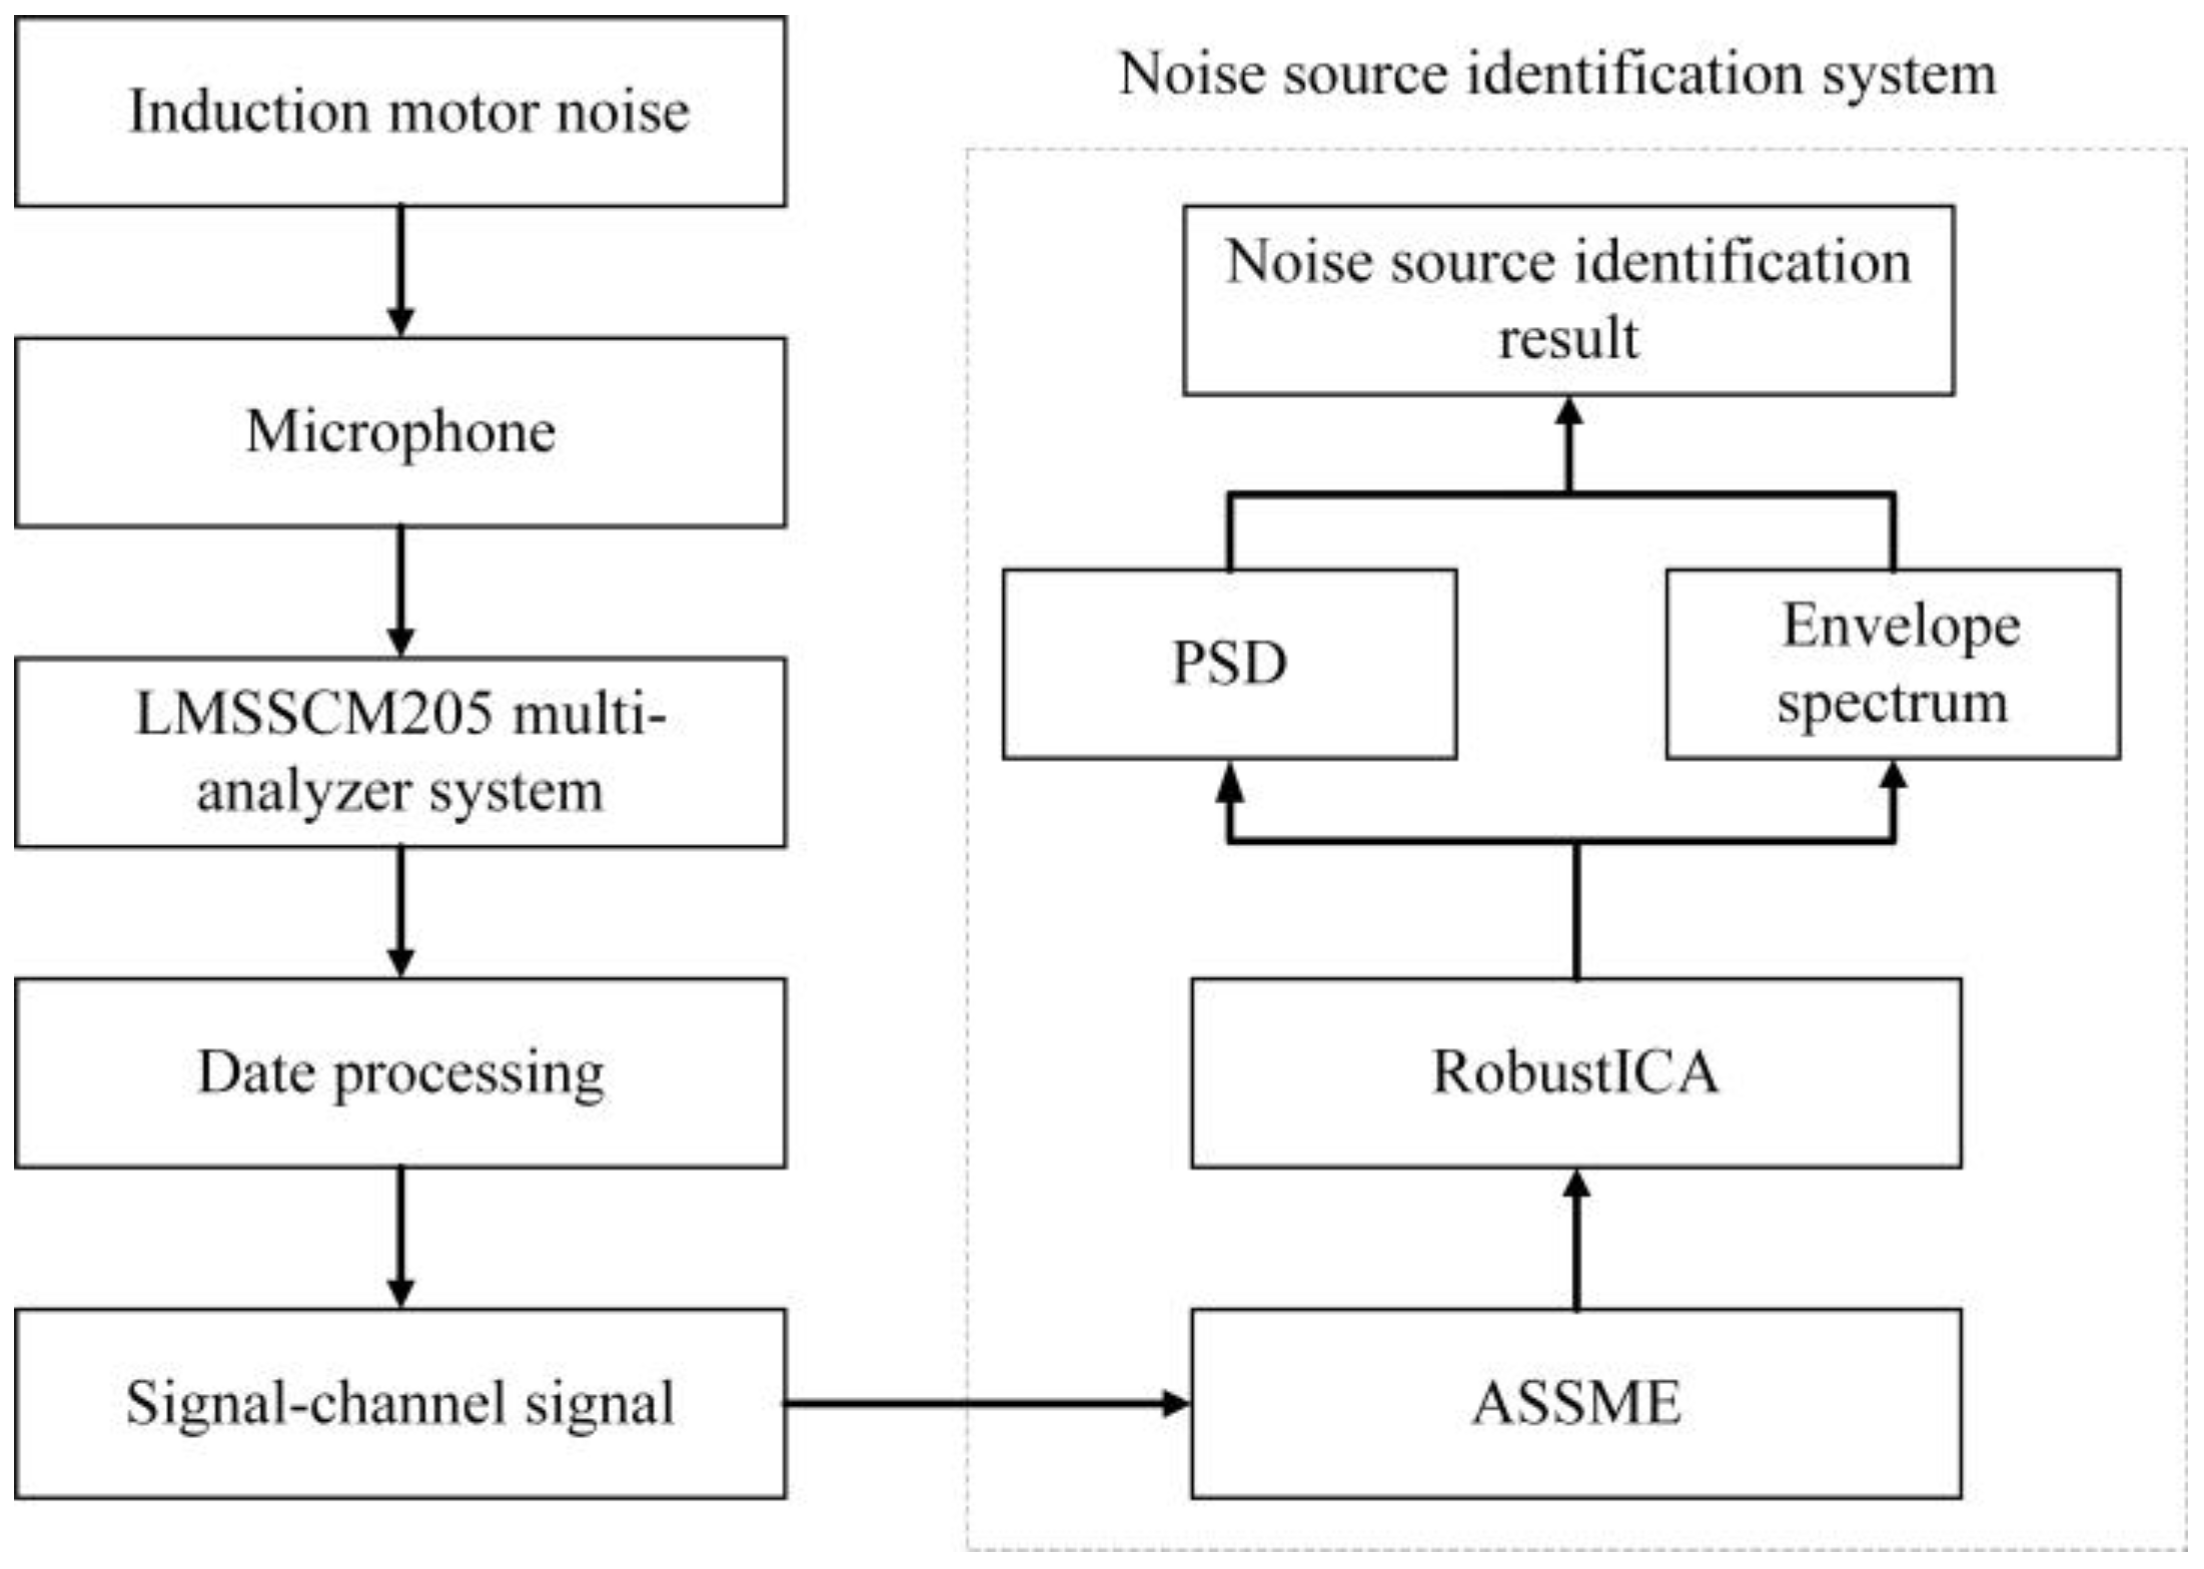
The induction motor ran at no load in the test work, and the slip ratio s was approximated as 0. Once the induction motor speed had stabilized, the noise signal was measured from four microphones with a sampling time of 10 s. The induction motor source decomposition and identification process is shown in Figure 10. The data acquisition system measures the induction motor noise signal through the microphones and uses ASSME to decompose the noise signal into a set of stationary linear and meaningful intrinsic mode components. The validity of the IMF is verified by calculating the correlation coefficient and variance contribution rate between the IMF and the original signal. Independent signal sources are then extracted from the IMF using RobustICA. Finally, the induction motor noise sources are identified using power spectral density analysis and envelope spectrum analysis.

4.2. Date Processing

The mechanical noise of induction motors is typically located in the low-frequency band, according to the existing vibration noise theory, and aerodynamic noise is generally a broad frequency noise of 100–10,000. Meanwhile, there may be low and medium-frequency whistle noise, while the prominent electromagnetic noise is generally in the band below 7000 Hz. Therefore, in order to improve the computational efficiency, this article resamples the signal acquired, intercepts the signal length of 0.5 s, and filters out the meaningless low amplitude frequency band components above 7000 Hz.
In addition, due to the high similarity of the three microphone signals along the housing’s radiation direction, the top and rear microphone data were selected as the test subjects. Although the test was carried out in a semi-anechoic chamber, there was still electromagnetic and other interference. This article eliminated the DC components and trend terms generated during the sampling process to reduce the accumulative error. Figure 11a shows a clear signal offset in the top microphone noise signal. After processing, the signal time domain and the frequency domain signal are shown in Figure 11b,c.
The time and frequency domain information directly above the motor shows high amplitude components throughout the noise’s low, medium, and high-frequency bands. The harmonic of the signal is the main component, but the noise signal may contain shocks and modulations. From the information in Figure 11, the noise source of the induction motor cannot be analyzed directly from the time and frequency domain information alone. Therefore, further separation and identification of the noise source are necessary.

4.3. Noise Source Separation and Identification

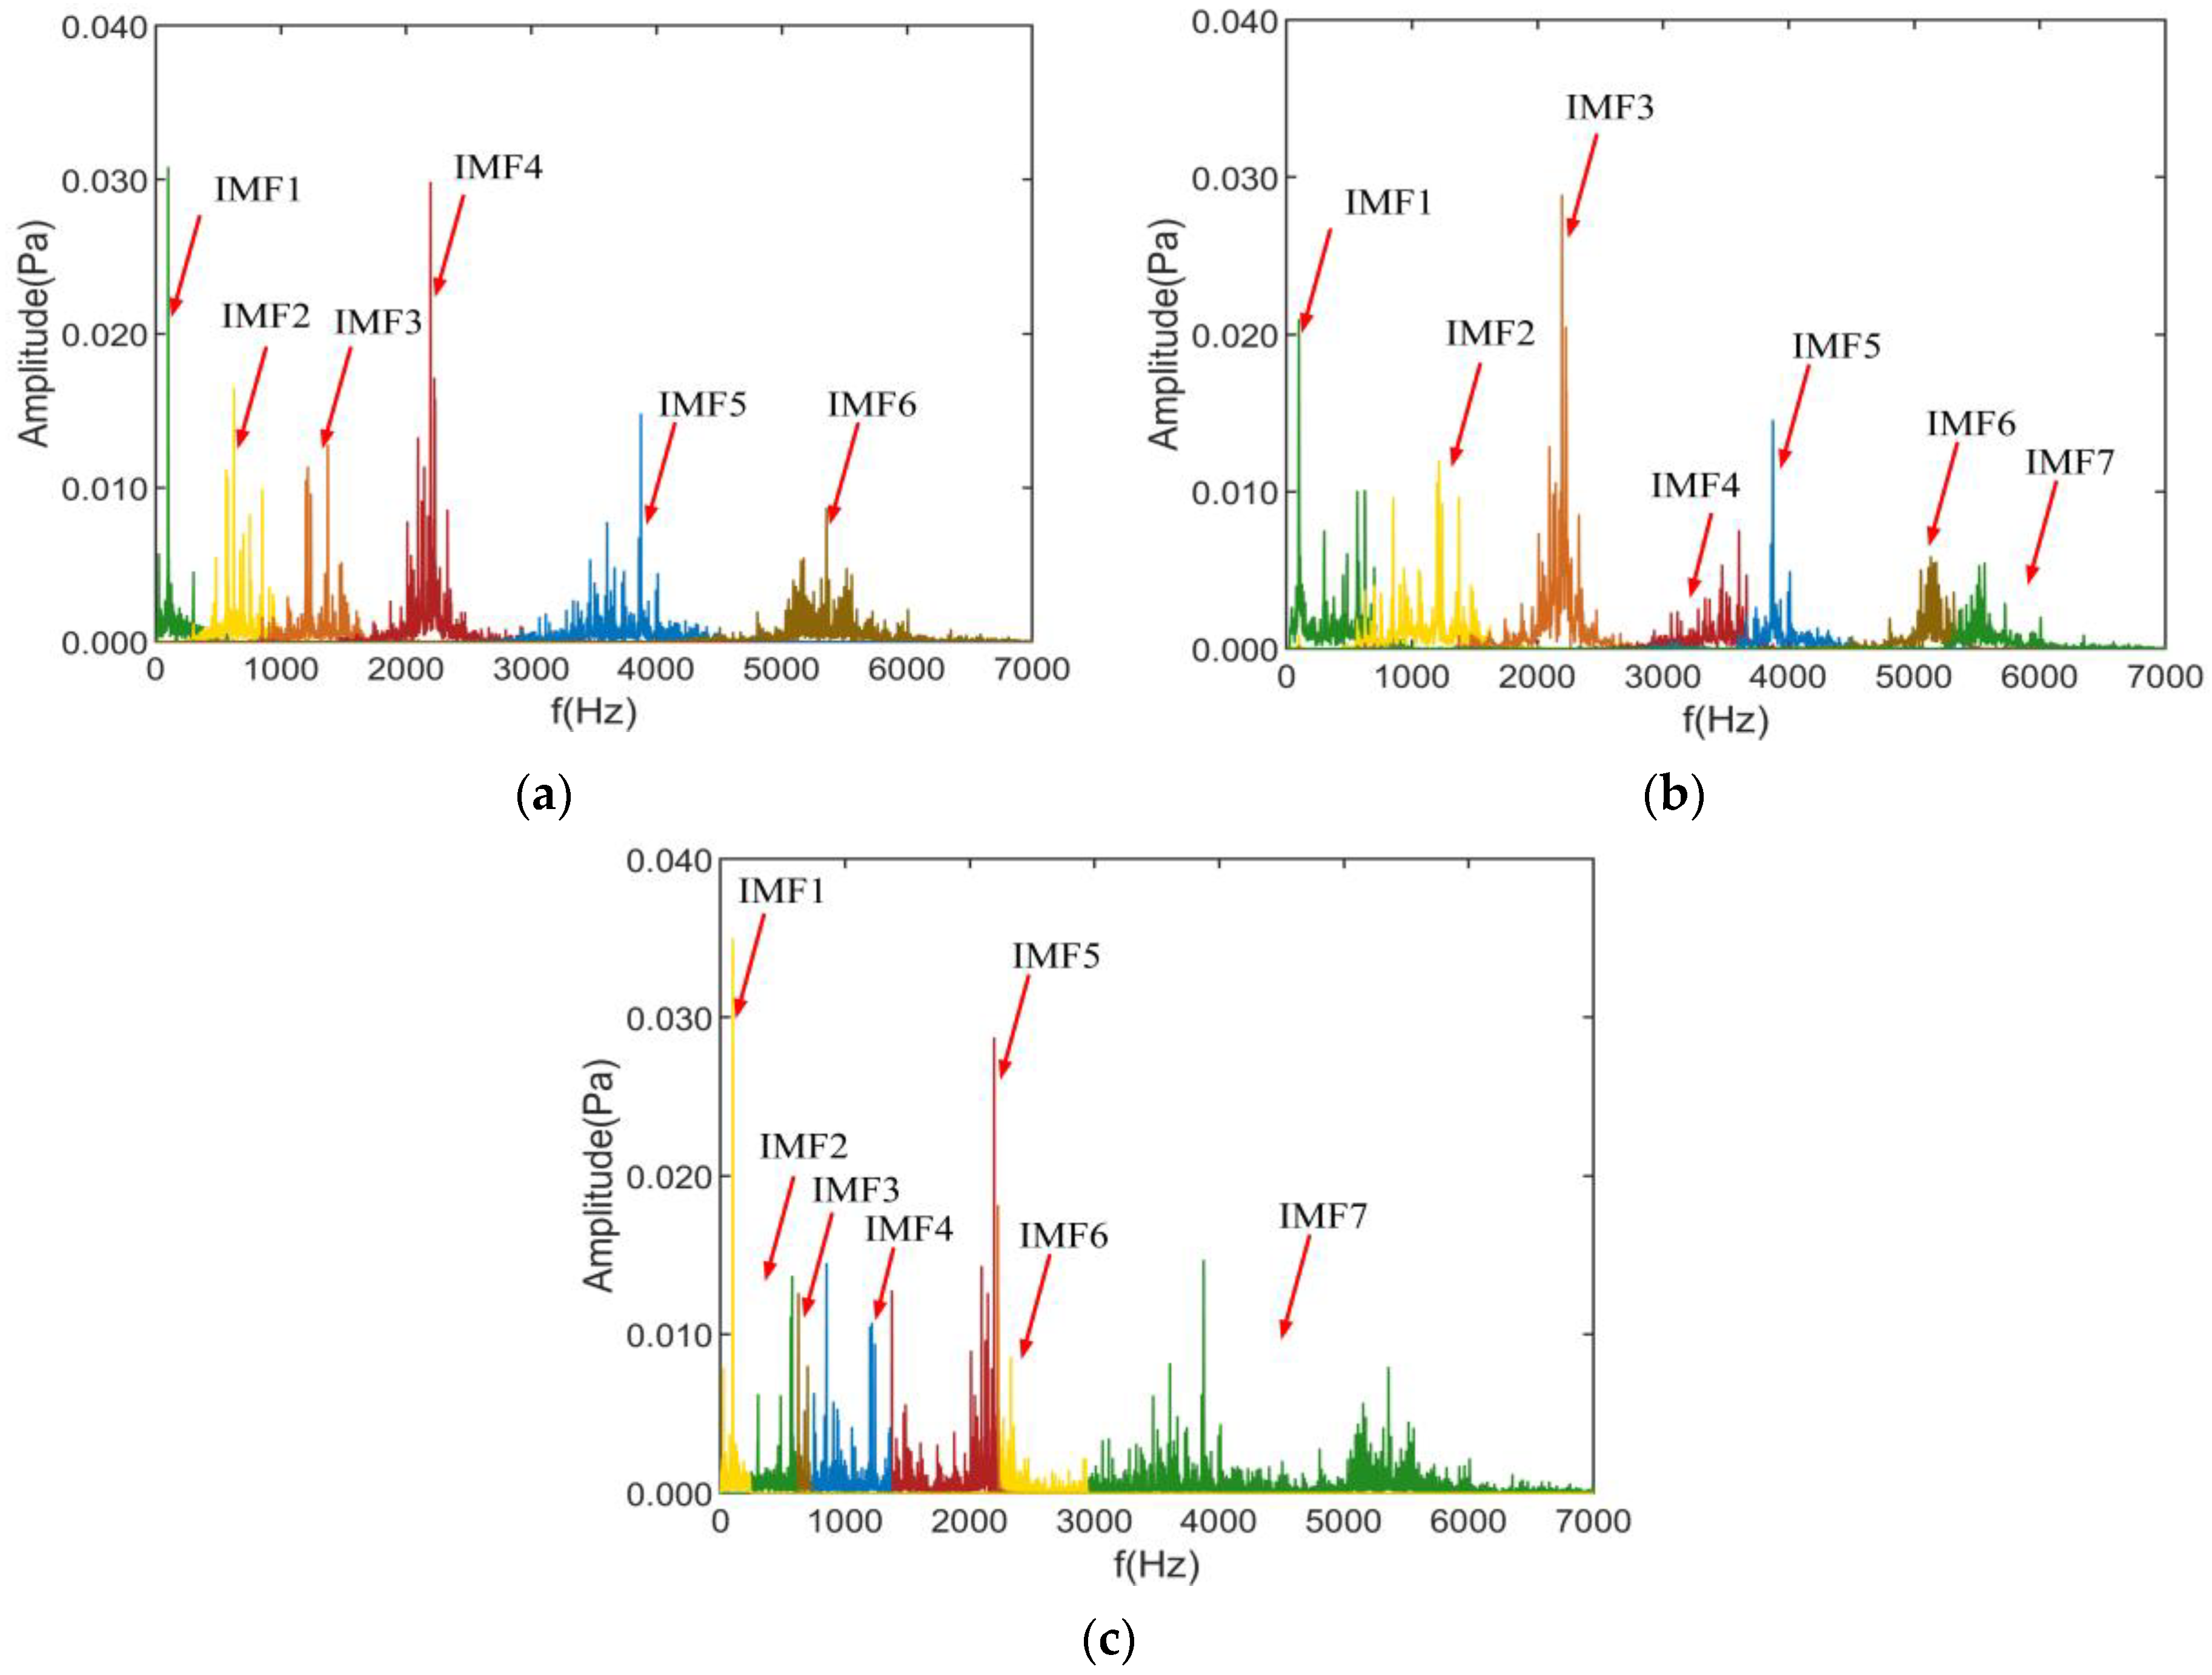
In noise source separation and identification, first, the modal extraction of the noise source is performed using ASSME, and six modal components are obtained, whose frequency domain is shown in Figure 12a. To further compare the separation effect of the ASSME method in actual motor noise, the decomposition results of the CSSVMD and CSSEWT methods are shown in Figure 12b,c.
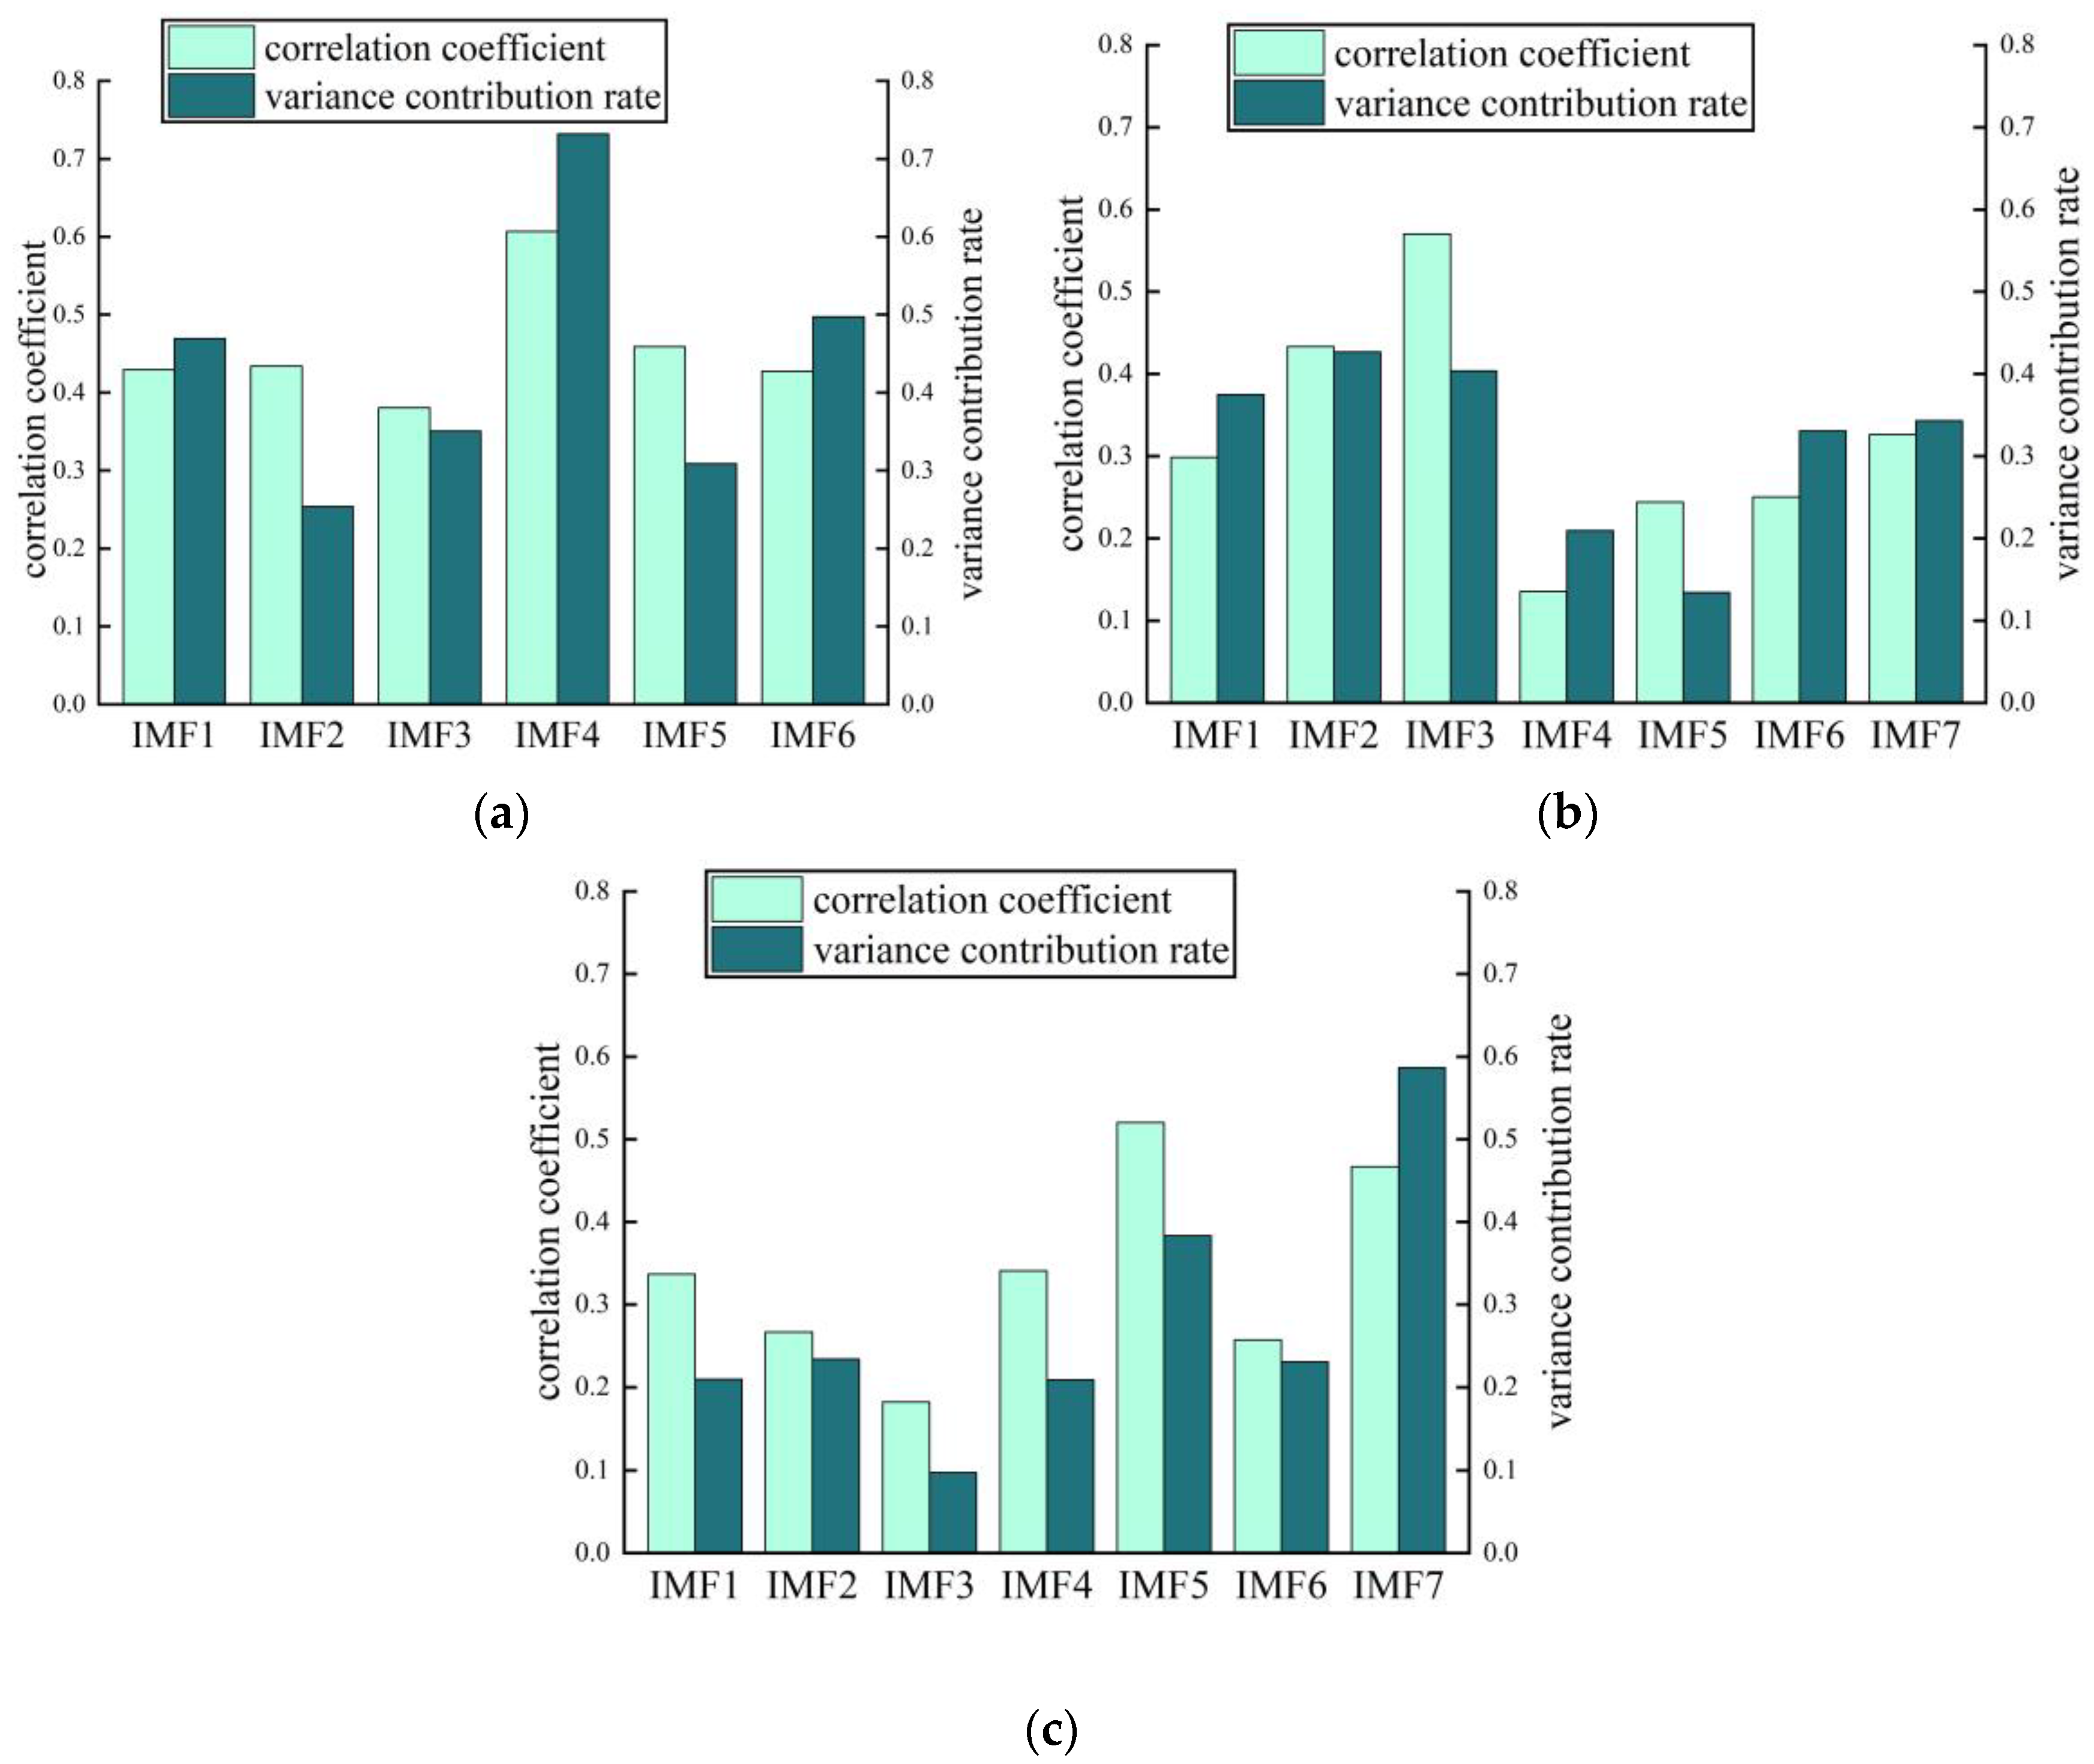
As can be seen from Figure 12, the ASSME method decomposes the original signal into 6 IMFs, and the number of IMFs obtained by CSSVMD and CSSEWT is 7. The IMF components obtained by the ASSME method retain the characteristics of the original signal intact, and no over-decomposition or aliasing occurs. The decomposition results of the CSSVMD method deviated from the original signal and showed modal aliasing due to the single penalty factor. However, the CSSEWT method still provided incorrect segmentation results. To further analyze the validity of the IMF components obtained by the three methods, the correlation coefficients and variance contribution rates of the decomposition results as shown in Figure 13.
The correlation coefficient indicates the degree of correlation between IMF and the original signal, and the variance contribution rate can indicate the degree of influence of each component on the original signal. The IMF1-IMF6 correlation coefficients in Figure 13a are 0.4294, 0.4341, 0.3808, 0.607, 0.459, and 0.4275, respectively, which have good correlation and high variance contribution rate levels, indicating significant sensitive information that cannot be ignored. In Figure 13b, The correlation coefficients of IMF1, IMF4, IMF5, and IMF6 in the CSSVMD decomposition results are below 0.3, which are weakly correlated with the original signal. In Figure 13c, The correlation coefficients of IMF2, IMF3, and IMF6 in CSSEWT are below 0.3, and the variance contribution rate of IMF3 is below 0.1. In summary, the decomposition results of the ASSME method proposed in this article are superior.
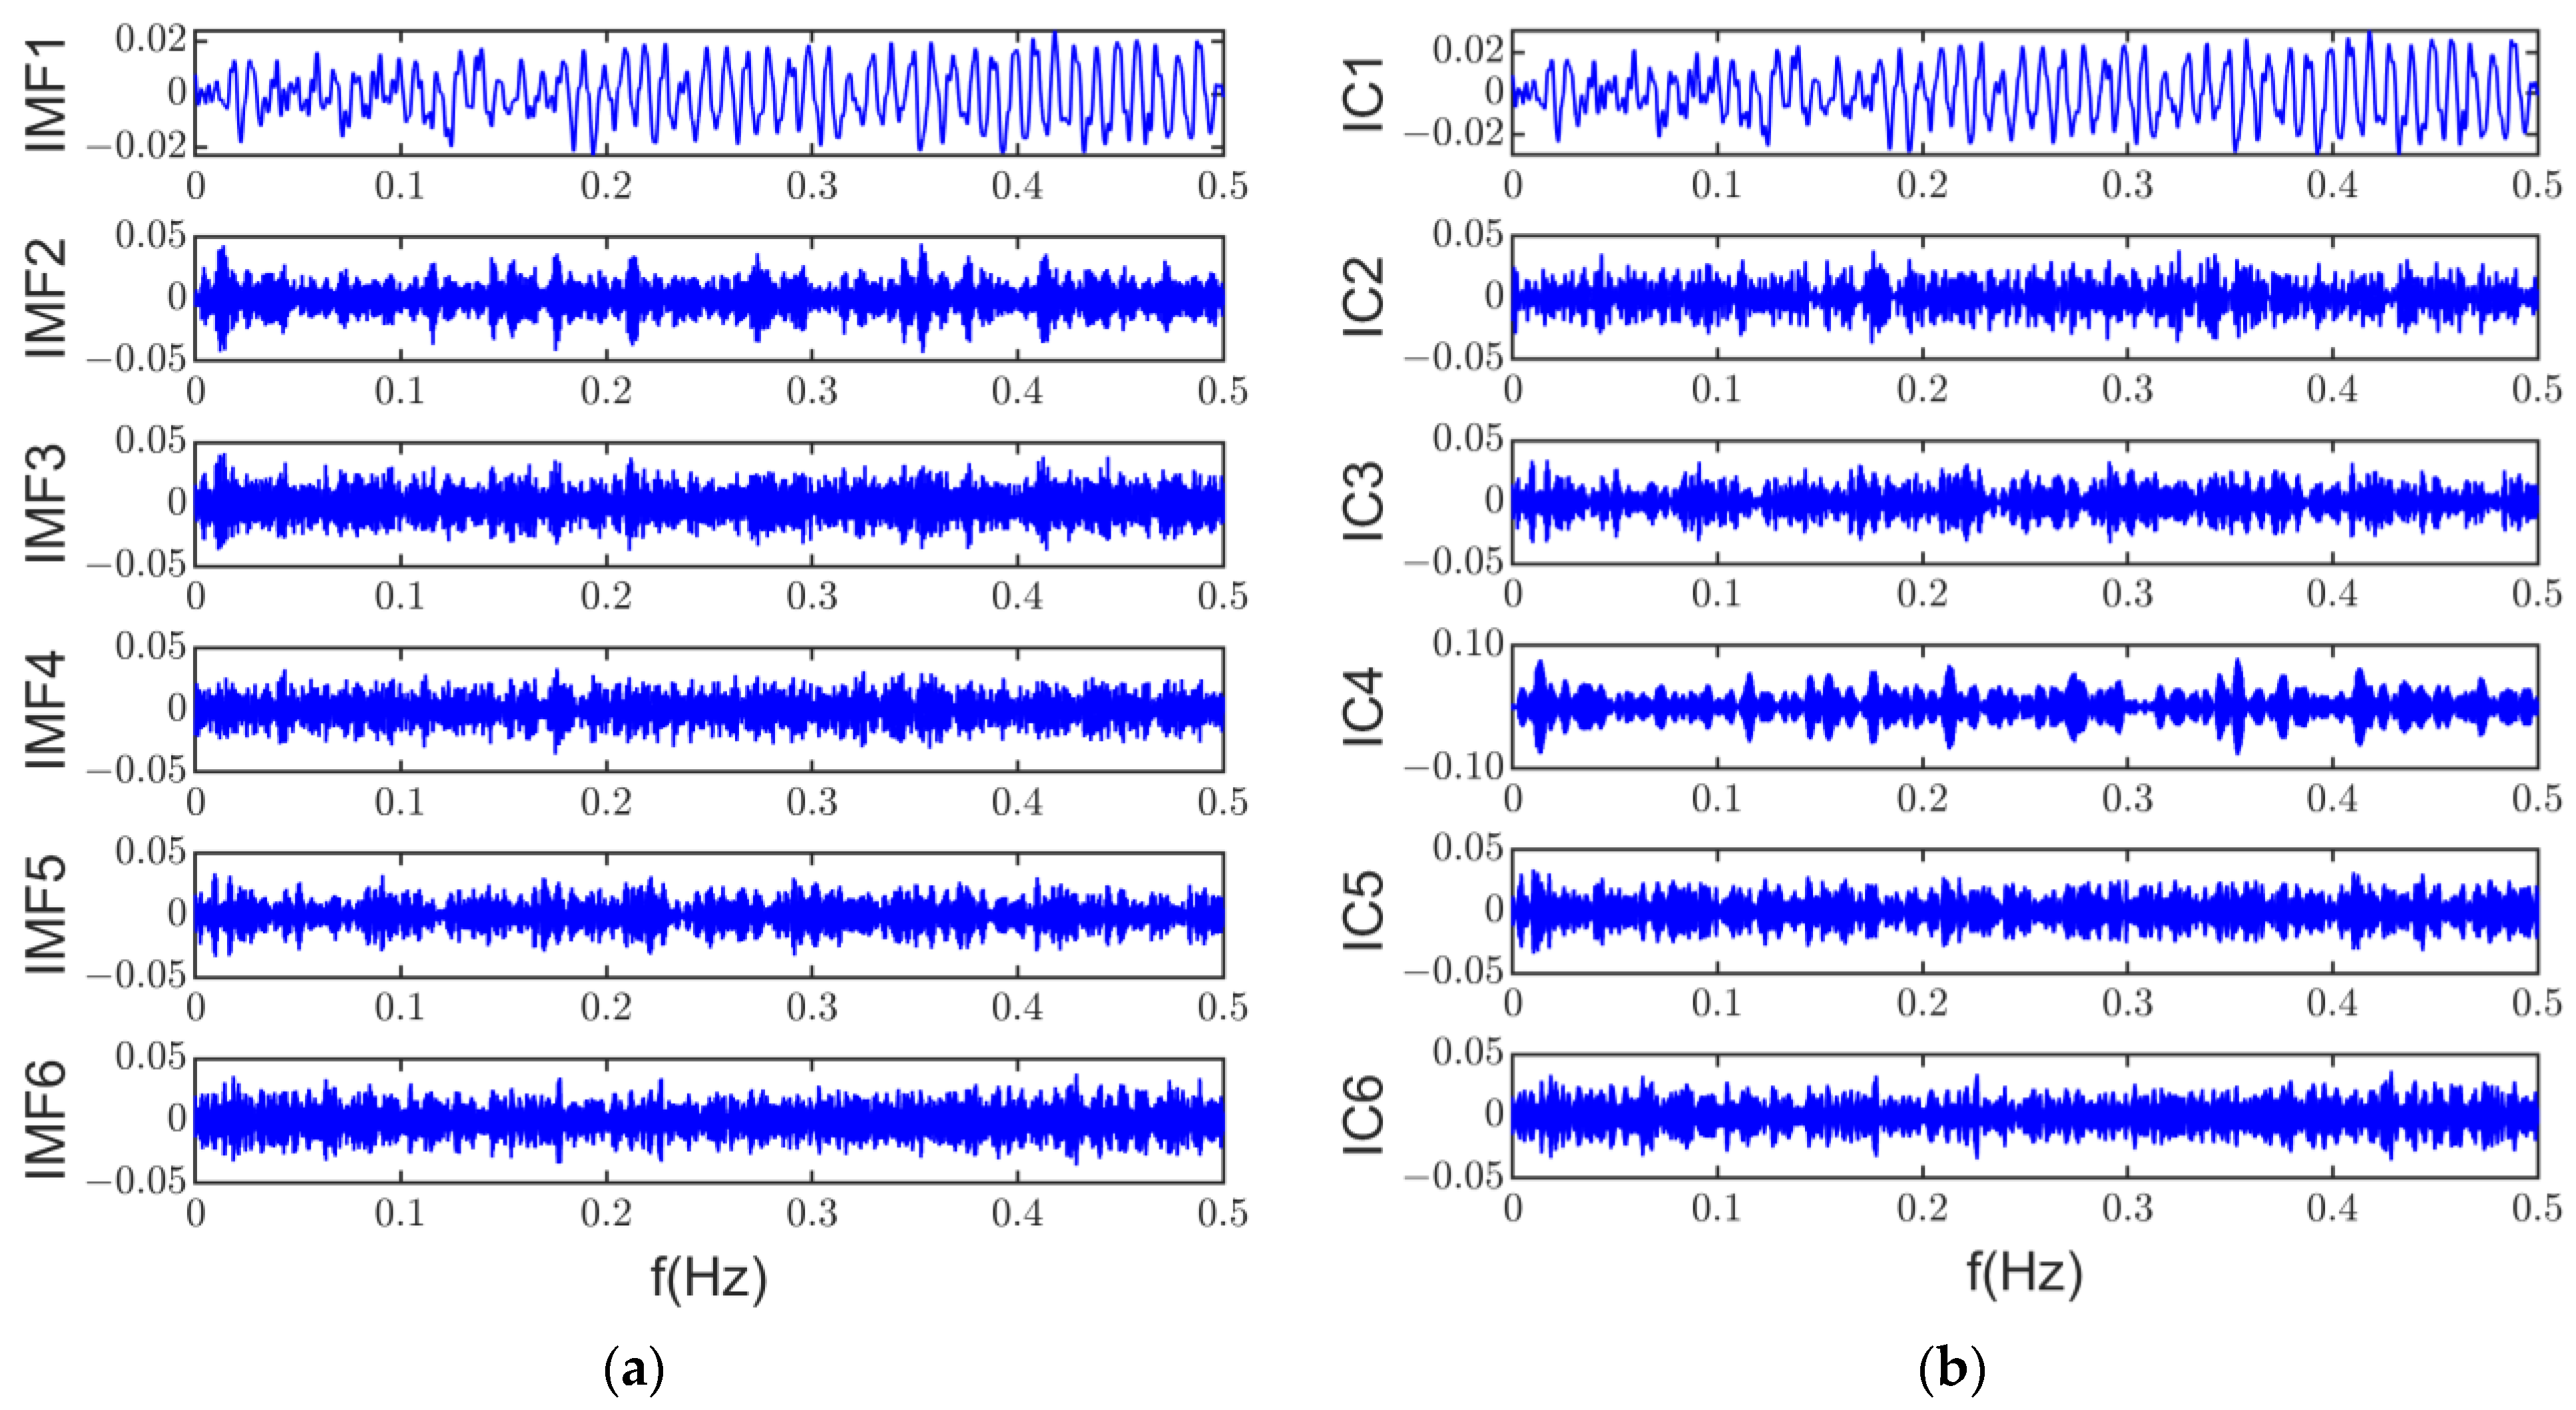
Due to the periodic nature of electromagnetic noise in time and spatial distribution, with most of the noise from the coupled vibration by motor housing, it is challenging to achieve over-determined or well-posed blind source separation. However, The ASSME method can obtain six accurate and reliable IMF components to construct multi-channel inputs. The multi-channel input signals are shown in Figure 14a. Using robust independent component analysis, the underdetermined blind source separation can be performed at a single microphone signal. Figure 14b shows the independent components extracted by RobustICA.
According to the basic principles of ICA, each of the signal components in the blind source separation results in Figure 14b is likely to be a major source of noise in the induction motor. Since induction motor noise may suffer from frequency overlap of different noise sources and modulations, this article uses power spectral density and envelope spectra to analyze these independent components and their characteristic excitations.
The power spectral density of IC1 is shown in Figure 15a. The main frequency component in IC1 is 100 Hz, and its amplitude is the largest in the ICs. the pole pair number of the test induction motor is 2. Therefore, the force wave frequency of the alternating part of the radial electromagnetic force, which is generated by the fundamental flux density, is twice the fundamental frequency of the motor. The flux density of this part of the alternating air gap usually generates a larger radial electromagnetic force. The results of the power spectral density show that IC1 has no significant modulation from the low-frequency characteristic. Thus IC1 is the radial electromagnetic noise generated by the fundamental flux density.
The power spectrum density of IC2 in Figure 15b shows that the main frequency of IC2 is 2125Hz with the sideband. Its frequency is close to the 3rd-order radial electromagnetic noise. However, the axial air channel number Nd = 85 and the rotational frequency ω m = 25 Hz. The pure tone frequency of axial ventilation f r d = k N d ω m = 2125 Hz, so IC2 may be aerodynamic noise, which needs to be combined with the rear microphone of IC2 for analysis.
From the electromagnetic noise characteristics, the radial electromagnetic force is generated mainly by the noise along the radial radiation of the housing, so the motor to the rear of the radiation noise produces mainly aerodynamic noise. Figure 16a shows the rear microphone power spectral density in the entire frequency band, which does not contain any other noise components except for IC2. In addition, the IC2 envelope spectrum in Figure 16b shows the presence of the characteristic frequency of IC2 at 25Hz and its multiples. Thus, IC2 is the aerodynamic noise.
Among the factors that cause radial electromagnetic force noise in induction motors, the air-gap flux density harmonics generated by the stator and rotor interaction are an important component. The stator harmonics order v = n1z1/p ± 1, the number of rotor harmonics u = n2z2/p ± 1, where n1, n2 = ±1, ±2, ±3 ···, the radial electromagnetic force order r = (u + v)p, and the frequency of this radial electromagnetic force fr = n2z2f1 (1 − s)/p, or fr = n2z2f1 (1 − s)/p ± 2 f1.
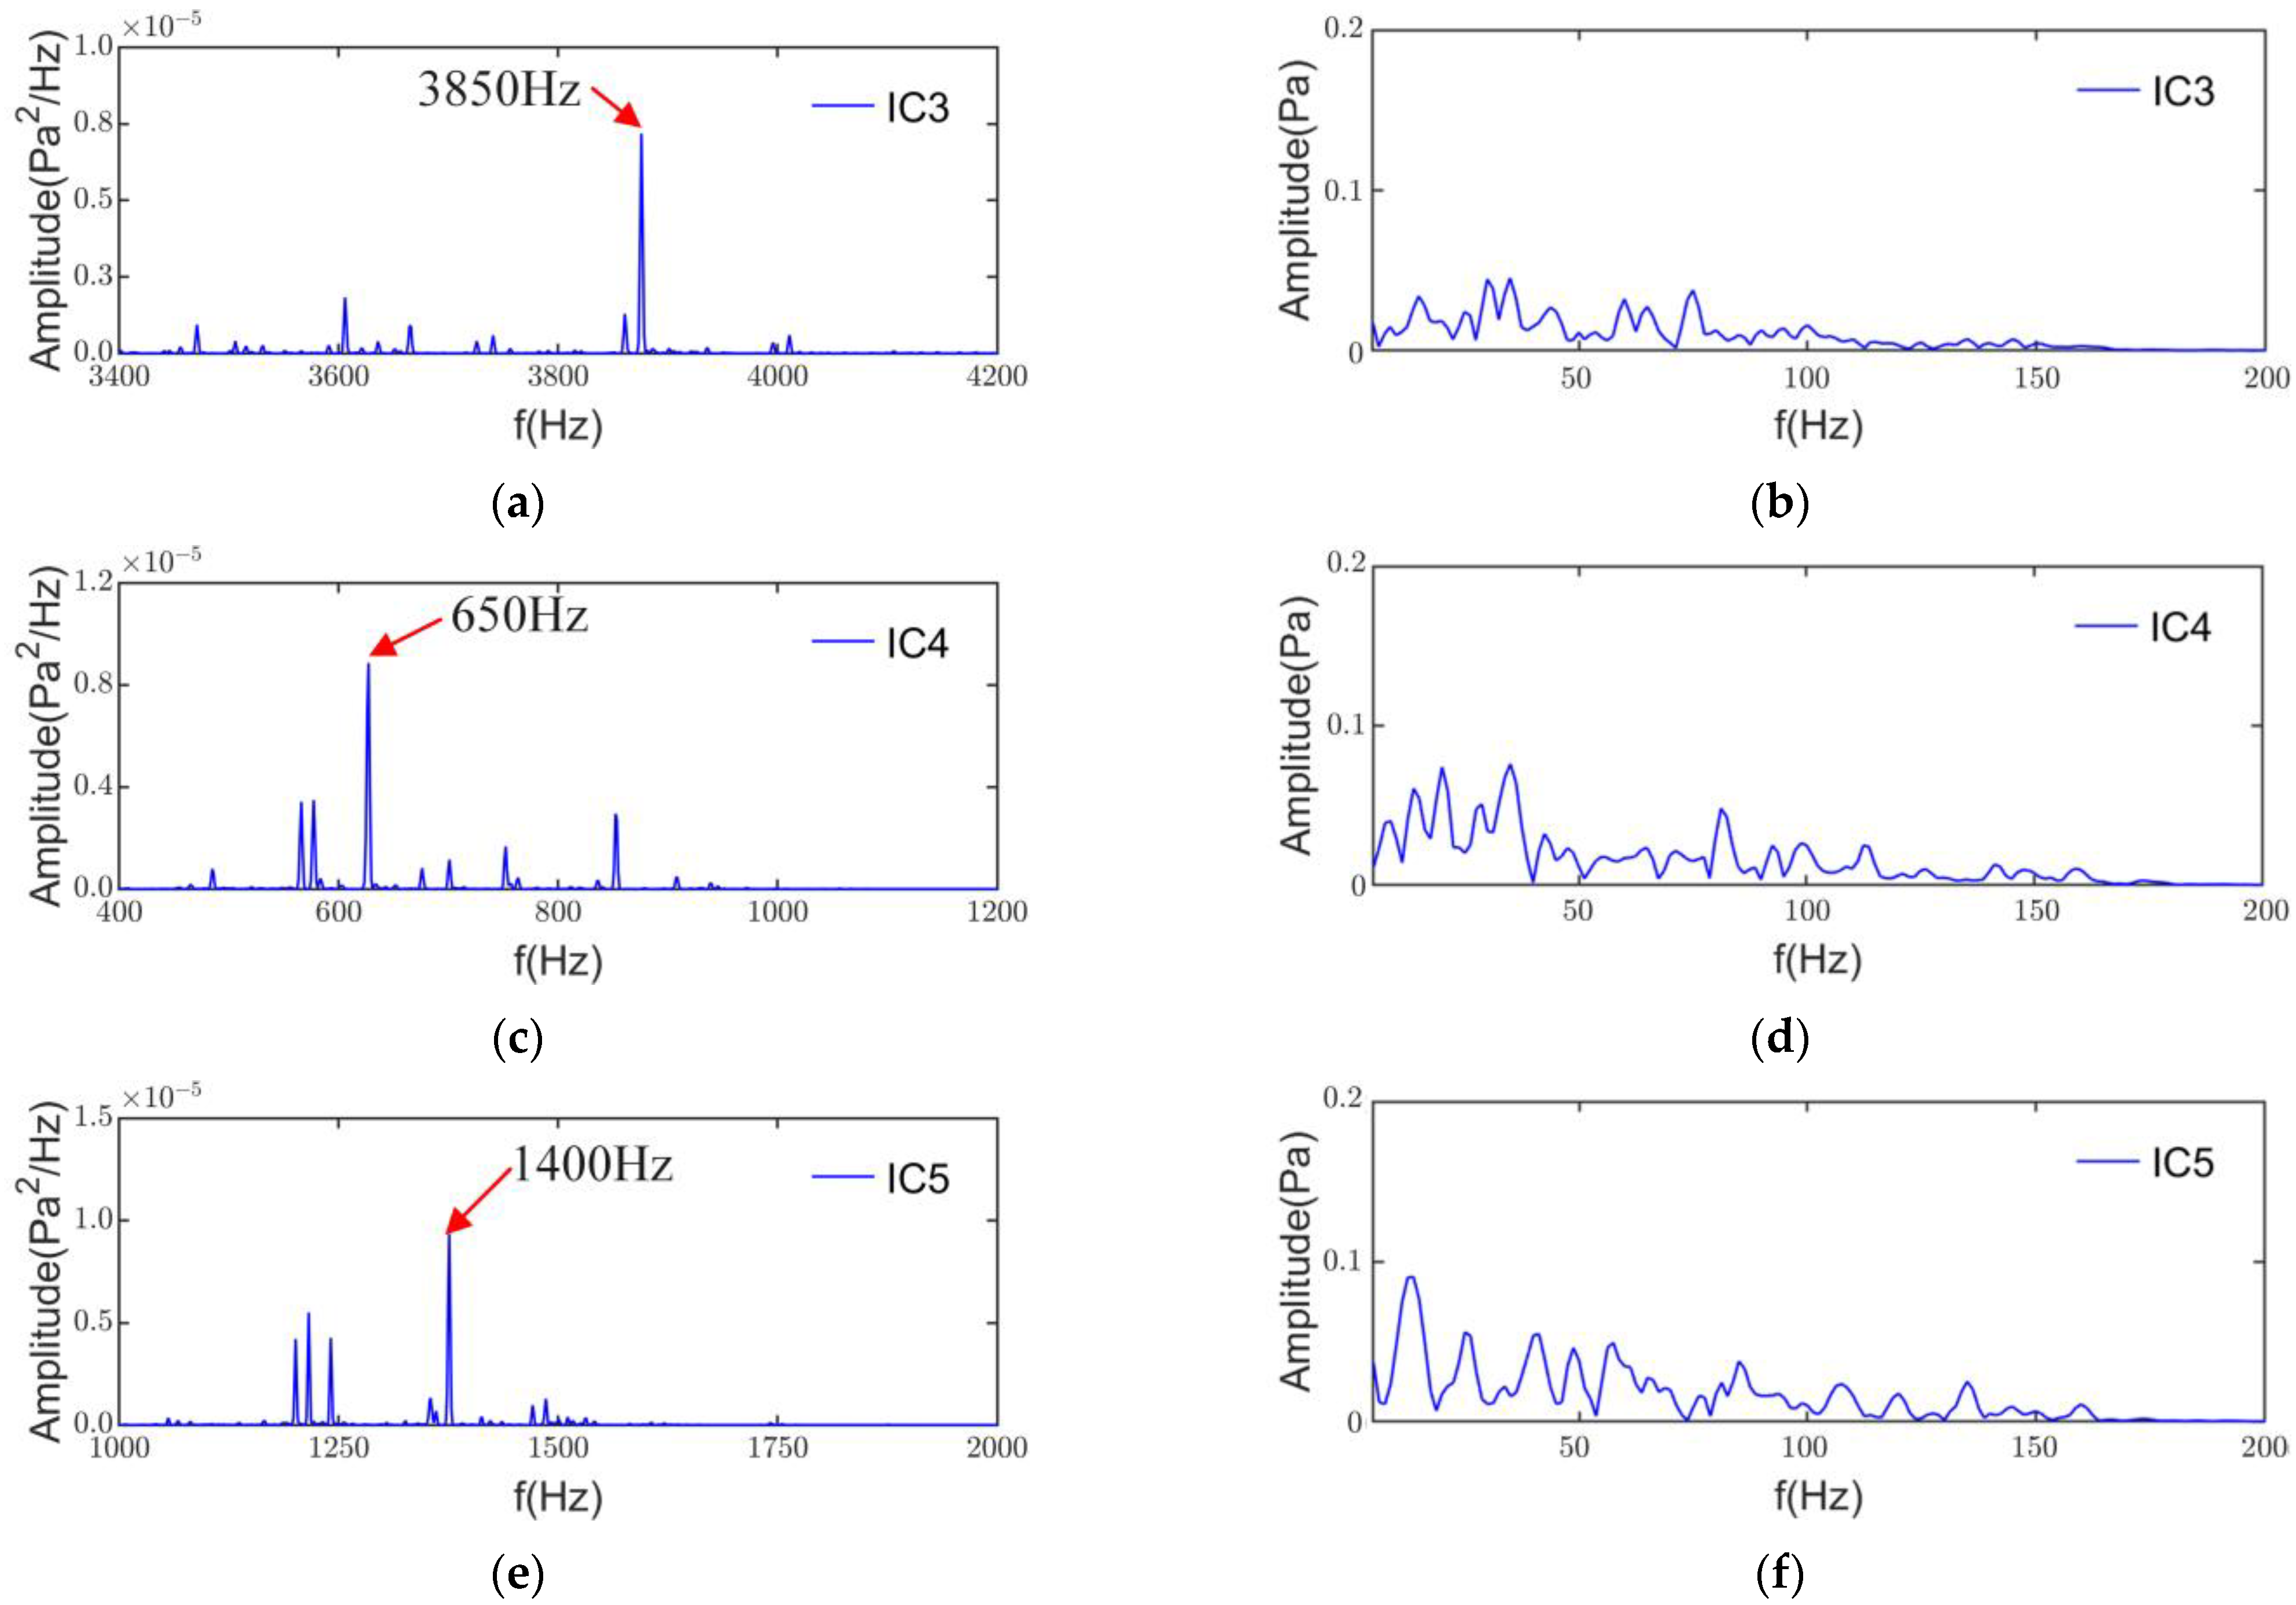
From Figure 17, it can be seen that the results of the power spectral density and envelope analysis of IC3, IC4, and IC5 show that the main noise frequency components are 3850, 650, and 1400 Hz, and the envelope analysis does not show a more pronounced low-frequency characteristic modulation. Therefore, IC3 is the r = 3 radial electromagnetic noise at n2 = ±5 generated by the interaction of the stator and rotor harmonic orders u = 76/−74, v = 73/−71. In the same way, the IC4 is the r = 3 radial electromagnetic noise order at n2 = ±1 resulting from u = 16/−14, v = 13/−11. The IC5 is the r = 6 radial electromagnetic noise order at n2 = ±2. It is important to note that radial electromagnetic forces larger than the 4th order are not generally considered to cause considerable electromagnetic noise [5]. However, due to factors such as structure and modulation, higher-order radial electromagnetic forces may still cause non-negligible noise.
As a PWM inverter powers this induction motor, the 0th-order electromagnetic force wave generated by the interaction of the PWM with the fundamental magnetic field has a frequency of fT + 3fc = 5350 Hz when the current harmonic frequency is fT + 2fc. There are significant sidebands in the power spectral density of IC6 in Figure 18a, and the envelope results in Figure 18b indicate the presence of a PWM modulation component of 20 Hz and its multiples. Therefore IC6 is the switching frequency noise from the PWM supply.

5. Conclusions

This article proposes an induction motor noise source separation and identification method based on adaptive scale-space modal extraction to accurately separate and identify induction motor noise sources. The main conclusions are as follows.
(1) The proposed electromagnetic feature scale space, which maps electromagnetic features on the MTF scale-space plane, solves the problem of over-decomposition existing in the classical scale-space method and can accurately distinguish the harmonic and pulse modes in the noise signal.
(2) Based on the electromagnetic feature scale space and the adaptive penalty factor constructed in this article, the adaptive scale-space mode extraction method (ASSME) is proposed. It avoids the extracted modal components containing extra or missing components and provides a complete and effective multi-channel input for the underdetermined blind source separation.
(3) The ASSME method and RobustICA are used to separate noise sources of the test induction motor. Power spectral density and envelope spectrum analysis identify the electromagnetic noise of different orders, aerodynamic noise, and switching frequency noise.
In future research, we will focus on the effect of the motor noise bandwidth on the proposed method, as well as on the general applicability of the method to other types of motors. At the same time, we will apply the method in background noise and other more complex operating conditions. We will study how to construct more suitable noise source contribution indexes to provide an accurate reference basis for motor design and optimization.

Author Contributions

Conceptualization, C.C. and Z.W.; methodology, Z.W.; software, Z.W.; validation, Z.W. and C.C.; formal analysis, C.C. and X.S.; investigation, Z.W. and Y.G.; resources, X.S. and L.W.; data curation, L.W. and Z.W; writing—original draft preparation, Z.W.; writing—review and editing, L.W. and Y.G.; supervision, Y.G. and X.S. All authors have read and agreed to the published version of the manuscript.

Funding

This research work was supported by National Natural Science Foundation of China under Grant No. 52175105, the National Natural Science Foundation of China under Grant No. 51675350, and the Natural Science Foundation Key Science and Technology Innovation Base Joint Fund of Liaoning Province under Grant No. 2022KF2404, which are greatly appreciated.

Institutional Review Board Statement

Not applicable.

Informed Consent Statement

Not applicable.

Data Availability Statement

Research data are not shared.

Conflicts of Interest

The authors declare that they have no known competing financial interests or personal relationships that could have appeared to influence the work reported in this paper.

References

  1. Gan, C.; Wu, J.H.; Sun, Q.G.; Kong, W.B.; Li, H.Y.; Hu, Y.H. A Review on Machine Topologies and Control Techniques for Low-Noise Switched Reluctance Motors in Electric Vehicle Applications. IEEE Access 2018, 6, 31430–31443. [Google Scholar] [CrossRef]
  2. Seshadri, A.; Lenin, N.C. Review based on losses, torque ripple, vibration and noise in switched reluctance motor. IET Electr. Power Appl. 2020, 14, 1311–1326. [Google Scholar] [CrossRef]
  3. Deng, W.; Zuo, S. Electromagnetic vibration and noise of the permanent-magnet synchronous motors for electric vehicles: An overview. IEEE Trans. Transp. Electrif. 2019, 5, 59–70. [Google Scholar] [CrossRef]
  4. Chu, N.; Liu, Q.; Yu, L.; Huang, Q.; Ning, Y.; Wu, D.Z.; Mohammad-Djafari, A.L. High-resolution localization of rotating acoustic sources: An experimental investigation and axial fan application. Measurement 2022, 196, 111149. [Google Scholar] [CrossRef]
  5. Wang, R.; Liu, T.; Zhang, C.Y.; Yu, L.; Li, J.Q. Noise source localization in permanent magnet synchronous motors under time-varying speed working conditions. Appl. Acoust. 2022, 192, 108724. [Google Scholar] [CrossRef]
  6. Verma, S.P.; Balan, A. Determination of radial-forces in relation to noise and vibration problems of squirrel-cage induction motors. IEEE Trans. Energy Convers. 1994, 9, 404–412. [Google Scholar] [CrossRef]
  7. Mao, Y.N.; Zhao, W.X.; Zhu, S.D.; Chen, Q.; Ji, J.H. Vibration Investigation of Spoke-Type PM Machine With Asymmetric Rotor Considering Modulation Effect of Stator Teeth. IEEE Trans. Ind. Electron. 2021, 68, 9092–9103. [Google Scholar] [CrossRef]
  8. Zhu, S.D.; Zhao, W.X.; Liu, G.H.; Mao, Y.X.; Sun, Y.H. Effect of Phase Shift Angle on Radial Force and Vibration Behavior in Dual Three-Phase PMSM. IEEE Trans. Ind. Electron. 2021, 68, 2988–2998. [Google Scholar] [CrossRef]
  9. Fang, H.Y.; Li, D.W.; Guo, J.X.; Xu, Y.S.; Qu, R.H. Hybrid Model for Electromagnetic Vibration Synthesis of Electrical Machines Considering Tooth Modulation and Tangential Effects. IEEE Trans. Ind. Electron. 2021, 68, 7284–7293. [Google Scholar] [CrossRef]
  10. Fang, H.Y.; Li, D.W.; Qu, R.H.; Yan, P. Modulation Effect of Slotted Structure on Vibration Response in Electrical Machines. IEEE Trans. Ind. Electron. 2019, 66, 2998–3007. [Google Scholar] [CrossRef]
  11. Wang, L.; Bao, X.H.; Di, C.; Zhou, Y. Influence on Vibration and Noise of Squirrel-Cage Induction Machine with Double Skewed Rotor for Different Slot Combinations. IEEE Trans. Magn. 2016, 52, 7000804. [Google Scholar] [CrossRef]
  12. Chai, F.; Li, Y.; Pei, Y.L.; Yu, Y.J. Analysis of Radial Vibration Caused by Magnetic Force and Torque Pulsation in Interior Permanent Magnet Synchronous Motors Considering Ai-Gap Deformations. IEEE Trans. Ind. Electron. 2019, 66, 6703–6714. [Google Scholar] [CrossRef]
  13. Huang, N.; Long, S.; Wu, M.; Shih, H.H.; Zheng, Q.; Yen, N.; Tung, C.; Liu, H.; Shen, Z. The empirical mode decomposition and the Hilbert spectrum for nonlinear and non-stationary time series analysis. Proc. R. Society. Math. Phys. Eng. Sci. 1998, 454, 903–995. [Google Scholar] [CrossRef]
  14. Mourad, N. Automatic correction of eye blink artifact in single channel EEG recording using EMD and OMP. In Proceedings of the Signal Processing Conference, Lisbon, Portugal, 1–5 September 2014. [Google Scholar]
  15. Deng, X.; Pang, L.; Jiang, K.; Wang, X. Single-channel blind signal separation method for time-frequency overlapped signal based on CEEMD-FastICA. In Proceedings of the 2016 IEEE 13th International Conference on Signal Processing (ICSP), Chengdu, China, 6–10 November 2016. [Google Scholar]
  16. Du, X.F.; Li, Z.J.; Bi, F.R.; Zhang, J.H.; Wang, X.; Shao, K. Source Separation of Diesel Engine Vibration Based on the Empirical Mode Decomposition and Independent Component Analysis. Chin. J. Mech. Eng. 2012, 25, 557–563. [Google Scholar] [CrossRef]
  17. Jiang, H.K.; Li, C.L.; Li, H.X. An improved EEMD with multiwavelet packet for rotating machinery multi-fault diagnosis. Mech. Syst. Signal Process. 2013, 36, 225–239. [Google Scholar] [CrossRef]
  18. Smith, J.S. The local mean decomposition and its application to EEG perception data. J. R. Soc. Interface 2005, 2, 443–454. [Google Scholar] [CrossRef]
  19. Bi, F.R.; Li, L.; Zhang, J.; Ma, T. Source identification of gasoline engine noise based on continuous wavelet transform and EEMD-RobustICA. Appl. Acoust. 2015, 100, 34–42. [Google Scholar] [CrossRef]
  20. Yao, J.C.; Xiang, Y.; Qian, S.C.; Wang, S.; Wu, S.W. Noise source identification of diesel engine based on variational mode decomposition and robust independent component analysis. Appl. Acoust. 2017, 116, 184–194. [Google Scholar] [CrossRef]
  21. Zhou, Q.D.; Zhang, J.H.; Zhou, T.Y.; Qiu, Y.B.; Jia, H.J.; Lin, J.W. A parameter-adaptive variational mode decomposition approach based on weighted fuzzy-distribution entropy for noise source separation. Meas. Sci. Technol. 2020, 31, 125004. [Google Scholar] [CrossRef]
  22. Yang, Z.X.; Rong, H.J.; Wong, P.K.; Angelov, P.; Vong, C.M.; Chiu, C.W.; Yang, Z.X. A Novel Multiple Feature-Based Engine Knock Detection System using Sparse Bayesian Extreme Learning Machine. Cogn. Comput. 2022, 14, 828–851. [Google Scholar] [CrossRef]
  23. Xin, Y.; Li, S.M.; Zhang, Z.Z. Adaptive Reinforced Empirical Morlet Wavelet Transform and Its Application in Fault Diagnosis of Rotating Machinery. IEEE Access 2019, 7, 65150–65162. [Google Scholar] [CrossRef]
  24. Liu, Z.C.; Ding, J.M.; Lin, J.H.; Huang, Y. A Rolling Bearing Fault Diagnosis-Optimized Scale-Space Representation for the Empirical Wavelet Transform. Shock. Vib. 2018, 2018, 2749689. [Google Scholar] [CrossRef]
  25. Ma, J.; Wu, J.D.; Wang, X.D. Incipient fault feature extraction of rolling bearings based on the MVMD and Teager energy operator. ISA Trans. 2018, 80, 297–311. [Google Scholar] [CrossRef]
  26. Huang, Y.; Lin, J.H.; Liu, Z.C.; Wu, W.Y. A modified scale-space guiding variational mode decomposition for high-speed railway bearing fault diagnosis. J. Sound Vib. 2019, 444, 216–234. [Google Scholar] [CrossRef]
  27. Wang, Z.J.; Yang, N.N.; Li, N.P.; Du, W.H.; Wang, J.Y. A new fault diagnosis method based on adaptive spectrum mode extraction. Struct. Health Monit. Int. J. 2021, 20, 3354–3370. [Google Scholar] [CrossRef]
  28. Wang, M.J.; Wang, W.J.; Zhang, X.N.; Iu, H.H.C. A New Fault Diagnosis of Rolling Bearing Based on Markov Transition Field and CNN. Entropy 2022, 24, 751. [Google Scholar] [CrossRef] [PubMed]
  29. Lempel, A.; Ziv, J. A universal algorithm for sequential data compression. IEEE Trans. Inf. Theory 1977, 23, 337–343. [Google Scholar]
  30. Cormack, G.V.; Horspool, R. Data Compression Using Dynamic Markov Modelling. Comput. J. 1987, 30, 541–550. [Google Scholar] [CrossRef]
  31. Gilles, J.; Heal, K. A parameterless scale-space approach to find meaningful modes in histograms—Application to image and spectrum segmentation. Int. J. Wavelets Multiresolution Inf. Process. 2014, 12, 1450044. [Google Scholar] [CrossRef]
  32. Al-khafaji, S.L.; Zhou, J.; Zia, A.; Liew, A.W.C. Spectral-Spatial Scale Invariant Feature Transform for Hyperspectral Images. IEEE Trans. Image Process. 2018, 27, 837–850. [Google Scholar] [CrossRef] [Green Version]
  33. Zhang, W.N. Combination of SIFT and Canny Edge Detection for Registration Between SAR and Optical Images. IEEE Geosci. Remote Sens. Lett. 2022, 19, 4007205. [Google Scholar] [CrossRef]
  34. Lowe, D.G. Distinctive image features from scale-invariant keypoints. Int. J. Comput. Vis. 2004, 60, 91–110. [Google Scholar] [CrossRef]
Figure 1. The flowchart of MTF.
Machines 11 00449 g001
Figure 2. Constructing MTF scale space.
Machines 11 00449 g002
Figure 3. The flowchart of ASSME.
Machines 11 00449 g003
Figure 4. Electromagnetic feature scale space: (a) MTF scale space; (b) electromagnetic feature mapping.
Machines 11 00449 g004
Figure 5. ASSME method separation results.
Machines 11 00449 g005
Figure 6. Spectral division results: (a) CSSVMD, (b) CSSEWT.
Machines 11 00449 g006
Figure 7. Original signal and decomposition results of three methods: (a) original signal, (b) ASSME, (c) CSSVMD, (d) CSSEWT.
Machines 11 00449 g007aMachines 11 00449 g007b
Figure 8. Induction motor noise test: (a) induction motor noise signal acquisition; (b) equipment.
Machines 11 00449 g008
Figure 9. Diagram of the microphone arrangement.
Machines 11 00449 g009
Figure 10. The flow chart of noise source identification.
Machines 11 00449 g010
Figure 11. Data processing: (a) original signal; (b) time domain signal after processing; (c) frequency domain signal after processing.
Machines 11 00449 g011
Figure 12. Decomposition results of the three methods: (a) ASSME, (b) CSSVMD, (c) CSSEWT.
Machines 11 00449 g012
Figure 13. The correlation coefficient and variance contribution rate of three methods: (a) ASSME; (b) CSSVMD; (c) CSSEWT.
Machines 11 00449 g013
Figure 14. RobustICA input and output: (a) input; (b) output.
Machines 11 00449 g014
Figure 15. Power spectral density: (a) IC1; (b) IC2.
Machines 11 00449 g015
Figure 16. (a) PSD of rear end noise signal; (b) envelope spectrum of IC2.
Machines 11 00449 g016
Figure 17. PSD and envelope spectrum of IC3-IC5: (a) PSD of IC3; (b) envelope spectrum of IC3; (c) PSD of IC4; (d) envelope spectrum of IC4; (e) PSD of IC5; (f) envelope spectrum of IC5.
Machines 11 00449 g017
Figure 18. PSD and envelope spectrum of IC6: (a) PSD; (b) envelope spectrum.
Machines 11 00449 g018
Table 1. Testing induction motor parameters.
CharacteristicsParameter
pole pair (p)2
Number of stator/rotor slots (z1/z2)24/30
Power supply frequency (fc)50 [Hz]
Power supply methodPWM
Carrier frequency (fs)5.2 [KHz]
No-load speed1500 [rpm]
Disclaimer/Publisher’s Note: The statements, opinions and data contained in all publications are solely those of the individual author(s) and contributor(s) and not of MDPI and/or the editor(s). MDPI and/or the editor(s) disclaim responsibility for any injury to people or property resulting from any ideas, methods, instructions or products referred to in the content.