Article

A One-Dimensional Convolutional Neural Network-Based Method for Diagnosis of Tooth Root Cracks in Asymmetric Spur Gear Pairs

1
Department of Mechanical Engineering, Bursa Uludag University, Bursa 16059, Turkey
2
Department of Electrical and Electronics Engineering, Bursa Uludag University, Bursa 16059, Turkey
3
Department of Computer Engineering, Bursa Uludag University, Bursa 16059, Turkey
*
Author to whom correspondence should be addressed.
Machines 2023, 11(4), 413; https://doi.org/10.3390/machines11040413
Submission received: 7 February 2023 / Revised: 28 February 2023 / Accepted: 21 March 2023 / Published: 23 March 2023
(This article belongs to the Section Machines Testing and Maintenance)

Abstract

:
Gears are fundamental components used to transmit power and motion in modern industry. Their health condition monitoring is crucial to ensure reliable operations, prevent unscheduled shutdowns, and minimize human casualties. From this standpoint, the present study proposed a one-dimensional convolutional neural network (1-D CNN) model to diagnose tooth root cracks for standard and asymmetric involute spur gears. A 6-degrees-of-freedom dynamic model of a one-stage spur gear transmission was established to achieve this end and simulate vibration responses of healthy and cracked (25%–50%–75%–100%) standard (20°/20°) and asymmetric (20°/25° and 20°/30°) spur gear pairs. Three levels of signal-to-noise ratios were added to the vibration data to complicate the early fault diagnosis task. The primary consideration of the present study is to investigate the asymmetric gears’ dynamic characteristics and whether tooth asymmetry would yield an advantage in detecting tooth cracks easier to add to the improvements it affords in terms of impact resistance, bending strength, and fatigue life. The findings indicated that the developed 1-D CNN model’s classification accuracy could be improved by up to 12.8% by using an asymmetric (20°/30°) tooth profile instead of a standard (20°/20°) design.

1. Introduction

Gears are the key components of modern industry and have been widely employed in automotive, machinery, wind turbine, and aviation fields [1]. The operational reliability of a geared transmission system is mainly associated with its mechanical structure and life, which can be easily affected by internal and external factors [2]. Due to material defects and imperfect manufacturing procedures (e.g., machining error), insufficient lubrication, and harsh running environments, the gears are prone to local defects [3,4]. According to the statistics, around 60% of total gearbox faults originate from individual gear errors [5]. In addition to that, it has also been reported that approximately 19.1% of helicopter powertrain system failures are caused by gearbox systems [6]. Typically, the main gear failure modes include tooth root cracks, pitting, spalling, and tooth surface wear. With this in mind, the literature review confirms that the early diagnosis of tooth root cracks is considerably valuable in modern industry in terms of predictive maintenance since the tooth cracks tend to have a more rapid failure (e.g., complete tooth breakage) compared to other listed major failure modes [7,8]. The presence of a tooth root crack can deteriorate the dynamic responses, for example, vibration and transmission error (TE), of a gear pair and may threaten the machines’ safety. To avoid unscheduled shutdowns, massive economic (for example, maintenance and repair costs) losses, and even human casualties, the matter of gear condition monitoring (CM) has drawn attention during the last decade with the wide availability of sensors and ever-increasing computation power. From this standpoint, CM of gear health status emerges as a vital and up-to-date research topic, considering its contribution to ensuring reliable operations and increasing cost savings.
Convenient and rapid diagnosis of an incipient fault is key to improving service safety. In this regard, the time-varying mesh stiffness (TVMS) is addressed as a primary consideration to interpret the dynamic behavior of a gearbox [9] and can also be utilized as a valuable parameter for understanding the damage severity [10,11]. Meshing stiffness is basically defined as a gear tooth’s ability to withstand deformation during the meshing cycle and can be incorporated with the finite element (FE) model or gear-lumped parameter model in order to predict the dynamic response (e.g., vibration and TE) of a geared transmission system. Plus, the fluctuations in TVMS of a gear pair are among the main sources of the periodic TE fluctuations and, therefore, changes in vibration response [12]. With this in mind, many scholars have investigated the influence of major failure modes (for example, tooth root cracks and pitting) and geometrical modifications on TVMS and TE. For instance, Chaari et al. [13] endeavored to quantify the reduction in TVMS through a developed analytical model by emphasizing the impact of an incurred tooth root crack fault on TVMS and vibration characteristics. The study benefited from an FE model in order to validate the findings acquired through the analytical model, and a good correlation was observed. Fernandez del Rincon et al. [14] portrayed a model to assess the TVMS of a spur gear transmission system, aiming to provide better insights regarding dynamics characteristics. The researchers presented a numerical example to achieve this end and further demonstrated the effects of different transmitted torque levels and mounting distances on meshing stiffness. Later, Liang et al. [15] pointed out that the TVMS is among the primary sources of vibration of a gearbox and investigated the influence of a tooth root crack on the meshing stiffness based on this motivation. Their study considered five different faulty (i.e., crack level) conditions, namely, (1) 10%, (2) 25%, (3) 50%, (4) 75%, and (5) tooth missing. As a result, it was reported that TVMS reduced considerably as the crack length (i.e., level) increased. Recently, Yu et al. [16] presented an analytical mathematical approach in order to identify meshing stiffness utilizing gearbox housing vibration signals. The effects of pitting and surface wear faults, other than healthy conditions, on the meshing stiffness were also evaluated under variable operational (i.e., torque and shaft speed) circumstances. Supplementary to the numerical simulations, the experimental findings confirmed that the proposed analytical approach would help achieve gear CM and fault diagnosis tasks.
Mechanical systems are expected to put forth high performance for longer cycles under excessive service loads with regard to more competitive industry requirements. Therefore, the CM of geared transmission systems is, in turn, even more essential to diagnose any potential failure before it becomes a functional failure that may further threaten the availability of the whole system. Under this predictive maintenance philosophy, the main approaches generally employed in CM include (1) vibration analysis, (2) motor current signature analysis, (3) particle wear analysis, and (4) oil analysis [17]. Among them, vibration-based analysis techniques have stood out in achieving gearbox early fault diagnosis tasks due to their advantages, for instance, low cost and fast measurement [18]. However, the effect of tooth root cracks on the mechanical systems’ vibration response could be limited (i.e., slight) in the early stages, or background noises may have submerged the fault features. From this point of view, an intelligent method that can automatically extract fault features from the vibration signals would be precious since failing in early diagnosis of root cracks may result in a rapidly broken tooth.
Under the circumstances, modeling the tooth root crack fault and simulating its influence on dynamic behavior (for example, vibration and TE) can provide a theoretical basis to detect outliers and achieve early fault diagnosis tasks [4]. In this regard, dynamic modeling of a geared transmission system offers an opportunity to better understand the system’s dynamic characteristics before starting a measurement campaign. The primary consideration in dynamic modeling is to produce a model with an acceptable trade-off between simplicity and reality. In this way, a sufficient amount of fault data can be collected under variable operational conditions (e.g., load and shaft speed) without needing a costly and physical experimental dataset [19]. For example, Howard et al. [20] endeavored to put forth a simplified dynamic model to ascertain the vibration responses of a geared transmission system by emphasizing its value for CM. In addition to that, the study also comparatively presented the effect of a tooth root crack fault on TVMS and frequency spectrum. Mohammed et al. [12] recorded the variation in two statistical indicators, considering three different crack propagation scenarios in order to understand the effects on vibration signals. To this end, a six-degrees-of-freedom (DOF) dynamic model of a geared transmission system was established. The researchers reported that the changes in statistical indicators were enhanced as the crack level increased, thus making fault detection easier. Ren et al. [21] aimed to evaluate the time domain vibration signals in a geared transmission system in the presence of a tooth root crack and developed a multi-DOF dynamic model to achieve this. Their research first parameterized the crack angle and depth and then indicated that the influence of tooth cracks on vibration impulses was amplified due to the crack propagation. Recently, Yang et al. [22] pointed out that finding major failure modes (e.g., tooth crack) under variable operational circumstances is challenging. Therefore, the researchers proposed a dynamic model, inducing frequency and amplitude modulations into gearbox vibration signals. The findings were verified through a test rig, and good agreement was observed.
Identifying a fault (or its location) through the CM of a gearbox is of great engineering significance. This way, the maintenance strategies can be optimized, and valuable support regarding safe decision making can be provided. The geared transmission system diagnosis by utilizing vibration-based approaches mainly consists of two stages, namely, (1) feature extraction and (2) classification. One type of mainstream for gearbox CM is extracting relevant fault (e.g., tooth root crack) features from the time or frequency domain of the vibration signal to decide the fault’s presence. With this in mind, traditional mechanism-based fault diagnosis techniques generally depend on advanced user knowledge regarding feature extraction and fault mechanism, a subjective and labor-oriented duty that limits its use (i.e., inspection and maintenance) in the field [23]. To overcome the dependency on expert knowledge, the other genre of mainstream approaches is designing neural networks where the computer can automatically extract implicit fault features from raw vibration signals. Artificial neural networks have recently been utilized in many diverse applications for (1) classification, (2) optimization, (3) clustering, and (4) pattern recognition [24,25]. Their implementation fields include CM of gearboxes [26], motor vehicles (e.g., race cars and motorcycles) [27,28], mining (e.g., thrust and moment prediction) [29], etc. However, machine learning (ML) algorithms, such as the k-nearest neighbor, support vector machines, and decision tree classifiers, comprise shallow structures, making learning pertinent hidden faults (for example, tooth root crack) features more compelling [19]. Recently, a deep learning (DL) technique called convolutional neural network (CNN) achieved great success in the field [7] thanks to its advantages, such as (1) automated fault extraction and (2) minimal engagement of signal processing. In addition to that, the CNN algorithm is also increasingly popular owing to its local shared weighted unique structure that reduces computational burden [7,19].
Sun et al. [26] emphasized that fault (e.g., tooth crack) signatures might be submerged in overwhelming environmental conditions and proposed an intelligent diagnosis approach based on the CNN algorithm to overcome this limitation. Their study gave vibration signals collected through a physical test rig in addition to numerical simulations into a CNN-based algorithm and obtained average classification accuracy of 99.58% (simulation) and 99.79% (experiment), respectively. Liu et al. [30] combined the CNN algorithm with singular value decomposition and variable-mode decomposition to achieve gear fault diagnosis tasks. The study considered three different faulty conditions (i.e., label), namely, (1) wear fault, (2) tooth crack, and (3) tooth breakage. As a result, an overall recognition accuracy of 100% was reached with fewer training times than other tested approaches. Kim and Choi [7] aimed to diagnose tooth cracks and spalling faults using vibration signals collected through a physical test rig. To this end, the researchers proposed a CNN-based algorithm to classify healthy and faulty (i.e., cracked and spalled) vibration signals and prove the developed method’s applicability to real-life practices. Gecgel [19] utilized simulated vibration data obtained through an established 6-DOF dynamic model to perform gear diagnostics tasks. In this regard, the success of a one-dimensional CNN (1-D CNN) was compared with (1) long short-term memory, (2) decision tree classifiers, (3) support vector machines, and (4) random forest classifiers. As a result, it was reported that the 1-D CNN was superior to other algorithms tested within the scope of the study. Azamfar et al. [31] fed the two-dimensional CNN algorithm with multisensor data in order to classify different gear faults under variable shaft speeds. In this regard, the researchers tested the effectiveness of their algorithm under shaft speeds of (1) 250 rpm, (2) 500 rpm, (3) 1000 rpm, and (4) 1500 rpm. In addition to that, the classification success of the proposed two-dimensional CNN method was compared with some traditional ML approaches, for example, k-nearest neighbor and support vector machines. As a result, it was reported that the two-dimensional CNN model outperformed all other ML-based approaches evaluated within the scope of research work in terms of classification accuracy.
The competitive industry requirements have boosted the need and awareness regarding new gear designs that can offer high performance under tough running conditions [32]. Based on this motivation, an asymmetric tooth profile in which the drive-side pressure angle (DSPA) (αd) and coast-side pressure angle (αc) of the involute tooth profile are adjusted differently should be addressed comprehensively [33,34,35,36,37]. Evidence in the literature confirms that using an asymmetric tooth profile instead of a standard (symmetric) involute tooth profile could provide advantages in terms of (1) vibration [33], (2) bending strength [34], (3) impact resistance [35], and (4) fatigue crack propagation life [8]. For example, Kapelevich [33] emphasized that the asymmetric profiled gears hold promise for reducing size and vibration while enhancing load-carrying capacity. The research work, therefore, presented a design methodology to obtain gears with asymmetric teeth and further demonstrated that asymmetric gears could reduce vibration levels significantly through an experimental test campaign. Shuai et al. [34] modeled internal helical gears with four different DSPAs: (1) 20°, (2) 25°, (3) 30°, and (4) 35°. Afterward, the researchers comparatively interpreted the influence of DSPA on maximum stress through FE simulations and reported that the asymmetric profiled internal helical gears outperformed the standard profiled counterparts. Later, Kalay et al. [35] developed a novel experimental procedure to measure the impact resistance of asymmetric spur gears and evaluated the influence of DSPA on peak force energy. To this end, test samples with DSPAs of 20° and 30° were manufactured, and then the experiments were performed for two different drop heights and DSPA. The study indicated that the peak force energy could be increased up to 25.8% by utilizing DSPA of 30° instead of 20°. Doğan et al. [8] compared the spur gears in terms of (1) fatigue propagation life and (2) tooth root stresses. The researchers considered four different backup ratios and DSPAs to achieve this. As a result, it was reported that utilizing an asymmetric tooth profile could have decreased the tooth root stresses by circa 66% while increasing the fatigue propagation life around fifteen-times. Recently, Mo et al. [37] put forth an analytical model in order to calculate TVMS and TE characteristics of an asymmetric gear pair. Their study considered four DSPAs and revealed that the meshing stiffness increased as the DSPA of an involute profile increased. In addition to all of its superiorities against standard designs, the asymmetric profiled gears also have three main disadvantages, namely, (1) operation for a single sense of rotation [35], (2) lower contact ratio [36], and (3) higher manufacturing costs [8,9]. With this in mind, it should be highlighted that, even so, the asymmetric gears still hold great promise compared to standard profiled gears in many aspects if utilized in appropriate implementation fields [33,34,35,36,37].
In summary, a great deal of research put forth the superiority of gears with asymmetric teeth against standard designs. Plus, it is known that ML- and DL-based methods have become valuable tools for predictive maintenance with the wide availability of sensors and ever-increasing computation power. With this in mind, the available literature either investigated the effects of asymmetric tooth profiles on dynamic behavior or utilized ML- or DL-based approaches to detect faults in gears with symmetric tooth profiles. However, no research study in the literature examined whether an advantage is provided by using an asymmetric tooth profile to facilitate fault detection with artificial intelligence to add to the improvements it affords in terms of bending strength, impact resistance, and fatigue propagation life. The motivation of the present study is to fill this gap by utilizing a DL-based approach to detect tooth root cracks in asymmetric spur gear pairs and investigating whether tooth asymmetry would provide an advantage to boost the DL-based algorithm’s classification accuracy. We hypothesize that since the meshing stiffness of an asymmetric gear pair is higher than standard designs, the fluctuation in the vibration signals will be stronger (i.e., more pronounced) in the presence of a tooth crack and facilitating fault detection.
The present study investigated the vibration responses of standard (αd = 20°) and asymmetric (αd = 25° and 30°) involute spur gear pairs in the presence of a tooth crack and whether tooth asymmetry would provide an advantage to facilitate the early fault diagnosis tasks. In this regard, a 1-D CNN model was proposed in order to solve a multi-class classification problem. This research introduced the crack propagation paths, which we obtained through ANSYS® Workbench (ANSYS, Inc., Canonsburg, PA, USA) SMART Crack-Growth Module in our previous study [8] and whose reliability was confirmed with the available experimental data in the literature [38] to the created 3-D CAD models. Afterward, the FE approach was employed in order to compute the single-tooth stiffness values of healthy and cracked (25%–50%–75%–100%) spur gear pairs and, accordingly, the TVMS data. A 6-DOF dynamic model of a one-stage spur gear transmission was established through MATLAB® (MathWorks Inc., Natick, MA, USA) software to simulate vibration responses of standard and asymmetric spur gear pairs. In addition to that, three different signal-to-noise ratios (SNRs) were added to the simulated vibration signals to approximate reality since the data collected through a dynamic model are perfect, meaning they are noise-free. The main objective of this paper is to examine whether tooth profiles yield an advantage in detecting toot cracks early through a DL-based method. The effect of tooth asymmetry on TVMS and, therefore, vibration responses of a spur gear transmission was also evaluated. No similar study has been reported using a DL-based approach for fault detection in asymmetric involute spur gears and whether tooth asymmetry yields an advantage in detecting tooth cracks in the literature.

2. Materials and Methods

In spur gears, the direction of the involute profile where the moment transmission realizes is called the drive side, while the other side is referred to as the coast side. In standard (symmetric) designs, the pressure angle of both sides is equal to each other and generally assigned as 20° [39]. On the other hand, in asymmetric profiled gears, DSPA is selected to be larger than the coast-side pressure angle. The present study defined the DSPA as a variable gear design parameter. In this regard, it is evident that different DSPA selections can be made in a comparative research study. With this in mind, the literature review confirms that DSPAs ranging between 25° and 35° are commonly preferred to design gears with asymmetric teeth [33,34,35,36,37]. In addition to the standard tooth profile, this research work comparatively addressed the influence of 20°/25° and 20°/30° tooth profiles on vibration responses and the overall recognition rate of a DL-based algorithm. Herein, it was also considered that the gears with 35° DSPA could not be fabricated for all root radii [35].
The primary consideration of the present study is to develop a DL-based algorithm to detect tooth root cracks in standard and asymmetric spur gear pairs and investigate whether tooth asymmetry would yield an advantage in detecting faults more easily. The 3-D CAD geometries of both standard and asymmetric gears were modeled wielding MATLAB® and CATIA® (Dassault Systemes, Waltham, MA, USA) software to achieve this end [8,35]. Figure 1 depicts the identifying geometric characteristics of 3-D CAD geometries of spur gears modeled within the scope of the present study. To create a background, it is worth mentioning that (1) the tooth root thickens and (2) the tooth tip sharpens as the DSPA increases, according to Figure 1. In this regard, the thickening of the tooth root enhances the tooth stiffness and bending strength, while the increment in the DSPA decreases the contact ratio.
This research work regulated the number of teeth (z) as 28 and the module (mn) value as 3.175 mm. In addition to that, the material properties of AISI 9310 steel, typically wielded in aerospace, were assigned to the created 3-D CAD geometries. As a reminder, the DSPA is selected as a variable gear design parameter. The primary material properties of AISI 9310 steel [8], in addition to the gear design parameters identified within the scope of the present study, are provided in Table 1.

2.1. Identification of Crack Propagation Paths

In the available literature, a great deal of research examining the influence of tooth cracks on gears’ dynamic behavior introduced crack propagation paths as straight lines making a specific angle with the horizontal without relying on any numerical or analytical basis [9,17]. However, defining realistic crack propagation paths is of great engineering value in safety-critical applications such as aviation to establish a reliable model. To overcome this limitation and approximate reality, we employed ANSYS® Workbench SMART Crack-Growth Module in our previous study [8] in order to obtain numerical crack propagation paths, whose reliability was confirmed with the available experimental data in the literature [38]. Detailed information regarding crack propagation analyses, such as (1) mesh convergence, (2) boundary conditions, and (3) validation with the available experimental data, can be found in our previous studies [8,40].
With this in mind, in the present study, five different health conditions (i.e., label) were identified by the authors, namely, (1) healthy state, (2) 25%, (3) 50%, (4) 75%, and (5) 100% crack levels. Considering its definition is fundamental, it should be highlighted that 100% crack level refers to the point at which the bending stress at the crack tip exceeds the material’s (i.e., AISI 9310 steel) yield strength. Therefore, the defined crack will propagate up this crack level (i.e., 100%) and would be a rapid breakage afterward. In this regard, 25%, 50%, and 75% portions of the 100% crack level constitute the other health conditions (i.e., 25%–50%–75% crack levels) identified within the scope of research work. An example of crack propagation paths obtained for standard gear samples is depicted in Figure 2. As referred, detailed information regarding numerical crack propagation analyses is provided in our previous studies [8,40].

2.2. Single-Tooth and Meshing Stiffness Calculation

The next step is to compute single-tooth stiffness and, accordingly, TVMS data of healthy and cracked (25%–50%–75%–100%) gear pairs, considering different tooth profiles. Herein, the calculated TVMS data will be given as input to the 6-DOF dynamic model of a one-stage spur gear transmission in order to acquire vibration responses. To achieve this, the single-tooth stiffness and TVMS of healthy and cracked involute spur gears were computed based on the methods employed in our previous studies [9,41]. Detailed information regarding the methods utilized to calculate both single-tooth and meshing stiffness values, for example, (1) boundary conditions and (2) validation with the available literature [42], is provided in our previous research works [9,41].

2.3. Dynamic Modeling of a One-Stage Spur Gear Transmission

To achieve dynamic modeling of a spur gear transmission, the equations of motion must be derived and solved by employing a convenient method. Knowing the characteristics of faults holds significance in engineering practice to perform diagnostics and prognostics tasks. However, the lack of fault samples in real-life engineering applications is noteworthy because fault data can generally only be obtained shortly before failure occurs [16,23]. To overcome this limitation, establishing multi-DOF dynamic models of a geared transmission system could be an excellent alternative to exploring the gears’ dynamic behaviors under variable operational circumstances. The primary motivation behind dynamic modeling is to develop a model with an acceptable trade-off between simplicity and reality. Herein, a sufficient amount of labeled data can be provided to ML- or DL-based algorithms as training datasets through a developed dynamic model.
The fluctuations in external excitations, for instance, input velocity and torque applied, and internal excitations caused by TVMS and TE typically end up with gearbox vibrations. The literature review reveals that many scholars investigated the changes in TE and, accordingly, vibration responses through the developed multi-DOF dynamic models [2,3,5,9,12,19,20,43]. Based on this motivation, the present research work established a 6-DOF dynamic model of a one-stage spur gear transmission to evaluate the dynamic behavior of standard and asymmetric spur gear pairs. In this regard, the developed model consists of (1) a motor, (2) two flexible shafts, (3) a driver (pinion), (4) two bearings, (5) a driven gear, and (6) a load. Figure 3 depicts the physical model and schematic diagram of the established 6-DOF dynamic model.
According to Figure 3, the equations of motion of a one-stage spur gear transmission system were derived and subsequently listed in Equations (1)–(6). Herein, J1 and J4 denote the mass moment of inertia of the motor and load, respectively, while J2 and J3 imply the mass moment of inertia of the driver (pinion) and driven gear, respectively. In the equations, θ1 to θ4 denote the rotational angle of the motor, driver (pinion), driven gear, and load, respectively. The symbols of Ss1 and Ss2 indicate the damping coefficients of shafts, while Ks1 and Ks2 denote their stiffness. The masses of gears, the driver (pinion) and driven gears, are symbolized as m2 and m3. The symbols of y2 and y3 imply displacements of bearings used in the 6-DOF dynamic model. Finally, S2 and S3 denote the damping coefficients of bearings, while K2 and K3 indicate their stiffness.
J 1 θ ¨ 1 + S s 1 θ ˙ 1 θ ˙ 2 + K s 1 θ 1 θ 2 = T i n ,
J 2 θ ¨ 2 + S s 1 θ ˙ 2 θ ˙ 1 + K s 1 θ 2 θ 1 = W r b 2 ,
J 3 θ ¨ 3 + S s 2 θ ˙ 3 θ ˙ 4 + K s 2 θ 3 θ 4 = W r b 3 ,
J 4 θ ¨ 4 + S s 2 θ ˙ 4 θ ˙ 3 + K s 2 θ 4 θ 3 = T o u t ,
m 2 y ¨ 2 + S 2 y ˙ 2 + K 2 y 2 = W ,
m 3 y ¨ 3 + S 3 y ˙ 3 + K 3 y 3 = W ,
It is also worth mentioning that Tin and Tout denote the input and output torques, respectively, while W denotes the dynamic load between the driver (pinion) and driven gears. The symbols of rb2 and rb3 also imply the base circles of gears. Equation (7) defines the dynamic load between the gear pairs. Herein, Cgt and Kgt can be defined as the gear pair’s time-varying damping coefficient and meshing stiffness, respectively.
W = K g t θ 2 r b 2 θ 3 r b 3 + y 3 y 2 + ( C g t ( θ ˙ 2 r b 2 θ ˙ 3 r b 3 + y ˙ 3 y ˙ 2 ) ,
The present study benefited from the MATLAB® program to solve the equations of motion by utilizing the fourth-order Runge–Kutta method. In this regard, the ODE (ordinary differential equations) solver could not be used concerning differential equations’ time-varying coefficients; thus, the authors scripted the Runge–Kutta algorithm.
The constant coefficients (i.e., independent of time) in the established 6-DOF dynamic model of a one-stage spur gear transmission are presented in Table 2. In this regard, the damping coefficients (i.e., S2 and S3) and stiffness values (i.e., K2 and K3) of the bearings were determined from the available literature [44]. In Table 2, the symbols of ѯ1 and ѯ2 imply the shafts’ damping ratios. In addition to that, ѯt denotes the meshing gears’ damping ratio and can be determined between the values of 0.03 and 0.17 from the available literature [43,45].

2.4. Signal-to-Noise Ratio

The SNR is a measure widely used in numerical research works and can be defined as the ratio of signal power (Psignal) to noise power (Pnoise) [19]. It is known that the vibration signals collected through a dynamic model would be perfect, meaning noise-free signals. Therefore, anomalies are typically observed in vibration data only when the faulty tooth enters the meshing, which makes detecting tooth crack faults a simple task for ML- or DL-based algorithms. To further complicate the diagnosis task, the present study added three levels of Gaussian noise to the vibration signals collected through the established 6-DOF dynamic model for all scenarios identified within the scope of research work. In this regard, the SNR values can be calculated by Equation (8).
S N R = 10 × log 10 P s i g n a l P n o i s e ,
The present study determined the SNR values as 5, 10, and 15 in accordance with the available literature [19]. According to Equation (8), it is worth mentioning that the amount of noise added to the signal increases as the SNR value decreases.

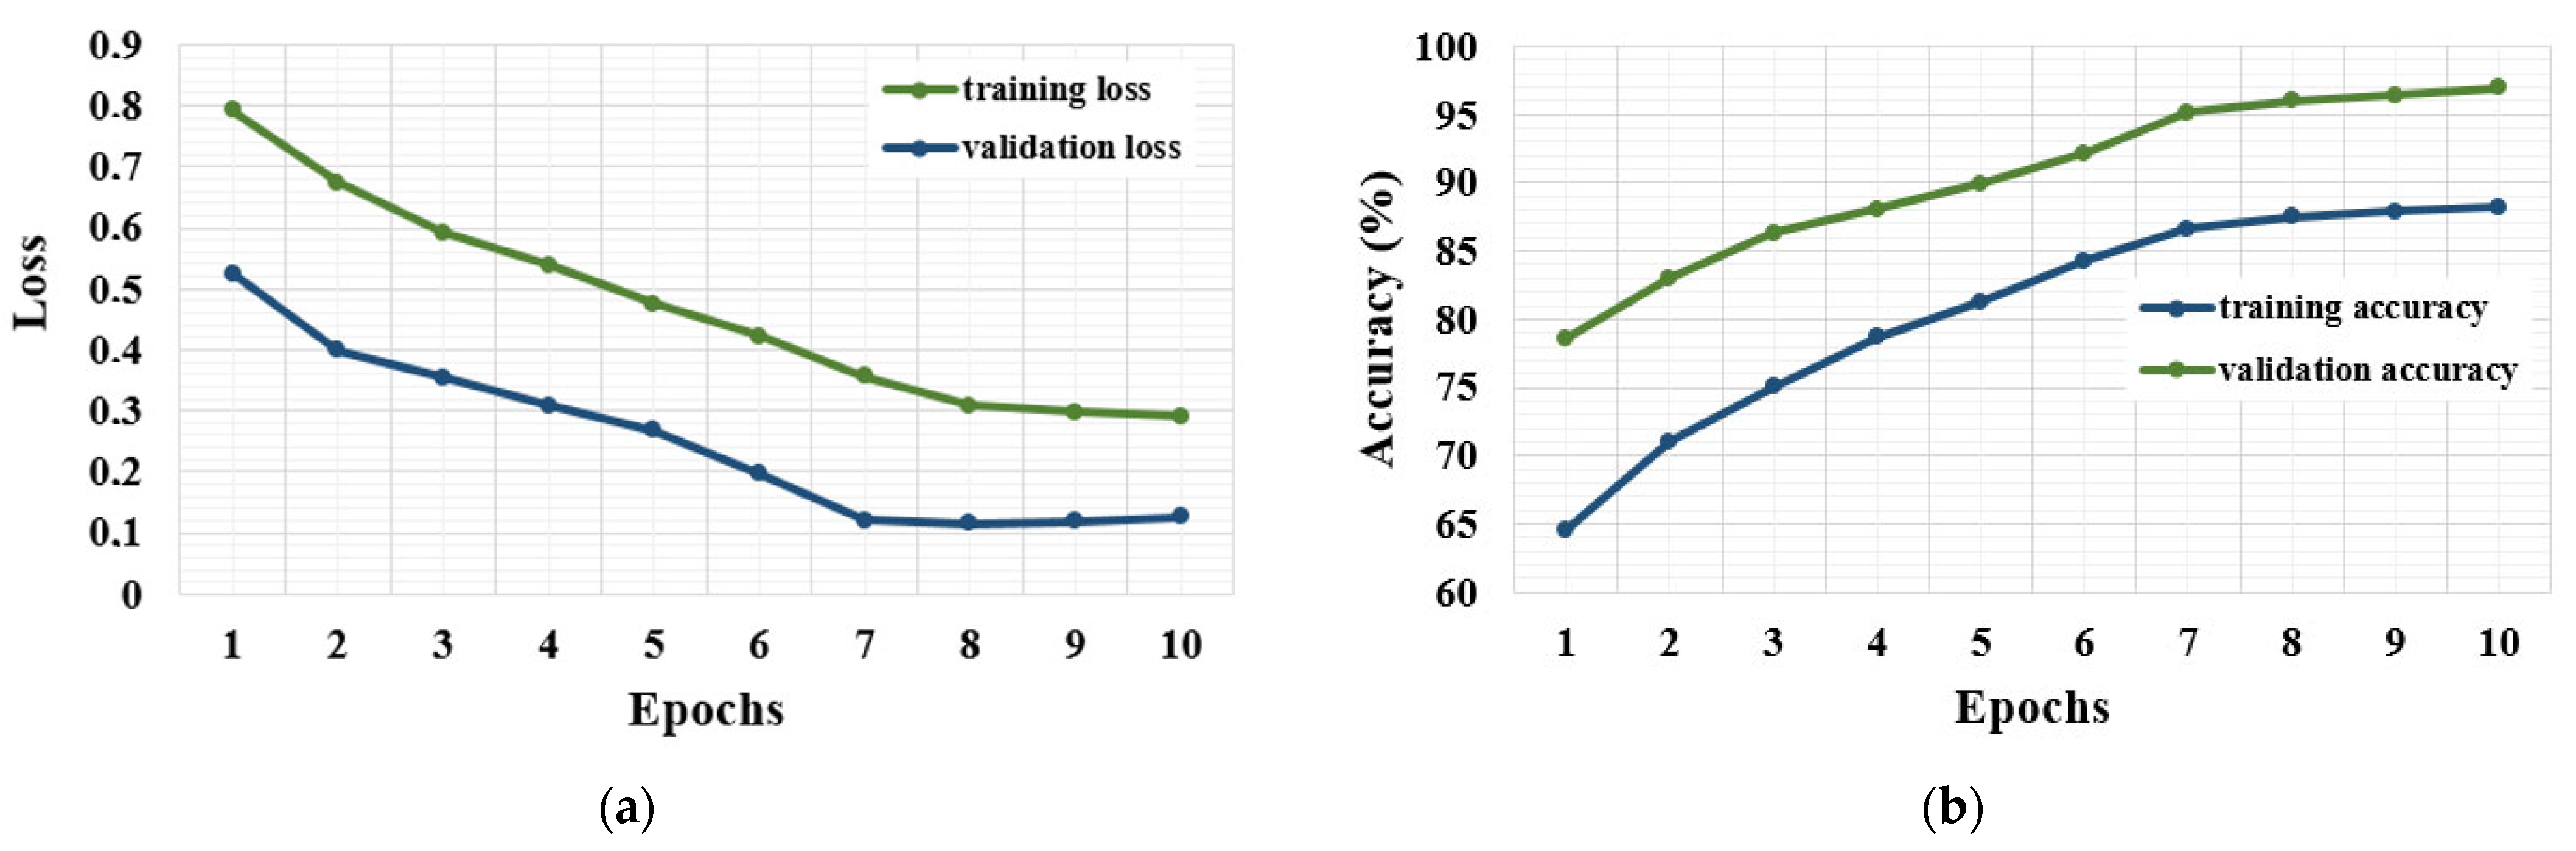
2.5. Convolutional Neural Network Architecture

CNN is a genre of feed-forward neural networks that typically comprises (1) a convolutional layer, (2) a pooling layer, and (3) a fully connected (FC) layer. Each convolutional layer typically includes multiple feature maps, and features are extracted from input data (e.g., signal) utilizing a convolution filter with single or multi-kernels. The 1-D convolution can be computed by using Equation (9). Herein, k1 implies the extracted fault (for example, tooth crack) features by the ith convolution kernel. The symbol of b denotes a kernel’s bias, while the symbol of w denotes its weight. In this regard, m represents the number of data points, and the rx implies the 1-D input.
k 1 i = b i + w x i x = 1 m r x ,   i = 1 ,   2 , ,   g ,
Following the convolution process, an activation function, for instance, (1) hyperbolic tangent, (2) sigmoid, and (3) rectified linear unit (ReLu), is mainly utilized to implement the nonlinear transformation of the convoluted data. Afterward, the next step is performing a subsampling, typically called the pooling operation. The literature commonly defines two types of pooling layers, namely, (1) max-pooling and (2) average-pooling layers. In this regard, the max-pooling layers are mainly utilized in designing a CNN structure to achieve gearbox diagnostics tasks. The pooling layer’s main objective is to conduct a down-sampling process and, thereby, reduce the number of parameters (i.e., computational complexity). The pooling operation can be described by using Equation (10).
p m a x l h ,   j = m a x j 1 v < u < j v t l h ,   u ,   j = 1 ,   2 , ,   g ,
Herein, tl(h,u) represents the uth neuron of the hth feature map in the ith layer. The symbol of j denotes jth pooling kernel, while v denotes the convolutional kernel’s width. The dropout is a regularization approach to overcome the overfitting problem and enhance the network’s robustness and generalization ability by randomly dropping some neurons. The FC layer is typically used in reassembling the acquired fault (for example, tooth crack) features through a weight matrix. In this regard, the FC process can be defined as presented in Equation (11).
x m = f a m = f ω m x m 1 + b m ,
Herein, each value xm−1 in the feature gradually allocated bias (i.e., bm) and weights (i.e., wm). An example of 1-D CNN architecture to achieve gear early diagnosis task is presented in Figure 4.
The present study developed a 1-D CNN model to classify different health conditions, namely, (1) healthy state, (2) 25% crack level, (3) 50% crack level, (4) 75% crack level, and (5) 100% crack level for both standard and asymmetric spur gear pairs. The main objective is to investigate whether the configuration of DSPA (i.e., tooth asymmetry) could provide an advantage in detecting tooth root crack faults early with a DL-based approach. To this end, the vibration signals obtained through the established 6-DOF dynamic model of a one-stage spur gear transmission have been provided as input data to the 1-D CNN model. To further complicate the early fault diagnosis task, the present research added three levels of Gaussian noise (i.e., SNR = 5, 10, and 15) to the simulated vibration signals. In this regard, 70% of the simulated dataset was utilized for training the developed network. Plus, 15% of the remaining data was used for testing and 15% for validation. The dropout ratio is set to 0.5, which is compatible with the available literature [19]. Table 3 lists the main attributes of the 1-D CNN structure developed within the scope of the present study.
The proposed model consists of two convolutions and max-pooling layers. In addition to that, the present research benefited from four feature maps and kernel size one in both convolution layers. Following the convolution operation, the ReLu activation function was utilized in both layers in order to implement the complex data’s nonlinear transformation. The batch size was set to 32, and the number of epochs was set to 10. The Adam (Adaptive Moment Estimation) version of stochastic gradient descent was utilized as an optimizer, compatible with the available literature [19]. Finally, the categorical cross-entropy was employed as the loss function, considering its advantages, for example, (1) strong generalization ability and (2) fast convergence speed, to classify five different health conditions for three different tooth profiles.
The present study utilized the 1-D CNN algorithm as a classification tool and fed it with the time-sequence acceleration data obtained through the developed 6-DOF dynamic model. In this regard, five different classes were identified by authors for three tooth profiles (20°/20°, 20°/25°, and 20°/30°), considering the healthy state and four different crack levels (25%–50%–75%–100%). The classes identified for standard (20°/20°) profiled involute spur gears within the scope of the present research work are presented in Table 4.
The present study aims to use the DL-based methods employed for early fault diagnosis in standard (20°/20°) profiled gear pairs for gears with asymmetric teeth for the first time. In this regard, the classes identified for asymmetric (20°/25° and 20°/30°) profiled involute spur gears to achieve this end are presented in Table 5 and Table 6, respectively.

2.6. Statistical Indicators

Statistical indicators are typically used in numerical research studies to quantify different crack levels [9,12]. In this regard, the present study calculated three different statistical indicators, namely, (1) root mean square (RMS), (2) kurtosis, and (3) crest factor (CF) through the established 6-DOF dynamic model of a one-stage spur gear transmission. The aim is to provide supplementary findings in addition to the 1-D CNN algorithm’s classification results, i.e., supplying additional information regarding whether tooth asymmetry offers an advantage in detecting tooth root crack faults. Suppose the percentage change in statistical indicators in the presence of a tooth crack is greater in asymmetric gears than in the standard designs. In that case, this finding supports the hypothesis that tooth asymmetry could contribute positively to fault detection. Herein, the present study identified the indicator values acquired for the healthy condition as reference values.
It is evident that other indicators, for example, peak to peak and maximum value, can be used for CM and diagnostics tasks. With this in mind, the RMS, kurtosis, and CF are among the most used statistical indicators to achieve this end and evaluate the effects of gear faults (e.g., tooth crack) on nonlinear vibration characteristics. In addition to that, the literature review confirms that interpreting the variations of one to three statistical indicators is generally sufficient [9,12]. In Equation (13), the symbol of K stands for kurtosis.
R M S = 1 N i = 1 N x i 2 ,
K = 1 N i = 1 N x i x ¯ 2 / 1 N i = 1 N x i x ¯ 2 2 ,
C F = m a x x i 1 N i = 1 N x i 2   ,

3. Results

The present study developed a 1-D CNN-based method to classify different gear health conditions, considering three different DSPAs. To this end, first, single-tooth stiffness and TVMS of healthy and cracked (25%–50%–75%–100%) standard and asymmetric spur gear pairs were computed using an FE-based method. Afterward, a 6-DOF dynamic model of a one-stage spur gear transmission was established to simulate vibration responses in the case of a tooth crack. The next step was to add Gaussian noise to the simulated vibration data to complicate the early fault diagnosis task, considering three different SNRs [19]. Finally, the overall classification accuracy rates acquired for three different tooth profiles (20°/20°, 20°/25°, and 20°/30°) through the developed 1-D CNN model were compared among themselves. The aim was to explore the influence of DSPA on the spur gear pairs’ dynamic behavior and investigate whether tooth asymmetry could provide an advantage to facilitate crack diagnosis to add to the improvements it affords in terms of bending strength, impact resistance, and fatigue life. As a supplementary finding, the present research also benefited from three statistical indicators, namely, (1) RMS, (2) kurtosis, and (3) CF, to investigate whether the configuration of DSPA would provide an advantage in detecting tooth root cracks.
Figure 5 depicts the meshing stiffness results obtained for three different tooth profiles, considering four different crack levels (25%–50%–75%–100%). Next, the acquired TVMS results will be utilized in order to obtain vibration responses through the 6-DOF dynamic model of a one-stage spur gear transmission. As highlighted earlier, the details regarding the methods used to compute both single-tooth and meshing stiffness values are provided in our previous research works [9,41].
Figure 5 provides three significant findings regarding the influence of DSPA (i.e., tooth asymmetry) on the meshing stiffness of spur gear pairs.
  • The meshing stiffness enhances with an increment of DSPA from 20° to 30°. In this regard, the tooth root thickens as the DSPA increases; thereby, the tooth behaves in a stiffer manner compared to standard (20°/20°) designs (see Figure 1) [8,35];
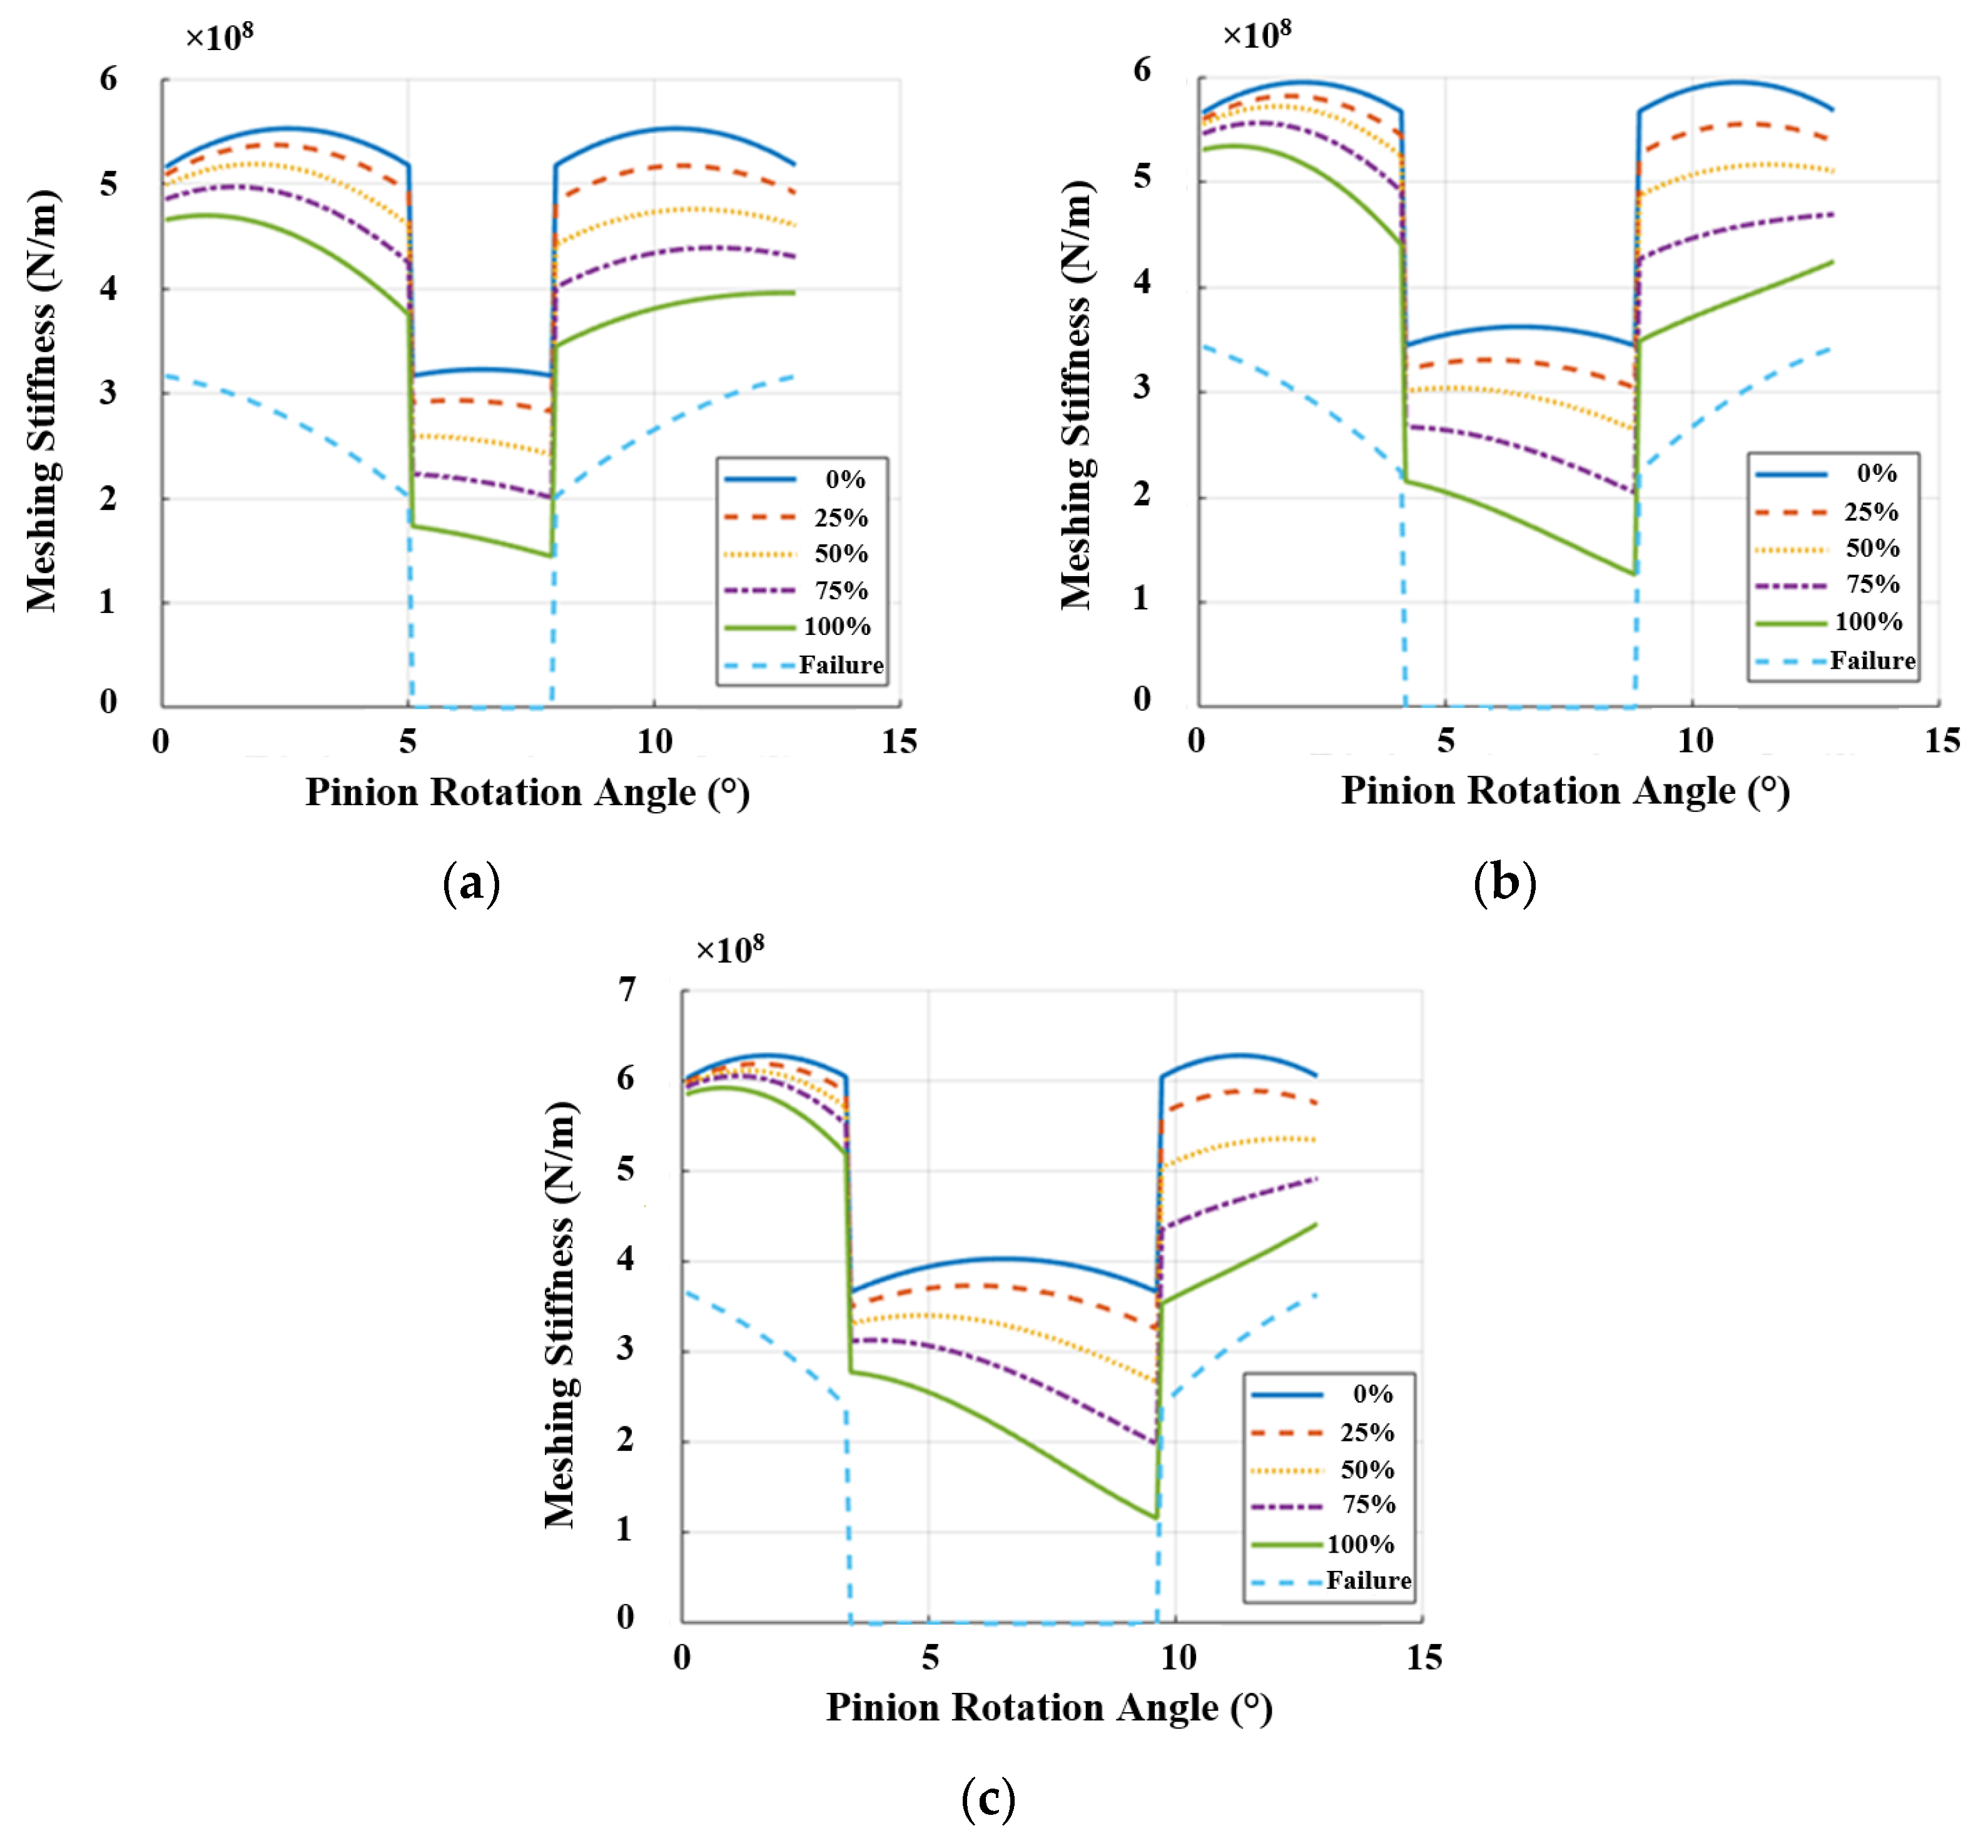
  • The TVMS of a spur gear pair decreases in the presence of a tooth crack. In this regard, the reduction in TVMS proportionally enhances as the crack level increases;
  • A reduction in TVMS decreases as the DSPA increases. This finding is also compatible with the available literature [9];
  • The single-tooth contact region enlarges as DSPA increases, resulting in longer load transmission with a single gear pair.
The vibration signals collected for three DSPAs through the established 6-DOF dynamic model are presented in Figure 6, Figure 7 and Figure 8, respectively. Herein, first, the noise-free signals are depicted to interpret the effect of DSPA (i.e., tooth asymmetry) on the vibration responses of a spur gear pair in the presence of a tooth crack. Later, three levels of Gaussian noise (SNR = 5, 10, and 15) were added to the vibration data obtained through the 6-DOF dynamic model. Finally, the noise-added signals were used for fault classification tasks through the developed 1-D CNN model.
The maximum vibration level for the healthy condition was measured as 1385 m/s2, 1530 m/s2, and 1840 m/s2 for DSPAs of 20°, 25°, and 30°, respectively. These values were also measured for 100% crack level as 2224 m/s2, 3153 m/s2, and 4268 m/s2, respectively, for 20°/20°, 20°/25°, and 20°/30° tooth profiles. As a result, it was noted that the vibration responses of asymmetric spur gear pairs were stronger than the standard (20°/20°) designs due to their higher stiffness.
The findings obtained regarding the influence of tooth asymmetry on the vibration response are listed below, considering Figure 6, Figure 7 and Figure 8. Herein, it should be highlighted that the fluctuations in the meshing stiffness are a primary source of the changes in vibration responses of a transmission system [12]. Therefore, it is expected that the effects of DSPA on TVMS and vibration response will be compatible.
  • The amplitude of the vibration response increases with the increment in DSPA from 20° to 30° (see Figure 6, Figure 7 and Figure 8);
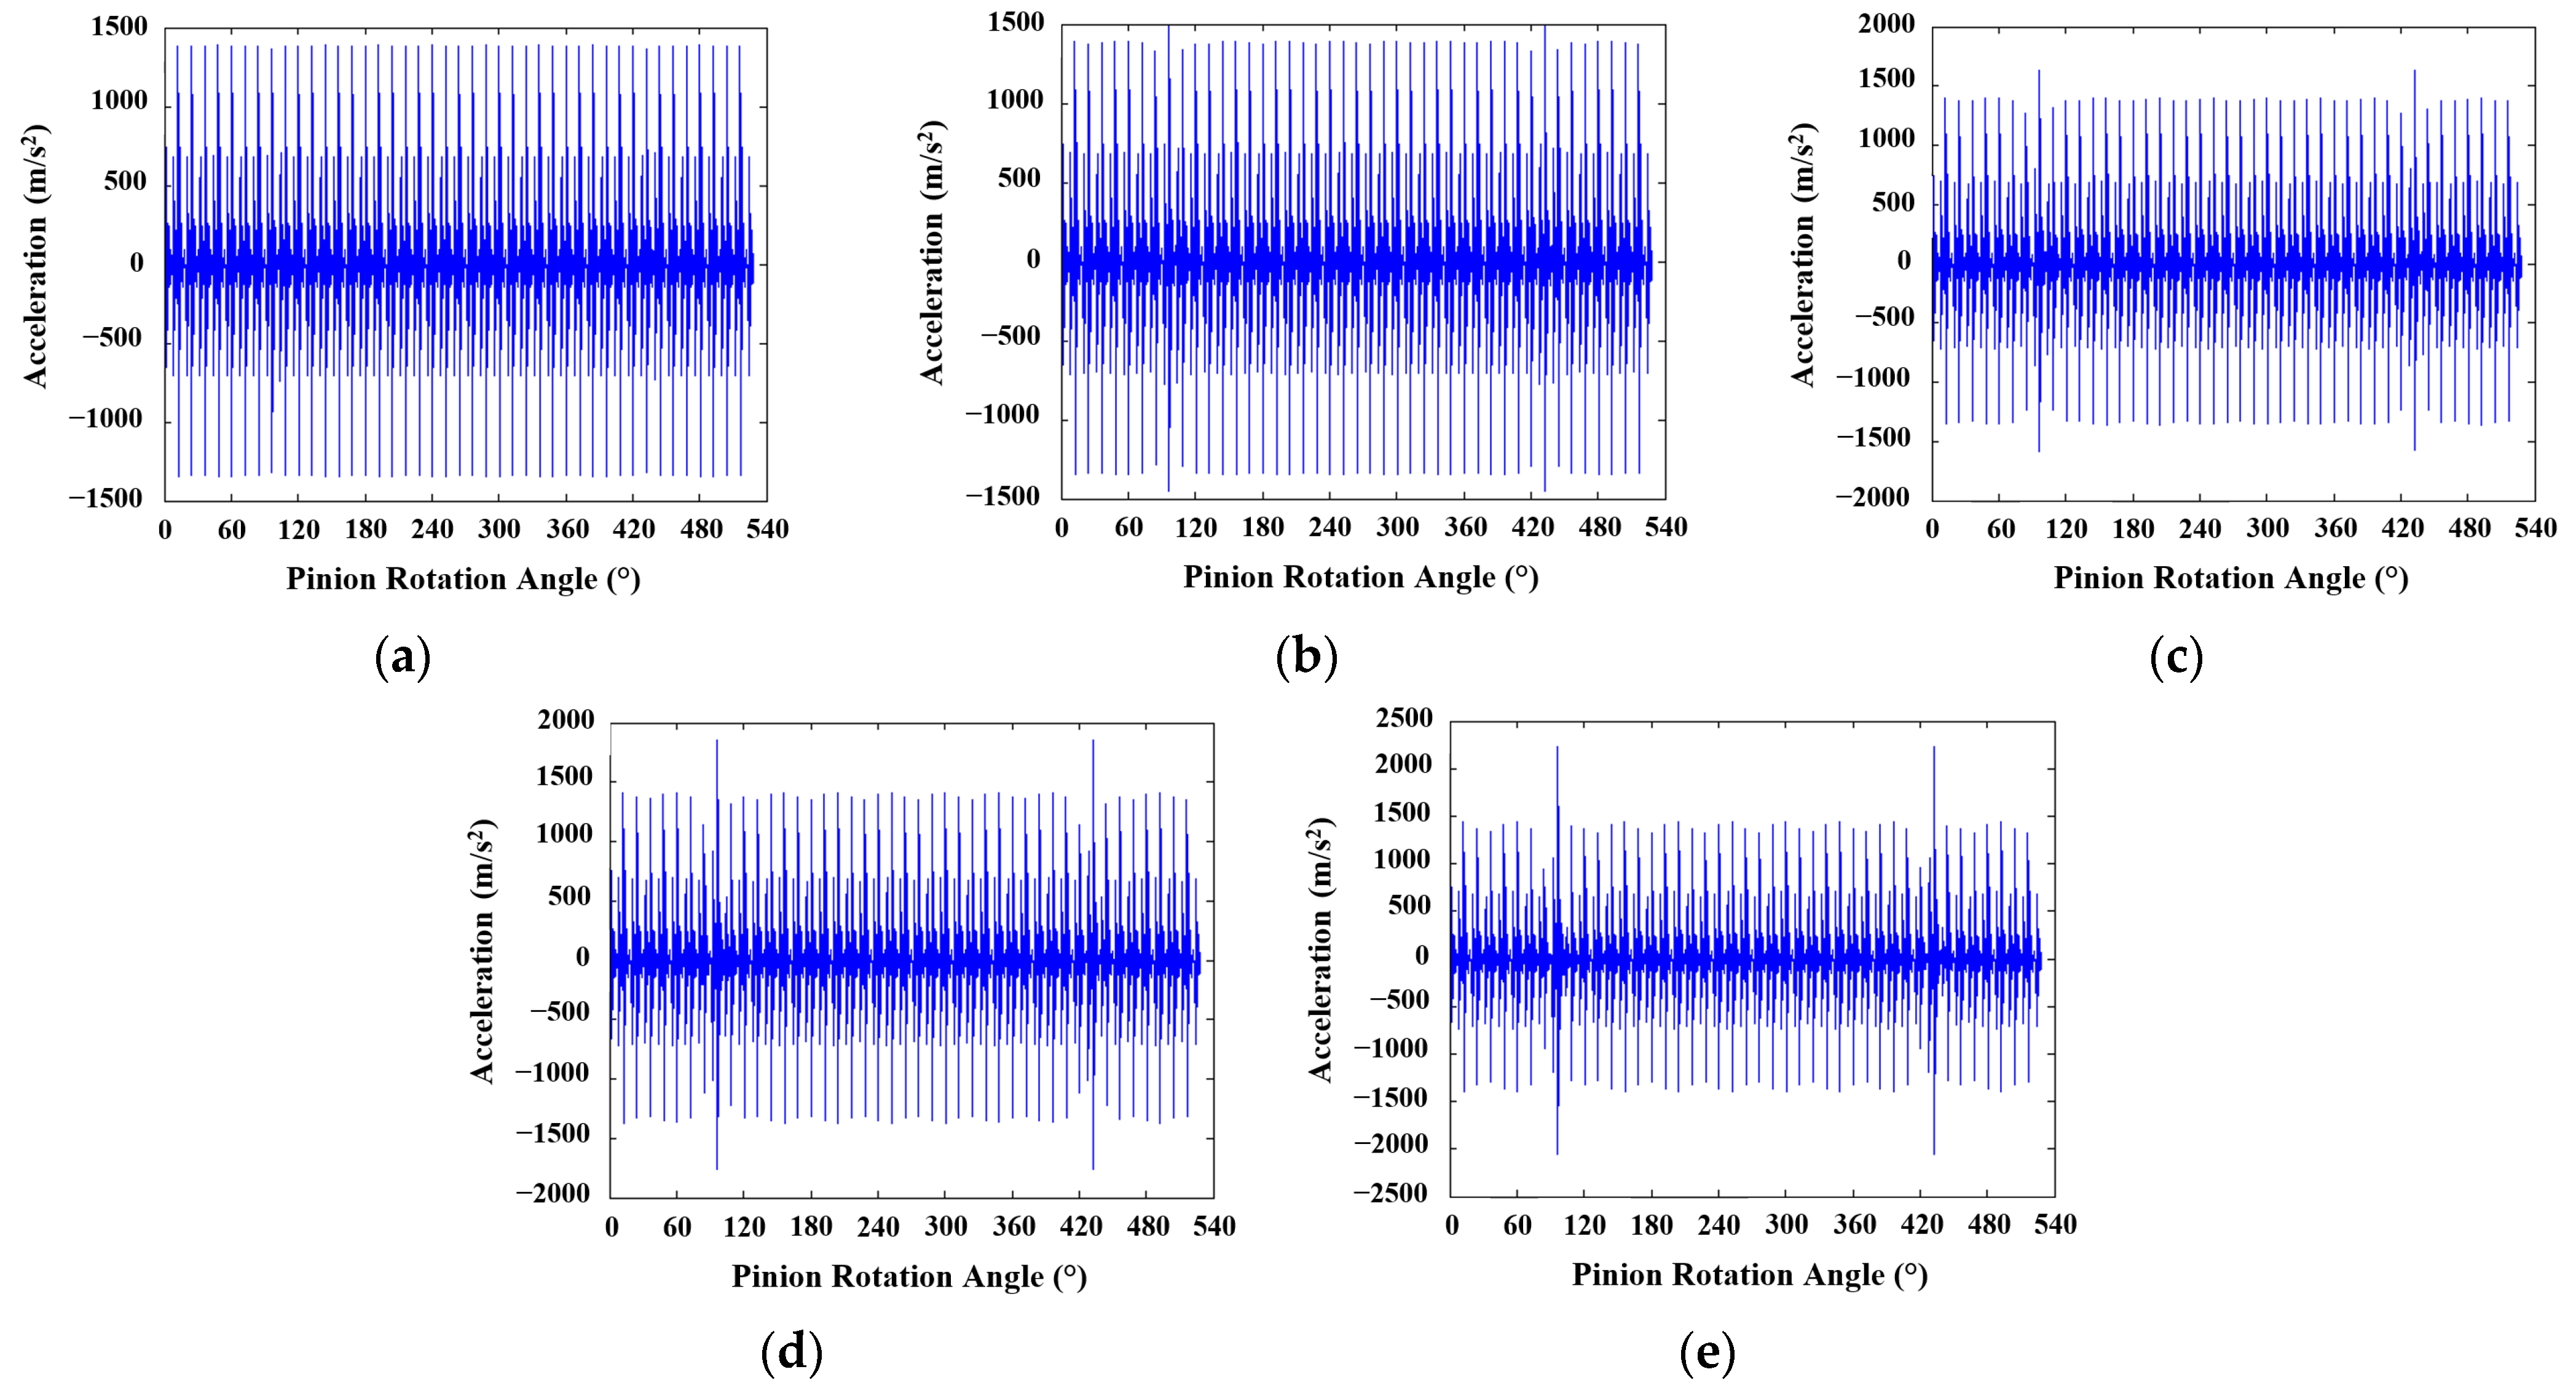
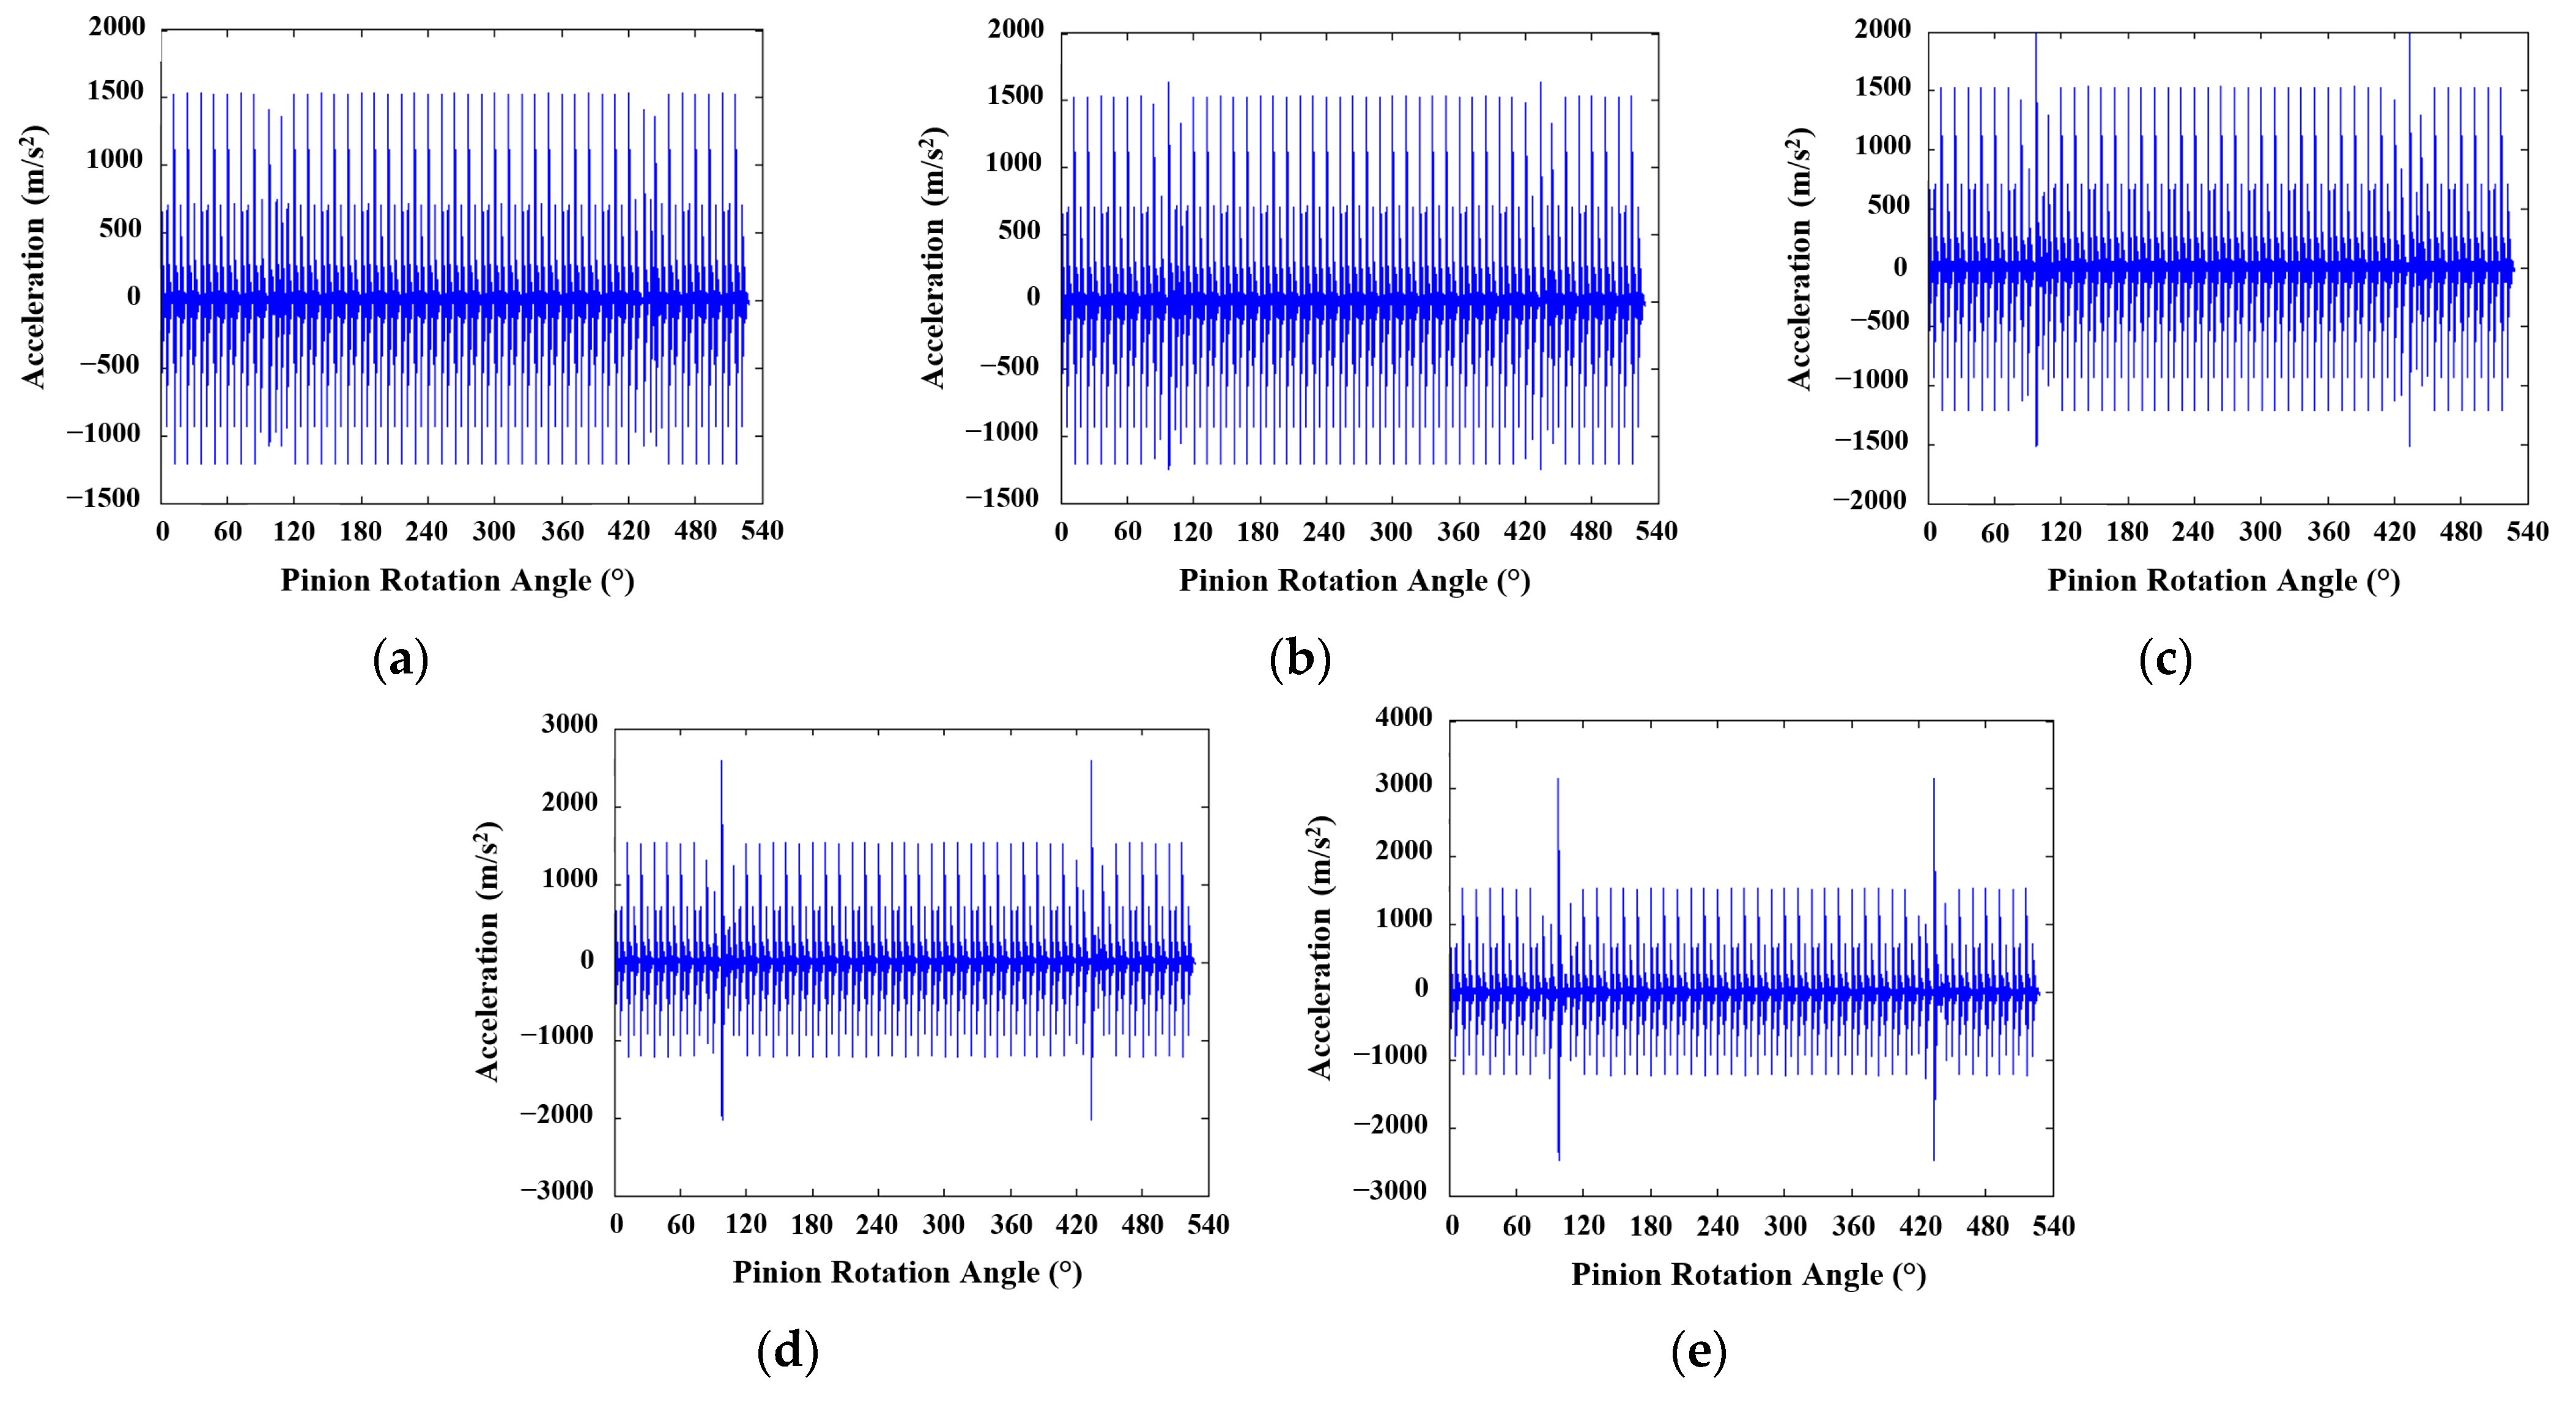
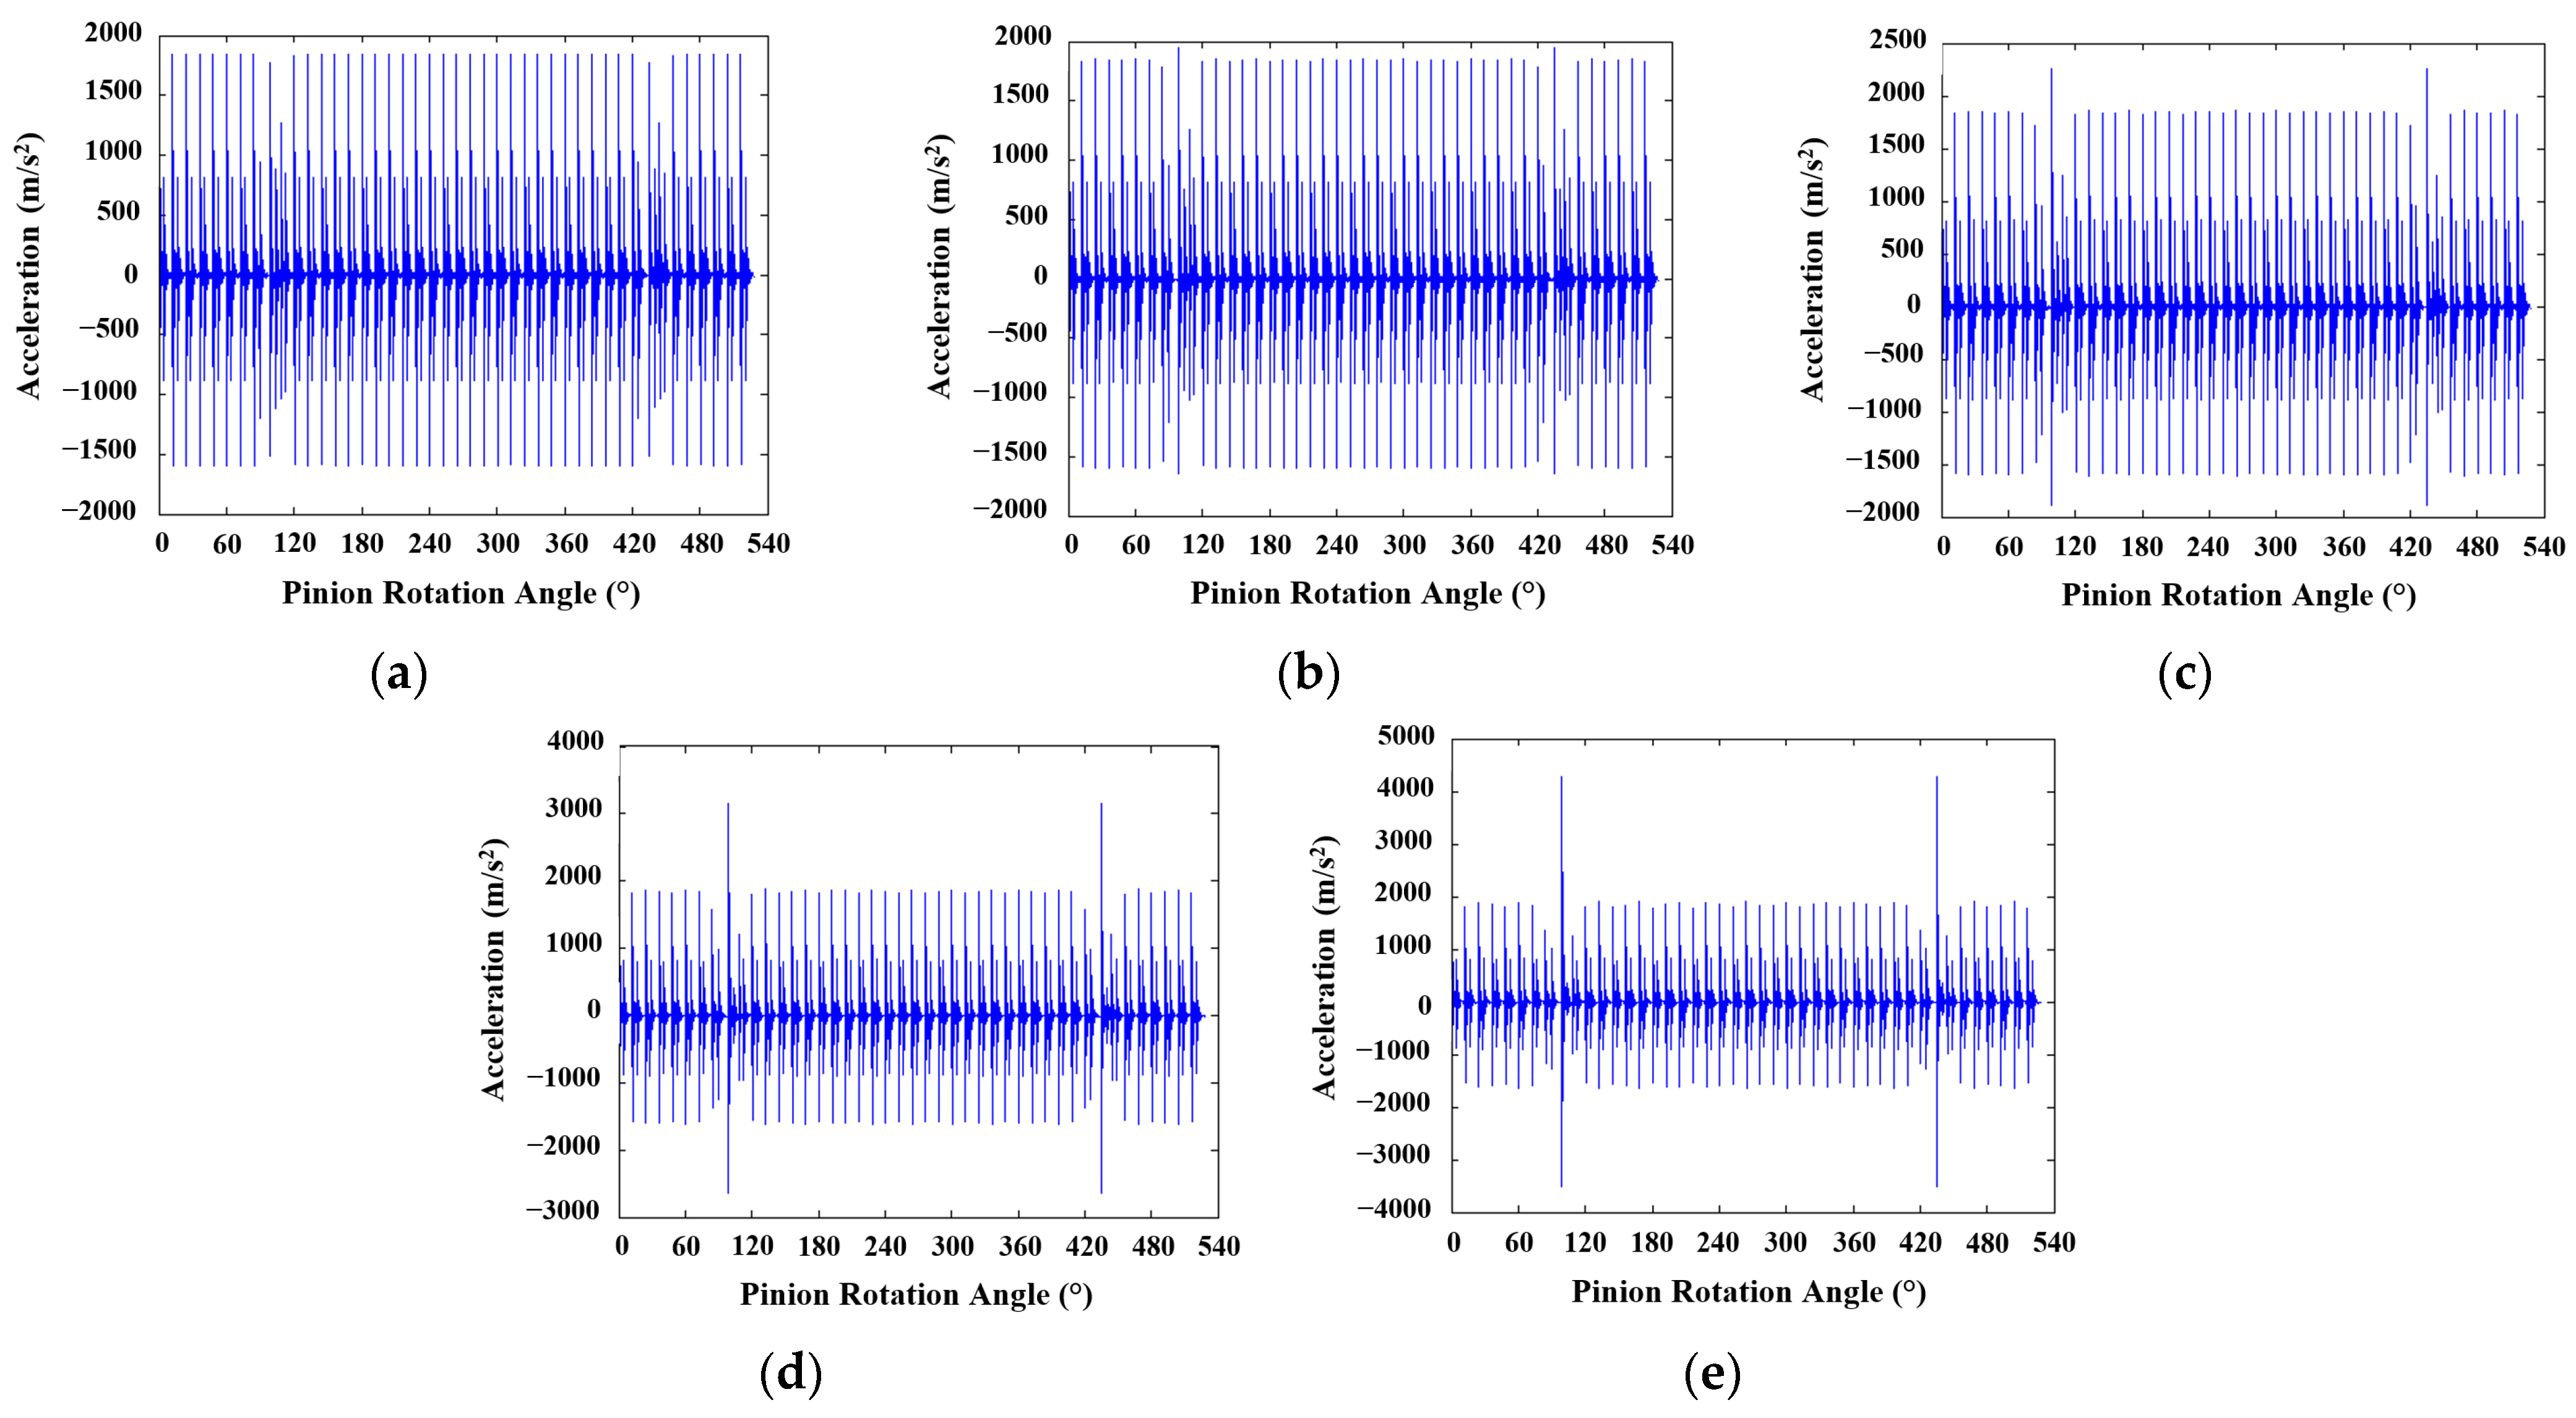
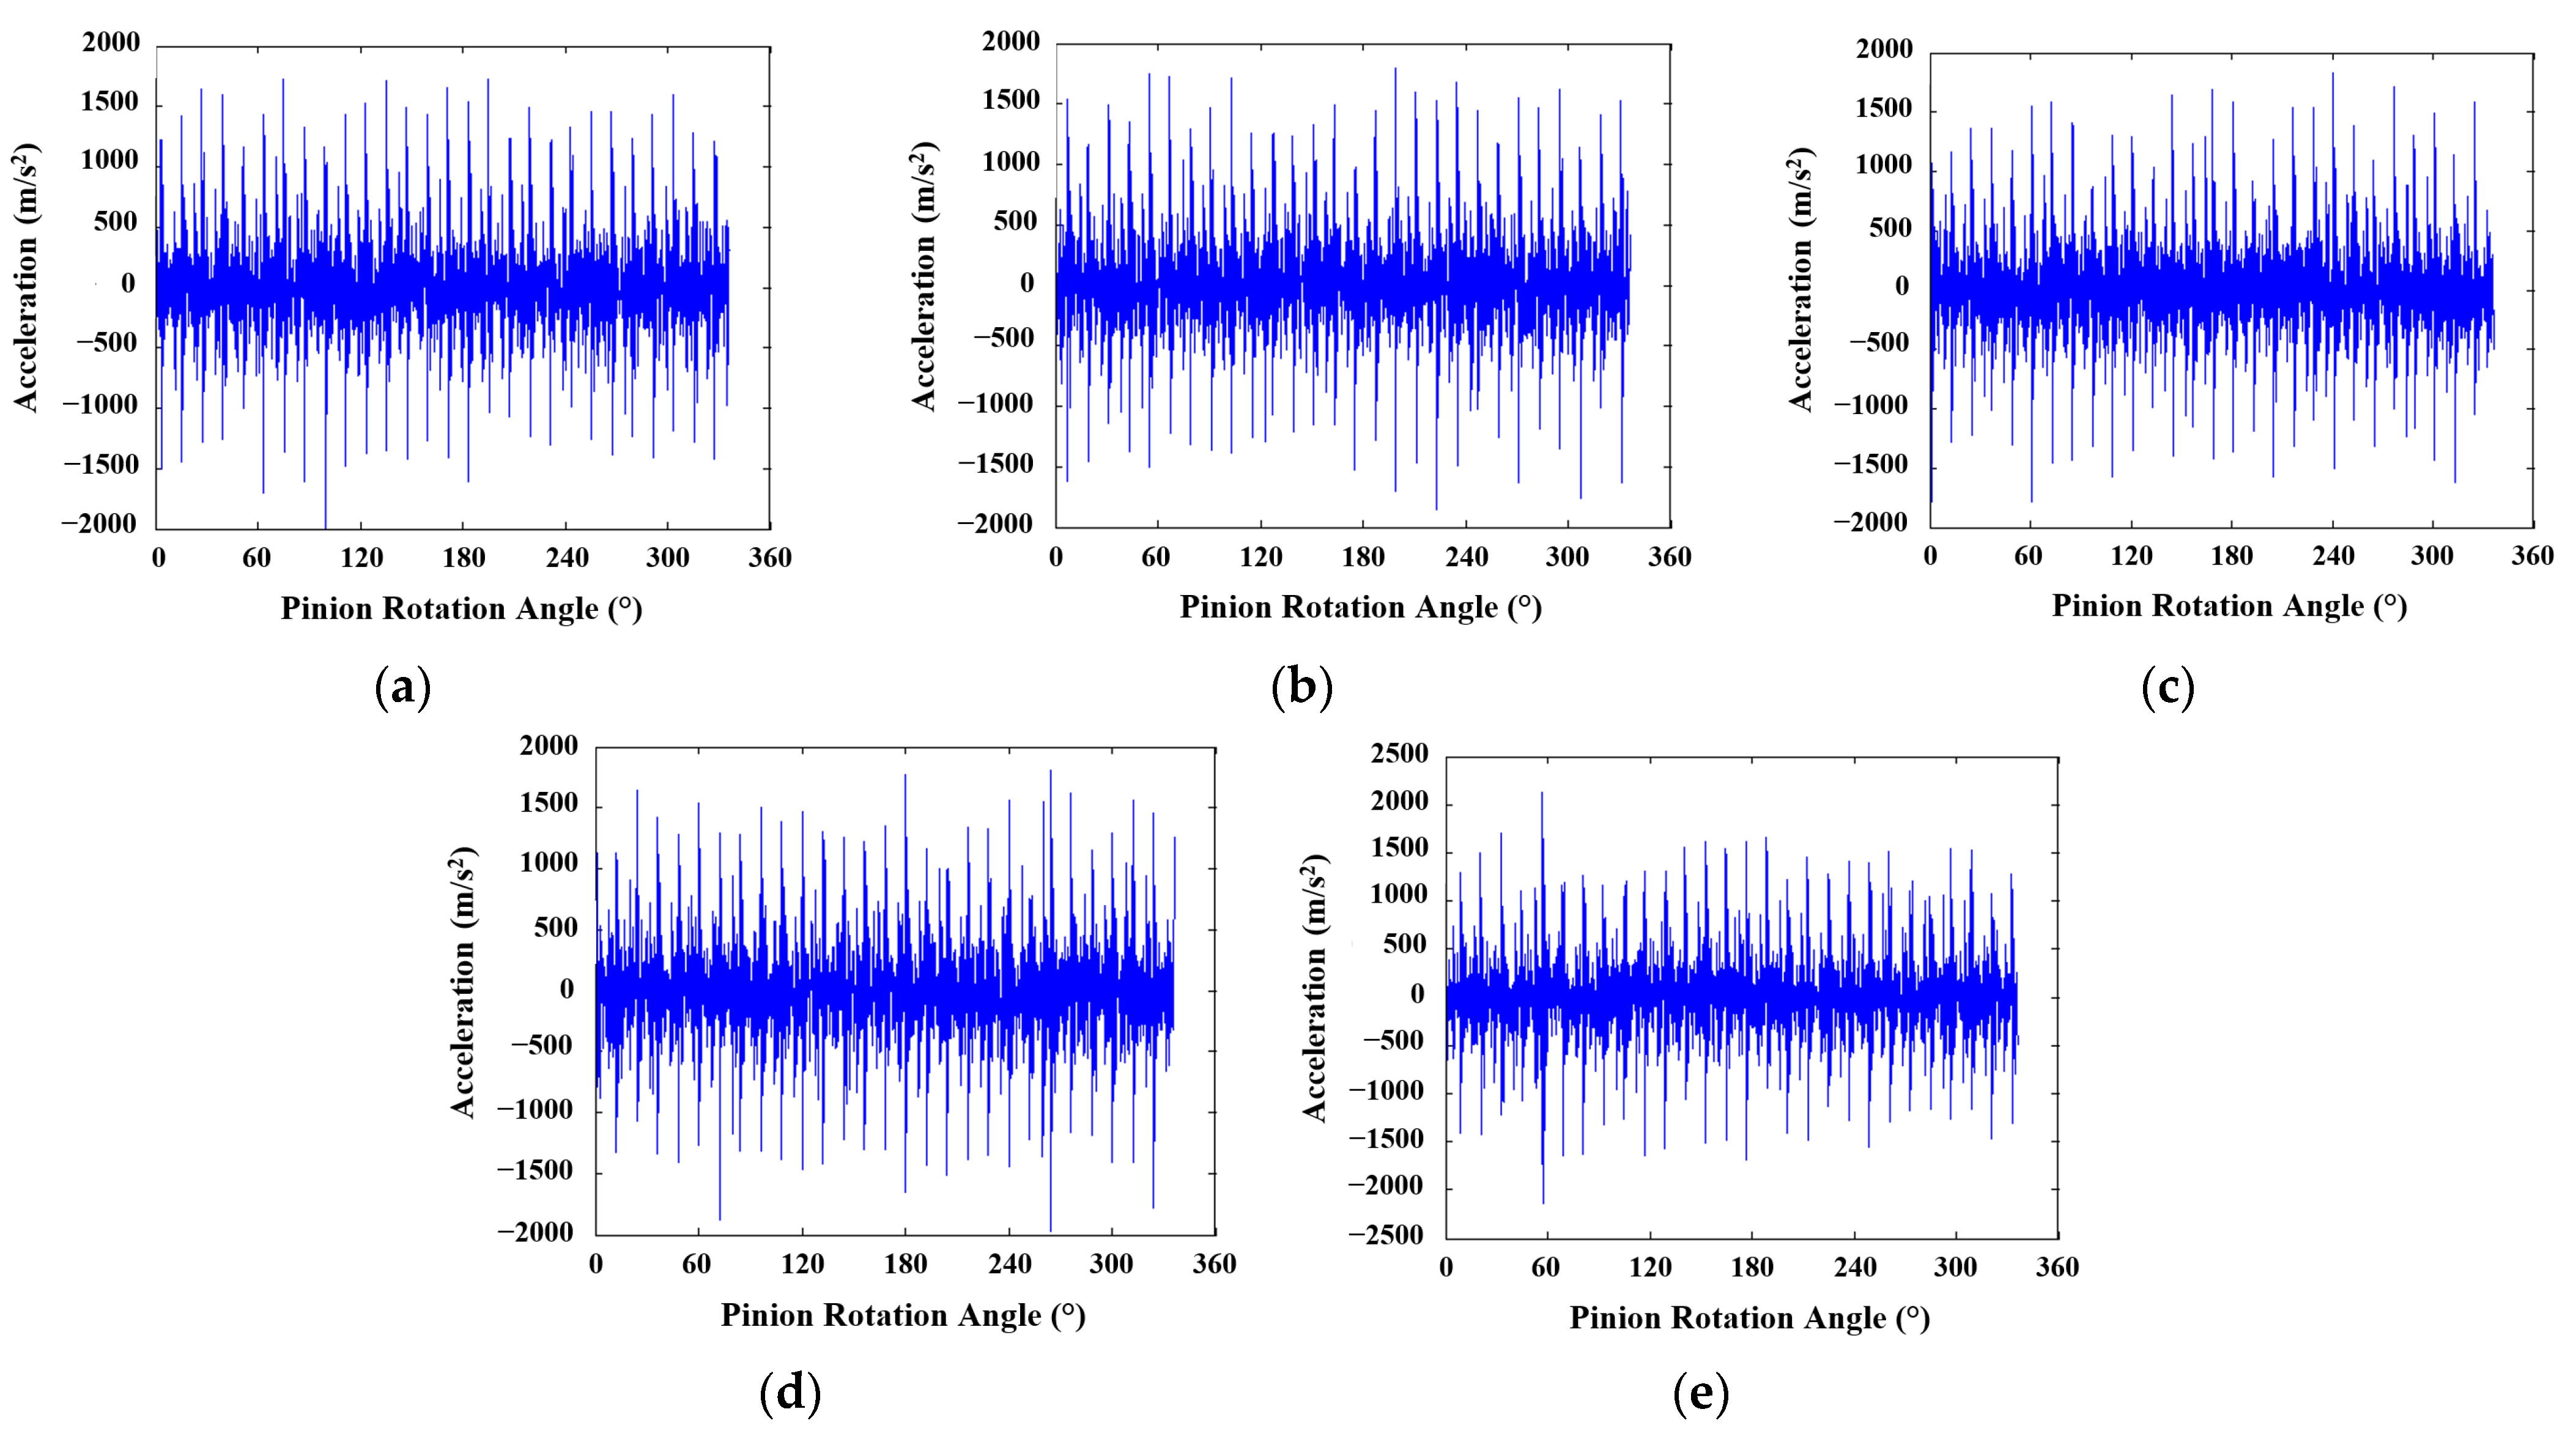
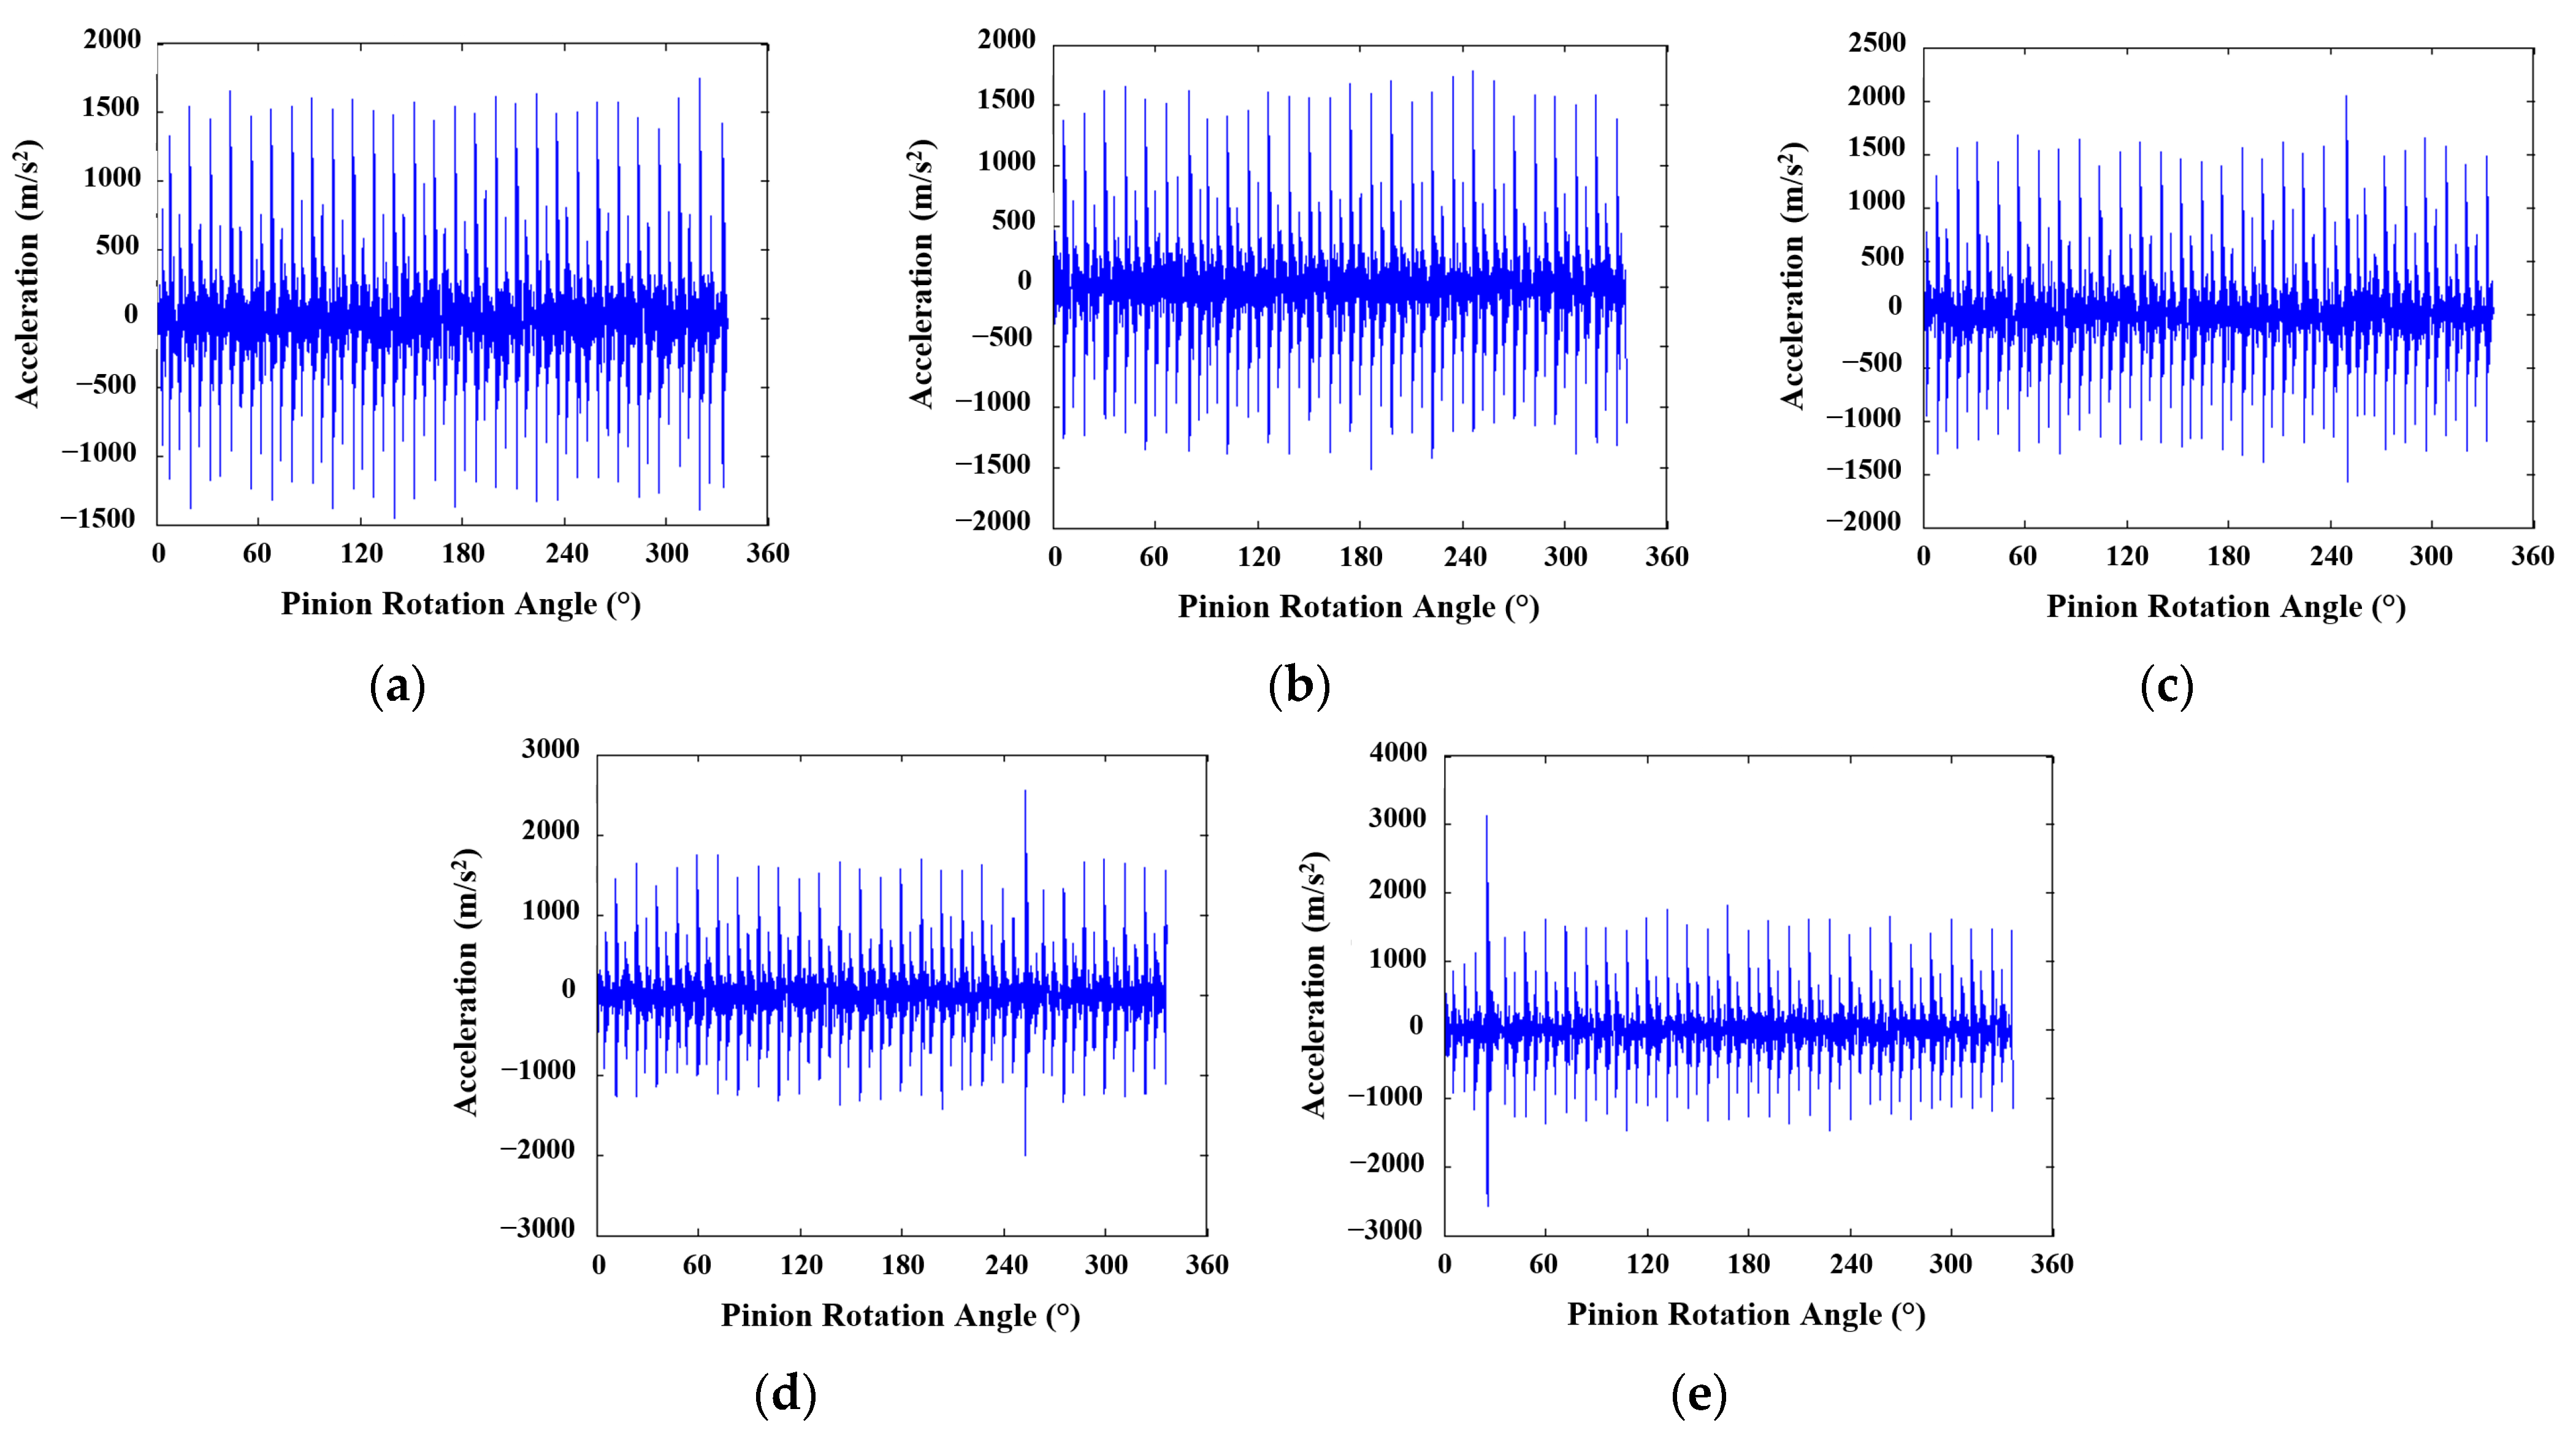
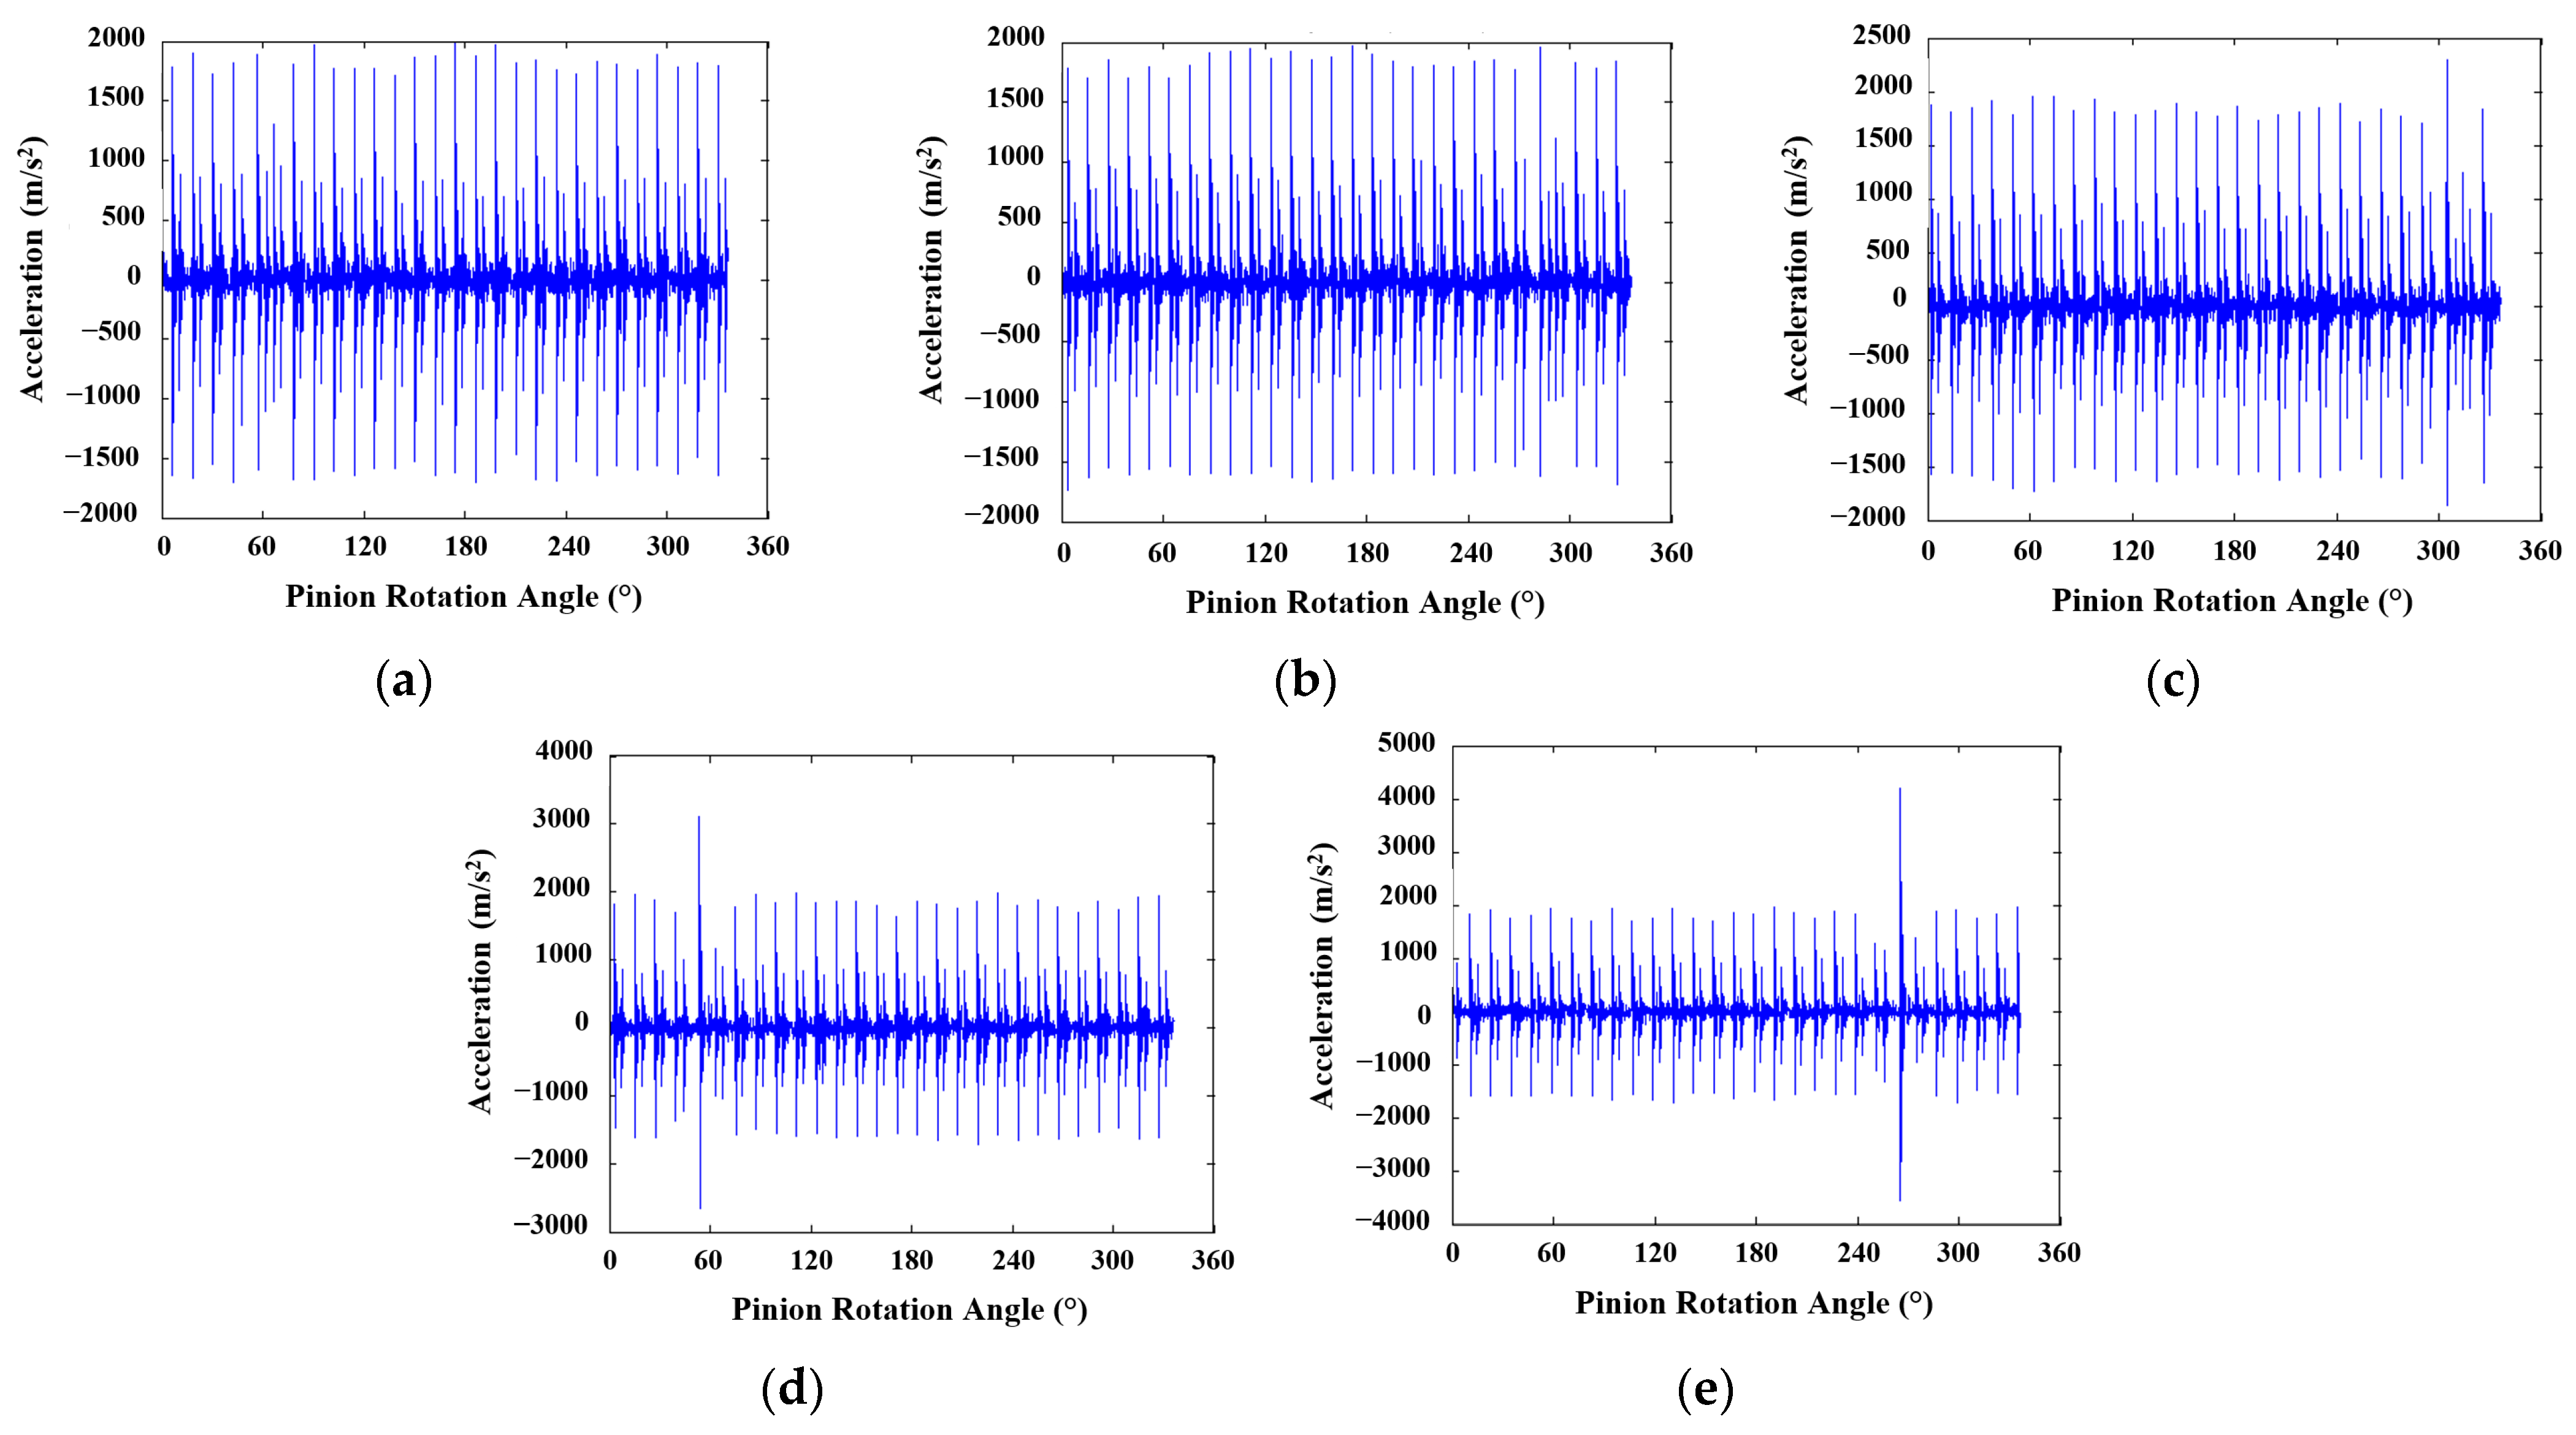
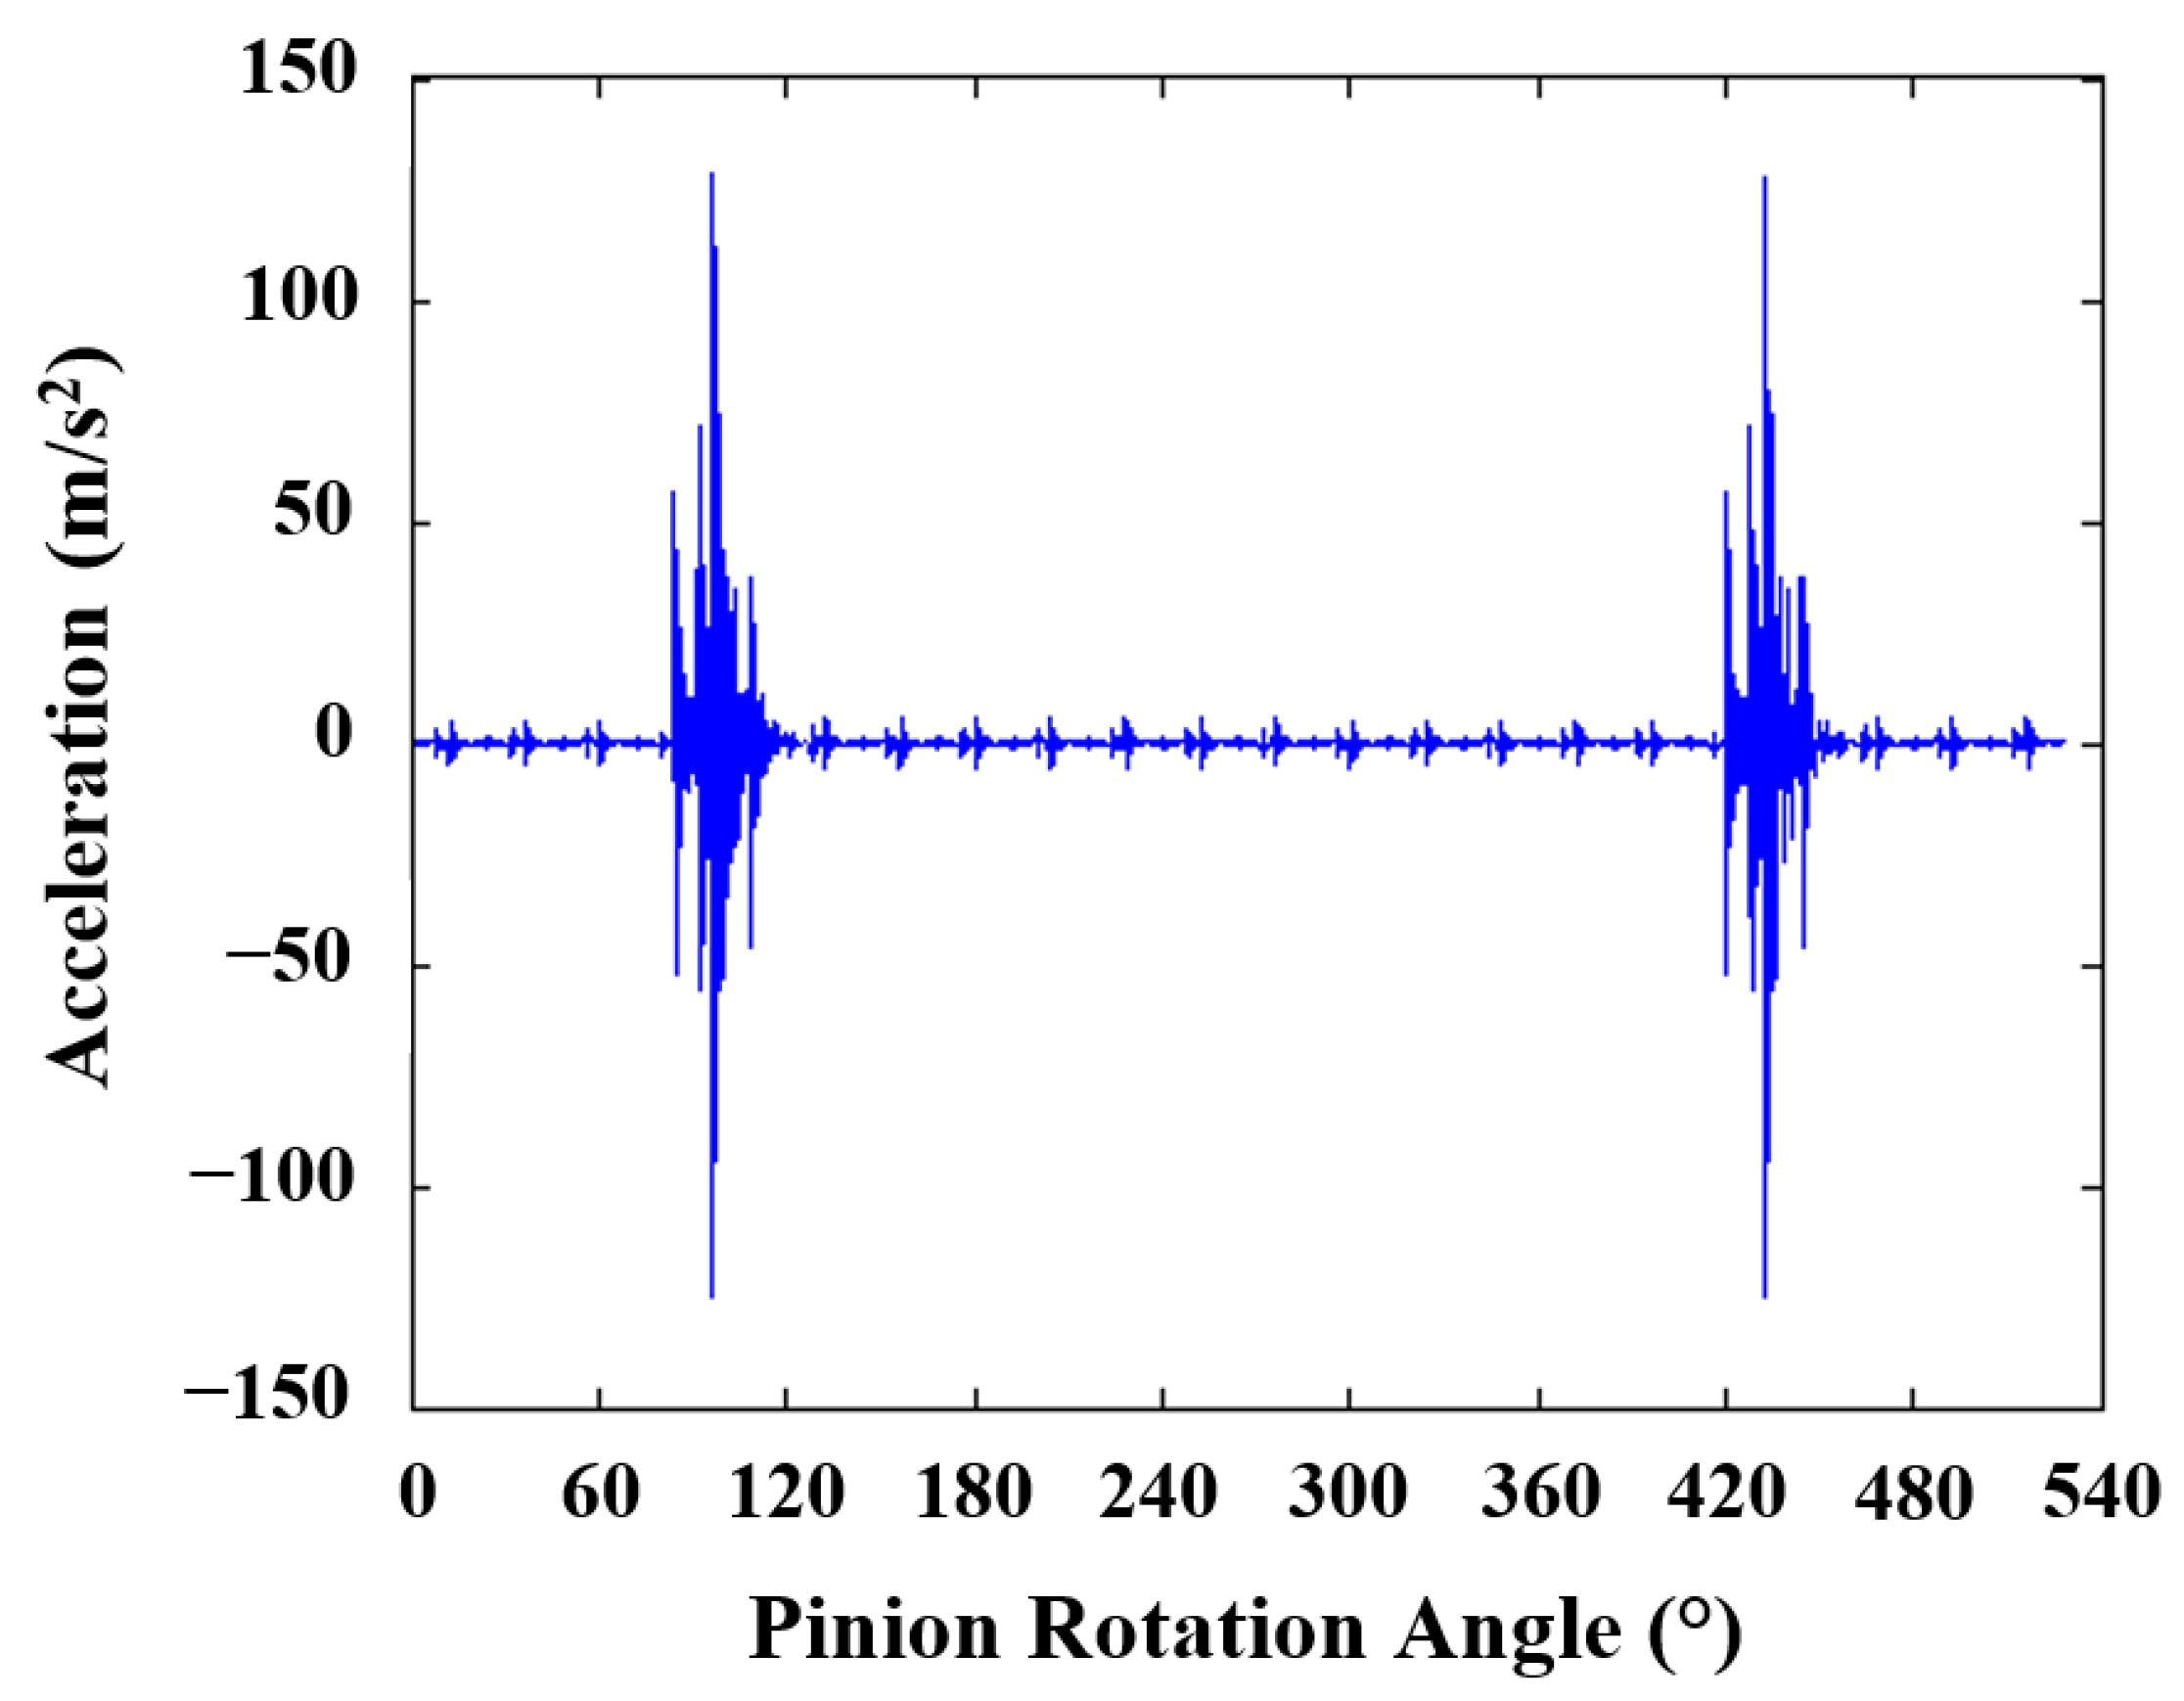
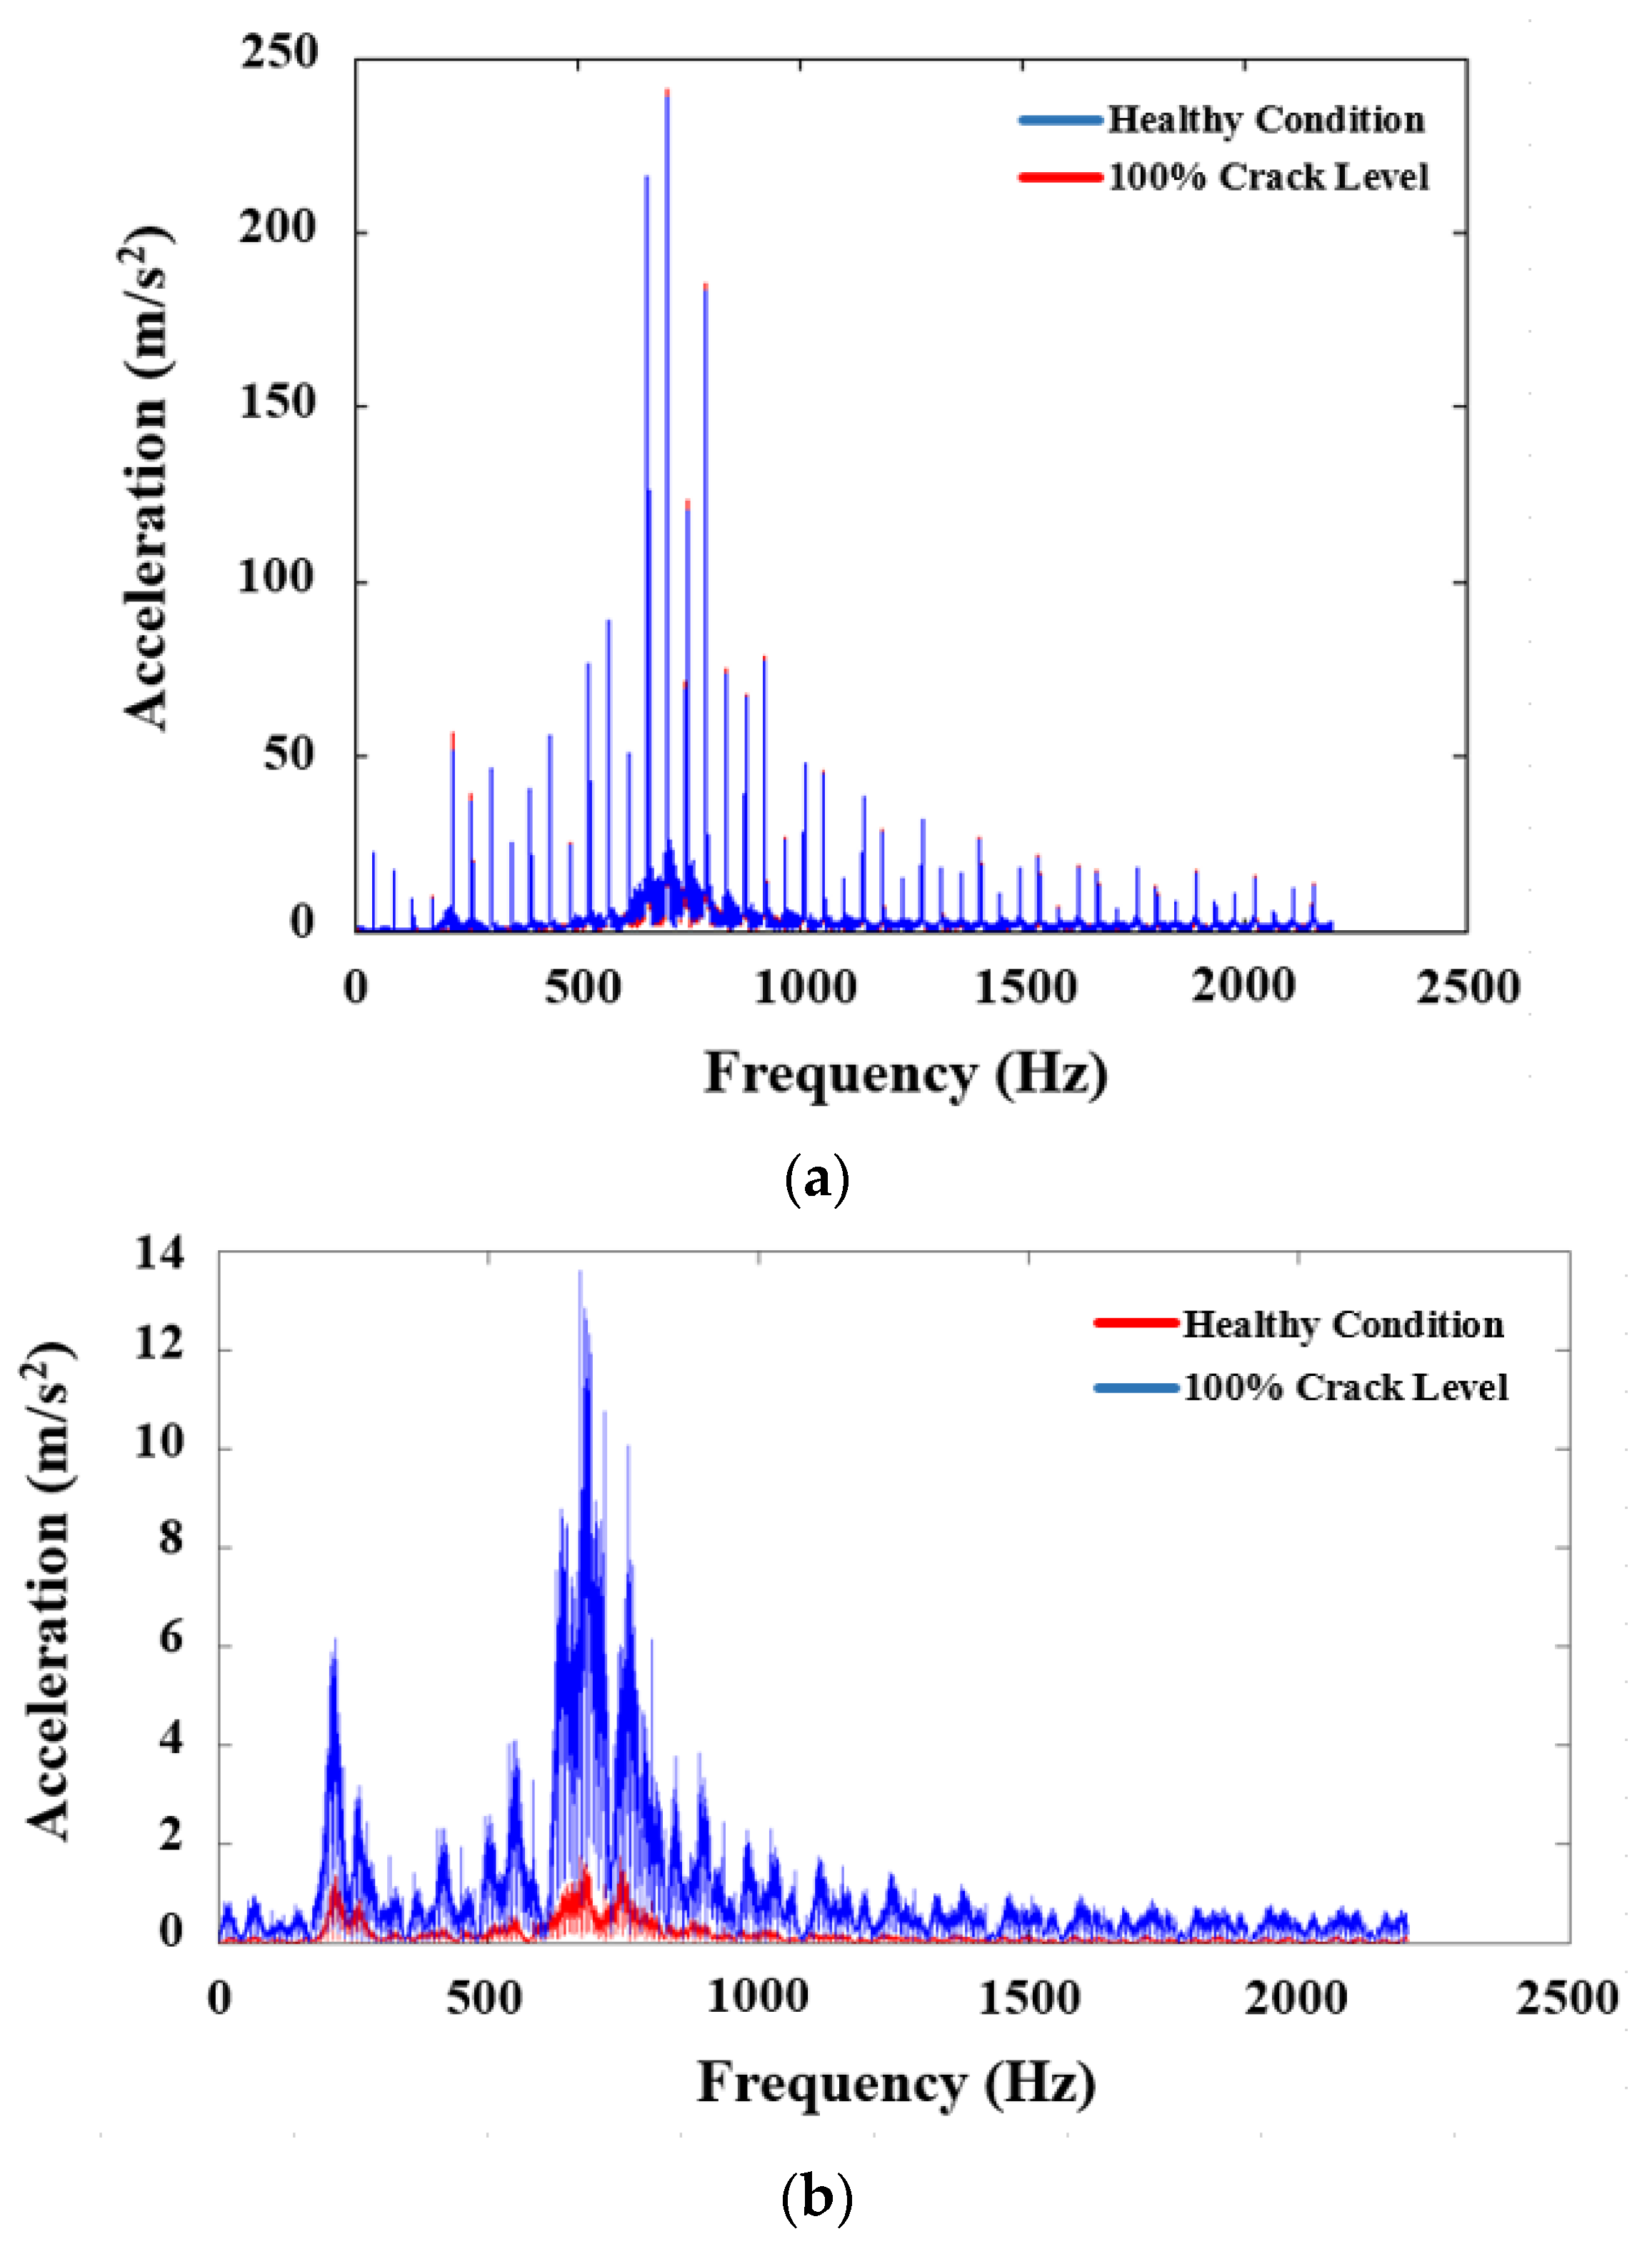
  • In the presence of a tooth crack, a peak (i.e., anomaly) in the vibration response is observed as the faulty tooth enters the meshing;
  • In this regard, the impact of tooth cracks on the vibration signals becomes more pronounced as DSPA increases. This finding holds promise in terms of detecting tooth cracks more easily through a DL-based method.
As can be seen from Figure 6, Figure 7 and Figure 8, the vibration responses collected through the 6-DOF dynamic model are perfect, meaning noise-free signals. Therefore, the present study added three levels of Gaussian noise to the simulated signals in order to complicate the early fault diagnosis task. In this regard, SNRs of 5, 10, and 15 were added to vibration signals in accordance with the available literature [19]. Herein, an example of vibration signals with one SNR level for each tooth profile is depicted in Figure 9, Figure 10 and Figure 11, respectively, considering the conciseness.
The present research work comparatively examined the influence of DSPA (i.e., tooth asymmetry) on the fault classification accuracy of the developed 1-D CNN model, considering three SNRs. To interpret the model stability, the tests were repeated three times (i.e., number of trials), and the standard deviation (SD) values were computed for each case identified within the scope of the present study.
After three tests, the average fault classification accuracies for the standard (20°/20°) profiled involute spur gears were obtained as 79.854%, 91.274%, and 95.100% for SNR values of 5, 10, and 15, respectively. Accordingly, the present study acquired overall classification accuracies for the 20°/25° tooth profile as 88.323%, 95.804%, and 99.195% under the same circumstances (i.e., SNR), respectively. Finally, the average classification accuracies for the 20°/30° tooth profile were obtained as 90.068%, 96.476%, and 99.251% for SNR values of 5, 10, and 15, respectively. Table 7 summarizes the findings obtained for three DSPAs and SNRs using the developed 1-D CNN model.
In this regard, the findings presented in Table 7 can be interpreted as follows.
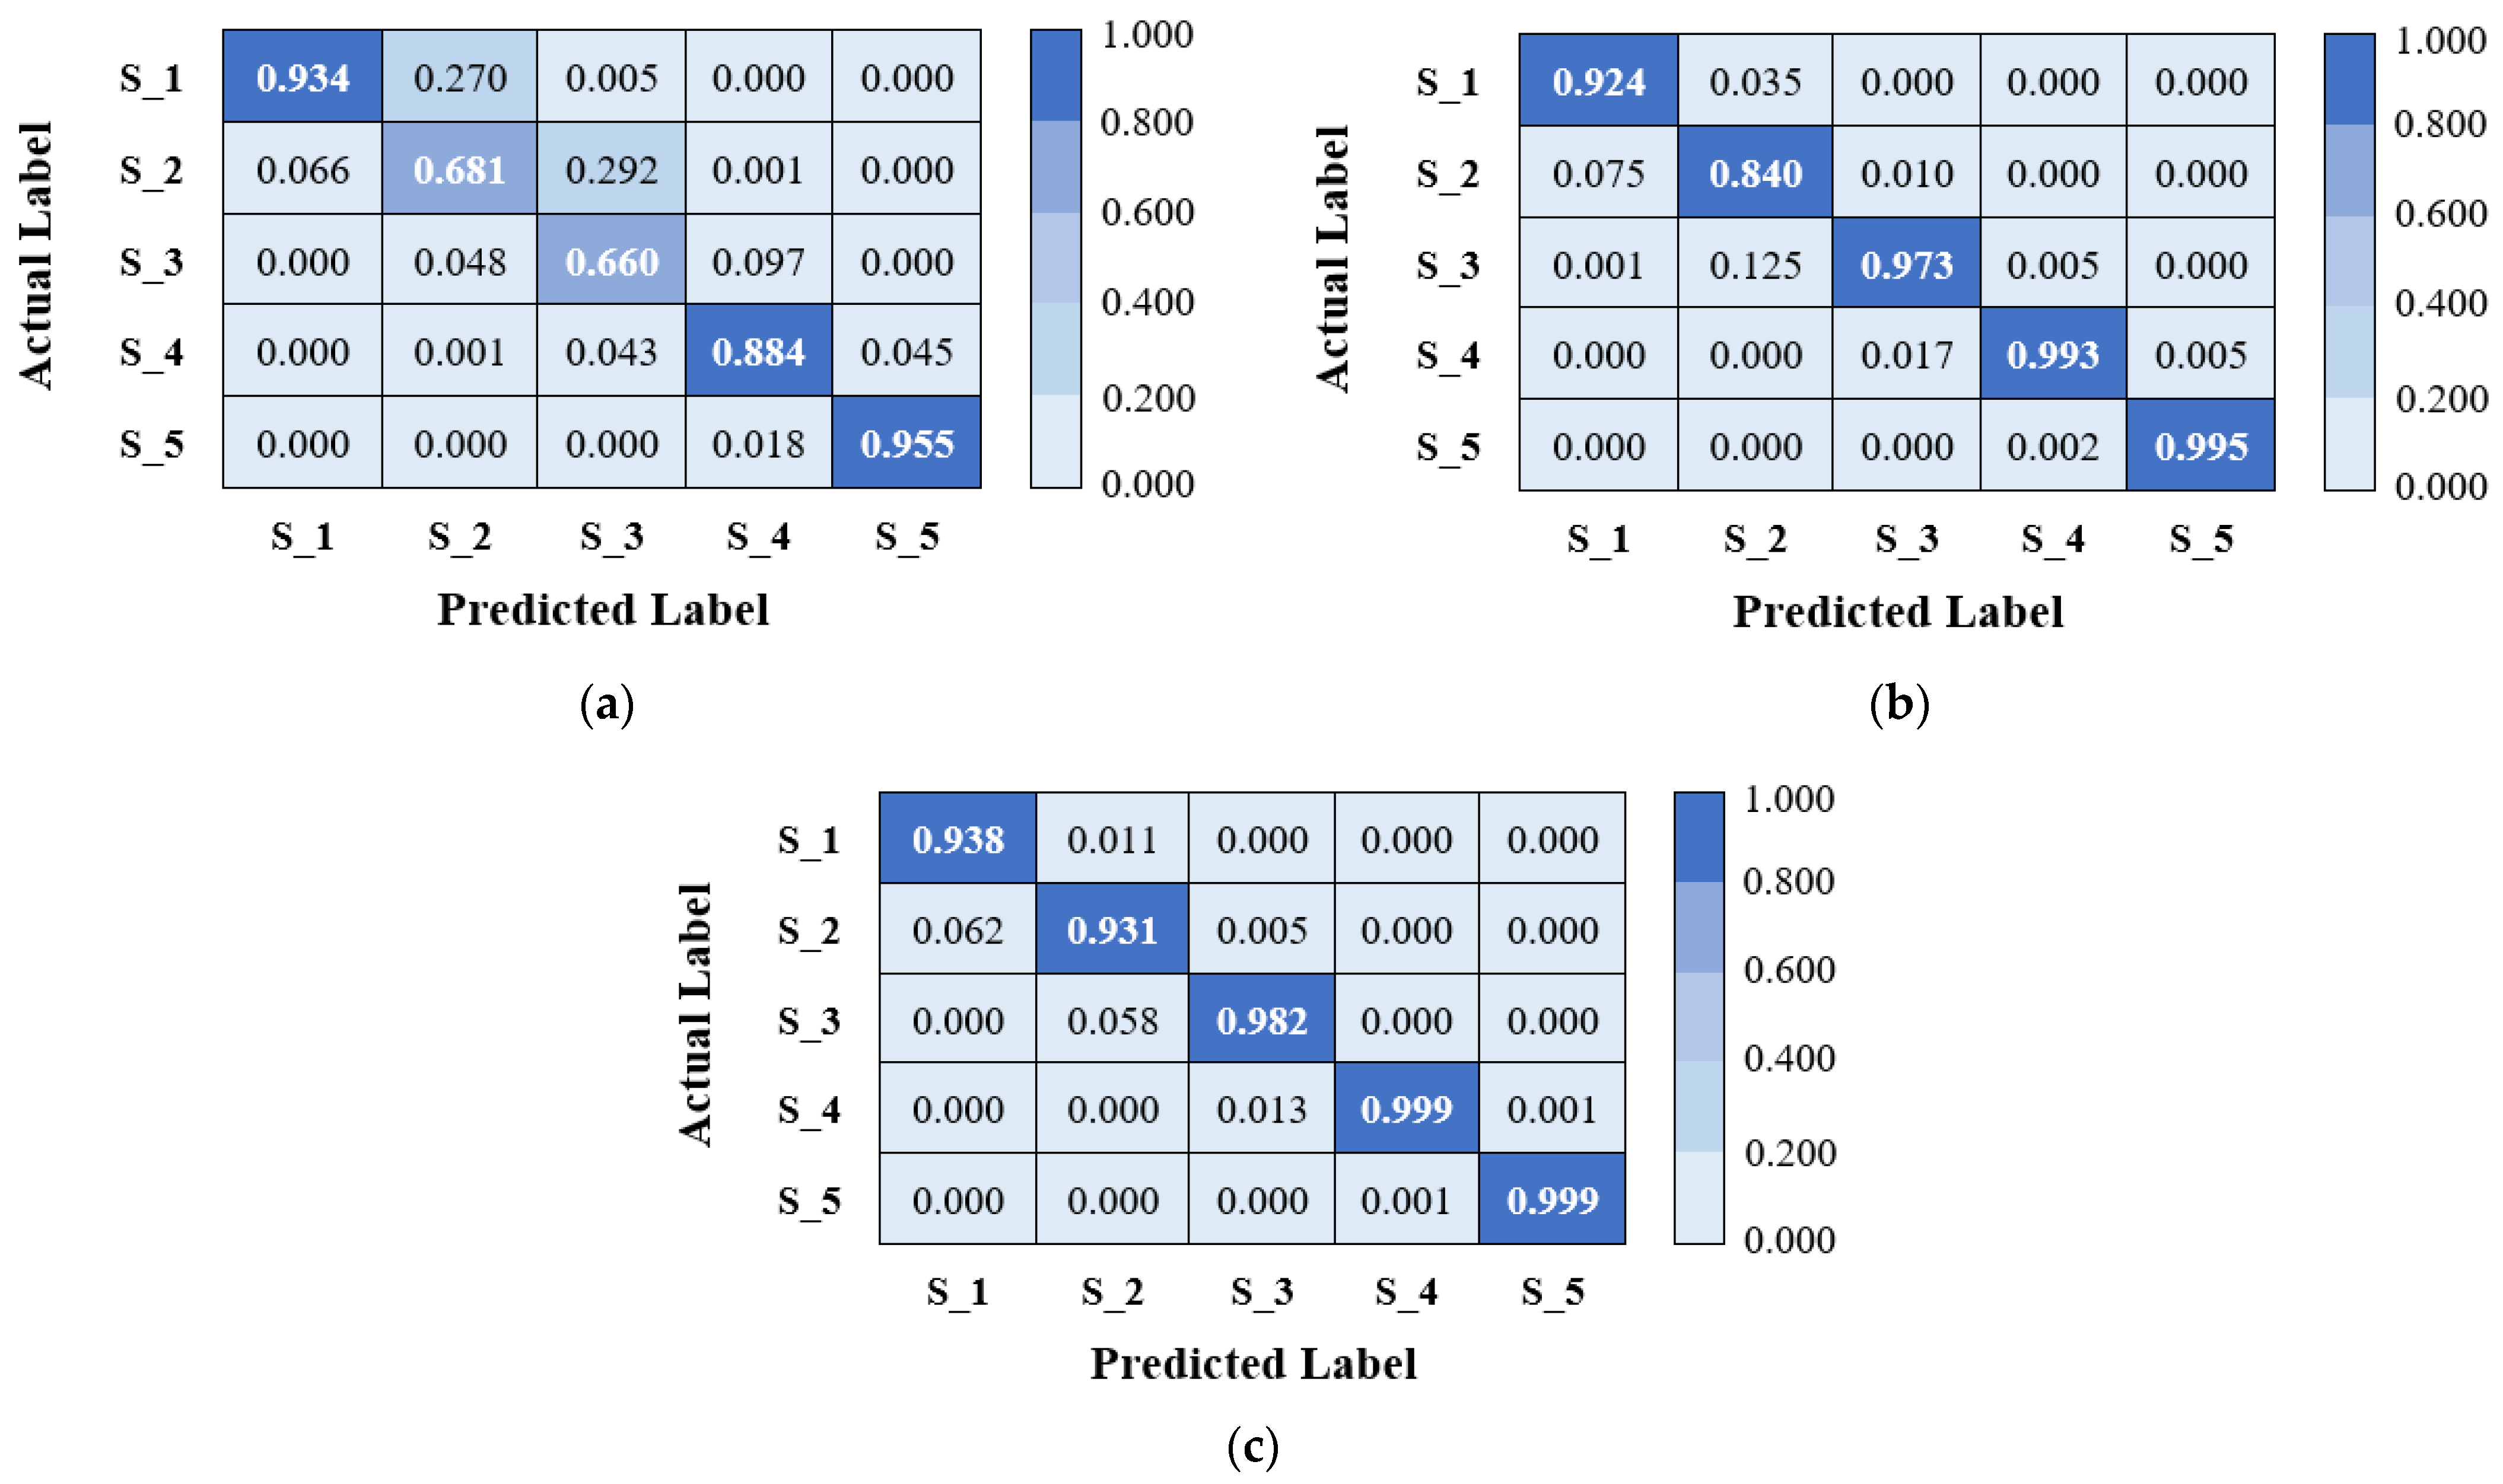
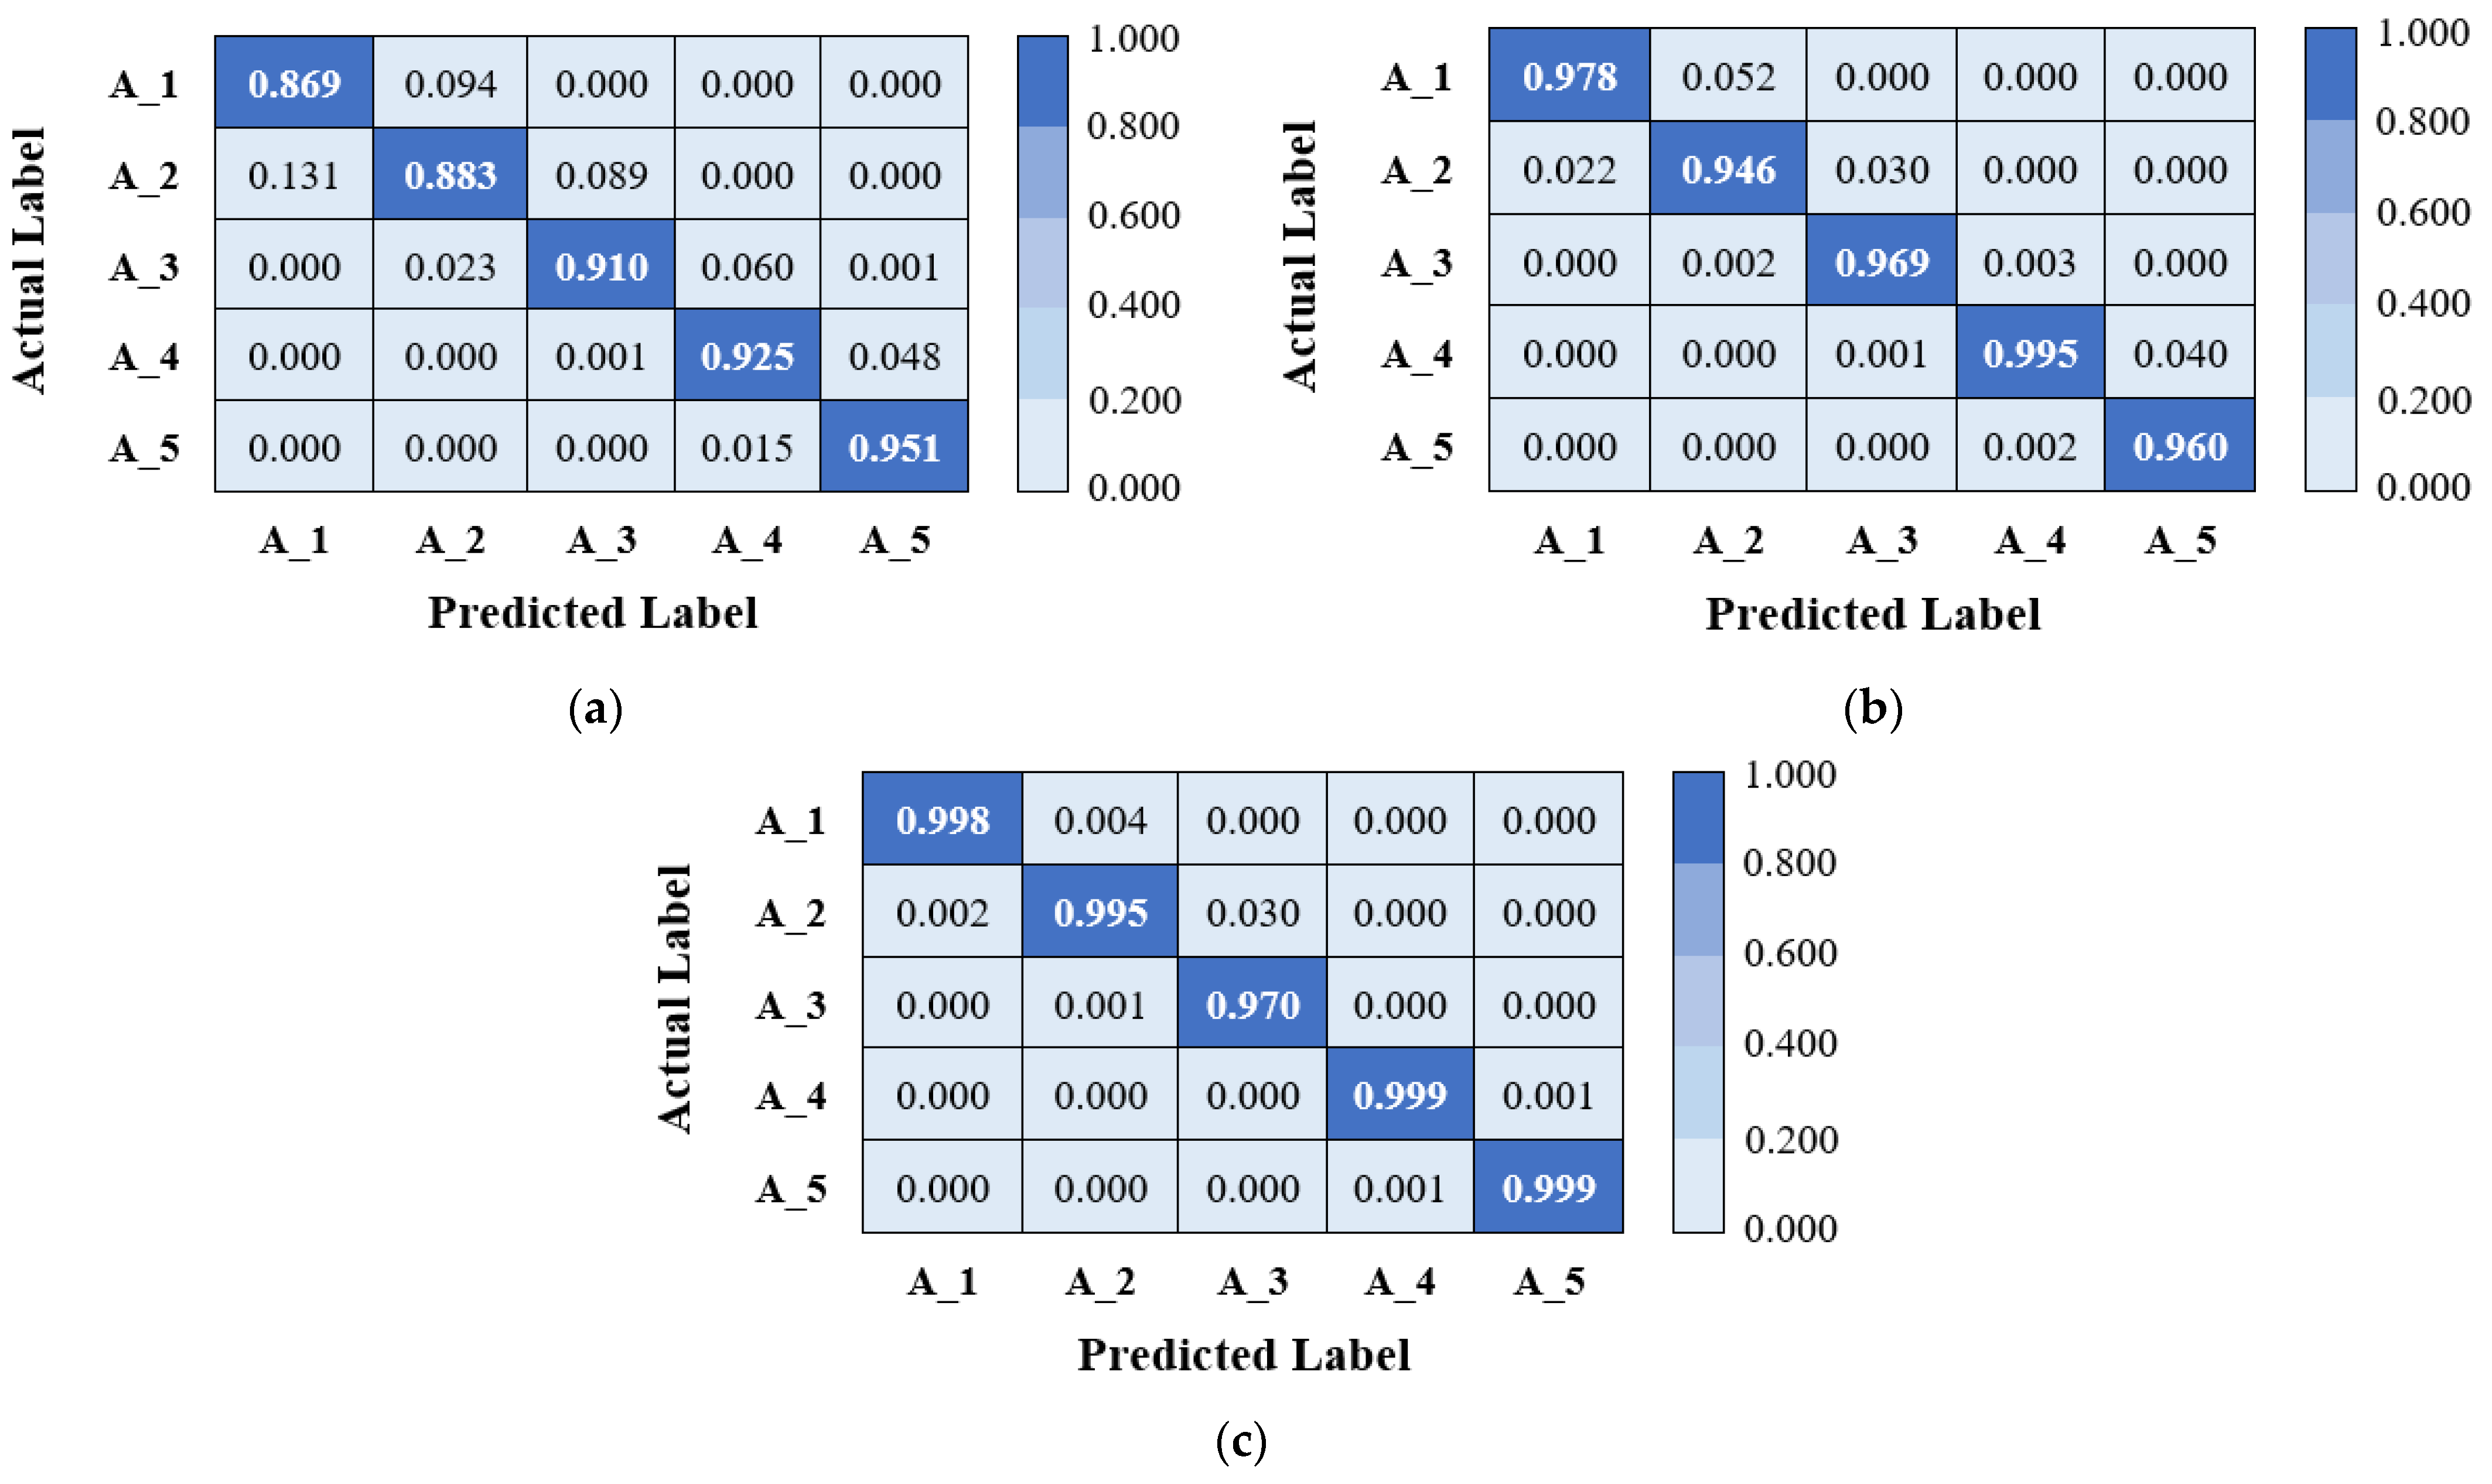
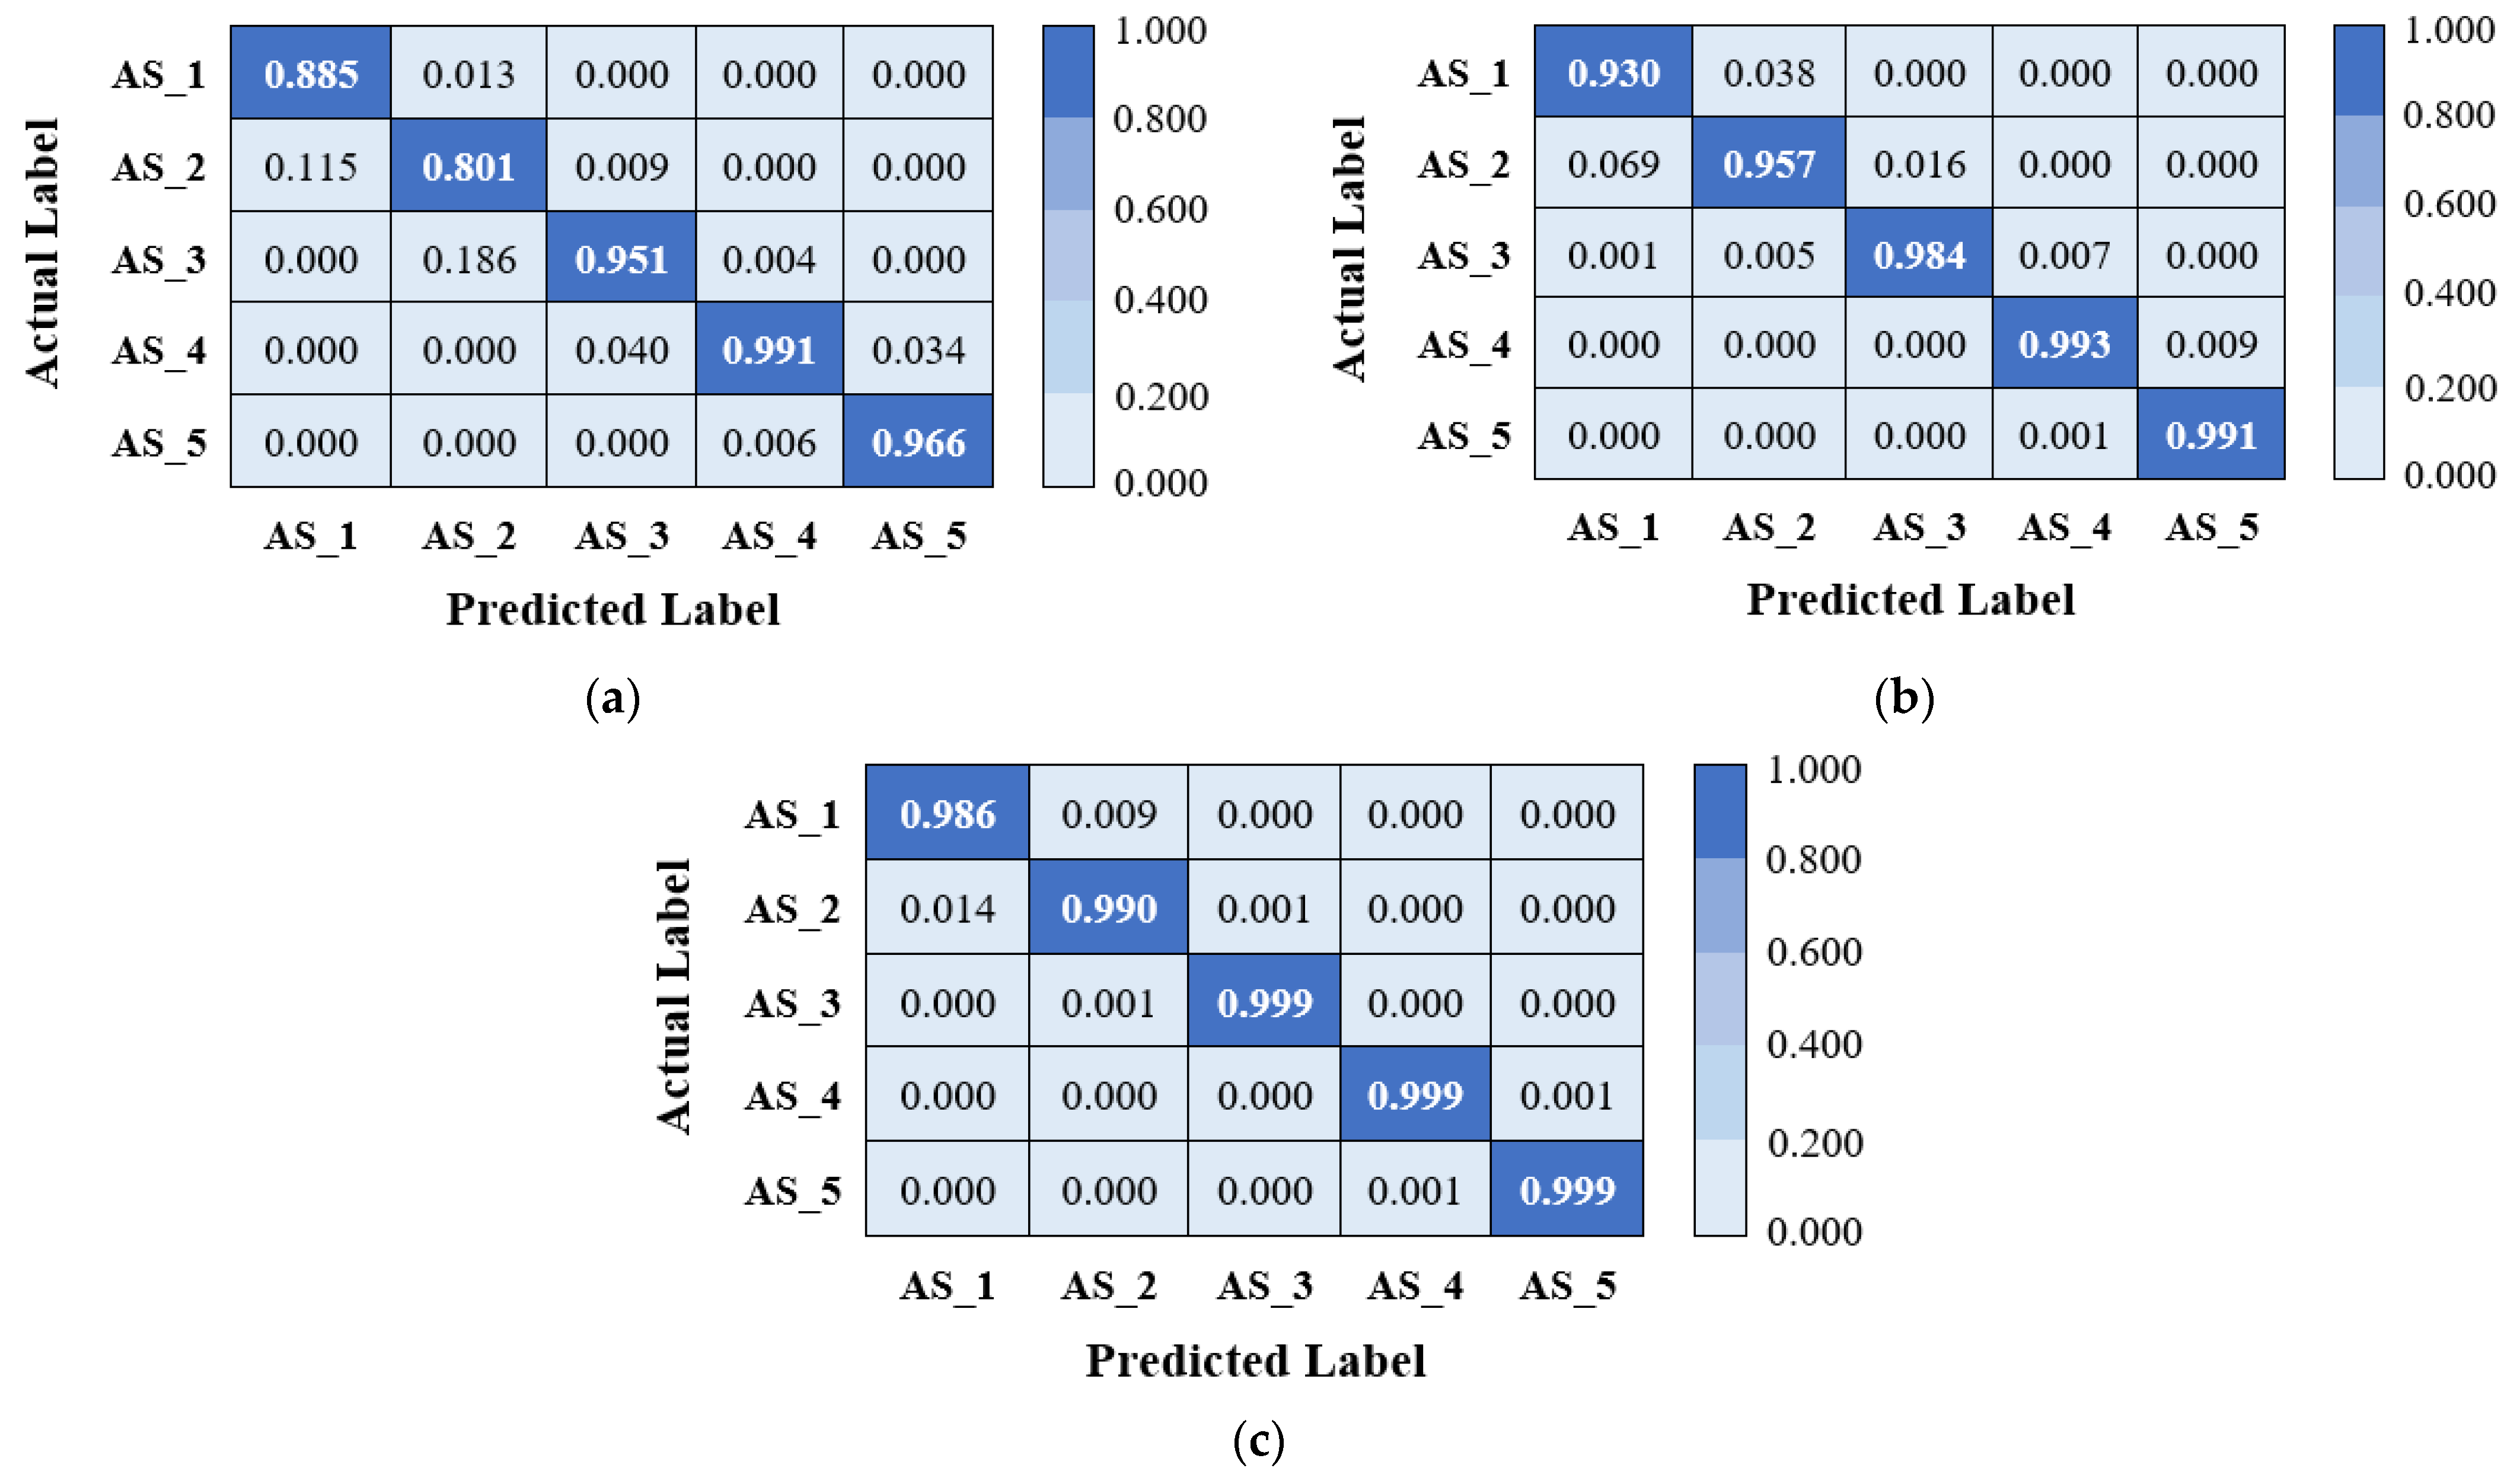
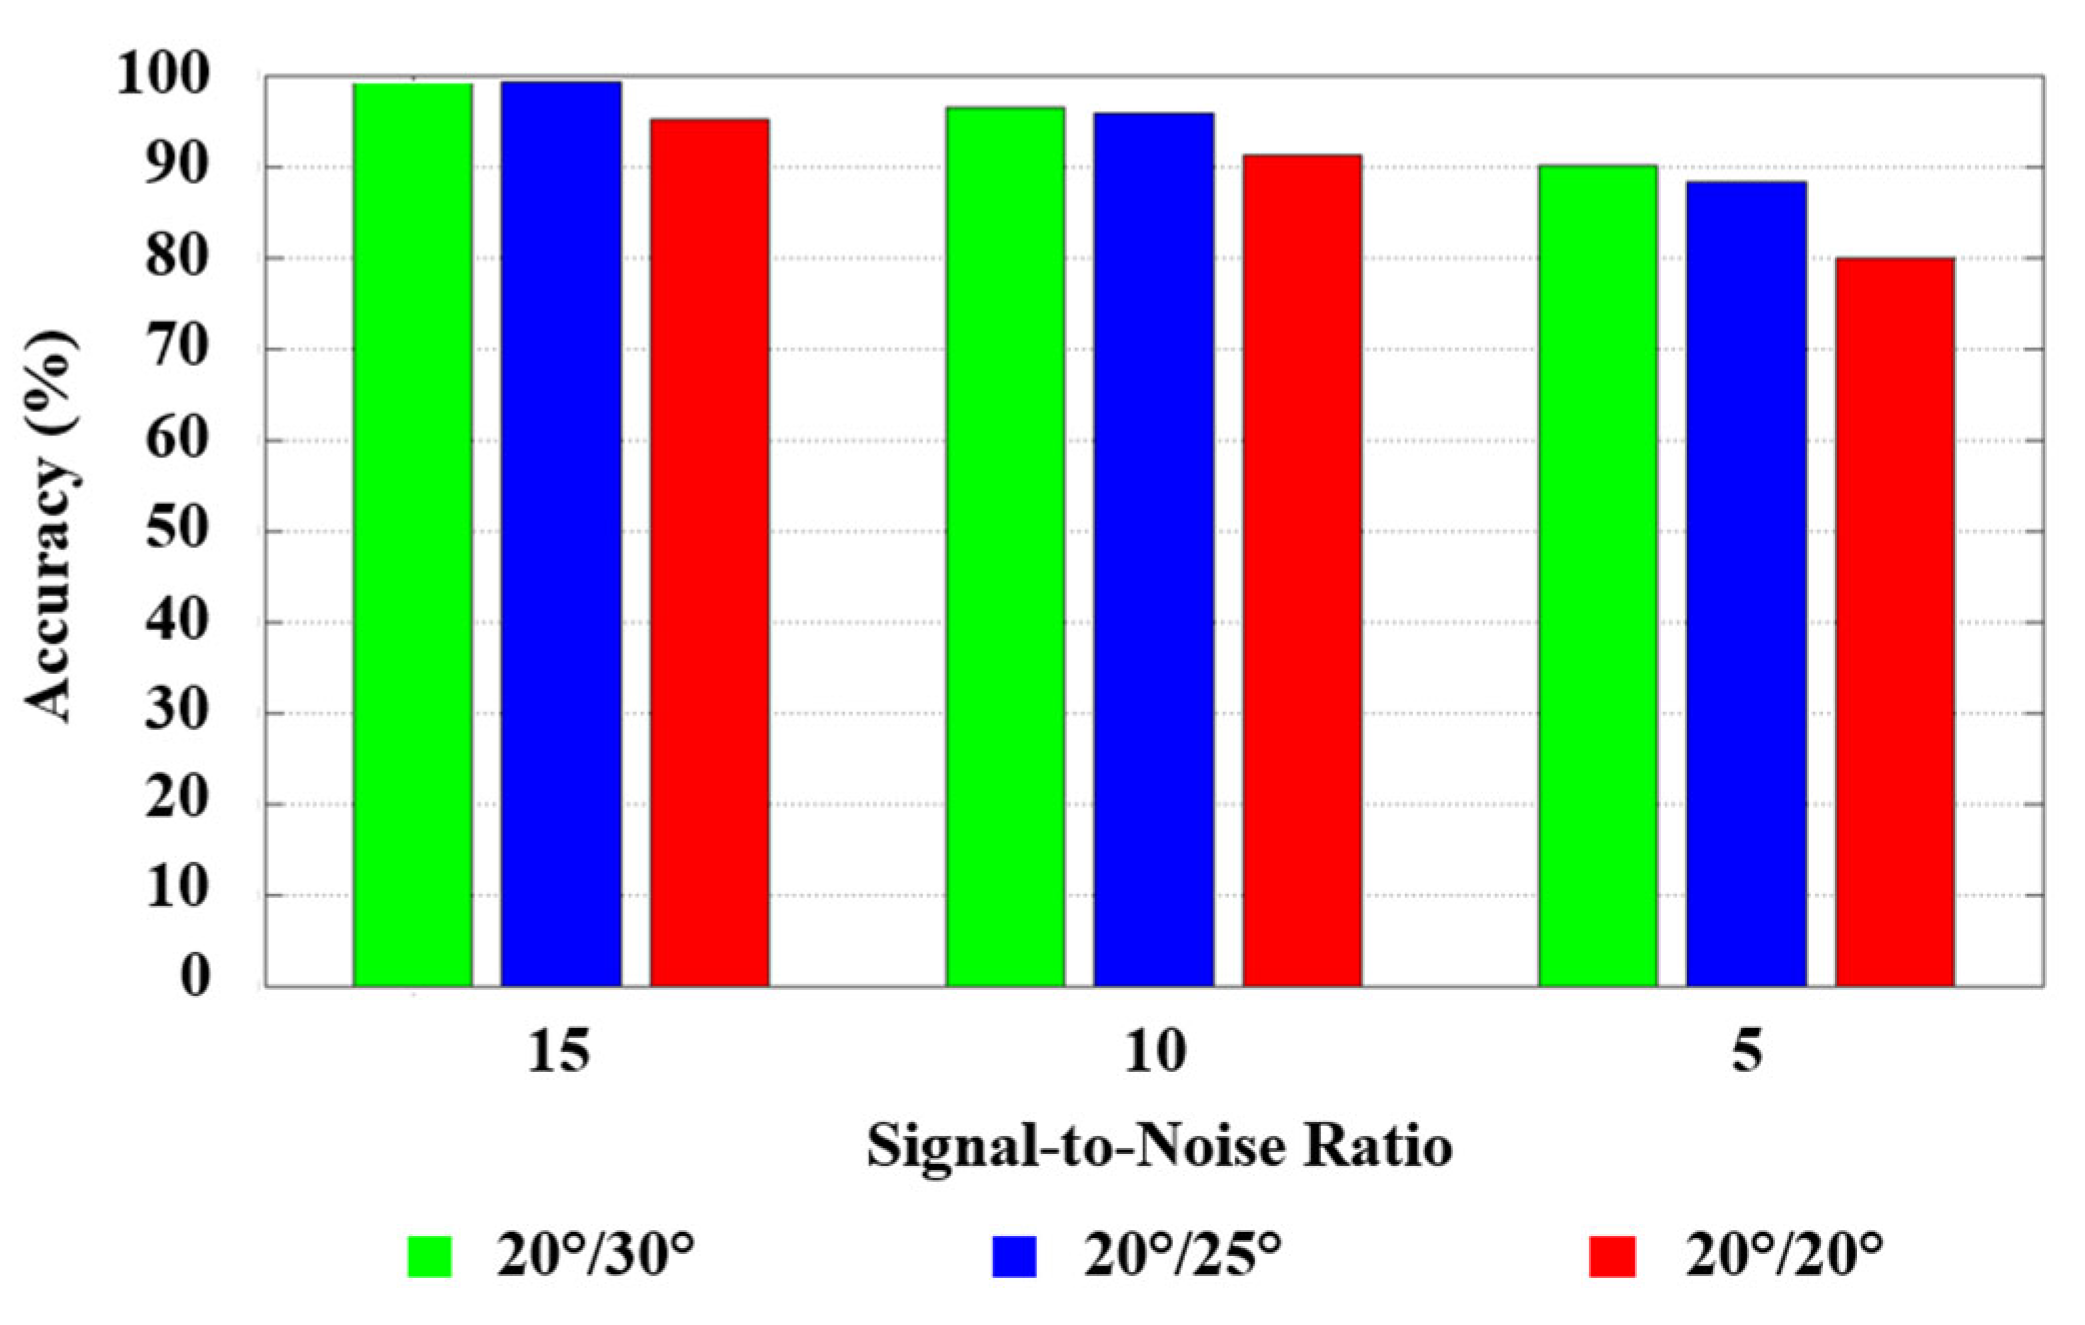
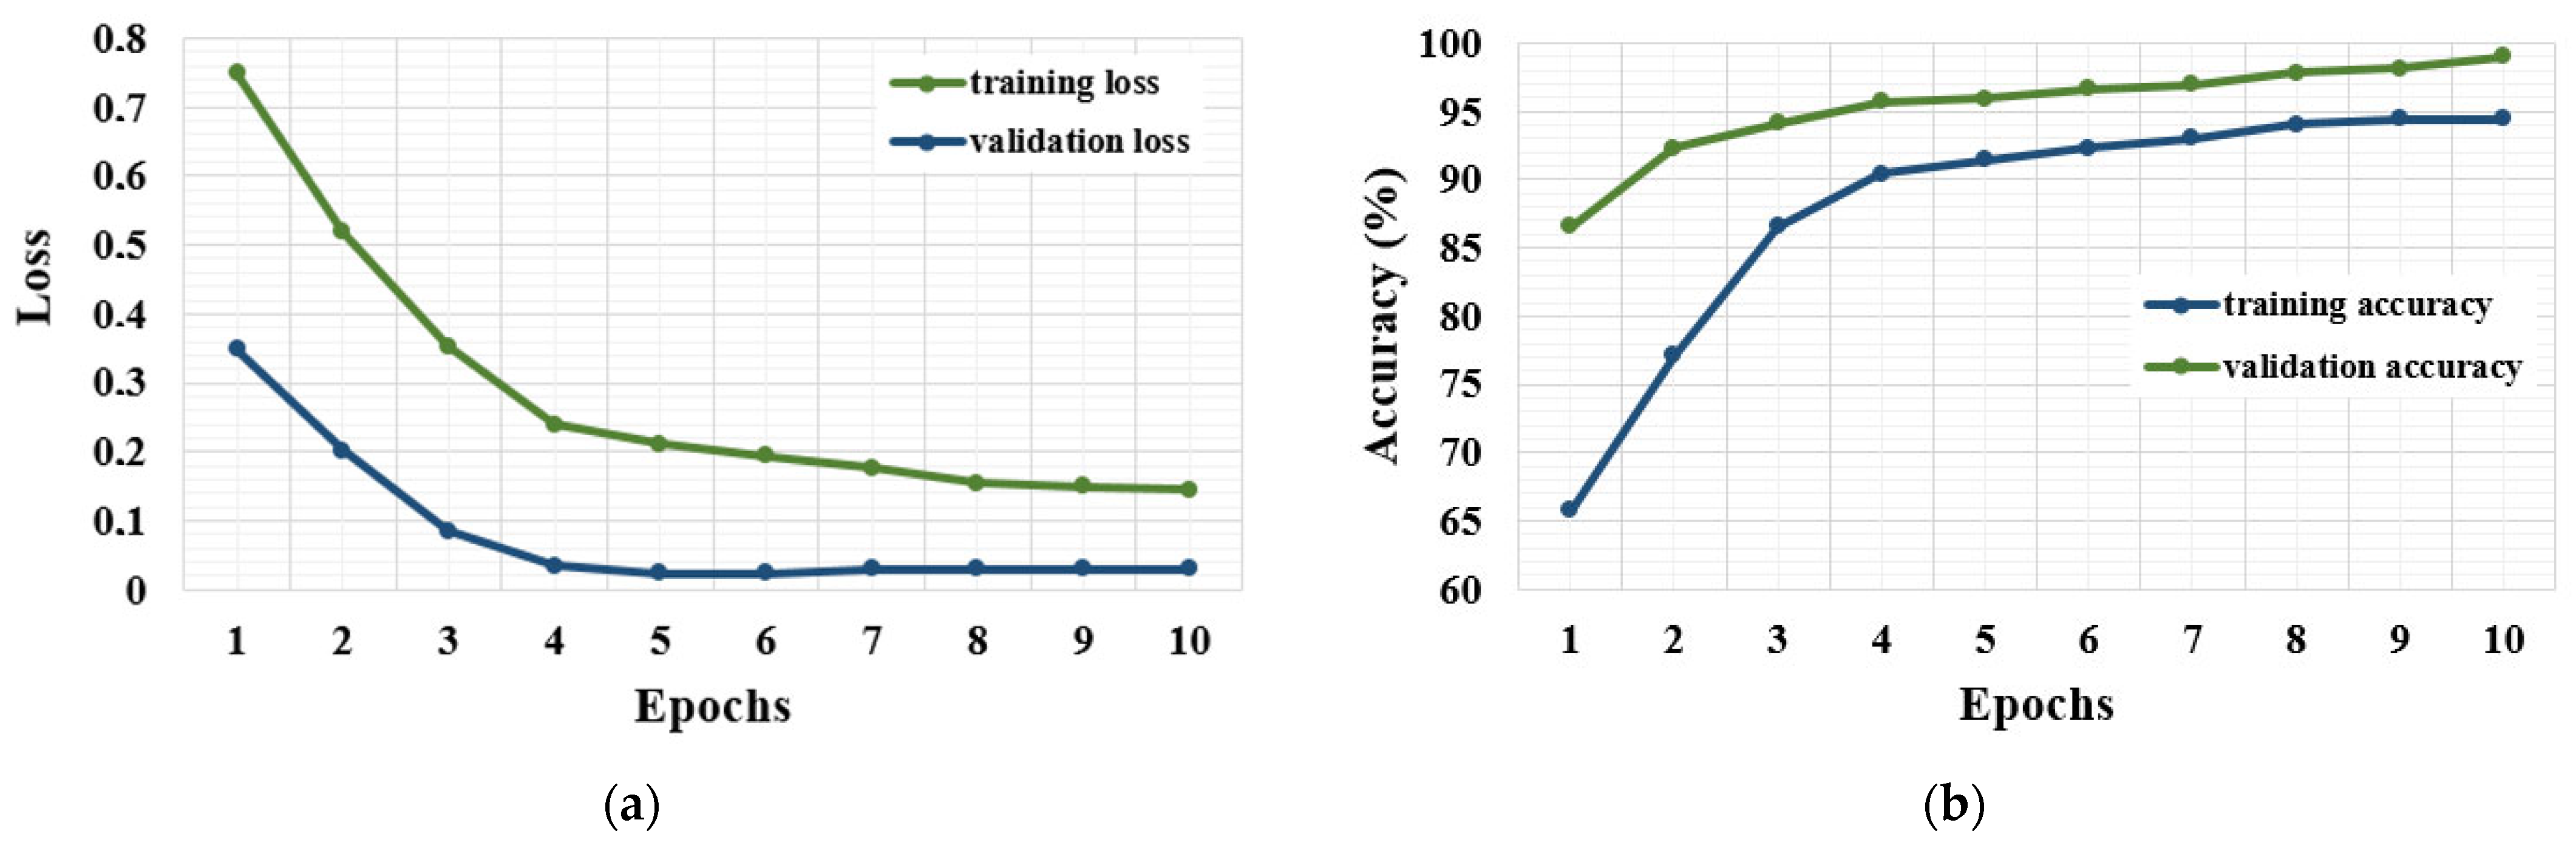
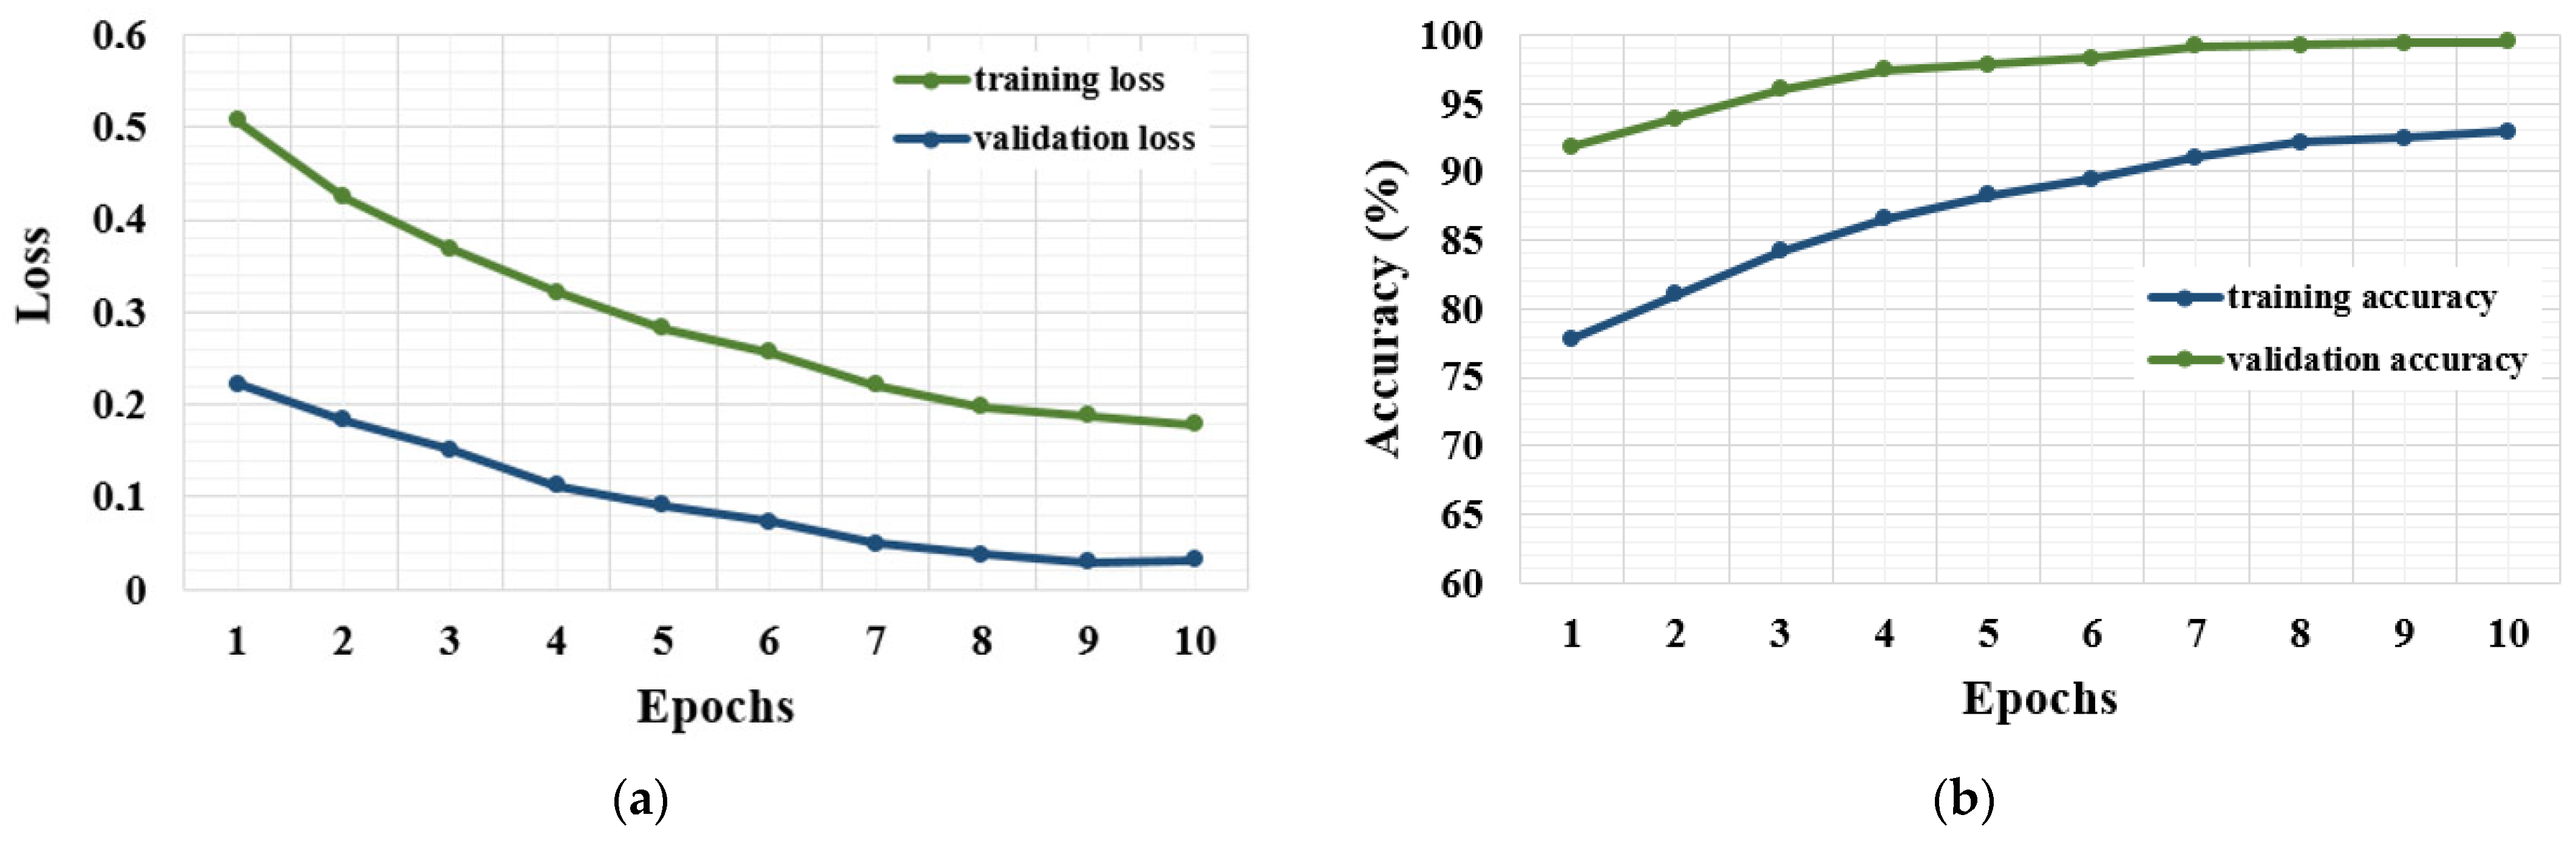
  • As expected, the classification accuracy decreased in all scenarios identified within the scope of research work as the noise level increased, meaning SNR value decreased (see Equation (8));
  • In all cases, the highest accuracy was obtained for SNR 15 (i.e., lowest noise level), while the lowest accuracy rates were obtained for SNR 5 (i.e., highest noise level);
  • It was observed that the average classification accuracy rates were improved as DSPA increased. This finding confirms the hypothesis that tooth asymmetry could provide an advantage in detecting tooth cracks more easily;
  • The average classification accuracy could be improved by 12.8% by using an asymmetric (20°/30°) tooth profile instead of a standard (20°/20°) design for high noise levels (i.e., SNR = 5);
  • Based on the calculated SD values, it was observed that the variability between the tests performed for each condition was small and acceptable, and the findings were consistent.
The present research plotted the confusion matrixes for three DSPAs and SNRs in order to interpret the obtained results, as presented in Figure 12, Figure 13 and Figure 14. Herein, the confusion matrixes of the highest performance (i.e., classification accuracy) among the three tests performed for each SNR were plotted. For example, a confusion matrix is presented for “Test-3,” where the highest classification accuracy was achieved for SNR 5 and 20°/20° tooth profile in Figure 12a. The findings obtained through the confusion matrixes were divided into three parts for effective interpretation, considering three DSPAs. First, for the 20°/20° tooth profile, it was observed that the developed 1-D CNN model performed relatively poorly in classifying the healthy state (S_1) and 25% crack level (S_2), and 25% crack level (S_2) and 50% crack level (S_3) for an SNR of 5. For an SNR value of 5, the model classified the healthy state (S_1) and 100% crack level (S_5) with acceptable recognition accuracy. In this regard, the classification accuracies were considerably improved for SNR values of 10 and 15 compared to SNRs of 5 (see Table 7 and Figure 12). The average classification accuracy rates reached 91.274% and 95.100% for SNRs of 10 and 15, respectively. This value was recorded as 79.854% for an SNR value of 5. Similar to findings obtained for SNR 5, the developed 1-D CNN model performed relatively poorly in classifying the healthy condition (S_1) and 25% crack level (S_2), and 25% crack level (S_2) and 50% crack level (S_3) for other SNR values.
Second, for the 20°/25° tooth profile, it was observed that the model was confused in classifying the healthy state (A_1) and 25% crack level (A_2), and 25% crack level (A_2) and 50% crack level (A_3) among themselves for an SNR value of 5. With this in mind, it needs to be highlighted that the proposed 1-D CNN model’s performance significantly improved compared to the 20°/20° tooth profile for SNR 5, where fault detection is most difficult. In this regard, the overall classification accuracy was enhanced from 79.854% to 88.323% with an increment of DSPA from 20° to 25°. It was also reported that the proposed model showed great success for SNR 15 conditions, with an average classification accuracy of 99.195% (see Table 7).
Finally, for the 20°/30° tooth profile, the model performs relatively poorly in classifying the healthy state (AS_1) and 25% crack level (AS_2) for SNR of 5 but with an acceptable error compared to other cases evaluated within the present study. The average classification accuracy for an SNR value of 5 was recorded as 90.068% for the 20°/30° tooth profile. This finding also indicates that using an asymmetric tooth profile instead of a symmetric (20°/20°) one holds promise in facilitating early crack diagnosis tasks, especially under high noise levels. Figure 14 depicts that the developed 1-D CNN model also successfully classified the healthy state and four different crack levels (25%–50%–75%–100%) for SNR values of 10 and 15. The average classification accuracies were noted as 96.476% and 99.251% for these circumstances (i.e., SNR), respectively.
For a better understanding of the obtained results, the average classification accuracies acquired for standard (20°/20°) and asymmetric (20°/25° and 20°/30°) profiled involute spur gear pairs are presented together in Figure 15.
Examples of the training and validation loss and accuracy curves obtained for the cases where the highest classification rates were achieved (i.e., SNR = 15) for all tooth profiles evaluated within the present research work are presented in Figure 16, Figure 17 and Figure 18. It was observed that the training and validation accuracies were enhanced as the number of epochs increased, resulting in less variation in accuracy (i.e., training and validation) values. Figure 16, Figure 17 and Figure 18 also depict that the developed 1-D CNN model converged after ten epochs for all tooth profiles. In this regard, the proposed model exhibited good robustness and stability characteristics.
The present study also computed three statistical indicators, namely, (1) RMS, (2) kurtosis, and (3) CF, to provide supplementary findings in addition to the 1-D CNN algorithm’s classification results. In this regard, the primary consideration was to supply additional information regarding whether tooth asymmetry is advantageous in detecting tooth crack faults. The percentage change in statistical indicators evaluated within the present research work corresponding to the different crack levels is presented for all tooth profiles in Figure 19. Herein, the present study identified the indicator values acquired for the healthy condition as reference values while calculating the percentage change in a statistical indicator.
The findings obtained regarding the percentage change in statistical indicators can be listed as follows.
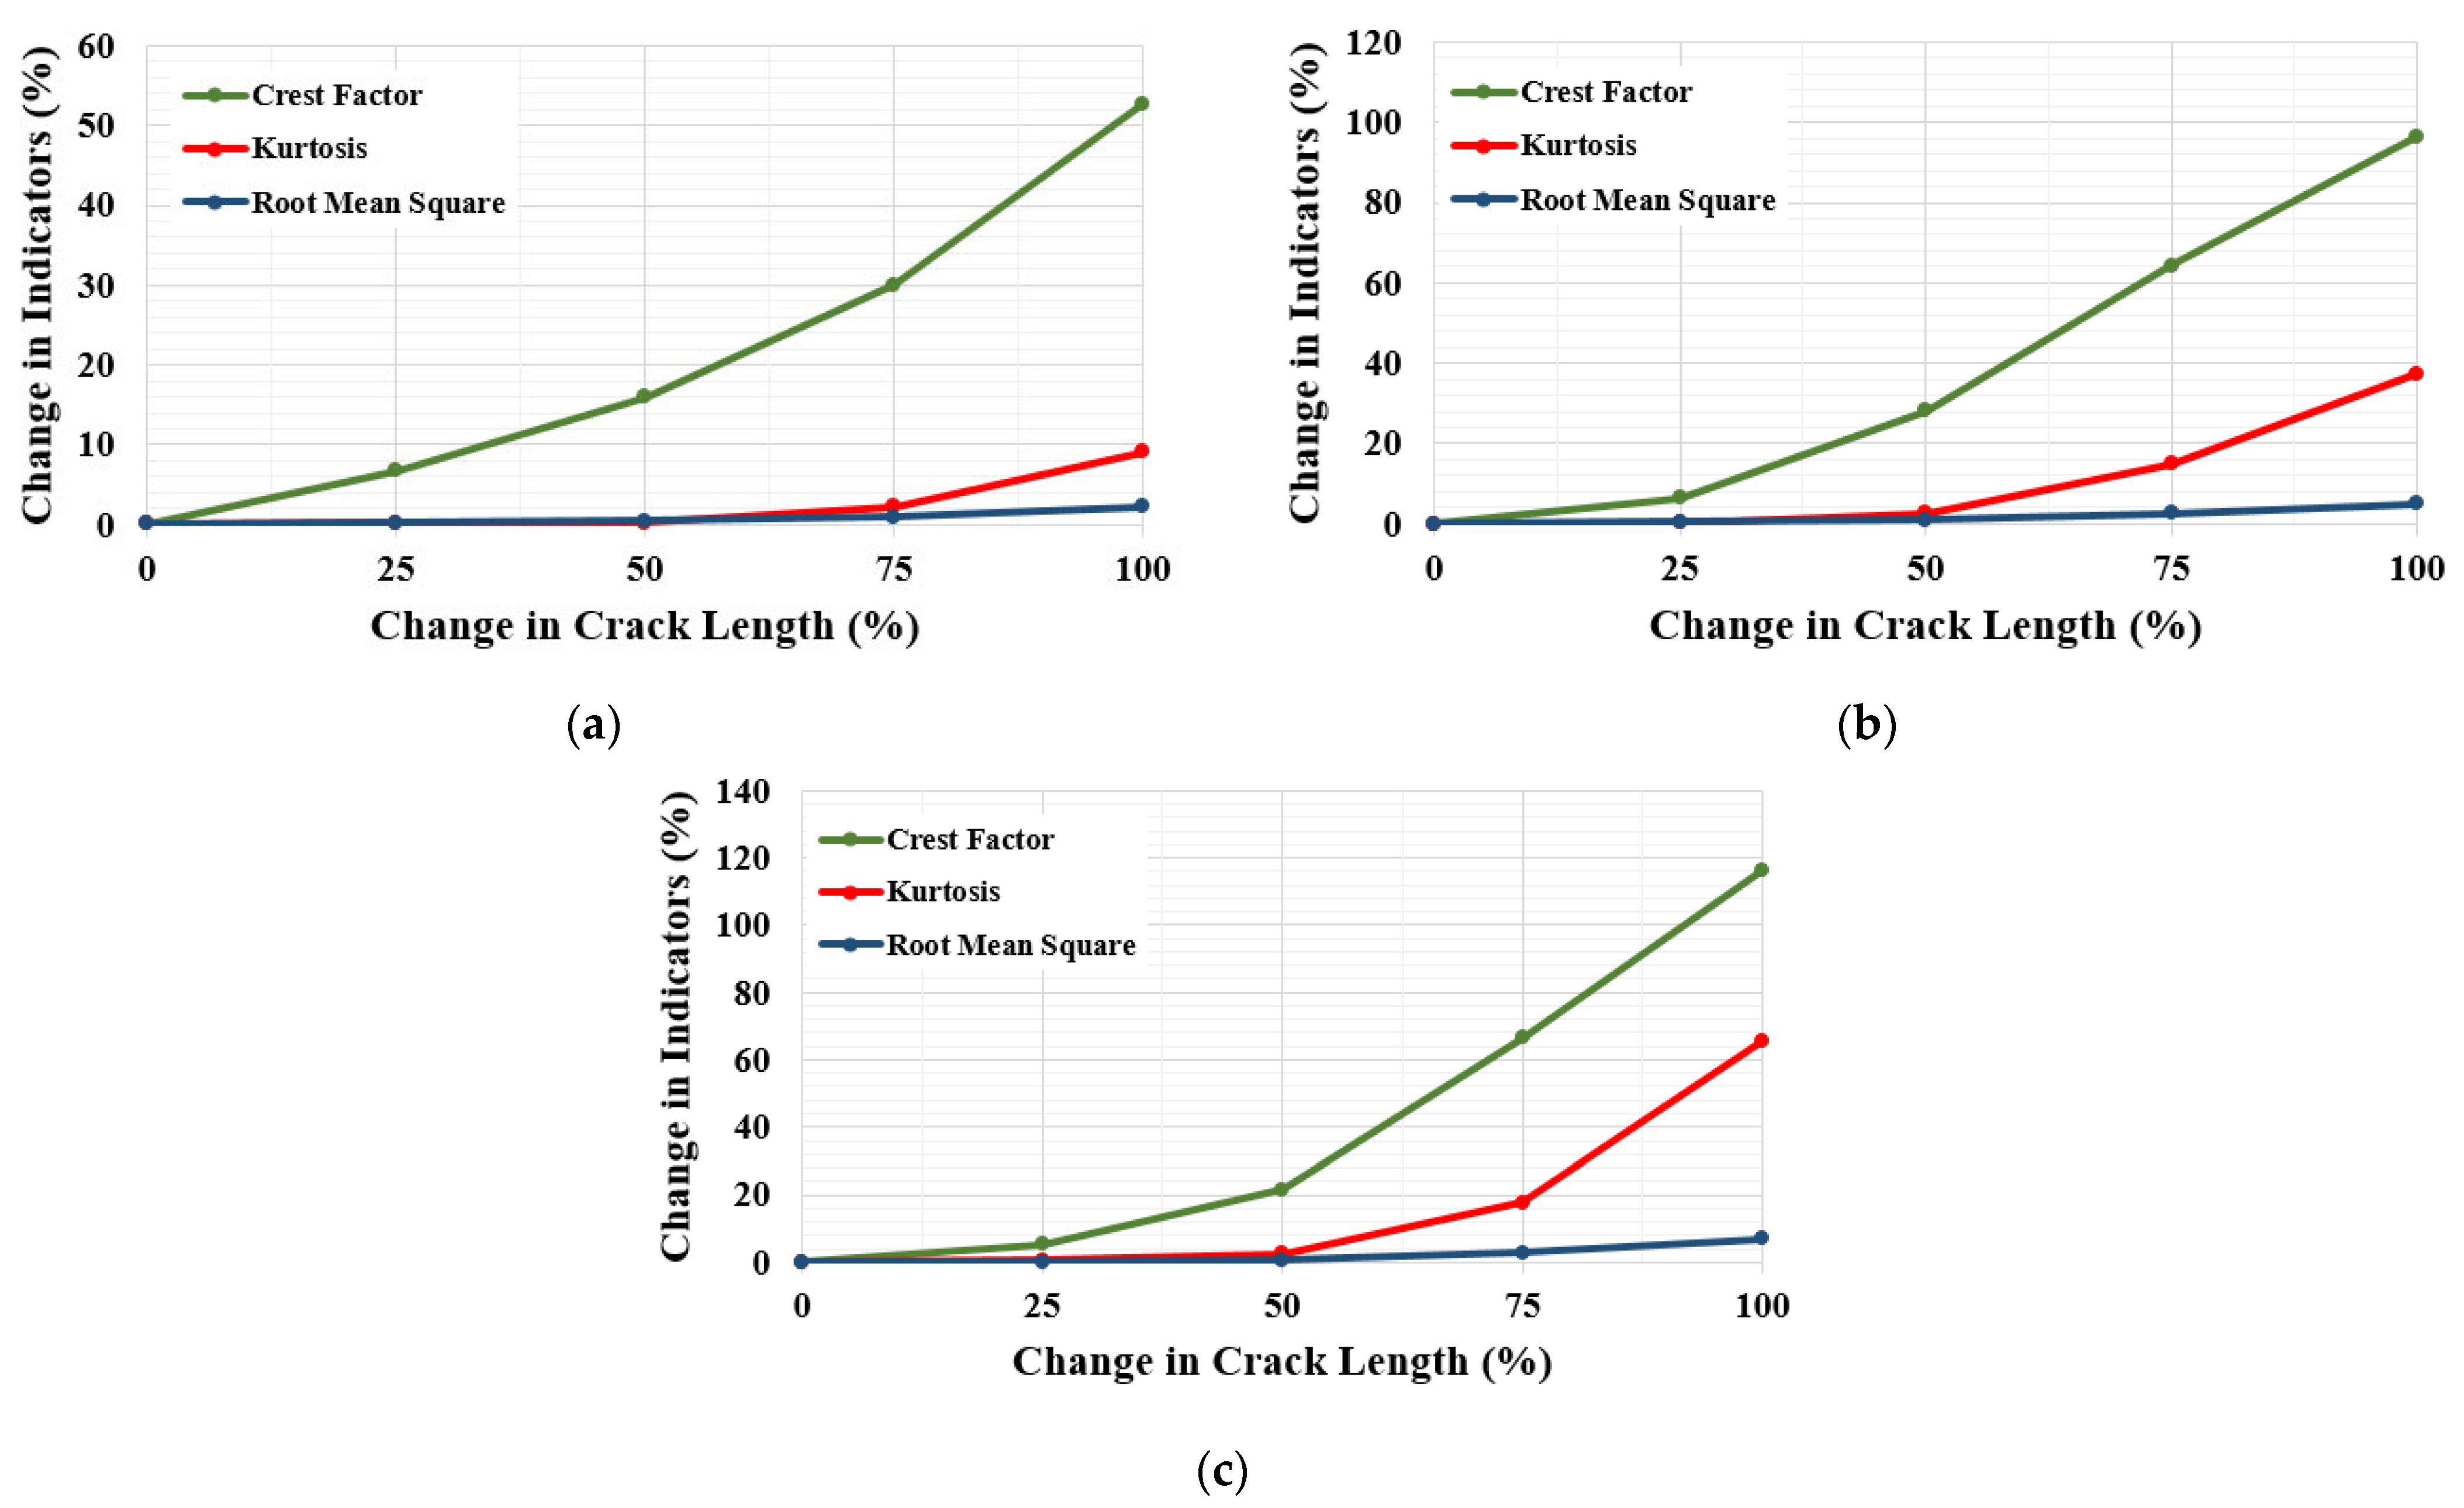
  • The statistical indicator values increase as the crack level is proportionally enhanced for all tooth profiles evaluated within the present study;
  • The sensitivity of RMS and kurtosis is relatively low for low crack levels, meaning 25% and 50% crack levels. In this regard, the kurtosis performed well compared to RMS for relatively high crack levels;
  • CF was found to be the most sensitive fault diagnosis indicator for all tooth profiles. This finding is also compatible with the available literature [9,46];
  • The percentage change in statistical indicators was increased as the DSPA increased for all crack levels. This finding supports the proposed DL-based model’s results that the tooth asymmetry could yield an advantage in detecting tooth cracks more easily;
  • The percentage change in the most sensitive indicator, i.e., CF, reached 52.75%, 96.4%, and 116.27% for DSPAs of 20°, 25°, and 30°, respectively, for 100% crack level.

Fault Classification with Residual Signals

The present study also attempted to improve the classification accuracy of the proposed 1-D CNN under high SNR levels. In this regard, the “residual signals” obtained as a result of taking the difference between the vibration signal of a cracked (for example, 25% crack level) gear and a reference signal (e.g., healthy condition) were provided as input data to the developed 1-D CNN model, considering different SNRs. In this way, we aimed to provide more fault features by clarification of the anomalies (i.e., peaks) formed when the faulty tooth enters meshing. Herein, the vibration signals acquired for the healthy condition were determined as reference values. The proposed approach was only applied to the standard (20°/20°) tooth profile with the lowest classification accuracies acquired within the present research work (see Table 7). Figure 20 presents an example of residual signals obtained for the 20°/20° tooth profile.
After implementing the proposed method, the developed 1-D CNN model achieved an average classification accuracy of 97.312%, 99.600%, and 99.989% for SNRs of 5, 10, and 15, respectively. These values were obtained as 79.854%, 91.274%, and 95.100% for the 20°/20° tooth profile under the same circumstances (i.e., SNR). In this regard, it was observed that the average classification accuracy could be improved by 25.08% by giving the residual signals as input data to the proposed 1-D CNN model (see Table 3 and Table 7).
The influence of residual signals on the frequency spectrum was also evaluated in the present research work. In this regard, Fourier transform was applied to the simulated time-sequence acceleration data in the time domain. Herein, the frequency spectra acquired for the healthy condition and 100% crack level were compared among themselves to demonstrate the influence of using a residual signal. Figure 21 shows the obtained frequency spectra of vibration signals. Figure 21a depicts the frequency spectrum obtained using the original vibration signals, while Figure 21b presents the frequency spectrum obtained using residual signals. In Figure 21a, the blue lines represent the healthy condition, while the red lines represent the 100% crack level. In Figure 21b, the red lines represent the healthy condition, while the blue lines represent the 100% crack level. As a result, it was observed that the influence of faults (i.e., tooth crack) became more pronounced in the frequency domain by using residual signals.

4. Discussion

High load-carrying capacity and prolonged fatigue propagation life are expected from geared transmission systems in an increasingly competitive modern industry. With this in mind, gears are prone to local defects due to harsh operational environments and material defects. In this regard, improving gears’ stiffness, impact resistance, and fatigue propagation life through geometry modifications is still an important research area. The researchers have, so far, investigated the effects of DSPA on gear dynamics characteristics, such as TVMS and TE. For example, Yang et al. [4] pointed out that an incurred tooth crack (root and surface) fault could change the meshing stiffness and, consequently, the vibration responses of a spur gear transmission. In this regard, the researchers developed an analytical model to calculate TVMS and benefited from an FE-based approach to validate their findings. It was reported that TVMS decreased proportionally, and the effects of tooth cracks became more pronounced as the crack level increased. Yu et al. [11] identified a spatial crack propagation scenario and investigated the variation in TVMS due to crack propagation. Their study also addressed the influence of different gear design parameters, for instance, (1) number of teeth, (2) pressure angle, and (3) module, on TVMS. As a result, it was concluded that the presence of a tooth crack reduces the meshing stiffness. Mohammed et al. [12] considered three crack propagation scenarios and evaluated the variation in the meshing stiffness and vibration responses of a geared transmission system. The research reports that the influence of faults becomes more pronounced on the vibration signals as the crack length, for example, increases from 0.8 mm to 1.8 mm. Yang [47] emphasized the significance of understanding a gearbox’s vibration characteristics in order to judge damage severity. Based on this motivation, the study established a multi-DOF dynamic model to simulate the dynamic responses of a spur gear transmission under variable operational circumstances. The vibration responses were acquired for multiple (nonadjacent and adjacent) crack scenarios and further validated experimentally.
Karpat et al. [36] pointed out the necessity of new gear designs to meet modern industry’s high-performance demands. In this regard, the research work parameterized the DSPA and evaluated the impact of tooth asymmetry on spur gears’ dynamic characteristics. It was reported that TVMS of a spur gear transmission could be improved as DSPA increased. Pedersen [39] benefited from shape optimization for redesigning a cutting tool geometry and attempted to explore the influence of tooth asymmetry on bending strength. As a result, it was observed that using an asymmetric tooth profile holds promise to enhance bending strength since the tooth root thickens as DSPA increases. Doğan and Karpat [9] evaluated the impact of DSPA on TVMS and dynamic TE response of standard and asymmetric spur gear pairs. In this regard, two DSPAs, namely, (1) 20° and (2) 35°, were employed to achieve this end. Their research benefited from a 4-DOF dynamic model to ascertain dynamic TE responses. In addition to that, statistical indicators were used in order to judge the damage severity. As a result, it was concluded that the impact of tooth root cracks becomes more potent on the dynamic TE response as DSPA increases.
With the wide availability of sensors, ML- and DL-based fault diagnosis approaches have become valuable tools for predictive maintenance in engineering practice [48]. For example, Ravikumar et al. [49] collected vibration signals from cracked spur gears through a physical experimental test setup. To this end, a deep neural network comprising (1) 1-D CNN, (2) residual learning, and (3) long short-term memory was proposed. Their research benefited from 70% of the total data for training and 30% for testing. In addition to that, the Adam version of stochastic gradient descent was employed in order to optimize the network. As a result, an average classification accuracy of 94.33% was reported. Yuan et al. [50] proposed a novel framework combining digital image processing and CNN methods to identify crack locations precisely. The researchers then developed a crack-tip-detection algorithm to generate the data needed to calculate the crack length. Later, Mohammed et al. [51] introduced three levels of tooth cracks to their samples and collected vibration data through a physical experimental test setup, considering five shaft speeds and load scenarios. Afterward, the researchers benefited from an ML-based approach to classify tooth root crack faults. The study reported an overall recognition rate of 80.41%. Recently, Wang et al. [52] developed a 6-DOF dynamic model of a spur gear transmission aiming to simulate a sufficient amount of faulty data to classify three different gear faults, namely, (1) tooth crack, (2) surface spall, and (3) tooth broken. The efficacy of 1-D CNN, recurrent neural networks, and long short-term memory in classifying different failure modes was compared. As a result, a classification accuracy of circa 100% was achieved by using simulated training data. However, these research works all used a standard (symmetric) tooth profile. No similar study has been reported using a DL-based approach for fault detection in asymmetric involute spur gears and whether tooth asymmetry provides an advantage in detecting tooth cracks more easily in the literature.
If handled individually, it can be concluded that the results of the present research work are compatible with the available literature in terms of the influence of (1) tooth root cracks [4,11,12,15] and (2) DSPA [33,34,35,36,37] on gear meshing stiffness and vibration responses. With this in mind, the available literature either addressed the impact of DSPA on gears’ dynamic characteristics or utilized ML- or DL-based approaches to detect faults in gears with symmetric tooth profiles. However, no research study in the literature examined whether an advantage is provided by using an asymmetric tooth profile to facilitate fault detection with artificial intelligence to add to the improvements it affords in terms of impact resistance, bending strength, and fatigue life.
From this standpoint, the major contributions of the present research work can be summarized as follows:
  • The meshing stiffness of standard and asymmetric spur gear pairs was evaluated comparatively in the case of a tooth crack fault. As a result, it was observed that as DSPA increased, the reduction in TVMS decreased. This finding revealed the superiority of asymmetric tooth profiles over the standard (symmetric) designs in terms of gear meshing stiffness;
  • It was demonstrated that the effect of faults (i.e., tooth crack) on vibration signals became more pronounced as DSPA increased;
  • The available literature only used ML- or DL-based methods in order to detect faults in gears with a symmetric tooth profile. However, no research study in the literature examined whether an advantage is provided by using an asymmetric tooth profile to facilitate fault detection with ML- or DL-based approaches to add to the improvements it affords in terms of impact resistance, bending strength, and fatigue life. The present research work aims to explore the impact of DSPA (i.e., tooth asymmetry) on a DL-based algorithm’s fault classification accuracy for the first time and make a novel contribution to knowledge in this field;
  • The findings demonstrated that the classification accuracy could be improved by up to 12.8% as DSPA increased from 20° to 30°. This result revealed that an advantage could be provided in detecting tooth cracks by using an asymmetric tooth profile instead of a symmetric design. No similar study has been reported using a DL-based approach for fault detection in asymmetric spur gear pairs and whether tooth asymmetry provides an advantage in detecting tooth cracks more easily in the literature.

5. Conclusions

The present study proposed a 1-D CNN-based diagnosis method to extract useful fault features from vibration data and classify different crack levels. The primary consideration of the present research was to investigate the influence of DSPA on dynamic characteristics and whether tooth asymmetry could yield an advantage in facilitating gear faults. As a supplementary finding, the percentage change in three statistical indicators in the presence of a tooth crack was also evaluated to support the developed 1-D CNN model’s classification results. The main concluding remarks were pointed out as follows.
  • It was observed that the average classification accuracy was improved for all cases identified within the scope of research work as the DSPA increased;
  • In this regard, it was recorded that the model’s ability to classify different crack levels improved by up to circa 12.8% by using an asymmetric (20°/30°) tooth profile instead of a symmetric (20°/20°) design for an SNR of 5;
  • The statistical indicator variations also support the hypothesis that tooth asymmetry could facilitate the early fault diagnosis task.
As a result, it can be concluded that tooth asymmetry provided an advantage in detecting tooth cracks more easily through a DL-based method. In addition to that, the proposed approach could help optimize maintenance strategies with early fault diagnosis and could be used to investigate the influence of variable operational circumstances on gear dynamics characteristics.
Future studies aim to verify the findings of the present study through an experimental test rig. The influence of color noises on ML- and DL-based methods’ classification accuracy can also be evaluated.

Author Contributions

Conceptualization, O.C.K. and F.K.; methodology, O.C.K., F.K., E.K. and A.E.D.; software, O.C.K.; validation, O.C.K., F.K. and E.K.; formal analysis, O.C.K.; investigation, O.C.K. and E.K.; resources, O.C.K. and A.E.D.; data curation, O.C.K.; writing—original draft preparation, O.C.K. and F.K.; writing—review and editing, O.C.K., F.K. and E.K.; visualization, O.C.K. and A.E.D.; supervision, F.K., E.K. and A.E.D.; project administration, F.K.; funding acquisition, O.C.K. and F.K. All authors have read and agreed to the published version of the manuscript.

Funding

This research was funded by the Bursa Uludag University, grant number FGA-2021-496 and The Scientific and Technical Research Council of Turkey (TUBİTAK), grant number 222M297.

Data Availability Statement

Not applicable.

Acknowledgments

The authors acknowledge support from the Council of Higher Education (CoHE) in Turkey 100/2000 PhD Scholarship program.

Conflicts of Interest

The authors declare no conflict of interest.

Nomenclature

zNumber of teeth
mnModule
haAddendum
hfDedendum
αdDSPA
αcCoast side pressure angle
ρTooth fillet radius
btFace width
J1, J2, J3, J4Mass moment of inertia of the motor, pinion, gear, and the load
θ1, θ2, θ3, θ4The rotational angle of the motor, pinion, gear, and the load
Ss1, Ss2Damping coefficients of shafts
Ks1, Ks2Stiffness of the shafts
m2, m3Masses of the pinion and gear
y2, y3Displacement of the bearings
S2, S3The damping coefficient of the bearings
K2, K3Stiffness of the bearings
Tin, ToutInput and output torques
WDynamic load between the gear pairs
rb2, rb3Base circles of pinion and gear
CgtTime-varying damping between the gear pairs
KgtTVMS of gear pairs
ѯ1, ѯ2Damping ratios of shafts
ѯtThe damping ratio of the meshing gears
PsignalSignal power
PnoiseNoise power
k1Extracted features by the ith convolution kernel
bThe bias of the kernel
wWeight of the kernel
mNumber of data points
rxOne-dimensional input
tl(h, u)uth neuron of the hth feature map in the ith layer
jjth pooling kernel
vConvolutional kernel’s width
TETransmission Error
CMCondition Monitoring
TVMSTime-Varying Mesh Stiffness
FEFinite Element
DOFDegree-of-Freedom
MLMachine Learning
DLDeep Learning
CNNConvolutional Neural Network
1-D CNNOne-Dimensional Convolutional Neural Network
DSPADrive Side Pressure Angle
SNRSignal-to-Noise Ratio
ODEOrdinary Differential Equation
FCFully Connected
ReLuRectified Linear Unit
RMSRoot Mean Square
CFCrest Factor
SDStandard Deviation

References

  1. Kapelevich, A.L. Asymmetric Gearing, 1st ed.; CRC Press: Boca Raton, FL, USA, 2018. [Google Scholar]
  2. Ma, J.; Liu, T.; Zha, C.; Song, L. Simulation research on the time-varying meshing stiffness and vibration response in micro-cracks in gears under variable tooth shape parameters. Appl. Sci. 2019, 9, 1512. [Google Scholar] [CrossRef] [Green Version]
  3. Yu, Y.; Shi, J.; Shen, C.; Luo, Y.; Wang, T.; Zhu, Z. Dynamic modelling of gearbox with multiple localized defects and its coupled vibration analysis. Mech. Syst. Signal Process. 2022, 180, 109469. [Google Scholar] [CrossRef]
  4. Yang, Y.; Tang, J.; Hu, N.; Shen, G.; Li, Y.; Zhang, L. Research on the time-varying mesh stiffness method and dynamic analysis of cracked spur gear system considering the crack position. J. Sound Vib. 2023, 548, 117505. [Google Scholar] [CrossRef]
  5. Liang, X. Dynamics Based Vibration Signal Modeling and Fault Detection of Planetary Gearboxes. Ph.D. Thesis, University of Alberta, Edmonton, AB, Canada, 2016. [Google Scholar]
  6. Qu, Y.; He, D.; Yoon, J.; Van Hecke, B.; Bechhoefer, E.; Zhu, J. Gearbox tooth cut fault diagnostics using acoustic emission and vibration sensors—A comparative study. Sensors 2014, 14, 1372–1393. [Google Scholar] [CrossRef] [PubMed]
  7. Kim, S.; Choi, J.-H. Convolutional neural network for gear fault diagnosis based on signal segmentation approach. Struct. Health Monit. 2019, 18, 1401–1415. [Google Scholar] [CrossRef]
  8. Doğan, O.; Yuce, C.; Karpat, F. Effects of rim thickness and drive side pressure angle on gear tooth root stress and fatigue crack propagation life. Eng. Fail. Anal. 2021, 122, 105260. [Google Scholar] [CrossRef]
  9. Doğan, O.; Karpat, F. Crack detection for spur gears with asymmetric teeth based on the dynamic transmission error. Mech. Mach. Theory 2019, 133, 417–431. [Google Scholar] [CrossRef]
  10. Chen, T.; Wang, Y.; Chen, Z. A novel distribution model of multiple teeth pits for evaluating time-varying mesh stiffness of external spur gears. Mech. Syst. Signal Process. 2019, 129, 479–501. [Google Scholar] [CrossRef]
  11. Yu, W.; Shao, Y.; Mechefske, C.K. The effects of spur gear tooth spatial crack propagation on mesh stiffness. Eng. Fail. Anal. 2015, 54, 103–119. [Google Scholar] [CrossRef]
  12. Mohammed, O.D.; Rantatalo, M.; Aidanpää, J.-O.; Kumar, U. Vibration signal analysis for gear fault diagnosis with various crack progression scenarios. Mech. Syst. Signal Process. 2013, 41, 176–195. [Google Scholar] [CrossRef]
  13. Chaari, F.; Fakhfakh, T.; Haddar, M. Analytical modelling of spur gear tooth crack and influence on gearmesh stiffness. Eur. J. Mech. A Solids 2009, 28, 461–468. [Google Scholar] [CrossRef]
  14. Fernandez del Rincon, A.; Viadero, F.; Iglesias, M.; García, P.; de-Juan, A.; Sancibrian, R. A model for the study of meshing stiffness in spur gear transmission. Mech. Mach. Theory 2013, 61, 30–58. [Google Scholar] [CrossRef]
  15. Liang, X.; Zuo, M.J.; Pandey, M. Analytically evaluating the influence of crack on the mesh stiffness of a planetary gear set. Mech. Mach. Theory 2014, 76, 20–38. [Google Scholar] [CrossRef]
  16. Yu, X.; Huangfu, Y.; Yang, Y.; Du, M.; He, Q.; Peng, Z. Gear fault diagnosis using gear meshing stiffness identified by gearbox housing vibration signals. Front. Mech. Eng. 2022, 17, 57. [Google Scholar] [CrossRef]
  17. Mohamed, A.S.; Sassi, S.; Paurobally, M.R. Model-based analysis of spur gears’ dynamic behavior in the presence of multiple cracks. Shock Vib. 2018, 2018, 1913289. [Google Scholar] [CrossRef] [Green Version]
  18. Wang, X.; Mao, D.; Li, X. Bearing fault diagnosis based on vibro-acoustic data fusion and 1D-CNN network. Meas. J. Int. Meas. Confed. 2021, 173, 108518. [Google Scholar] [CrossRef]
  19. Gecgel, O. Condition Monitoring of Gearbox Components Using Deep Learning with Simulated Vibration Data. Ph.D. Thesis, Texas Tech University, Lubbock, TX, USA, December 2019. [Google Scholar]
  20. Howard, I.; Jia, S.; Wang, J. The dynamic modelling of a spur gear in mesh including friction and a crack. Mech. Syst. Signal Process 2001, 15, 831–853. [Google Scholar] [CrossRef]
  21. Ren, F.; Wang, D.; Shi, G.; Wu, X. Investigation on dynamic characteristics of spur gear transmission system with crack fault. Machines 2022, 10, 664. [Google Scholar] [CrossRef]
  22. Yang, X.; Zhou, P.; Zuo, M.J.; Tian, Z.; Peng, Z. The effect of time-varying operating condition on the crack induced impulses and its application to gearbox tooth crack diagnosis. Mech. Syst. Signal Process 2023, 188, 110026. [Google Scholar] [CrossRef]
  23. Xu, L.; Wang, T.; Xie, J.; Yang, J.; Gao, G. A mechanism-based automatic fault diagnosis method for gearboxes. Sensors 2022, 22, 9150. [Google Scholar] [CrossRef]
  24. Abiodun, O.I.; Jantan, A.; Omolara, A.E.; Dada, K.V.; Mohamed, N.A.; Arshad, H. State-of-the-art in artificial neural network applications: A Survey. Heliyon 2018, 4, e00938. [Google Scholar] [CrossRef] [PubMed] [Green Version]
  25. Abiodun, O.I.; Jantan, A.; Omolara, A.E.; Dada, K.V.; Umar, A.M.; Linus, O.U.; Arshad, H.; Kazaure, A.A.; Gana, U.; Kiru, M.U. Comprehensive review of artificial neural network applications to pattern recognition. IEEE Access 2019, 7, 158820–158846. [Google Scholar] [CrossRef]
  26. Sun, W.; Yao, B.; Zeng, N.; Chen, B.; He, Y.; Cao, X.; He, W. An intelligent gear fault diagnosis methodology using a complex wavelet enhanced convolutional neural network. Materials 2017, 10, 790. [Google Scholar] [CrossRef] [Green Version]
  27. D’Andrea, D.; Risitano, G.; Desiderio, E.; Quintarelli, A.; Milone, D.; Alberti, F. Artificial neural network prediction of the optimal setup parameters of a seven degrees of freedom mathematical model of a race car: IndyCar case study. Vehicles 2021, 3, 300–329. [Google Scholar] [CrossRef]
  28. Carputo, F.; D’Andrea, D.; Risitano, G.; Sakhnevych, A.; Santonocito, D.; Farroni, F. A neural-network-based methodology for the evaluation of the center of gravity of a motorcycle rider. Vehicles 2021, 3, 377–389. [Google Scholar] [CrossRef]
  29. Yu, H.; Qin, C.; Tao, J.; Liu, C.; Liu, Q. A multi-channel decoupled deep neural network for tunnel boring machine torque and thrust prediction. Tunn. Undergr. Space Technol. 2023, 133, 104949. [Google Scholar] [CrossRef]
  30. Liu, C.; Cheng, G.; Chen, X.; Pang, Y. Planetary gear feature extraction and fault diagnosis method based VMD and CNN. Sensors 2018, 18, 1523. [Google Scholar] [CrossRef] [Green Version]
  31. Azamfar, M.; Singh, J.; Bravo-Imaz, I.; Lee, J. Multisensor data fusion for gearbox fault diagnosis using 2-D convolutional neural network and motor current signature analysis. Mech. Syst. Signal Process. 2020, 144, 106861. [Google Scholar] [CrossRef]
  32. Lin, M.-C.; Han, P.-Y.; Fan, Y.-H.; Li, C.-H.G. Development of compound fault diagnosis system for gearbox based on convolutional neural network. Sensors 2020, 20, 6169. [Google Scholar] [CrossRef]
  33. Kapelevich, A. Geometry and design of involute spur gears with asymmetric teeth. Mech. Mach. Theory 2000, 35, 117–130. [Google Scholar] [CrossRef]
  34. Shuai, M.; Shuai, M.; Guoguang, J.; Jiabei, G.; Ting, Z.; Shengping, Z. Design principle and modeling method of asymmetric involute internal helical gears. Proc. Inst. Mech. Eng. Part C J. Mech. Eng. Sci. 2019, 233, 244–255. [Google Scholar] [CrossRef]
  35. Kalay, O.C.; Doğan, O.; Yılmaz, T.G.; Yüce, C.; Karpat, F. A comparative experimental study on the impact strength of standard and asymmetric involute spur gears. Meas. J. Int. Meas. Confed. 2021, 172, 108950. [Google Scholar] [CrossRef]
  36. Karpat, F.; Ekwaro-Osire, S.; Cavdar, K.; Babalik, F.C. Dynamic analysis of involute spur gears with asymmetric teeth. Int. J. Mech. Sci. 2008, 50, 1598–1610. [Google Scholar] [CrossRef]
  37. Mo, S.; Li, Y.; Luo, B.; Wang, L.; Bao, H.; Cen, G.; Huang, Y. Research on the meshing characteristics of asymmetric gears considering the tooth profile deviation. Mech. Mach. Theory 2022, 175, 104926. [Google Scholar] [CrossRef]
  38. Lewicki, D.G. Crack Propagation Studies to Determine Benign or Catastrophic Failure Modes for Aerospace Thin-Rim Gears. Ph.D. Thesis, Case Western Reserve University, Cleveland, OH, USA, August 1995. [Google Scholar]
  39. Pedersen, N.L. Improving bending stress in spur gears using asymmetric gears and shape optimization. Mech. Mach. Theory 2010, 45, 1707–1720. [Google Scholar] [CrossRef]
  40. Karpat, F.; Dogan, O.; Yilmaz, T.; Yuce, C.; Kalay, O.C.; Karpat, E.; Kopmaz, O. Effects of drive side pressure angle on gear fatigue crack propagation life for spur gears with symmetric and asymmetric teeth. In Proceedings of the ASME International Mechanical Engineering Congress and Exposition, Salt Lake City, UT, USA, 11–14 November 2019. [Google Scholar] [CrossRef]
  41. Doğan, O.; Kalay, O.C.; Karpat, F. Influence of tooth root cracks on the mesh stiffness of asymmetric spur gear pair with different backup ratios. Proc. Inst. Mech. Eng. Part C J. Mech. Eng. Sci. 2023, 237, 717–731. [Google Scholar] [CrossRef]
  42. Kuang, J.-H.; Lin, A.D. The effect of tooth wear on the vibration spectrum of a spur gear pair. J. Vib. Acoust. 2001, 123, 311–317. [Google Scholar] [CrossRef]
  43. Yoon, K.Y.; Rao, S.S. Dynamic load analysis of spur gears using a new tooth profile. J. Mech. Des. 1996, 118, 1–6. [Google Scholar] [CrossRef]
  44. Ozguven, H.N. A non-linear mathematical model for dynamic analysis of spur gears including shaft and bearing dynamics. J. Sound Vib. 1991, 145, 239–260. [Google Scholar] [CrossRef]
  45. Lin, H.H. Computer Aided Design and Analysis of Spur Gear Dynamics. Ph.D. Thesis, University of Cincinnati, Cincinnati, OH, USA, July 1985. [Google Scholar]
  46. Yang, Y.; Xia, W.; Han, J.; Song, Y.; Wang, J.; Dai, Y. Vibration analysis for tooth crack detection in a spur gear system with clearance nonlinearity. Int. J. Mech. Sci. 2019, 157–158, 648–661. [Google Scholar] [CrossRef]
  47. Yang, X. Dynamics-Guided Vibration Signal Analysis for Fixed-Axis Gearbox Fault Diagnosis. Ph.D. Thesis, University of Alberta, Edmonton, AB, Canada, 2022. [Google Scholar]
  48. Cheng, J.; Yang, Y.; Li, X.; Pan, H.; Cheng, J. An early fault diagnosis method of gear based on improved symplectic geometry mode decomposition. Meas. J. Int. Meas. Confed. 2020, 151, 107140. [Google Scholar] [CrossRef]
  49. Ravikumar, K.N.; Yadav, A.; Kumar, H.; Gangadharan, K.V.; Narasimhadhan, A.V. Gearbox fault diagnosis based on multi-scale deep residual learning and stacked LSTM model. Meas. J. Int. Meas. Confed. 2021, 186, 110099. [Google Scholar] [CrossRef]
  50. Yuan, Y.; Ge, Z.; Su, X.; Guo, X.; Suo, T.; Liu, Y.; Yu, Q. Crack length measurement using convolutional neural networks and image processing. Sensors 2021, 21, 5894. [Google Scholar] [CrossRef] [PubMed]
  51. Mohammed, S.A.; Ghazaly, N.M.; Abdo, J. Fault diagnosis of crack on gearbox using vibration-based approaches. Symmetry 2022, 14, 417. [Google Scholar] [CrossRef]
  52. Wang, H.; Yang, R.; Xiang, J. Numerical simulation of gears for fault detection using artificial intelligence models. Meas. J. Int. Meas. Confed. 2022, 203, 111898. [Google Scholar] [CrossRef]
Figure 1. The effect of DSPA on the spur gears’ geometric characteristics: (a) 20°/20°; (b) 20°/25°; (c) 20°/30° tooth profiles.
Machines 11 00413 g001
Figure 2. An illustration regarding the identification of different crack levels identified within the present study: (a) 25%; (b) 50%; (c) 75%; (d) 100% crack levels.
Machines 11 00413 g002
Figure 3. A depiction of the developed 6-DOF dynamic model of a one-stage spur gear transmission: (a) physical model; (b) schematic diagram.
Machines 11 00413 g003
Figure 4. A depiction of 1-D CNN architecture.
Machines 11 00413 g004
Figure 5. The meshing stiffness results in the presence of a tooth crack: (a) 20°/20°; (b) 20°/25°; (c) 20°/30° tooth profiles.
Machines 11 00413 g005
Figure 6. Vibration signals obtained for 20°/20° tooth profile: (a) healthy; (b) 25%; (c) 50%; (d) 75%; (e) 100% crack levels.
Machines 11 00413 g006
Figure 7. Vibration signals obtained for 20°/25° tooth profile: (a) healthy; (b) 25%; (c) 50%; (d) 75%; (e) 100% crack levels.
Machines 11 00413 g007
Figure 8. Vibration signals obtained for 20°/30° tooth profile: (a) healthy; (b) 25%; (c) 50%; (d) 75%; (e) 100% crack levels.
Machines 11 00413 g008
Figure 9. Vibration signals obtained for 20°/20° tooth profile and SNR 5: (a) healthy; (b) 25%; (c) 50%; (d) 75%; (e) 100% crack levels.
Machines 11 00413 g009
Figure 10. Vibration signals obtained for 20°/25° tooth profile and SNR 10: (a) healthy; (b) 25%; (c) 50%; (d) 75%; (e) 100% crack levels.
Machines 11 00413 g010
Figure 11. Vibration signals obtained for 20°/30° tooth profile and SNR 15: (a) healthy; (b) 25%; (c) 50%; (d) 75%; (e) 100% crack levels.
Machines 11 00413 g011
Figure 12. Confusion matrix for 20°/20° tooth profile: (a) SNR = 5; (b) SNR = 10; (c) SNR = 15.
Machines 11 00413 g012
Figure 13. Confusion matrix for 20°/25° tooth profile: (a) SNR = 5; (b) SNR = 10; (c) SNR = 15.
Machines 11 00413 g013
Figure 14. Confusion matrix for 20°/30° tooth profile: (a) SNR = 5; (b) SNR = 10; (c) SNR = 15.
Machines 11 00413 g014
Figure 15. Comparison of overall classification accuracies obtained for standard and asymmetric tooth profiles.
Machines 11 00413 g015
Figure 16. The performance metrics for 20°/20° tooth profile and SNR 15: (a) loss-versus-epochs; (b) accuracy-versus-epochs graphs.
Machines 11 00413 g016
Figure 17. The performance metrics for 20°/25° tooth profile and SNR 15: (a) loss-versus-epochs; (b) accuracy-versus-epochs graphs.
Machines 11 00413 g017
Figure 18. The performance metrics for 20°/30° tooth profile and SNR 15: (a) loss-versus-epochs; (b) accuracy-versus-epochs graphs.
Machines 11 00413 g018
Figure 19. The percentage change of statistical indicators evaluated within the scope of the present study: (a) 20°/20°; (b) 20°/25°; (c) 20°/30°.
Machines 11 00413 g019
Figure 20. An example of residual signals acquired for the 20°/20° tooth profile.
Machines 11 00413 g020
Figure 21. The frequency spectrum of vibration responses: (a) original signal; (b) residual signal.
Machines 11 00413 g021
Table 1. Gear design parameters [8].
ParameterUnitEntity
Module (mn)mm3.175
Number of Teeth (z) 28
Addendum (ha)mm1 × mn
Dedendum (hf)mm1.352 × mn
Coast Side Pressure Angle (αc)deg20°
DSPA (αd)deg20°/25°/30°
Tooth Fillet Radius (ρ)mm0.1 × mn
Face Width (bt)mm1
Material AISI 9310
Poisson Ratio 0.3
Young’s ModulusN/mm2206,000
Table 2. Constant coefficients of the dynamic model [43,44,45].
ParameterUnitEntity
PowerkW10
Pinion Speedrpm1200
Face Widthmm25.4
Mass of Pinion and Gearkg0.9918
Mass Moment of Inertias
(J2 and J3)
kgm20.0017
Mass Moment of Inertias
(J1 and J4)
kgm20.0052
Shear ModulusN/mm279,300
Shaft Lengthsm0.3
Shafts StiffnessNm/rad10,897
Shafts DampingNms/rad0.0752
ѯ1 and ѯ2 0.01
ѯt 0.1
Bearing StiffnessN/m8 × 109
Bearing DampingNs/m5000
Table 3. The structure of the developed 1-D CNN model.
Layer (Type)Output ShapeParam
conv1D (Conv1D)(None, 128, 4)8
max_pooling1D (MaxPooling1D)(None, 64, 4)0
conv1D_1 (Conv1D)(None, 64, 4)20
max_pooling1D (MaxPooling1D)(None, 32, 4)0
dropout (Dropout)(None, 32, 4)0
flatten (Flatten)(None, 128)0
dense (Dense)(None, 256)33,024
dense_1 (Dense)(None, 128)32,896
dense_2 (Dense)(None, 64)8256
dense_3 (Dense)(None, 5)325
Table 4. The classes identified for standard (20°/20°) profiled involute spur gears.
Health ConditionTooth ProfileLabel
Healthy20°/20°S_1
25% Crack Level20°/20°S_2
50% Crack Level20°/20°S_3
75% Crack Level20°/20°S_4
100% Crack Level20°/20°S_5
Table 5. The classes identified for 20°/25° profiled asymmetric gears.
Health ConditionTooth ProfileLabel
Healthy20°/25°A_1
25% Crack Level20°/25°A_2
50% Crack Level20°/25°A_3
75% Crack Level20°/25°A_4
100% Crack Level20°/25°A_5
Table 6. The classes identified for 20°/30° profiled asymmetric spur gears.
Health ConditionTooth ProfileLabel
Healthy20°/30°AS_1
25% Crack Level20°/30°AS_2
50% Crack Level20°/30°AS_3
75% Crack Level20°/30°AS_4
100% Crack Level20°/30°AS_5
Table 7. Comparison of results obtained for all scenarios identified within the scope of the present study.
Tooth ProfileSNRTest-1Test-2Test-3Overall
Accuracy
SD
20°/20°578.138%79.122%82.304%79.854%0.02177
1091.230%94.520%88.074%91.274%0.03223
1596.981%93.851%94.470%95.100%0.01657
584.865%89.341%90.765%88.323%0.03078
20°/25°1094.798%96.963%95.653%95.804%0.01090
1599.190%99.232%99.135%99.195%0.00048
588.452%89.866%91.886%90.068%0.01725
20°/30°1097.083%96.402%95.944%96.476%0.00573
1599.458%99.079%99.218%99.251%0.00191
Disclaimer/Publisher’s Note: The statements, opinions and data contained in all publications are solely those of the individual author(s) and contributor(s) and not of MDPI and/or the editor(s). MDPI and/or the editor(s) disclaim responsibility for any injury to people or property resulting from any ideas, methods, instructions or products referred to in the content.

