Abstract
Due to reduced manufacturing, transportation, and installation costs, the two-blade wind turbines (Two-BWT) are a viable option for offshore wind farms. So far, there is no mature design model for offshore Two-BWT. This paper proposes an aerodynamic design method for offshore Two-BWT blades using the blade element momentum (BEM) theory. This method calculates the power coefficient of the Two-BWT by analogy with the three-blade wind turbines (Three-BWT), and then determines the wind rotor diameter. Then, the airfoil, chord length, and twist angle are taken as the key design factors. Furthermore, the piecewise combination method (PCM) for airfoil distribution, the three-point sine method (Three-PSM) for chord length distribution, and the two-point sine method (Two-PSM) for torsion angle distribution are adopted, respectively. Subsequently, the minimum rotational speed, under the rated wind speed and rated power, is taken as the optimization objective to establish the optimization model. The global flow field of Two-BWT is constructed based on CFD technology, and the characteristics of wind speed distribution and blade pressure distribution in the flow field are investigated. Finally, the CFD results are compared with the results of the BEM theory, and the consistency of the results also shows the feasibility of the design method.
1. Introduction
With the decreasing number of onshore wind farms that can be developed, the development of offshore wind farms has become an inevitable trend [1,2,3]. At present, offshore wind turbines are commonly used in the form of three blades. With the development of a single-turbine capacity of over 10 MW, the manufacturing costs, transportation costs, and installation costs of the Three-BWT (three-blade wind turbines) are putting more and more pressure on the operators. Two-BWT (two-blade wind turbines) is another kind of wind turbine that has received attention. Two-BWT have one blade less than Three-BWT. Blades are the main component of wind turbines [4]. Reducing one blade will lead to a large reduction in manufacturing costs. At the same time, transportation costs, lifting costs, and maintenance costs can also be reduced. From the perspective of mechanical force, wind shear, yaw, moment of inertia, and other factors will make the Two-BWT bear the greater dynamic load. Large load fluctuation leads to more complex dynamic behavior, which puts forward more stringent requirements for optimized design and dynamic control [5,6,7]. On the other hand, the noise of the blade operation will increase rapidly with the increase of the blade tip speed. At the same speed, the power generated by the Two-BWT is lower than that of the Three-BWT. To achieve the same power generation, the Two-BWT needs a higher speed; the blade tip speed is much higher, and the noise is much higher. This is a big disadvantage for onshore wind turbines. For offshore wind turbines, low manufacturing costs, transportation costs, and installation costs are very attractive. Furthermore, the disadvantage of strong noise is not so obvious in the marine service environment. So, Two-BWT could be an alternative to future offshore wind power. The aerodynamic design of the Two-BWT blade is the focus of this paper because they are important energy capture components in wind turbines, whose shape and structure are the key factors affecting wind energy capture.
Blade optimization design is a hot topic in wind turbine design, which is widely concerned by academic and engineering circles. For example, Z. Qin et al. carried out the design and structural response analysis of a 38-meter-long wind turbine blade under an extreme static load [8]. G.P. Serafeim et al. studied the blade mass reduction of a 10 MW wind turbine using a passive control technique [9]. T. Bagherpoor et al. used MATLAB programming to optimize the structure of a 2 MW composite wind turbine blade [10]. The blade design mainly focuses on two aspects: one is aerodynamic design, and the other is strength design. The aerodynamic design is mainly influenced by the distribution of airfoil, chord length, and torsional angle, while the strength design is mainly influenced by the material and structure [11,12,13]. As far as aerodynamic design is concerned, the main calculation methods used at present are BEM (Blade Element Momentum) theory [14,15] and CFD (Computational Fluid Dynamics) method [16,17]. Airfoil selection is an important prophase work in blade design. Many countries and institutions in the world have carried out continuous research on airfoil design and formed a relatively stable airfoil database, such as NACA airfoils, RISø airfoils, FFA airfoils, and DU airfoils. Different airfoils have different characteristics, so how to choose the airfoils depends on the specific design objectives. M. Avvad et al. analyzed the performance of three airfoils at different pitch angles and wind speeds [18]. To further improve the energy efficiency of wind turbines, S. Huang et al. proposed a new wind turbine design method using bionic blades [19]. Based on S809 and NACA 63215 airfoils, S.-C. Yen et al. designed a new type of hybrid blade airfoil [20]. There are also some studies on the distribution of chord length and twist angle. A. Alkhabbaz et al. used a unique linearization method to divide the congruent line into equal divisions, and linearized the chord and torsion distributions of a 10 kW horizontal axis wind turbine [21]. L. Jia et al. proposed a reinforcement learning-based approach to effectively search for optimal twist distribution for optimizing power [22]. M. Tahani et al. used a new linearization method, through the different points of chord and twist and tangent cross, to solve the distribution of chord and twist. The optimal point along chord and twist distribution with a higher total power coefficient is determined [23]. M. Tahani et al. introduced the distribution of chords and twists by fitting different types of functions and chose 48 functions as possible distributions for analysis [24]. S. Rahgozar et al. used four possible combinations of the linear/nonlinear distribution of chord length and twist angle for small wind turbines, and the multi-objective optimization analysis of its output power and start-up time is carried out [25]. In addition, much of the research on blade optimization focuses on design algorithms such as genetic algorithms, artificial neural networks, and support vector machines. A. Pourrajabian et al. investigated the robustness and accuracy of continuous and binary techniques in genetic algorithms for wind turbine blade design [26]. M. Sessarego et al. introduced the method of using a neural network to optimize the blade design of the curved wind turbine blade [27].
Although some research work has been done, there are still many challenges to design wind turbine blades more accurately and efficiently, especially for the blade optimization design of the new large offshore Two-BWT. In comparison, the two-blade design can refer to less empirical knowledge than the three-blade design; for example, how to determine the diameter of the two-blade wind rotor. The flow field characteristics of the two-blade wind rotor are also different from those of the three-blade wind rotor. To provide knowledge support for the commercial development of offshore Two-BWT, this paper will provide in-depth research on the design optimization of the offshore two-blade wind rotor blade. The main challenges to be solved include: (1) the effective determination of the diameter of the two-blade wind rotor; (2) the determination of aerodynamic design variables and their corresponding change control modes; (3) the construction of optimization objectives and their optimization solutions; and (4) investigation of global flow field characteristics of two-blade wind rotor. To better understand the process of this work, the research flow is illustrated using Figure 1.
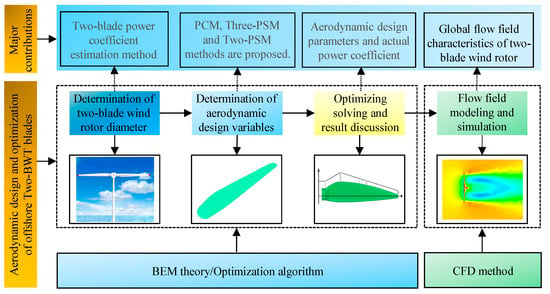
Figure 1.
Research flow of the Two-BWT blade design.
In general, the innovative contributions of the paper can be summarized as follows:
- An aerodynamic design method for novel offshore Two-BWT blades is presented.
- The design variable control models (PCM, Three-PSM, and Two-PSM) are adopted.
- The wind speed distribution and blade pressure distribution in the Two-BWT flow field are investigated.
2. Determination of Two-Blade Wind Rotor Diameter
2.1. Blade Aerodynamic Modeling
Wind turbine blades are composed of sections of different airfoils. To design a blade, aerodynamic modeling is required to obtain parameters such as thrust and power coefficient. As the classic and most widely used method, BEM (Blade Element Theory) is the preferred method for blade aerodynamic modeling. Figure 2 shows the wind turbine, blade, and elemental forces. According to the BEM theory, the aerodynamic forces acting on the blade interface can be expressed as lift and drag, that is
where is the lift acting on the local blade element, is the drag acting on the local blade element; c is the chord length; is the air density; is the lift coefficient, is the drag coefficient; is the wind speed; is the wind velocity relative to the local blade element; is the blade element length.
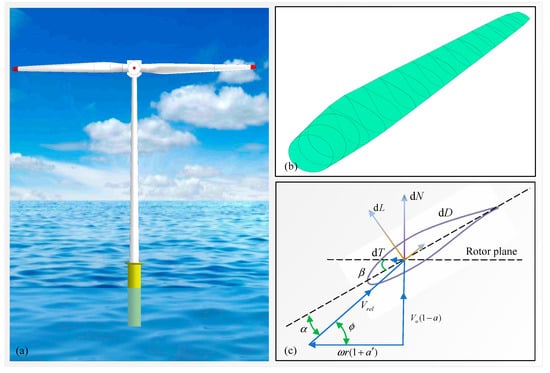
Figure 2.
Wind turbine, blade, and elemental forces. (a) Wind turbines; (b) Wind turbine blade; (c) Local elemental forces.
According to the principle of force synthesis and decomposition, the lift force and drag force on the blade element can be further decomposed into the tangential force and the normal force, and the expression is [28,29]
where is the tangential force (tangential to the rotor plane), is the normal force (normal to the rotor plane); is the inflow angle.
Then, starting from the tangential force, the power expression of the wind rotor can be further deduced as
where B is the number of blades in the wind rotor; is the rotational speed of the wind rotor; R is the rotor radius.
The total thrust expression can be written as
So, the power coefficient expression can be written as
where is the power coefficient.
The thrust coefficient expression can be written as
where is the thrust coefficient.
2.2. Estimation of the Two-BWT Rotor Diameter
When designing the Two-BWT blades, the wind rotor diameter needs to be determined. The wind rotor diameter is also the basic dimension parameter for blade design, and with this parameter, the aerodynamic shape can be further optimized. Generally, the rated power of the wind turbines is set at the beginning of the design, and then the rated wind speed is determined according to the wind resource characteristics of the wind farm. Based on these conditions, if the power coefficient can be also given, the wind rotor can be directly estimated by the following formula
where is the wind rotor diameter.
Under the premise that the rated power and wind speed are given, the key in Equation (9) is to obtain the power coefficient. As a new type of wind turbine, the research and prior knowledge of the power coefficient of the Two-BWT is less. How to obtain the power coefficient of the Two-BWT has become a key point of this paper. To solve this problem, the idea adopted is to carry out a “three-to-two” calculation for an already designed three-blade wind turbine based on the previously established blade aerodynamic model; that is, to artificially transform the three-blade wind turbine into a two-blade wind turbine.
Here, the NREL 5 MW offshore wind turbines are selected as the calculation objects. Table 1 shows the blade aerodynamic parameter distribution. The total blade length is 61.5 m. “RNodes” in the table are the blade node locations, oriented along the blade pitch axis from the rotor center to the blade cross-section. This blade consists of several airfoils; in the table, “DU” means Delft University, and “NACA” means the National Advisory Committee for Aviation. More detailed information on the blades and wind turbines can be found in the literature [30]. Using the NREL 5 MW blade parameters, the three-blade wind rotor form and the two-blade wind rotor form are set in the simulation software “Qblade,” which is open-source software designed based on BEM theory (http://q-blade.org (accessed on 25 June 2022)). Then, the power coefficient and thrust coefficient are calculated, respectively, as shown in Figure 3.

Table 1.
Blade aerodynamic parameter distribution [30].
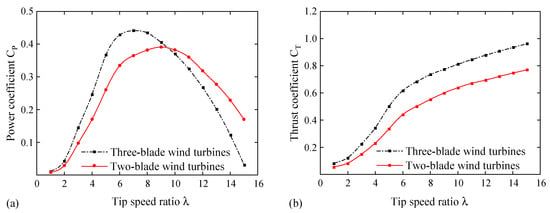
Figure 3.
Power coefficient and thrust coefficient. (a) Power coefficient; (b) Thrust coefficient.
When calculating, the wind speed is set to the rated wind speed of 11.4 m/s. Figure 3a shows the relationship between the power coefficient and tip speed ratio; Figure 3b shows the relationship between the thrust coefficient and tip speed ratio. From Figure 3a, it is found that the power coefficient of the three-blade wind rotor is higher than that of the two-blade wind rotor in the region with a low tip speed ratio. In the region of high tip speed ratio, the power coefficient of the two-blade wind rotor is higher than that of the three-blade wind rotor. The reason for this phenomenon is that the change in the number of blades leads to a change in the solidity of the rotor, which in turn affects the change of the induction factor during the aerodynamic analysis. However, for large wind turbines, because the blades are very long, the tip speed ratio cannot be too large, otherwise, the linear speed of the blade tip will exceed the design value. In this way, it is generally unlikely that the power coefficient of the two-blade wind rotor is greater than that of the three-blade wind rotor in practice. It can also be seen that for the two-blade wind rotor and the three-blade wind rotor, the tip speed ratios corresponding to their respective maximum power coefficients are different. The maximum power coefficient of the three-blade wind rotor is larger than that of the two-blade wind rotor. In the figure, the power coefficient of the three-blade wind rotor is 0.44, and that of the two-blade wind rotor is 0.39 (equivalent to 88.6% of the three-blade wind rotor). In addition, comparing the thrust coefficient curves of the two-blade wind rotor and the three-blade wind rotor in Figure 3b, it is found that the thrust coefficient of the two-blade wind rotor is always lower than that of the three-blade wind rotor. Moreover, the changing trend of the two is generally the same. The changing trend of the thrust coefficient is different from that of the power coefficient.
According to the calculation result in Figure 3, the maximum power coefficient can be preset to be 0.39. By substituting the power coefficient value into Equation (9), the two-blade wind rotor diameter can be calculated, that is
3. Determination of Aerodynamic Design Variables
To obtain the excellent aerodynamic performance of wind turbine blades, it is necessary to optimize the distribution of relevant parameters that affect the aerodynamic characteristics, such as airfoil distribution, chord length distribution, and twist angle distribution. In reference [13], a quadratic function is used to control the distribution pattern of the blade chord length and twist angle, which realizes the parameterized control of aerodynamic variables. This method can effectively realize the aerodynamic optimization design of the blades. Similarly, the parameterized control mode of blade aerodynamic parameter distribution is adopted in this paper, and new Three-PSM and Two-PSM methods are proposed.
3.1. Airfoil Distribution Variables
Referring to the airfoil used by the NREL 5 MW blade, combined with the aerodynamic characteristics of each airfoil, the DU30 airfoil, DU25 airfoil, DU21 airfoil, and NACA 64 airfoil are selected for this 2 MW blade design, distributed in the blade span, as shown in Figure 4. Here, the airfoil distribution on the blade is called piecewise combination method (PCM). l1 is the sum of the hub radius and cylinder length of the blade root. Usually, the length of the cylindrical segment does not change much, so it can be determined in advance in the design—that is, it can be regarded as a constant value. l2, l3, l4, and l5 are the distribution lengths of the three airfoils in the spanwise direction of the blade, respectively. During design, these length parameters can be freely changed within a certain range. In this way, the blade airfoil distribution can be written as
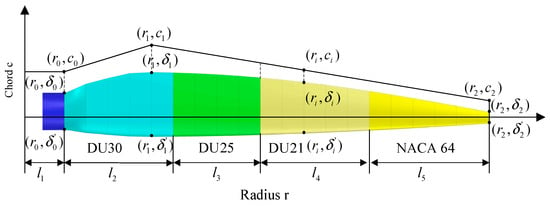
Figure 4.
Blade airfoil distribution and chord length distribution.
Although l2, l3, l4, and l5 are all changed, the sum of the three is constant (the value is R − l1); this means that it just makes three of the four variables. For example, let l2, l3, and l5 be variables, one has
3.2. Chord Length Distribution Variables
In Figure 4, the abscissa represents the spanwise length of the blade, and the center of the hub is the origin of the coordinate. At the rotor radius ri, the value of the chord length ci is equal to . According to the experience of blade chord length distribution, the chord length coordinate at the root of the blade, the maximum chord length coordinate , and the chord length coordinate at the blade tip are set in advance. In the reference [13], the distribution of chord length is in the form of the quadratic function, and here, the distribution of chord length is in the form of the sinusoidal function. Here, this chord distribution control is called the three-point sine method (Three-PSM). Its expression can be written as
where is the chord length of each airfoil section of the blade, and are the equation coefficients.
From Equation (10), if the coefficients are determined, the chord length at any section can be determined.
Since function passes through point , point , and point , the coefficients ,,, and can be represented by and as
Then, the function can be rewritten as
In Equation (12), the equation coefficients have been reduced to two variables and , that is, if and are given, the chord length on any section is known. On the other hand, the chord length of the blade root to the maximum chord length of the blade has an increasing trend, and the chord length from the maximum chord length to the blade tip chord length has a decreasing trend. So, two monotonic intervals and of the sine function, respectively, are chosen as control intervals for the design. From this, the range of variables and can be obtained as
3.3. Twist Angle Distribution Variables
In a coordinate system, the abscissa represents the spanwise length of the blade, and the ordinate represents the blade twist angle. The blade-root twist angle coordinate and the blade-tip twist angle coordinate are preset as control variables. Then, the sine function is used to control the blade’s twist angle distribution of each airfoil section. This twist distribution control is called the two-point sine method (Two-PSM). The expression can be expressed as
where is the twist angle of the blade airfoil section; , and are the equation coefficients; and is the adjustment parameter (preset, for example, 1).
Substituting the coordinates and into Equation (16), the expressions for the coefficient and are obtained as
Then, the function can be rewritten as
The distribution of the blade twist angle obeys the rule that it decreases gradually from root-to-tip. This is because the inflow angle at the blade root is the largest and the inflow angle at the blade tip is the smallest. To make each element of the blade in the best performance, their attack angles should not differ much, so it is necessary to have a large twist angle at the blade root and a small twist angle at the blade tip. Therefore, selecting the interval as the design range, the range of variable is
4. Optimizing Solving and Result Discussion
4.1. Design Objective and Solutions
Compared with the Three-BWT, the Two-BWT require a higher rotational speed to achieve the same power generation, resulting in higher linear speeds and stronger noise. In addition, although increasing the rotational speed of the wind rotor will bring about higher power generation, it will make the wind turbine blades easily damaged. On the premise that the rated wind speed and rated power remain unchanged, reducing the rotational speed of the wind rotor required to capture wind energy can prolong the life of wind turbines and obtain more reliable economic benefits.
According to Equations (11), (14), and (18), the extracted variables are as follows
The design objective is the minimum required rated speed nrated, that is, min (nrated)
Here, it should be noted that both , , and are dimensionless, but their value range is expressed by , , , , and . The objective and variables in the optimization model cannot form a direct functional relationship, and a program needs to be written for iteration. The process of solving the minimum rated rotational speed to meet the rated power is complicated, while it is relatively simple to solve the maximum power under a certain speed condition. Therefore, according to the ideas in the reference [13], the solution steps are changed; that is, the rotational speed of the wind rotor is first used as a variable to obtain the maximum power at different rotational speeds. Then, the rotational speed of the wind rotor at which the maximum power is equal to the rated power is found. At this point, the rotational speed of the wind rotor is the minimum rotational speed required to satisfy the rated power condition. Figure 5 shows the optimization design method and process of the Two-BWT blades. Overall, it is divided into four stages, namely determining the two-blade wind rotor diameter, determining the aerodynamic design variables, establishing the optimized design model, and optimizing solving.
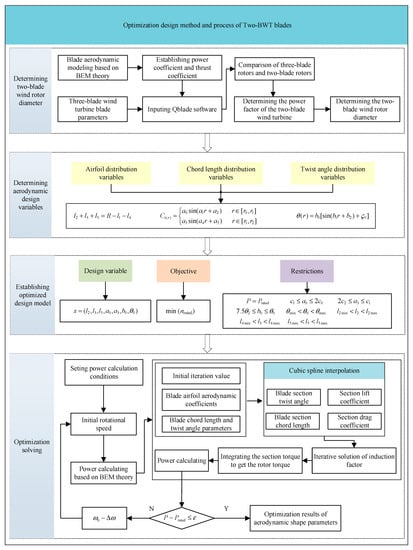
Figure 5.
Optimization design method and process of the Two-BWT blades.
In the optimization solution process, the power calculation needs to be programmed based on BEM theory. For optimization, it is necessary to set the value range of relevant parameters and the initial conditions of calculation, such as the initial rotational speed, wind speed, pitch angle, etc. Then, the optimization objective is modified to maximize the power, and in this case, the first term of the optimization constraint is canceled. The “fmincon” function, which finds the minimum of the constrained nonlinear multivariable function, is chosen as the optimization algorithm. This “fmincon” optimization algorithm uses the first-order derivative information of the objective function and the constraint function to iterate from the given initial point along the descending direction of the objective function and finally converge. The power-solving procedure is embedded in the calculation process. Taking the power as a negative value, the result of the minimization solution is the maximum power. In this way, the corresponding aerodynamic shape parameters can be obtained. In the process of calculating wind rotor power using BEM theory, iterative calculation of velocity induction factor is an important task. The specific calculation method can be found in references [28,29,31], and will not be repeated here.
In this optimization design example, the parameters are set as: , , , , , , , , , , , , , , , . The set rated wind speed is ; The set initial speed is , , and .
After the optimized design, the aerodynamic parameters of the blade are: , , , , , , and . The specific aerodynamic data are shown in Table 2, and the minimum rotational speed of the wind rotor required to meet the rated power is 1.67 rad/s.

Table 2.
Designed blade chord, twist angle, and airfoil distribution.
The performance of the newly designed 2 MW Two-BWT is shown in Figure 6. Figure 6a,b show the power coefficient and thrust coefficient under different tip speed ratios, respectively. Taking the tip speed ratio 6 as an example, the comparison between Figure 3a and Figure 6a shows that the power coefficient of the new Two-BWT is 0.36, which is 83.7% of that of the Three-BWT (which is 0.43). Figure 3a also shows the results of directly using two blades of the Three-BWT to calculate the power coefficient. When the tip speed ratio is 6, its value is 0.33. The power coefficient is increased by 9% by using the method proposed in this paper. Figure 6c,d show the power coefficient and thrust coefficient under different pitch angles, respectively. Here, the calculation condition is that the wind speed is 11.4 m/s and the rotational speed is 1.67 rad/s. This is the rated rotational speed and rated wind speed determined during design. With the increase of the pitch angle, the power coefficient will decrease. Moreover, the intensity of descent in two areas is different. When the pitch angle is small, the descent is slow, and when the pitch angle is large, the descent speed is fast. The trend of the thrust coefficient curve changing with the pitch angle is different from that of the power coefficient. In the area with the small pitch angle (less than 8°), the thrust coefficient increases with the increase of the pitch angle. In the area with the large pitch angle (greater than 8°), the thrust coefficient decreases with the increase of the pitch angle.
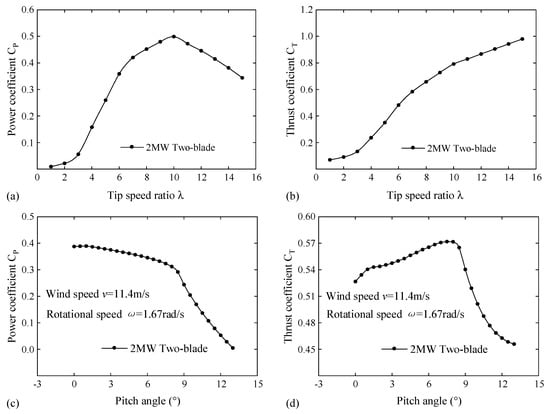
Figure 6.
Performance curve of Two−TWB. (a) Power coefficient under different tip speed ratios; (b) Thrust coefficient under different tip speed ratios; (c) Power coefficient under different pitch angles; (d) Thrust coefficient under different pitch angles.
4.2. Result Discussion
The above design process and results are carried out according to the maximum chord length of 3.5 m and the maximum chord length of 10 m from the center of the hub. In other words, the maximum chord length and its location are set to constant. To further study the influence of the maximum chord length change and its location change on the design results, the maximum chord length is set to 3.2 m and 3.8 m (the location of the maximum chord length remains unchanged at r1 = 10 m) for redesign, and the following results are obtained: when c1 is equal to 3.2 m, , , , , and the rotational speed of the wind rotor is equal to 1.75 rad/s; when c1 is equal to 3.8 m, , , , , and the rotational speed of the wind rotor is equal to 1.61 rad/s. Then, the location of the maximum chord length is set to 8 m and 12 m, respectively (the maximum chord length remains unchanged at c1 = 3.5 m), and the following results are obtained: when r1 is equal to 8 m, , , , , and the rotational speed of the wind rotor is equal to 1.70 rad/s; when r1 is equal to 12 m,, , , , and the rotational speed of the wind rotor is equal to 1.64 rad/s. The results are summarized in Table 3. The airfoil distribution does not change in the design results. The reason for this phenomenon is that the airfoil distribution is only related to the spanwise length, not the chord length. Therefore, when only changing the value and location of the maximum chord length, the airfoil distribution will not be affected. When changing the maximum chord length, the distributions of chord length and torsion angle change; the smaller the maximum chord length is, the smaller the maximum torsion angle is, but the rotational speed of the wind rotor increases. When changing the location of the maximum chord length, the chord length distribution function does not change (the coefficients and do not change). The main reason for this phenomenon is that the variation of the location of the maximum chord length is small compared to the spanwise length of the blade, which does not affect the expression of the distribution function. The designed blade shape is shown in Figure 7. Figure 7a–c show the blade shape when the maximum chord length is 3.2 m, 3.5 m, and 3.8 m, respectively. Figure 7d–f show the blade shape when the location of the maximum chord length is 8 m, 10 m, and 12 m, respectively.

Table 3.
The effect of the maximum chord length and its location change.
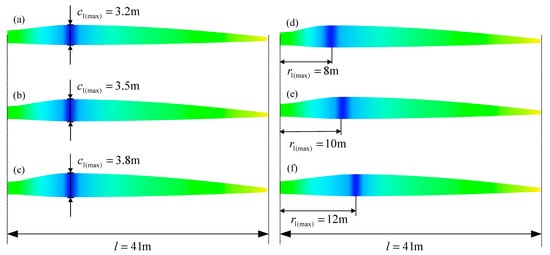
Figure 7.
Blades with different maximum chord length values and locations. (a) Blade shape with a maximum chord length of 3.2 m; (b) Blade shape with maximum chord length of 3.5 m; (c) Blade shape with a maximum chord length of 3.8 m; (d) Blade shape with maximum chord length position of 8 m; (e) Blade shape with maximum chord length position of 10 m; (f) Blade shape with maximum chord length position of 12 m.
Figure 8 shows the effect of the value and location of the maximum chord length. Figure 8a shows the effect of changing the maximum chord length value on the chord length distribution. Under the condition of different maximum chord lengths, the law of chord length distribution is the same. When the maximum chord lengths are 3.2 m and 3.5 m, respectively, the torsion angle distributions in Figure 8b are coincident; but, when the maximum chord length is 3.8 m, the torsion angle distribution deviates significantly from the other two cases. Each power curve in Figure 8c has a maximum point, which is monotonically increasing on the left of the maximum point and monotonically decreasing on the right. The larger the maximum chord length, the greater the power coefficient corresponding to the same tip speed ratio on the left of the maximum point of the power curve, and the smaller the power coefficient corresponding to the same tip speed ratio on the right side of the maximum point of the power curve. Since the location change of the maximum chord length does not change the chord length distribution function, the three chord length distribution curves in Figure 8e have the same trend of change. However, a cross occurs because the maximum point moves horizontally. Under the condition that the location of the maximum chord length changes to a certain extent, the torsion angle distribution curves coincide (Figure 8e), and the change of the power coefficient is also very small (Figure 8f). This shows that if the location of the maximum chord length changes within a certain range, it has little effect on the aerodynamic design, and more attention can be linked to the strength analysis of the structural design.
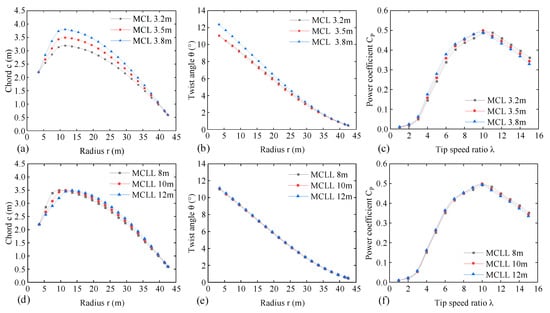
Figure 8.
Effect of the value and location of the maximum chord length. (Note: MCL is the abbreviation for maximum chord length and MCLL is the abbreviation for maximum chord length location.). (a) chord length of MCL; (b) Twist angle of MCL; (c) Power coefficient of MCL; (d) chord length of MCLL; (e) Twist angle of MCLL; (f) Power coefficient of MCLL.
5. Flow Field Modeling and Simulation
5.1. Modeling and Flow Field Setup
Using the airfoil distribution, chord length distribution, and twist angle distribution obtained from the optimal design of the blade shown in Table 2, a three-dimensional solid model is established. After that, two blades are assembled on the simplified hub to form a two-blade wind rotor model. The wind rotor model is then imported into ANSYS Fluent (CFD) software, and the different surfaces are stitched together into a single geometry using the geometry stitching function.
In many references, the location of the velocity inlet and pressure outlet has been studied. For example, L. Wang et al. [32] selected 3R and 10R as the distance from the velocity inlet and pressure outlet to the blade (R is the radius of the wind rotor). B. Ji et al. [33] and A. Eltayesh et al. [34] used 7R as the distance from the pressure outlet to the blade. In this paper, the diameter of the velocity inlet is set as 8R, and the distance from the wind rotor is 3R. The diameter of the pressure outlet is 12R, which is 7R away from the wind rotor. In this way, a conical calculation domain is formed, as shown in Figure 9a. The outer surface of the computational domain is also considered as the velocity inlet, which has the same velocity as the main inlet.
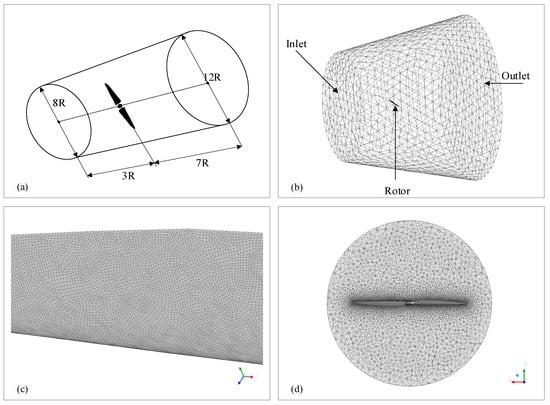
Figure 9.
Flow field settings of the Two-BWT. (a) Flow field space settings; (b) Flow field meshing; (c) Blade surface meshing; (d) Local area mesh for wind rotor.
In Figure 9b–d, the unstructured mesh is adopted for mesh division in the computing domain. To obtain a better boundary-layer solution effect, the surface of the wind rotor is treated with an inflation layer. Ten inflation layers are used, with an inflation rate of 1.5, and the first layer is 3.8 × 10⁻⁵ m high so that the y+ value around the entire wind rotor surface is close to 1, as shown in Figure 10.
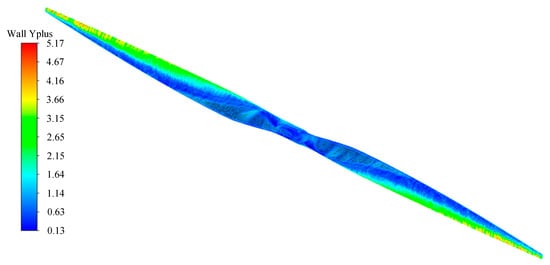
Figure 10.
Blade y+ distribution.
The SST k-omega viscous model is selected for the turbulence model, the motion mode of the flow field is set to the reference frame motion, the rotation axis is set to the z-axis, and the rotation speed is set to −1.67 rad/s. In the boundary condition setting, the blade is set as a static wall, the wind speed at the inflow port is 11.4 m/s, and a mesh interface is created to ensure the information exchange of periodic surfaces. The SIMPIE algorithm is selected as the simulation calculation method to make the convergence speed faster, and the convergence residual is set to 1× 10⁻⁶. Finally, the number of iterations is set to 1500.
5.2. Mesh Sensitivity Analysis
To determine the appropriate mesh size of the wind rotor surface and blade surface, mesh sensitivity is studied. The wind speed and the rotational speed of the wind rotor are set to 11.4 m/s and 1.67 rad/s, respectively. In the process of analysis, five mesh sizes of the wind rotor surface are studied, namely 0.055 m, 0.06 m, 0.07 m, 0.08 m, and 0.09 m. In another scenario, the simulation of a single blade can be used to replace the simulation of the whole wind rotor. This is because the wind rotor is symmetrical about its rotation center. By using single-blade simulation, the mesh can be divided more finely to obtain a better aerodynamic performance calculation effect. By using wind rotor simulation, better flow field distribution characteristics can be observed. Different simulation modes can be selected according to different situations. Therefore, it is also necessary to analyze the mesh sensitivity of single-blade simulation. Five mesh sizes of the blade surface, namely 0.035 m, 0.04 m, 0.05 m, 0.06 m, and 0.07 m, are also studied. The number of meshes and the calculated rotor torque are shown in Table 4 and Figure 11. The rotor torque has a good convergence effect when the mesh size of the rotor surface is 0.06 m, and the mesh size of the blade surface is 0.04 m. When the mesh size of the wind rotor surface and blade surface is further refined to 0.055 m and 0.035 m, the difference with the former is 0.8% and 1.6%, respectively, but the number of meshes will increase from more than 7 million to more than 9 million, which increases the time cost. In this paper, the mesh size of 0.06 m and 0.04 m is selected as the appropriate element surface size of the model surface. It can also be seen from Table 4 that under the same mesh size, the calculated rotor torque is very close, which also shows that both modes can be used. However, with the same mesh size, the mesh number of single-blade simulation is much less. With the same computing power, it is possible to further refine the mesh.

Table 4.
Results of mesh sensitivity analysis.
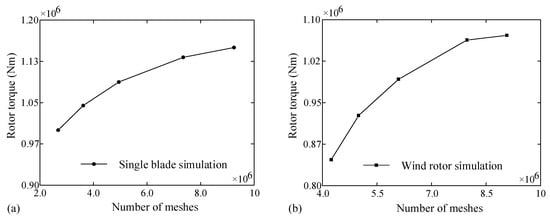
Figure 11.
Rotor torque calculation results under different mesh numbers. (a) Single-blade simulation; (b) Wind rotor simulation.
5.3. Model Feasibility Verification
To verify the effectiveness of the model, the same CFD solution scheme is used to calculate the NREL 5 MW wind turbine rotor under different working conditions, and the power and thrust are compared with those in the literature [30]. The comparison results are shown in Figure 12. Below the rated wind speed, the two are very close. Above the rated wind speed, the power calculated by the CFD model has a certain deviation from the data in the literature. The thrust is consistent at all wind speeds. Below the rated wind speed, the relative error of the power calculated by the CFD and the power in the literature is less than 4%. Above the rated wind speed, the relative error of the power calculated by the CFD and the power in the literature is more than 4%. For example, when the wind speed reaches 20 m/s, the error between the two is about 9%—less than 10%. Here, the relative error is defined as the percentage of the difference between the two and the corresponding value in the literature. For thrust comparison, the maximum relative error is about 5%. This shows that the modeling method adopted in this paper is feasible.
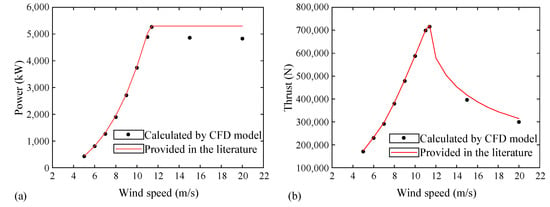
Figure 12.
CFD model verification results. (a) Power curve; (b) Thrust curve.
5.4. Simulation Results and Discussion
Figure 13 shows the cloud map of the wind speed distribution of the two-blade wind rotor flow field. Figure 13a,b are the cloud maps of the wind speed distribution at 6 m and 4 m away from the front of the wind rotor, respectively. In the area facing the plane of the wind rotor, the wind speed is greatly affected, and the wind speed distribution is complex. There is a concentrated area of low wind speed near the projection of the two blades, and the lowest wind speeds in the two figures are 8.79 m/s and 8.17 m/s, respectively.
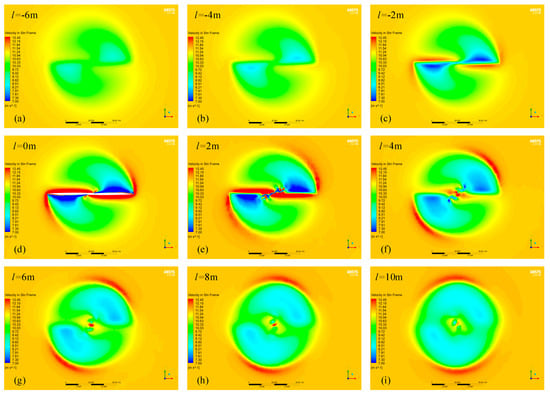
Figure 13.
Wind speed cloud map at different locations. (a) 6 m away from the front of the wind rotor; (b) 4 m away from the front of the wind rotor; (c) 2 m away from the front of the wind rotor; (d) Wind.rotor plane; (e) 2 m behind the wind rotor; (f) 4 m behind the wind rotor; (g) 6 m behind the wind rotor; (h) 8 m behind the wind rotor; (i) 10 m behind the wind rotor.
Figure 13c is the cloud map of the wind speed distribution 2 m away from the front of the wind rotor. The low wind speed area near the projection of the wind rotor blades is more obvious, and the minimum wind speed is 7.12 m/s. In addition, it is also found that in the periphery of the low wind speed concentrated area, there is a local high wind speed area with a divergent trend, and the highest wind speed is 12.26 m/s. Figure 13d is the wind speed cloud map at the plane of the wind rotor. On the two sides of the blade, high wind speed areas and low wind speed areas appear, respectively. The highest wind speed appears at the tip of the blade, reaching 68.71 m/s; the lowest wind speed appears at the middle of the blade, and its value was 0.71 m/s. In this way, the pressure on one side of the blade is large, and the pressure on the other side is small, thus forming lift and drag. Another interesting phenomenon is that there are two local high wind speed point domains near the blade root. Figure 13e is the wind speed cloud map at 2 m behind the plane of the wind rotor. The highest wind speed is behind the blade root, and its value is 19.02 m/s. The low wind speed area and the high wind speed area show a relatively obvious alternating phenomenon. Figure 13f–i are the wind speed cloud maps at 4 m, 6 m, 8 m, and 10 m behind the wind rotor, respectively. It can be found that the area with the highest wind speed is concentrated behind the center of the hub, and the second highest wind speed area appears on the edge of the projection plane of the wind rotor. The reason for this phenomenon is that the tip rotation has a perturbing effect on the wind speed. In addition, the low wind speed area is gradually dispersed to the entire rotor area.
Figure 14 shows the wind speed cloud map of the whole flow field of the two-blade wind rotor and the distribution map of the front and rear streamlines of the wind rotor. Figure 14a is the 3D wind speed cloud map of the whole flow field. From a macro perspective, the influence of the wind rotor on the flow field is mainly reflected in the rear area of the wind rotor.
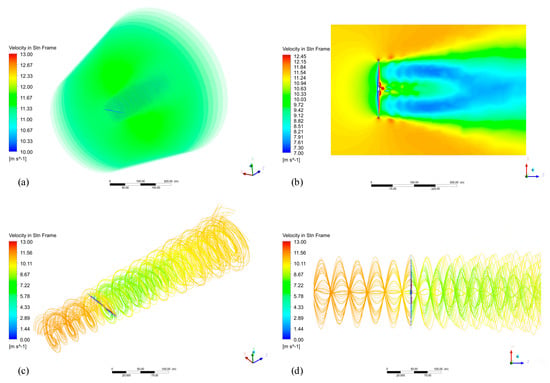
Figure 14.
Flow field and streamline of the Two−BWT. (a) 3D wind speed cloud map of the whole flow field; (b) Wind speed cloud map of the axial section of the whole flow field; (c) Streamline distribution maps of the whole flow field; (d) Streamline distribution maps of the axial section of the whole flow field.
Figure 14b is the wind speed cloud map of the axial section of the whole flow field. In front of the wind rotor, the wind speed is significantly lower near the wind rotor. A concentrated high wind speed dot-area appeared on the periphery of the blade tip. After passing through the wind rotor, the flow field appeared as a diffusion phenomenon. At the back of the wind rotor, there is a high wind speed concentration in the peripheral local area of the hub and blades. A little further away, there is an obvious horizontal V-shaped low wind speed area in the flow field, which is the unique wake phenomenon of the two-blade wind rotor. Figure 14c,d are the streamline distribution maps of the whole flow field. The velocity streamline distribution from the inlet to the front of the wind rotor is uniform, and the streamline distribution becomes complicated after passing through the wind rotor. Farther from the front of the wind rotor, the color of the streamline is the same, indicating that the wind speed has not changed. Approaching the front of the wind rotor, the color of the streamline becomes lighter, indicating that the wind speed gradually decreases. Behind the wind rotor, there is a phenomenon of coexistence of multiple colors of streamlines, and the colors of the streamlines gradually tend to be consistent in the distance.
When conducting a flow field investigation, the fineness of mesh division is related to the object’s structural characteristics and size, the computer’s computing power, and other factors. The full flow field investigation is beneficial to grasp the overall aerodynamic characteristics of the designed wind rotor, and a more detailed analysis requires further observation of the pressure clouds at different sections of the blade. For more accurate observation, it is necessary to further refine the mesh of the blade and the flow field in which it is located. Combined with the research of mesh sensitivity, the single-blade flow field simulation with higher calculation accuracy is selected, the mesh size of the blade surface is 0.04 m, and the total number of meshes are 7.35 million.
Figure 15 contains the pressure cloud map of the blade-spanned section from 8%R to 90%R, covering the root, middle, and tip of the blade, involving 4 airfoils. Figure 15a–c are the cross-sectional pressure cloud maps at 8%R, 9%R, and 10%R, and the cross-section airfoil is DU30 airfoil; Figure 15d–f are the cross-sectional pressure cloud maps at 13%R, 15%R, and 17%R, and the cross-section airfoil is DU25 airfoil; Figure 15g–i are the cross-sectional pressure cloud maps at 25%R, 35%R, and 45%R, and the cross-section airfoil is DU21 airfoil; Figure 15j–l are the cross-sectional pressure cloud maps at 60%R, 75%R, and 90%R, and the cross-sectional airfoil is NACA 64 airfoil.
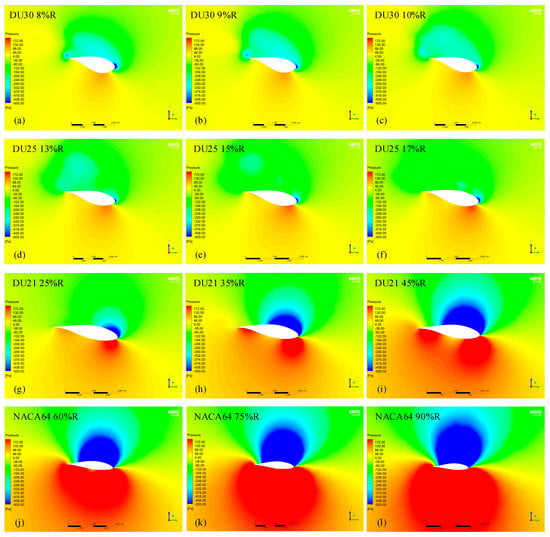
Figure 15.
Pressure cloud maps at different sections of the Two−BWT blade. (a) At 8% R section; (b) At 9%R section; (c) At 10%R section; (d) At 13%R section; (e) At 15%R section; (f) At 17%R section; (g) At 25%R section; (h) At 35%R section; (i) At 45%R section; (j) At 60%R section; (k) At 75%R section; (l) At 90%R section.
Overall, the high-pressure area is distributed on the lower surface of the airfoil section, and the low-pressure area is distributed on the upper surface of the airfoil section as illustrated in Figure 15. The pressure in the high-pressure area near the blade root is lower than that in the high-pressure area near the blade tip, and the pressure in the low-pressure area near the blade tip is lower than that in the low-pressure area near the blade root. Therefore, the pressure difference between the upper and lower surfaces of the section near the blade tip is the largest. The main reason for this phenomenon is that the closer to the blade tip, the greater the linear velocity of the blade section. Furthermore, this is also related to the airfoil characteristics at different sections. There is a low-pressure concentration area on the leading edge of the airfoil section, from the blade root to the blade tip; this low-pressure concentration area gradually spreads along the upper surface of the airfoil section. At 90%R, almost the entire upper surface of the airfoil section is covered. At the root of the blade, the pressure is highest on the lower surface of the airfoil section near the leading edge, forming a high-pressure concentration area that gradually decreases along both sides. The further to the middle and tip of the blade, the greater the pressure in the high-pressure area. Moreover, in the middle region of the blade, high-pressure concentration areas appear near the leading edge and trailing edge of the lower surface of the airfoil section, respectively. At the tip of the blade, the high-pressure concentration area on the lower surface of the airfoil section has covered the entire surface.
Table 5 shows the power calculation results based on the CFD method and the BEM theory, respectively. During the calculation, the rotational speed of the wind rotor is set to 1.67 rad/s, and the wind speed variation range is set to 10.2 m/s–12.6 m/s. The calculated deviation is defined as the ratio of the difference between the two to the BEM result. Through comparison, it is found that the maximum power deviation obtained by the two methods is 5.5%, and the minimum is 3.2%. This also proves that the method adopted in this paper for the design of 2 MW two-blade wind turbine blades is feasible.

Table 5.
Comparison of power calculation results.
6. Conclusions
In this paper, an optimal design method for two-blade wind turbine blades is proposed. The power coefficient of the Two-BWT is calculated by analogy with the Three-BWT, and the diameter of the two-blade wind rotor for a 2 MW wind turbine case is determined based on this power coefficient. Then, the airfoil distribution, chord length distribution, and twist angle distribution are used as the influencing factors of blade aerodynamic optimization, and their design invariants and variables are set, respectively. According to the characteristics of the variables in the airfoil distribution, chord length distribution, and twist angle distribution, the respective variation ranges and variation methods are set. To obtain better aerodynamic performance, a variety of airfoils are used in the blade span, and the distribution optimization of multiple airfoils is realized through the optimization solution. By comparing the characteristics of various functions, the sine function is used as the control function of the chord variable and the twist angle variable, and the influence of the maximum chord value and the location of the maximum chord on the aerodynamic performance of the blade is discussed. The optimization model takes the minimum rotational speed of the wind rotor under the conditions of rated power and rated wind speed as the objective and transforms the problem of solving the minimum rotational speed of the wind rotor into the problem of solving the maximum power, thereby reducing the difficulty of solving. The power coefficient of the new Two-BWT can reach 0.36, which is 83.7% of that of the Three-BWT. Furthermore, the power coefficient is increased by 9% by using the proposed method. The CFD method is used to analyze the wind speed distribution characteristics of the whole flow field and the pressure distribution characteristics of the blade section. The unique flow field phenomenon of the large two-blade wind rotor is obtained. In addition, the CFD method and the BEM theory are used to calculate the rotor power and the deviation between the two under multiple working conditions, and it is found that the maximum deviation is 5.5%. This proves the feasibility of the blade design optimization method for the 2 MW Two-BWT. The design method of wind rotor and its blades presented in this paper can provide a basis for the design of offshore Two-BWT.
Author Contributions
G.L. Modeling and numerical analysis; J.D. Contributing to the conception and writing the manuscript; C.Z. Structure design and paragraph organization; F.Z. Assisted writing and graphic design. All authors have read and agreed to the published version of the manuscript.
Funding
This work is supported by the National Natural Science Foundation of People’s Republic of China (grant number 52075164, 51975535) and the Science and Technology Innovation Program of Hunan Province (grant number 2021RC4038).
Data Availability Statement
No new data were created or analyzed in this study. Data sharing is not applicable to this article.
Conflicts of Interest
The authors declare no conflict of interest.
References
- Salvador, C.B.; Arzaghi, E.; Yazdi, M.; Jahromi, H.A.F.; Abbassi, R. A multi-criteria decision-making framework for site selection of offshore wind farms in Australia. Ocean Coast. Manag. 2022, 224, 106196. [Google Scholar] [CrossRef]
- Dai, J.; Yang, X.; Wen, L. Development of wind power industry in China: A comprehensive assessment. Renew. Sustain. Energy Rev. 2018, 97, 156–164. [Google Scholar] [CrossRef]
- Dai, J.; Hu, W.; Yang, X.; Yang, S. Modeling and investigation of load and motion characteristics of offshore floating wind turbines. Ocean Eng. 2018, 159, 187–200. [Google Scholar] [CrossRef]
- Çiftci, C.; Erdoğan, A.; Genç, M.S. Investigation of the mechanical behavior of a new generation wind turbine blade technology. Energies 2023, 16, 1961. [Google Scholar] [CrossRef]
- Chudzik, S. Wind Microturbine with Adjustable Blade Pitch Angle. Energies 2023, 16, 945. [Google Scholar] [CrossRef]
- Martynowicz, P. Experimental study on the optimal-based vibration control of a wind turbine tower using a small-scale electric drive with MR damper support. Energies 2022, 15, 9530. [Google Scholar] [CrossRef]
- Hou, Z.; Lv, X.; Zhuang, S. Optimized extreme learning machine-based main bearing temperature monitoring considering ambient conditions’ effects. Energies 2021, 14, 7529. [Google Scholar] [CrossRef]
- Qin, Z.; Qiang, S.; Zhang, M.; Rong, X.; Liao, C.; Wang, J.; Xu, J. Design and structural responses of a 38-meter sectional wind turbine blade under extreme static loads. Compos. Struct. 2022, 290, 115487. [Google Scholar] [CrossRef]
- Serafeim, G.P.; Manolas, D.I.; Riziotis, V.A.; Chaviaropoulos, P.K.; Saravanos, D.A. Optimized blade mass reduction of a 10MW-scale wind turbine via combined application of passive control techniques based on flap-edge and bend-twist coupling effects. J. Wind Eng. Ind. Aerodyn. 2022, 225, 105002. [Google Scholar] [CrossRef]
- Bagherpoor, T.; Xuemin, L. Structural optimization design of 2MW composite wind turbine blade. Energy Procedia 2017, 105, 1226–1233. [Google Scholar] [CrossRef]
- Vesel, R.W.; McNamara, J.J. Performance enhancement and load reduction of a 5 MW wind turbine blade. Renew. Energy 2014, 66, 391–401. [Google Scholar] [CrossRef]
- Damiano, M.; Russo, A.; Sellitto, A.; Vecchio, E.; Stellato, T.; Riccio, A. Design of a composite wind turbine blade manufactured with the ONE SHOT BLADE® technology. Mater. Today: Proc. 2021, 34, 103–105. [Google Scholar] [CrossRef]
- Juchuan, D.; Shanghong, Z.; Xiyun, Y.; Deshun, L.; Zejun, W. Design and optimizaiton of aerodynamic shape and operating characteristics of large scale wind turbine blade. J. Mech. Eng. 2015, 51, 138–145. [Google Scholar]
- Pinto, R.L.U.d.F.; Gonçalves, B.P.F. A revised theoretical analysis of aerodynamic optimization of horizontal-axis wind turbines based on BEM theory. Renew. Energy 2017, 105, 625–636. [Google Scholar] [CrossRef]
- Bavanish, B.; Thyagarajan, K. Optimization of power coefficient on a horizontal axis wind turbine using bem theory. Renew. Sustain. Energy Rev. 2013, 26, 169–182. [Google Scholar] [CrossRef]
- Laalej, S.; Bouatem, A.; AlMers, A.; El Maani, R. Wind turbine performances prediction using BEM approach with Jonkman-Buhl brake state model coupled to CFD method. Mater. Today Proc. 2022, 65, 3829–3838. [Google Scholar] [CrossRef]
- Esfahanian, V.; Salavati Pour, A.; Harsini, I.; Haghani, A.; Pasandeh, R.; Shahbazi, A.; Ahmadi, G. Numerical analysis of flow field around NREL Phase II wind turbine by a hybrid CFD/BEM method. J. Wind Eng. Ind. Aerodyn. 2013, 120, 29–36. [Google Scholar] [CrossRef]
- Avvad, M.; Vishwanath, K.C.; Kaladgi, A.R.; Muneer, R.; Kareemullah, M.; Navaneeth, I.M. Performance analysis of aerofoil blades at different pitch angles and wind speeds. Mater. Today Proc. 2021, 47, 6249–6256. [Google Scholar] [CrossRef]
- Huang, S.; Qiu, H.; Wang, Y. Aerodynamic performance of horizontal axis wind turbine with application of dolphin head-shape and lever movement of skeleton bionic airfoils. Energy Convers. Manag. 2022, 267, 115803. [Google Scholar] [CrossRef]
- Yen, S.-C.; Liu, W.-S.; San, K.-C.; Wang, W.-F. Design of wind-turbine blades for improving aerodynamic performance using hybrid blades. Ocean Eng. 2021, 227, 108889. [Google Scholar] [CrossRef]
- Alkhabbaz, A.; Yang, H.-S.; Weerakoon, A.H.S.; Lee, Y.-H. A novel linearization approach of chord and twist angle distribution for 10 kW horizontal axis wind turbine. Renew. Energy 2021, 178, 1398–1420. [Google Scholar] [CrossRef]
- Jia, L.; Hao, J.; Hall, J.; Nejadkhaki, H.K.; Wang, G.; Yan, Y.; Sun, M. A reinforcement learning based blade twist angle distribution searching method for optimizing wind turbine energy power. Energy 2021, 215, 119148. [Google Scholar] [CrossRef]
- Tahani, M.; Kavari, G.; Masdari, M.; Mirhosseini, M. Aerodynamic design of horizontal axis wind turbine with innovative local linearization of chord and twist distributions. Energy 2017, 131, 78–91. [Google Scholar] [CrossRef]
- Tahani, M.; Kavari, G.; Mirhosseini, M.; Ghiyasi, S. Different functionalized chord and twist distributions in aerodynamic design of HAWTs. Environ. Prog. Sustain. Energy 2019, 38, 13108. [Google Scholar] [CrossRef]
- Rahgozar, S.; Pourrajabian, A.; Kazmi, S.A.A.; Kazmi, S.M.R. Performance analysis of a small horizontal axis wind turbine under the use of linear/nonlinear distributions for the chord and twist angle. Energy Sustain. Dev. 2020, 58, 42–49. [Google Scholar] [CrossRef]
- Pourrajabian, A.; Dehghan, M.; Rahgozar, S. Genetic algorithms for the design and optimization of horizontal axis wind turbine (HAWT) blades: A continuous approach or a binary one? Sustain. Energy Technol. Assess. 2021, 44, 101022. [Google Scholar] [CrossRef]
- Sessarego, M.; Feng, J.; Ramos-García, N.; Horcas, S.G. Design optimization of a curved wind turbine blade using neural networks and an aero-elastic vortex method under turbulent inflow. Renew. Energy 2020, 146, 1524–1535. [Google Scholar] [CrossRef]
- Lanzafame, R.; Messina, M. Fluid dynamics wind turbine design: Critical analysis, optimization and application of BEM theory. Renew. Energy 2007, 32, 2291–2305. [Google Scholar] [CrossRef]
- Dai, J.C.; Hu, Y.P.; Liu, D.S.; Long, X. Aerodynamic loads calculation and analysis for large scale wind turbine based on combining BEM modified theory with dynamic stall model. Renew. Energy 2011, 36, 1095–1104. [Google Scholar] [CrossRef]
- Jonkman, J.; Butterfield, S.; Musial, W.; Scott, G. Definition of a 5-MW Reference Wind Turbine for Offshore System Development; National Renewable Energy Lab.(NREL): Golden, CO, USA, 2009.
- Moriarty, P.; Hansen, A. Aerodyn Theory Manual; NREL/TP-500-36881; National Renewable Energy Laboratory: Golden, CO, USA, 2005.
- Wang, L.; Quant, R.; Kolios, A. Fluid structure interaction modelling of horizontal-axis wind turbine blades based on CFD and FEA. J. Wind Eng. Ind. Aerodyn. 2016, 158, 11–25. [Google Scholar] [CrossRef]
- Ji, B.; Zhong, K.; Xiong, Q.; Qiu, P.; Zhang, X.; Wang, L. CFD simulations of aerodynamic characteristics for the three-blade NREL Phase VI wind turbine model. Energy 2022, 249, 123670. [Google Scholar] [CrossRef]
- Eltayesh, A.; Castellani, F.; Burlando, M.; Hanna, M.B.; Huzayyin, A.; El-Batsh, H.M.; Becchetti, M. Experimental and numerical investigation of the effect of blade number on the aerodynamic performance of a small-scale horizontal axis wind turbine. Alex. Eng. J. 2021, 60, 3931–3944. [Google Scholar] [CrossRef]
Disclaimer/Publisher’s Note: The statements, opinions and data contained in all publications are solely those of the individual author(s) and contributor(s) and not of MDPI and/or the editor(s). MDPI and/or the editor(s) disclaim responsibility for any injury to people or property resulting from any ideas, methods, instructions or products referred to in the content. |
© 2023 by the authors. Licensee MDPI, Basel, Switzerland. This article is an open access article distributed under the terms and conditions of the Creative Commons Attribution (CC BY) license (https://creativecommons.org/licenses/by/4.0/).