Article

A Portable Real-Time Test Bench for Dielectric Elastomer Actuators

1
Department of Computing and Engineering, Frankfurt University of Applied Sciences, Nibelungenplatz 1, 60318 Frankfurt, Germany
2
Department of Automation, Electronics and Computer Architecture and Networks, School of Engineering, University of Cadiz, Avda. de la Universidad 10, 11519 Puerto Real, Spain
*
Author to whom correspondence should be addressed.
Machines 2023, 11(3), 380; https://doi.org/10.3390/machines11030380
Submission received: 21 February 2023 / Revised: 10 March 2023 / Accepted: 11 March 2023 / Published: 13 March 2023
(This article belongs to the Section Bioengineering Technology)

Abstract

:
Recently, a significant amount of research has been devoted to soft robots. Artificial muscles belong to the most important components of soft robots. Dielectric elastomer actuators (DEAs) represent the technology that comes closest to the capabilities of a natural muscle, making them the best candidates for artificial muscles in robotics and prosthetics applications. To develop these applications, an analysis of DEAs in a test bench must be possible. It is important that the environmental conditions are known, and all components are specified, which is not the case in most publications. This paper focuses on the development of a real-time test bench for DEAs which provides environmental conditions and all components that are specified. Its goal is to open up the research field of dielectric elastomer actuators or soft robots. The stacked DEA used is powered by a high-voltage amplifier, which can be controlled via a real-time block diagram environment together with a data acquisition (DAQ) device. The response of the actuator is measured with a laser triangulation sensor. Furthermore, information about the applied voltage, the operating current, the temperature, and the humidity are collected. It was demonstrated that the selected laser sensor is a suitable device for this application. Moreover, it was shown that the selected high-voltage amplifier is adequate to power a DEA. However, the DAQ is not fast enough to measure the actuator current. It was demonstrated that housing keeps environmental conditions constant, is transportable, and offers the flexibility to investigate different DEAs.

1. Introduction

In recent years, a significant amount of research has been devoted to soft robots. These works are driven by the promise that soft robots can be used to create robotic systems which are cheaper, safer, and more flexible than traditional robots [1]. Soft robots can be defined as robots that are bio-inspired in both software and hardware and consist completely or partially of soft matter. They provide robot-typical functions through deformation [1,2,3]. Artificial muscles belong to the most important components of soft robots [4]. They are defined as a subclass of soft actuators [5] which can reversibly contract, expand or rotate in one component, due to an external stimulus [4,6]. According to [7], dielectric elastomer actuators (DEAs) represent the technology that comes closest to the capabilities of a natural muscle, making them the best candidates for artificial muscles in robotics and prosthetics applications.
The recent commercial availability of DEAs, especially stacked DEAs, opens up new possibilities for their use as artificial muscles in robotics [8]. To turn these possibilities into applications or to develop application-specific actuators, it is important to analyse the DEAs deformation due to a stimulus in a known environment and under different loading conditions. This requires appropriate test benches, which also provide environmental information such as temperature and humidity and whose components are precisely specified. Information about the environmental conditions can help to better interpret the results, as acrylic DEAs are not as stable in temperature and humidity as silicone-based DEAs [9,10,11]. For example, Michel et al. recommend the use of acrylic-based DEAs only in controlled environments, since the modulus of elasticity changes from 550 × 10 6   N m 2 to 0.05 × 10 6   N m 2 in a range from −50 °C to 75 °C [11]. Zuo et al. reported a 1599% increase in viscoelastic effects for an acrylic DEA when humidity was increased by 60% [10]. In addition, the interpretability and reproducibility of the results can also be improved by providing precise information on the components. A test bench mainly consists of driving electronics, measurement equipment, and communication hardware. Wilson et al. [12] connected their DEA to a DC-DC converter (EMCO F-121) to supply it with power, while a high-voltage amplifier (Trek 10/40 A) was selected by [13]. In [12,14,15] the authors used laser sensors, e.g., the Keyence LK-G152, mostly based on the principle of laser triangulation. Cao et al. and Rosset et al. [13,16] employed instead the self-sensing properties of DEAs. For reading the sensor values as well as controlling the driving electronics, hardware from dSpace (DS1104) [14] as well as from National Instruments (cRIO-9014, NI-9144, and NI-9264) [12] was embedded into a host PC. MATLAB/Simulink [13] or LabView [12] were utilized to process the data. It is worth mentioning that the publications described did not have their focus on the development of a test bench for a DEA system. Hence, not all test bench components were specified [13,14,17] and no environmental information was collected.
Therefore, the objective of this work is to develop a flexible test bench in which the system is encapsulated and information about the environmental conditions during the experiments can be deduced. Furthermore, the exact specifications of the test bench will be provided. It is intended to make the research field of dielectric elastomer actuators and soft robots more accessible. The rest of the paper is structured as follows. Section 2 briefly explains the basics of dielectric elastomer actuators before the methodology of this paper is presented in Section 3. Subsequently, Section 4 specifies the hardware and software used in this test bench before the measurement results are presented and compared with the theory. The paper finishes with a discussion and conclusion in Section 5 and Section 6.

2. Dielectric Elastomer Actuators

The DEAs are available in a wide variety of shapes [18]. The simplest configuration is an incompressible dielectric elastomer sandwiched between two compliant electrodes [19,20]. In Figure 1a,b, the resulting compliant capacitor is shown in a non-actuated and in an actuated state.
DEAs follow electrostatic principles. When an electric field is applied across the electrodes by a voltage, the charges move from one electrode to the other via an external conductor. As a result, the positive charges accumulate at one electrode and the negative charges at the other electrode, which leads to an electrostatic force of attraction between the two electrodes. This force is also known as the Coulomb force and compresses the dielectric elastomer (DE) membrane. The compression creates a stress inside the DE membrane which, due to its incompressibility, reacts with a length and width extension [19]. The expansion in length and width is supported by the repulsion of the same charges on both electrodes [21]. Both the thickness reduction and the expansion in length and width convert electrical energy into mechanical energy and can be used as an actuation mechanism [19,21]. One of the first methods to calculate the stress within the DE membrane and to predict the mechanical response of the DEA was developed by Pelrine et al. [22]. Consequently, the electrostatic pressure inside the DE membrane, which is also called Maxwell stress or Maxwell pressure, can be calculated with the following equation
σ e l = ε 0 × ε r × E 2 = ε 0 × ε r × ( ϕ z ) 2
with ε 0 and ε r as absolute and relative permittivity of the DE membrane, E as the electric field, ϕ the applied voltage, and z the thickness of the DE membrane in its non-actuated state [19,22]. Equation (1) is based on the assumption that the membrane is an ideal dielectric elastomer and that the charges are equally distributed on electrodes of infinite size. Furthermore, it is assumed that the membrane has a uniform thickness and that the dielectric behaviour of the elastomer is similar to a fluid and therefore does not change due to deformation [19]. It should also be mentioned that Equation (1) is only valid for strains up to 10%. For larger strains, the change in membrane thickness must be taken into account [22,23]. The membrane of a DEA is compressed by the electrostatic pressure until this pressure and the stress inside the elastomer are in equilibrium [23]. Thus, Equation (1) can be used together with a suitable material model to calculate the response of a DEA to a voltage and vice versa. Various material models can be used for calculating the stress within the membrane. On the one hand, the material can be considered a linear spring, with a specific spring constant [13]. On the other hand, Hooke’s law can be used to describe the material, with a modulus of elasticity [23]. However, if larger strains or dynamic situations are involved, a hyperelastic or rheological (viscoelastic) material model must be used [5,23]. If the response does not meet the application’s requirements in terms of stroke or actuating force, there are several ways to change the configuration of the DEAs that will increase their performance [21]. For instance, in a stacked DEA, the individual layers are connected mechanically in series and electrically in parallel as displayed in Figure 1c [24]. Thus, the stroke scales with the number of layers, and the actuation force scales with the size of the overlapping electrode area [21]. For other possibilities to change the configuration, refer to [21].
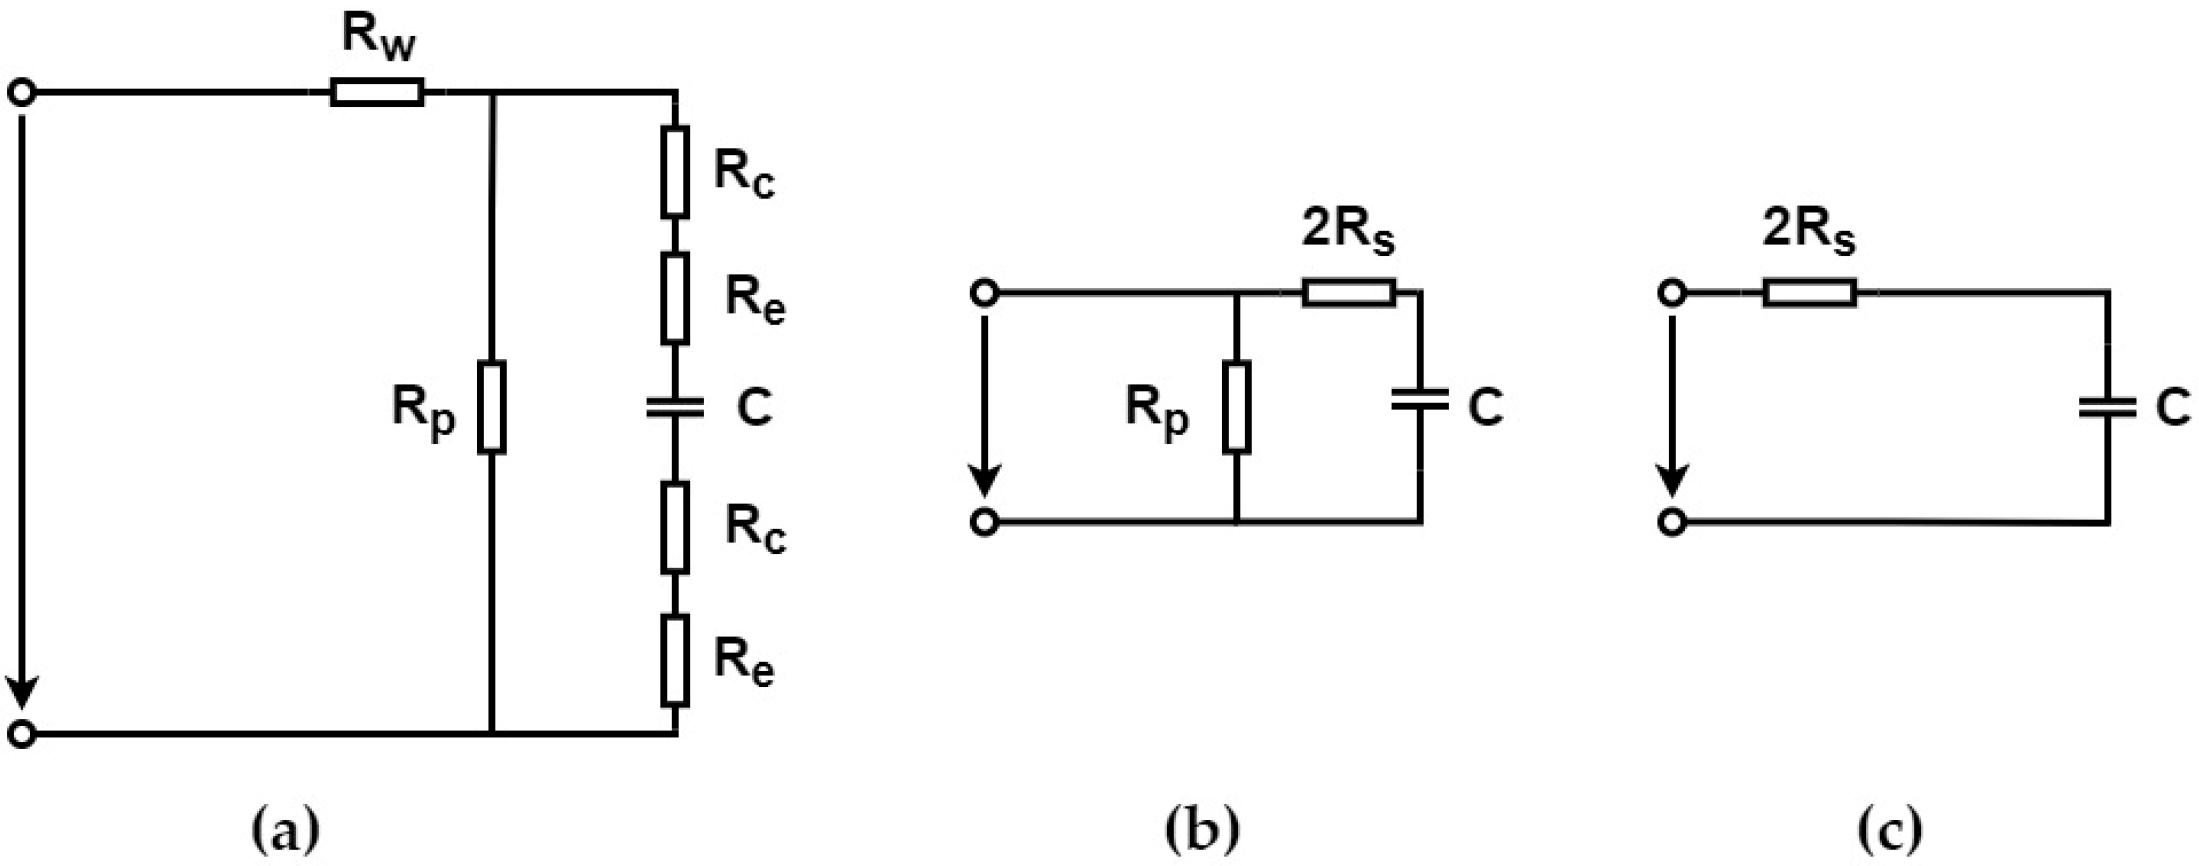
A current challenge in the context of DEAs is the high electric fields that are required for their operation. This results in typical supply voltages of 0–10 kV. However, since DEAs work electrostatically and not electrodynamically, only currents in the range of less than a few milliamperes are required for the supply voltages [20]. A DEA can also be operated with a current in the microampere range [8]. The current only needs to be greater than the dielectric leakage current through the membrane [8,25]. However, the higher the driving current the faster the DEA reacts [8]. In addition, the reaction time of the DEA depends on its time constant, since from an electrical point of view they can be represented by a combination of resistors and a capacitor. The electrical equivalent circuit is shown in Figure 2.
In Figure 2a, R w stands for the electrical resistance of the supply wire. R c is the resistance of the connection between the supply line and the electrode and R e represents the electrode resistance. Since the resistance of the supply line R w is usually very small, it can be neglected for simplification purposes, as can be seen in Figure 2b. Furthermore, R c and R e can be combined to R s and both R s to 2 R s . R p corresponds to the resistance of the elastomer. Since R p is very high, it can also be neglected in a final simplification step, as illustrated in Figure 2c [26]. Note that C is the capacity of a single layer. To extend the electrical equivalent circuit for a stacked DEA, refer to [26]. Keeping the temporal characteristics of an RC network in mind, DEAs can normally be operated in a frequency range between 10 Hz and 100 Hz [9,20].

3. Methods

To develop the test bench, both commercial and open-source tools were used. The open-source suite for electronic design automation (EDA) KiCad 6.0 was utilised to develop the printed circuit board (PCB). The design of the housing was created with the help of the commercial computer-aided design (CAD) suite Inventor 2022. MATLAB/Simulink R2020b and the STM32 CubeIDE 1.4.0 were used to write the software for the experiments. Together with QUARC 2021 SP1, MATLAB/Simulink enables the operation of the test bench in real-time. QUARC generates real-time code directly from Simulink and executes it in real-time on a windows target, bridging the gap between simulation time and the real world [27].
The set-up of the test bench was tested with a commercially available silicone-based stacked DEA (CT25.2-10-10 × 10 mm, CTSystems, Dübendorf, Switzerland. The actuator has a height of 10 mm and is equipped with rigid end plates at the top and bottom. These can be used to connect the actuator to its environment. Furthermore, they prevent an uneven deformation of the actuator’s surface. During the experiments, the stacked DEA was powered by a high-voltage amplifier (Trek 2220, Advanced Energy, Metzingen, Germany) with a gain of 200 v/v and a Slew Rate (10% to 90%) typically greater than 100 V/µs. This allows signals up to 7.5 kHz to be amplified [28]. With this amplifier, the DEA, which behaves such as a capacitor, cannot only be charged but also discharged. If a high-voltage DC-DC converter was used, a discharge resistor would have to be dimensioned. However, this would permanently consume the charging current if the complexity of the system were not increased by an extra circuit [29]. To control the output of the amplifier a data acquisition device (Q2-USB, Quanser, Markham, ON, Canada) was utilized, which was connected to the host PC via USB. This device is equipped with two 12-bit DAC, which have a voltage range of ±10 V [30]. With MATLAB/Simulink and the HIL Write Analog block, the high voltage can be adjusted in 0.586 V steps.
The response of the DEA to the high voltage was measured by a digital laser triangulation sensor (ILD 1220-10, Micro-Epsilon, Ortenburg, Germany) with linearity < 10 µm and repeatability of 1 µm [31]. Due to the measurement via diffuse reflection, it is well suited for measurement on non-reflective surfaces. In addition, by using such a sensor, the movement of the actuator is not restricted by an optical method [32]. The samples were taken with a frequency of 1 kHz and each sample consists of 3 bytes. If no valid measurement value can be obtained, the last valid measurement value is transmitted until a new valid measurement value is available [31]. The bytes were sent over the RS-422 interface of the sensor, which results in a transmission rate of 0.75 kB/s. A serial communication with 256 kBd was used to transfer the data to the host PC. For this purpose, an RS-422/485 to USB serial adapter (USB 2.0 Adapter to 1 × Serial RS-422/485, Delock, Berlin, Germany) was employed. In MATLAB/Simulink the bytes were received using a Stream Call and three Stream Read blocks. The Stream Call block was configured according to the sensor settings (baud rate: 256 kBd; word: 8, parity: none; stop: 1, flow: none; byte ordering: little endian). No changes were made to the default size of the stream call receive buffer size (8000 bytes). The output data type of the Stream Read blocks was set to unit8. During execution, the step size of the blocks was taken from the MATLAB/Simulink model which was set to 1 ms. With the setup pipeline, the deformation of the DEA can be measured with a latency of 20 ms. Before measurement, the warm-up time of 20 min defined by the manufacturer is adhered to in order to achieve a uniform temperature distribution in the sensor [31]. If an error occurs during the processing of the sensor data, the last valid measured value is passed onto the sensor itself.
In addition to the deformation of the actuator, the actual voltage applied and the current consumed were also measured during the experiments. For this purpose, the voltage, as well as the current monitor of the high-voltage amplifier, an ADC of the Q2-USB and MATLAB/Simulink with the HIL Read Analog block, were used. The voltage monitor has an accuracy better than 0.5% and the current monitor is 2% of the full scale [28]. With a scale factor of 0.4 V/mA [28] and the 12-bit ADC with an input range of ±10 V [30], the current was recorded with a resolution of 0.012 mA. Note that the current was limited to a maximum of 10 mA by a resistor. For the voltage monitor, which scales the output of the amplifier with 1/200th of the high-voltage [28], a resolution of 0.977 V results from the ADC. The maximum voltage that the actuator can withstand is 1200 V [9].
To determine the environmental conditions during the experiments, a combined temperature and humidity sensor was used (SHT30-DIS-B2.5kS, Sensorium, Stäfa, Switzerland). A combined sensor reduces the implementation effort. The sensor has a temperature accuracy of ±0.2 °C and a humidity accuracy of ±2%RH. Both measured values are resolved with 0.01 °C and 0.01% relative humidity (RH) respectively [33]. To read out the sensor, it was connected to a NUCLEO-F334R8 ARM Cortex-M4 microcontroller via I2C. After the readout, the values were visualized on an LCD display (EA DIP203-4, Electronic Assembly, Gilching, Germany). Additional information on the software framework behind the experiments is given in Section 4.3.

4. Results

First, the design of the PCB and housing are detailed in this chapter. Afterwards, the software and the measurements carried out are presented.

4.1. Printed Circuit Board

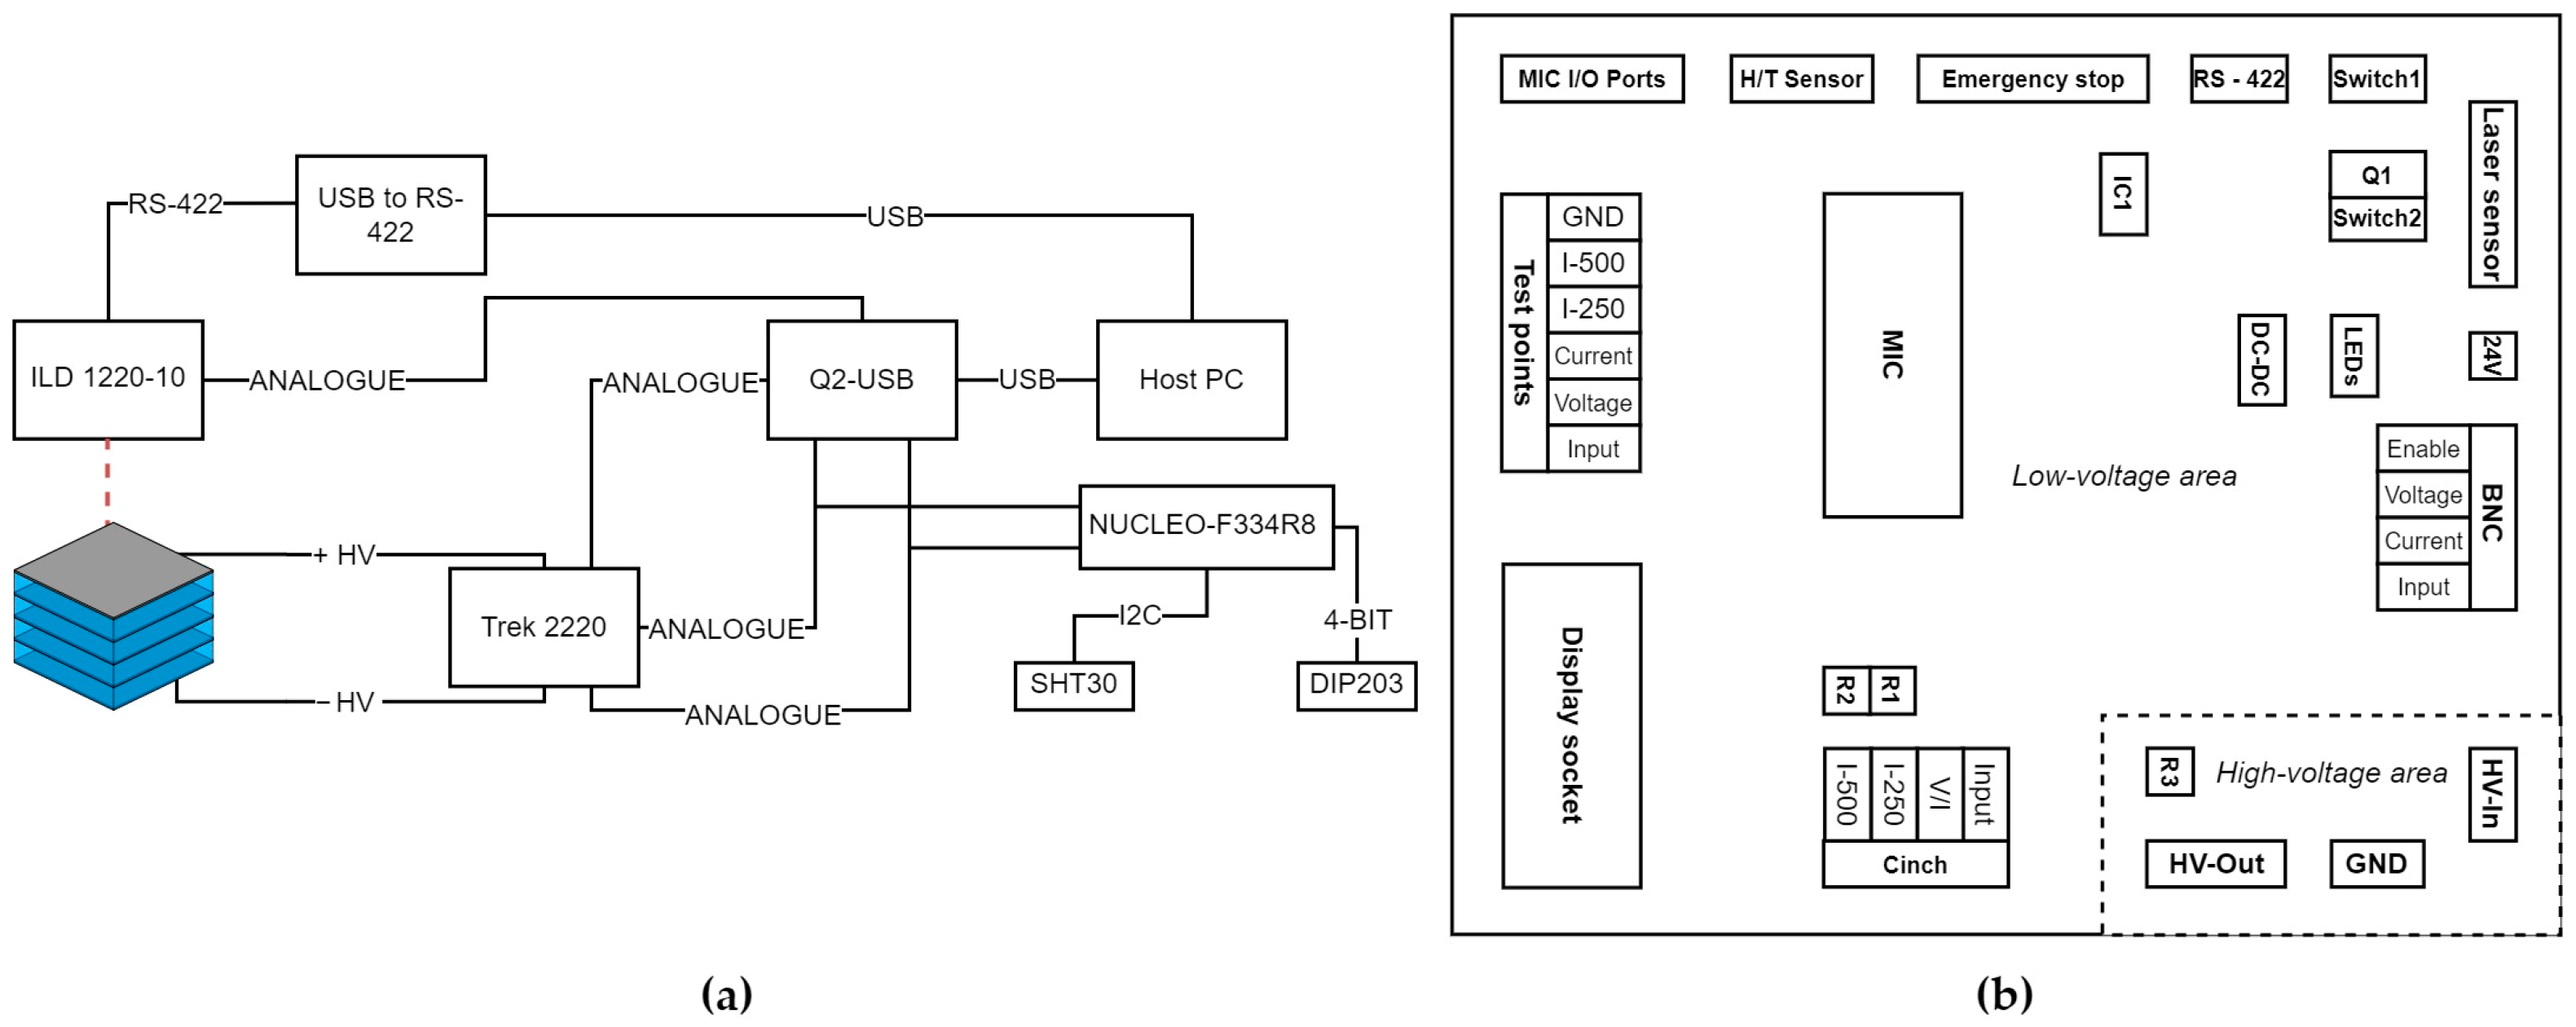
All the components described in the methodology section are arranged to each other as displayed in Figure 3a. A PCB was developed in order to allocate all the electronic components needed. Figure 3b shows the schematic layout of the PCB. The PCB is divided into a high-voltage area and a low-voltage, which are isolated from each other.

4.1.1. High-Voltage Area

A BNC connector is placed in the high-voltage area to connect the high-voltage amplifier (HV-In). The high-voltage is wired to an 1 × 2 3.5 mm pitch ultra-fit right-angle header to connect the DEA (HV-Out). A resistor series (R3) is placed between HV-In and HV-Out. It is used to limit the feeding current to 10 mA at 1200 V and it consists of six 20 kΩ resistors with a power dissipation of 2 W and a tolerance of 1%. The value 10 mA was chosen because this is the maximum current that the Trek 2220 can supply continuously. It is supplied with 24 V and 1.7 A [28]. In the end, a GND pin is mounted in the HV section, which can be used as a reference for a probe (with a suitable division) to measure the high voltage with a multimeter or oscilloscope.

4.1.2. Low-Voltage Area

The PCB is supplied with 24 V and 1.7 A via a 2.0 mm right-angled DC power jack. A toggle switch, which is connected to another 1 × 2 3.5 mm pitch ultra-fit right-angle header (Switch1), can be used to turn the 24 V on and off. With a DC-DC (LM2596S-5.0/NOPB, Texas Instruments, Dallas, TX, USA) converter, 24 V is converted to 5 V (max. 500 mA). Two LEDs indicates whether the 24 V and the output of the DC-DC converter are present.
To transmit the signal being amplified to the high-voltage amplifier, the DAC of the Q2 device can be connected via the right-angled RCA phono connector Cinch-Input. The signal is then passed to the right-angled BNC-Input connector, where it can be used for the amplifier.

4.1.3. Laser Sensor

The laser sensor is connected to the PCB with a 1 × 10 2.0 mm pitch HPI right-angled post header. All signals from the laser sensor are routed through it, including the 24 V, the RS-422 signal, the analogue current signal, and the signals Laser On/Off and Function Input. With the help of a 9-pin right-angled male D-Sub connector (RS-422), the RS422 signals can be passed on to the converter.
In addition to the RS-422 interface, the laser sensor can also be read out via an analogue current signal. If this interface is used, the signal can be passed on to the ADC of the Q2 device via the Cinch-I-250 or Cinch-I-500 connector. For this purpose, a measuring resistor is placed in front of each output, one with 250 Ω (R1) and one with 500 Ω (R2). Both resistors have a tolerance of 0.01%. The analogue current signal has a range of 4–20 mA representing a measuring range from 0–10 mm [31]. Thus, at R1 the signal is converted into a range of 1–5 V and at R2 into a range of 2–10 V. For R1 it results in a resolution of 12.21 µm and for R2 in a resolution of 6.105 µm.
Switch2 can be used to pull the Laser On/Off signal to GND so that the sensor’s laser is switched on [31]. The Function Input signal is connected to the NPN transistor Q1, which is controlled by one GPIO of the microcontroller. When the transistor switches, the Function Input signal is pulled to GND for a certain time and thus the measurement value of the laser sensor is set to zero [31]. More information about zeroing can be found in Section 4.3.4.

4.1.4. Voltage and Current Monitors

The voltage and current monitors are connected by the two right-angled BNC-Voltage and BNC-Current connectors. Afterwards, the signals are routed to the two female 2 × 19 pin headers (MIC) and to the right-angled RCA phono connector Cinch-V/I. Together with a jumper, the Cinch-V/I connector transmits either the voltage or the current monitor to the ADC of the Q2 device. Using the MIC headers, the signals are transmitted to the microcontroller, together with the 5 V and the low-voltage GND. The microcontroller has two 12-bit ADCs with an input range of 0–3.3 V [34]. Both the signal from the current monitor and the signal from the voltage monitor are provided using voltage dividers. The divider of the current monitor (100 Ω and 470 Ω) brings the signal into a range of 0–3.298 V and the divider of the voltage monitor (953 Ω and 470 Ω) yields a range of 0–1.982 V. Thus, at the microcontroller, the current monitor has a resolution of 0.002 mA and the voltage monitor has a resolution of 0.488 V. After the voltage and current monitors have been digitised, the values are shown on the display, which is connected via two female 1 × 10 pin headers (Display socket). Via this connector, the LCD display is supplied with 3.3 V, GND, and it is a 4-bit data bus [35] for communication with the microcontroller.

4.1.5. Testing and Safety

To be able to check various signals during operation, a six-terminal block with a 5.0 mm pitch is installed (Test points). In addition to the signals at the RCA phono connectors, the GND of the low-voltage area can also be accessed there. To extend the functionality of the test bench, an SPI, a CAN, a USART, 3.3 V, 5 V, and the microcontroller GND are routed to the outside via a 2 × 10 2.54 mm pitch male right-angled box header (MIC I/O ports). They could be used to integrate a controller or additional sensors into the system. Using another 5.0 mm pitch terminal block an emergency stop is connected (Emergency stop). Its signal is inverted (Onsemi MC74HC1G14DBVT1G) for the digital enable of the Trek 2220 (IC1). The inverted signal is then routed to the right-angled BNC-Enable connector. When the emergency stop switch is pressed, the high voltage is switched off.

4.2. Housing

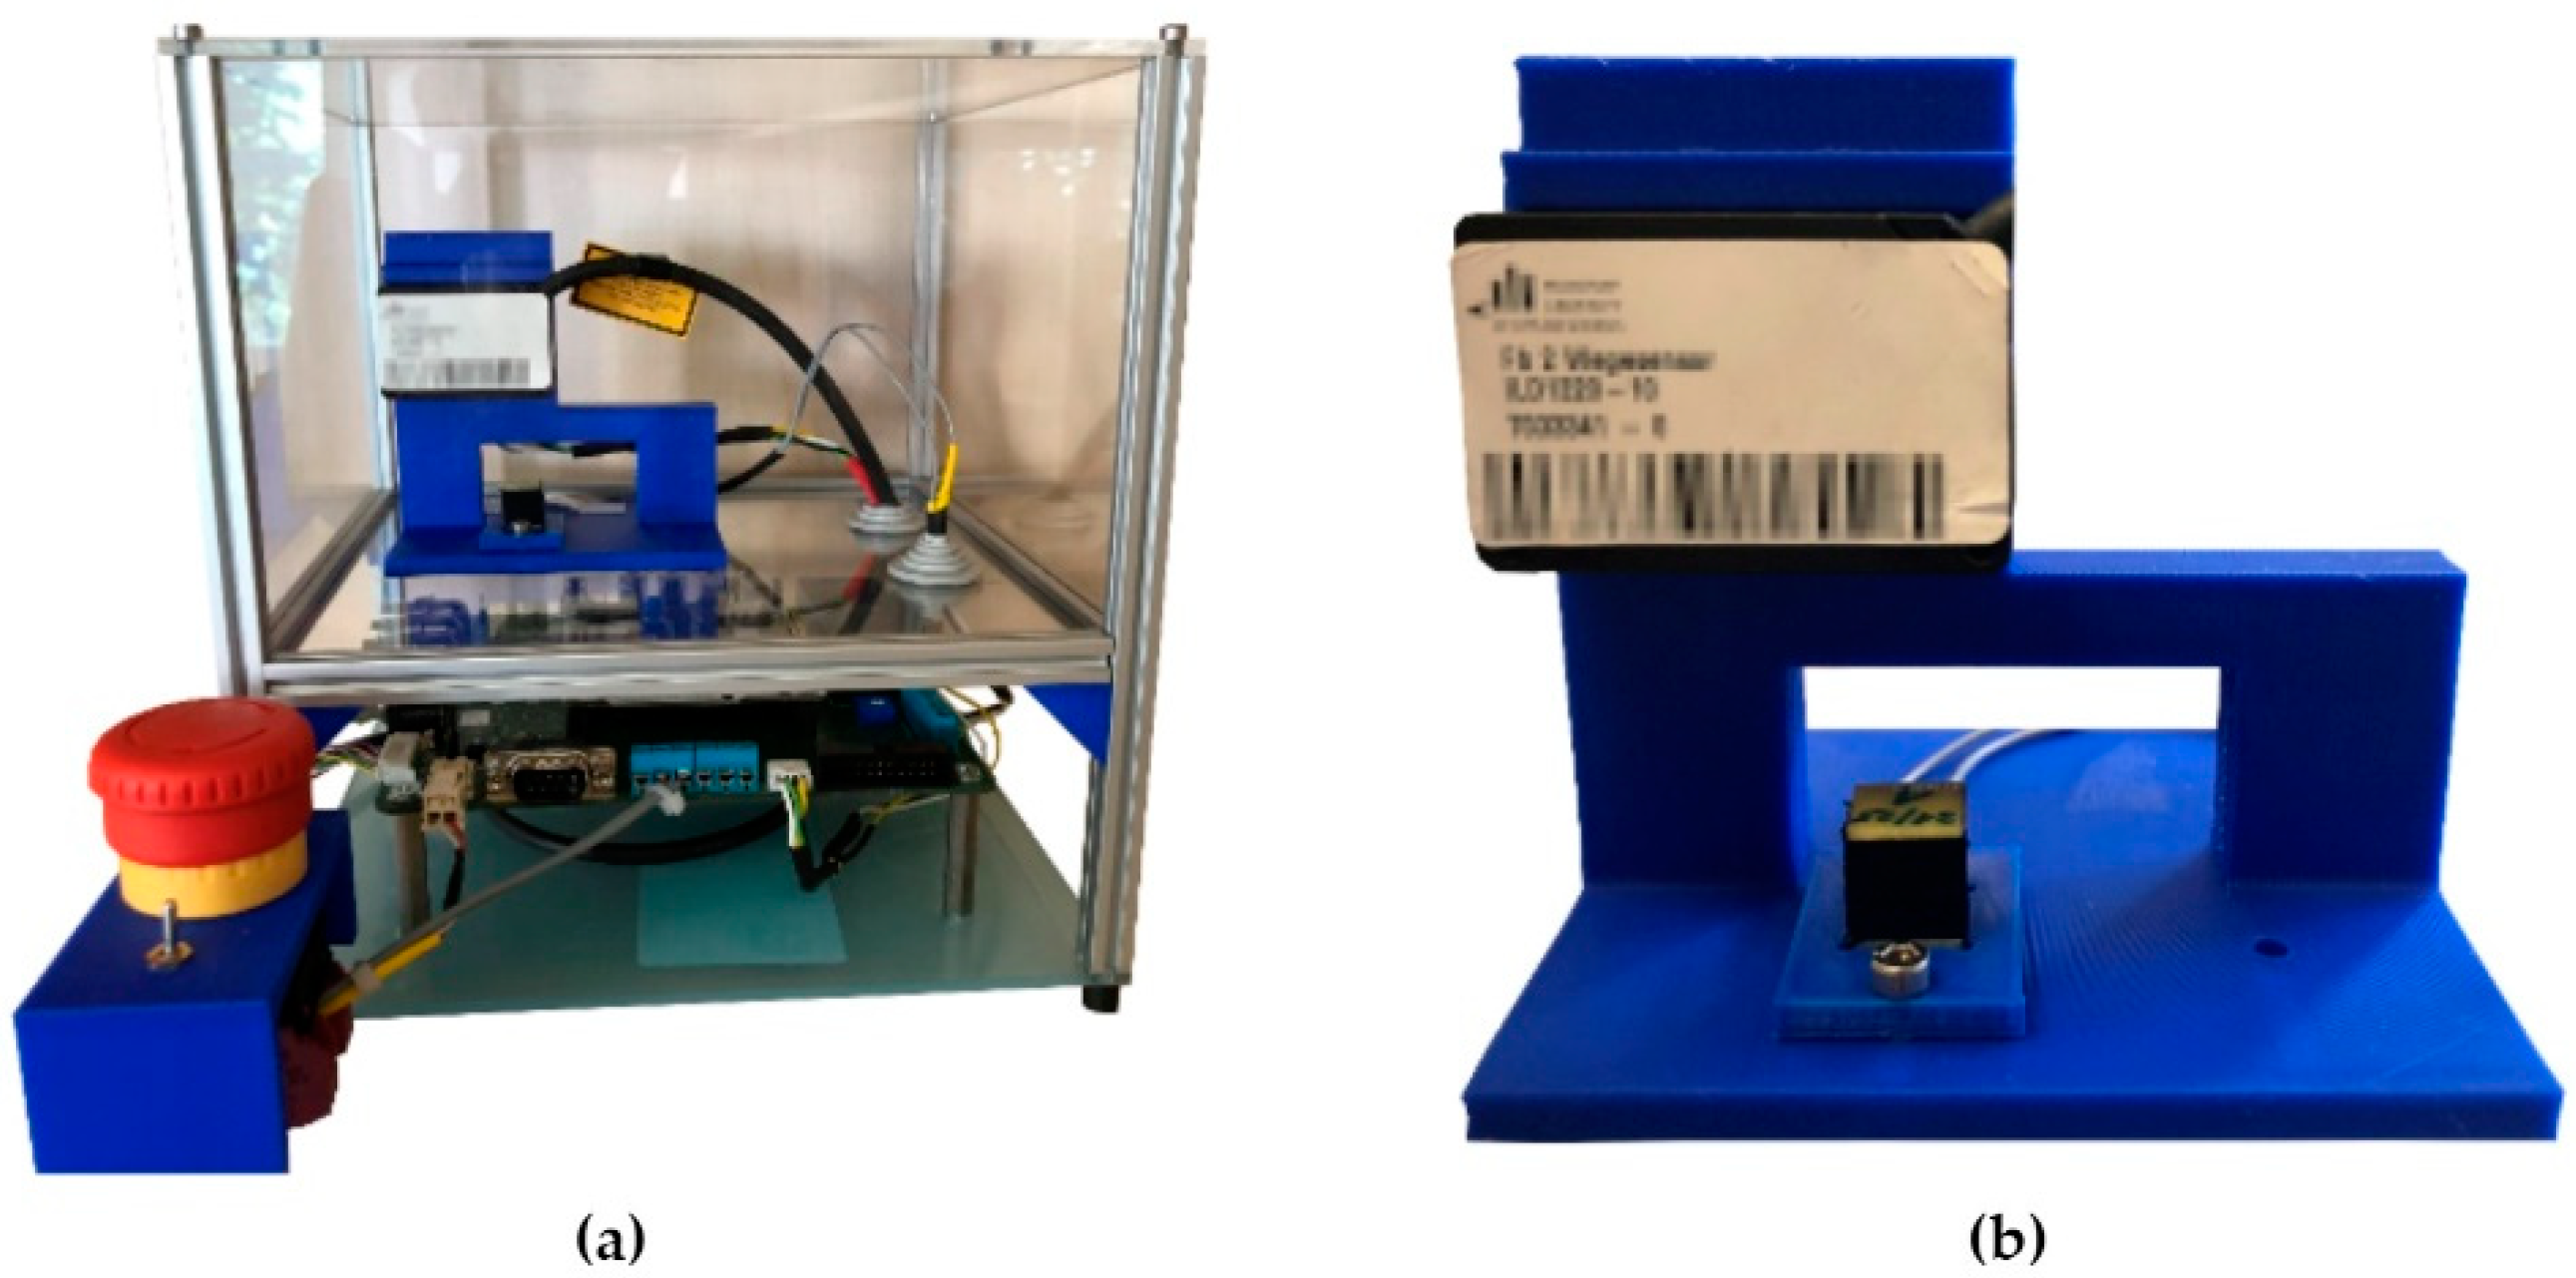
The frame of the housing is built from 10 mm by 10 mm MakerBeam aluminium profiles, which are connected by 3D printed PLA angles, completed by 3 mm thick acrylic sheets. In the lower part of the housing, which is not completely closed, the PCB is fixed. Four M3 threaded buffers are used to decouple the housing from the table so that mechanical vibrations do not influence the measurement of the laser sensor [31]. The DEA, the laser sensor as well as the temperature and humidity sensor are placed in the upper enclosed part of the housing. They were all attached to a continuous 3D printed mounting so that the sensor and actuator could not be moved relatively. On the easily accessible side of the housing, the emergency stop switch and the PCB switch are installed with a 3D-printed PLA mounting. The emergency stop is insulation-proof up to 600 V and can switch 8 A at 24 V [36]. Without the components, the housing has a weight of approx. 0.977 kg. The outer dimensions are 215 mm by 290 mm by 214 mm (length, width, height).

4.3. Software Implementation

In order to perform experiments using the test bench, a software framework has been developed. It includes both the host PC for real-time measurement of the actuator response and the microcontroller for displaying the measured values on the LCD and setting the laser sensor to zero for a relative distance measurement.

4.3.1. MATLAB/Simulink

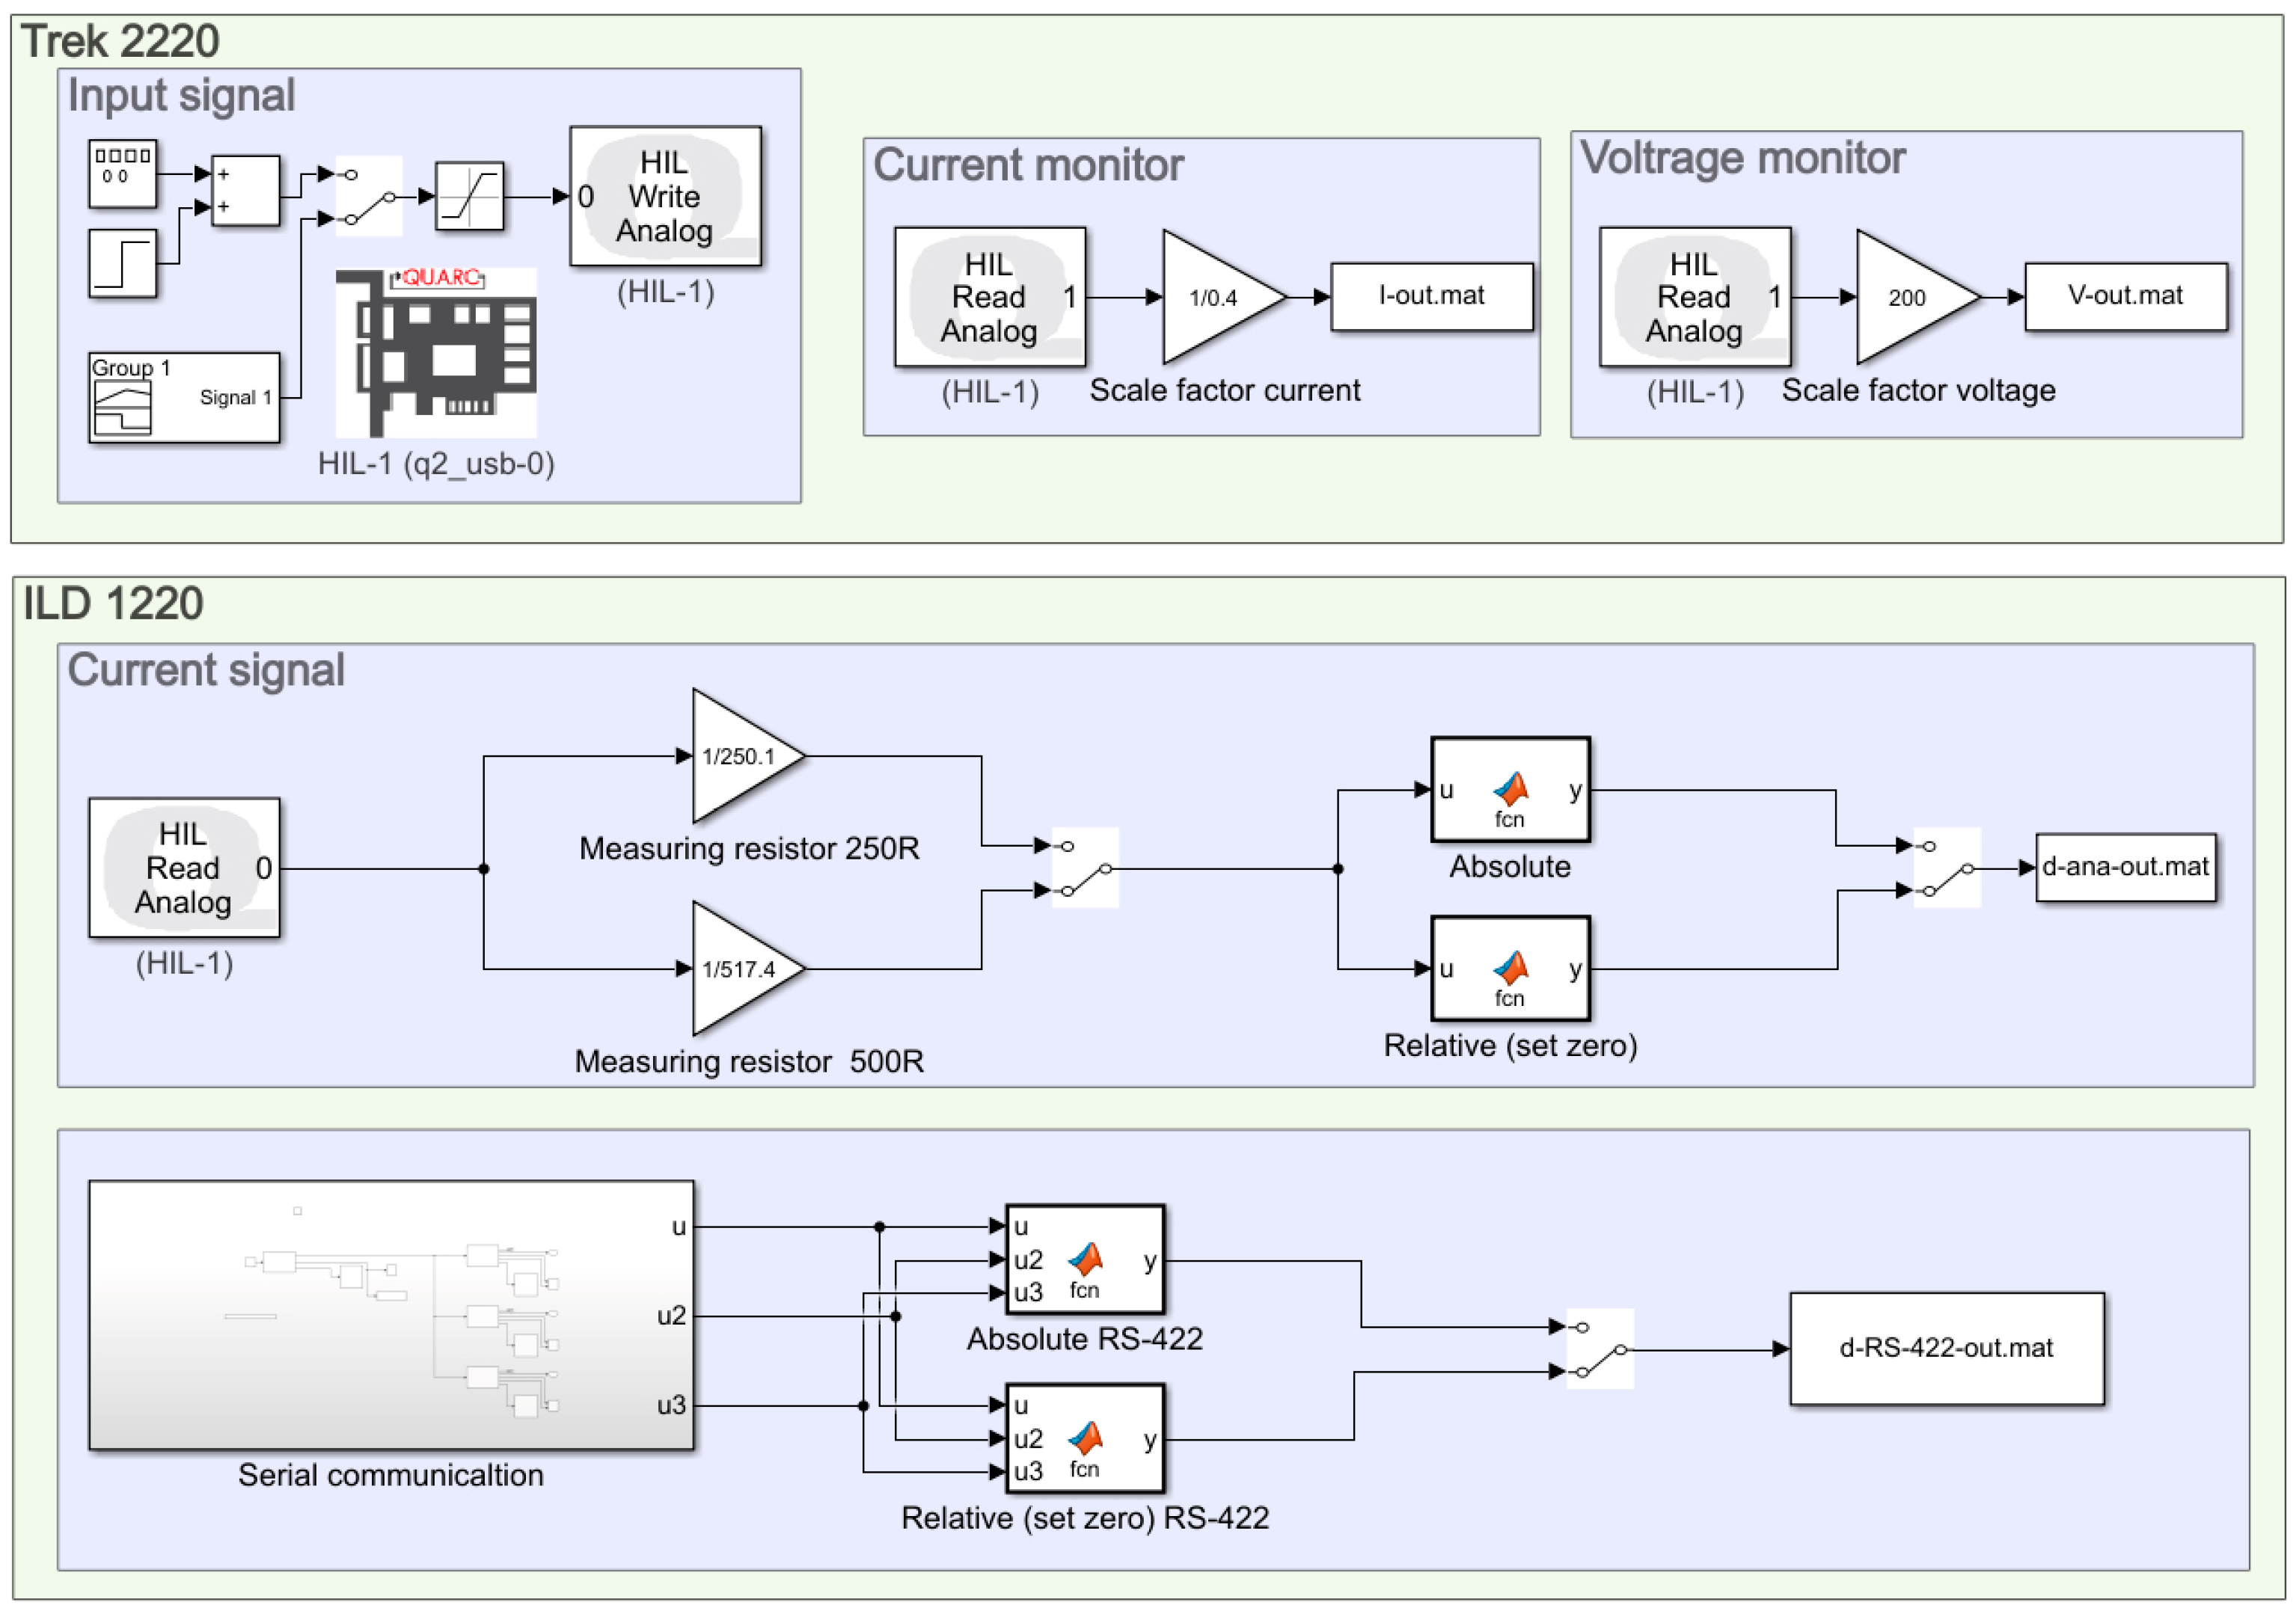
Figure 4 shows the block diagram used to operate the test bench. The model receives its input through different signal generator blocks (sine, rectangular, and step signal) in the up-right corner. A saturation function ensures that the input signal does not exceed 6 V (equivalent to 1200 V high voltage) and damages the actuator. The signal is then passed on to the high-voltage amplifier via the Q2-DAC. Via the first ADC of the Q2, the Simulink model can receive either the current or the voltage monitor. Both signals are converted by a gain with their scale factor before they are exported to a file.
The second ADC of the Q2 is used to collect the current signal. A moving average filter can be used to reduce noise in the signal. To convert the signal back into a current value, it is divided by the value of the respective measuring resistor. The resulting current signal can then be used to calculate the absolute distance or the relative distance using the equations provided by the manufacturer [31]. The absolute distance describes the distance from the start of the measurement range to the measurement object, whereas the relative distance describes the distance from a zeroed point within the measurement range to the measurement object. Both distances are then exported to a file.
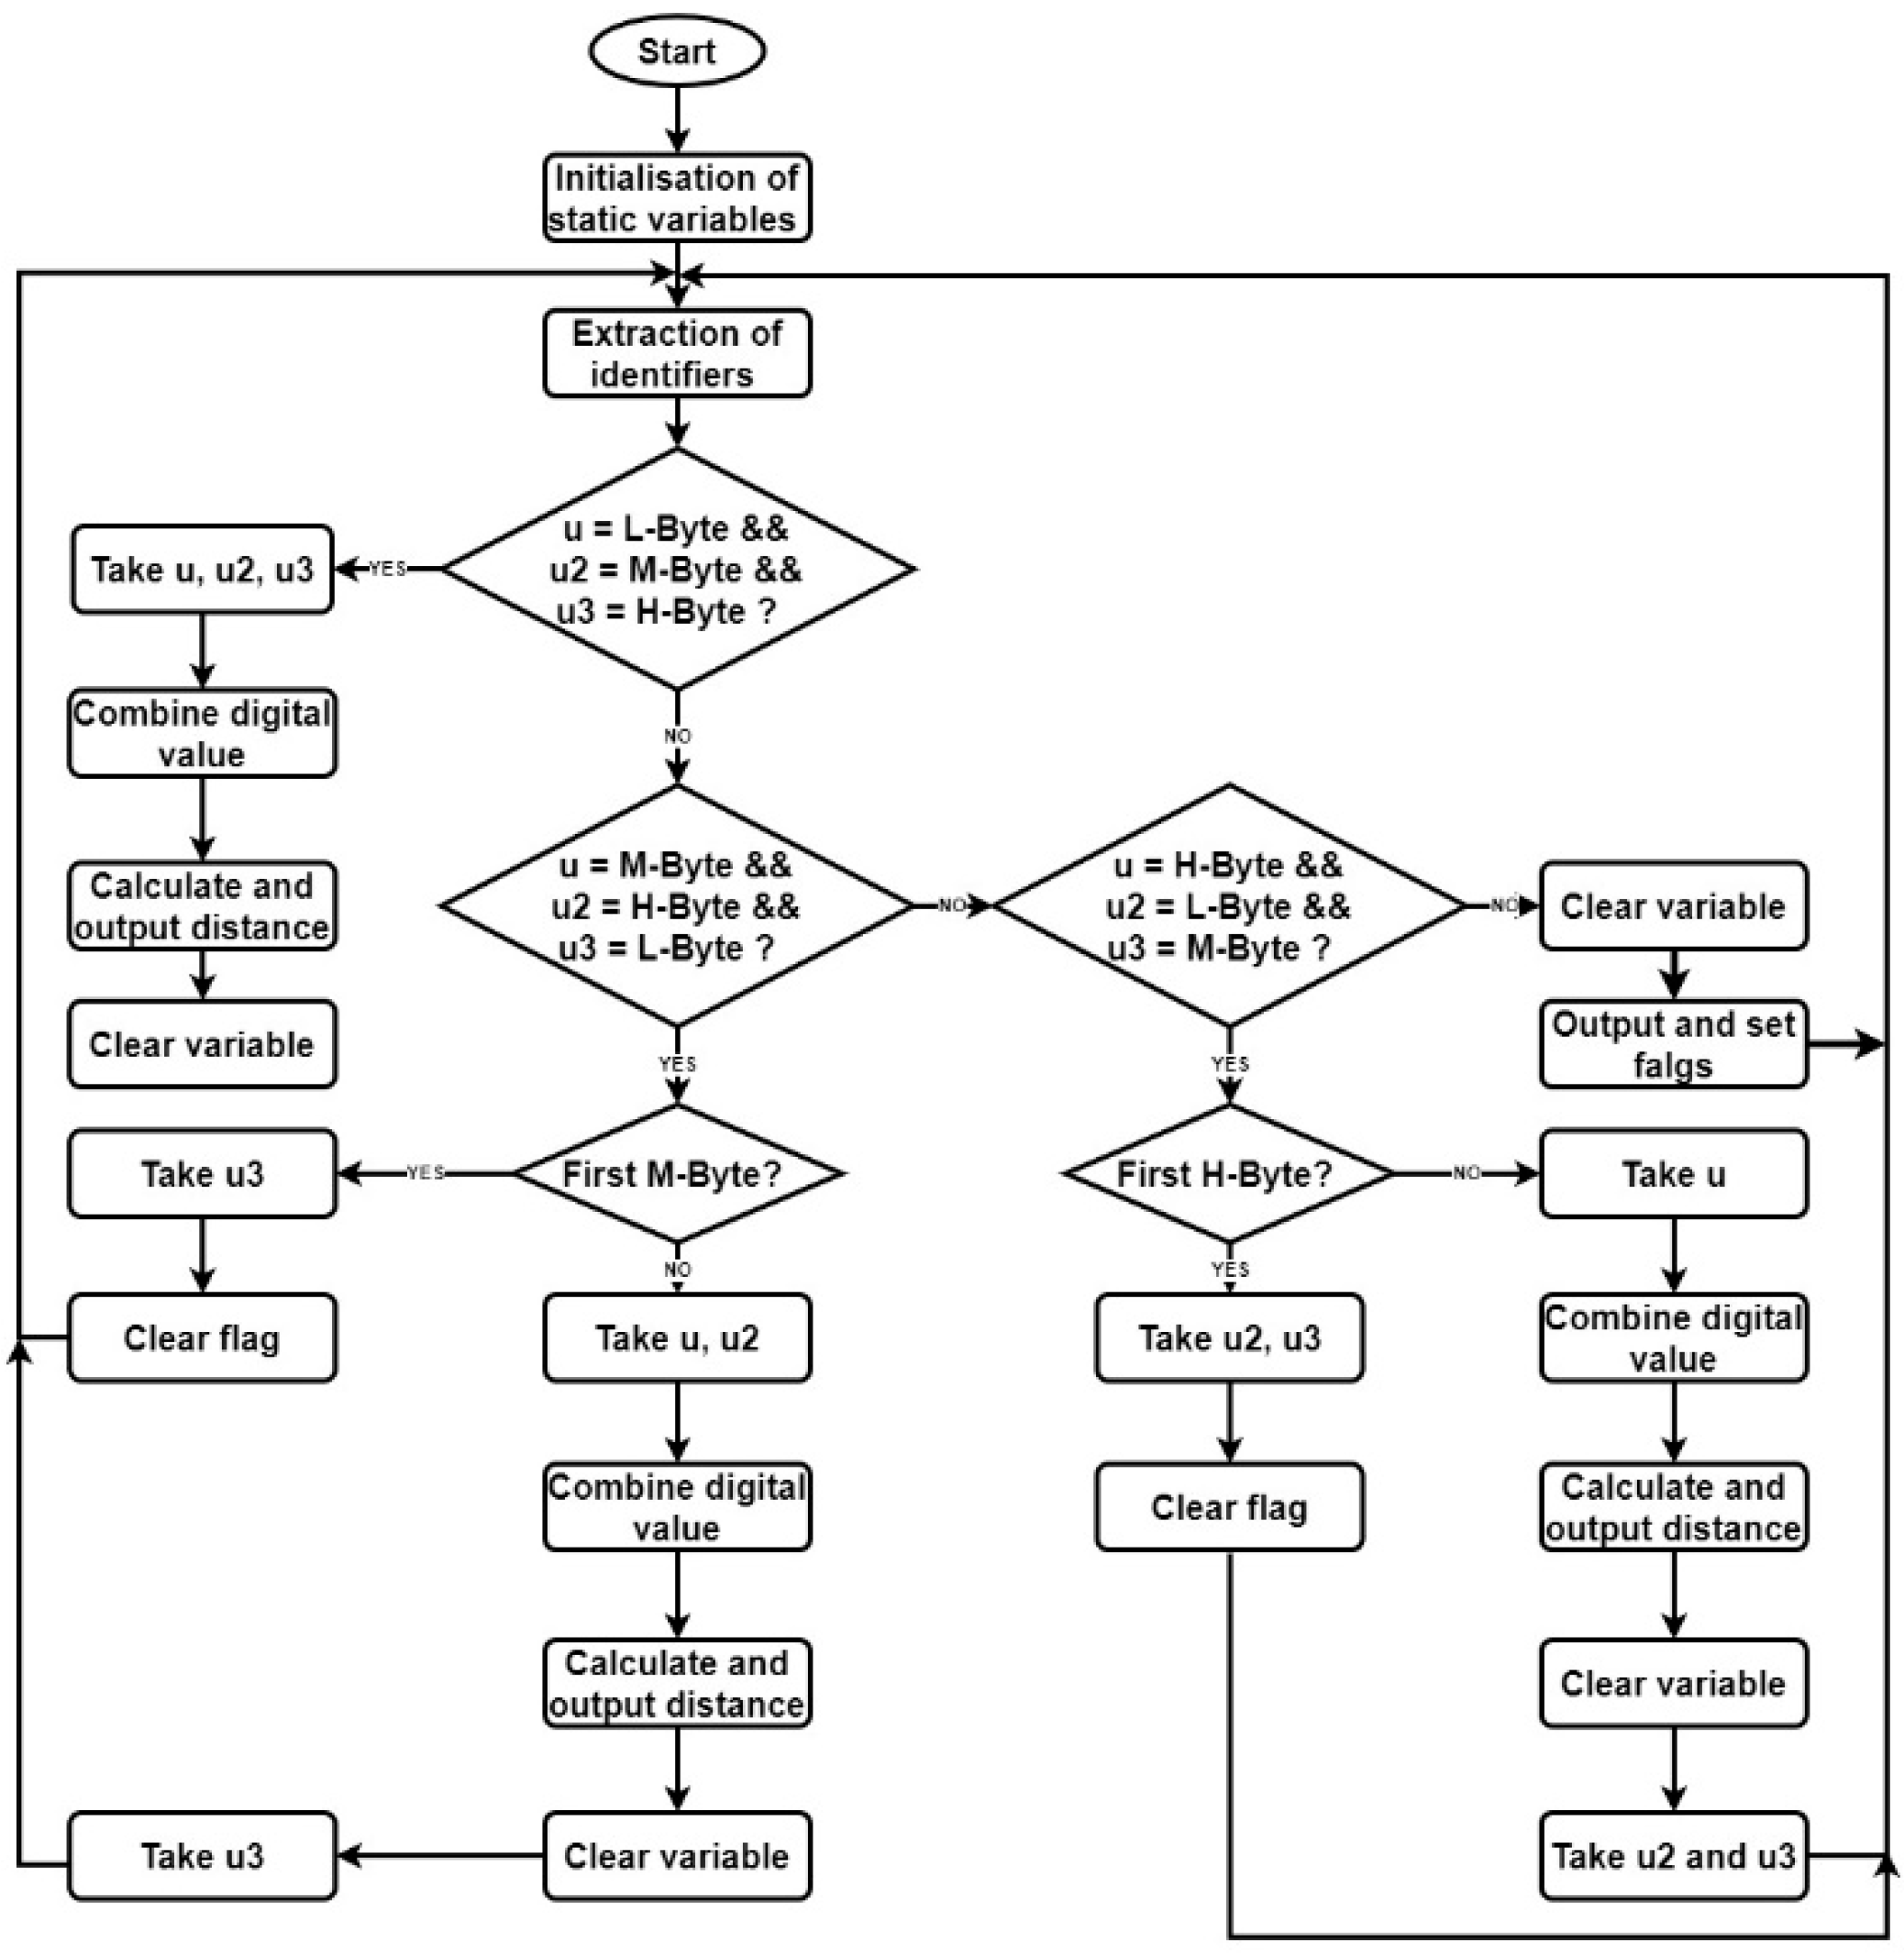
The RS-422 interface can be read via the Serial communication subsystem [37]. An absolute measured value is encoded by the ILD 1220-10 with 16-bits and a relative measured value with 18 bits distributed over 3 bytes [31]. In any case, the bytes are always sent in the order: Low-Byte (L-Byte), Medium-Byte (M-Byte), and High-Byte (H Byte). Since the Stream Read block cannot receive 24-bit data, three uint8 Stream Read blocks are connected in parallel. Thus, three bytes are read from the serial interface each time step (0.001 s). Even if the bytes are sent in a fixed order, the start time of the model determines whether the first byte to arrive is an L-, M-, or H-Byte. The processing of the resulting four scenarios for an absolute measurement is shown schematically in Figure 5.
If the first byte received is an L-byte, the digital value can be combined from the three bytes received in this time step and the distance can be calculated using the equations provided by the manufacturer [31]. However, if an M or H byte is received first, the digital value must be combined from two-time steps. If there is a change between the scenarios during the runtime due to a transmission error, the last measured value is returned.

4.3.2. NUCLEO-F334R8

Via the STM32 CubeIDE, the microcontroller is configured as follows: Maximum clock frequency 72 MHz (external quartz), user button external interrupt priority 5, ADC-1 channel one and channel two voltage and current monitor, I2C1 for temperature/humidity sensor and various GIPO pins as output. FreeRTOS, an embedded real-time operating system, is used to divide the individual responsibilities of the microcontroller into three tasks. The tick rate of the RTOS is set to 1 kHz.

4.3.3. Temperature and Humidity Measurement

After receiving the data via the I2C interface, a cyclic redundancy check (CRC) is carried out. If the calculated CRC sum matches the received CRC sum, the temperature, and relative humidity are calculated using the equations provided by the manufacturer [33].

4.3.4. Zeroing of the Laser Sensor

The zeroing is controlled by the microcontrollers user button. When the button is pressed, the GPIO pins PC2 and PA5 are set high for two seconds. This causes the user LED (LD2) to light up as optical feedback and the “function input” signal is pulled to GND via Q1. This sets the output value of the laser sensor to half of the analogue output value or to zero for the digital value [31]. If the button is pressed again, PC2 and PA5 are set high for 8 s. This causes the laser sensor to reset back from zero.

4.4. Measurements

In Figure 6, the experimental setup is shown. The stacked DEA is mounted below the laser sensor and is unloaded.
After 1 s a rectangular voltage signal is applied to the actuator. It has a duration of 2 s and jumps from 0 V to 1000 V and back again. Figure 7a shows the reaction of the actuator. To read out the sensor the RS-422 interface and the current signal were used. A break of 10 min was taken between each of the three measurements to allow the actuator to relax. The absolute distance is plotted on the Y-axis. Before the measurement, the two measuring resistors were checked with a multimeter. The factor 1 250.1   Ω respectively 1 518.4   Ω was used for the conversion to the respective current values.
In Figure 7a, a difference between the three signals can be observed in relation to the distance value. The RS-422 signal has an initial static value (measured at 0.5 s) of 4.679 mm, the 500R signal of 4.676 mm, and the 250R signal of 4.663 mm. Over the complete measurement, fluctuations can be observed in the signals: RS-422 4.7 µm, 500R 11.8 µm, and 250R 24.4 µm. To determine the accuracy of the set-up, the distance to two different gauge blocks (Holex, steel, tolerance ± 0.3 µm) was measured 25 times each via the RS-422 interface, as this interface shows the smallest fluctuation. Afterwards, the distance was averaged over the 25 measurements. Since the first gauge block has a height of 20 mm and the second a height of 23 mm, the actual difference between the two measurements was known. From the measurement, a difference of 3.0194 mm was obtained. Thus, all distance values shown are to be considered with an accuracy of 19.4 µm. Furthermore, a latency of 5 ms for the two analogue signals was observed.
Figure 7b displays the norm of the actuator’s contraction at different voltages in comparison to a theoretical model. During the measurements the actuator was unloaded and placed under the laser sensor as in Figure 6b. For each voltage, three rectangular functions were applied to the actuator. The first function was applied after 10 s and had a length of 30 s. After a break of 30 s, the second function was applied. Another 30 s pause was followed by the third function with a duration of 200 s. This procedure is intended to eliminate the long-term viscoelastic effects so that the loading history does not have a major influence on the measurement. A break of 2 h was taken between measurements and the laser sensor was set to zero before each measurement. For the geometric linear model, Hooke’s law and Equation (1) were used, leading to the equation below [23]
z = n × z × ε 0 × ε r E × ( ϕ z ) 2
with n = 399, z = z 0 = 0.25 µm, ε 0 = 8.8541878128 × 10 12 As Vm , ε r   = 2.8 and E = 1.4 MPa [9]. The model is based on the assumptions that the actuator is unloaded, there is a uniaxial loading condition, the actuator can move freely, it is an ideal elastomer and the elastomer is incompressible. Qualitatively, the model and the measured values show the same trend. However, the model and the measured values diverge with increasing voltage. At 1200 V the model has a value of 0.386 mm and the measured value is 0.29 mm, which corresponds to a deviation of approx. 25%.
In Figure 8a, the step response of the Trek 2220 is shown. The high voltage should jump to 1000 V at time 1 s, which corresponds to a value of 5 V at the input of the high voltage amplifier. In the signal of the voltage monitor, a latency of 0.001 s and an overshoot of 9 V can be seen. At 1.019 s, the voltage monitor reaches its final value of 1001 V.
Figure 8b shows the current flowing at the high-voltage output with different loads. At the time 0.5 s, a jump to 500 V is executed. All three signals have a latency of 0.001 s. When the high-voltage output is short-circuited, a maximum of 4.163 mA flows through the resistor chain R3. If the DEA is connected, a maximum value of 3.822 mA can still be read from the current monitor. If a capacitor with a capacity approx. 10 times greater is connected, a maximum current of 3.883 mA can be measured.
Figure 9 shows the development of the temperature and humidity inside the enclosed part of the housing over the period of one hour. The measured values were read from the LCD display every 5 min. While doing so, the test bench was fully supplied with voltage and the actuator was activated every 5 min. During the measurement, the temperature increased by 0.2 °C and the humidity decreased by 0.18%.

5. Discussion

The most noticeable aspect of Figure 7a is the difference between the three signals RS-422, 250R, and 500R. To verify the measured values, the laser sensor was also read out with software (sensorTOOL 1.6.0) provided by the manufacturer Micro-Epsilon. A static initial value of 4.679 mm was measured. This value matches the RS-422 signal in Simulink, which confirms the functionality of the developed software. Moreover, the RS-422 signal has the lowest fluctuation with 4.7 µm. This is due to the fact, that it is the signal with the highest resolution, namely a 16-bit corresponding to a step size of 0.15 µm [31]. However, the fluctuation is outside the expected range of two times the resolution (0.3 µm) but inside the error band. The resolution is also the reason for the deviation of the 500R and the 250R from the RS-422 signal and the fluctuation of the analogue signals. With its deviation of 2 µm, the 500R signal is within the expected range of ±6.164 µm (recalculated for 518.4 Ω). The 500R fluctuation of 11.8 µm is also within a range of two times the resolution (12.328 µm). In contrast, the 250R signal with its deviation of 16 µm is 3.79 µm outside its resolution of ±12.21 µm but still inside the error band. The 250R fluctuation, on the other hand, is 24.4 µm inside the expected range of two times the resolution (24.42 µm). Exceeding the range of fluctuation of the RS-422 and the deviation of the 250R signal is related to the surface characteristics of the actuator [31]. The higher latency of the digital interface of 20 ms is caused by the RS-422/485 to USB serial adapter. This hypothesis is supported by the fact that the analogue interfaces have a lower latency, which rules out the laser sensor as the cause. Furthermore, lowering the sampling rate of the laser sensor (to 250 Hz) did not reduce the latency, which rules out the speed of the RS-422 interface and the processing of the data in Simulink as the source of the delay.
The deviation between the model and the measured value shown in Figure 7b is due to the assumptions and structure. The model does not consider the passive region in each layer, which isolates the layer from the outside and restricts its movement. Furthermore, the model does not take into account the lateral fixation of the outer layers by the end plates of the actuator, which further affects the contraction [38]. Additionally, Equation (2) is a static model. That means that the time-dependent effects, such as creep, which can be seen in Figure 7a, are not considered. The model only predicts the static state. However, it is not easy to verify this value with measurement data, as it would theoretically require infinitely long measurements to be sure that all viscoelastic processes have been completed [39]. The deviations indicate the importance of including viscoelasticity and mechanical constraints such as a passive region or lateral fixation in the modelling.
The measurements shown in Figure 7 can be compared with previous works as follows: Li et al. [17] measured a similar creep of their actuator in response to an applied voltage as in Figure 7a. They also demonstrated how long-term viscoelastic effects can alter the response of a DEA. It should be mentioned that their experiments involved an acrylic-based actuator, which usually has stronger viscoelastic effects [19]. Lotz et al. [40] investigated a similar performance of the model in Figure 7b. These consistencies and the fact that laser triangulation sensors were also used in [12,14,15] prove, that the selected sensor is well suited to measure the deformation of the stacked DEA used here.
The Trek 2220 is equipped with a dynamics adjustment potentiometer that can be used to improve the step response with capacitive loads [28]. This eliminates the overshoot of 9 V but shortens the response time of the amplifier. By factory setting, a slew rate from 10% to 90% greater than 100 V/µs is specified. Through graphic evaluation, a time of 0.8 µs was determined for a rise from 100 V to 900 V. Thus, the performance corresponds to the manufacturer’s specifications. For the high-voltage output, an offset of max 1 V and for the voltage monitor an offset of max 10 mV, as well as an accuracy of better than 0.5% of full scale (corresponds to better than 10 V), is stated [28]. Thus, the final value of 1001 V is also within the specifications and the error band.
Theoretically, a current of 4.167 mA should flow via R3. The current monitor is listed with a maximum offset of 0.025 mA and an accuracy of better than 2% of the full scale (corresponds to better than 0.4 mA) [28]. Thus, the deviation of 0.04 mA is within the expected range. If the DEA is connected, the measured value drops by 0.342 mA. However, almost the same current should flow. Behboodi and Lee [8] reported an electrode resistance of a stacked DEA from CTSystems with an active area of 15 mm by 15 mm of 50 kΩ. If this value is taken as a basis, the DEA used in this work has a total electrode resistance of approx. 132 Ω. However, this increase in resistance would only justify a reduction in the current of approx. 0.004 mA. If the DEA is replaced by a capacitor and the capacity is increased from 34 nF to 334 nF, a drop in current of only 0.28 mA can be observed. Increasing the capacity also increases the time constant of the load, which indicates the shortness of the DEA current peak as the reason for the deviation.
This suggests that the DAQ card is not fast enough to record the peak value. Nevertheless, the use of a high-voltage amplifier with built-in voltage and current monitor is supported by [41]. Compared to [13], the Trek 2220 is a lot more affordable and weighs only 8% (2 kg instead of 24.9 kg). Furthermore, the low overshoot shows that the Trek 2220 is well suited for driving the stacked DEA.
It was found that the temperature inside the enclosed housing is more stable over a period of one hour and the measurements are inside the error band. However, as soon as an acrylic-based DEA is investigated, a temperature and humidity control system should be added to the test bench. With its weight of approx. 0.977 kg and the dimensions of 0.215 m by 0.290 m by 0.214 m, the test bench is easy to transport. In addition, the 3D-printed sensor and actuator mount showed a high flexibility to quickly adapt the test bench to other objects, e.g., gauge blocks or custom-made actuators. This offers the possibility to test different and new configurations of stacked DEAs, which nowadays can be manufactured in a very flexible way by using 3D printing [42].

6. Conclusions

In this paper, a design of a portable real-time test bench for a DEA was considered. Experiments have shown that the RS-422 interface of the ILD 1220-10 is best suited to measure the DEAs response. It was found that the simplicity of the linear Hookean model caused a 25% deviation between the prediction and the measured values and that the measurement of the static response is challenging. It has been shown how important it is to consider viscoelasticity and mechanical constraints, such as a passive area and lateral fixation, e.g., in the modelling. Since a model with a deviation of more than 20% is not well suited, e.g., to design a controller based on the model. The Trek 2220 operates within its specifications and has proven adequate to power the DEA. To capture the current peaks during the charging process of the DEA, an additional circuit must be integrated before the ADC. One solution is to process the peak with a shaping amplifier since the information resides in the height and not the shape of the peak. Afterwards, the signal can be provided to the ADC with a peak detector or a sample and hold circuit. It was found that the temperature inside the enclosed housing is noticeably stable for a period of one hour. However, temperature and humidity control would further increase the reproducibility of the results, especially when DEAs based on acrylics and not silicones are investigated. Alternatively, the temperature and humidity data obtained can be used to integrate them into a controller as disturbance variables. The results presented in this manuscript provide a common ground for research on dielectric elastomer actuators and increase their applicability. Thus, the test bench presented speeds up the research on soft robots based on DEAs.
Future work will focus on integrating the additional circuit for the current monitor. Furthermore, an attempt will be made to build a static and dynamic model that takes the mechanical restrictions into account. In this context, it will be investigated whether it is necessary to consider the electrical domain when modelling DEAs with a stroke of 5% to 10%. In addition, a position control will be developed to close the loop of the test bench.

Author Contributions

Conceptualization, L.S.; methodology, L.S.; software, L.S. and S.B.; validation, L.S.; formal analysis, L.S.; investigation, L.S. and S.B.; resources, K.S. and F.P.-P.; data curation, S.B. and L.S.; writing—original draft preparation, L.S.; writing—review and editing, F.P.-P., K.S. and L.S.; visualization, L.S.; supervision, F.P.-P. and K.S.; project administration, L.S.; funding acquisition, K.S. All authors have read and agreed to the published version of the manuscript.

Funding

This research was funded by Frankfurt University of Applied Sciences and the University of Cadiz.

Institutional Review Board Statement

Not applicable.

Informed Consent Statement

Not applicable.

Data Availability Statement

Not applicable.

Acknowledgments

The work described in this paper was funded and supported by the Frankfurt University of Applied Sciences and the University of Cadiz. The authors acknowledge the valuable support of CTsystems AG, Micro-Epsilon and Acal BFi Germany GmbH.

Conflicts of Interest

The authors declare no conflict of interest.

References

  1. Wang, L.; Nurzaman, S.G.; Iida, F. Soft-Material Robotics. ROB 2017, 5, 191–259. [Google Scholar] [CrossRef]
  2. Laschi, C.; Mazzolai, B.; Cianchetti, M. Soft robotics: Technologies and systems pushing the boundaries of robot abilities. Sci. Robot. 2016, 1, eaah3690. [Google Scholar] [CrossRef] [PubMed] [Green Version]
  3. Verl, A.; Albu-Schäffer, A.; Brock, O.; Raatz, A. Soft Robotics; Springer: Berlin/Heidelberg, Germany, 2015. [Google Scholar]
  4. Wang, J.; Gao, D.; Lee, P.S. Recent Progress in Artificial Muscles for Interactive Soft Robotics. Adv. Mater. 2020, 33, e2003088. [Google Scholar] [CrossRef] [PubMed]
  5. Asaka, K.; Okuzaki, H. Soft Actuators; Springer: Singapore, 2019; ISBN 978-981-13-6849-3. [Google Scholar]
  6. Mirvakili, S.M.; Hunter, I.W. Artificial Muscles: Mechanisms, Applications, and Challenges. Adv. Mater. 2018, 30, 1704407. [Google Scholar] [CrossRef] [PubMed]
  7. Randazzo, M. Multilayer Dielectric Elastomer Actuators; University of Genoa: Genova, Italy, 2008. [Google Scholar]
  8. Behboodi, A.; Lee, S. Benchmarking of a Commercially Available Stacked Dielectric Elastomer as an Alternative Actuator for Rehabilitation Robotic Exoskeletons. In Proceedings of the 2019 IEEE 16th International Conference on Rehabilitation Robotics (ICORR), Toronto, ON, Canada, 24–28 June 2019; pp. 499–505, ISBN 978-1-7281-2755-2. [Google Scholar]
  9. CTsystems AG. CTstack: The Transducer Technology. Available online: https://ct-systems.ch/technology/ctstack-the-transducer-technology/ (accessed on 10 May 2021).
  10. Zuo, Y.; Ding, Y.; Zhang, J.; Zhu, M.; Liu, L.; Zhao, J. Humidity Effect on Dynamic Electromechanical Properties of Polyacrylic Dielectric Elastomer: An Experimental Study. Polymers 2021, 13, 784. [Google Scholar] [CrossRef] [PubMed]
  11. Michel, S.; Zhang, X.Q.; Wissler, M.; Löwe, C.; Kovacs, G. A comparison between silicone and acrylic elastomers as dielectric materials in electroactive polymer actuators. Polym. Int. 2010, 59, 391–399. [Google Scholar] [CrossRef]
  12. Wilson, E.D.; Assaf, T.; Pearson, M.J.; Rossiter, J.M.; Anderson, S.R.; Porrill, J.; Dean, P. Cerebellar-inspired algorithm for adaptive control of nonlinear dielectric elastomer-based artificial muscle. J. R. Soc. Interface 2016, 13, 20160547. [Google Scholar] [CrossRef] [PubMed] [Green Version]
  13. Cao, J.; Liang, W.; Zhu, J.; Ren, Q. Control of a muscle-like soft actuator via a bioinspired approach. Bioinspir. Biomim. 2018, 13, 66005. [Google Scholar] [CrossRef] [PubMed]
  14. Liang, W.; Cao, J.; Ren, Q.; Xu, J.-X. Control of Dielectric Elastomer Soft Actuators Using Antagonistic Pairs. IEEE/ASME Trans. Mechatron. 2019, 24, 2862–2872. [Google Scholar] [CrossRef]
  15. Cao, J.; Liang, W.; Wang, Y.; Lee, H.P.; Zhu, J.; Ren, Q. Control of a Soft Inchworm Robot With Environment Adaptation. IEEE Trans. Ind. Electron. 2020, 67, 3809–3818. [Google Scholar] [CrossRef]
  16. Rosset, S.; O’Brien, B.M.; Gisby, T.; Xu, D.; Shea, H.R.; Anderson, I.A. Self-sensing dielectric elastomer actuators in closed-loop operation. Smart Mater. Struct. 2013, 22, 104018. [Google Scholar] [CrossRef] [Green Version]
  17. Li, L.; Li, J.; Qin, L.; Cao, J.; Kankanhalli, M.S.; Zhu, J. Deep Reinforcement Learning in Soft Viscoelastic Actuator of Dielectric Elastomer. IEEE Robot. Autom. Lett. 2019, 4, 2094–2100. [Google Scholar] [CrossRef]
  18. Youn, J.-H.; Jeong, S.M.; Hwang, G.; Kim, H.; Hyeon, K.; Park, J.; Kyung, K.-U. Dielectric Elastomer Actuator for Soft Robotics Applications and Challenges. Appl. Sci. 2020, 10, 640. [Google Scholar] [CrossRef] [Green Version]
  19. Gu, G.-Y.; Zhu, J.; Zhu, L.-M.; Zhu, X. A survey on dielectric elastomer actuators for soft robots. Bioinspir. Biomim. 2017, 12, 11003. [Google Scholar] [CrossRef] [PubMed]
  20. Kim, K.J.; Tadokoro, S. Electroactive Polymers for Robotic Applications: Artificial Muscles and Sensors; Springer: London, UK, 2007. [Google Scholar]
  21. Hau, S. High-Performance Dielectric Elastomer Actuators; Universität des Saarlandes: Saarbrücken, Germany, 2018. [Google Scholar]
  22. Pelrine, R.E.; Kornbluh, R.D.; Joseph, J.P. Electrostriction of polymer dielectrics with compliant electrodes as a means of actuation. Sens. Actuators A Phys. 1998, 64, 77–85. [Google Scholar] [CrossRef]
  23. Lotz, P. Dielektrische Elastomerstapelaktoren für ein Peristaltisches Fluidfördersystem; Technischen Universität Darmstadt: Darmstadt, Germany, 2009. [Google Scholar]
  24. El Atrache Ceballos, A. Dynamic Modeling of Soft Robotic Dielectric Elastomer Actuator. Ph.D. Thesis, Embry-Riddle Aeronautical University, Daytona Beach, FL, USA, 2021. [Google Scholar]
  25. Qian, J. Mechanics of dielectric elastomers: Materials, structures, and devices. J. Zhejiang Univ. Sci. A 2016, 17, 1–21. [Google Scholar] [CrossRef] [Green Version]
  26. Haus, H.; Matysek, M.; Mößinger, H.; Schlaak, H.F. Modelling and characterization of dielectric elastomer stack actuators. Smart Mater. Struct. 2013, 22, 104009. [Google Scholar] [CrossRef]
  27. Quanser. QUARC Real-Time Control Software-Quanser. Available online: https://www.quanser.com/products/quarc-real-time-control-software/ (accessed on 1 April 2022).
  28. Advanced Energy Industries, Inc. Trek 2200 Series|Piezo Drivers|Advanced Energy. Available online: https://www.advancedenergy.com/products/high-voltage-products/high-voltage-amplifiers/piezo-drivers/trek-2200-series/ (accessed on 25 March 2022).
  29. Giousouf, M.; Kovacs, G. Dielectric elastomer actuators used for pneumatic valve technology. Smart Mater. Struct. 2013, 22, 104010. [Google Scholar] [CrossRef]
  30. Quanser. Q2-USB Data Acquisition Device-Quanser. Available online: https://www.quanser.com/products/q2-usb-data-acquisition-device/ (accessed on 29 March 2022).
  31. Micro-Epsilon Messtechnik. Kompakter Laser-Wegsensor für OEM und Serieneinsatz. Available online: https://www.micro-epsilon.de/displacement-position-sensors/laser-sensor/optoNCDT_1220/ (accessed on 28 March 2022).
  32. Keferstein, C.P.; Marxer, M. Fertigungsmesstechnik: Praxisorientierte Grundlagen, moderne Messverfahren, 8th ed.; Springer Fachmedien: Wiesbaden, Germany, 2015; ISBN 3-8348-2583-2. [Google Scholar]
  33. Sensirion. Home. Available online: https://sensirion.com/de/ (accessed on 28 March 2022).
  34. STMicroelectronics. STM32F334R8-STMicroelectronics. Available online: https://www.st.com/en/microcontrollers-microprocessors/stm32f334r8.html (accessed on 30 March 2022).
  35. FSnD Ltd. LCD Displays für Platinenmontage. Available online: https://www.lcd-module.de/produkte/dip.html (accessed on 30 March 2022).
  36. Multicomp Pro. Multicomp Pro|The Engineer’s Choice. Available online: http://www.multicomp-pro.com/ (accessed on 1 April 2022).
  37. Quanser. QUARC Serial Interfacing Binary Demo: QUARC Demos. Available online: http://quanser-update.azurewebsites.net/quarc/documentation/quarc_serial_interfacing_binary_demo.html (accessed on 6 June 2022).
  38. Flittner, K. Dielektrische Elastomerstapelaktoren für Mikroventile; Technischen Universität Darmstadt: Darmstadt, Germany, 2015. [Google Scholar]
  39. Effinger, V.M. Finite Nichtlinear Viskoelastische Modellierung Offenzelliger Polymerschäume; Institut für Baustatik und Baudynamik, Universität Stuttgart: Stuttgart, Germany, 2016; ISBN 978-3-00-054033-2. [Google Scholar]
  40. Lotz, P.; Matysek, M.; Flittner, K.; Schlaak, H.F. Modeling of non ideal dielectric elastomer stack actuators. In Electroactive Polymer Actuators and Devices (EAPAD) 2010; SPIE: Bellingham, WA, USA, 2010; pp. 330–338. [Google Scholar]
  41. Takagi, K.; Kitazaki, Y.; Kondo, K. A Simple Dynamic Characterization Method for Thin Stacked Dielectric Elastomer Actuators by Suspending a Weight in Air and Electrical Excitation. Actuators 2021, 10, 40. [Google Scholar] [CrossRef]
  42. Bernat, J.; Gajewski, P.; Kołota, J.; Marcinkowska, A. Review of Soft Actuators Controlled with Electrical Stimuli: IPMC, DEAP, and MRE. Appl. Sci. 2023, 13, 1651. [Google Scholar] [CrossRef]
Figure 1. Dielectric elastomer actuator (a) not activated (b) activated (c) stacked.
Machines 11 00380 g001
Figure 2. Electrical equivalent circuit of a DEA (a) all resistance in one layer included (b) resistance of the supply line neglected and combined connection and electrode resistance (c) resistance of the elastomer neglected.
Machines 11 00380 g002
Figure 3. Schematic layout (a) test bench (b) PCB.
Machines 11 00380 g003
Figure 4. MATLAB/Simulink software model.
Machines 11 00380 g004
Figure 5. Flow chart function Absolute RS-422.
Machines 11 00380 g005
Figure 6. Test bench (a) fully assembled (b) detailed view of stacked DEA, laser sensor, and mounting.
Machines 11 00380 g006
Figure 7. Distance measurement (a) absolute with different interfaces (b) relative with theoretical comparison.
Machines 11 00380 g007
Figure 8. High voltage amplifier feedback (a) voltage monitor at a voltage step (b) current monitor at different loads.
Machines 11 00380 g008
Figure 9. Environmental conditions (a) temperature (b) relative humidity.
Machines 11 00380 g009
Disclaimer/Publisher’s Note: The statements, opinions and data contained in all publications are solely those of the individual author(s) and contributor(s) and not of MDPI and/or the editor(s). MDPI and/or the editor(s) disclaim responsibility for any injury to people or property resulting from any ideas, methods, instructions or products referred to in the content.