Article

A Normalized Terzaghi Model and Time-Step FEA for Predicting the Adsorption of a Cylindrical Object in Subsea Salvage

College of Mechanical and Electrical Engineering, Harbin Engineering University, Harbin 150001, China
*
Authors to whom correspondence should be addressed.
Machines 2023, 11(2), 245; https://doi.org/10.3390/machines11020245
Submission received: 9 December 2022 / Revised: 26 January 2023 / Accepted: 3 February 2023 / Published: 7 February 2023
(This article belongs to the Section Machine Design and Theory)

Abstract

:
This paper proposes a normalized Terzaghi model modified based on finite element analysis to predict the adsorption force of a cylindrical object for salvage from the seabed. The maximum relative error is less than 5% compared with finite element analysis. Furthermore, the time-step finite element method is adopted to analyze the effects of the lifting force and bury depth. With increased lifting force, the critical displacement is reduced slightly, soil separation on the bottom of the object occurs earlier, and the velocity increases more quickly at the same burial depth. In addition, the soil displacement on the bottom stops increasing earlier, and the off-mud process is completed earlier. With increased burial depth, soil separation takes considerably longer, velocity increases more slowly, the maximum soil displacement is increased, and the off-mud process takes longer to complete.

1. Introduction

With the increase in underwater activities, submersibles and aircraft often become submerged on the seabed because of high hydrostatic pressure in the deep sea, solar activity, high temperatures, and strong vibrations. Rapid salvage is required [1]. However, because of the interaction between the object and the subsea soil during rapid salvage operations, soil adsorption presents a significant challenge.
The salvage of deep-sea wrecks is one of the most difficult underwater operations. At sea depths below 200 m, ecosystems occupy more than 90% of the biosphere, connecting shallow and deep-sea ecosystems, playing a key role in nutrient regeneration, and providing harvestable fish resources [2]. Deep-sea salvage may lead to oil leaks from sunken ships, submersibles, and aircraft, which can cause pollution of the marine ecosystem. The consequence of severe pollution can be massive economic losses [3]. However, in the salvage process, extracting the object from the seabed mud is the first thing to be considered, and in this regard, the adsorption force of the soil is the key factor.
NCELI [4] tested a series of systematic and well-developed small-scale models in the laboratory in order to study the adsorption force. The results of the tests were used to classify salvage operations into long and short off-mud cases. Vesic [5] used anchor plate tests in soft clay to explain the mechanism of the adsorption force and derive a theoretical formula. The results showed that when the anchor plate moved upward under the lifting force, a difference in the pore water pressure above and below the anchor plate was produced, and this was the adsorption force. Ninomiya [6,7,8] analyzed the effects of bottom immersion time on the adsorption force. Das [9,10,11] investigated the variation between the damage coefficient of the adsorption and the burial depth using hollow anchors to increase the pore water pressure by venting air into the bottom of the flat anchors. Sawicki [12] proposed two stages, a “without-seam phase” and a “with-seam phase”, for the lifting process in saturated clay. Zhou [13], on the basis of Sawicki, proposed a transition phase between the without-seam and with-seam stages. Sui [14] used the finite element software ANSYS to simulate the adsorption force of the submerged structure and studied the relationship between the adsorption force, the depth of the mud, and the internal friction angle of the submerged structure. Hu [15] focused on the trifold lateral friction resistance model and its analytical solution under different loading states. Meyerhof [16] assumed that drainage conditions were the determining factor for the adsorption force and tested the magnitude of the adsorption force applied to the structure by experimentally loading it slowly over a period of time. Qiu [17] studied the effect of the water content on the adsorption force. Jin [18] divided the factors affecting adsorption force into three categories: the nature of the structure, the substrate in contact with the structure, and the immersion depth of the structure in the sediment. Referring to the traditional Terzaghi bearing capacity theory, the theoretical formula for the adsorption force of the sediment on the structure was calculated using the Skempton model. At present, the adsorption force formula is mainly used for submarine structures such as pile boots and caissons and is primarily developed from the foundation bearing capacity formula, which cannot be directly used to calculate the adsorption force. The earliest adsorption force formula was proposed by the U.S. Naval Civil Engineering Laboratory, which found that the salvage force was much greater than the self-weight of the structure in the submarine salvage and proposed an empirical formula based on the test results. However, this had limitations in that the coefficients in the empirical formula needed to be determined. Han [19] studied the relationship between lifting speed and adsorption force. Fang [20] carried out a study of adsorption forces through field tests of buoyancy variations using a model of a subsea bottom-supported foundation. Timir Karmakar [21] conducted an analytical study of the two-dimensional problem of lifting an object from the top of a fully saturated, rigid, porous bed. Davie and Sutherland [22] found in a series of experiments that structures subjected to upward force were easier to control, which reduced engineering accidents. Cong [23] analyzed the soil adsorption mechanism from a chemical point of view and also studied the factors affecting the adsorption, such as soil surface properties, surface characteristics, and the nature of the ions. Michalski [24,25] addressed the problem of calculating parameters for lifting objects of axisymmetric shape from the seabed and derived approximate algebraic formulas for lifting objects stranded on the seabed, proposing a parametric method suitable for assessing the suction of slender objects on the seabed and predicting the time of object release.
This paper proposes an improved Terzaghi model based on finite element analysis to predict the adsorption force of a cylindrical object to be salvaged from the seabed. The maximum relative error is less than 5% compared with finite element analysis. The effects of the lifting force and burial depth are further analyzed using time-step finite element analysis.

2. The Object and Salvage Process

When a fallen object is salvaged from the seabed, it is subjected to the adsorption force of the mud. The adsorption force is generally the interaction between the structure, the soil, and the liquid, which is usually water. The adsorption force consists of three elements: the adhesion between the soil and the bottom surface of the object’s structure, the negative water pressure generated during the lifting of the structure, and the lateral frictional resistance generated between the soil and the side of the structure. When the lifting starts, the soil is deformed by the adsorption force and friction resistance. When the critical point of the adsorption force is reached, the soil on the bottom of the structure starts to separate from the structure surface; however, the soil on both sides of the structure has not been separated completely. Although the soil is separated from the structure’s bottom, the soil on both sides is still lifted with the structure until a new equilibrium is reached again. As the lifting continues, the soil on both sides moves again and separates from the surface of the structure until the structure is fully lifted up and away from the mud. The movement of the fallen object and the soil is illustrated in Figure 1.

3. Results of Off-Mud Process Modeling and FEA

In this section, the off-mud model is created to analyze the behavior of the mud during the lifting. The simulation results are compared with the Terzaghi model, and the Terzaghi model is then modified to improve the model error.

3.1. Off-Mud Modelling

The Mohr–Coulomb model can be applied to loose or cemented granular materials that yield under shear stress, and the magnitude of the shear stress limit depends only on the maximum and minimum principal stresses. In addition, the Mohr–Coulomb model has two failure criteria: tensile and shear. The location of the stress point in the envelope is controlled by both the uncorrelated flow of the shear damage and the correlation law of the tensile damage.

3.1.1. Failure Criterion

In the principal stress space, the incremental expression of Hooke’s law in terms of the generalized stress and stress increment is given by [26],
Δ σ 1 = α 1 Δ ε 1 e + α 2 ( Δ ε 2 e + Δ ε 3 e ) Δ σ 2 = α 1 Δ ε 2 e + α 2 ( Δ ε 1 e + Δ ε 3 e ) Δ σ 3 = α 1 Δ ε 3 e + α 2 ( Δ ε 1 e + Δ ε 2 e ) ,
In these equations, α 1 and α 2 are the material constants defined by the shear modulus and bulk modulus.
α 1 = K + 4 3 G α 2 = K 2 3 G ,
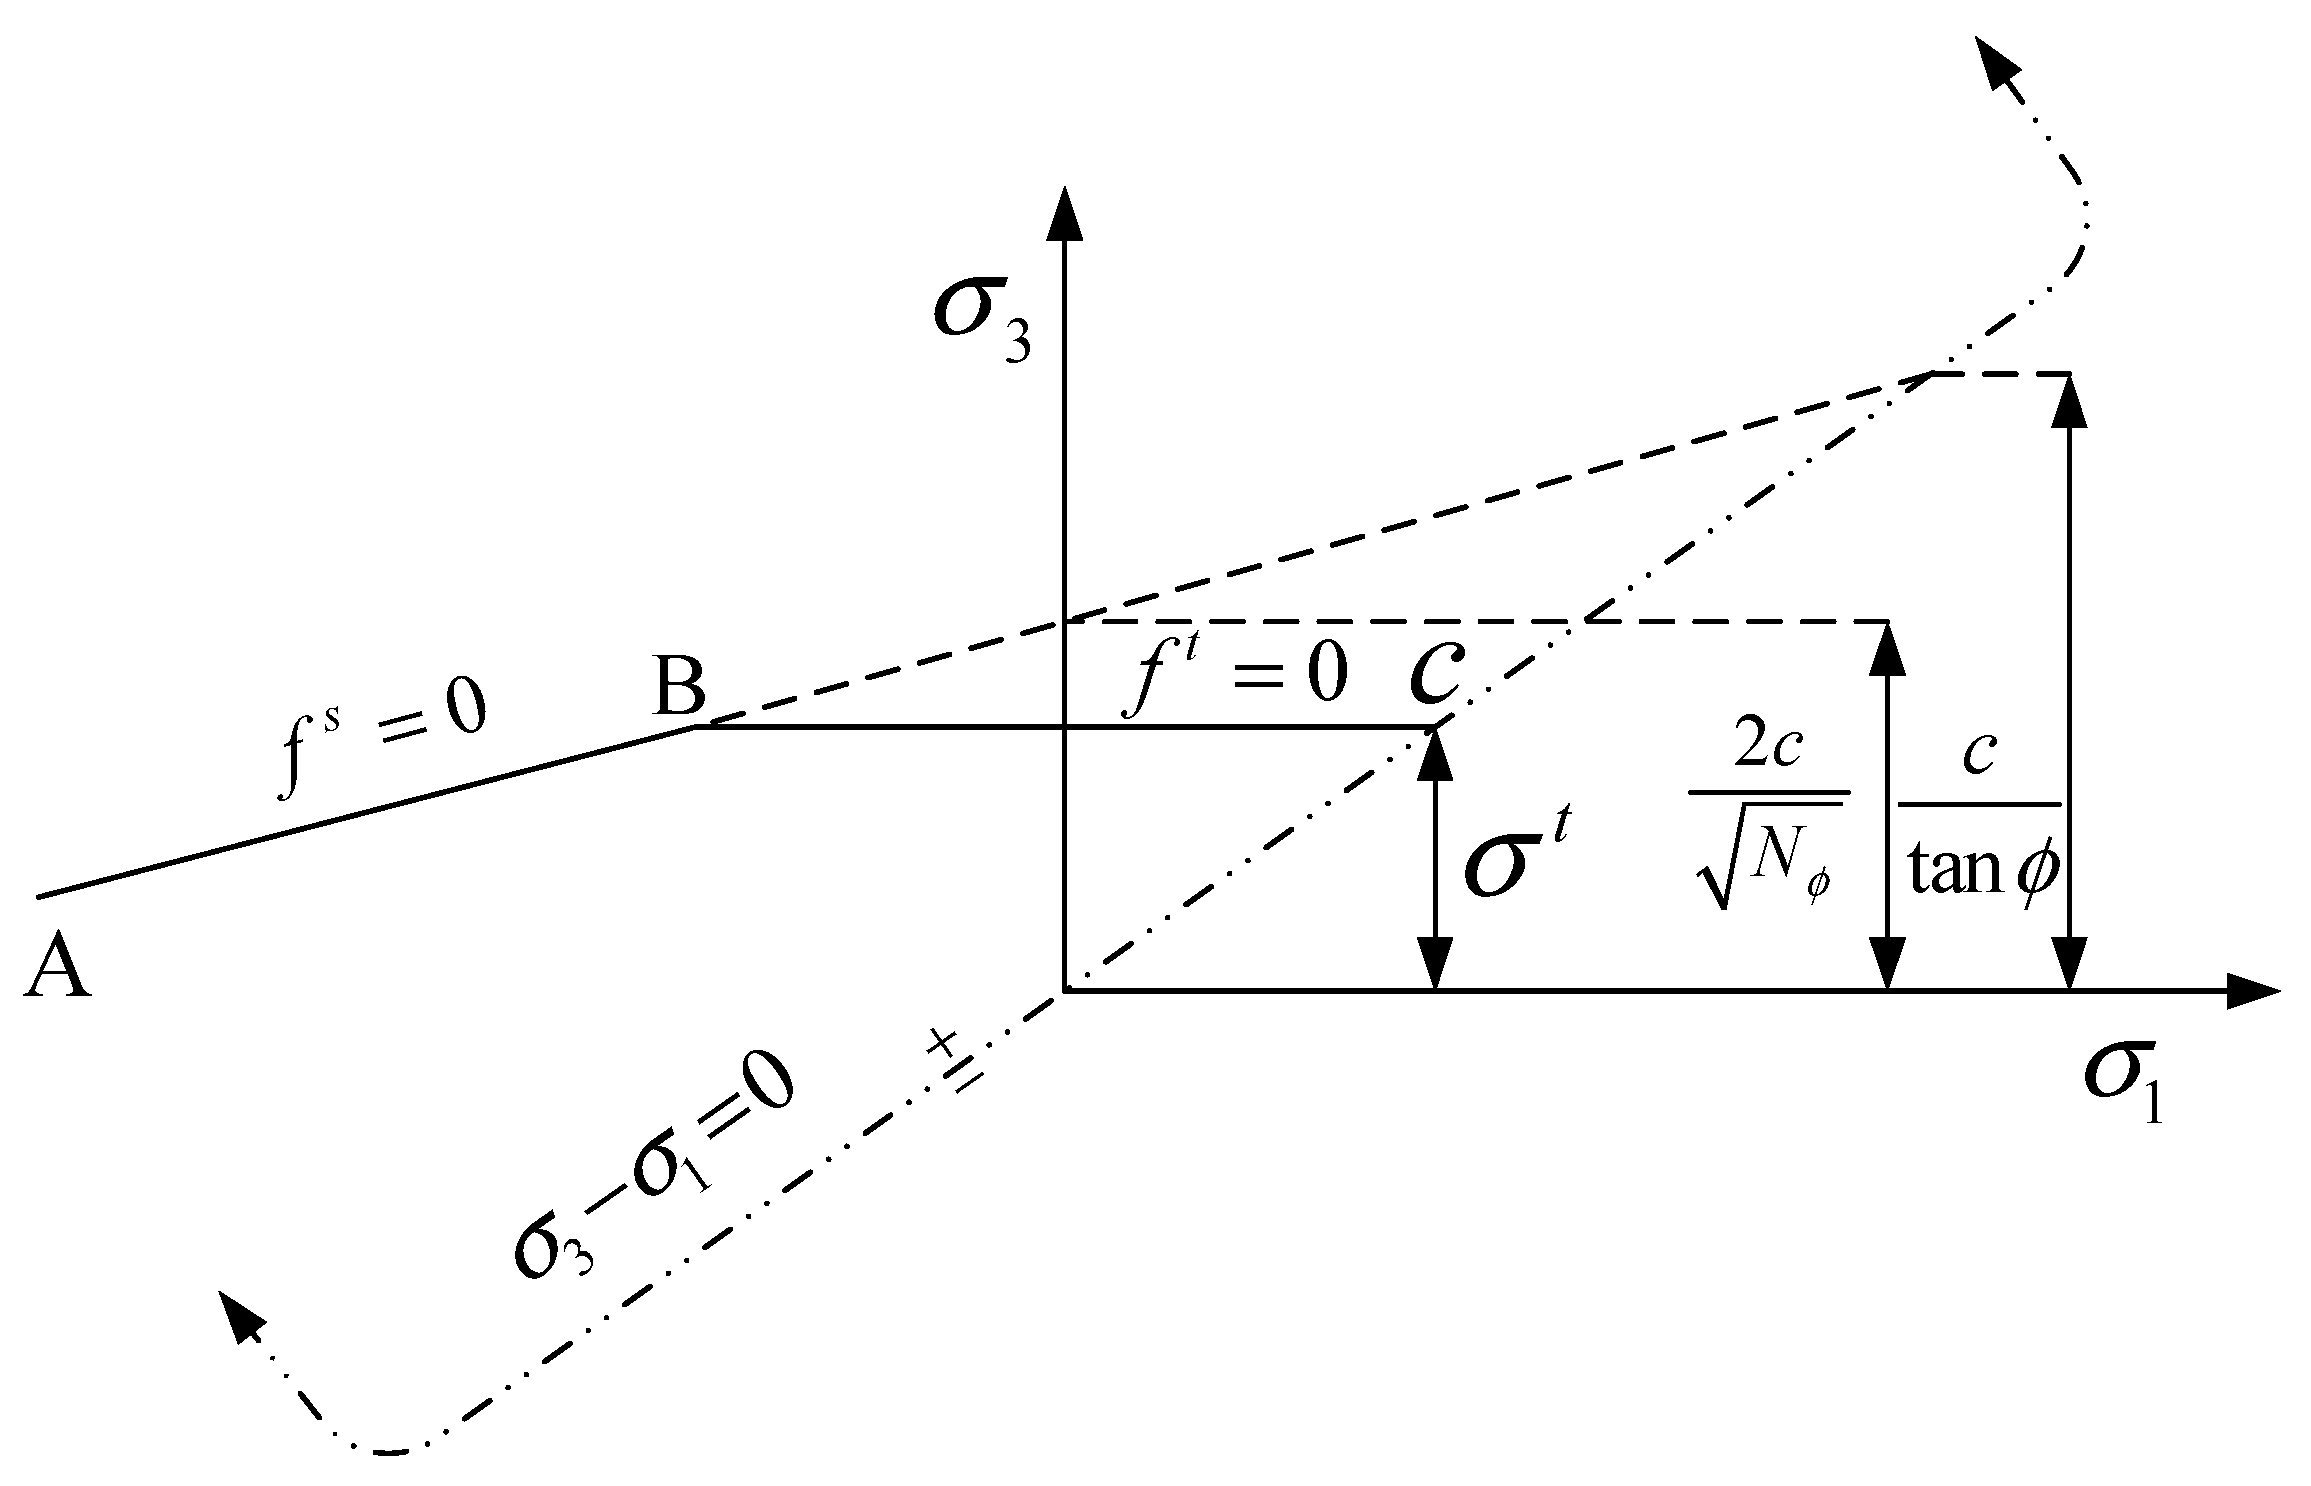
The combined Mohr–Coulomb criterion with the tensile failure is shown in Figure 2.
The failure envelope f ( σ 1 , σ 3 ) = 0 is defined by the shear failure criterion, f s = 0 , from A to B,
f s = σ 1 σ 3 N ϕ + 2 c N ϕ ,
and   N φ = 1 + sin ϕ 1 sin ϕ .
This equation is defined by the tensile failure criterion, f t = 0 , from B to C,
f t = σ 3 σ t ,
where ϕ is the angle of the internal friction, c is the cohesive force, and σ t is the tensile strength.

3.1.2. Mobility

Two functions, g s and g t , are used to represent the shear plastic flow and tensile plastic flow patterns. The function g s corresponds to the uncorrelated flow [26].
g s = σ 1 σ 3 N ψ   and
N ψ = 1 + sin ψ 1 sin ψ ,
where ψ is the expansion angle.
The function g t corresponds to the correlation law.
g t = σ 3 .
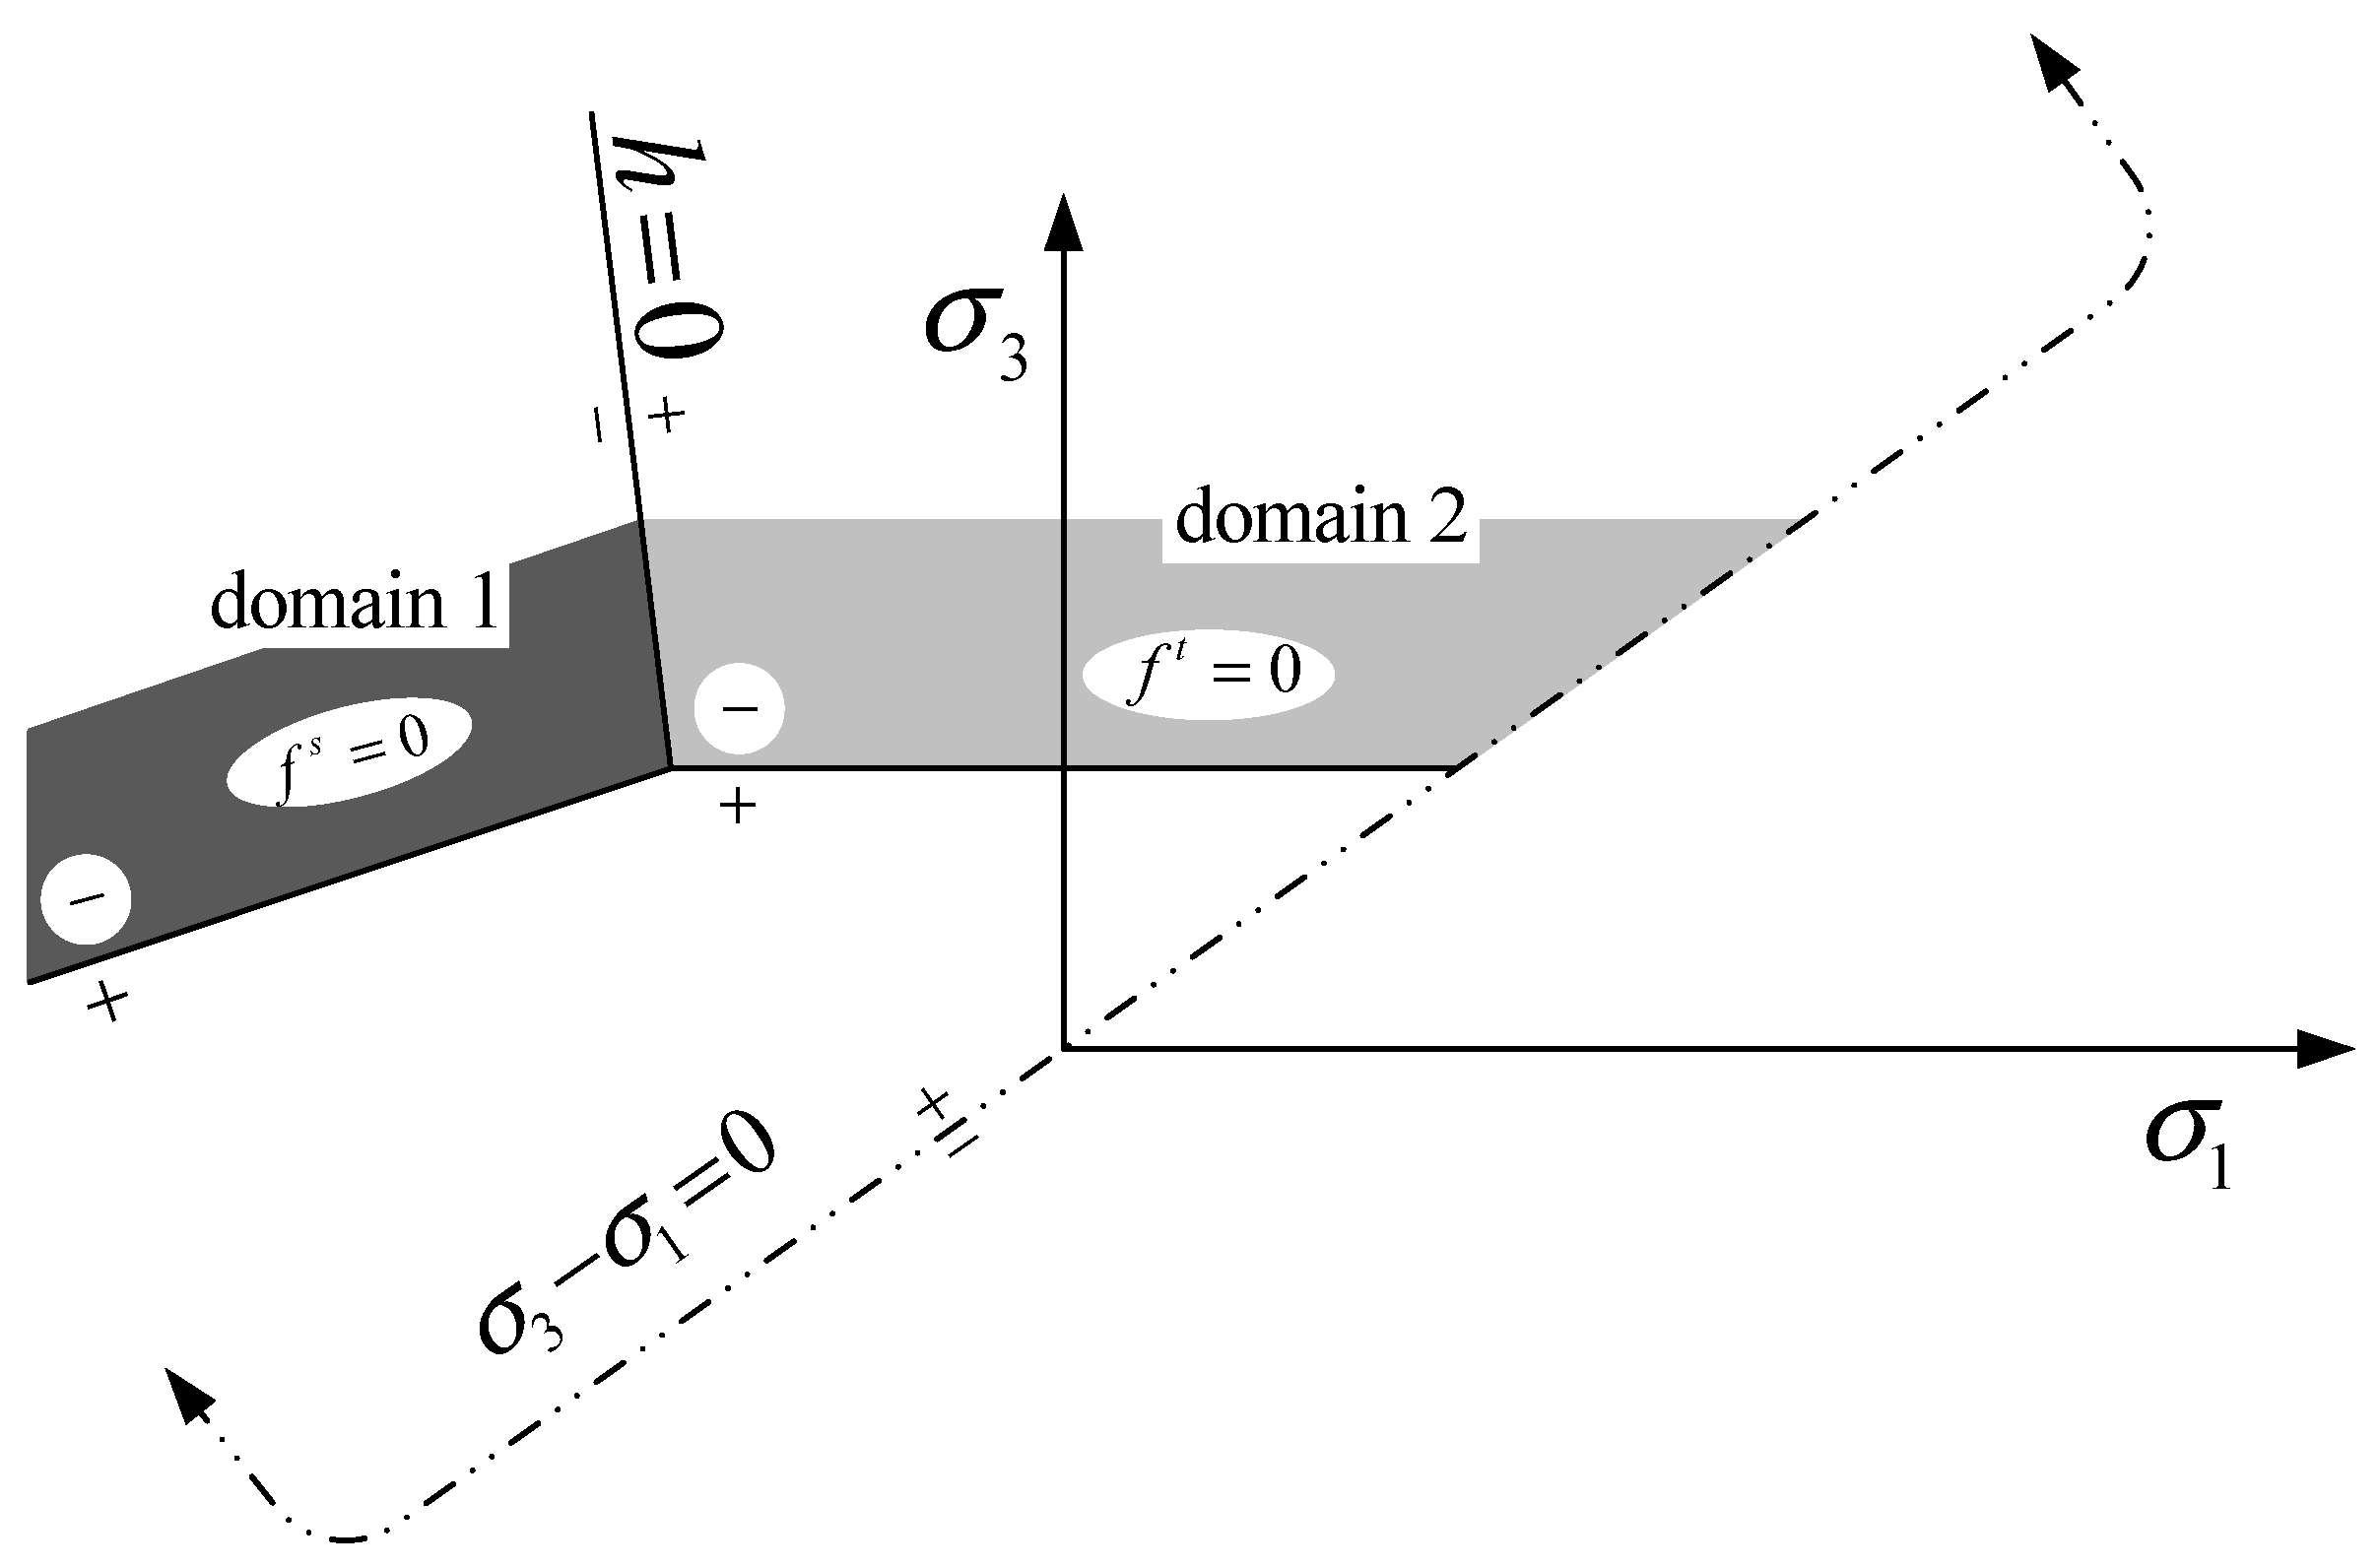
Different laws are chosen by defining the region in which the stress point is located. As shown in Figure 3, this is the formula that defines the positive and negative domains:
h = σ 3 σ t + a p ( σ 1 σ p ) ,
where a p and σ p are constants and,
a p = 1 + N φ 2 + N φ σ p = σ t N φ 2 c N φ
When the stress point falls within shear damage region 1 and the stress point conforms to the curve f s = 0 , the uncorrelated flow law derived from the function g s is applicable. When the stress point falls within tensile damage region 2 and the stress point conforms to the curve f t = 0 , the correlation law derived from the function g t is applicable.

3.1.3. Interface Model

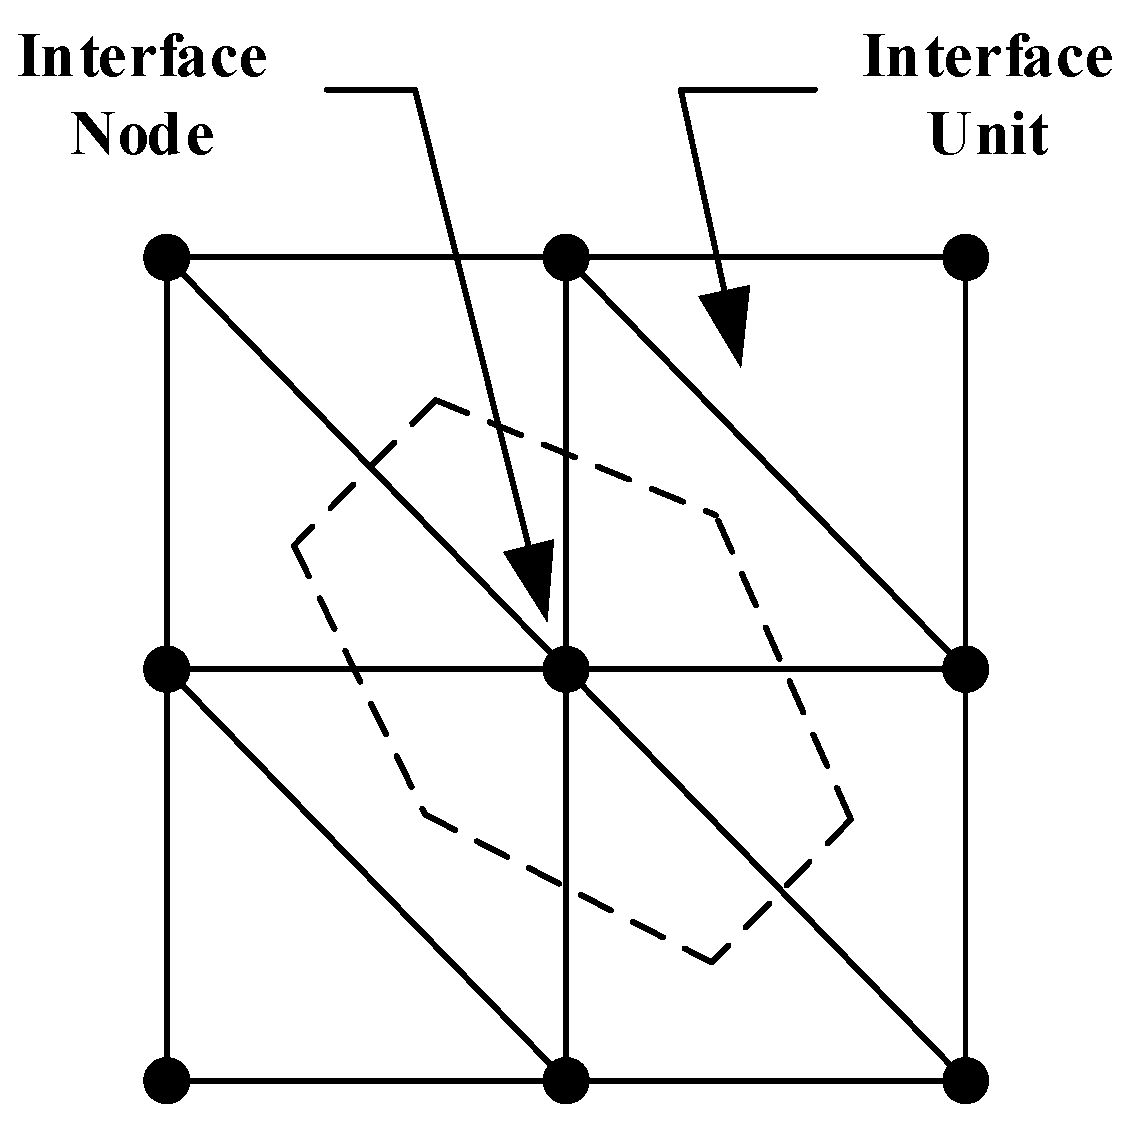
The interface cells are assigned as a triangle, so that any node on an interface corresponds to an associated area. The area of any quadrilateral is defined by two triangular interface cells; nodes are located at the vertices of each interface cell, and interface nodes are formed when an interface cell connects to another mesh surface, as shown in Figure 4.
The interface can be treated as a “shrinkage band” that can be stretched and allows other surfaces to be connected to the interface with higher sensitivity when they pierce each other. The target surface, that is, the solid surface of the unit, can link the interface unit to the interface node. The normal stress at the interface is determined by the orientation of the target surface. The absolute normal impalement between the interface nodes and the target surface and the relative shear velocity are first derived at each time step of the calculation, and finally the tangential and normal force magnitudes are calculated using the interface intrinsic model. The expressions for the tangential and normal forces at the interface at the moment of t + Δ t when the interface is in the elastic phase are [27],
F n ( t + Δ t ) = k n u n A + σ n A F s i ( t + Δ t ) = F s i ( t ) + k s Δ u s i ( t + 0.5 Δ t ) A + σ s i A ,
where F n ( t + Δ t ) is the normal force vector at the time of t + Δ t , F s i ( t + Δ t ) is the tangential force at the time of t + Δ t , u n is the absolute displacement of the interface node penetration into the target surface, and Δ u s i is the relative shear displacement increment vector. σ n and σ s i are the additional normal and additional tangential stresses, both caused by the initialization of the interface stresses. k s is the tangential stiffness of the interface unit, k n is the normal stiffness of the interface unit, and A is the area represented by the interface nodes.
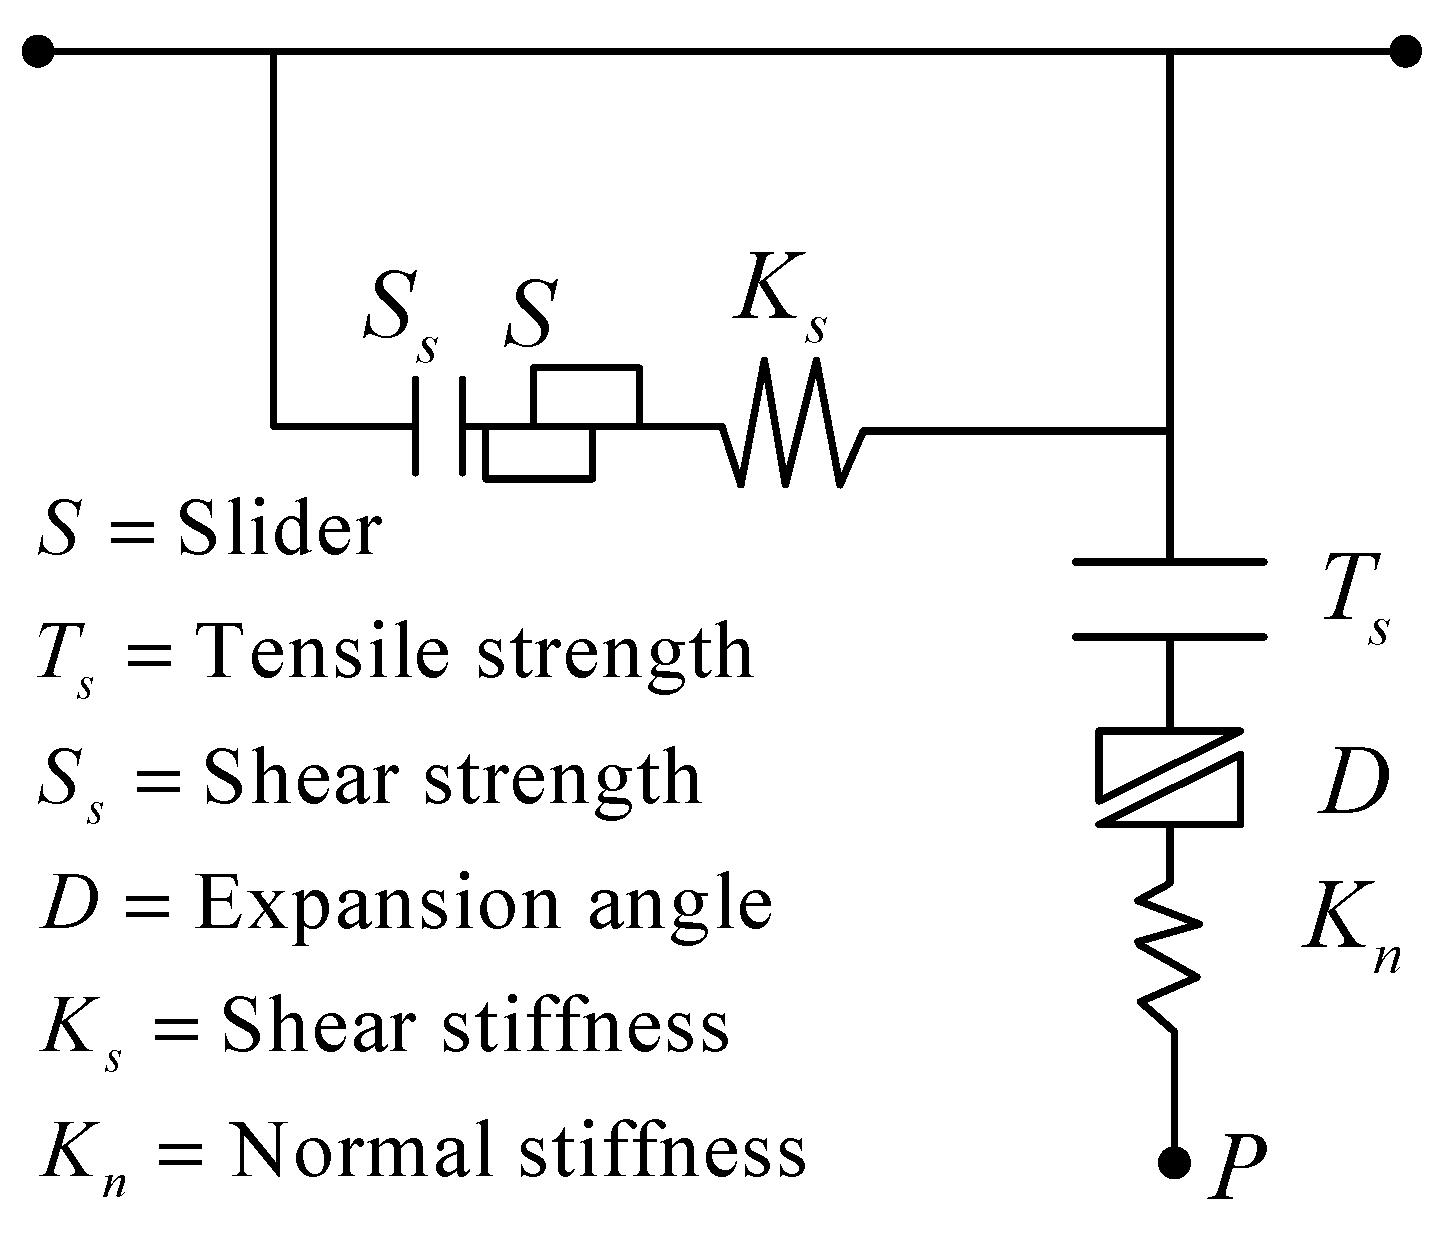
The model of the interface is shown in Figure 5. For the Coulomb sliding interface unit, there are two states of the mutual contact and relative sliding between the interface and the target surface, and according to the Coulomb shear strength criterion, the tangential force, F s max , required for the relative sliding of the interface and the target surface, can be obtained as [27],
F s max = c i f A + tan φ i f ( F n u A ) ,
where c i f is the interface cohesion, φ i f is the interface friction angle, and u is the water pressure.
When the tangential force on the interface is less than the maximum tangential force, namely, | F s | < F s max , the interface is in the elastic stage. When the tangential force on the interface is equal to the maximum tangential force, that is, | F s | = F s max , the interface is in the plastic stage.
When the magnitude of the tensile stress on the interface exceeds the tensile strength on the interface, the interface will be damaged, and the normal and tangential forces on the interface will become zero at the moment of interface damage. In general, the default tensile strength of the interface is zero.
The existence of interface nodes not only reflects the contact of the interface but also the transfer of the contact force. It is assumed that the stresses at the nodes are distributed over the representative areas of the nodes. Each node on the interface is associated with a parameter and can also have its own node with different parameters.
The normal and tangential stiffnesses of the interface are set at 10 times the equivalent stiffness of the “hardest” adjacent area [27],
k n = k s = 10 max ( K + 4 G 3 Δ Z min ) ,
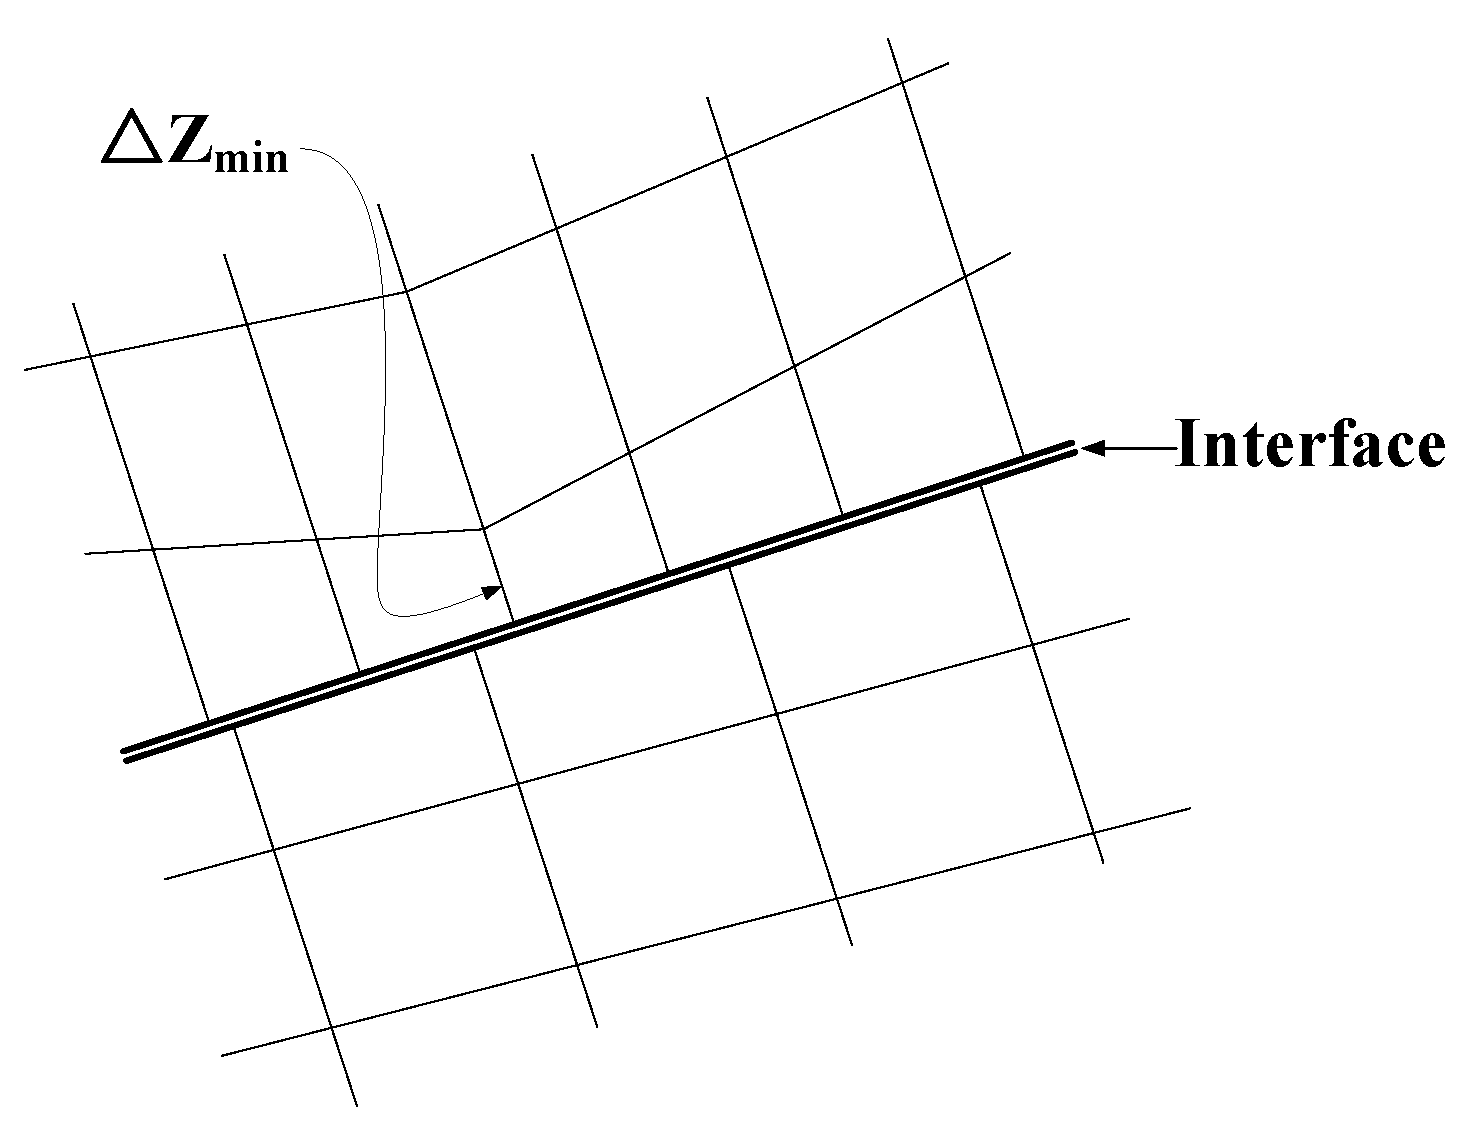
where K is the bulk modulus, G is the shear modulus, and Δ Z min is the minimum dimension over the connection area in the normal direction of the interface, as shown in Figure 6.
The interface parameters to be determined include cohesion c , friction angle φ , tangential stiffness k s , and normal stiffness k n . The parameters related to the interface of this model are listed in Table 1.

3.1.4. Soil Parameters

The soil density is 1.29 g/cm3, and it is a silty soil. The Poisson’s ratio of the silty soil is 0.3, and the elasticity modulus is 80,000 kN/m2.
The bulk modulus K , shear modulus G , Young’s modulus E , and Poisson’s ratio υ are related as [27],
K = E 3 ( 1 2 υ ) ,
G = E 2 ( 1 + υ ) .
The parameters of the silty soil are listed in Table 2.

3.1.5. Object Parameters

The density of the object is 3002 kg/m3, Poisson’s ratio is 0.33, and the modulus of elasticity is 7.17 × 10 10 Pa. The shear modulus is calculated as 2.70 × 10 10 Pa, and the bulk modulus is 7.03 × 10 10 Pa. The parameters of the object are listed in Table 3.

3.2. Finite Element Analysis

The following assumptions are made for this simulation:
  • The deformation of the cylindrical structures is not considered;
  • The soil is saturated;
  • The particles of the soil are incompressible.
The parameters of the soil model are listed in Table 4. Because the soil close to the interface is affected by the lifting force, the soil and cylinder near the interface are refined.

Flow Chart of the Simulation

The silty soil and object model is shown in Figure 7.
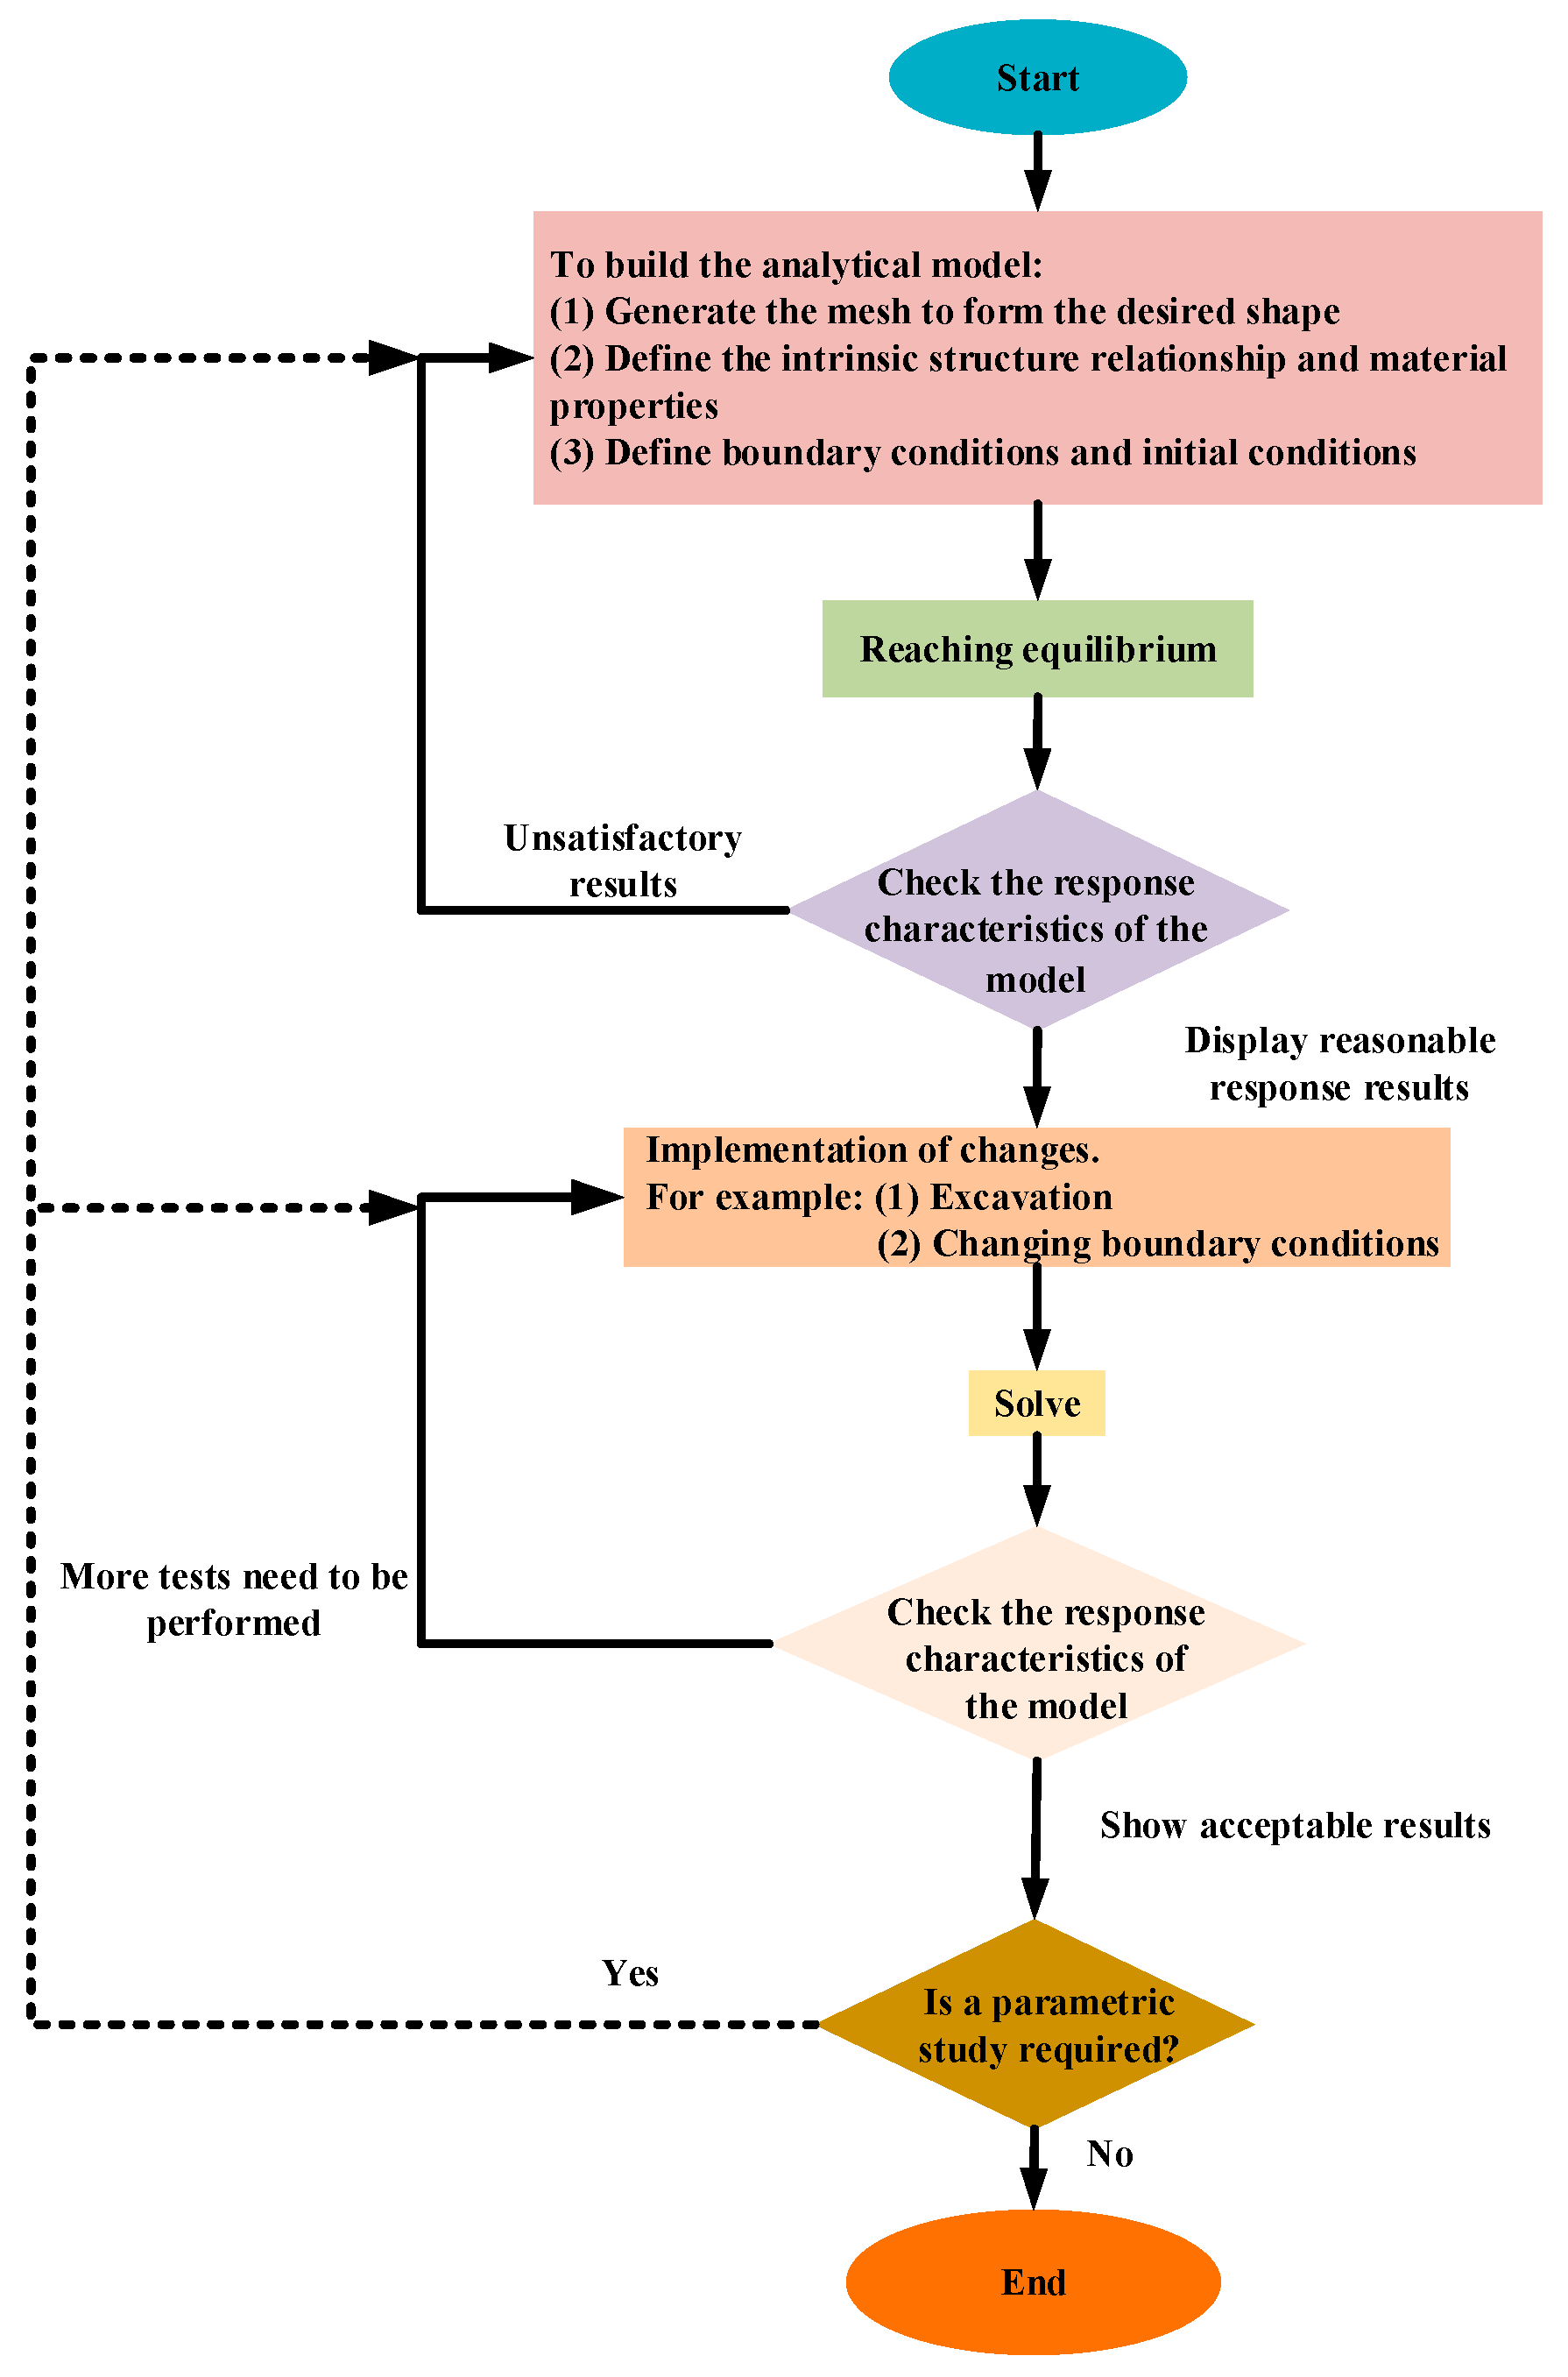
The simulation flowchart is shown in Figure 8.

3.3. Initial Stress and Off-Mud Process

The existence of initial ground stress and displacement affects the simulation results. Before the salvage, both need to be included in the simulation.

3.3.1. Initial Stress

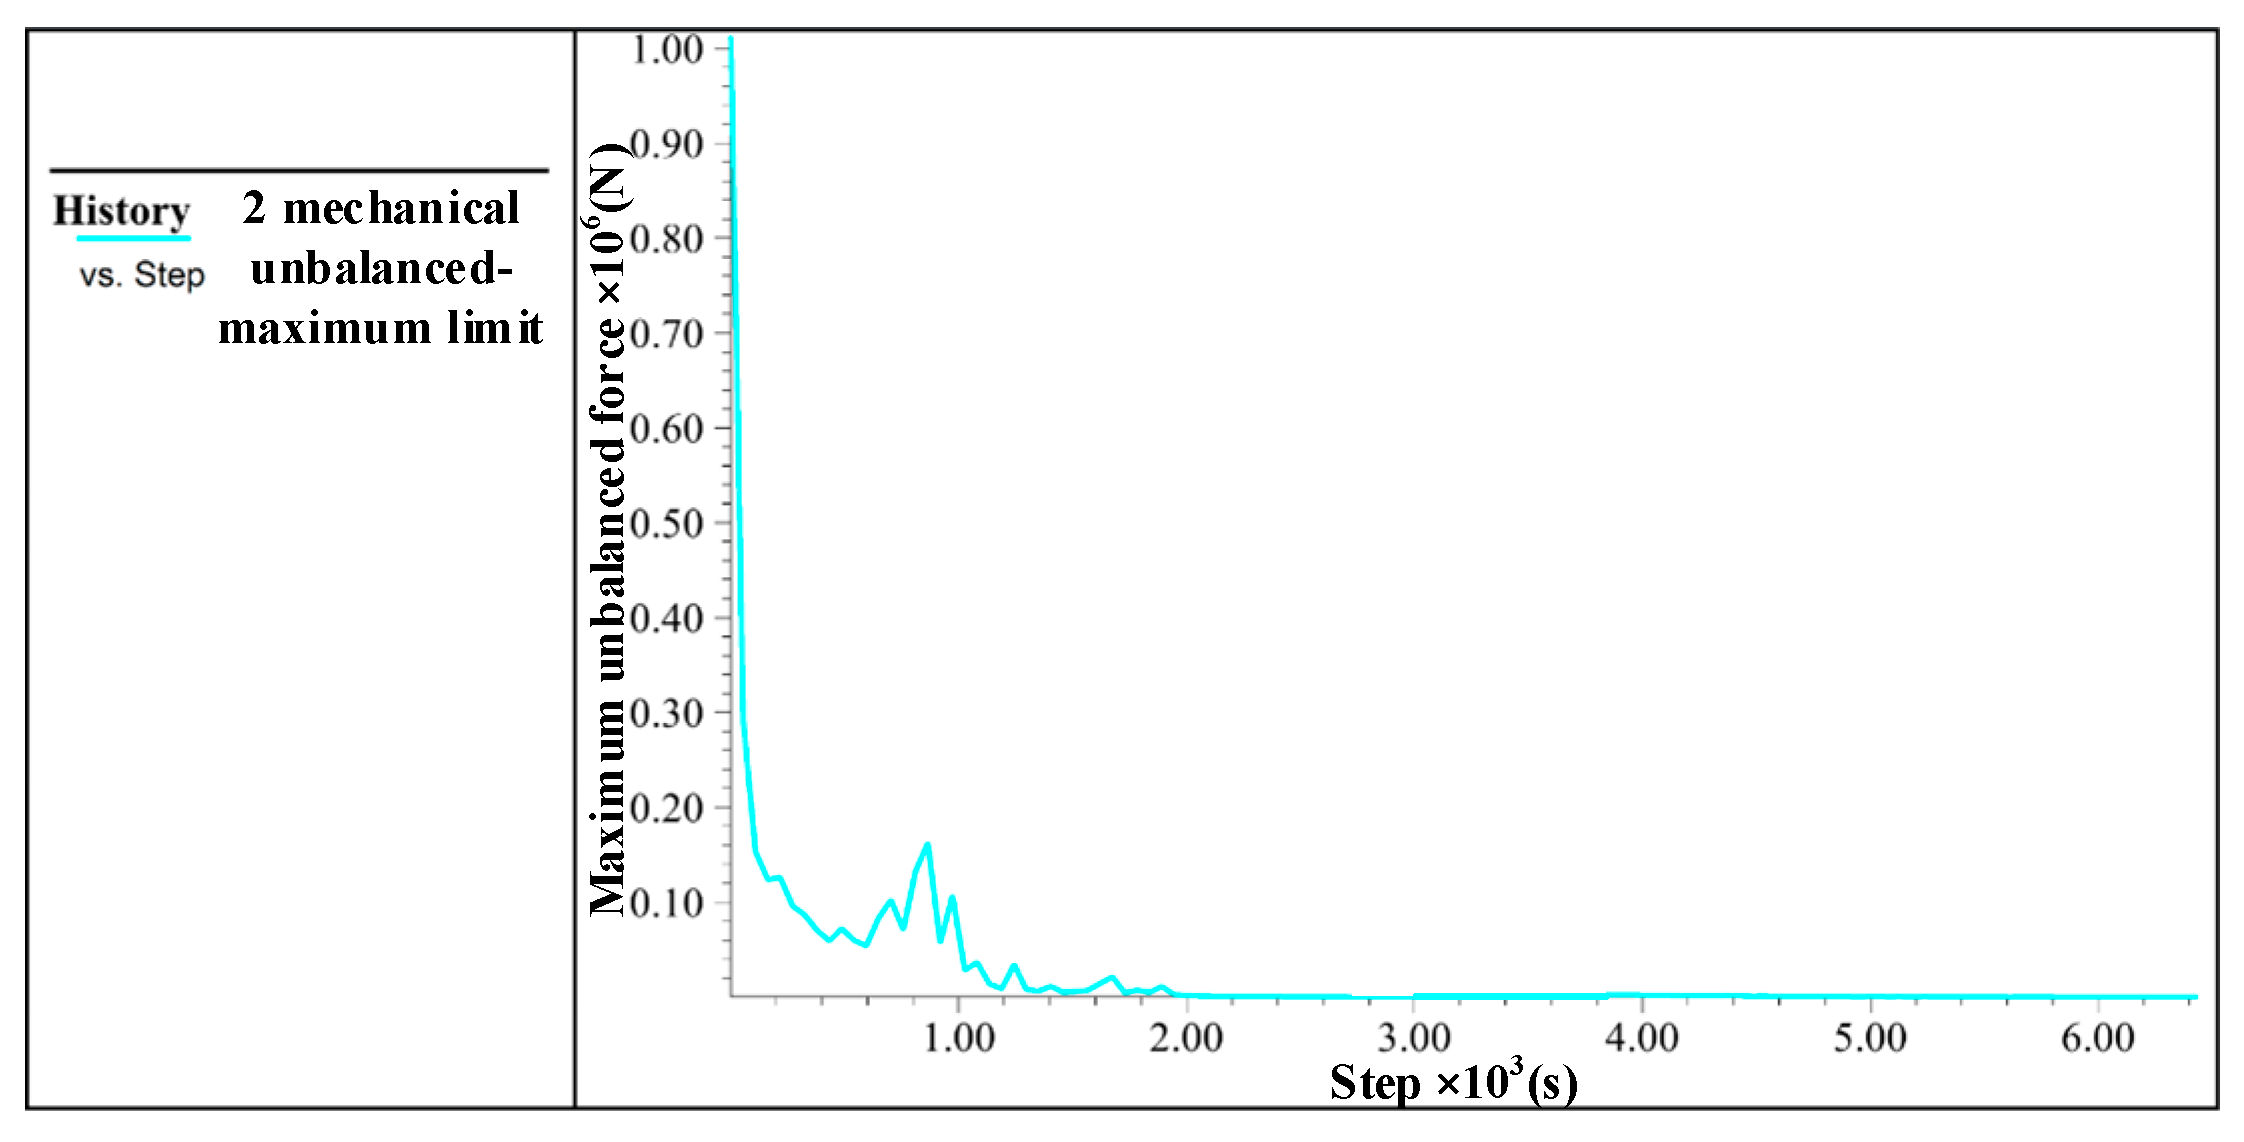
In the analysis of the initial stress equilibrium of the silty soil, the criterion for the system to reach equilibrium is specified as the ratio of the maximum unbalanced force to 1 × 10 5 . In other words, when the ratio of the maximum unbalanced force to the average of the initially applied nodal force is no more than 1 × 10 5 , the maximum unbalanced force is negligible, and the system is in convergent equilibrium. In this case, the model of the object with a depth of 1.6 m is used.
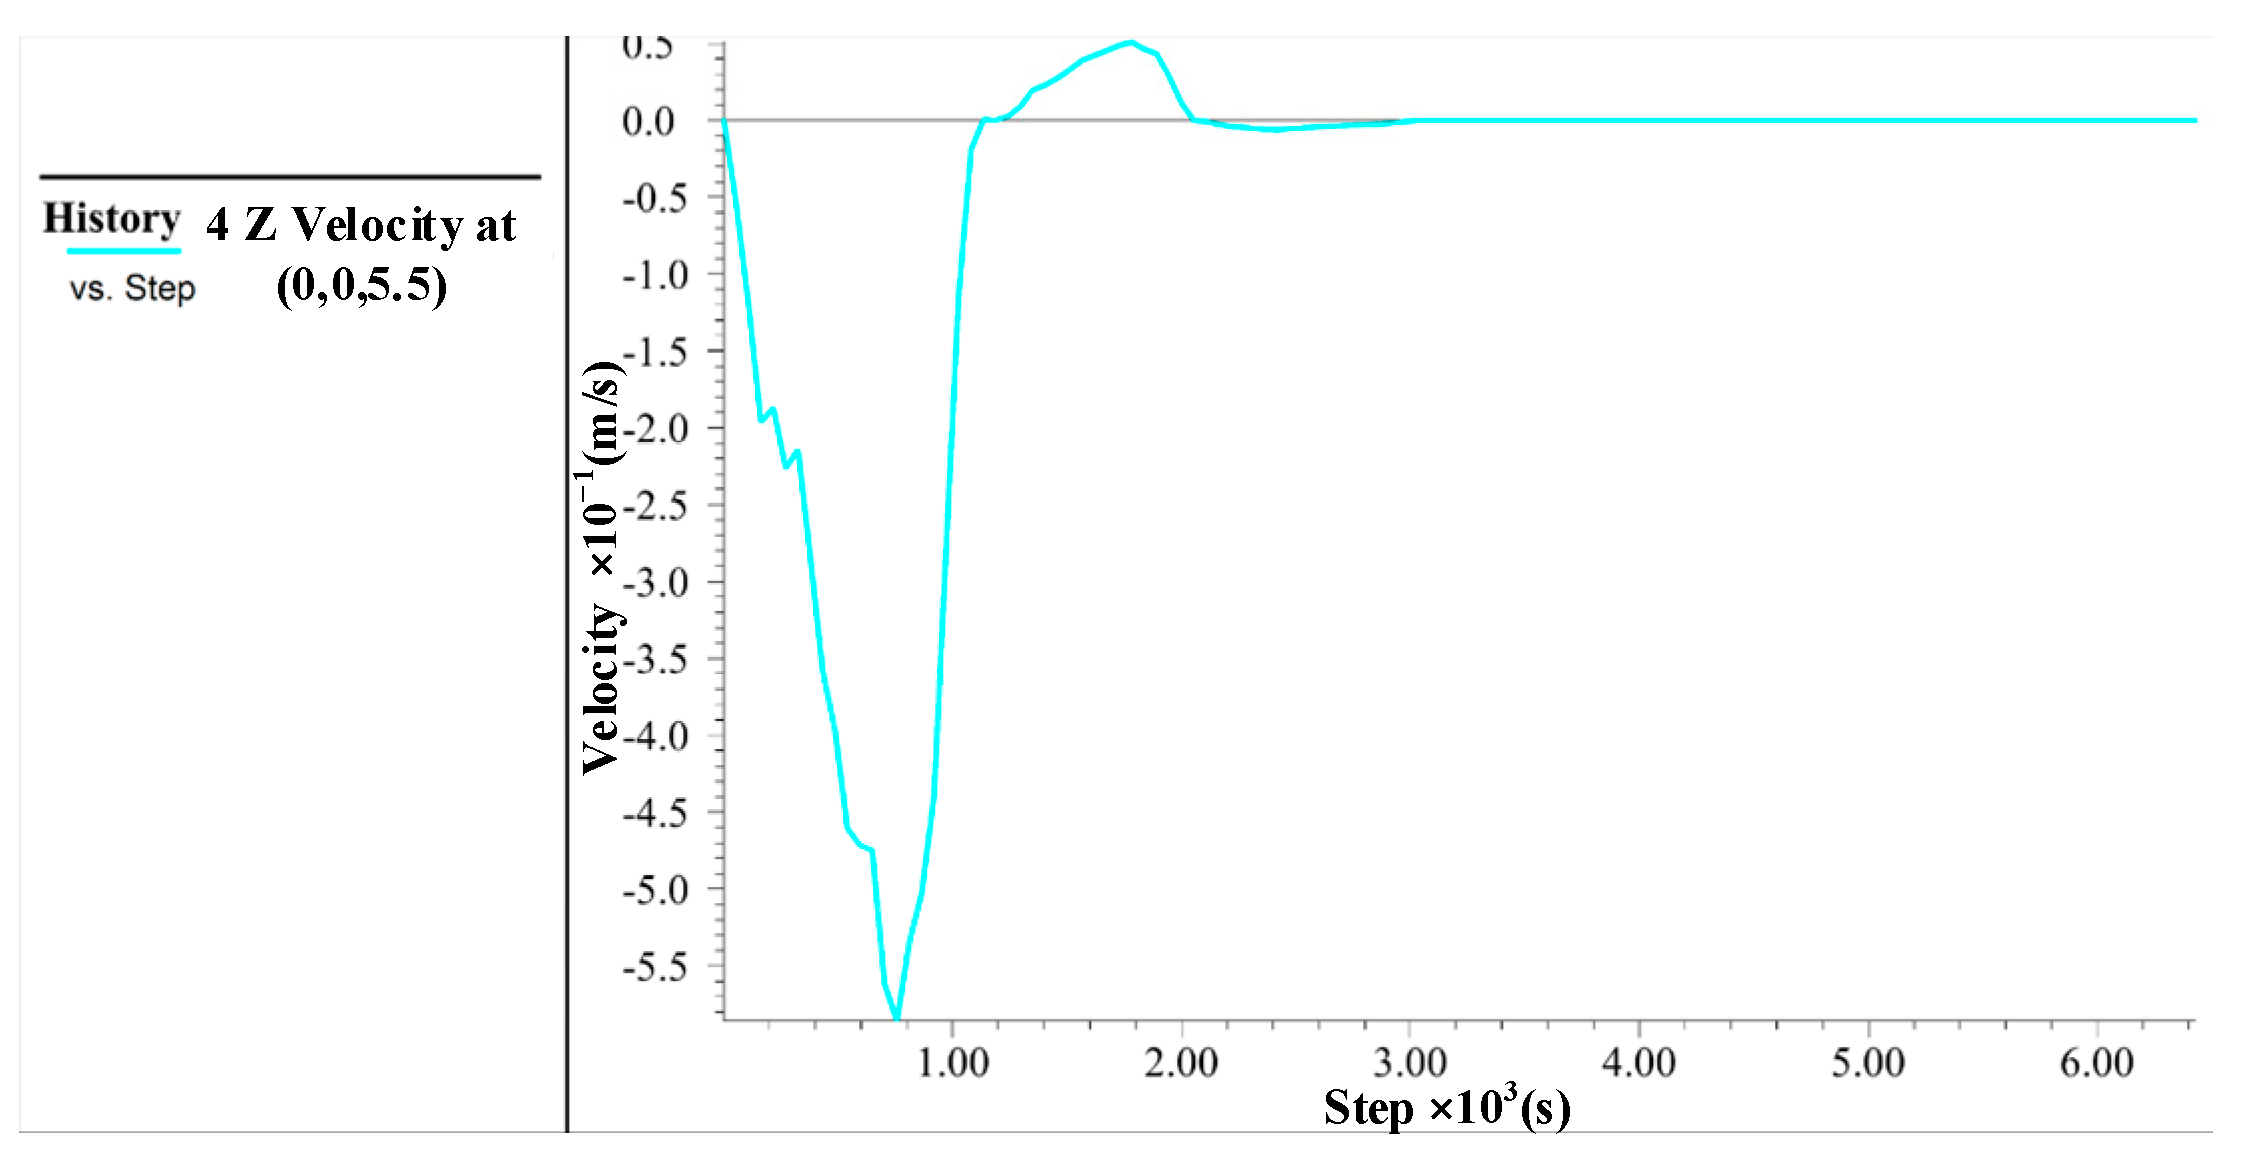
In Figure 9, it can be seen that the maximum unbalanced force ratio gradually tends to zero as the time steps increase, until finally the system reaches equilibrium under gravity. However, it is necessary to observe the changes in velocity and displacement in the model to ensure they converge to constants so as to further verify that the system has reached true equilibrium. The node at the bottom of the object was selected, and the time-step curves of its velocity and displacement in the z-direction were plotted, as shown in Figure 10 and Figure 11. It can be seen that as the time step increases, the velocity of the node at the bottom approaches zero and the displacement gradually approaches a constant, which shows that the system has reached true equilibrium.
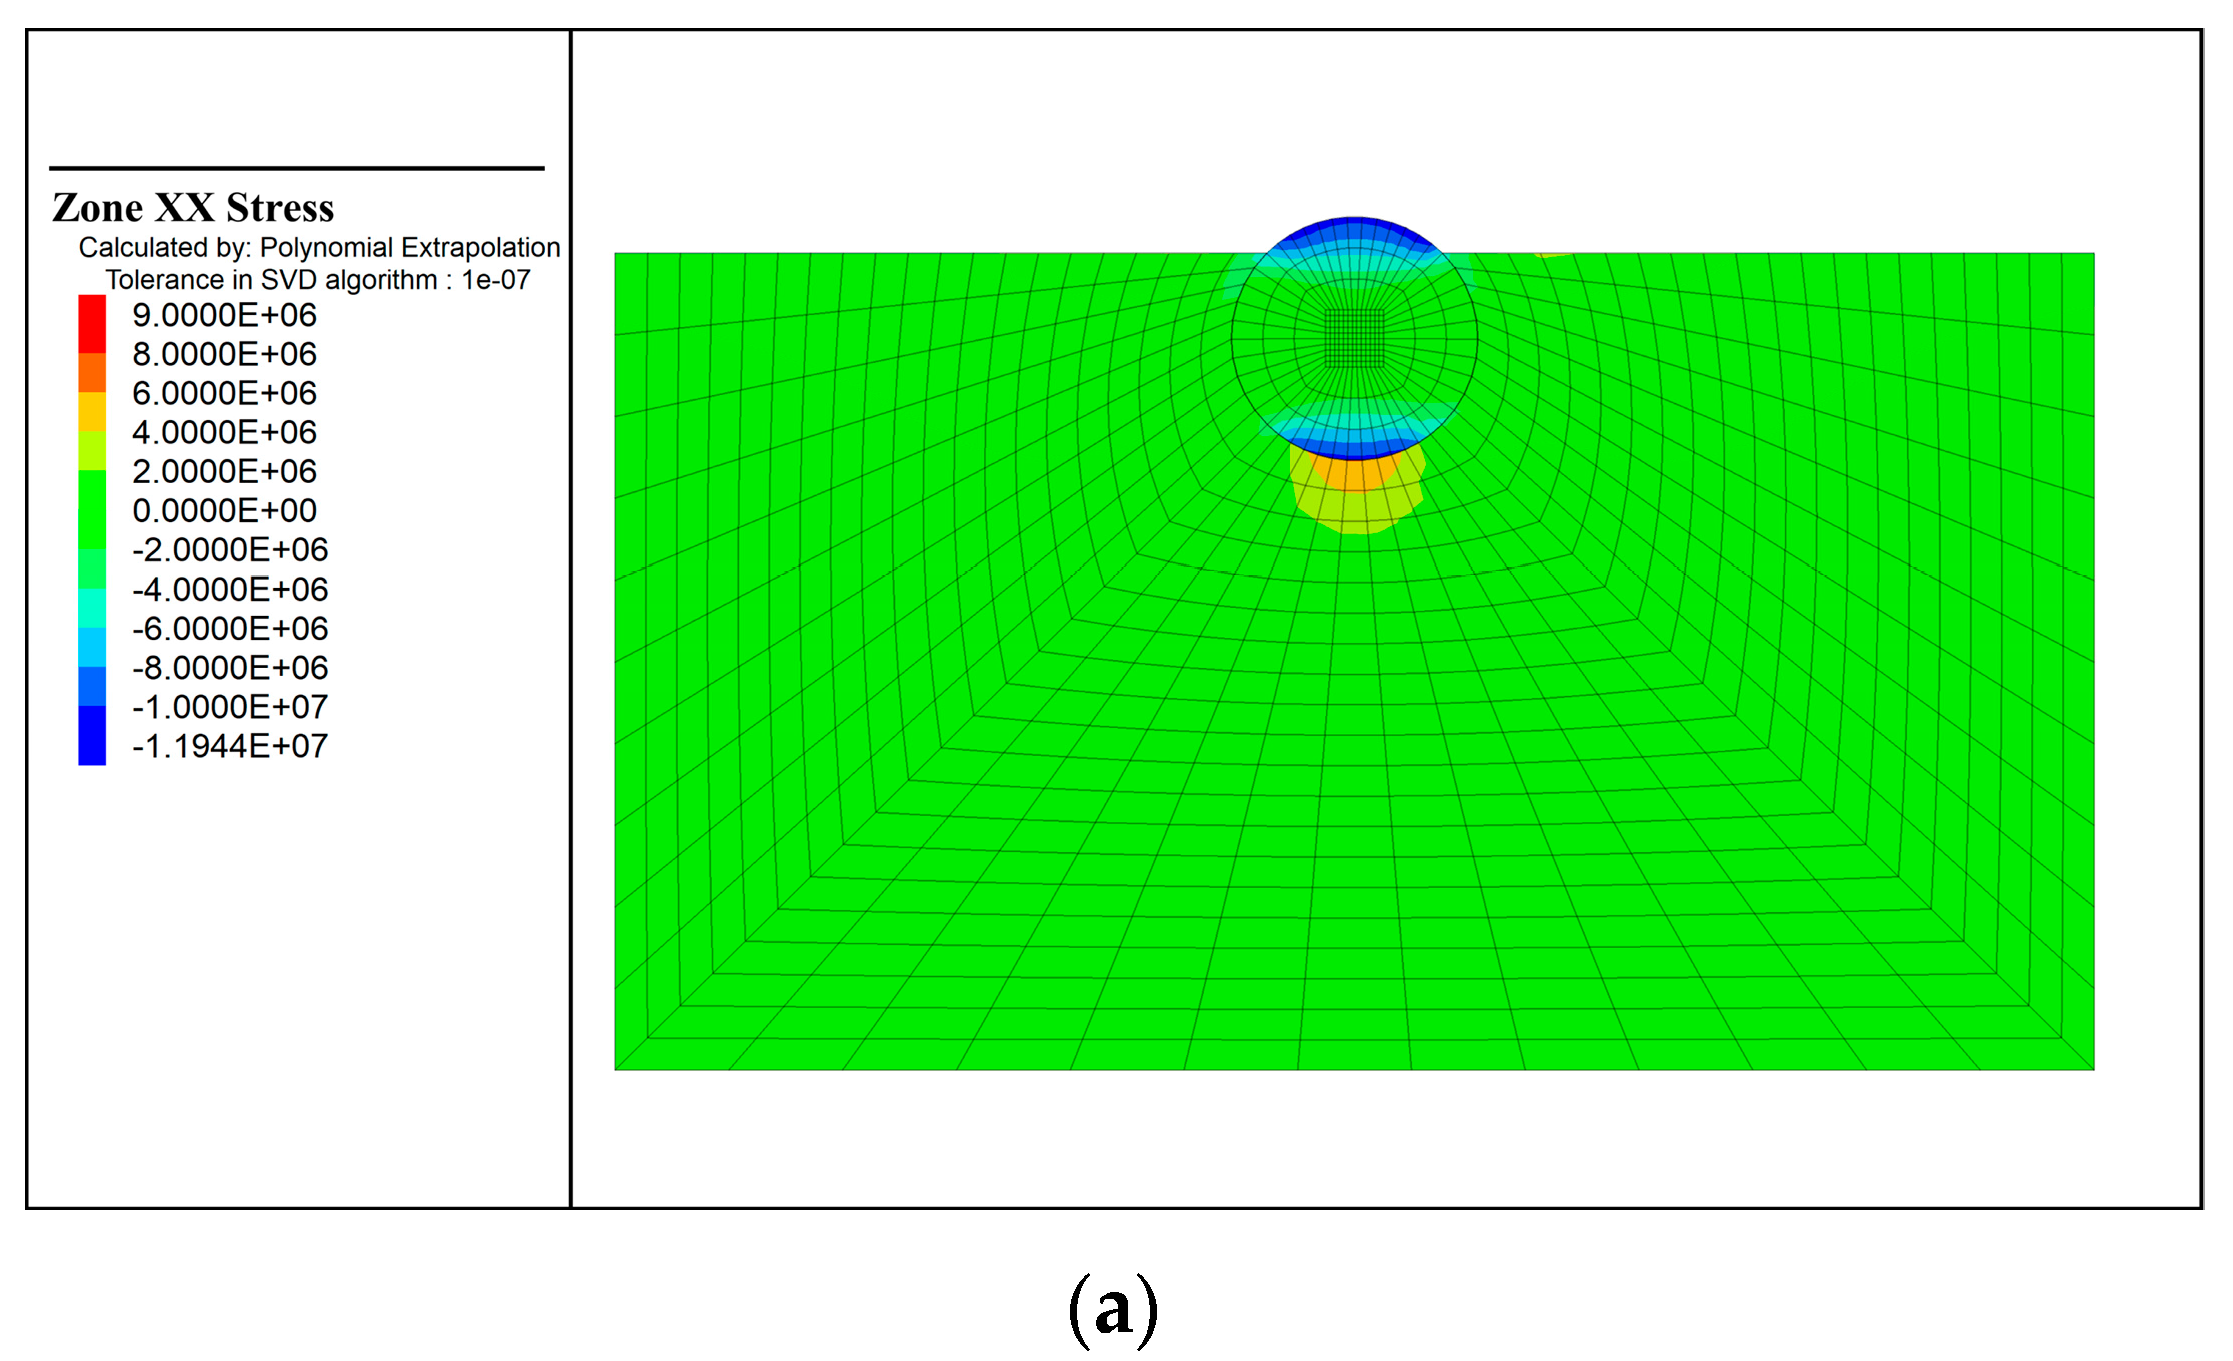
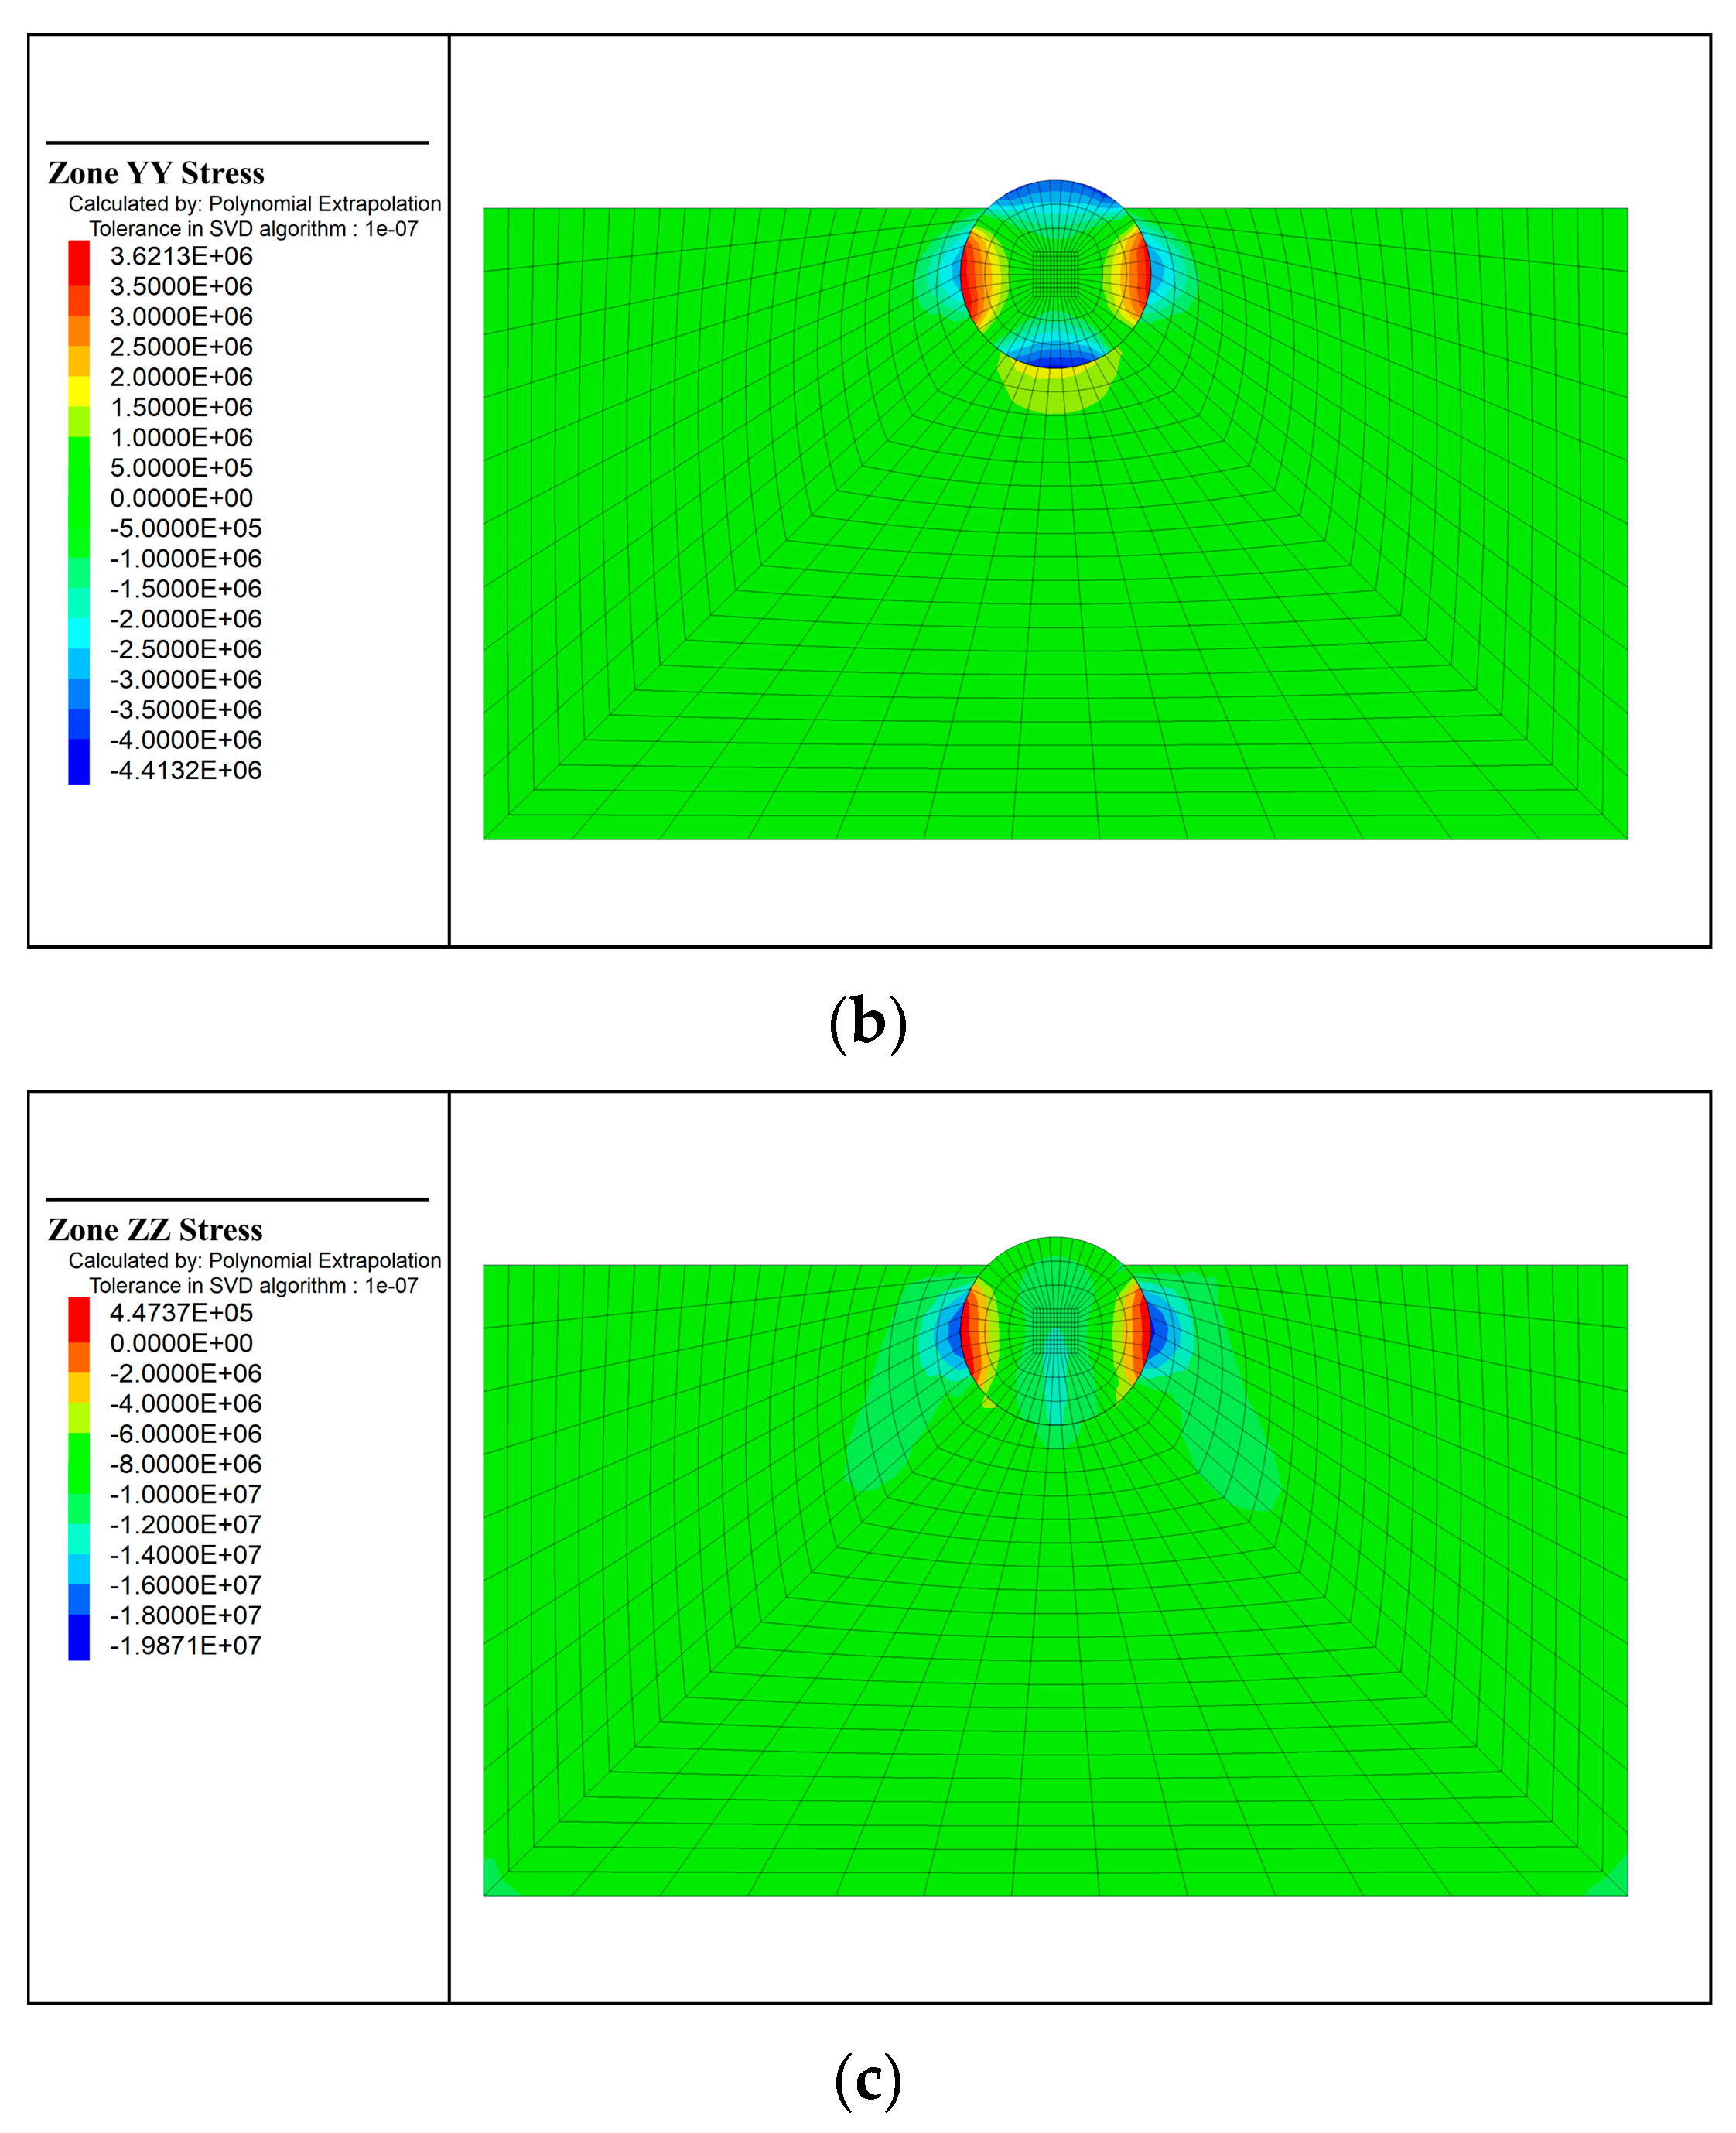
The initial stress of the system is shown in Figure 12. When the model reaches true equilibrium, the stress of the soil is consistent with the real situation.
The x- and y-directional stresses are nearly constant in most of the area, and the stress concentration occurs only on the top, bottom, and both sides of the object, as shown in Figure 12a,b. This is due to the gravity-produced displacement of the object in the negative direction of the z-axis and the lateral displacement of the soil close to the object under the effect of hydrostatic pressure. From the z-direction stress, it can be seen in Figure 12c that the stress concentration appears on both sides of the object. The reason for this is that the solid structure on top of the object is compressed by the weight of the soil on both sides. At this moment, the maximum compressive stress is 19.8 MPa.

3.3.2. Off-Mud Simulation

To investigate the effect of the depth in the mud, the salvage process can be divided into two stages. The first stage is from when the object starts to move upward until it is fully out of the mud; the second stage is from when the object is fully out of the mud until it is out of the water. Because this paper focuses on the salvage of the object from the mud, the x- and y-directional displacements are horizontal displacements, which have little influence on the salvage process; therefore, only the z-directional displacement of the object is discussed.
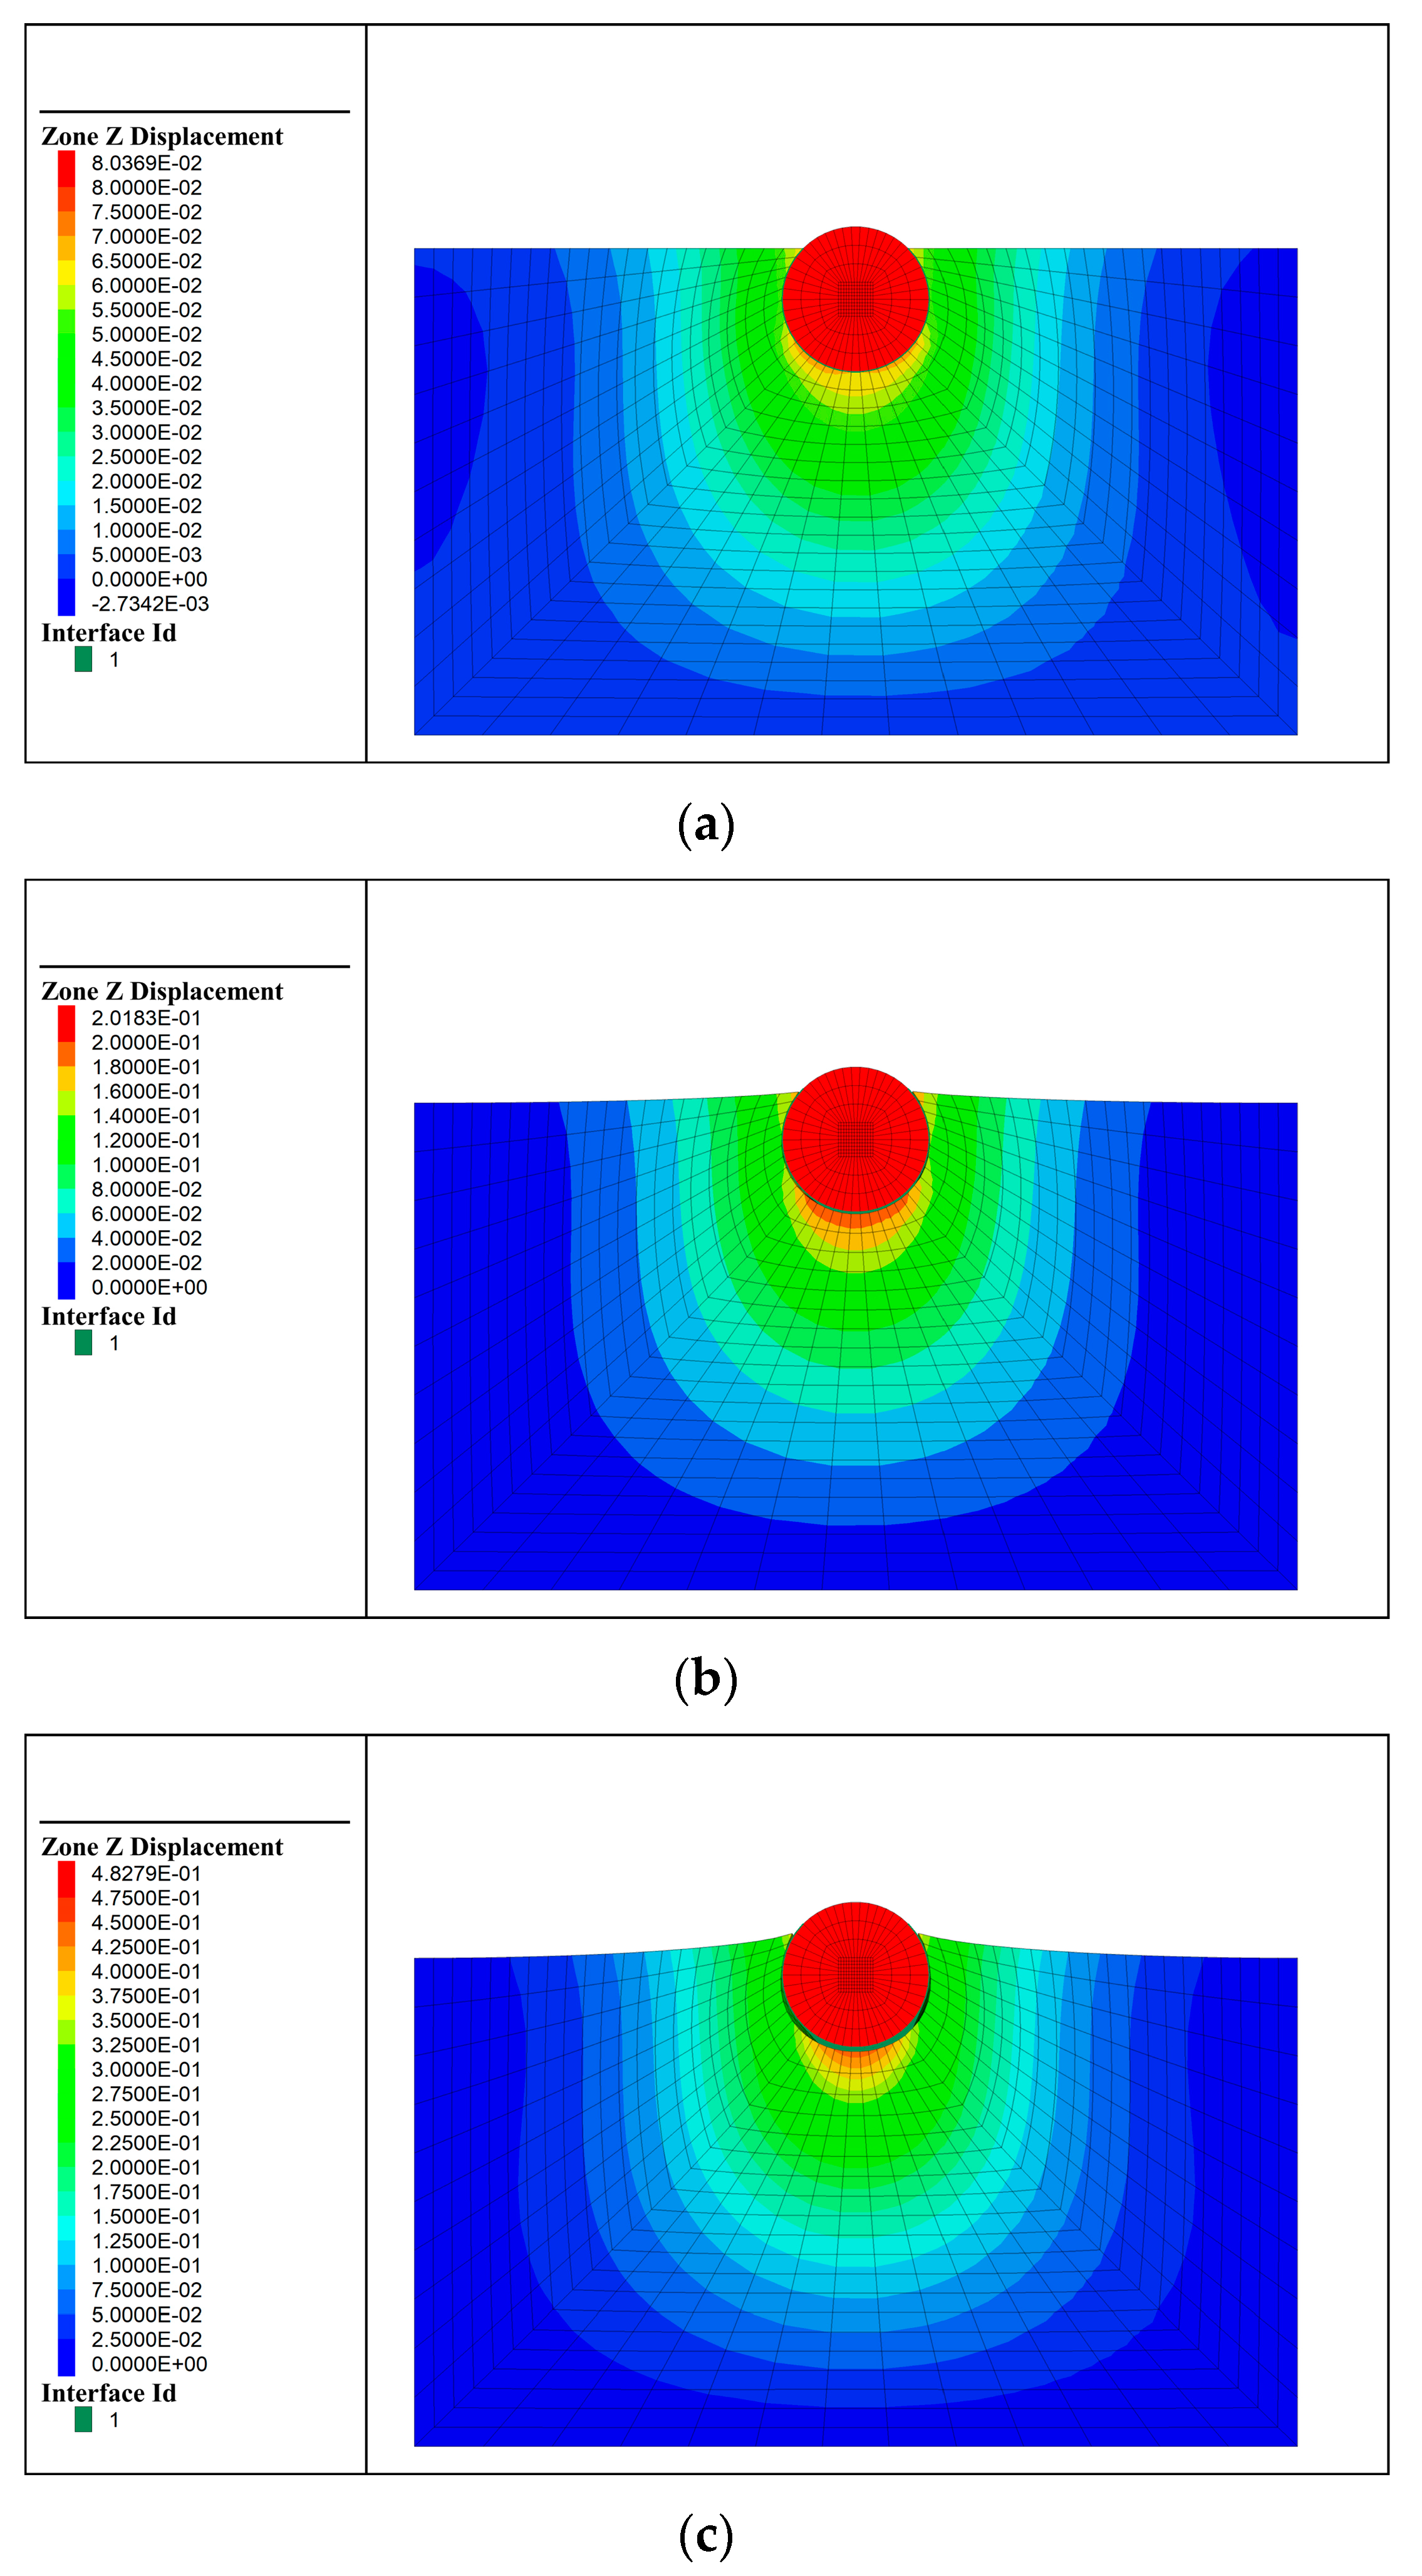
The simulation of the object moving out of the mud is shown in Figure 13. The object starts to move up, but the bottom of the object does not separate from the soil (no gap) because of the adsorption force of the silty soil under the action of the upward lifting force, as shown in Figure 13a. As shown in Figure 13b, the soil at the bottom is subjected to an upward tensile strain, and the tensile strain in the middle of the soil gradually increases, and the soil at the bottom is about to be separated. Figure 13c shows that as the upward tensile strain continues to increase, the soil close to the bottom of the object starts to separate from the object because of gravity, and a gap is produced. With an increase in the tensile strain, the gap extends until the mud is separated from the object. As illustrated in Figure 13d, it can be seen that at the beginning, the displacements of the object and the bottom soil are equal to each other. As the time increases, the bottom soil displacement becomes less than that of the object, and the gap is produced; this difference increases with time until the displacement of the mud stops increasing and the object is fully out of the mud.

4. Comparison and Modification of the Terzaghi Model

The Terzaghi model [28] can be used to describe the lifting force,
F t = 5 A τ f ( 1 + 0.2 d e d B ) ( 1 + 0.2 B L ) sin ( π A R 2 A P ) ,
where A is the horizontal projection area of the structure, τ f is the shear strength of the soil, and , B , and L are the burial depth, width, and length of the structure, respectively; A R is the contact area of the structure immersed in the soil and A P is the total surface area of the structure.

4.1. Comparison with FEA Results

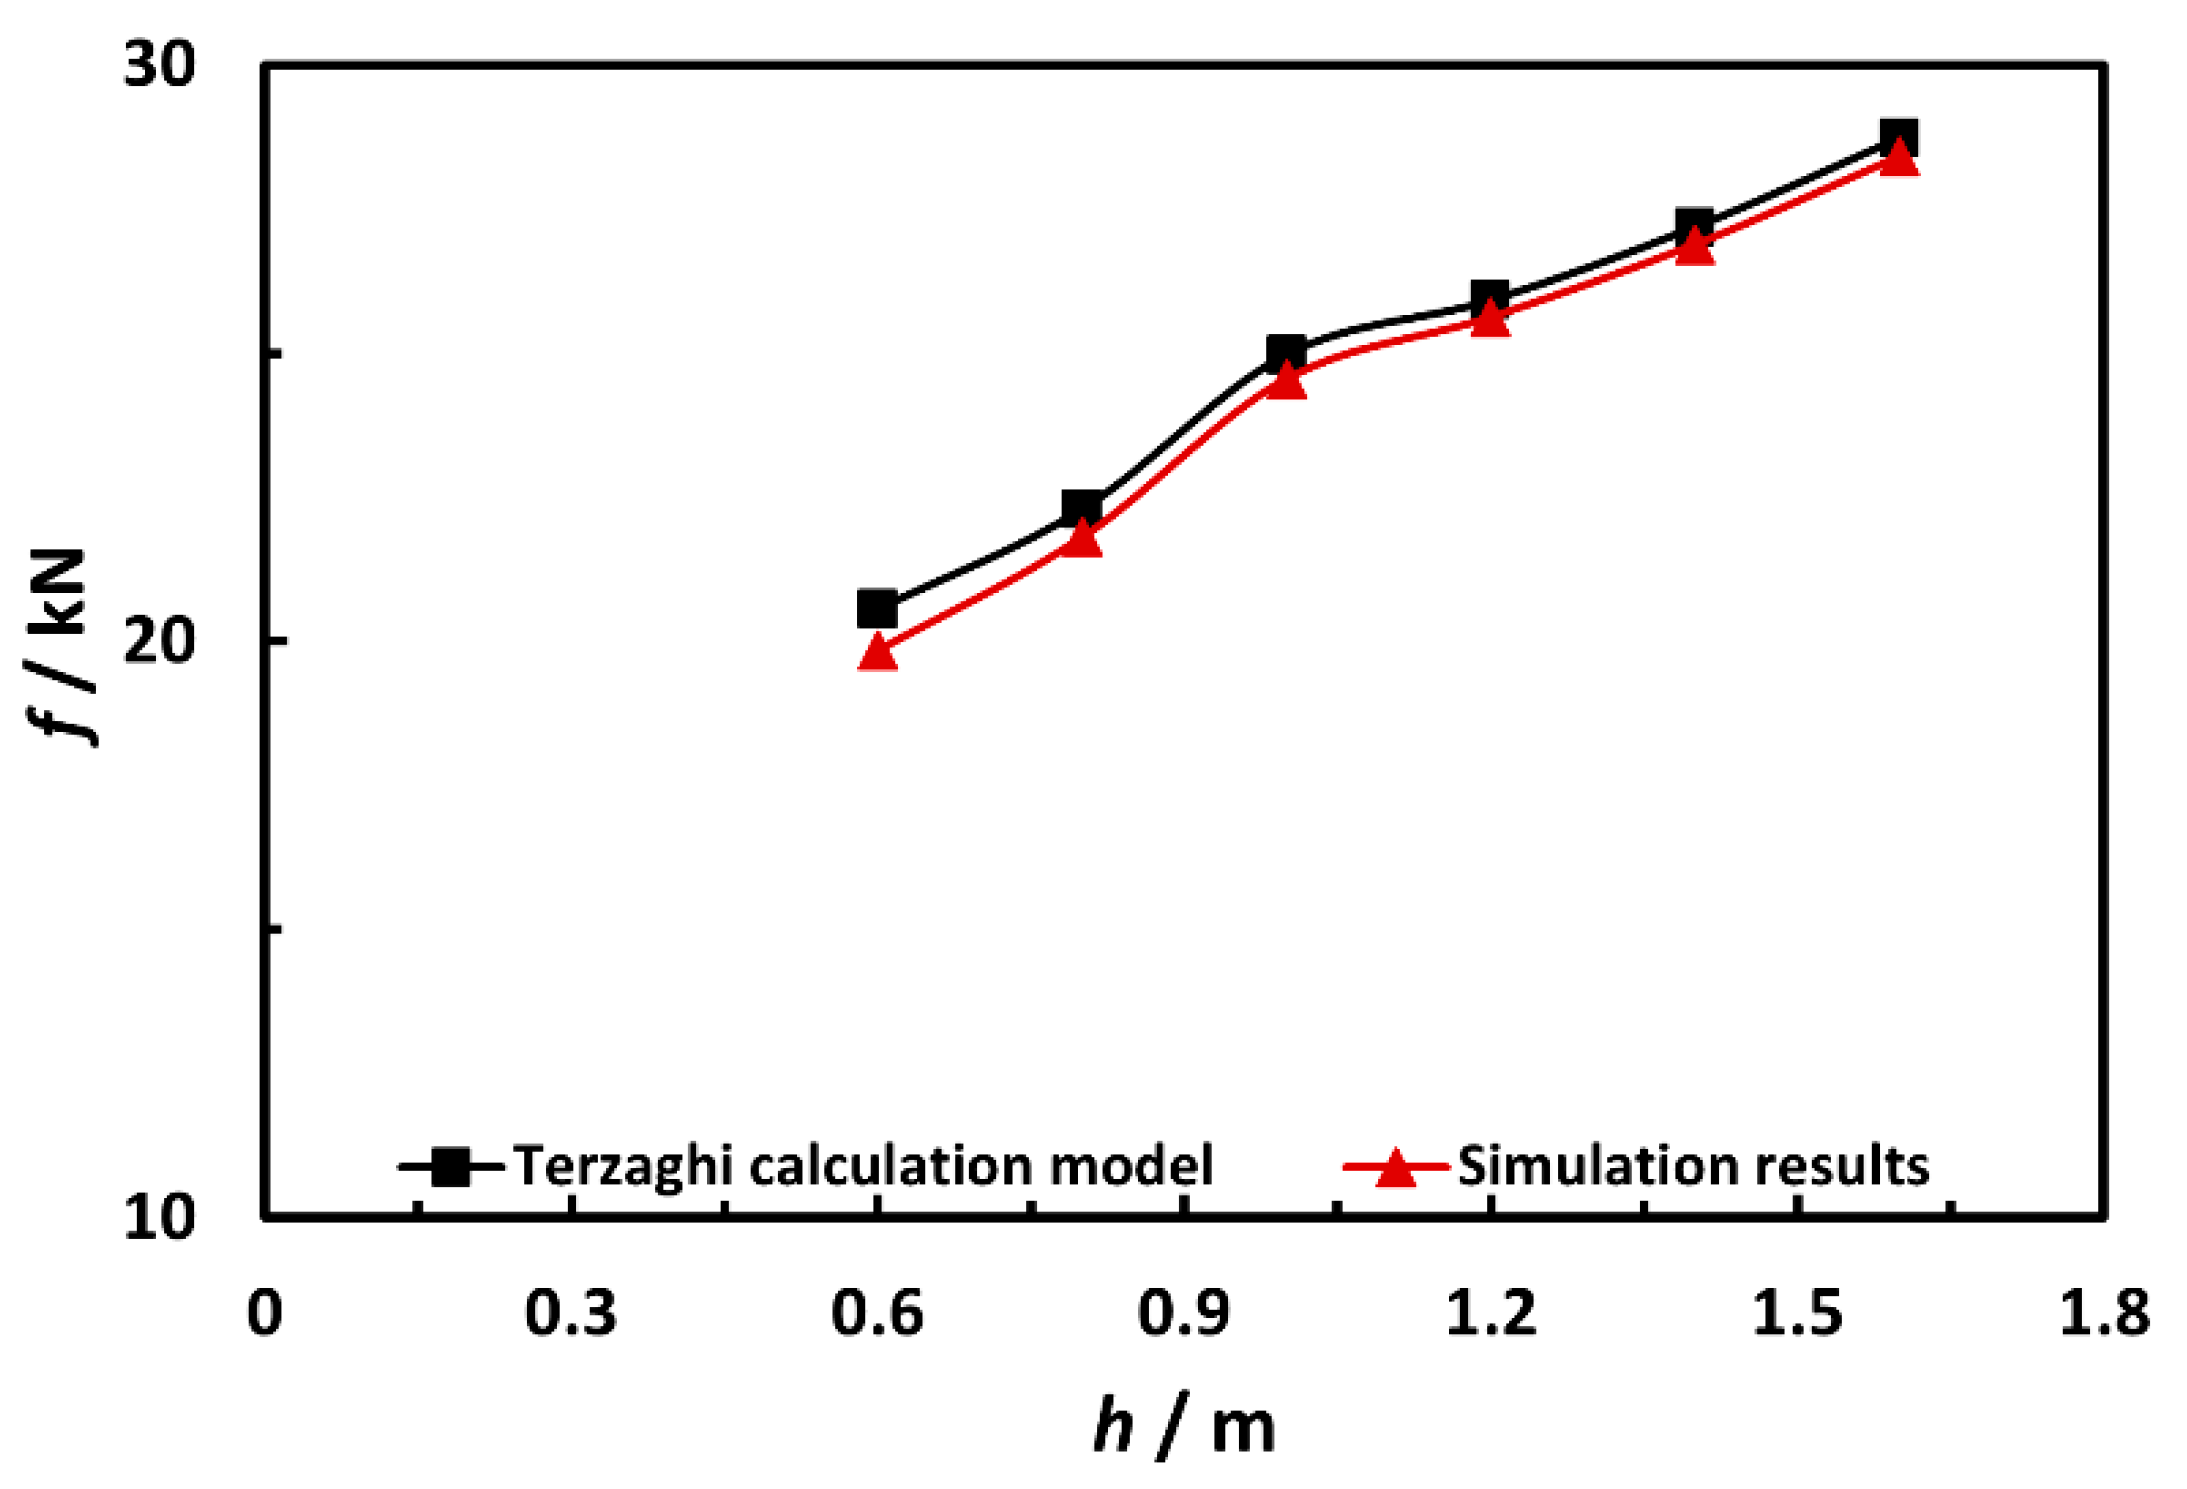
The Terzaghi model results were compared with the simulation results to verify the model errors, as shown in Figure 14. The trend of the Terzaghi results is consistent with the FEA results but slightly higher.

4.2. Normalized Terzaghi Model and Modification

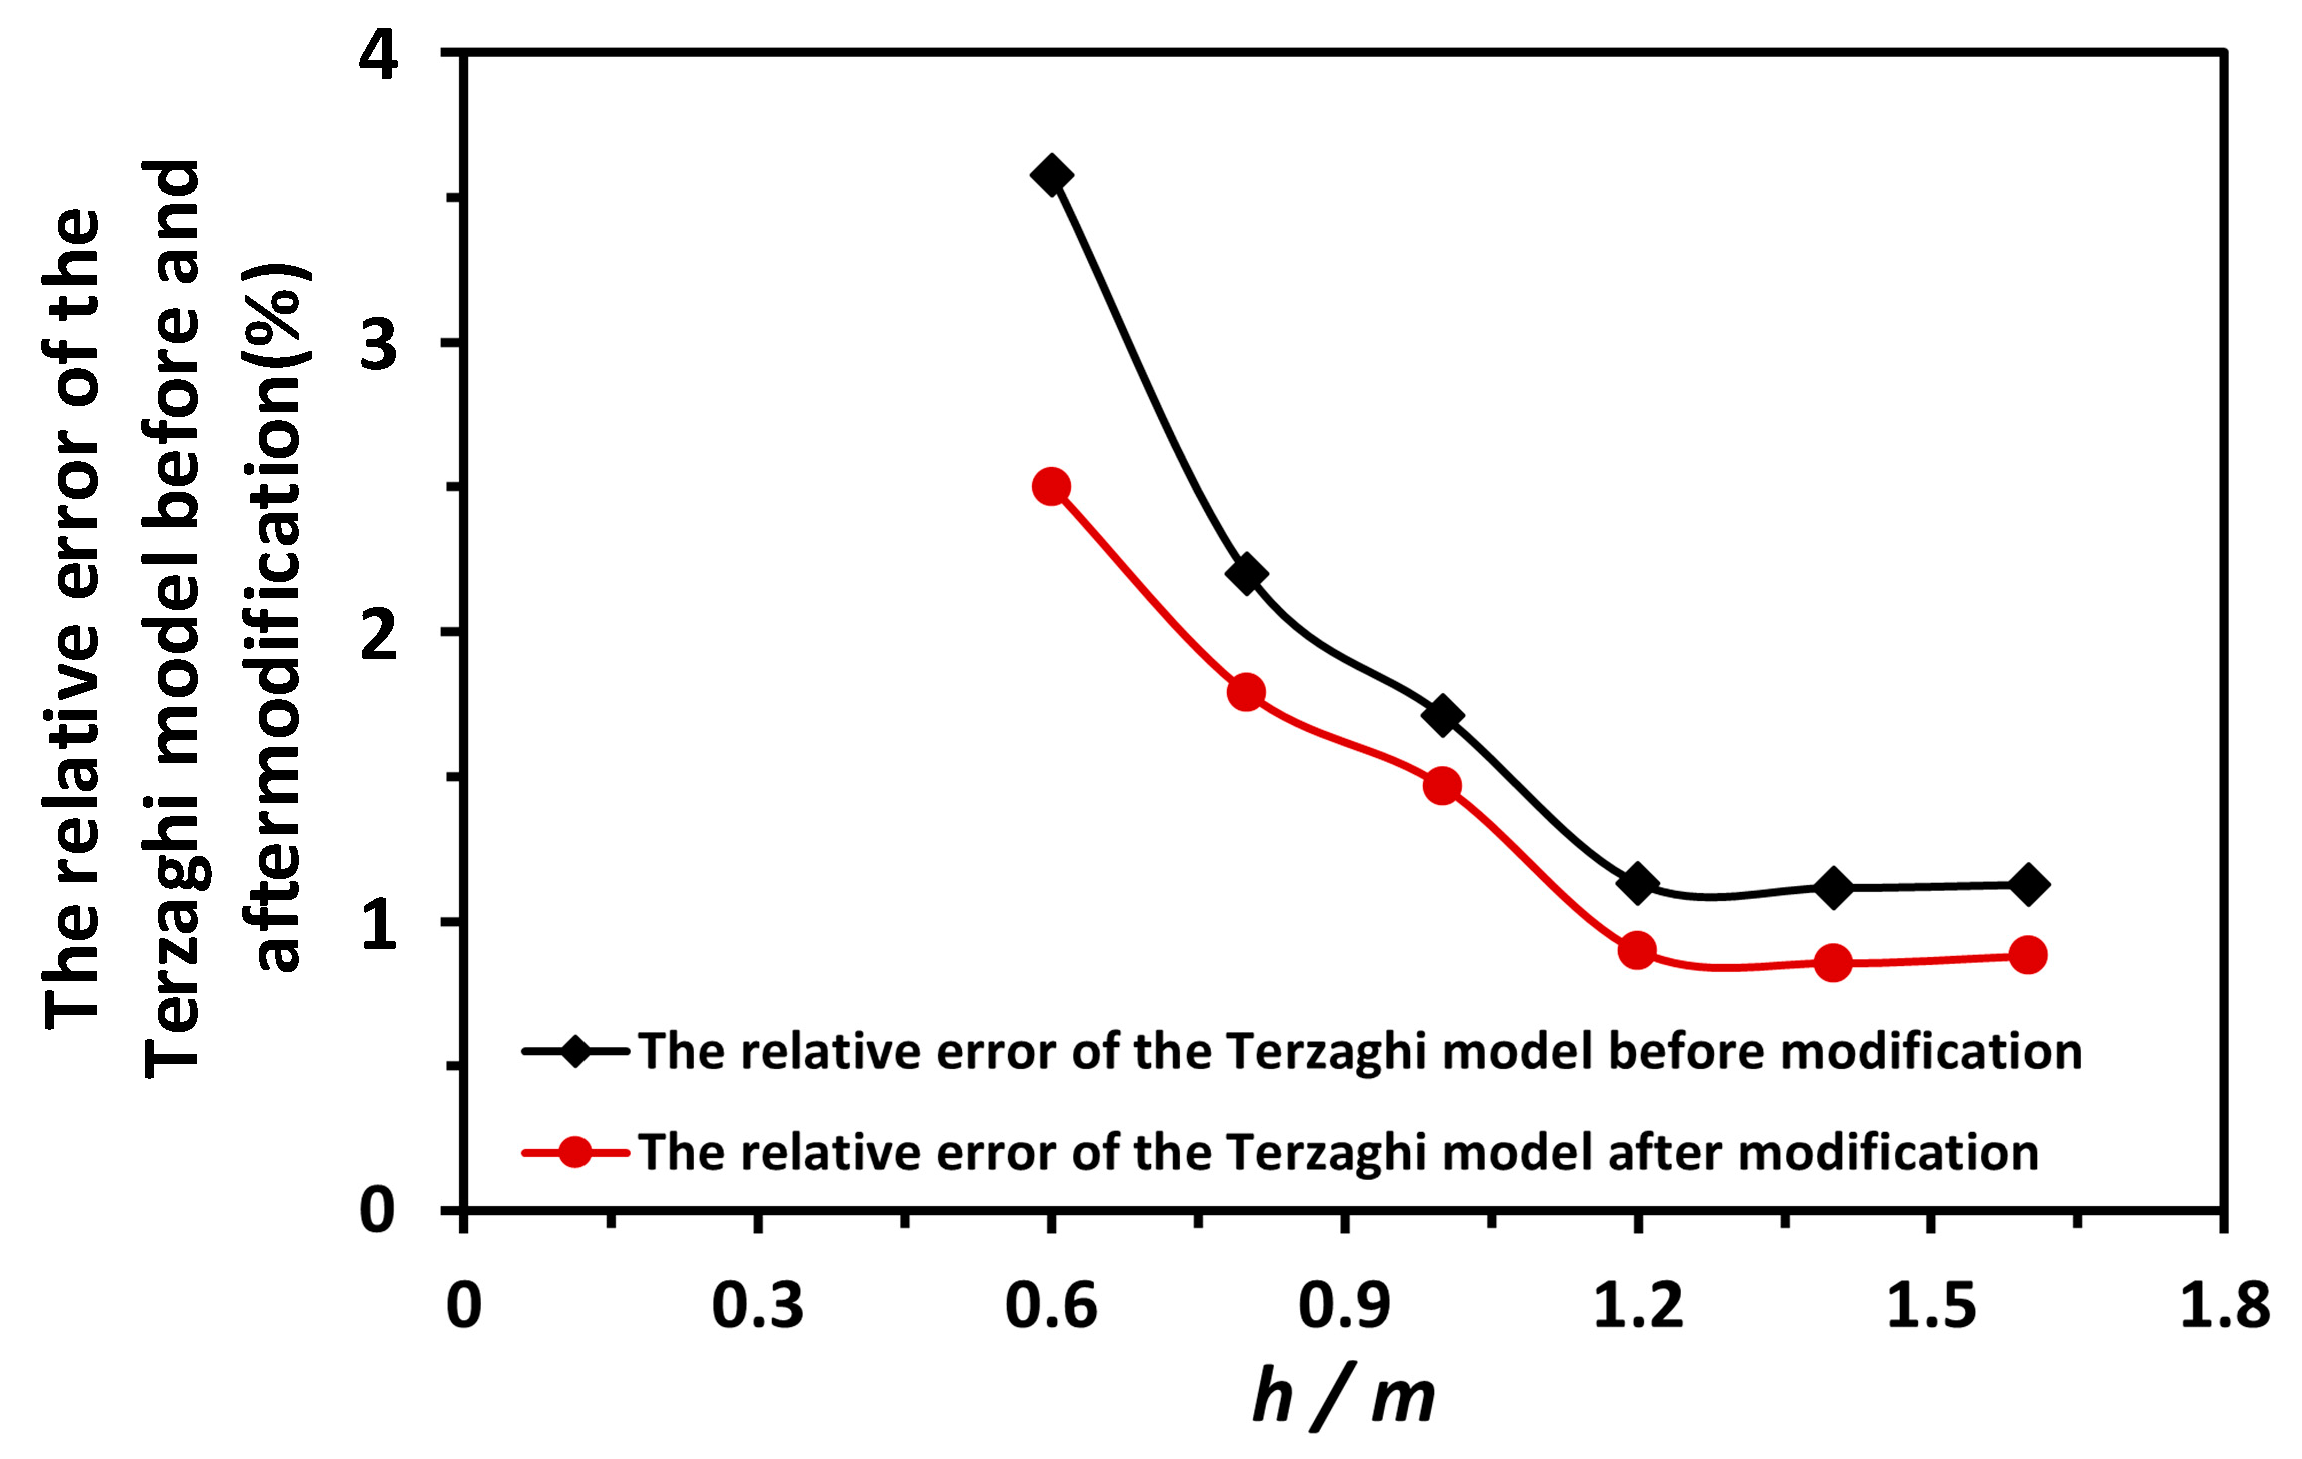
The relative error of the Terzaghi model and its comparison with the FEA results are plotted in Figure 15. The maximum relative error is 3.51%.
To improve the prediction errors, a normalized Terzaghi model is proposed, as set out below.
Define the nondimensional burial depth β, the nondimensional width γ, and the nondimensional burial surface λ, as:
β = d B γ = B L λ = A R A P .
The modification coefficient ψ, is defined as:
ψ = a ( 1 + b β ) .
Equation (12) can be rewritten as,
F t = ψ F t = 5 A τ f a ( 1 + b β ) ( 1 + 0.2 e B β e β ) ( 1 + 0.2 B L ) sin ( π A R 2 A P ) = 5 A τ f a ( 1 + b β ) ( 1 + 3.838 β e β ) ( 1 + 0.2 γ ) sin ( λ π 2 ) .
where a = 0.934 and b = 0.165.
The relative error of the normalized Terzaghi model after modification is plotted in Figure 15, and the maximum relative error after modification is 2.49%.

5. Time-Step Analysis

The static adsorption force can be accurately predicted using the improved Terzaghi model. When the speed is not sufficiently low, the Terzaghi model is less effective for adsorption force prediction. In this situation, the time-step simulation can be used.

5.1. Effects of Lifting Force and Burial Depth on Critical Displacement

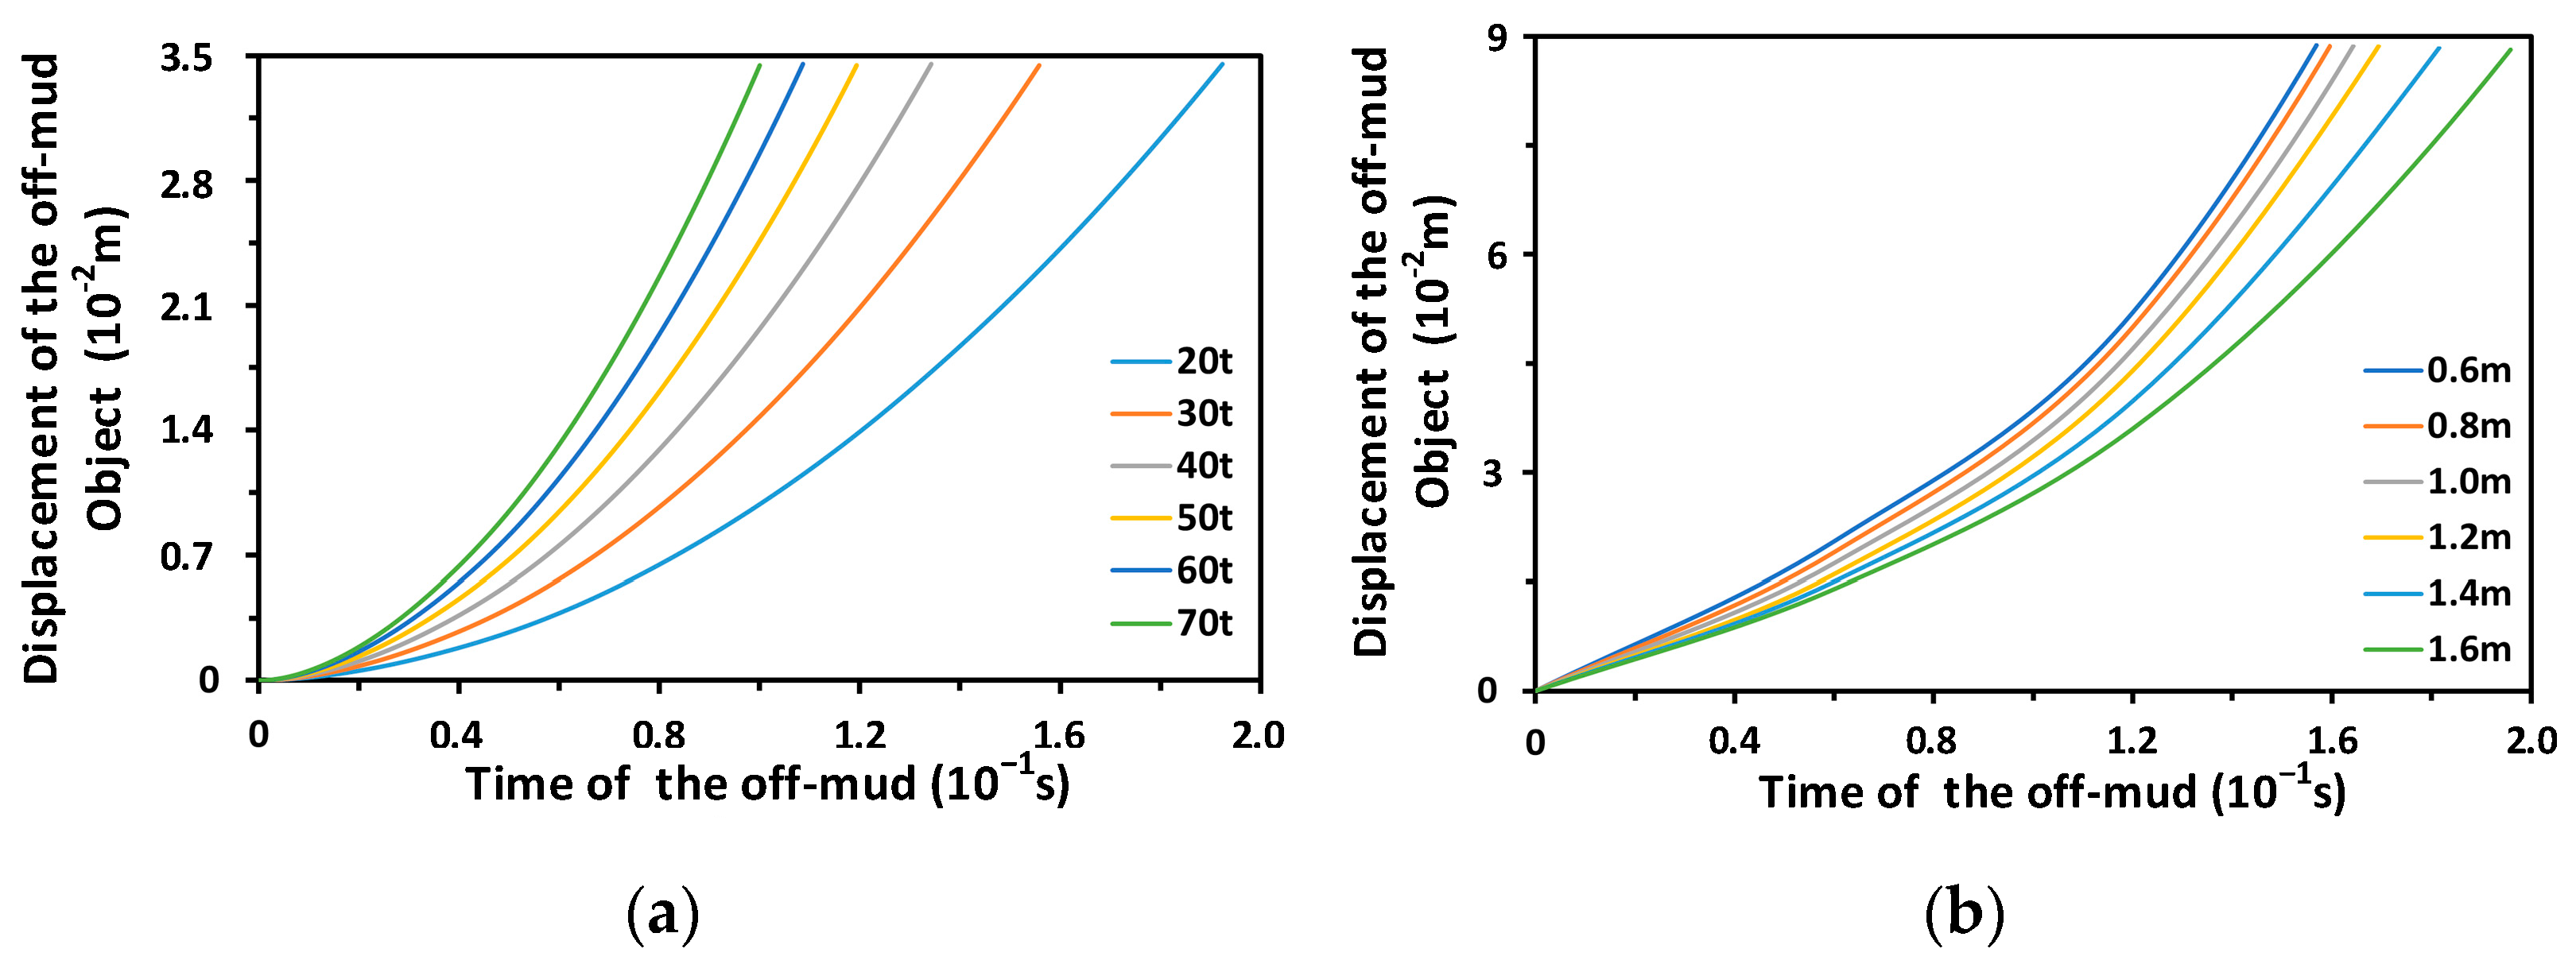
The critical displacement is the displacement that occurs when bottom separation occurs. As shown in Figure 16, a depth of 1.6 m and a lifting force of 50 t were used as reference parameters for the analysis, and these were selected according to a recent project requirement.
As shown in Figure 16a, the displacement of the object and the soil increases in a nonlinear way with lifting forces of 20 t, 30 t, 40 t, 50 t, 60 t, and 70 t. With increased lifting force, the critical displacement reduces slightly but does not linearly decrease. With a large lifting force and at the same burial depth, the separation occurs earlier. As shown in Figure 16b, an increase in burial depth with the same lifting force considerably increases the time taken for separation to occur.

5.2. Effects of Lifting Force and Burial Depth on Displacement

The displacements with different lifting forces are plotted in Figure 17a. With a large lifting force and the same burial depth, the displacement increases more quickly. Displacements with different burial depths are plotted in Figure 17b. The displacement increases more quickly when the burial depth is smaller, and vice versa.

5.3. Effects of Lifting Force and Burial Depth on Velocity

The velocity in the lifting process is plotted in Figure 18a, with lifting forces ranging from 20 t to 70 t. The velocity increases with time as the constant lifting forces are applied. With a large lifting force, the velocity increases much more quickly. The displacements with different burial depths and the same lifting force of 50 t are plotted in Figure 18b. The displacement increases with time. At a large burial depth, the velocity increases more slowly.

5.4. Effects of Lifting Force and Burial Depth on Soil Displacement

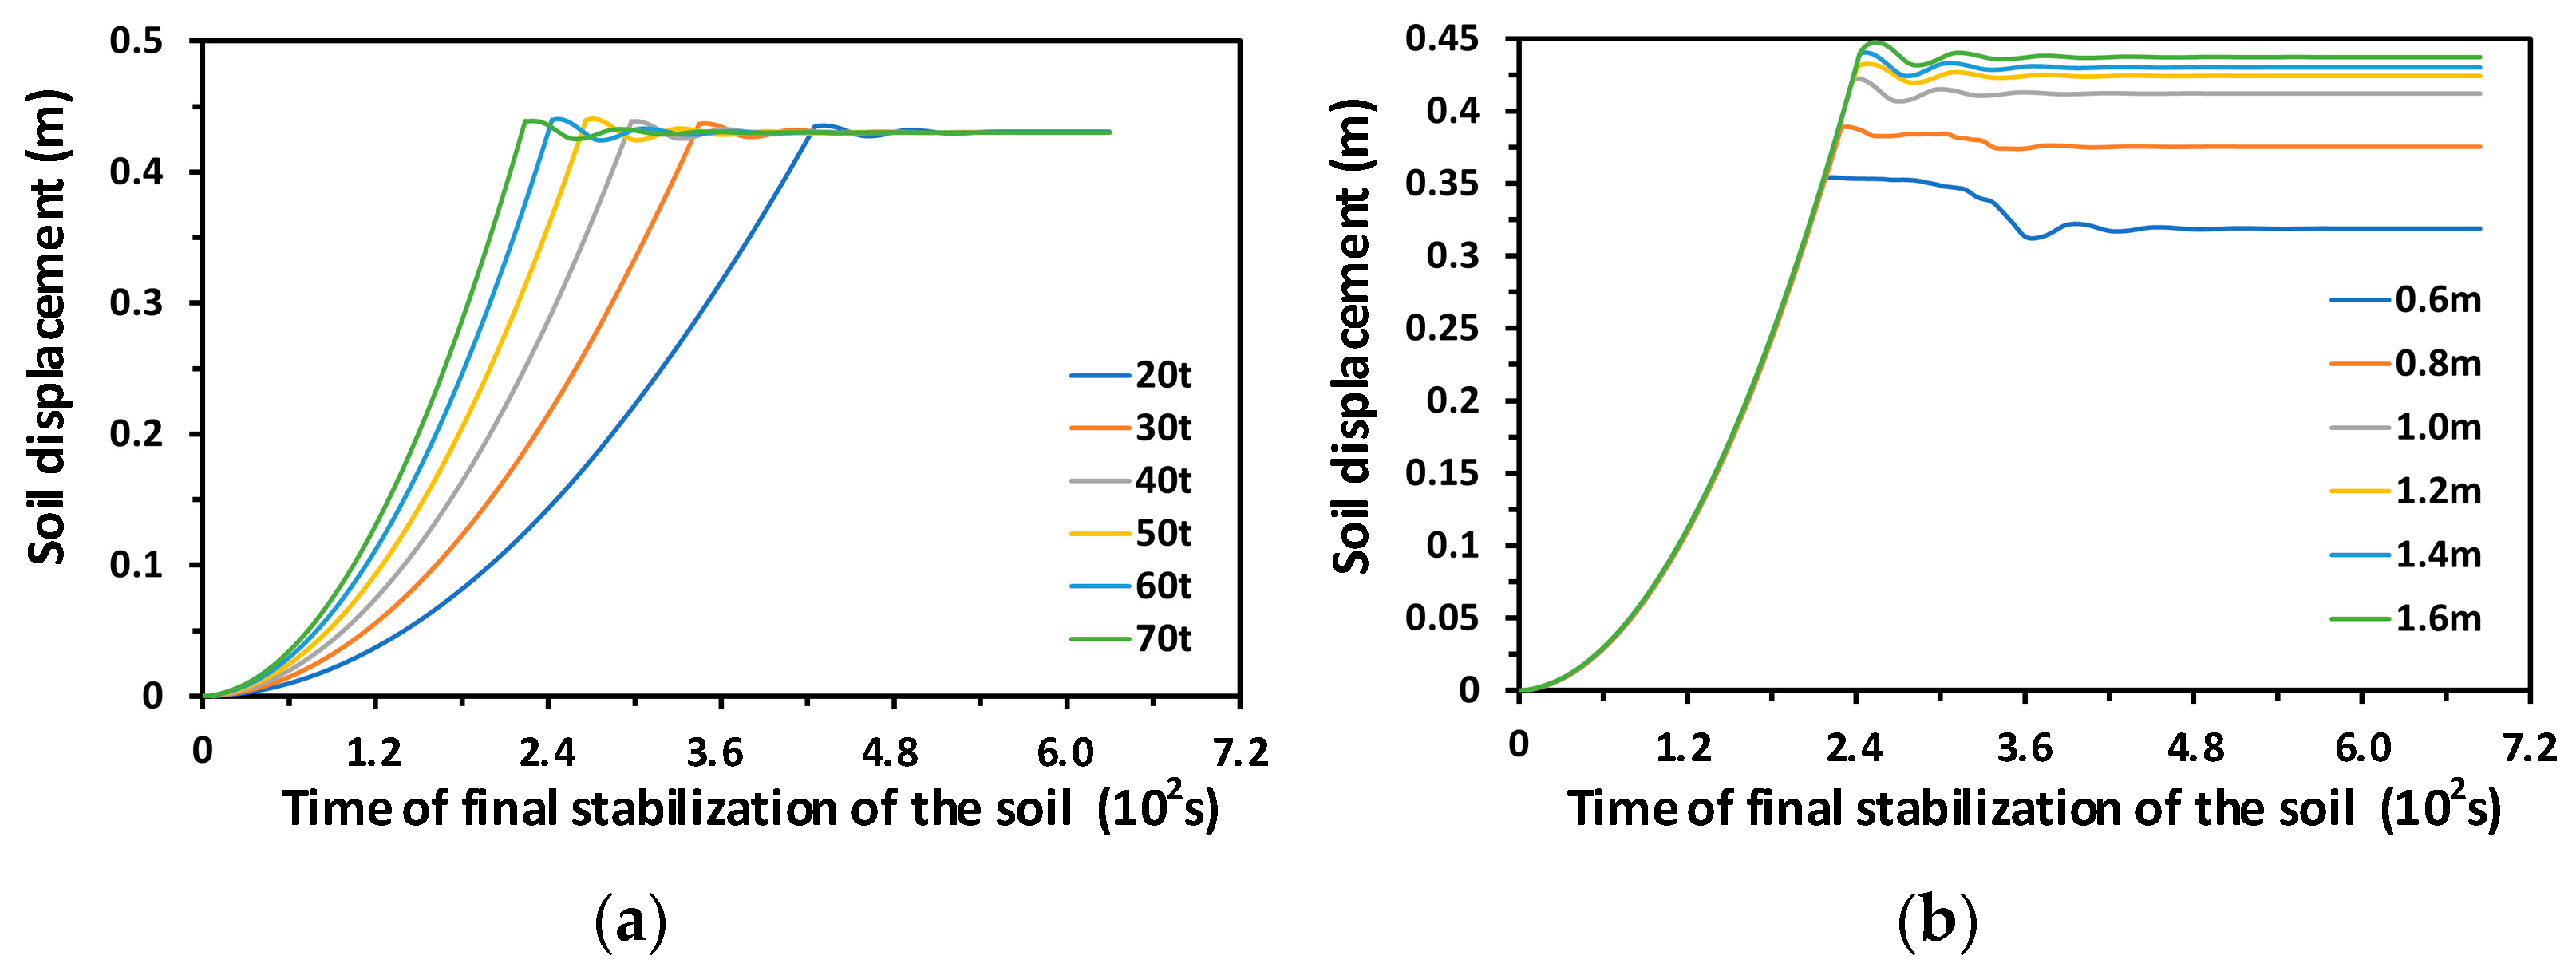
Bottom soil displacement increases when the object is lifted until it is fully separated from the soil and the off-mud process is complete.
Soil displacements with different lifting forces are plotted in Figure 19a. With a big lifting force and the same burial depth, the soil displacement stops increasing sooner, and the off-mud process is also completed earlier. When the burial depth is increased with the same lifting force, the maximum soil displacement increases. When the burial depth is decreased with the same lifting force, the displacement stops increasing slightly earlier, as shown in Figure 19b.

6. Conclusions

This paper proposes a normalized Terzaghi model that has been modified according to finite element analysis to predict the adsorption force of a cylindrical object for salvage from the seabed. The effects of the lifting force and burial depth are also analyzed using time-step finite element analysis. The following conclusions can be drawn:
  • The normalized Terzaghi model can be used to predict the adsorption force in the salvage of cylindrical objects. The maximum relative error is less than 2.49% compared with finite element analysis;
  • Time-step finite element analysis can be used to investigate the off-mud process with regard to the effects of the lifting force and burial depth;
  • With increased lifting force and the same burial depth, the critical displacement is reduced slightly, soil separation on the bottom of the object occurs earlier, the velocity increases more quickly, soil displacement on the bottom stops increases earlier, and the off-mud process is completed earlier;
  • With increased burial depth, the time required for soil separation is considerably increased, the velocity increases more slowly, the maximum soil displacement is increased, and the off-mud process takes longer.
The above-mentioned normalized Terzaghi model is only suitable for long cylindrical objects and cannot be used for objects with rectangular or triangular cross sections or for objects with section dimensions equal to their length, where the end effects are dominant.
In future research, the normalized Terzaghi model could be further improved with regard to the effects of the lifting velocity and force, and the model could be verified using time-step finite element analysis as well as experiments.

Equation Symbols List

σ 1 , σ 2 , σ 3 The three components of the generalized stress vector.
α 1 The material constants defined by the shear modulus and bulk modulus.
α 2 The material constants defined by the shear modulus and bulk modulus.
ε 1 , ε 2 , ε 3 The principal strains.
N φ The internal friction angle coefficient.
ϕ The angle of the internal friction.
c The cohesive force.
σ t The tensile strength.
N ψ The expansion angle coefficient.
ψ The expansion angle.
F n ( t + Δ t ) The normal force vector at the time of t + Δ t .
F s i ( t + Δ t ) The tangential force at the time of t + Δ t .
u n The absolute displacement of the interface node penetration into the target surface.
Δ u s i The relative shear displacement increment vector.
σ n The additional normal stress.
σ s i The additional tangential stress.
k s The tangential stiffness of the interface unit.
k n The normal stiffness of the interface unit.
A The area represented by the interface nodes.
F s max The tangential force.
c i f The interface cohesion.
φ i f The interface friction angle.
u The water pressure.
K The bulk modulus.
G The shear modulus.
Δ Z min The minimum dimension over the connection area in the normal direction of the interface.
k s The tangential stiffness.
k n The normal stiffness.
E Young’s modulus.
υ Poisson’s ratio.
AThe horizontal projection area of the structure.
τ f The shear strength of the soil.
d The burial depth.
B The width of the structure.
L The length of the structure.
A R The contact area of the structure immersed in the soil.
A P The total surface area of the structure.
βThe nondimensional burial depth.
γThe nondimensional width.
λThe nondimensional burial surface.
ψThe modification coefficient.

Author Contributions

Conceptualization, F.Y. and Y.N.; methodology, Y.N.; writing—original draft preparation, Y.N. and F.Y.; writing—review and editing, S.Y., L.W. and M.L.; validation, L.W. and S.Y.; supervision L.W.; funding acquisition, F.Y. All authors have read and agreed to the published version of the manuscript.

Funding

This research was funded by the Heilongjiang Provincial Natural Science Foundation of China (LH2021E046); Key R&D Program of Shandong Province (2021JMRH0302).

Institutional Review Board Statement

Not applicable.

Informed Consent Statement

Not applicable.

Data Availability Statement

Not applicable.

Acknowledgments

The authors gratefully acknowledge the financial support from the Heilongjiang Provincial Natural Science Foundation of China (LH2021*E046); Key R&D Program of Shandong Province (2021JMRH0302).

Conflicts of Interest

All the authors have read and approved this version of the article, and due care has been taken to ensure the integrity of the work. The authors have no conflict of interests to declare.

References

  1. Yan, Y.; Jin, H.; Zhang, Y.; Wang, J.; Guo, J. Statistical analysis of typical ship accidents in past 4 years and review of salvage equipment in China. In Proceedings of the 2019 5th International Conference on Transportation Information and Safety (ICTIS), Liverpool, UK, 14–17 July 2019. [Google Scholar] [CrossRef]
  2. Drazen, J.C.; Smith, C.R.; Gjerde, K.M.; Haddock, S.H.D.; Carter, G.S.; Choy, C.A.; Clark, M.R.; Dutrieux, P.; Goetze, E.; Hauton, C.; et al. Opinion: Midwater ecosystems must be considered when evaluating environmental risks of deep-sea mining. Proc. Natl. Acad. Sci. USA 2020, 117, 17455–17460. [Google Scholar] [CrossRef] [PubMed]
  3. Lee, M.; Jung, J.Y.; Park, K.C.; Choi, S.H. Environmental and economic loss analyses of the oil discharge from shipwreck for salvage planning. Mar. Pollut. Bull. 2022, 155, 111142. [Google Scholar] [CrossRef] [PubMed]
  4. Lee, H. Breakout of partially embedded objects from cohesive seafloor soils. In Proceedings of the Offshore Technology Conference, Houston, TX, USA, 29 April 1973. [Google Scholar] [CrossRef]
  5. Vesic, A.S. Breakout resistance of objects embedded in ocean bottom. J. Soil. Mech. Found. Div. 1971, 97, 1183–1205. [Google Scholar] [CrossRef]
  6. Ninomiya, K.; Tagaya, K.; Murase, Y. A study on suction breaker and scouring of a submersible offshore structure. In Proceedings of the The Third Annual Offshore Technology Conference, Houston, TX, USA, 18 April 1971; pp. 297–304. [Google Scholar] [CrossRef]
  7. Ninomiya, K.; Tagaya, K.; Murase, Y. A study on suction breaker and scouring of sit-on-bottom type offshore structure. In Proceedings of the The Fourth Annual Offshore Technology Conference, Houston, TX, USA, 30 April 1972; pp. 869–874. [Google Scholar] [CrossRef]
  8. Ninomiya, K.; Tagaya, K.; Murase, Y. A study on suction breaker and scouring of bottom-sitting offshore. J. Petrol. Technol. 1973, 25, 279–287. [Google Scholar] [CrossRef]
  9. Das, B.M. Model tests for uplift capacity of foundations in clay. Soil. Found. 1978, 18, 17–24. [Google Scholar] [CrossRef] [PubMed]
  10. Das, B.M.; Shin, E.C.; Dass, R.N. Suction force below plate anchors in soft clay. Mar. Georesour. Geotec. 1994, 12, 71–81. [Google Scholar] [CrossRef]
  11. Das, B.M. Behavior of a shallow plate anchor in clay under sustained loading. Mar. Georesour. Geotec. 1995, 13, 417–428. [Google Scholar] [CrossRef]
  12. Sawicki, A.; Mierczynski, J. Mechanics of the breakout phenomenon. Comput. Geotech. 2003, 30, 231–243. [Google Scholar] [CrossRef]
  13. Zhou, X.; Chow, Y.; Leung, C. Numerical modeling of break out process of objects lying on the seabed surface. Comput. Geotech. 2008, 35, 686–702. [Google Scholar] [CrossRef]
  14. Sui, J. Study on Adsorption Power of Submersible Structure from Sediment. Master’s Thesis, Dalian University of Technology, Dalian, China, 2009. [Google Scholar]
  15. Hu, Y. Analysis of the Mechanism of Excavation Resistance of Special Shape Falling Object. Master’s Thesis, Harbin Engineering University, Harbin, China, 2018. [Google Scholar]
  16. Meyerhof, S. Engineering Properties of Nuclear Technical, Report NO.3-699, Report 2; U.S. Army Engineer Water Ways Experiment Station: Vicksburg, MI, USA, 1965. [Google Scholar]
  17. Qiu, C.; Zhang, Q.; Yan, P.; Ji, Y. Experimental study of adhesion of clay. Rock Soil Mech. 2017, 5, 67–72. [Google Scholar] [CrossRef]
  18. Jin, G.; Jin, T.; Chen, X.; Zhang, Z.; Luo, D. Experimental Research on Breakout Force of Embeded Objects from Sediments. J. Nav. Acad. Eng. 1998, 3, 49–53. [Google Scholar]
  19. Han, L.; Jiang, M.; Zhang, R. Experiment Simulation of Absorption Force of Marine Structure Caisson. Port. Eng. Technol. 2009, 46, 43–45. [Google Scholar]
  20. Fang, T.; Liu, G.; Ye, G.; Pan, S.; Shi, H.X.; Zhang, L. Field Test on Buoyancy Variation of a Subsea Bottom-Supported Foundation Model. J. Mar. Sci. Eng. 2019, 7, 143. [Google Scholar] [CrossRef]
  21. Karmakar, T.; Sekhar, G.P. Lifting a large object from an anisotropic porous bed. Phys. Fluids 2016, 28, 093601. [Google Scholar] [CrossRef]
  22. Davie, J.; Sutherland, H. Uplift resistance of cohesive soils. J. Geotech. Eng. Div. 1977, 103, 935–952. [Google Scholar] [CrossRef]
  23. Cong, X.; Ren, L.; Chen, B. Study on Soil Adhesion Phenomenaby Chemical Adsorption. Trans. Chin. Soc. Agric. Eng. 1996, 12, 40–44. [Google Scholar]
  24. Michalski, J. Parametric Method Applicable in Calculating Breakout Force and Time for Lifting Axisymmetric Objects from Seabed. Pol. Marit. Res. 2019, 26, 147–152. [Google Scholar] [CrossRef]
  25. Michalski, J. Parametric Method Applicable in Assessing Breakout Force and Time for Lifting Slender Bodies from Seabed. Pol. Marit. Res. 2020, 27, 69–75. [Google Scholar] [CrossRef]
  26. FLAC3D Base Commands. Available online: http://docs.itascacg.com/flac3d700/flac3d/docproject/source/flac3dhome.html (accessed on 20 January 2023).
  27. Chen, Y.; Xu, D. FLAC/FLAC3D Basic and Engineering Examples, 2nd ed.; China Water and Power Press: Beijing, China, 2013; pp. 143–146. [Google Scholar]
  28. Ma, J.; Yang, G.; Li, T. Study on Breakout Force of Embedded Objects from Seabed. China Offshore Platf. 2007, 2, 16–19. [Google Scholar]
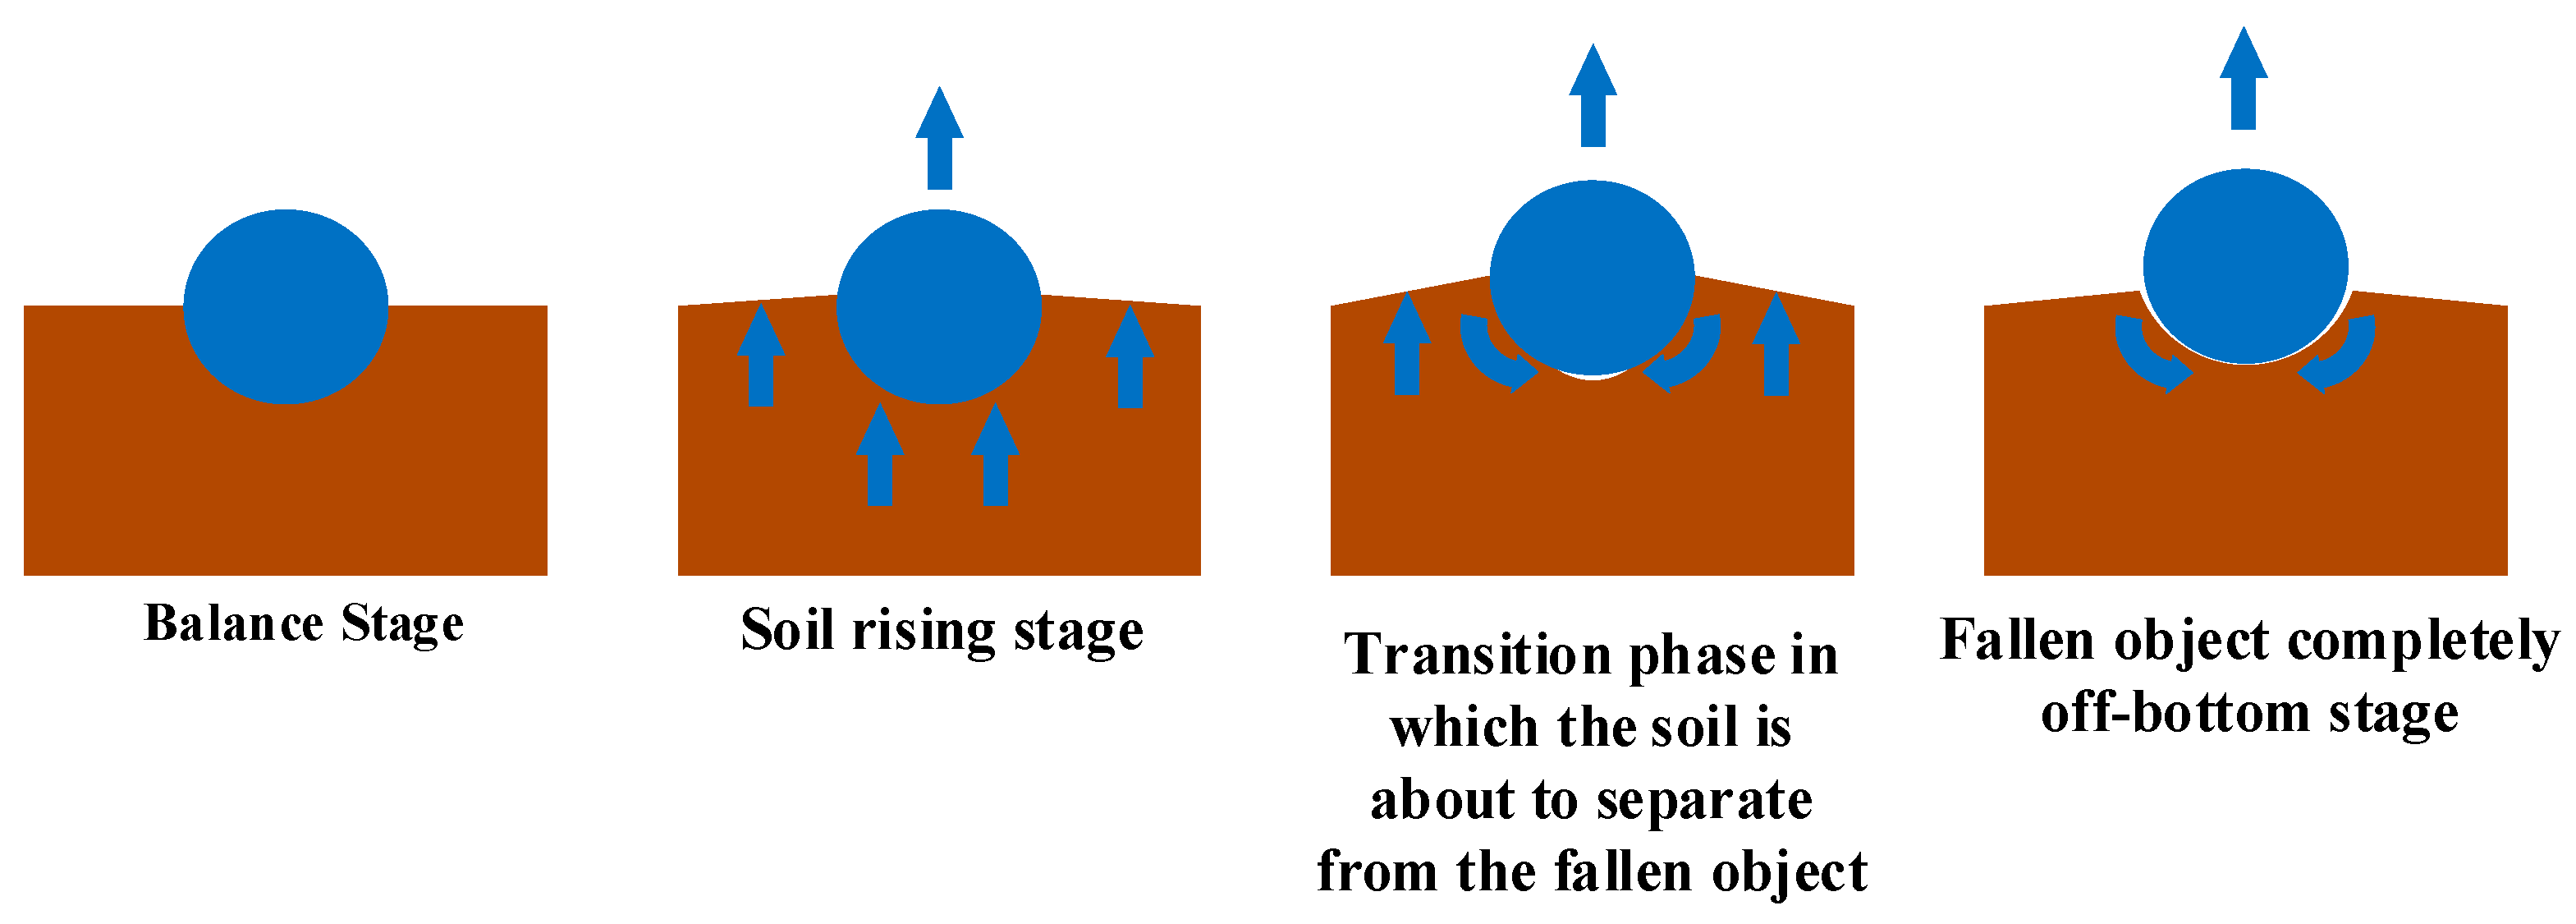
Figure 1. Schematic diagram of the fallen object and soil movement trend.
Machines 11 00245 g001
Figure 2. Mohr–Coulomb failure guidelines.
Machines 11 00245 g002
Figure 3. Definition domain of the laws of the Mohr–Coulomb model.
Machines 11 00245 g003
Figure 4. Interface node-related area distribution.
Machines 11 00245 g004
Figure 5. Schematic diagram of the interface unit principle.
Machines 11 00245 g005
Figure 6. Schematic diagram of the minimum dimensions in the normal direction of the interface.
Machines 11 00245 g006
Figure 7. Silty soil and object model.
Machines 11 00245 g007
Figure 8. Flowchart of the simulated solution process.
Machines 11 00245 g008
Figure 9. Maximum unbalanced force.
Machines 11 00245 g009
Figure 10. Nodal velocity at the bottom of the object.
Machines 11 00245 g010
Figure 11. Node displacement at the bottom of the object.
Machines 11 00245 g011
Figure 12. Initial stress field: (a) x-directional stress in the initial equilibrium; (b) y-directional stress in the initial equilibrium; and (c) z-directional stress in the initial equilibrium.
Machines 11 00245 g012aMachines 11 00245 g012b
Figure 13. Initial stress field: (a) without gap phase; (b) transition phase; (c) with gap phase; and (d) the displacement curves of the object and bottom soil.
Machines 11 00245 g013aMachines 11 00245 g013b
Figure 14. Validation of simulation results.
Machines 11 00245 g014
Figure 15. The relative error of the Terzaghi model before and after modification.
Machines 11 00245 g015
Figure 16. Effects of lifting force and burial depth on the critical displacement of the object before separation: (a) burial depth, 1.6 m; (b) lifting force, 50 t.
Machines 11 00245 g016
Figure 17. Displacement with different lifting forces and burial depths: (a) burial depth, 1.6 m; (b) lifting force, 50 t.
Machines 11 00245 g017
Figure 18. Effects of lifting force and burial depth on velocity: (a) burial depth, 1.6 m; (b) lifting force, 50 t.
Machines 11 00245 g018
Figure 19. Displacement of the soil at the bottom with different lifting forces and burial depths: (a) burial depth, 1.6 m; (b) lifting force, 50 t.
Machines 11 00245 g019
Table 1. Interface parameters.
Cohesion c
(Pa)
Friction Angle φ
(°)
Tangential Stiffness k n
(Pa)
Normal Stiffness k s
(Pa)
5.6 × 10 3 2.16 1 × 10 8 1 × 10 8
Table 2. The parameters of the silty soil.
Density (kg/m3)Bulk Modulus (Pa)Shear Modulus (Pa)Cohesion (kPa)Friction Angle (°)Tensile Strength
(Pa)
1290 6.7 × 10 7 3.1 × 10 7 7.0 2.7 1 × 10 8
Table 3. Parameters of the object.
Density (kg/m3)Bulk Modulus (Pa)Shear Modulus (Pa)Diameter
(m)
Length
(Pa)
3002 7.03 × 10 10 2.70 × 10 10 2 14
Table 4. Simulation envelope of the soil.
Length
(m)
Width
(m)
Height
(m)
14126
Disclaimer/Publisher’s Note: The statements, opinions and data contained in all publications are solely those of the individual author(s) and contributor(s) and not of MDPI and/or the editor(s). MDPI and/or the editor(s) disclaim responsibility for any injury to people or property resulting from any ideas, methods, instructions or products referred to in the content.