Abstract
A laser projection positioning technique for large composite production based on a scanning galvanometer is proposed in this paper. First, based on the projecting model of the scanning galvanometer, a solution is proposed for the problem which includes pose calculations of the galvanometer projection and autocorrection technology. Then, according to the solution of the perspective-n-point (PNP) problem in the control software for the pose of the scanning galvanometer relative to the projection object, an improved genetic algorithm is proposed to optimize the results of calculating the pose. Meanwhile, to account for the tangential distortion caused by the perturbation between the scanning galvanometer and the projected object during the actual manufacturing process, the projection pattern is corrected by the perspective transform method, thus ensuring the accuracy of the projection. Eventually, in order to evaluate the proposed method, a general scheme of the projection positioning system is designed, and software is developed for the projection device relative to the pose calibration of the composite material mold and projection image correction. Following that, 3D printing model projection experiment and the large composite layup projection positioning tests are conducted with the experimental prototype of the projection positioning system. The result of the 3D printing model projection experiment shows that the calculating accuracy of the relative pose based on the improved adaptive genetic algorithm achieves 0.0007 mm, which is superior to the 1.115 mm accuracy of the solution of photographing the target with the camera. In addition, after a small deformation of the mold in the actual working conditions, the influence of the target localization point in the PNP problem in 2D and 3D coordinates on the algorithm is compared, and the optimized errors are respectively scaled to 2 mm and 0.2 mm. These numerical simulations and experimental results in working conditions show that the proposed method has high accuracy, high robustness, and fast astringency, and it provides a candidate for projection positioning of large composite material layups.
1. Introduction
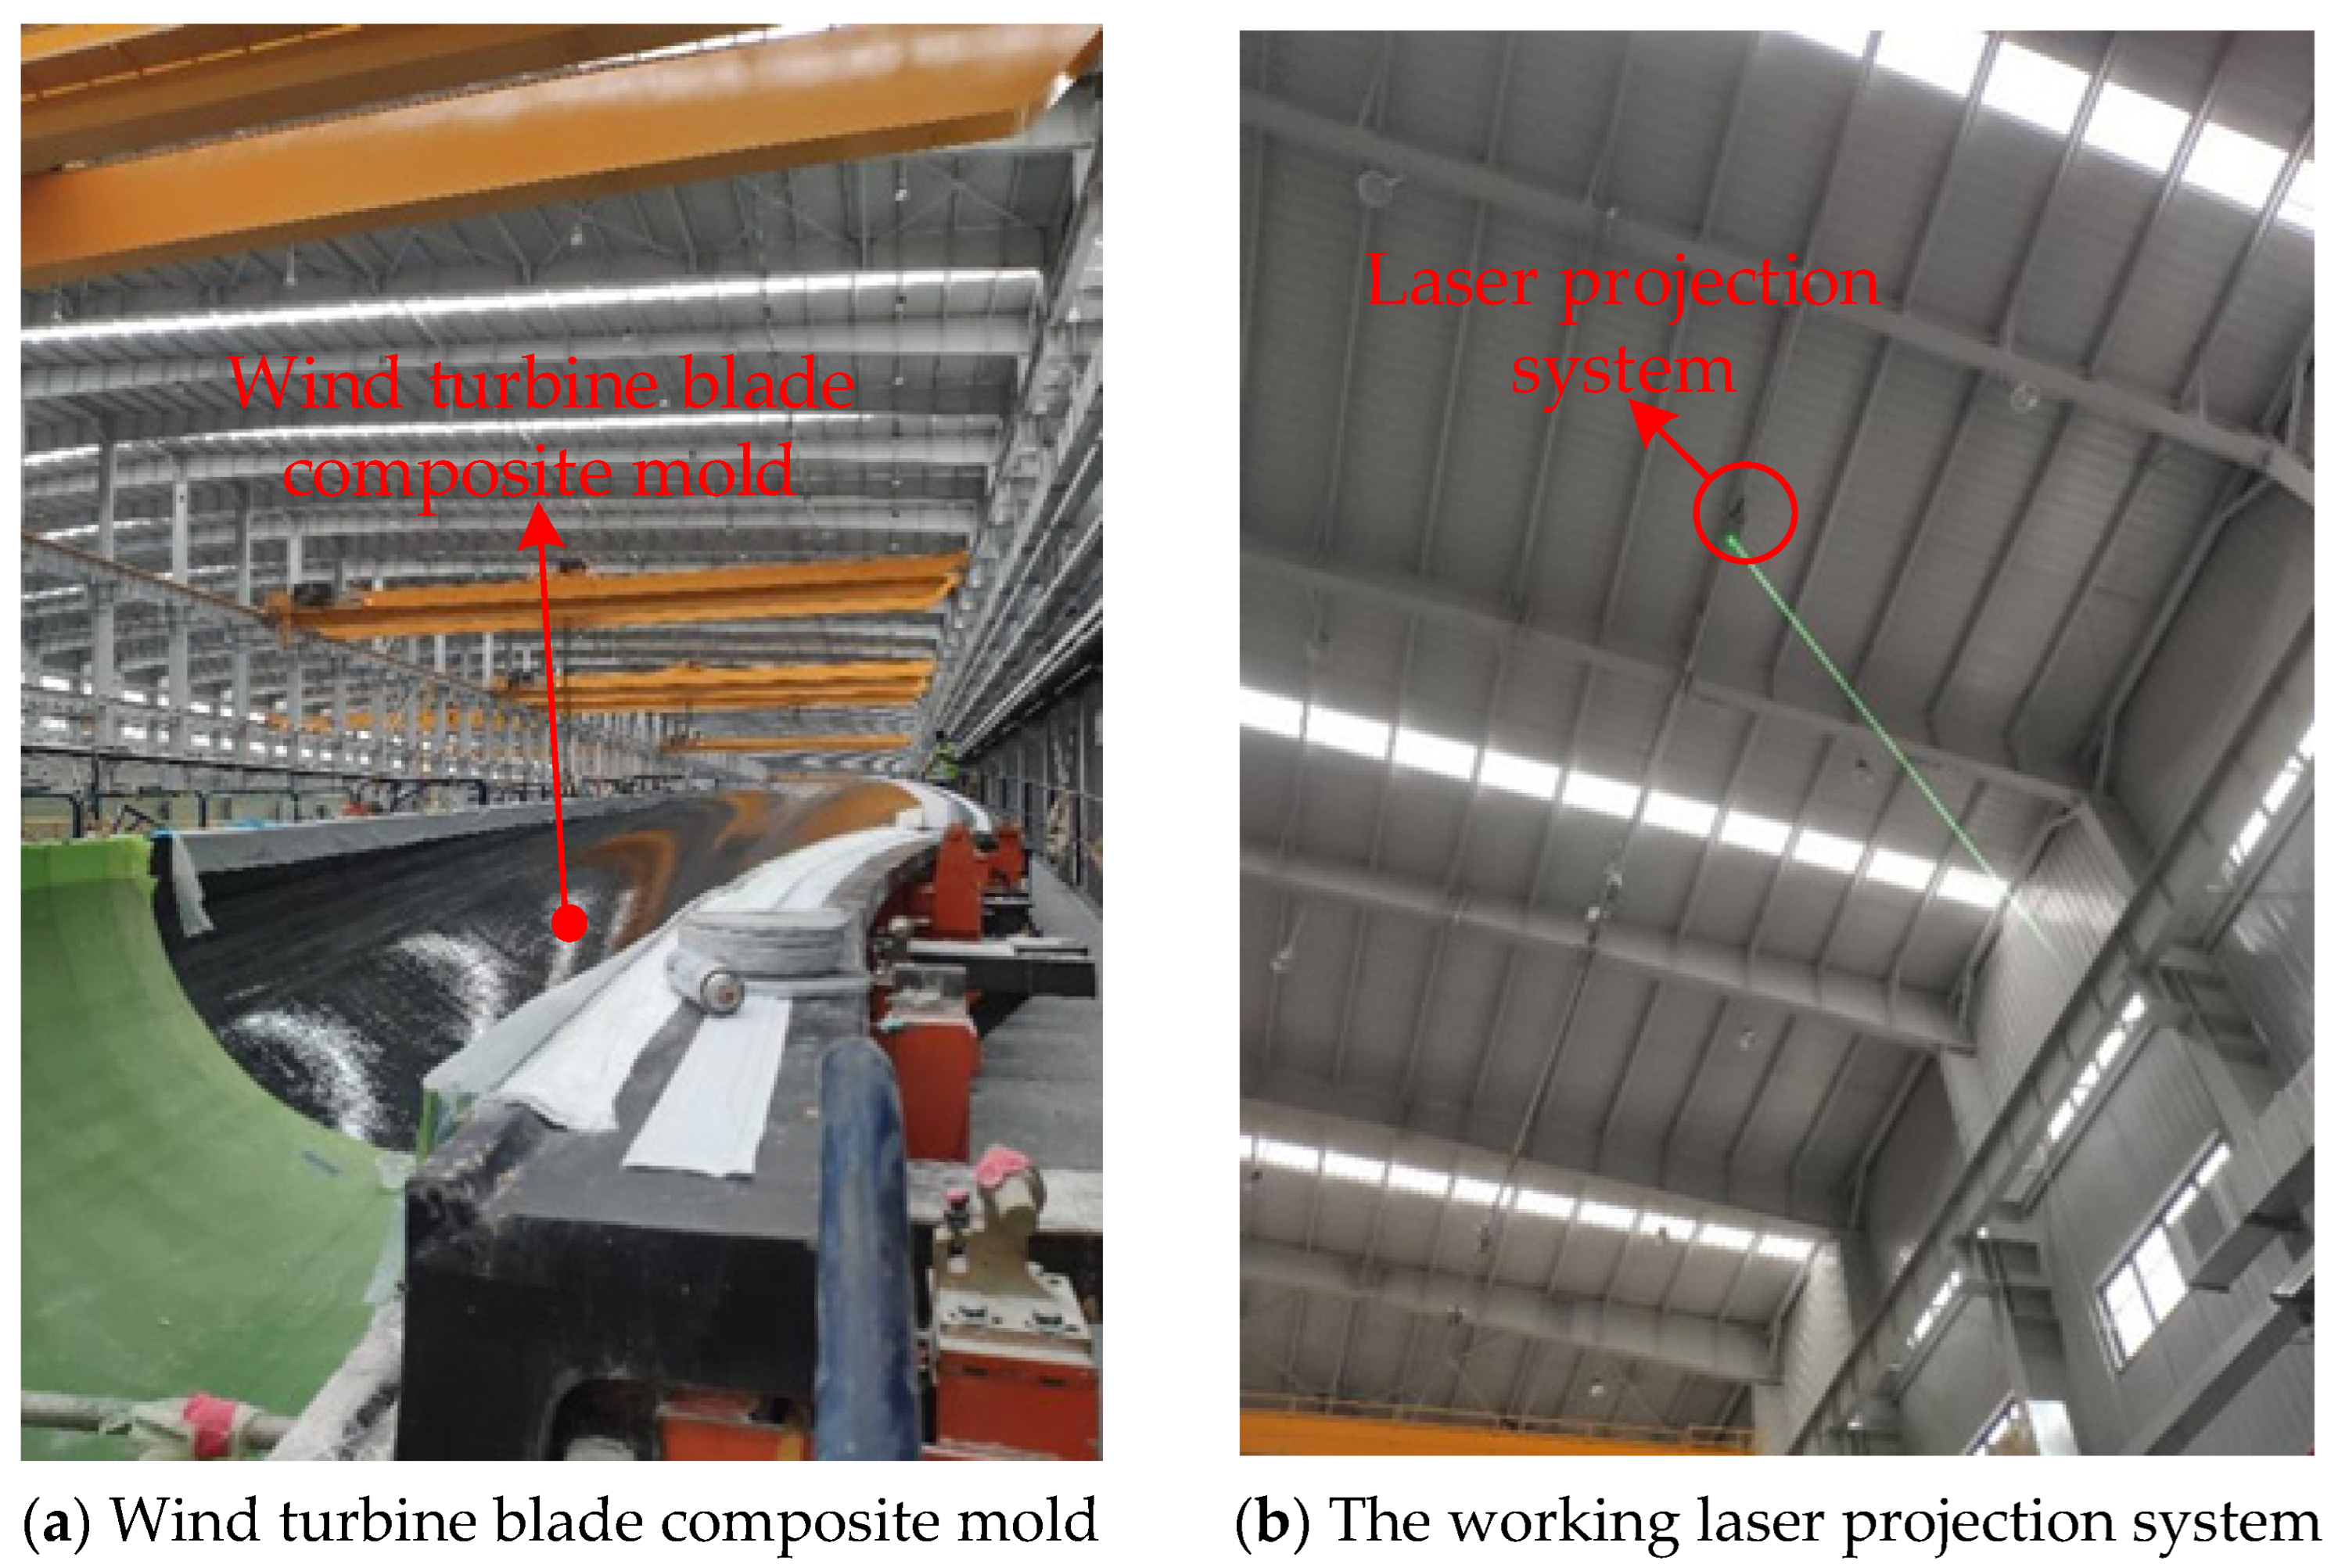
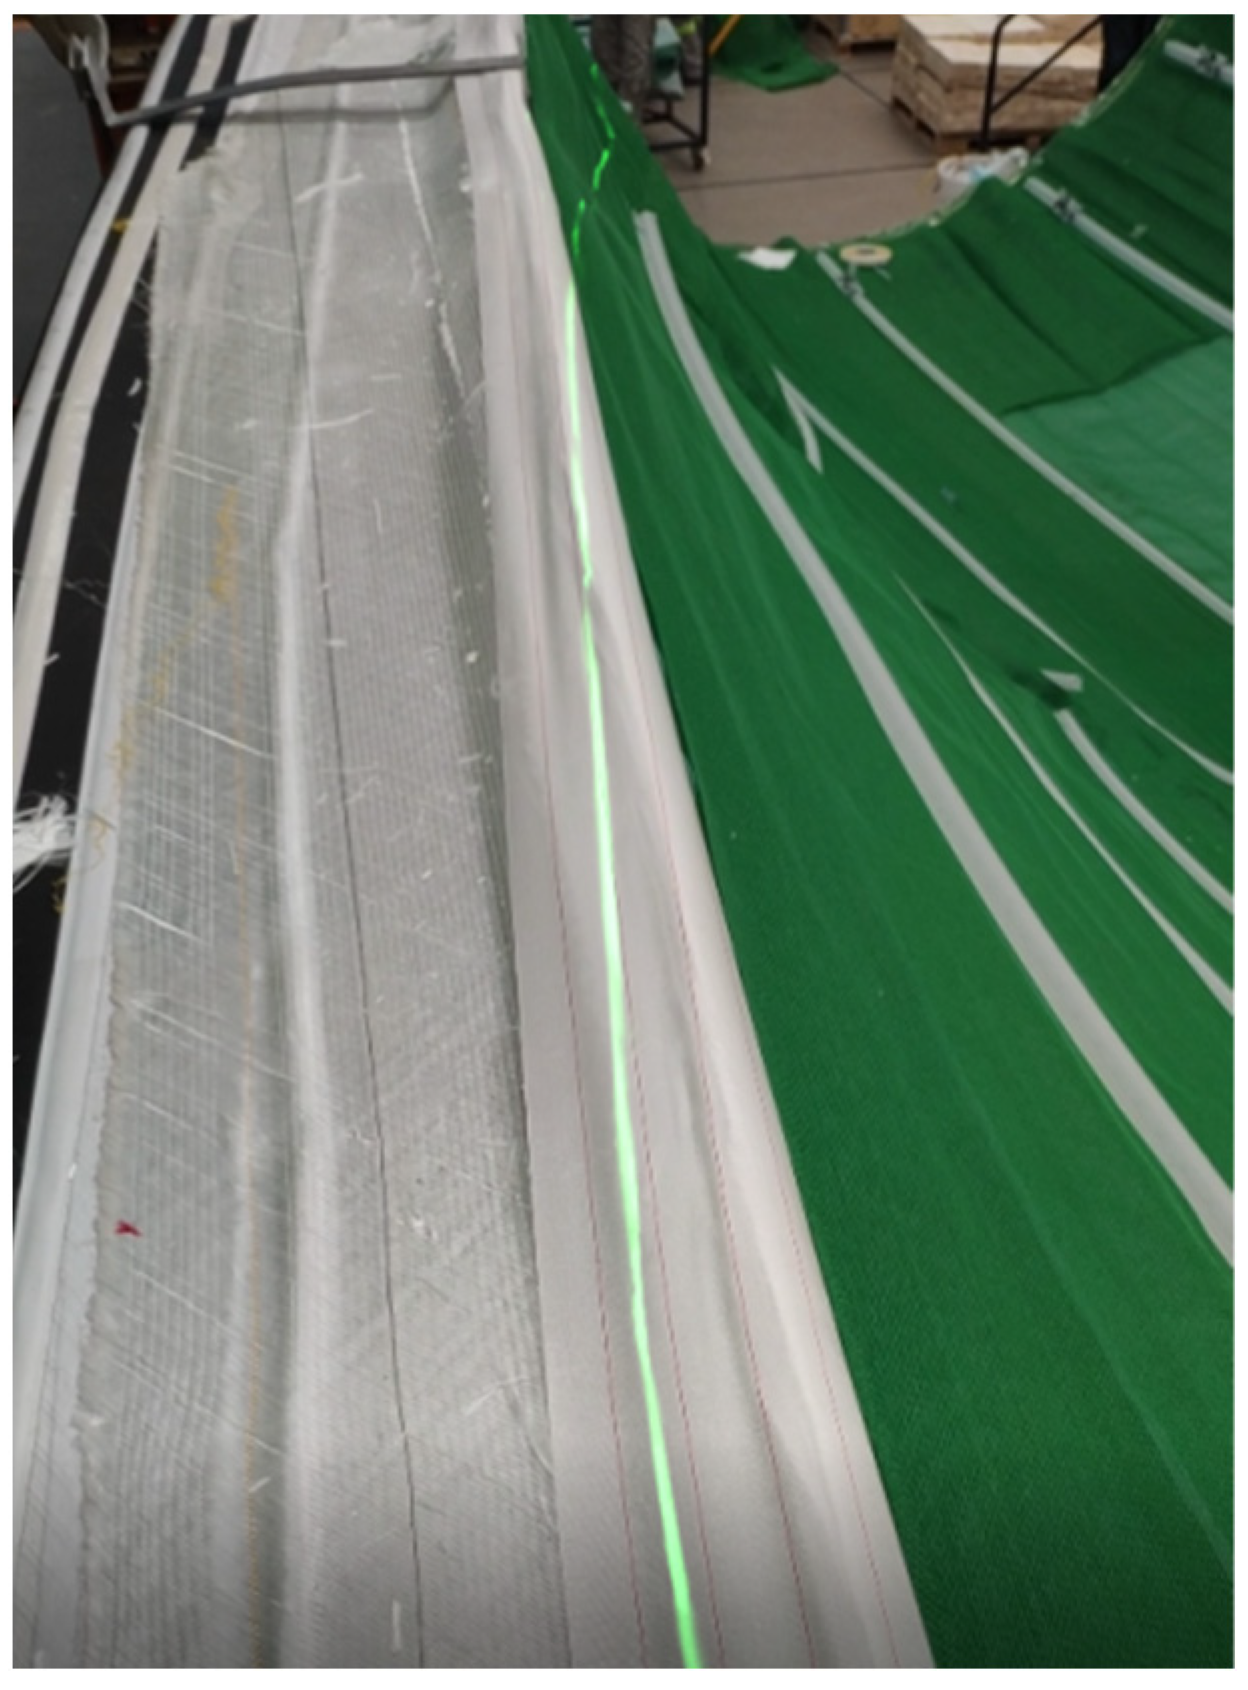
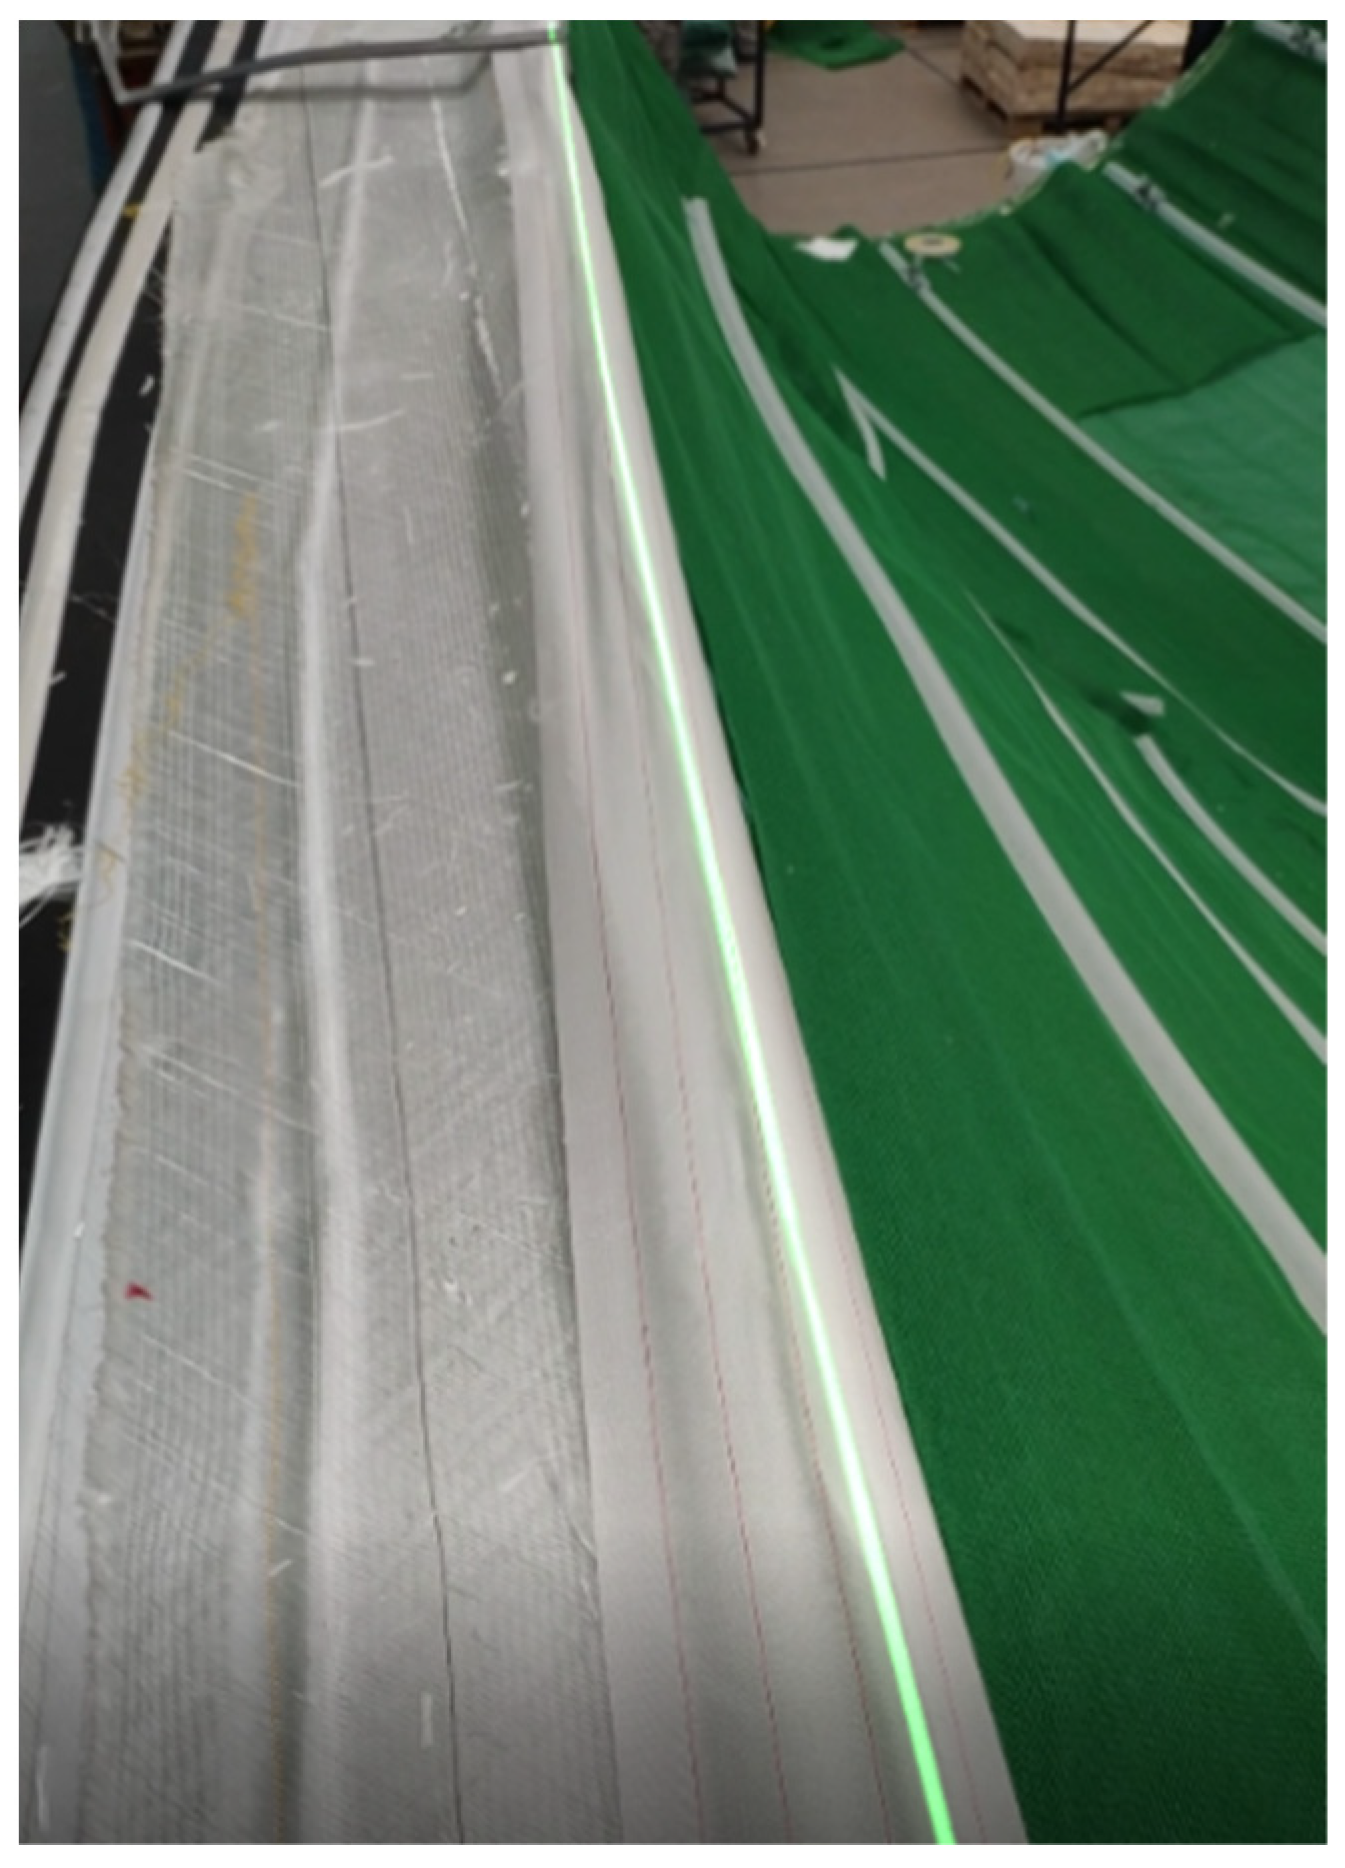
Laser scanning technology, with its high precision, high energy, and non-contact characteristics, has led to considerable changes and developments in the manufacturing industry. Lasers play important roles in processes such as precision guidance, assisted positioning, parts processing, printing and engraving, scanning and molding, and composite materials processing [1,2,3,4,5]. Laser scanning projection technology originated in aerospace composite material manufacturing (as shown in Figure 1a) and processing (Figure 1b), relying on collimation, high brightness, and directionality [6,7,8,9,10]; it can be used for high-precision projection, imaging, surface reconstruction, and mapping based on digital models of objects [11,12,13,14].

Figure 1.
Laser projection technology originated in aerospace composite material manufacturing and processing.
The core of laser technology lies in the precise control of the beam motion trajectory, through the pointing control and tracking calibration of the laser spot, so that the spot moves according to the predetermined trajectory as much as possible, and the inclusion of feedback control allows for timely correction and compensation of the trajectory after it has drifted [15,16]. The scanning galvanometer is the most widely used scanning device in laser projection, reducing the cost of laser projection and making it widely used in automotive, shipbuilding, and heavy equipment manufacturing processes [17]. The laser projection model was first developed by Minoura et al. [18]. Palmateer et al. described the modules needed for a laser projection system, the working principle of the system, and its application to composite layup positioning and aircraft painting area guidance [19]. Michael et al. proposed to use laser projection positioning technique to scan the outer contour of a part to be mounted on the surface of a workpiece to guide assembly [20]. In 2013, Kaufman et al. implemented a laser scanning projection system with spatial perception using a laser ranging function [21], but the ranging accuracy of this approach is greatly affected by the distortion of the scanning galvanometer. Behan et al. studied the extraction and processing of the pose information of the projected image required for laser scanning projection [22]. Bordignon et al. developed a laser projection system [23] for guiding technicians in assembly work, which laid the foundation for the future development of laser scanning projection technology. In 2007, Kaufman et al. investigated a laser scanning projection system for inspecting projected objects, mainly for confirming the assembly and manufacturing of parts [24]. In 2008, Morden et al. investigated a laser scanning projection system with intelligent data correction [25], which uses a digital scanning device to scan a workpiece and correct the projected shapes according to the differences in the manufacturing and design conditions of the workpiece, thus projecting a more accurate workpiece position and orientation. In 2011, Rueb et al. investigated a method for projecting laser templates on the surface of the projected object, using fixed-position transmitters and receivers for the calibration of the moving of the projected target surface relative to the laser projector [26]. In 2016, Sivertsen studied a laser projection system [27] which acquires image information of the projection area by a camera; a computer then detects and calculates the coordinate value of the localized target, according to which the projection system projects the figure onto the projection area. In 2017, Kaufman et al. investigated a laser projection technique for tracking moving parts [28], which requires the use of an additional scanning device with known relative projector poses, to recalibrate the relative poses of the laser scanning projector and a part by calculating the rotation or movement of the part occurring relative to a reference target. In 2018, Rueb et al. investigated a laser scanning projection system and method with motion compensation which determines the 3D position information of a workpiece and a photogrammetry system by acquiring the image information of the projected workpiece through the photogrammetry system, while the position information of the laser projector relative to the photogrammetry system is fixed and known, and a computer controls the dynamic motion of the laser projector on the workpiece surface [29].
Foreign commercial laser projection positioning systems have entered the market with products from companies such as LPT, LAP, and ViRTEK. Commercial laser projection positioning systems usually use a sensitive positioning device or an optical target placed on the surface of the workpiece to be projected. The projection system scans and searches the sensitive positioning head fixed at a known position, and after the sensor returns a signal, the system calculates the pose of the galvanometer relative to the workpiece and places it into a pattern by means of special software. However, once the projected object has changed its position or has been slightly deformed, the system needs to be recalibrated and corrected, which affects the efficiency and accuracy of the projection. LPT combines iGPS positioning technology, LIDAR technology, computer vision, and scanning projection systems to achieve the same results without a sensitive positioning device; ViRTEK invented the ViRTEK Iris 3D RFQ laser projection system, which is equipped with a binocular vision measurement and positioning system, reducing the calibration time from minutes to seconds. Although it improves the efficiency of system calibration and recalibration, it also increases the cost. These laser projection positioning systems are prone to deviations in the projection of the digital model onto the projected object and are unable to effectively position the projected object when it undergoes deformation. In the case of larger projected objects, the positioning error is magnified because the projection device is far away from the object due to the limitations of the projection space, which in turn leads to a larger projection error. Therefore, the accuracy of laser projection positioning patterns in large composite layup projection positioning is still less than ideal and is generally in the millimeter range and above.
To summarize, although laser projection positioning is a technology that is widely used in the manufacturing industry, there still exists the following drawbacks:
- (1)
- The projection positioning of large projected objects is subject to inaccurate pose calibration and large projection errors.
- (2)
- Large projected objects are affected by the actual working conditions and their own deformation, which interfere with the pose calibration results.
- (3)
- In order to solve the calibration and correction problems of laser projection systems, the introduction of auxiliary equipment becomes more and more expensive.
This paper mainly investigates the laser projection positioning of layups for large composite materials and manages to make improvements for the above-mentioned shortcomings. The remaining parts of this paper are organized as follows. Firstly, the causes of projection positioning errors and the correction methods are analyzed in Section 2, and the proposed approaches are presented in Section 3. Then, the results of the implemented numerical cases and experiments are described and analyzed in Section 4. Finally, these contributions of this paper are briefly summarized in Section 5.
2. Principle of Scanning Galvanometer Pose Measurement
2.1. Scanning Galvanometer Projection Model
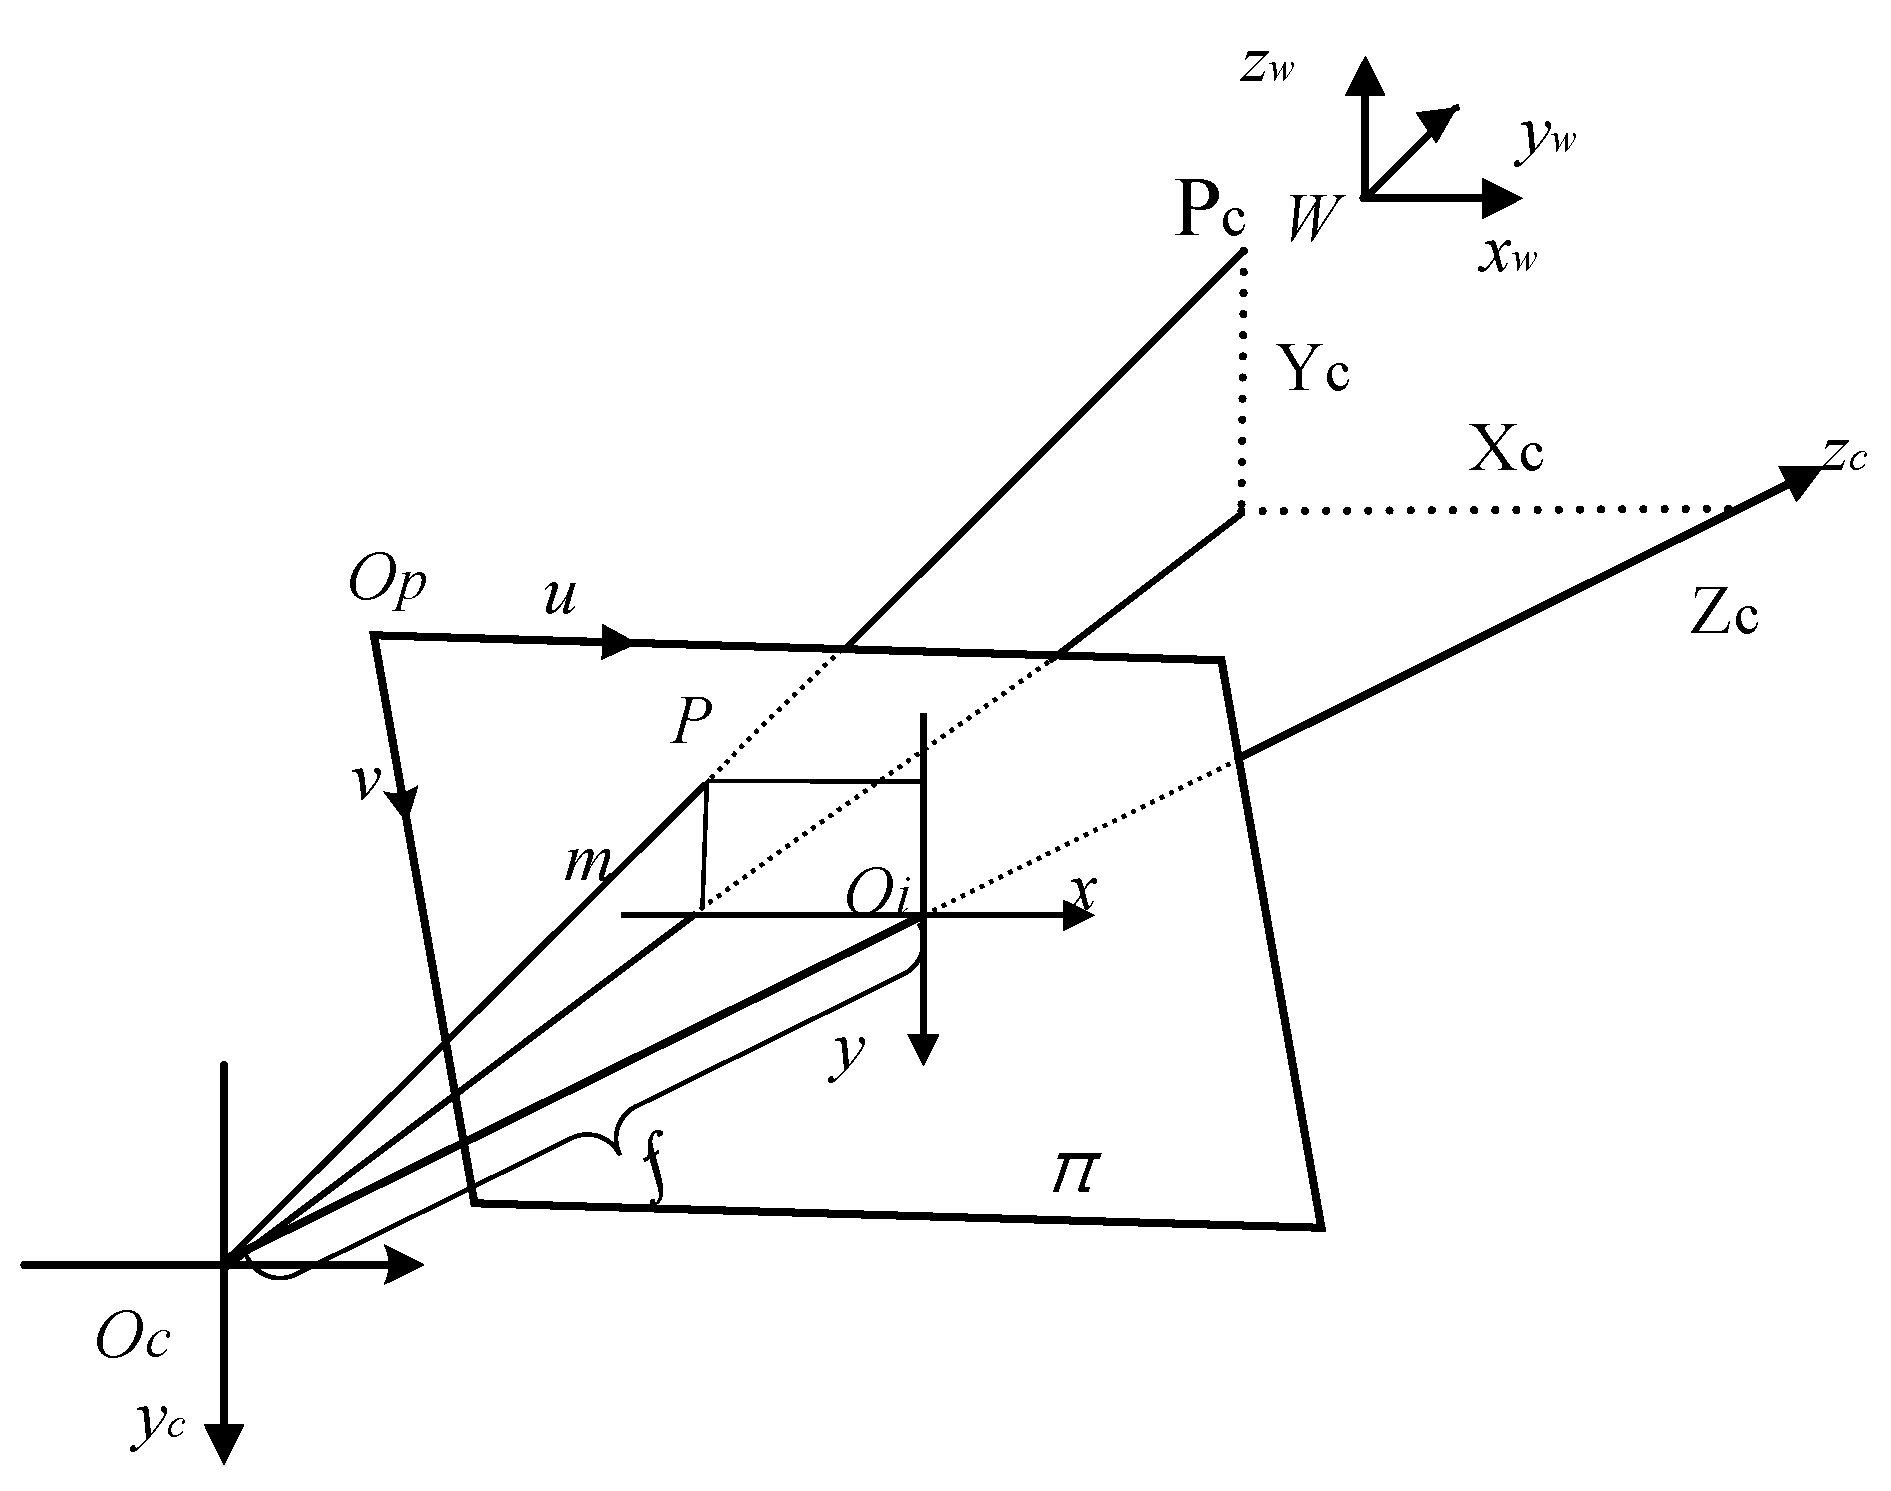
The pinhole camera model can be equated with the scanning galvanometer projection model, and there is an inverse relationship between the two models. Ideal projection imaging, as the inverse process of small-aperture imaging, describes the transformation relationship of a two-dimensional point P from the pixel coordinate system to the world coordinate system .
When the size of the projected figure is the same as that of the drawn figure, the distance from the vertical line between the X-axis and the Y-axis of the scanning galvanometer to the projection plane is regarded as the focal length , as shown in Figure 2.
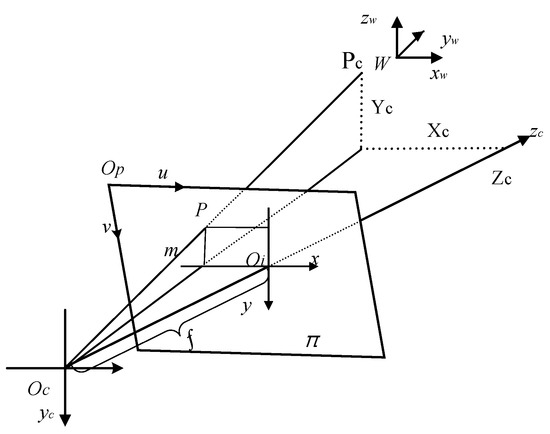
Figure 2.
Small-hole imaging and projection imaging model.
The point coordinates of a point in space in the world coordinate system are , corresponding to the coordinates on the pixel plane . The transformation can be expressed as:
where is the focal length of the scanning galvanometer, denotes the internal reference matrix of the scanning galvanometer, denotes the external reference matrix of the scanning galvanometer, denotes the homography matrix of the scanning galvanometer, and Pw is the position of the point in the world coordinate system.
2.2. Solving the Position and Orientation of the Scanning Galvanometer Based on the PNP
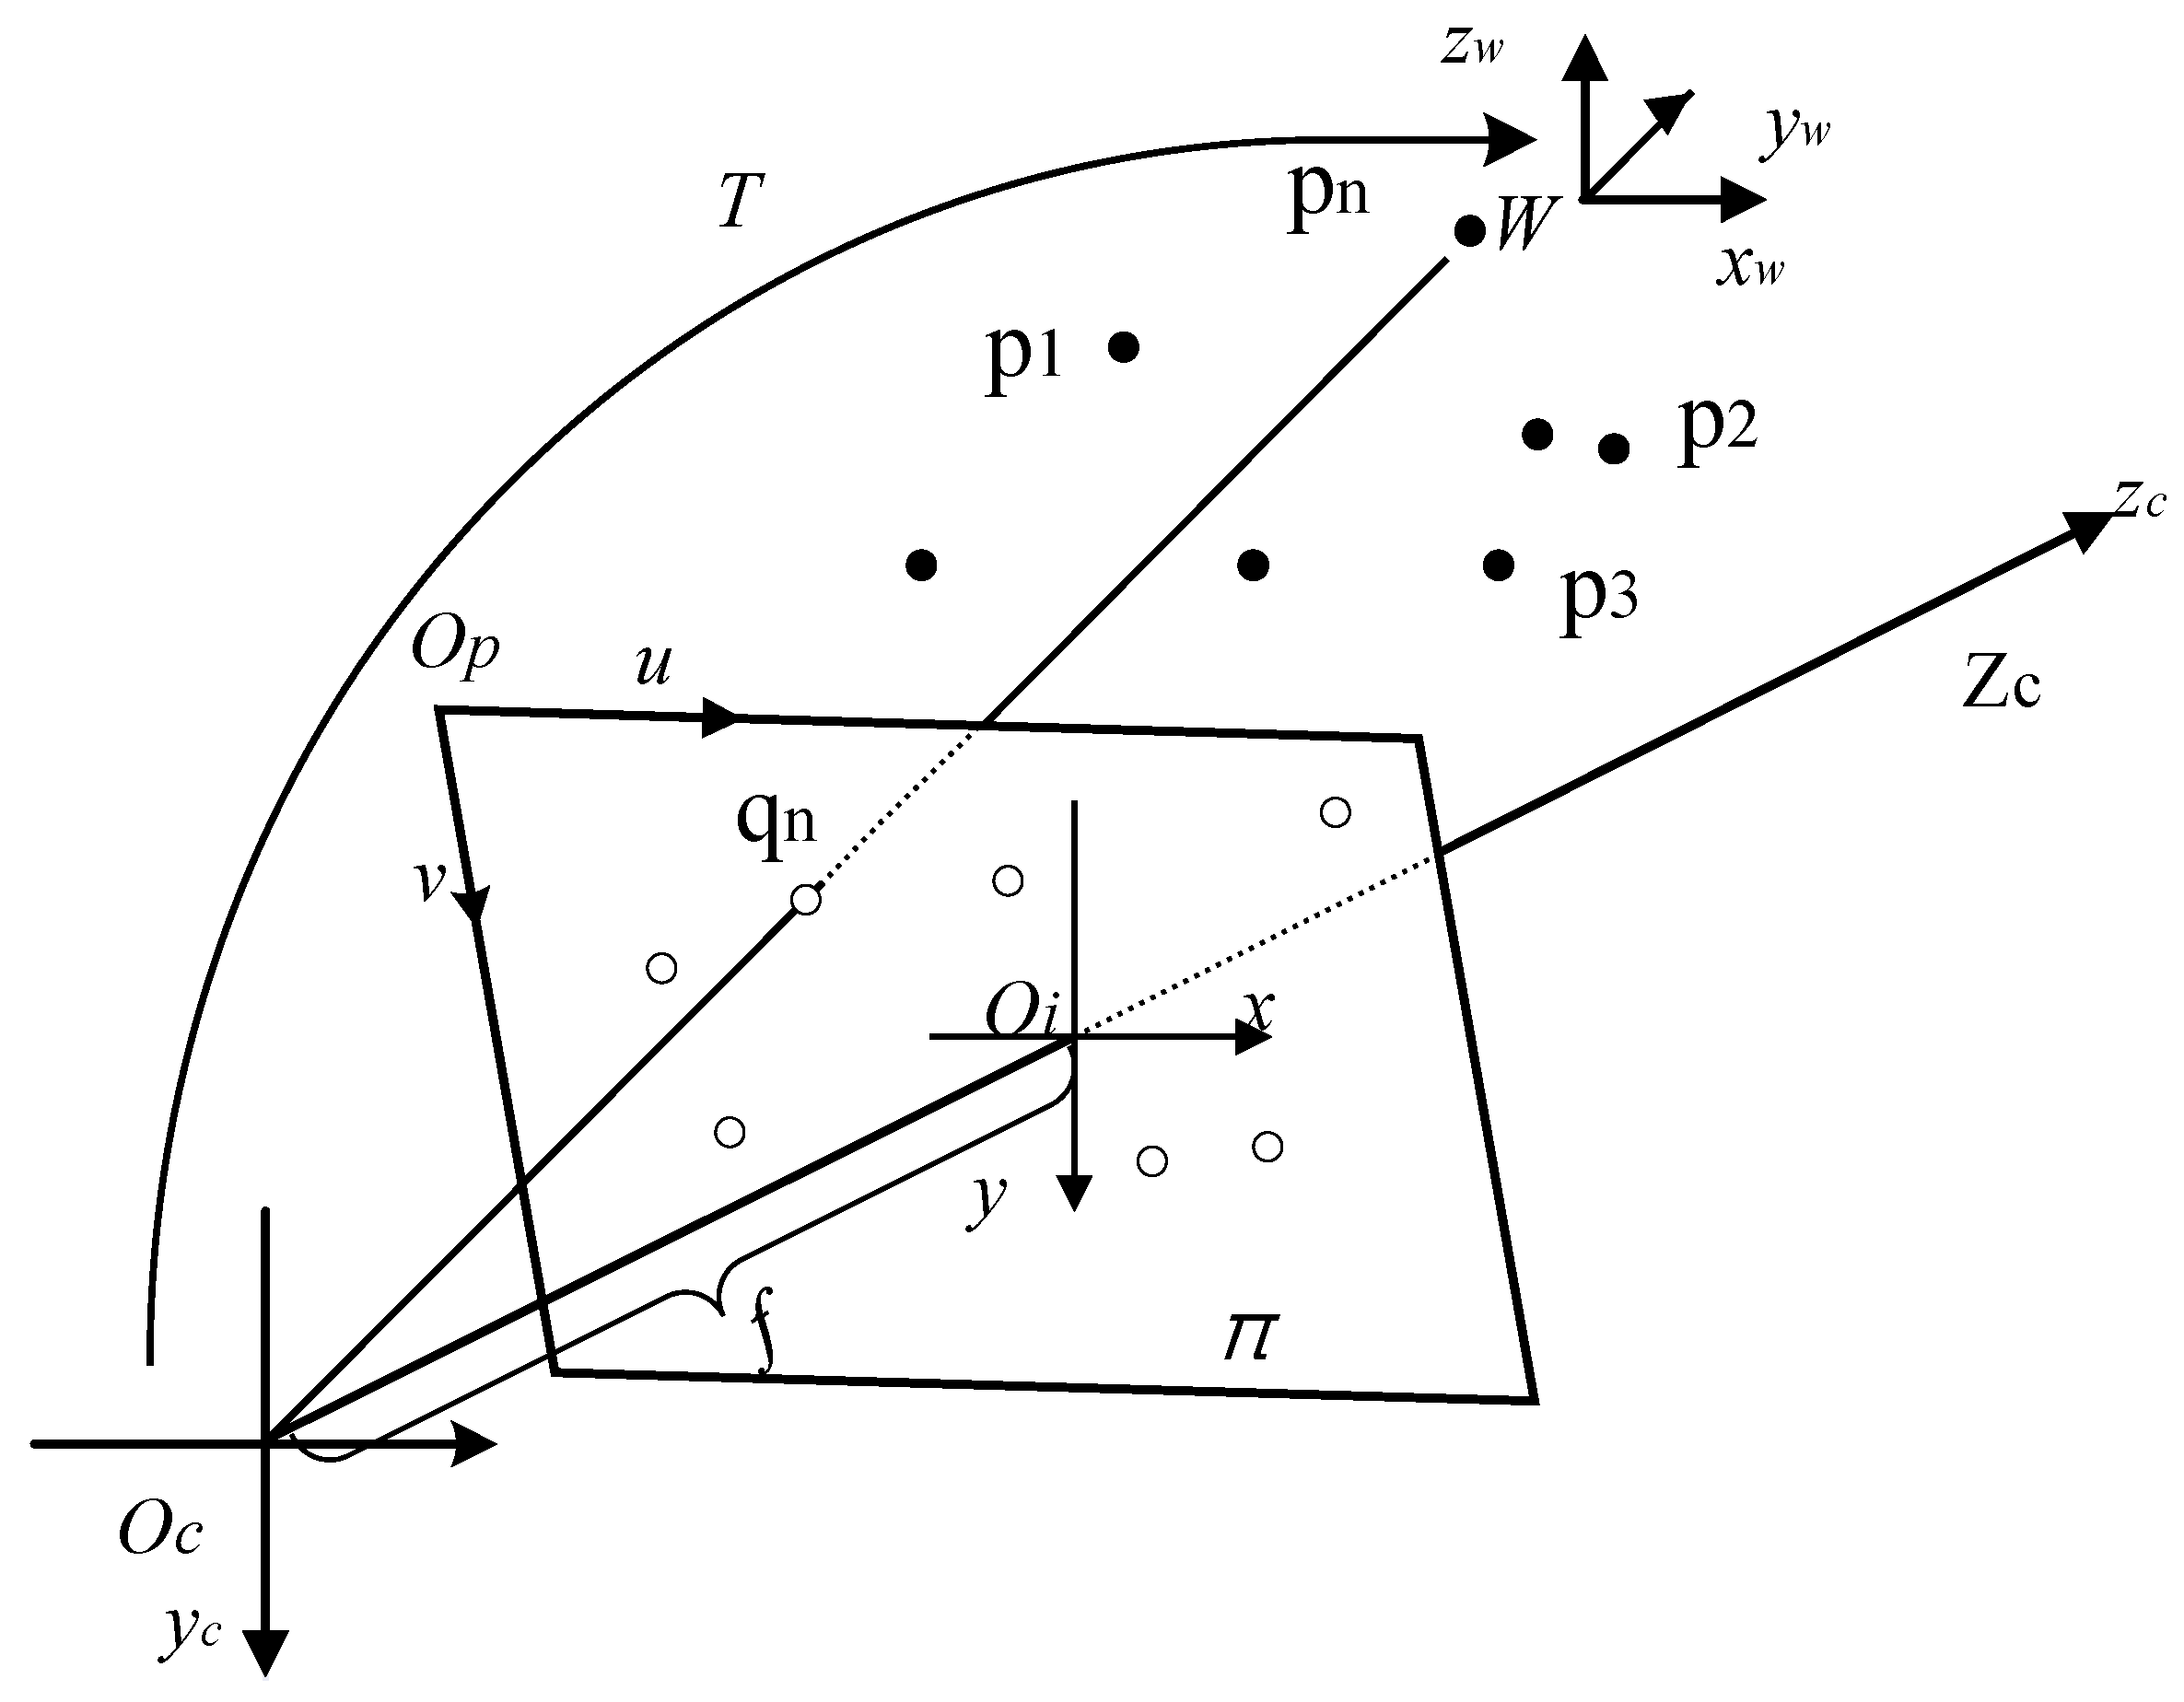
The visual localization method is a method that uses a device such as a camera to photograph an environment containing feature information, extracts these features by algorithmic recognition, and combines them with a priori data to calculate the camera’s poses in space. The projection model, as an inverse small-aperture imaging model, can be used to calculate the relative poses of the scanning galvanometer and the projected object by monocular visual localization methods. The positional solution problem can be regarded as a PNP problem with few feature points. The classical PNP problem is shown in Figure 3. The projected object coordinate system is unified with the world coordinate system; the 3D point set P of N target points is given on the projected object, which corresponds to the 2D point set Q on the projection plane coordinate system. The focal length of the scanning oscillator and the coordinates of the localization points in both the world and projection plane coordinate systems are known.
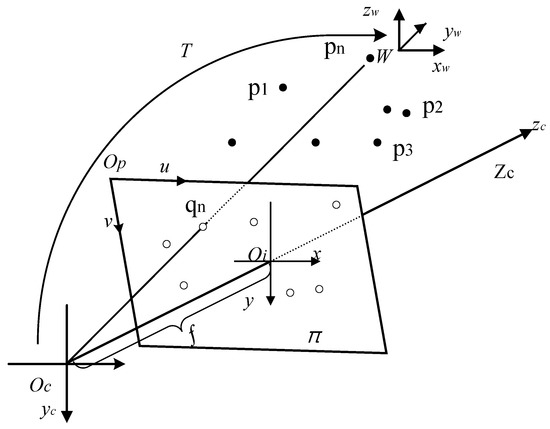
Figure 3.
PNP problem diagram.
Set the homogeneous coordinates of the target localization points in the world coordinate system as:
The coordinates in the projected plane coordinate system are:
Set the internal parameter matrix K of the scanning galvanometer as:
The projection plane point set Q uses normalized coordinates, ignores the effect of the internal reference matrix K, and simplifies the transformation matrix T to the augmented matrix. Then, the target point is projected from the spatial coordinate system (world coordinate system) into the projection plane coordinate system, which can be expressed as:
Expressing the matrix with the unknowns yields:
By rearranging Equation (6), one can obtain:
Equation (7) can be rewritten in matrix form.
In the case that the number of known points N ≥ 6, the original problem becomes a direct linear transformation (DLT) problem.
In the DLT, all the 12 elements of the matrix are directly treated as unknowns, ignoring the connection among them.
Because the rotation matrix satisfies , the solution found by the DLT does not necessarily satisfy this constraint, and it is necessary to find the best rotation matrix to approximate it for the R matrix estimated by the DLT.
Under the condition that there are more than six pairs of matching points:
In order to improve the availability of the solution, the least squares solution to the overdetermined equation is found using a method such as the SVD.
The last column of the V matrix is the solution of the above equation, but the result of the solution is dimensionless, and if the scale factor is , the actual solution is:
The rotation matrix is:
is an orthogonal matrix with scales, and to find the optimal rotation matrix, the SVD decomposition is performed.
The optimal rotation matrix R is:
The scale factor is:
The 3D point should be in front of the scanning galvanometer, so:
Then, the translation vector is:
According to the actual working conditions, the calibration of the projected object is likely to introduce random error disturbance due to chattering, deformation, attitude change, and a lack of machining quality accuracy, resulting in the spatial three-dimensional coordinates of the target positioning point not matching with the theory and introducing errors into the attitude calculation, so it is necessary to optimize the attitude measurement.
3. Optimization of Pose Measurement Results
Random errors are introduced during the calibration of the relative poses of the scanning galvanometer and the projected object, and cannot be corrected by the real-time determination of the 3D coordinates of the target positioning point. This makes it impossible to calculate the poses accurately, and in serious cases, the calculation results deviate greatly. Therefore, a method is needed to optimize the relative solution results. A genetic algorithm (GA) is a randomized search method obtained by referring to biological evolutionary laws. In order to avoid falling into a locally optimal solution, an improved genetic algorithm with an adaptive adjustment strategy has emerged.
In this paper, a tournament selection operator is used to retain the best individual, and the individual is extracted from the parent Pt(t) according to the mutation rate Pm. These individuals perform mutation operations according to random numbers generated with equal probability.
When the fitness of individuals in the population tends to be more concentrated, the larger Pc and Pm are, the more diverse the fitness values of individuals in the next generation population are. This operation avoids the premature phenomenon of generating algorithms that fall into locally optimal solutions [30].
The adaptive algorithms of Pc and Pm used in this paper are as follows:
where is the average fitness of all chromosomes in the population of the generation i, and Pc0 and Pm0 are the initial values of the algorithm crossover and mutation rates, respectively, which are generally between 0.25 and 0.85 [31].
To improve the efficiency of the algorithm, an elitism strategy is introduced. During each iteration, a number of individuals with higher fitness are retained, and a number of individuals with lower fitness are deleted. Moreover, according to the value of the fitness, the retained individuals with higher fitness are copied to fill the empty spaces left by the deleted individuals, and the higher the fitness, the more individuals that are copied. During the iterative process, the more the whole population converges to the individuals with high fitness, and the more the population fitness is concentrated, the larger Pc and Pm are, and so the greater the efficiency of the improved genetic algorithm will be. The adaptive algorithm of the number of retained elites N is as follows:
where , is the maximum fitness of chromosomes that can be achieved in the population, is the maximum fitness of chromosomes in the generation i, and N0 is the initial value of the number of retained elites, generally between 5% and 10% of the total number of chromosomes.
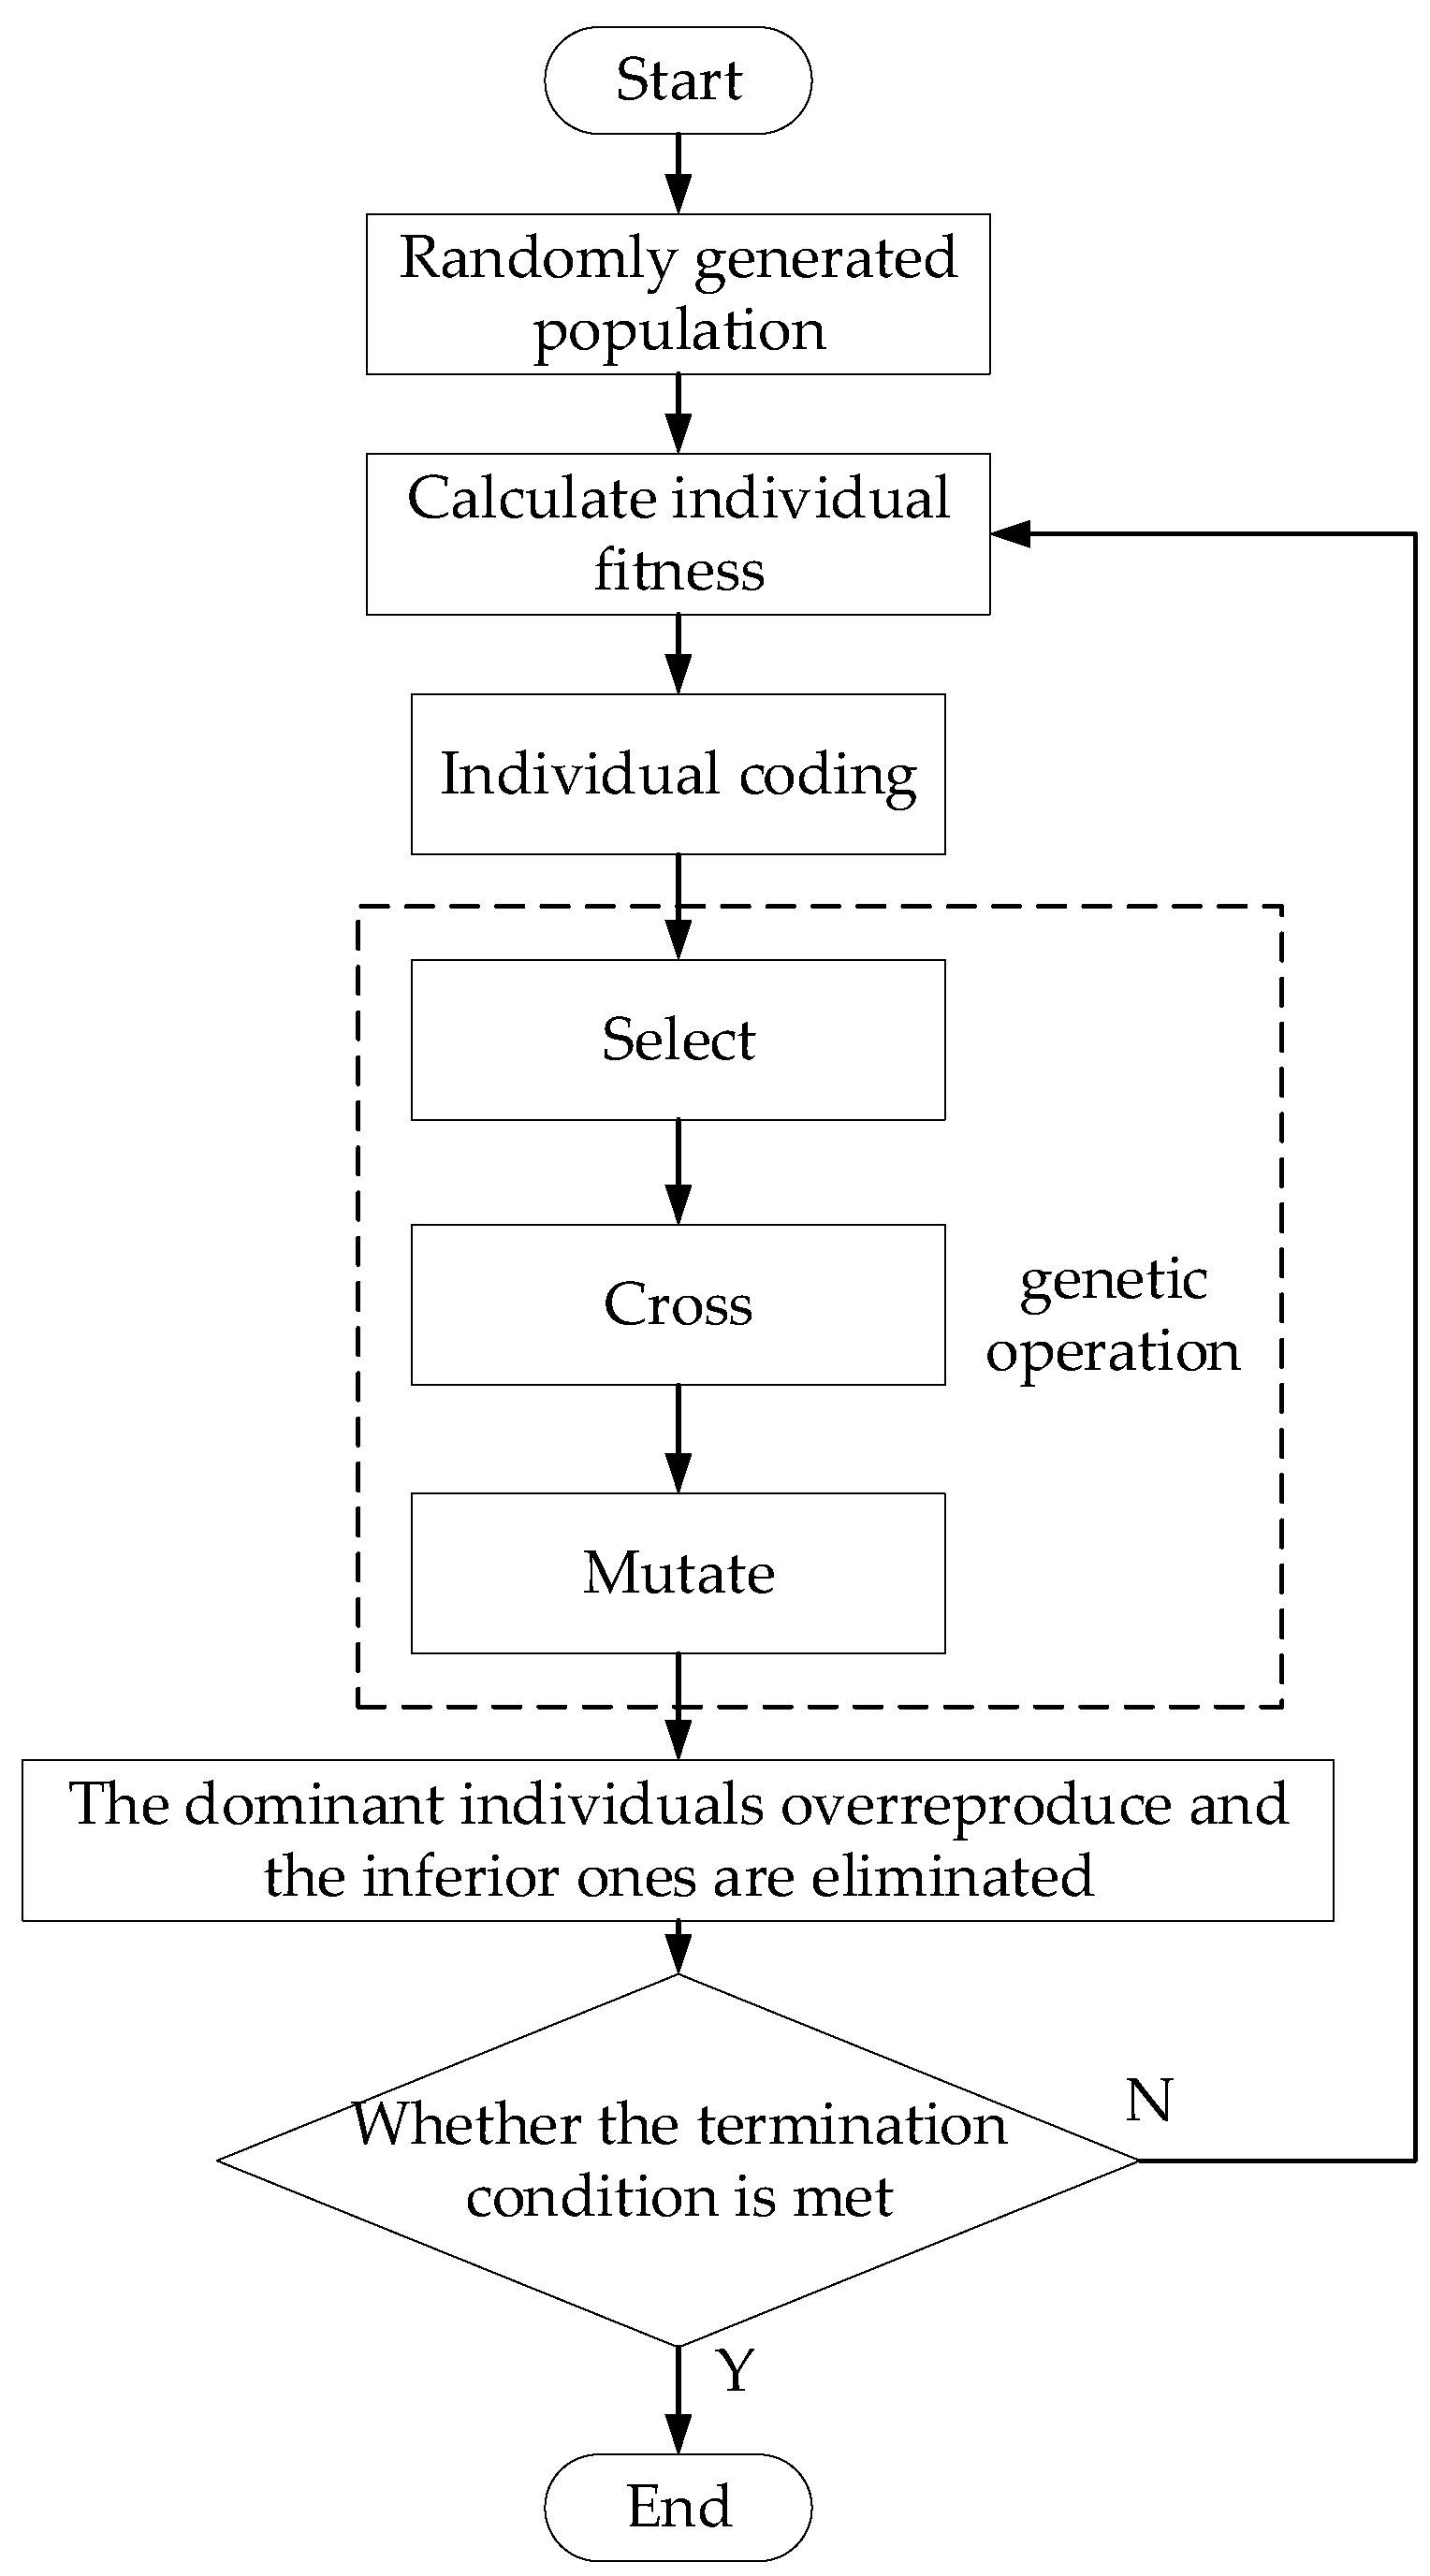
The improved genetic algorithm flowchart is shown in Figure 4.
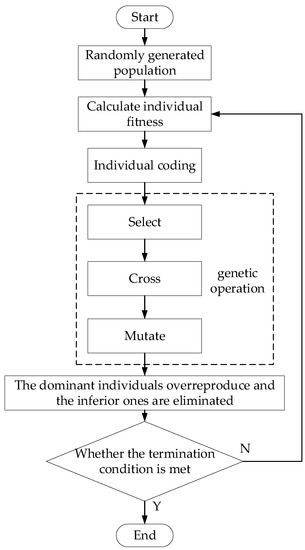
Figure 4.
Flowchart of improved genetic algorithm.
4. Experimental Results and Analysis
Indoor experiments were conducted using 3D printing scaling models of composite molds. Because the 3D printing models themselves have deviations from the ideal models, they are able to simulate the deformation effects of the molds under actual working conditions due to a variety of reasons and can better verify the effectiveness of the scheme. In order to simulate the installation conditions in the field, the model is placed randomly to check the projection effect and autocorrection effect of the system. At the same time, the target is fixed on the side of the model, and photos are taken with the calibrated camera. The algorithm in OpenCV is used to process the photos and calculate the relative poses of the model, and the relative poses are converted into the scanning galvanometer coordinate system of the projection device for verification. The target is mounted on the mold by the tooling, and the coordinates of the target points are acquired manually by the software-controlled galvanometer. The technical specifications of the laser scanning galvanometer used are listed in Table 1 and the technical specifications of the camera used are listed in Table 2.

Table 1.
Technical specifications of the laser scanning galvanometer.

Table 2.
Technical specifications of the camera.
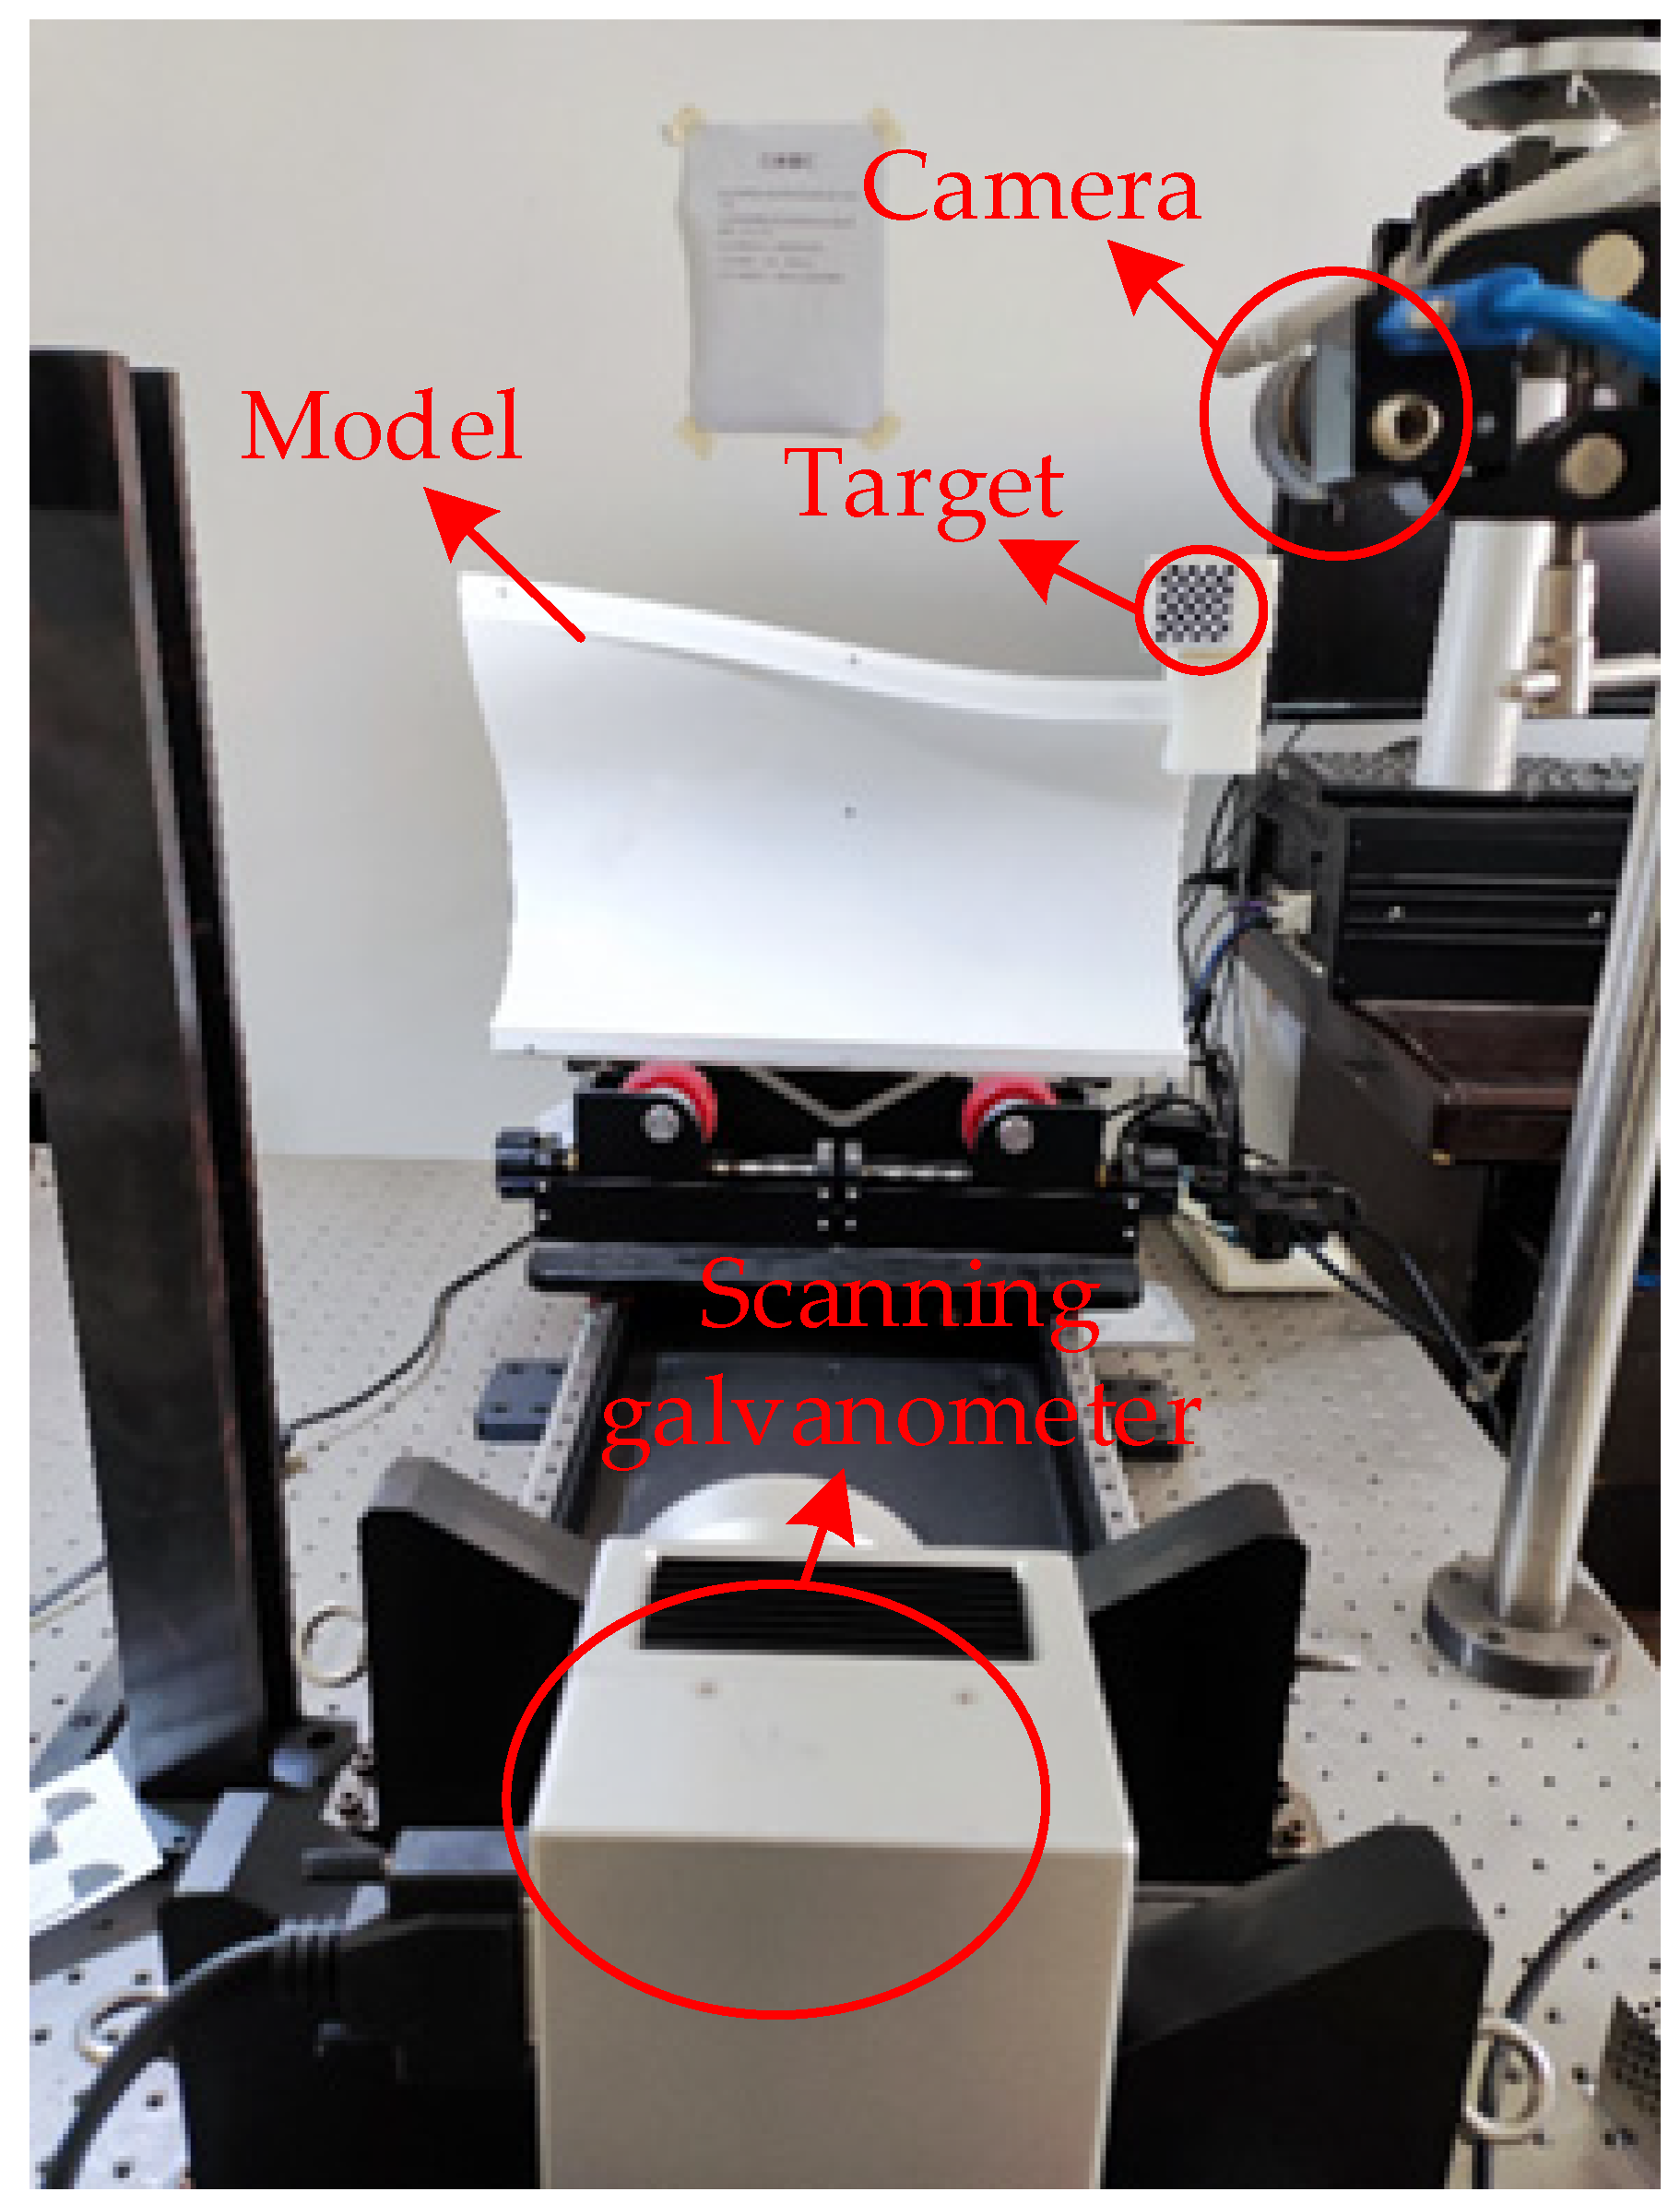
The experiment site is shown in Figure 5.
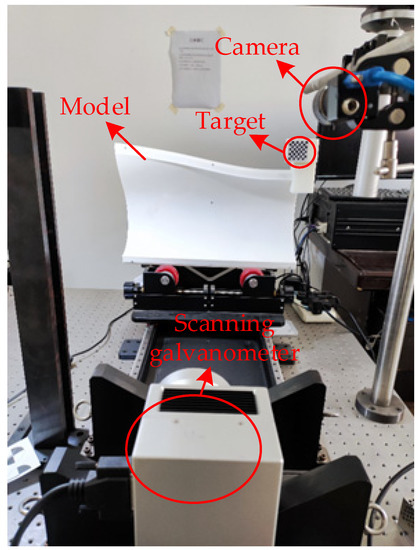
Figure 5.
Calibrating the poses of the camera and the scanning galvanometer by using the target.
4.1. Value of Design Variable
Due to the existence of measurement errors, both the spatial coordinates and the projection plane coordinates of the target point exist but cannot be measured directly, both of which affect the accuracy of the pose calculation. Due to the time cost, it is not feasible to optimize both the spatial coordinates and the projection plane coordinates of the target point, so they are optimized separately to determine the impact of both errors on the accuracy. Let the theoretical spatial coordinates of the model target point set be and the collected plane coordinates be , and optimize the two coordinate sets.
The coordinates of the projection plane coordinate system are first optimized, and the design variables are written in vector form as:
where the physical meaning of each component is the x-coordinate and y-coordinate of the projection plane coordinates of the target point, in mm, in that order.
Considering the accuracy when acquiring the coordinates of the projection plane, the acquisition of the target point should satisfy the following conditions:
where , is the lower bound of the error between the design variable and the true value , and is the upper bound of the design variable.
The objective function uses the average error of the target point positions after reprojection, i.e., after calculating the poses using the spatial coordinates of the target points and the projection plane coordinates, the target points are reprojected according to the poses, and the reprojected target points generate a new set of projection points in the projection plane in order; the average distance between the old and new projection points sums all of the target points .
as in Equation (22):
Thus, the objective function can be expressed as:
The final optimized design model is as follows:
Similarly, to optimize the coordinates of the spatial coordinate system, the design variables are written in vector form as:
where the physical meaning of each component is the x-coordinate, y-coordinate, and z-coordinate of the projection plane coordinates of the target point, in mm, in that order.
Considering the errors generated by the 3D model printing and the deformation during transportation, the 3D coordinates of the target point should meet the following conditions:
where , is the lower bound of the error between the design variable and the true value , and is the upper bound of the design variable.
The objective function is given by the following equation:
Thus, the objective function can be expressed as:
Then, the final optimized design model is as follows:
From the improved genetic algorithm proposed in the previous section, and after continuous testing, the parameters are listed in Table 3, and the operation yields the corresponding optimal solution.

Table 3.
Value of optimization model parameters.
The evolution curves of the fitness function when solving this optimization problem using the above two different algorithms are shown in Figure 6, and the computation time is about 3 min. From the figure, it can be observed that the optimized spatial coordinates give better results.

Figure 6.
Comparison chart of the fitness values of the two optimization strategies.
The curves show that in the initial stage of the genetic algorithm, chromosomes are relatively abundant in the population, and the two optimization strategies tend to converge in the evolutionary process about 1300 and 1200 generations later, respectively—details are listed in Table 4—and finally result in individuals with errors of 0.0091 mm and 0.0009 mm, respectively.

Table 4.
Comparison of the results of the two optimizations.
Considering the large-space working condition, the projection object is about 20 m away from the scanning galvanometer, and the errors obtained by the two optimization methods are scaled up to 2 mm and 0.2 mm, respectively, so the spatial coordinate optimization is used in actual practice.
The final results of the optimization of the two strategies are shown in Figure 7.

Figure 7.
Comparison of the average error of target points for the two optimization strategies.
It can be seen that the error of the projected plane coordinates of the target point has less influence on the pose calculation compared to the spatial coordinates, and the two optimization methods are run several times without considering the time cost to obtain individuals with errors of 0.0037 mm and 1.3765 × 10⁻⁵ mm, respectively.
Therefore, it can be seen that the main source of the pose calculation error is the offset of the spatial position of the target point generated by the deformation of the projected object itself.
4.2. Indoor 3D Printing Model Projection Experiment
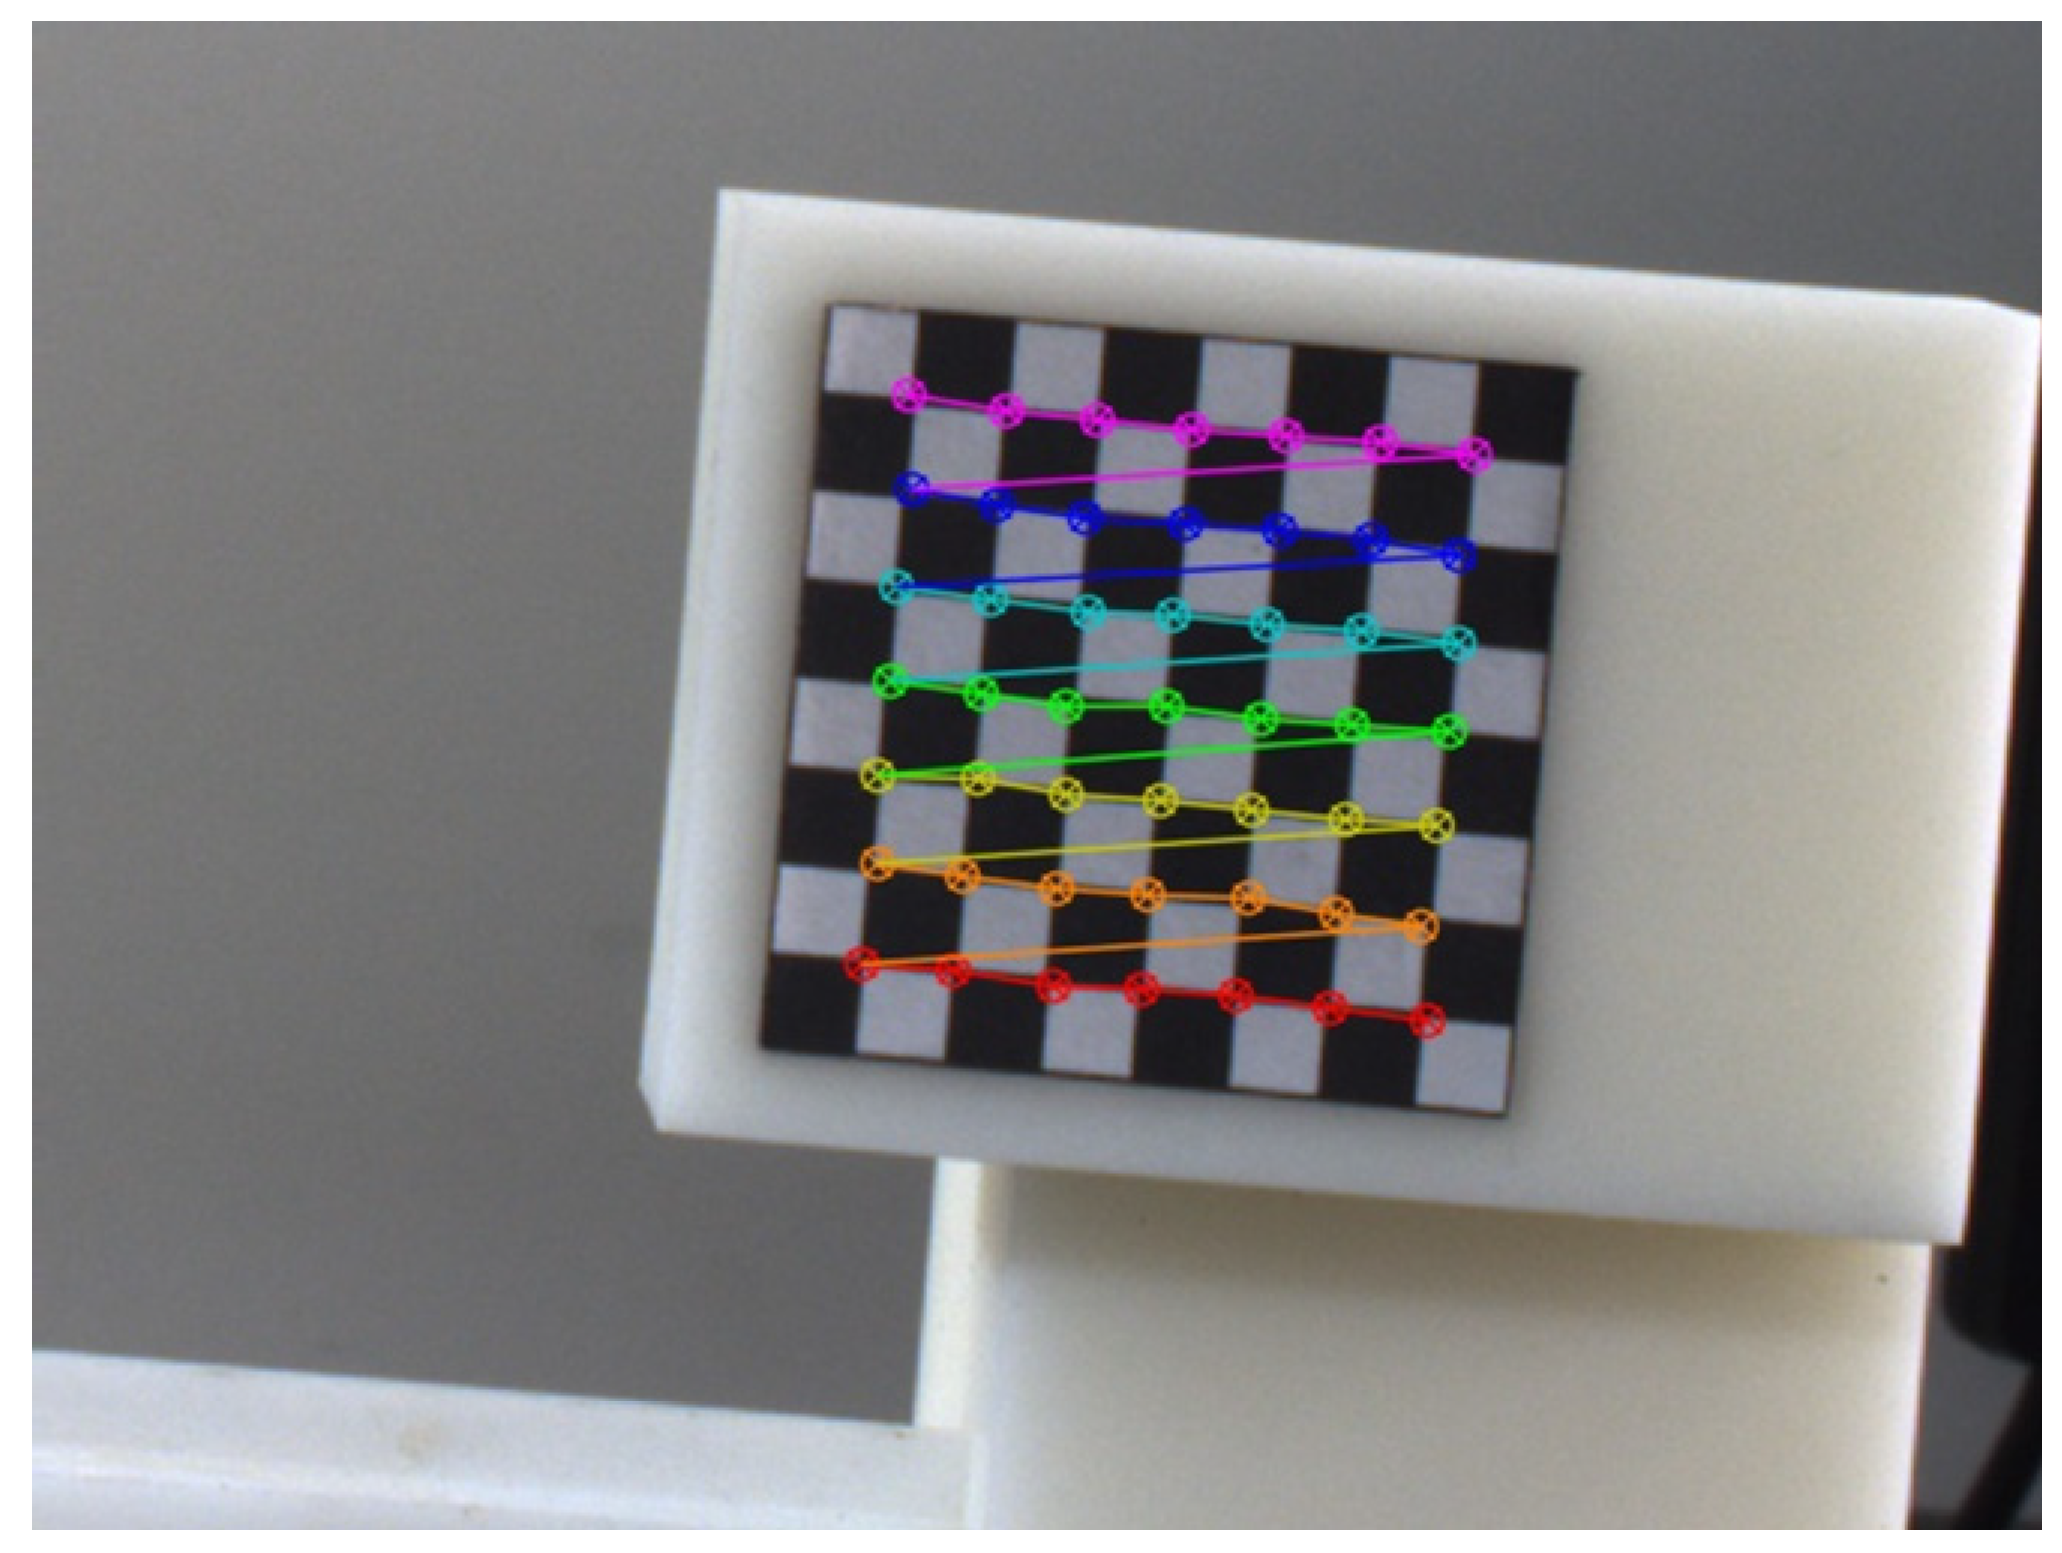
Firstly, the camera and the scanning galvanometer are calibrated using a randomly positioned target, as shown in Figure 8, and the transformation from the camera to the scanning galvanometer is given by the camera coordinate system , the scanner coordinate system , and the target coordinate system .

Figure 8.
Molds and target models with target patterns pasted onto them.
The final calibration results are listed in Table 5.

Table 5.
Camera-to-scanning galvanometer transformation.
Subsequently, the mold model was randomly adjusted to change the pose of the fixed target pattern and maintained as shown in Figure 9, ensuring that it was placed within the working space of the scanning galvanometer and the camera.
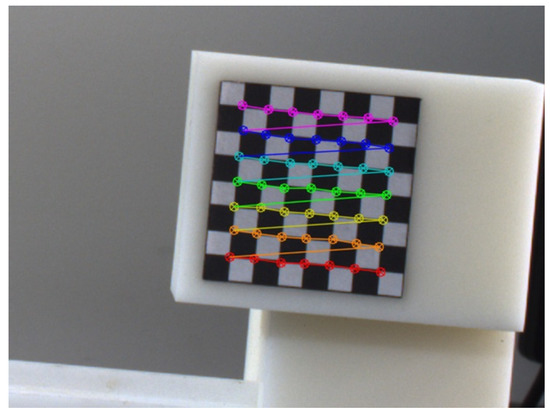
Figure 9.
Image of the target obtained by the camera.
The camera calculates the pose relationship between the camera and the model by photographing the target, and the scanning galvanometer obtains the two-dimensional coordinates on the projection plane of the target points by finding the point, then calculates and optimizes the pose of the scanning galvanometer in relation to the mold.
Finally, the camera-solved poses are transformed to the scanning galvanometer coordinate system and compared with the poses acquired by the scanning galvanometer through the target points, and the two sets of poses are reprojected separately and compared with the manually acquired projection points.
The poses are listed in Table 6 for the camera shot of the target and the scanning galvanometer acquisition of the target points, respectively.

Table 6.
Pose information solved by camera and scanning galvanometer.
The transformations of the model to the scanning galvanometer obtained from the scanning galvanometer at the current position and the transformations of the model to the scanning galvanometer obtained from the camera are listed in Table 7.

Table 7.
Transformation from mold model to scanning galvanometer.
Using and to reproject the target points, the average error values of the final target points after reprojection are 1.115 mm and 0.0007 mm, and the optimization fitness values are 8.885 mm and 9.9993, respectively.
The coordinates of the reprojected target point and the original target point are listed in Table 8, and it can be seen that the solution of finding and optimizing a point with the scanning galvanometer is significantly better than the solution of photographing the target with the camera.

Table 8.
Two calculation methods to obtain the reprojection point coordinates.
4.3. Large-Space Laser Projection Experiment
In order to restore the actual working scene as much as possible, in this paper, the experiment was carried out in the real wind turbine blade production workshop, the experiment site as shown in Figure 10, in order to enhance the reading effect, the green light path has been done to enhance the processing.
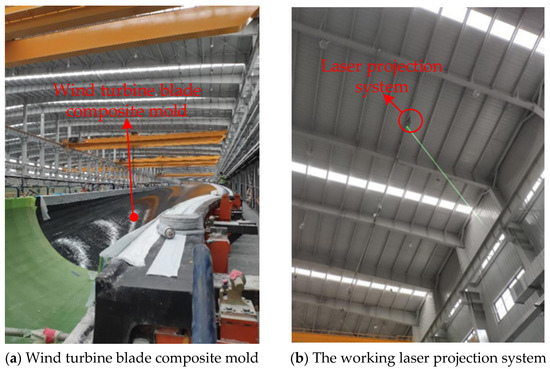
Figure 10.
Large-space laser projection experiment site.
Under the large-space condition, the projection plane coordinates of the target point are firstly obtained through the wireless target, and then the pose of the scanning galvanometer relative to the mold is solved using the pose-solver software.
In the process of projection, the scanning galvanometer generates aberrations in the projection due to small pose changes in vibration, and the mold also generates small deformations at all times.
After a period of projection imaging, the accumulated errors caused by aberrations and deformations will seriously affect the layup accuracy, so the pattern needs to be corrected.
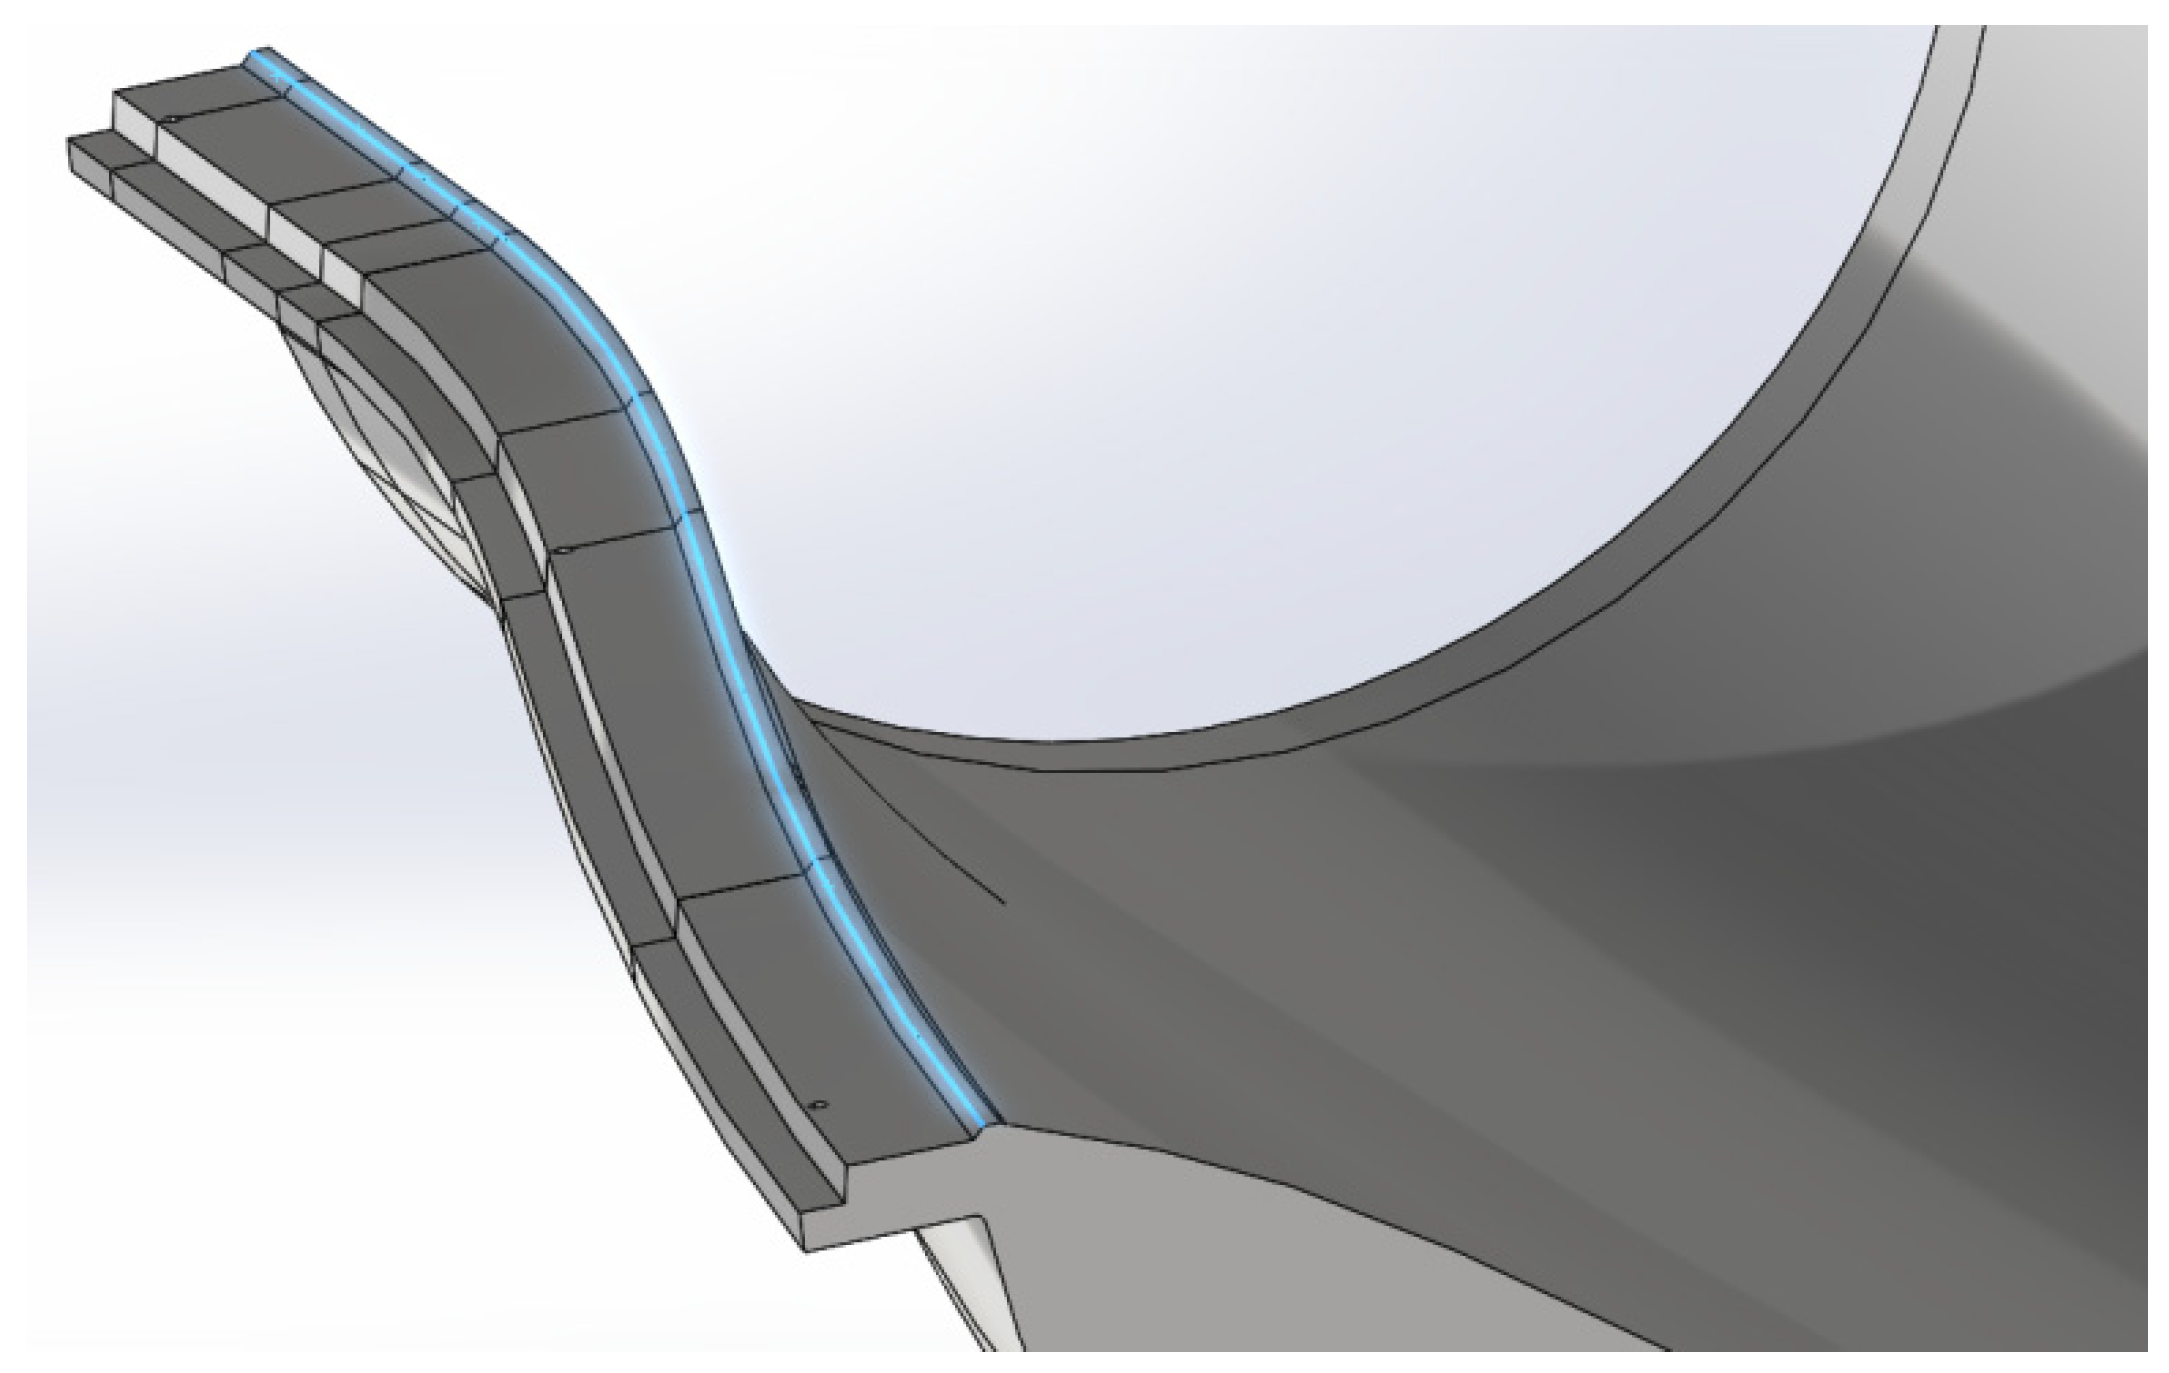
The projection of the contour line of a wind turbine blade mold is chosen from the outer edge of the first step of the mold, as shown in Figure 11.
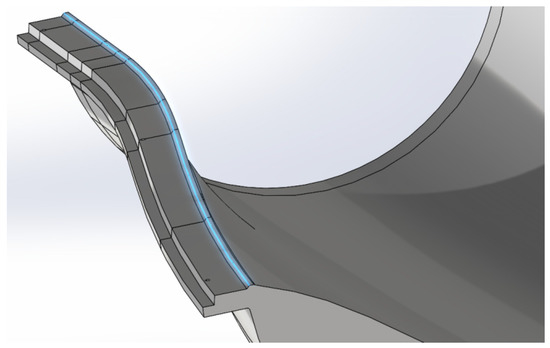
Figure 11.
Projection contour line.
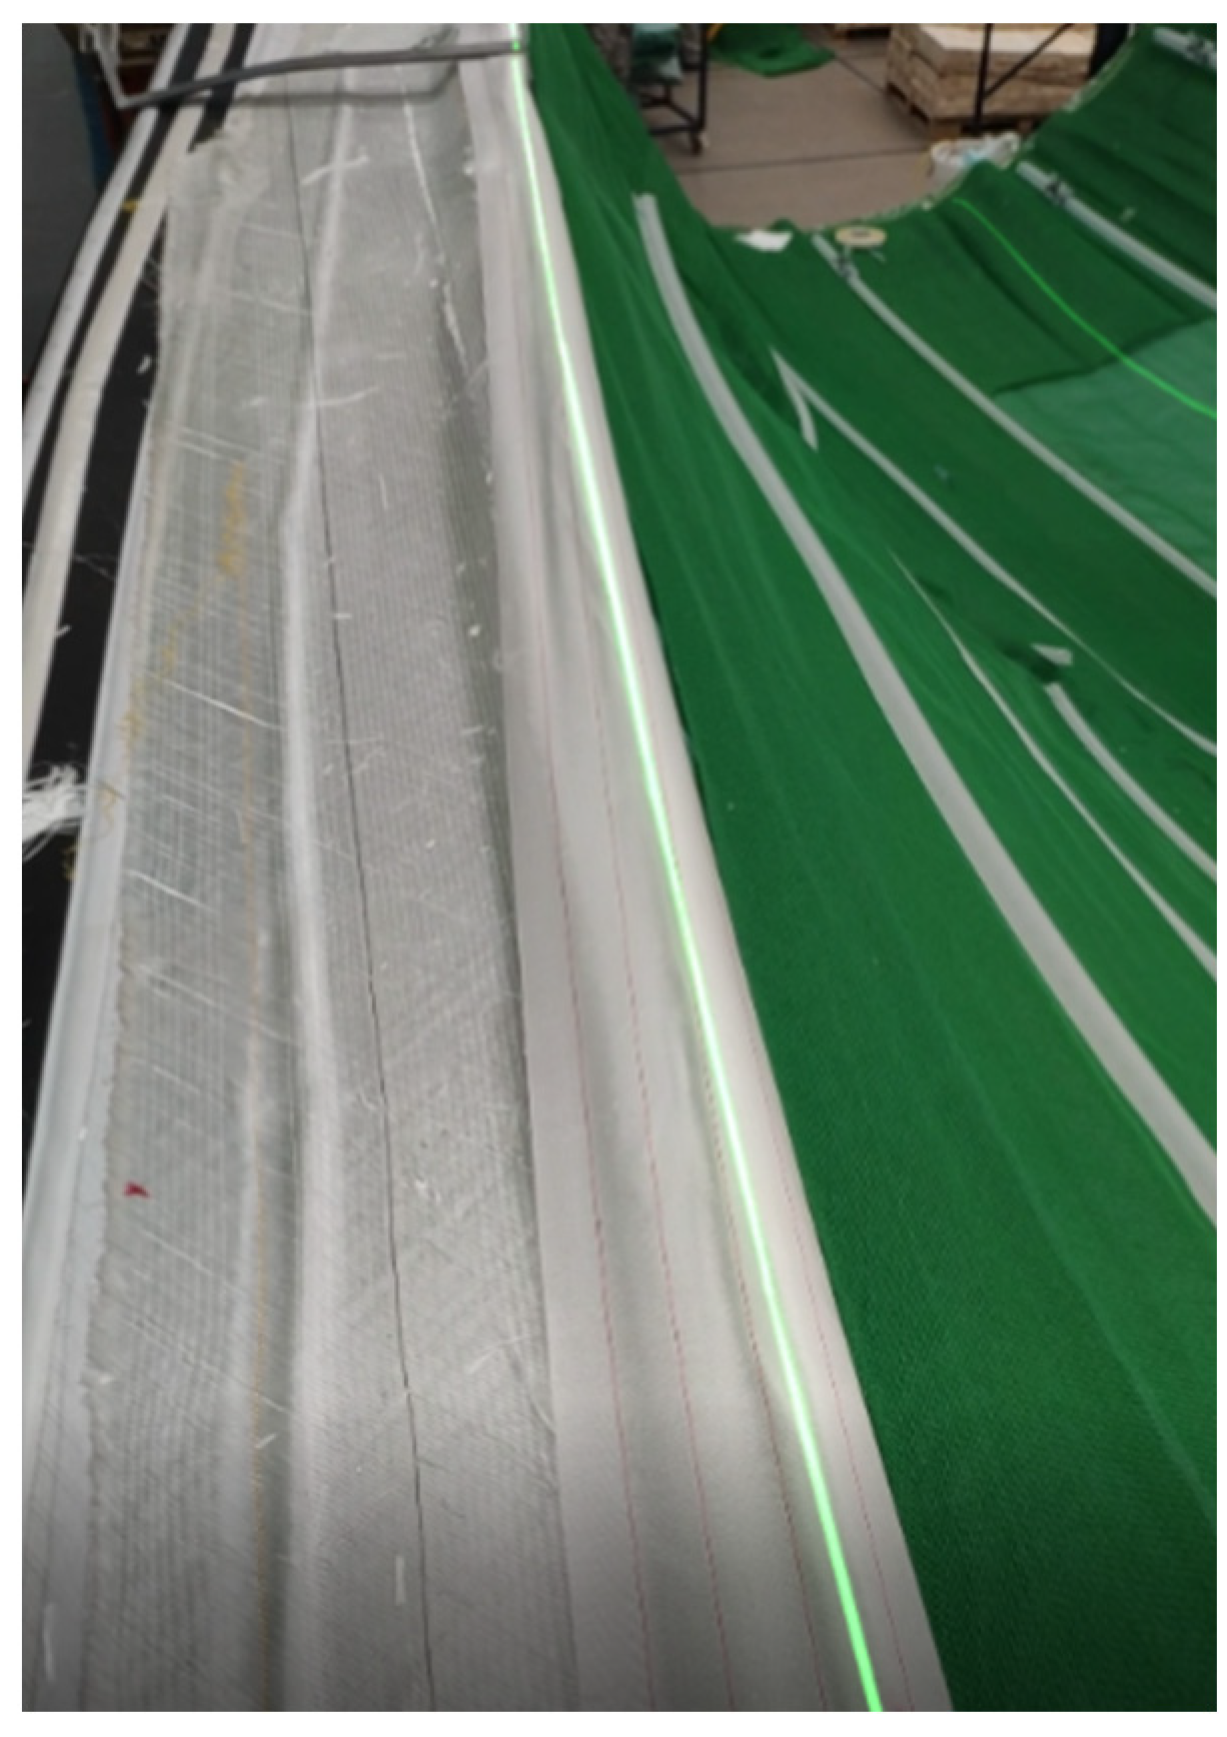
The search and projection states of the wireless target positions during the large-space projection are shown in Figure 12, Figure 13, Figure 14 and Figure 15.
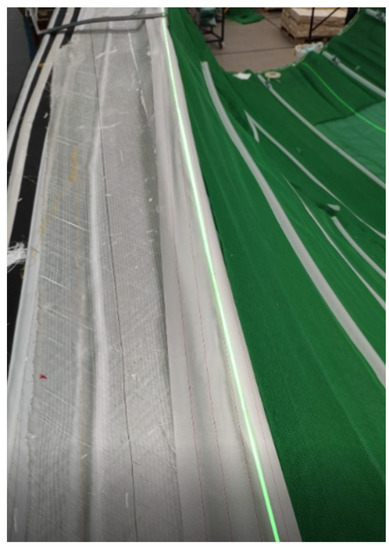
Figure 12.
The initial state of projection imaging.
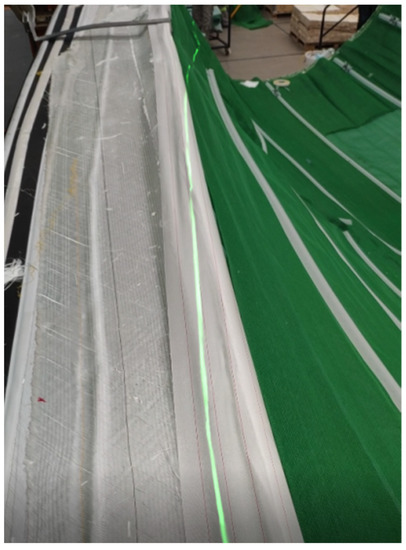
Figure 13.
Projection errors occur.

Figure 14.
Autocorrected 0~16 m target points.
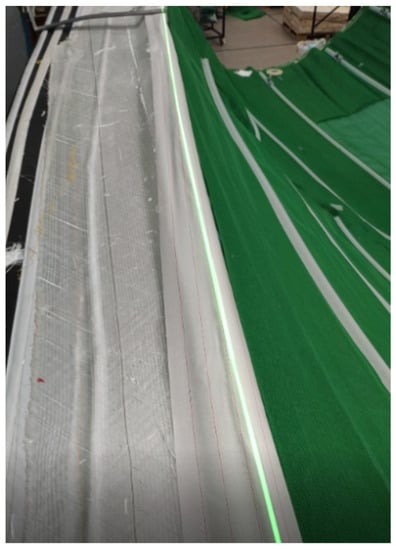
Figure 15.
Projected imaging status after autocorrection.
From the figures, one can observe that after a period of projection, the projection appears distorted, and the error between the projected contour line and the mold is shown in Figure 12 and Figure 13.
By using the meter marks on the mold as the target points, we can fix the wireless target at the meter mark, use the scanning galvanometer to search the wireless target, and project the meter mark position after the successful search, as shown in Figure 14.
After the projection pattern is corrected, the contour lines are reprojected to correspond to the mold, as shown in Figure 15.
5. Conclusions
This study presents a laser projection positioning technique based on a scanning galvanometer to address the problem of insufficient positioning accuracy and the high cost of auxiliary equipment in the production of large composite materials. The main contributions of this work can be summarized as follows:
1. Based on the projecting model of the scanning galvanometer, a solution to the scanning galvanometer pose calibration problem in the projection positioning of large composite materials is proposed, including a pose calculation and automatic correction technique for the projection.
2. Based on the solution of the PNP problem in computer vision, an improved genetic algorithm is proposed to optimize the results of calculating poses which has high accuracy and global convergence.
3. The 3D printing model projection experiments and large composite layup projection positioning tests are conducted. The results of the 3D printing model projection experiment show that the calculating accuracy of the relative pose based on the improved adaptive genetic algorithm achieves 0.0007 mm, which is better than the 1.115 mm accuracy of the solution of photographing the target with the camera. In addition, after a small deformation of the mold in the actual working conditions, the influences of the target localization point in the PNP problem in 2D and 3D coordinates on the algorithm are compared, and the optimized errors are respectively scaled to 2 mm and 0.2 mm. These numerical simulations and experimental results in real working conditions show that the proposed method has high accuracy, high robustness, and fast astringency, and it provides a candidate for projection positioning of large composite material layups.
Although the method proposed in this study is effective, there are also limitations. In futures work, as an extension for projection objects with large depth or thickness, the original projection pattern does not match the projected surface after the change of the pose, and the error increases with depth or thickness. The software can automatically redraw the projection pattern after calculating the pose, and its applicability and projection accuracy will be stronger. In the face of more optimization variables and complex shapes of the projected objects, the genetic algorithm cannot take advantage of the speed, so in subsequent research, methods such as deep learning or an extreme learning machine can be tried to improve the speed and robustness of pose calculation. This study did not validate the effect of the method using patterns or objects with known (calibrated) geometries, and such validation can be added in a subsequent study.
Author Contributions
Conceptualization, X.D. and Z.X.; methodology, Z.X. and X.D.; software, Z.X.; validation, Y.Z. and D.Z.; formal analysis, X.D.; investigation, Y.Z; resources, X.D.; data curation, Y.Z.; writing—original draft preparation, Z.X.; writing—review and editing, X.D. and D.Z.; visualization, Z.X.; supervision, X.D.; project administration, X.D.; funding acquisition, X.D. All authors have read and agreed to the published version of the manuscript.
Funding
This research was funded by National Key R&D Program of China (No. 2021YFB3900300) and the Fundamental Research Funds for the Central Universities (No. QTZX22160).
Institutional Review Board Statement
Not applicable.
Informed Consent Statement
Informed consent was obtained from all subjects involved in the study.
Data Availability Statement
The data presented in this study are available on request from the corresponding author. The data are not publicly available due to privacy and ethical restrictions.
Conflicts of Interest
The authors declare no conflict of interest.
References
- Qiao, J.; Yu, P.; Wu, Y.; Chen, T.; Du, Y.; Yang, J. A Compact Review of Laser Welding Technologies for Amorphous Alloys. Metals 2020, 10, 1690. [Google Scholar] [CrossRef]
- Wicker, R.; Medina, F.; Elkins, C. Multi-Material Stereolithography. U.S. Patent US7556490 B2, 7 July 2009. [Google Scholar]
- Wang, J.; Goyanes, A.; Gaisford, S.; Basit, A.W. Stereolithographic (SLA) 3D printing of oral modified-release dosage forms. Interna-Tional J. Pharm. 2016, 503, 207–212. [Google Scholar] [CrossRef] [PubMed]
- Sukman, Y.P.; Risser, C.J.; Gorham, E.W.; Schultz, D.W. Laser Material Processing System with Multiple Laser Sources Apparatus and Method. U.S. Patent US6313433B1, 6 November 2001. [Google Scholar]
- Dill, W.J.; Jennerjohn, P.E.; Solecki, P.G.; Panergo, R.R.; Vanavery, J.C.; Caton, L.M.; Manzer, P.J.; Lindley, D.A. Laser Projection Marking System. U.S. Patent US20090195753A1, 6 August 2009. [Google Scholar]
- Rueb, K.D.; Jackson, R.V.; Morden, J.V. Laser Projection Systems and Method. U.S. Patent US7545517 B2, 3 January 2007. [Google Scholar]
- Stann, B.L.; Ruff, W.C.; Sztankay, Z.G. Intensity-modulated diode laser radar using frequency-modulation/continuous-wave ranging techniques. Opt. Eng. 1996, 35, 3270–3278. [Google Scholar] [CrossRef]
- Google LLC. Patent Issued for In-Field Calibration of Laser Transmitter. U.S. Patent 10651946, 12 May 2020.
- Ding, L.; Li, S.; Lu, Z.; Wang, Y.; Zhu, C.; Chen, Y.; Du, P.; Zhang, H.; Cui, C.; Zhou, L.; et al. Analysis of the beam-pointing stability in the high power laser system. Opt.-Int. J. Light Electron Opt. 2016, 127, 6056–6061. [Google Scholar] [CrossRef]
- Pacheco, S.; Wang, C.; Chawla, M.K.; Nguyen, M.; Baggett, B.K.; Utzinger, U.; Barnes, C.A. High resolution, high speed, long working distance, large field of view confocal fluo-rescence microscope. Sci. Rep. 2017, 7, 13349. [Google Scholar] [CrossRef] [PubMed]
- Cassinelli, A.; Zerroug, A.; Watanabe, Y.; Ishikawa, M.; Angesleva, J. Camera-less Smart Laser Projector. In Proceedings of the SIGGRAPH Emerging Technologies, Los Angeles, CA, USA, 26–30 July 2010. [Google Scholar]
- Ilchev, S.; Andreev, R.; Ilcheva, Z. Display of computer-generated vector data by a laser projector. In Proceedings of the 21st International Conference on Computer Systems and Technologies’ 20, Ruse, Bulgaria, 19–20 June 2020; pp. 11–18. [Google Scholar]
- He, K.; Sui, C.; Huang, T.; Zhang, Y.; Zhou, W.; Chen, X.; Liu, Y.-H. 3D Surface reconstruction of transparent objects using laser scanning with LTFtF method. Opt. Lasers Eng. 2022, 148, 106774. [Google Scholar] [CrossRef]
- Xue, J.; Zhang, Q.; Li, C.; Lang, W.; Wang, M.; Hu, Y. 3D face profilometry based on galvanometer scanner with infrared fringe projection in high speed. Appl. Sci. 2019, 9, 1458. [Google Scholar] [CrossRef]
- Qin, F.; Zhang, D.; Xing, D.; Xu, D.; Li, J. Laser Beam Pointing Control With Piezoelectric Actuator Model Learning. IEEE Trans. Syst. Man Cybern. Syst. 2020, 50, 1024–1034. [Google Scholar] [CrossRef]
- Mao, Y.; Deng, C.; Xun, G.; Tian, J. The effect of physical parameters of inertial stabilization platform on disturbance rejection ability and its improvement method. Int. Soc. Opt. Photonics 2015, 9676, 96760U. [Google Scholar]
- Kaufman, S.P.; Arkady, S.; Masoud, M. Virtual Laser Projection System and Method. U.S. Patent US20170038195A1, 9 August 2016. [Google Scholar]
- Minoura, K.; Sugiura, M.; Minami, S.; Sato, T. Scanning Projection Device. U.S. Patent US4293184 A, 6 October 1981. [Google Scholar]
- Dorsey-Palmateer, J.W.; Harbor, G. Method for Controlling Projection of Optical Layup Template Utilizing Cooperative Targets. U.S. Patent US5450147A, 12 September 1995. [Google Scholar]
- Hayes, M.W.; Baer, D.M. Method of Assembling an Article Using Laser Light Projection and a Photoreactive Material. WO2005072903A3, 11 August 2005. [Google Scholar]
- Kaufman, S.P.; Savikovsky, A.; Chagaris, C.C.; Stave, J. Laser Radar Projection with Object Feature Detection and Ranging. U.S. Patent US8085388 B2, 27 December 2011. [Google Scholar]
- Behan, W.M.; Bagwill, T.L. Methods, Systems, and Formats for Data, Such as Data Used in Laser Projection of Fasteners Used in Manufacturing. U.S. Patent US9527149B2, 8 August 2013. [Google Scholar]
- Bordignon, R.M.; Rueb, K.; Wieczorek, J. Laser Projector for Projecting an Image onto a Curvilinear Surface. U.S. Patent US5381258A, 10 January 1995. [Google Scholar]
- Kaufman, S.P.; Savikovsky, A.; Chagaris, C.C.; Stave, J. Laser Projection with Object Feature Detection. U.S. Patent EP1851588 A2, 11 December 2007. [Google Scholar]
- Morden, J.V.; Rueb, K.D. Laser Projection System, Intelligent Data Correction System and Method. U.S. Patent US20050121422, 27 July 2006. [Google Scholar]
- Rueb, K.D.; Jackso, V.R.; Morden, J.V. Laser Projection Systems and Methods. U.S. Patent 7,986,417, 26 July 2011. [Google Scholar]
- Sivertsen, C.G. Laser Projection System Projecting Content Based on Information Collected from Nearby Targets. U.S. Patent US09292757B1, 22 March 2016. [Google Scholar]
- Kaufman, S.P.; Mettinen, K.J.; Mohazzab, M.; Savikovsky, A.; Stave, J.H. 3D Laser Projection, Scanning and Object Tracking. U.S. Patent US9826207, 9 February 2017. [Google Scholar]
- Rueb, K.D. Laser Projection System with Motion Compensation and Method. U.S. Patent US9,881,383, 30 January 2018. [Google Scholar]
- Katoch, S.; Chauhan, S.S.; Kumar, V. A review on genetic algorithm: Past, present, and future. Multimed. Tools Appl. 2021, 80, 8091–8126. [Google Scholar] [CrossRef] [PubMed]
- Hassanat, A.; Almohammadi, K.; Alkafaween, E.; Abunawas, E.; Hammouri, A.; Prasath, V.B.S. Choosing mutation and crossover ratios for genetic algorithms—A review with a new dynamic approach. Information 2019, 10, 390. [Google Scholar] [CrossRef]
Disclaimer/Publisher’s Note: The statements, opinions and data contained in all publications are solely those of the individual author(s) and contributor(s) and not of MDPI and/or the editor(s). MDPI and/or the editor(s) disclaim responsibility for any injury to people or property resulting from any ideas, methods, instructions or products referred to in the content. |
© 2023 by the authors. Licensee MDPI, Basel, Switzerland. This article is an open access article distributed under the terms and conditions of the Creative Commons Attribution (CC BY) license (https://creativecommons.org/licenses/by/4.0/).


