Article

A Novel Feature for Fault Classification of Rotating Machinery: Ternary Approximate Entropy for Original, Shuffle and Surrogate Data

School of Machinery and Automation, Weifang University, No. 5147 Dong Feng Dong Street, Weifang 261061, China
*
Author to whom correspondence should be addressed.
Machines 2023, 11(2), 172; https://doi.org/10.3390/machines11020172
Submission received: 10 January 2023 / Revised: 19 January 2023 / Accepted: 25 January 2023 / Published: 27 January 2023
(This article belongs to the Section Turbomachinery)

Abstract

:
Existing works have paid scant attention to the multivariate entropy of complex data. Thus, existing methods perform poorly in fully exposing the nature of complex data. To mine a rich vein of data features, this paper applies a shuffle and surrogate approach to complex data to decouple probability density information from correlation information and then obtain shuffle data and surrogate data. Furthermore, this paper applies approximate entropy (ApEn) to individually estimate complexities and irregularities of the original, the shuffle, and the surrogate data. As a result, this paper develops a ternary ApEn approach by integrating the ApEn of the original, shuffle, and surrogate data into a three-dimensional vector for describing the dynamics of complex data. Next, the proposed ternary ApEn approach is compared with conventional temporal statistics, conventional ApEn, two-dimensional energy entropy based on empirical mode decomposition or wavelet decomposition, and binary ApEn using both gear vibration data and roller-bearing vibration data containing different types and severity of faults. The results suggest that the ternary ApEn approach is superior to the other methods in identifying the conditions of rotating machinery.

1. Introduction

Rotating machinery, widely applied in various industrial landscapes, plays a central role in industrial production [1]. In this sense, a fault occurring in rotating machinery usually results in an appreciable loss. Therefore, condition monitoring of rotating machinery is very important for ensuring its safe operation. Vibration data of rotating machinery, which generally works in non-stationary conditions, generally demonstrate complex properties. As a result, it is hard to completely reveal the nature of the vibration data of rotating machinery.
Traditional temporal statistics, such as skewness and kurtosis, which are devoted to the analysis of stationary and linear data, are unsuitable as indicators of machinery conditions in non-stationary and nonlinear circumstances. Recently, some temporal statistics of vibration signals have been exploited to classify cutting tools [2,3]. Currently, many time-frequency analysis (TFA) methods, such as wavelet decomposition (WD) [4], empirical mode decomposition (EMD) [5], and variational mode decomposition (VMD) [6], have been advanced for feature extraction of vibration data of rotating machinery. Unfortunately, these TFA methods encounter some difficulties in the analysis of complex data [7]. For example, a blindly selected basis function for the use of WT, mode aliasing and endpoint effects that EMD suffers from and difficulties in further determining some parameters of VMD. As such, these limitations seemingly restrict the use of these TFA methods. Moreover, some entropic methods, such as approximate entropy (ApEn) [8], sample entropy (SaEn) [9], and permutation entropy (PeEn) [10], have been exploited for gaining considerable insight into the dynamics of complex vibration data. Traditionally, each of these entropic methods is apt to reduce complex vibration data to a single feature. However, it seems difficult to accurately reflect the nature of complex vibration data in terms of a single parameter. This led to a multiscale entropic approach being developed for investigating complex vibration data by multiple features [11,12]. Nevertheless, an average scheme in the multiscale entropic approach easily incurs a loss of local features of data. In addition, chaotic and fractal methods were adopted to explore complex vibration data [13,14]. However, chaotic methods typically face difficulties in determining embedding dimensions and time lags, while traditional fractal methods are frequently disturbed by non-stationary trends [15,16]. Detrended fluctuation analysis (DFA) was proposed for analyzing complex vibration data [17]. However, DFA struggles to accurately depict the nature of complex vibration data by a single scaling exponent [18]. In light of this, multifractal DFA (MFDFA) was put forward for uncovering the nature of complex vibration data [18]. Even so, MFDFA runs into difficulties in determining the order and the type of data trend [16]. Latterly, intelligent fault diagnosis methods based on machine learning have attracted considerable attention [19,20,21]. However, currently, the application of machine learning to fault diagnosis of machinery faces some challenges, such as poor quality of big data, imbalanced health states, and uninterpretable features and results [19].
Recently, some works have demonstrated that shuffle data and surrogate data contain distinctly different dynamics from original data [16,22,23]. In fact, the shuffle of data can retain the distribution of the probability density functions (PDFs) of the original data but destroy the spectral properties of the original data. In contrast, a surrogate of the data can inherit the spectral properties of the original data but discard their PDF properties [24]. Thus, original, shuffle and surrogate data reflect compound, PDF, and spectral properties of data, respectively. Consequently, it is necessary to mine a rich vein of properties of these three data types to clearly understand the nature of complex data. Nevertheless, current research pays scant attention to this point. Consequently, existing methods may lack enough abilities to completely uncover the essence of complex vibration data. To overcome this deficiency, this paper first applies a shuffle and surrogate approach to data for separating PDF information from spectral information of the original data and then acquires shuffle data and surrogate data. In addition, this paper exploits ApEn to examine the original, shuffle, and surrogate data. Next, a novel ternary ApEn is constructed by integrating the ApEn of the original, shuffle, and surrogate data into a three-dimensional vector for describing the dynamics of the complex vibration data. Consequently, this paper advances a novel feature for fault classification of rotating machinery. In addition, the performance of the proposed method is benchmarked against traditional temporal statistics, traditional ApEn, two-dimensional energy entropy (EnEn) based on EMD or WD, and binary ApEn using both gear vibration data and roller-bearing vibration data containing different types and severity of faults. The results show that the proposed method in this paper delivers a better performance than the other approaches in fault classification of rotating machinery.
This paper is organized as follows. Section 2 formulates ApEn and develops ternary ApEn for fault classification of rotating machinery. In Section 3, the proposed method in this paper is compared experimentally with traditional temporal statistics, traditional ApEn, two-dimensional EnEn based on EMD or WD, and binary ApEn. Section 4 discusses the results and Section 5 concludes this paper.

2. Materials and Methods

2.1. ApEn

For a time series u ( n ) , 1 n N , construct a vector x ( i ) = [ u ( i ) , u ( i + 1 ) , , u ( i + m 1 ) ] , 1 i N m + 1 . Here, N indicates the length of the series u ( n ) and m represents a positive integer [8]. Firstly, one defines
d [ x ( i ) , x ( j ) ] = max k = 1 , 2 , , m [ | u ( i + k 1 ) u ( j + k 1 ) | ]
For each i , 1 i N m + 1 , one defines
C i m ( r ) = { number of j such that d [ x ( i ) , x ( j ) ] r } / ( N m + 1 )
Here, r stands for a positive real number. Subsequently, a definition is given as follows.
Φ m ( r ) = i = 1 N m + 1 log C i m ( r ) / ( N m + 1 )
Thus, the ApEn of the series u ( n ) is defined as [8]
A p E n ( m , r , N ) = Φ m ( r ) Φ m + 1 ( r )

2.2. Fault Classification of Rotating Machinery Based on Ternary ApEn

(1) For a series u ( n ) , 1 n N , its shuffle series u s h u f ( l ) , 1 l N , is defined as u s h u f = r a n d o m { [ u ( 1 ) , u ( 2 ) , , u ( N ) ] } . Here, the symbol r a n d o m ( ) means to randomize the order of a series. MATLAB codes for data shuffling are provided in Appendix A.
(2) Conduct a fast Fourier transform (FFT) for the series u ( n ) :
U ( k ) = n = 1 N { u ( n ) exp [ j 2 π ( k 1 ) ( n 1 ) / N ] } = A ( k ) exp [ j φ ( k ) ] ,   1 k N
Here, A ( k ) = | U ( k ) | and φ ( k ) stand for the amplitude and the phase of U ( k ) , respectively. Then, let ϕ ( k ) represent pseudo independent and identically distributed quantities in a range of ( 0 , 2 π ) and substitute ϕ ( k ) for φ ( k ) . Thus, one obtains a surrogate series in the frequency domain as
U s u r r ( k ) = A ( k ) exp [ j ϕ ( k ) ] , 1 k N
Next, implement inverse FFT for U s u r r ( k ) and obtain a complex series
c ( n ) = 1 N k = 1 N { U s u r r ( k ) exp [ j 2 π ( k 1 ) ( n 1 ) / N ] }
Then, take the real part of c ( n ) and acquire a surrogate series
u s u r r ( n ) = r e a l [ c ( n ) ]
Here, the symbol r e a l ( ) means to take the real part. MATLAB codes for generating surrogate versions of the data are provided in Appendix B.
(3) Calculate the ApEn of the original series u ( n ) , the shuffle series u s h u f ( n ) , and the surrogate series u s u r r ( n ) . Here, ApEn o r i g , ApEn s h u f , and ApEn s u r r serve to represent ApEn of u ( n ) , u s h u f ( n ) , and u s u r r ( n ) , respectively. Thus, the three-dimensional vector [ ApEn o r i g , ApEn s h u f , ApEn s u r r ] is defined as the ternary ApEn for elucidating the nature of u ( n ) .
(4) Apply the ternary ApEn to identify the conditions of rotating machinery.
An illustration of the ternary ApEn is given in Figure 1.

3. Results

3.1. Fault Classification of Gears

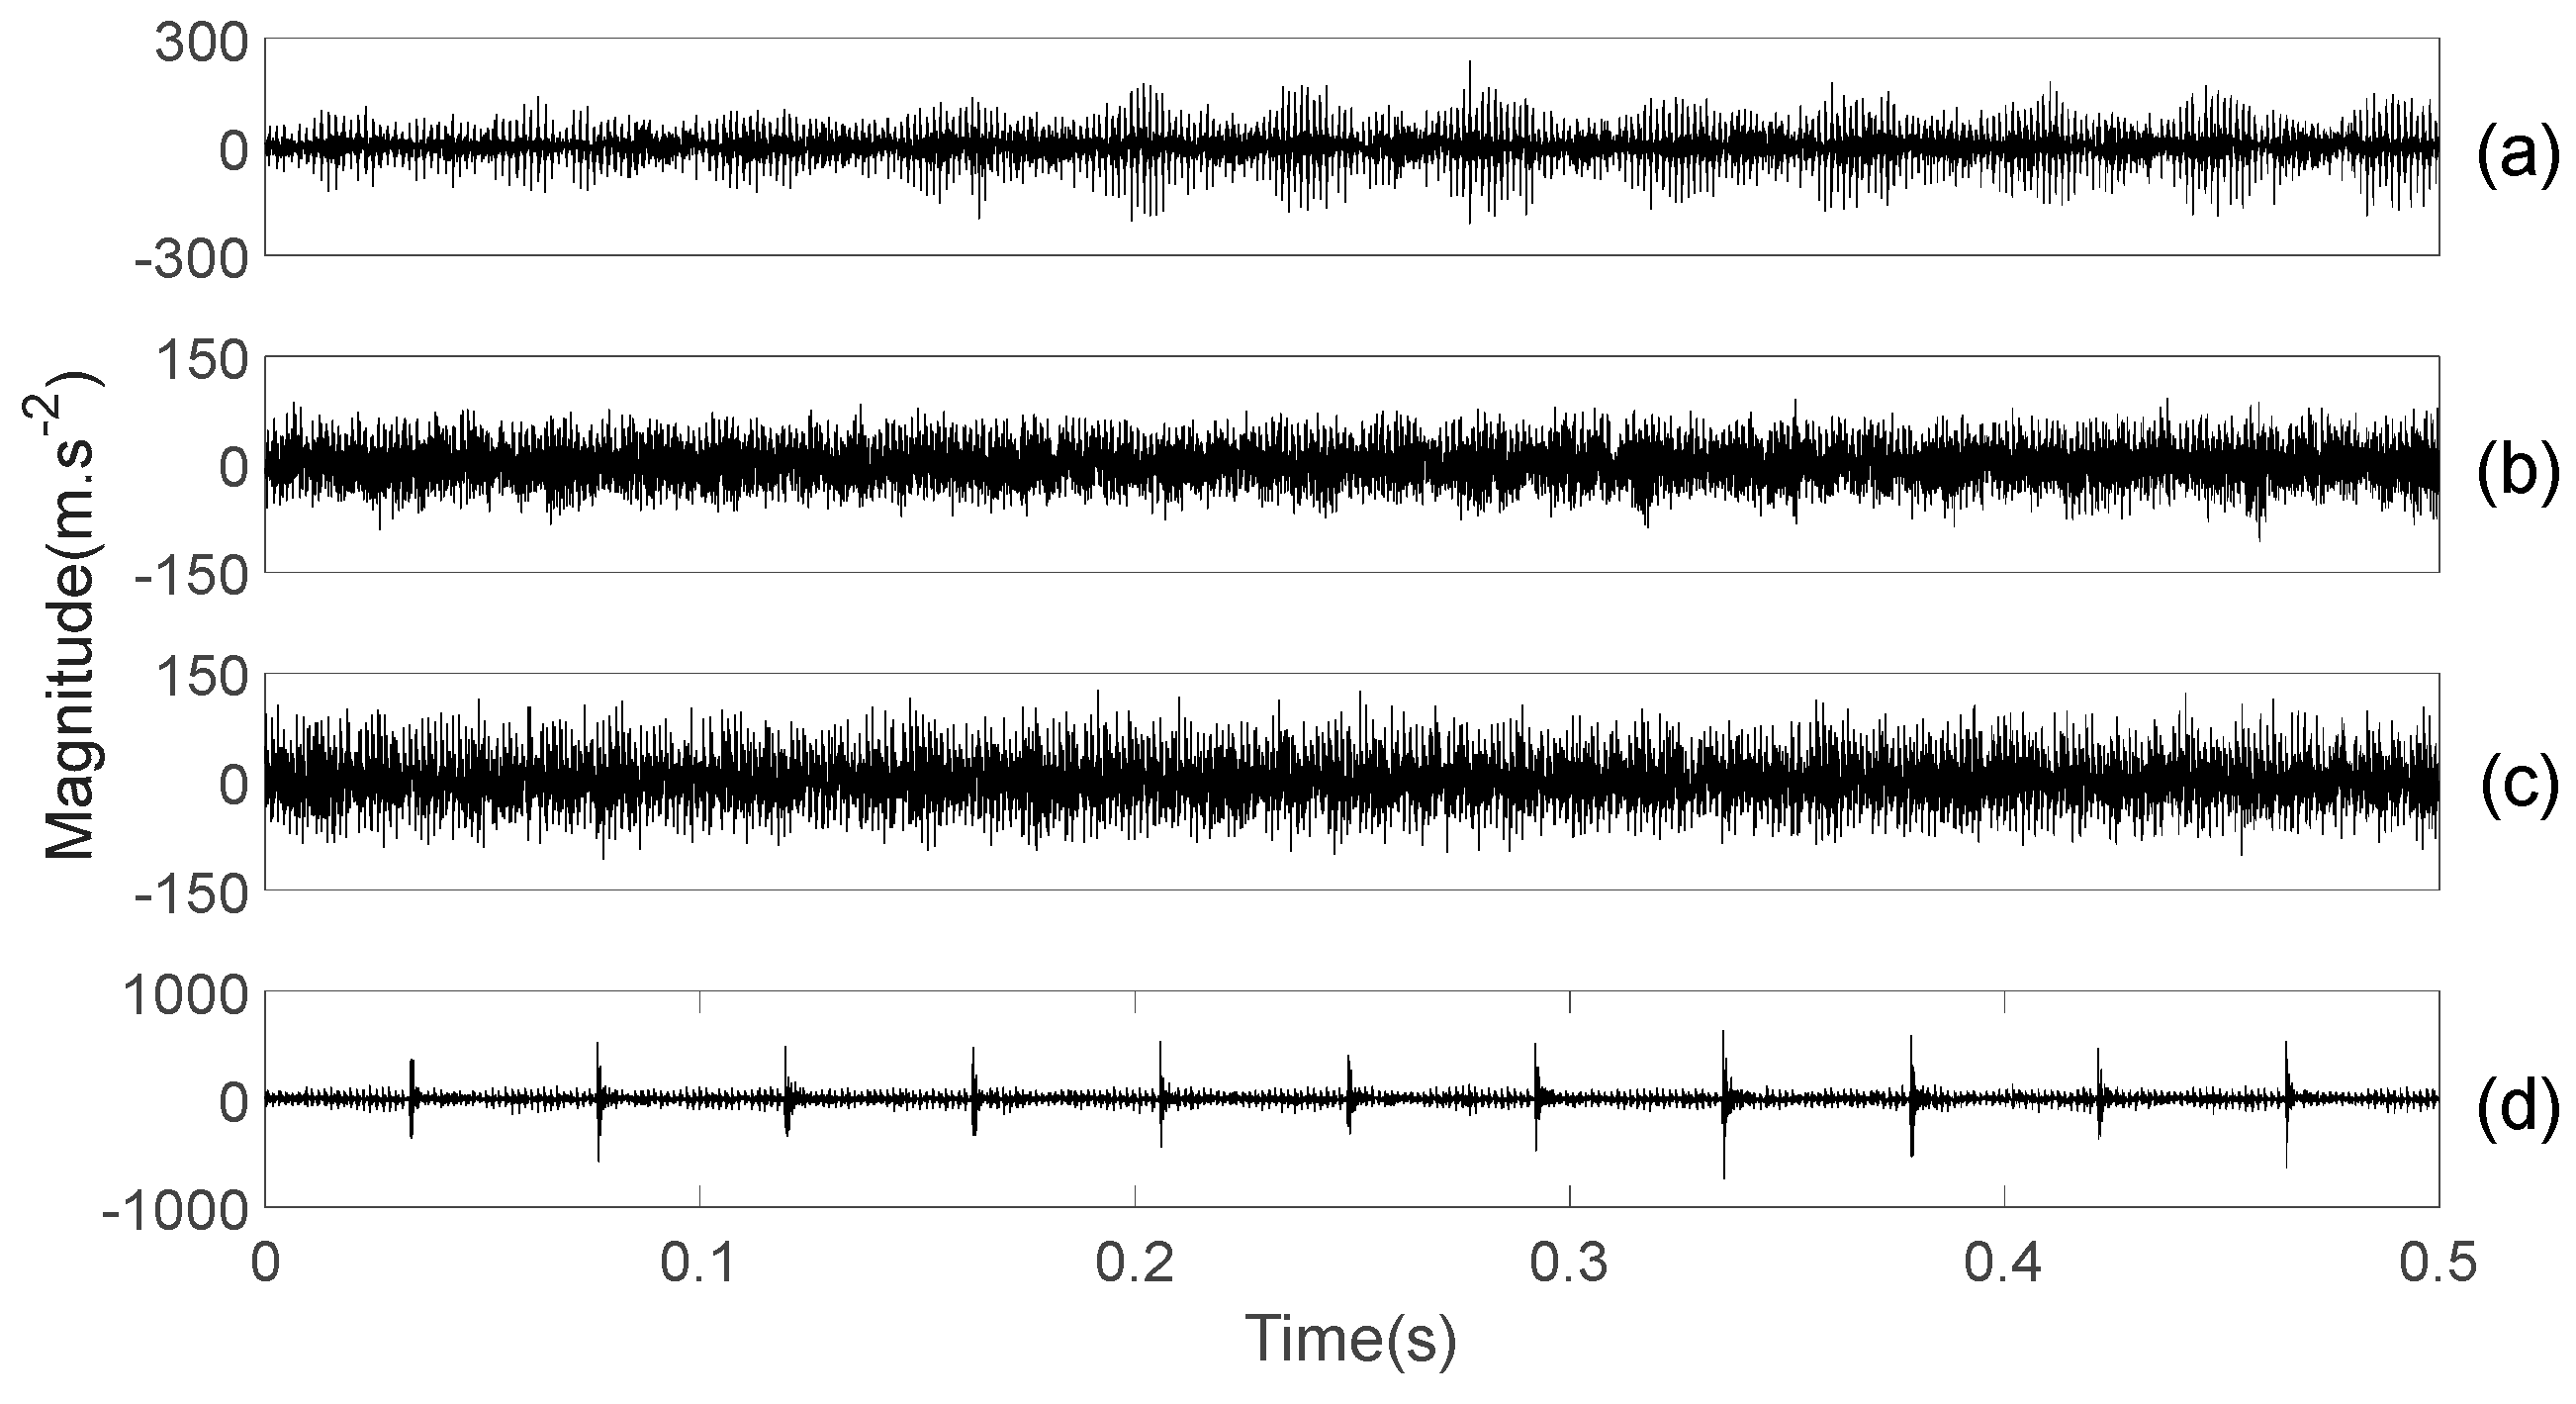
As shown in Figure 2, the gear vibration data used in this paper were gathered from a four-speed motorcycle gearbox, which was driven by an electrical motor with a constant nominal rotating speed of 1420 RPM [25]. In the gear experiment, four shock absorbers were placed under the bases of the testbed to isolate it from vibration from the ground. Vibration data were collected from the housing near the input shaft of the gearbox. Additionally, four different types of gear conditions were considered: normal, slightly worn, medium-worn, and broken-tooth. Here, two similar types of gear fault, i.e., slightly worn and medium-worn, were specially introduced for evaluating the effectiveness of the proposed method. Eight pieces of data were collected for each of these four types of gear condition, each piece with a sampling frequency of 16,384 Hz and a data size of 8192. These four types of gear vibration data are given in Figure 3.
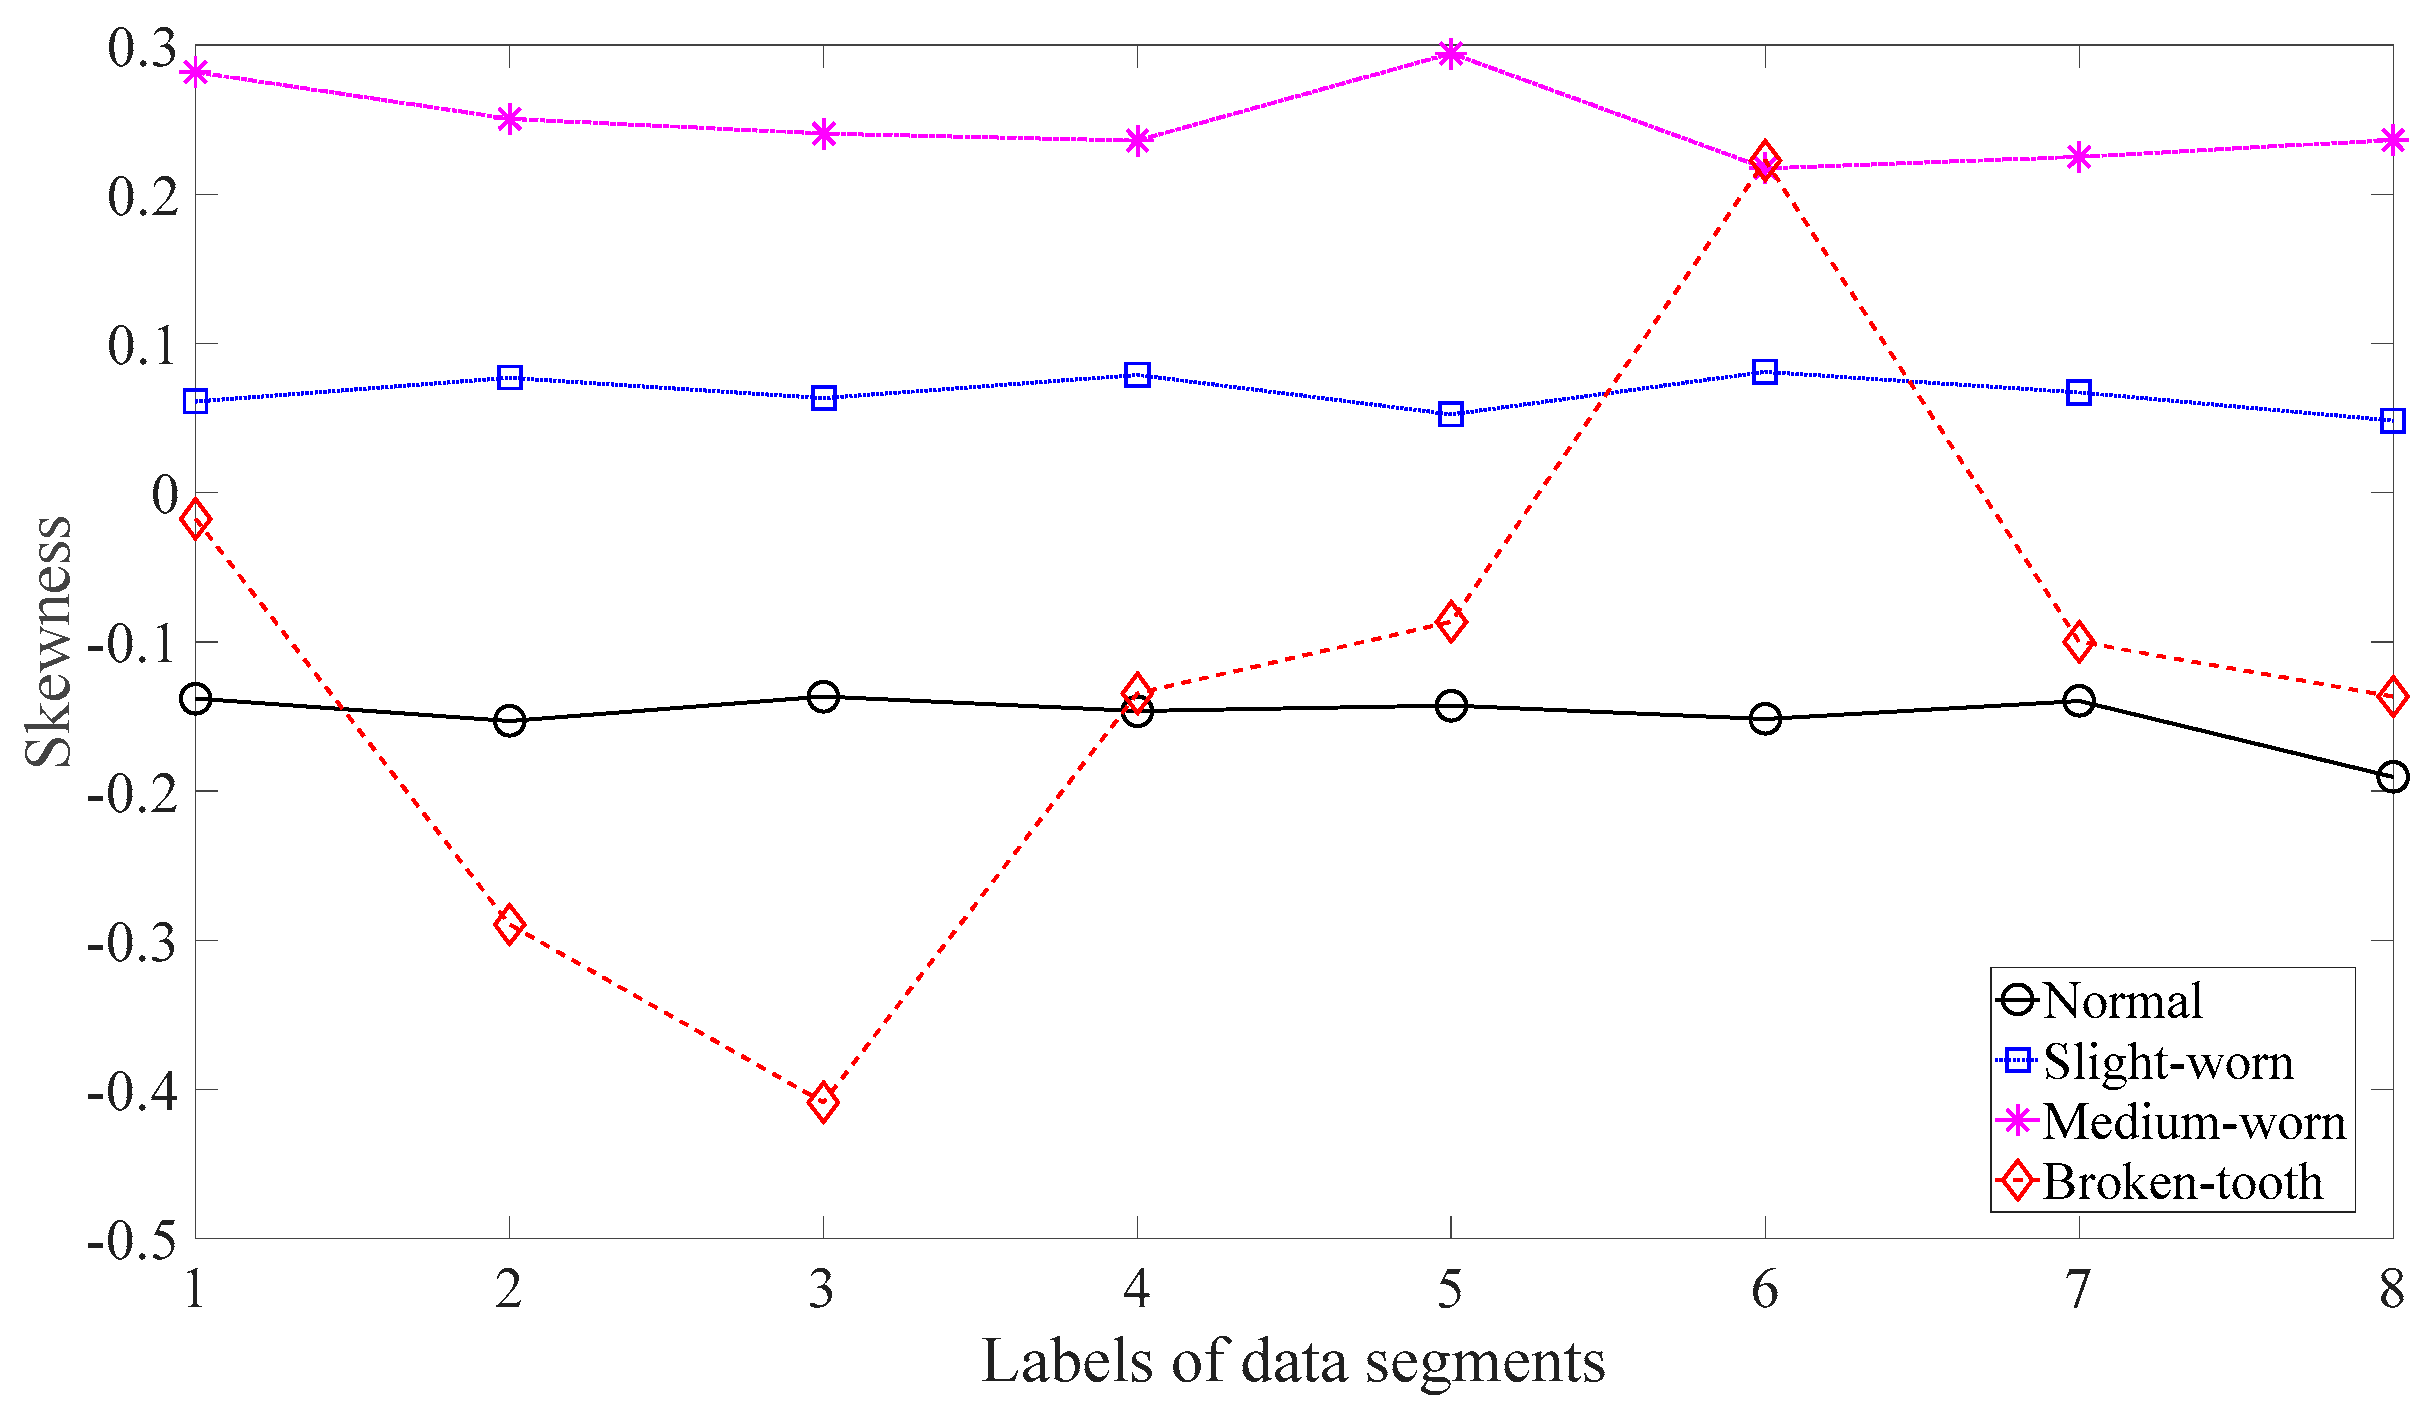
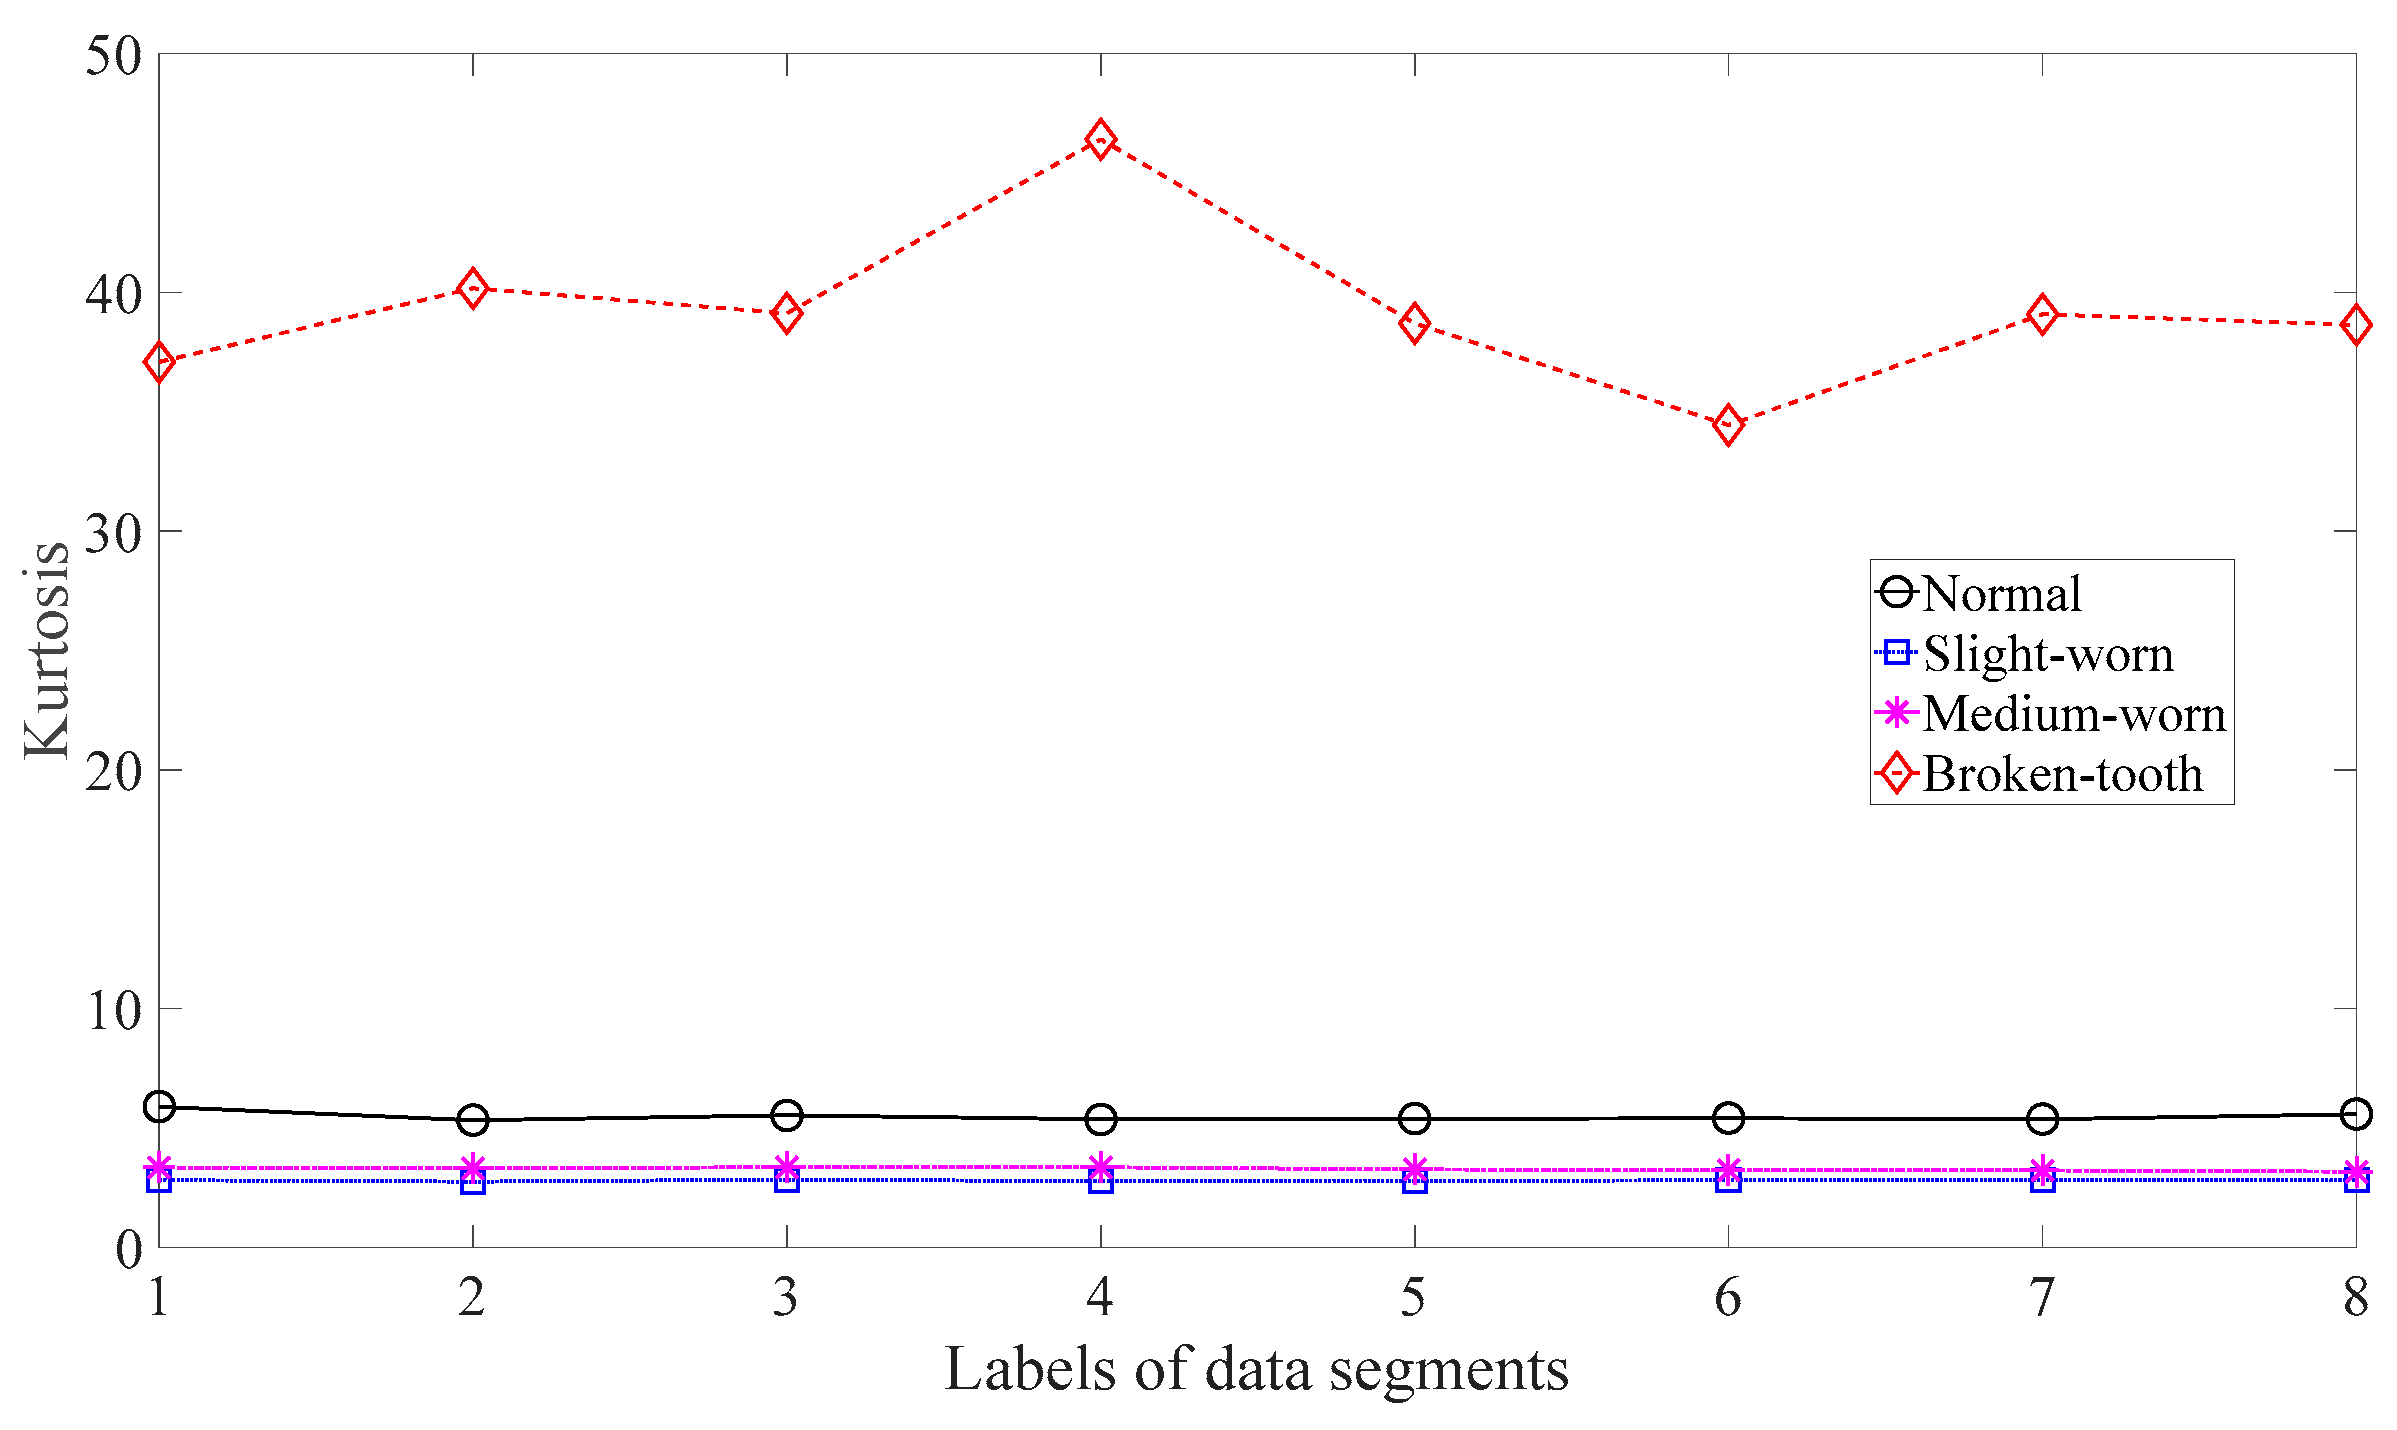
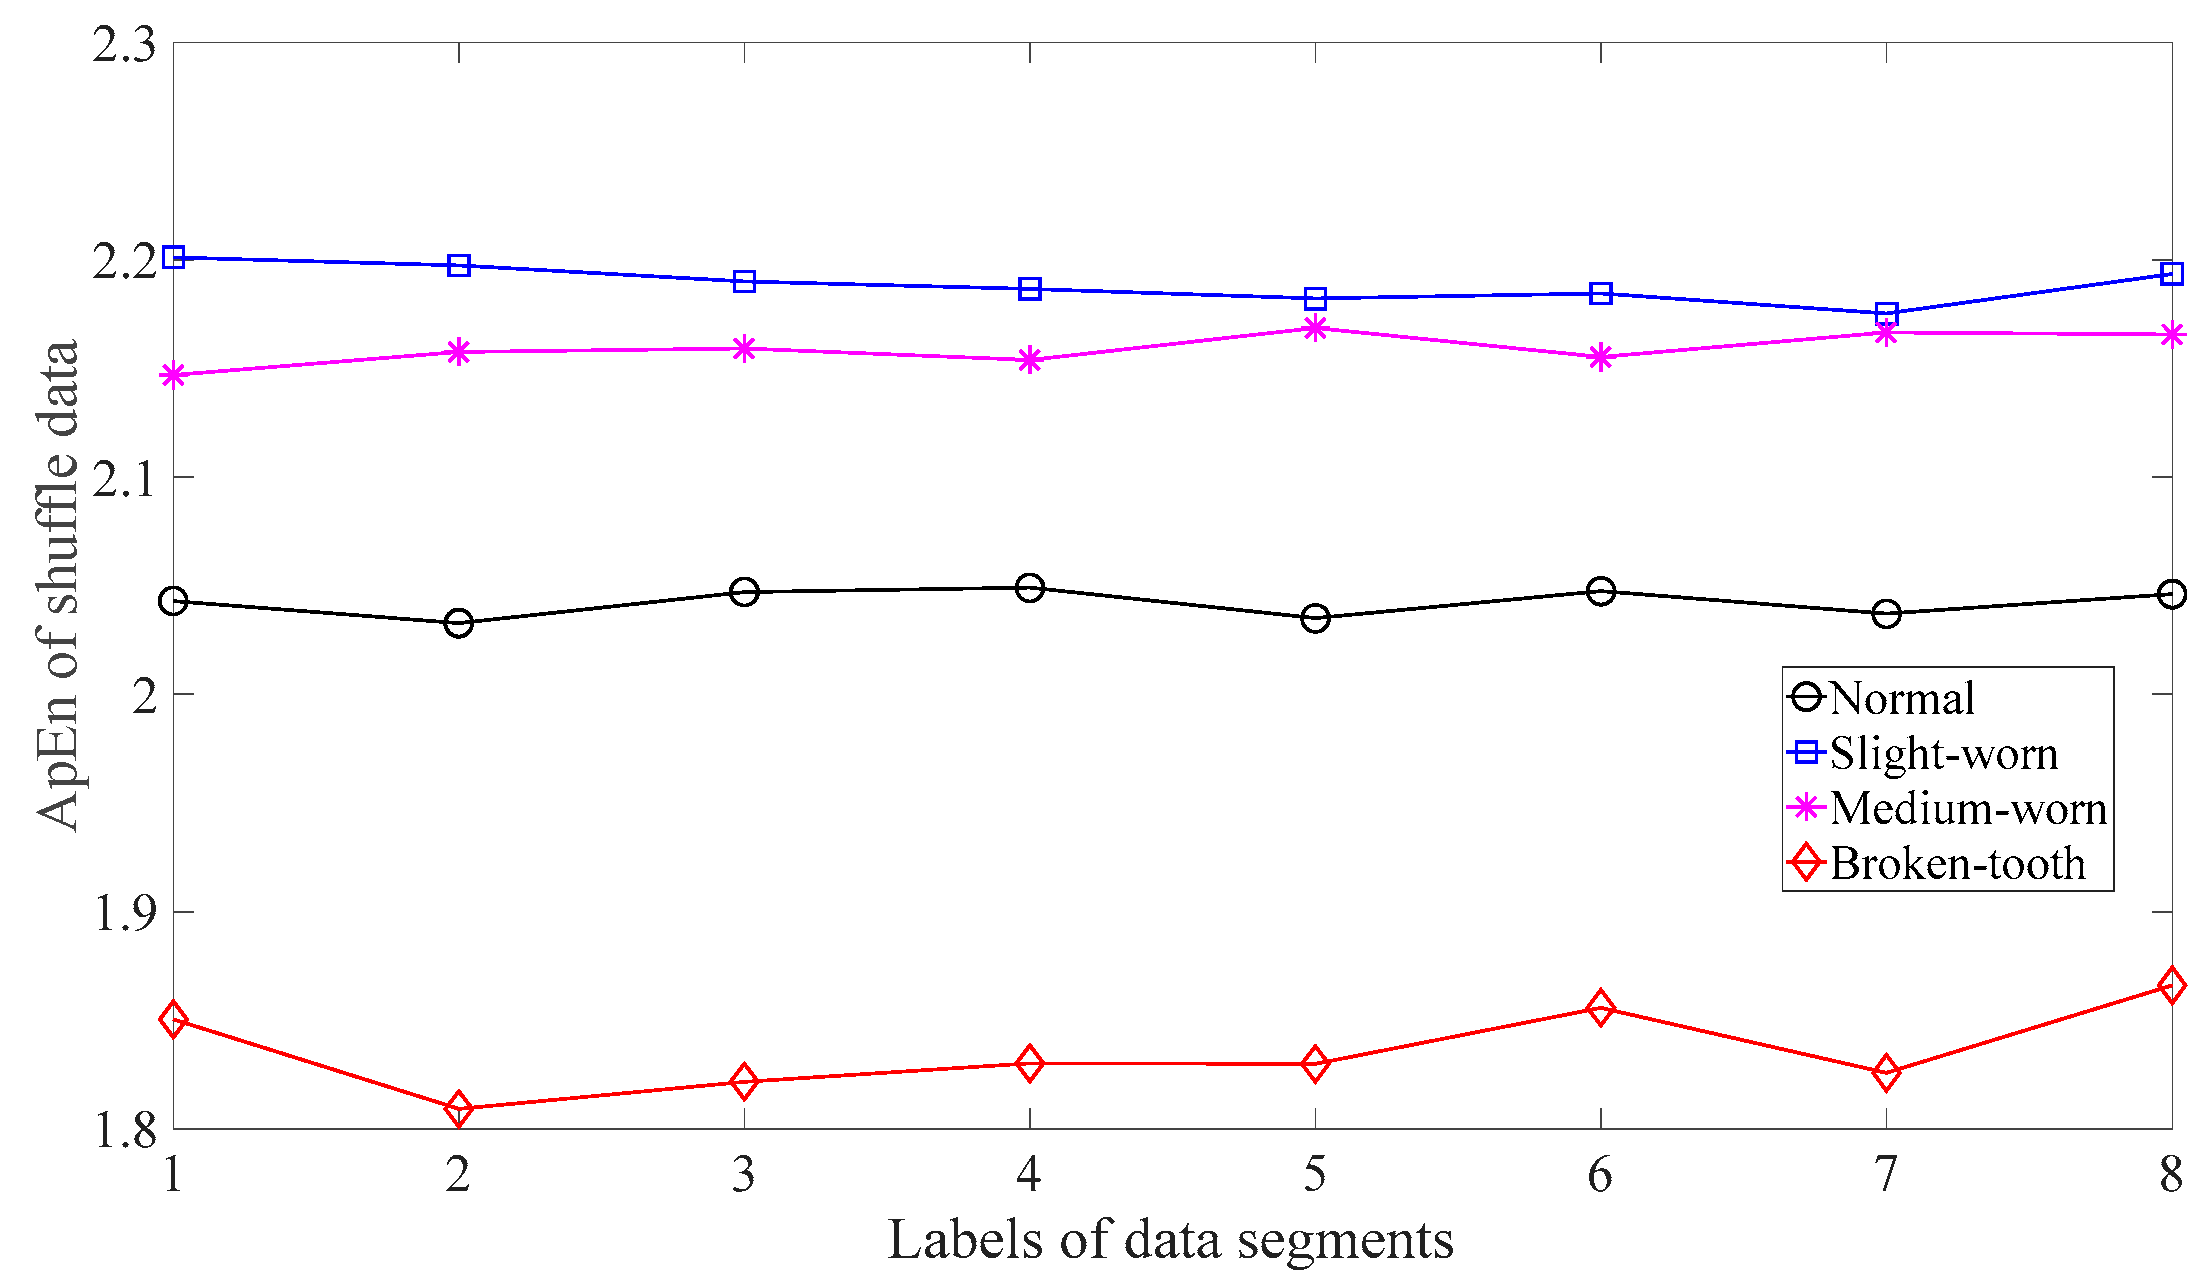
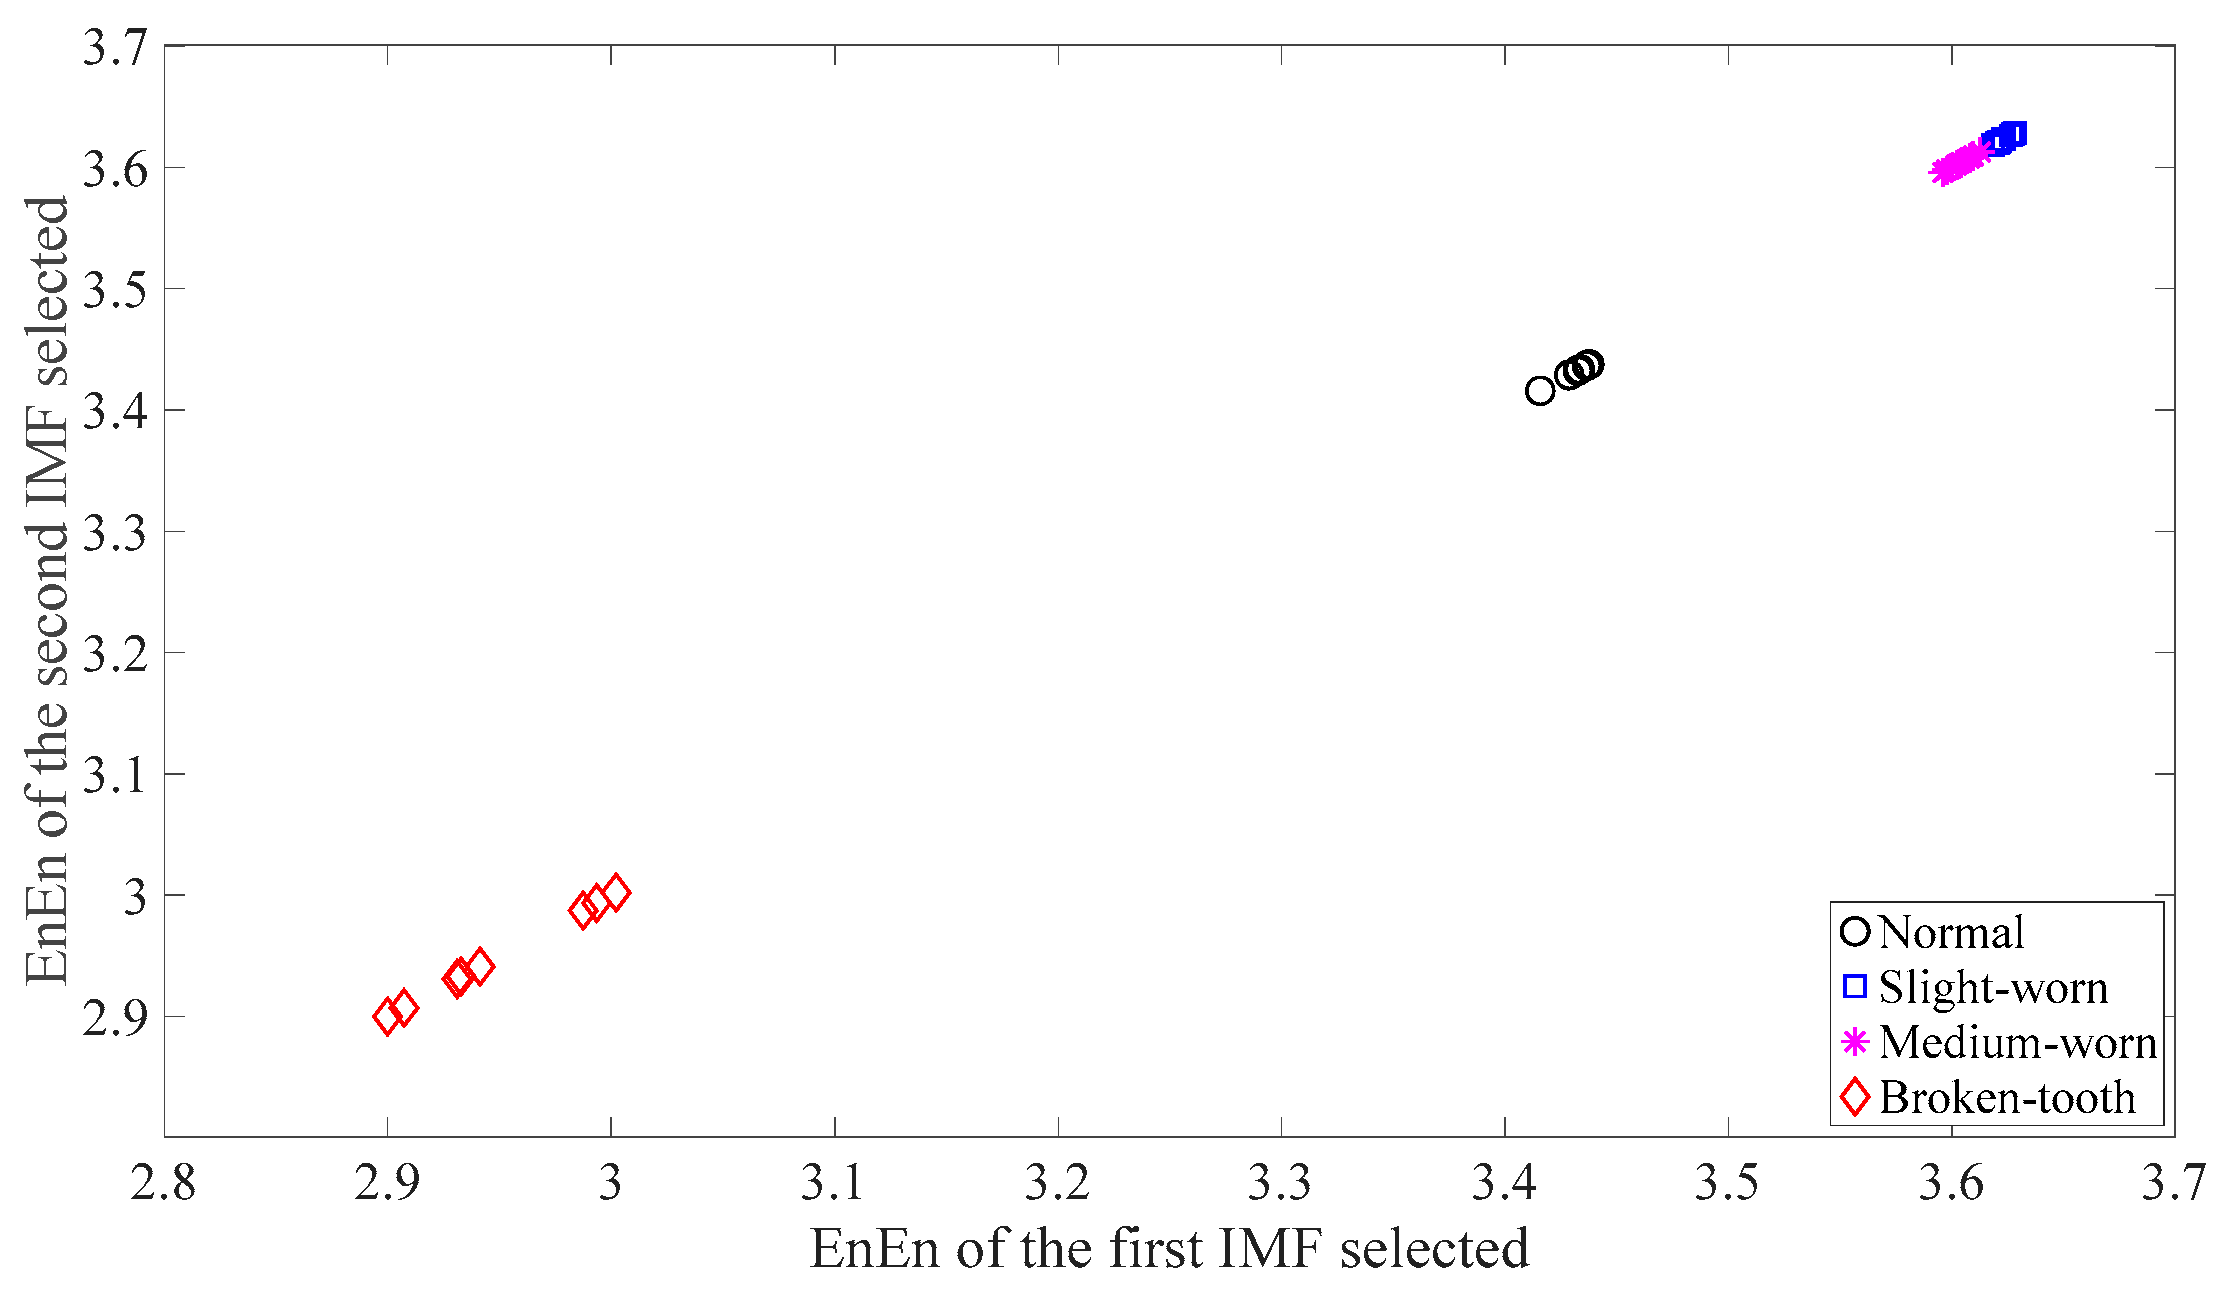
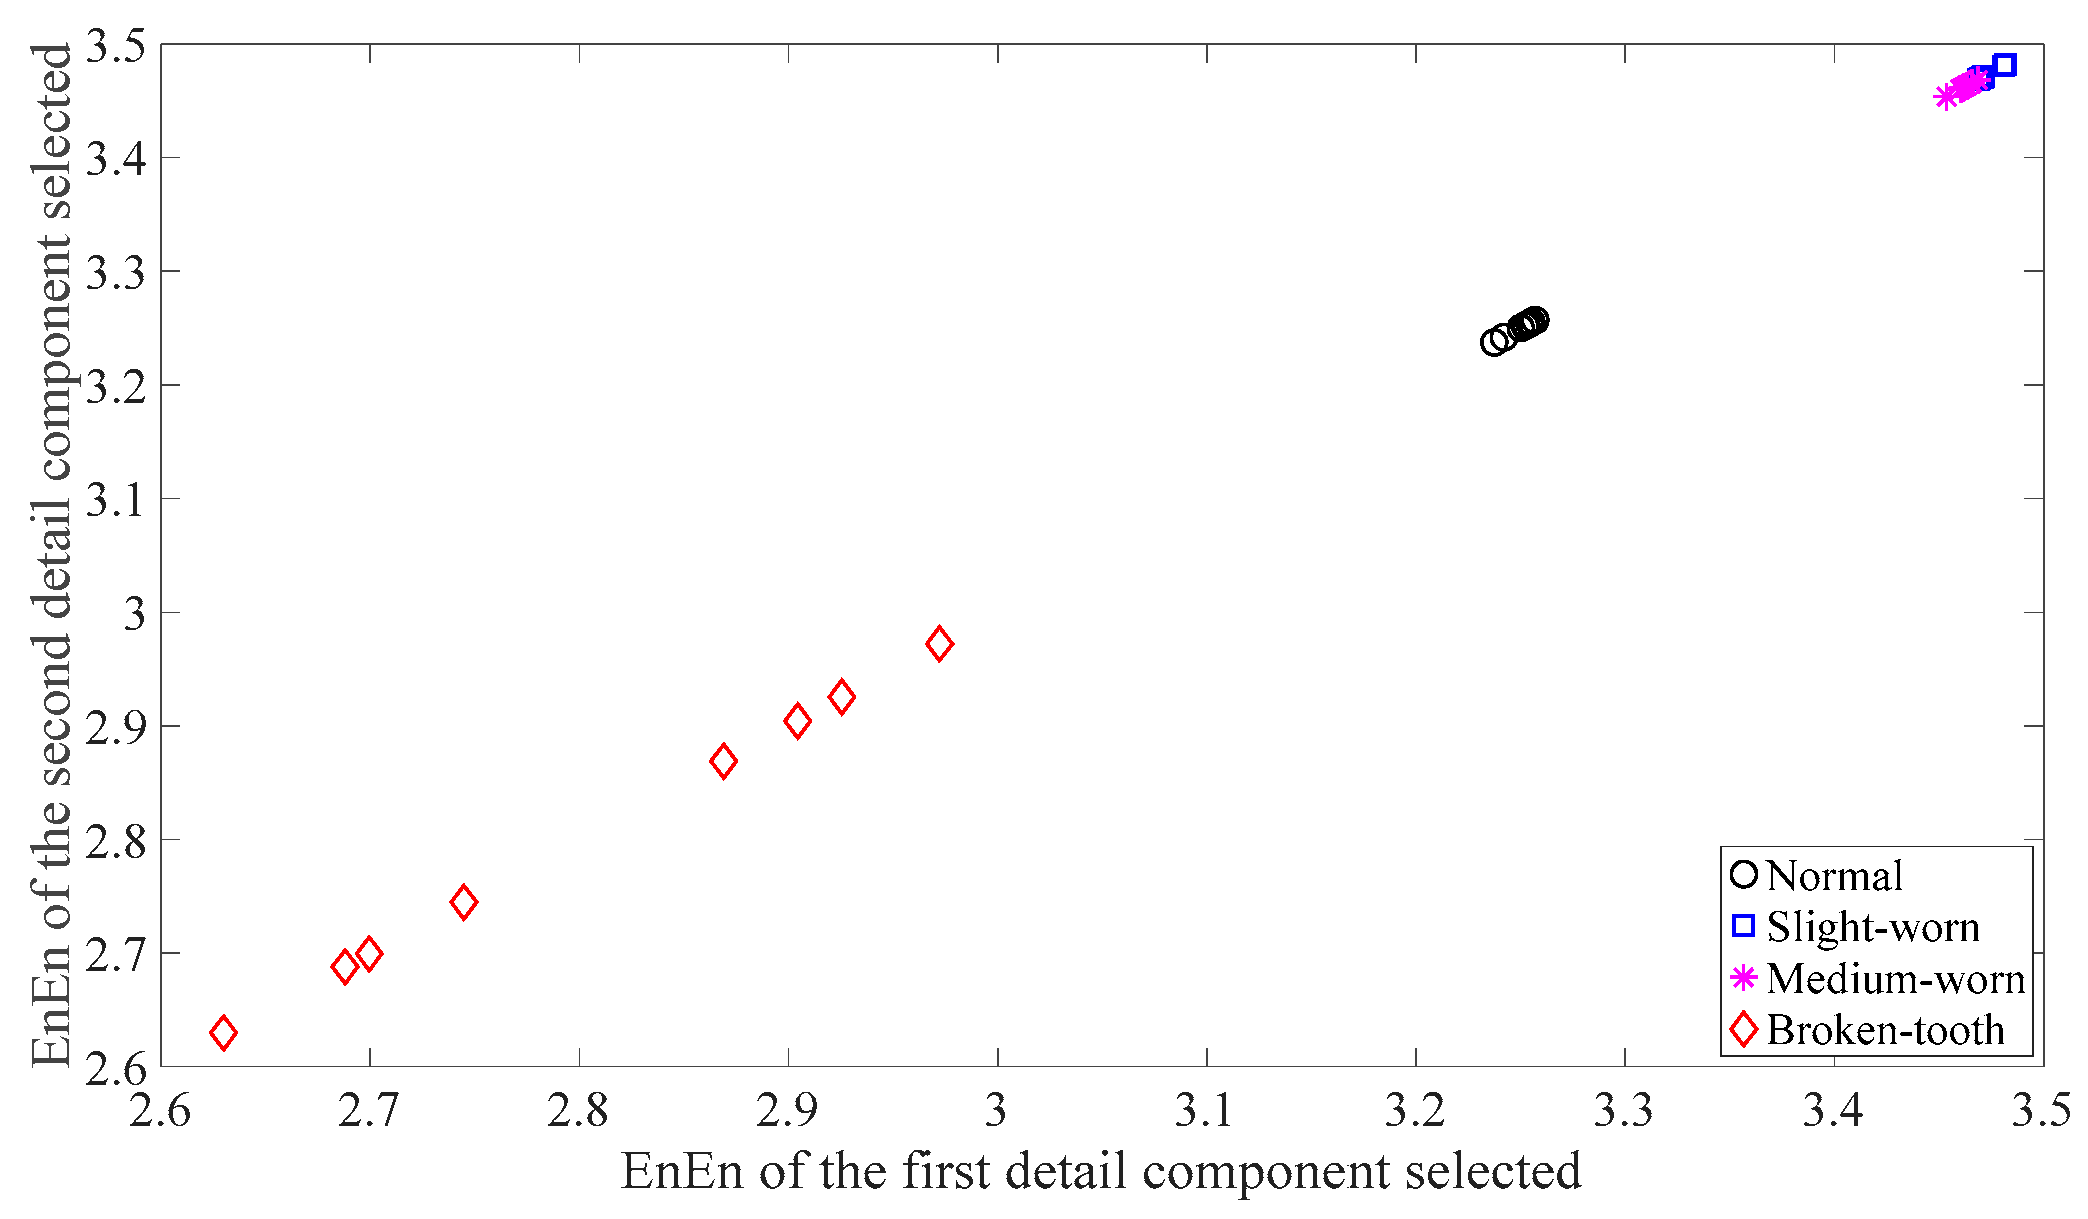
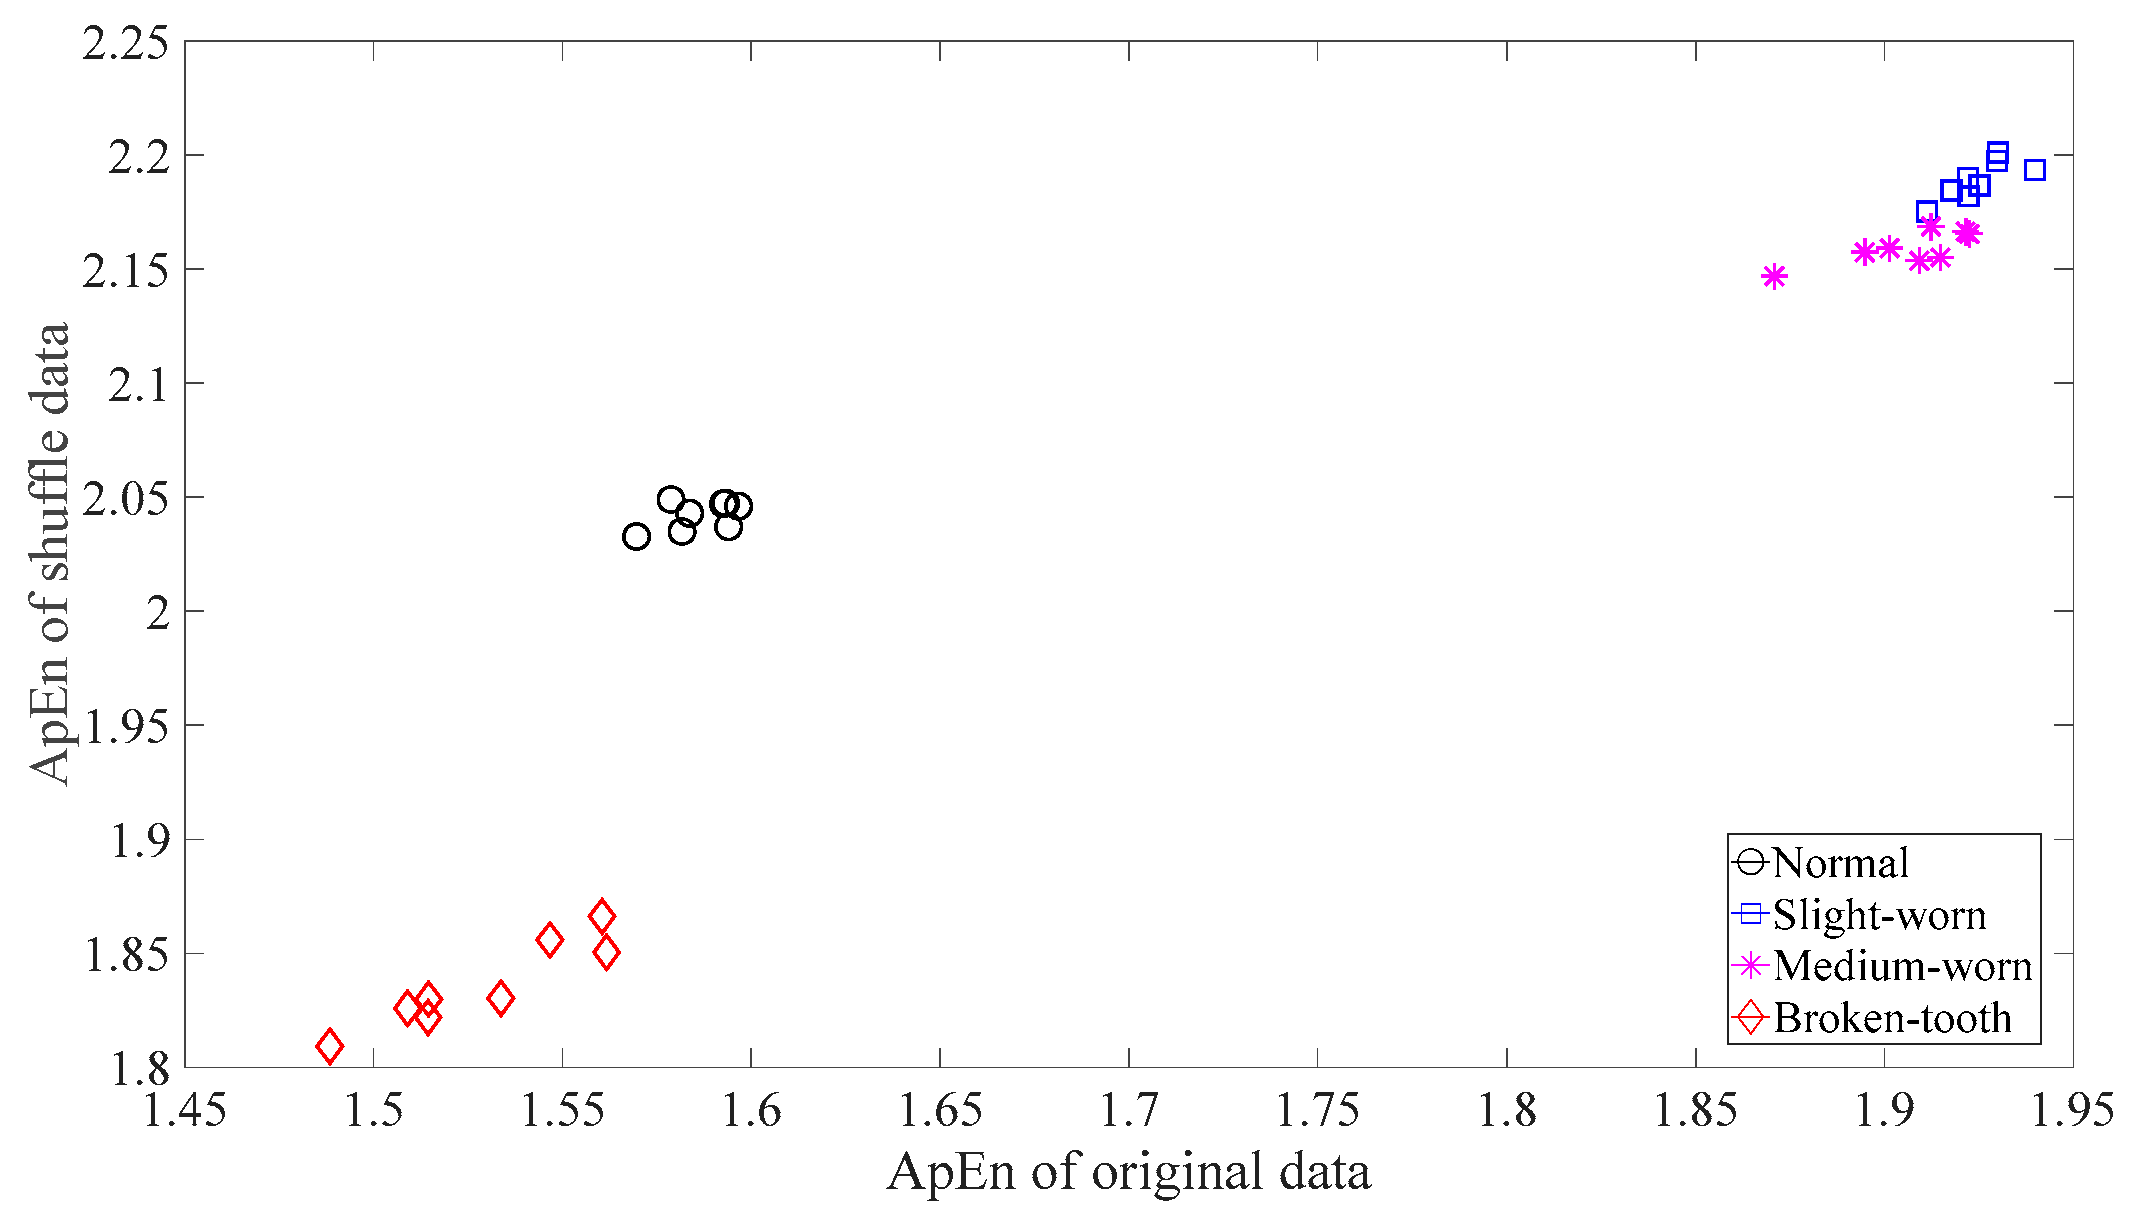
Firstly, skewness was used to analyze these gear vibration data and the results are displayed in Figure 4. As displayed in Figure 4, the skewness for broken-tooth conditions fluctuates considerably over time. In addition, the skewness for broken-tooth conditions overlaps with those for the other three gear conditions. Thus, skewness cannot serve to distinguish between these four types of gear condition. Next, kurtosis was applied to investigate these gear vibration data and the results are shown in Figure 5. As shown in Figure 5, the kurtosis for broken-tooth conditions differs significantly from those for the other three gear conditions. Even so, kurtosis fails to find its application in differentiating between normal, slightly worn, and medium-worn conditions. Next, this paper analyzed ApEn of original, shuffle, and surrogate versions of these gear vibration data. For ApEn, this paper sets the embedding dimension, time delay, radius distance threshold, and logarithm as 2, 1, 0.2 × SD (Sig), and natural, respectively. Here, the symbol SD (Sig) means to calculate the standard deviation of the data Sig. Figure 6, Figure 7 and Figure 8 give the ApEn of the original, shuffle, and surrogate versions of these four types of gear vibration data, respectively. As Figure 6 and Figure 7 show, the slightly worn and medium-worn conditions are hard to separate by ApEn of the original or shuffle data. As demonstrated in Figure 8, it seems difficult to discriminate between slightly worn, medium-worn, and broken-tooth conditions by ApEn of the surrogate data. Next, EMD was applied to investigate these gear vibration data. In doing so, each piece of gear vibration data was decomposed adaptively into nine intrinsic mode functions (IMFs) and a trend. Subsequently, the energy entropy (EnEn) of the two IMFs most correlated with the original data was exploited to characterize the original data (MATLAB codes for EnEn are provided in Appendix C.). The results are displayed in Figure 9. As Figure 9 shows, the slightly worn and medium-worn conditions are hard to separate by the two-dimensional EnEn relating to EMD. WD was also adopted to examine these gear vibration data. For ease of comparison, each piece of gear vibration data was also decomposed into nine detail components and one approximate component using the ‘db2′ wavelet. Next, EnEn of the two detail components most correlated with the original data was exploited to characterize the original data and the results are shown in Figure 10. As Figure 10 shows, the slightly worn and medium-worn conditions are rarely separated by the two-dimensional EnEn relating to WD. Figure 11 depicts the joint distribution of the ApEn of the original and shuffle data and shows that the slightly worn and medium-worn conditions cannot be separated by the binary ApEn. Finally, Figure 12 shows the ternary ApEn of these gear vibration data. As can be seen, these four types of gear conditions can be clearly separated by the ternary ApEn. A comparison of the results in Figure 12 and those in Figure 4, Figure 5, Figure 6, Figure 7, Figure 8, Figure 9, Figure 10 and Figure 11 shows that the ternary ApEn delivers a better performance in classifying gear conditions than the other approaches.

3.2. Fault Classification of Roller-Bearings

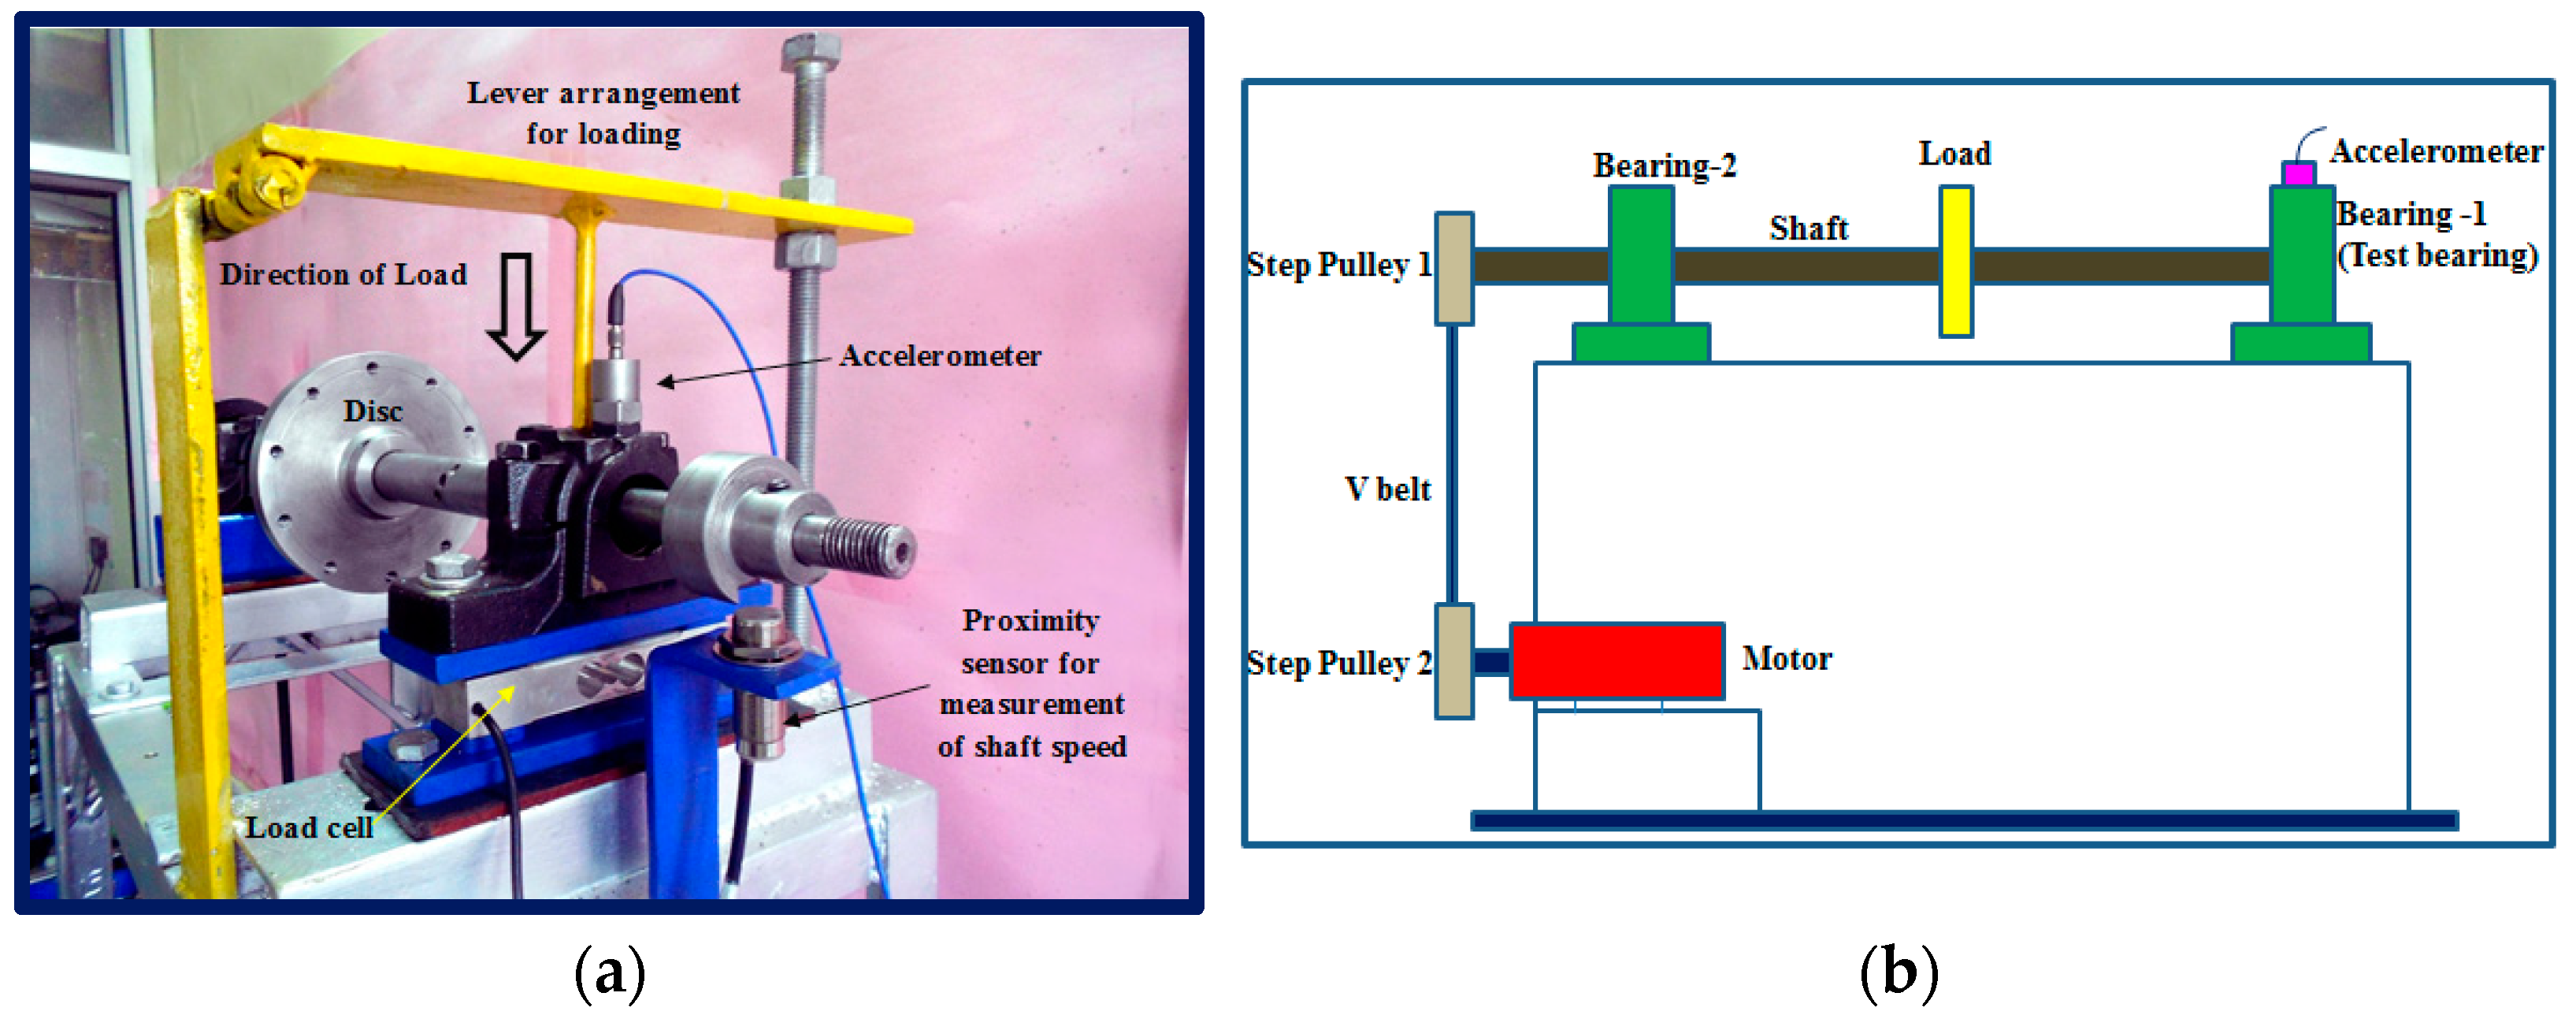
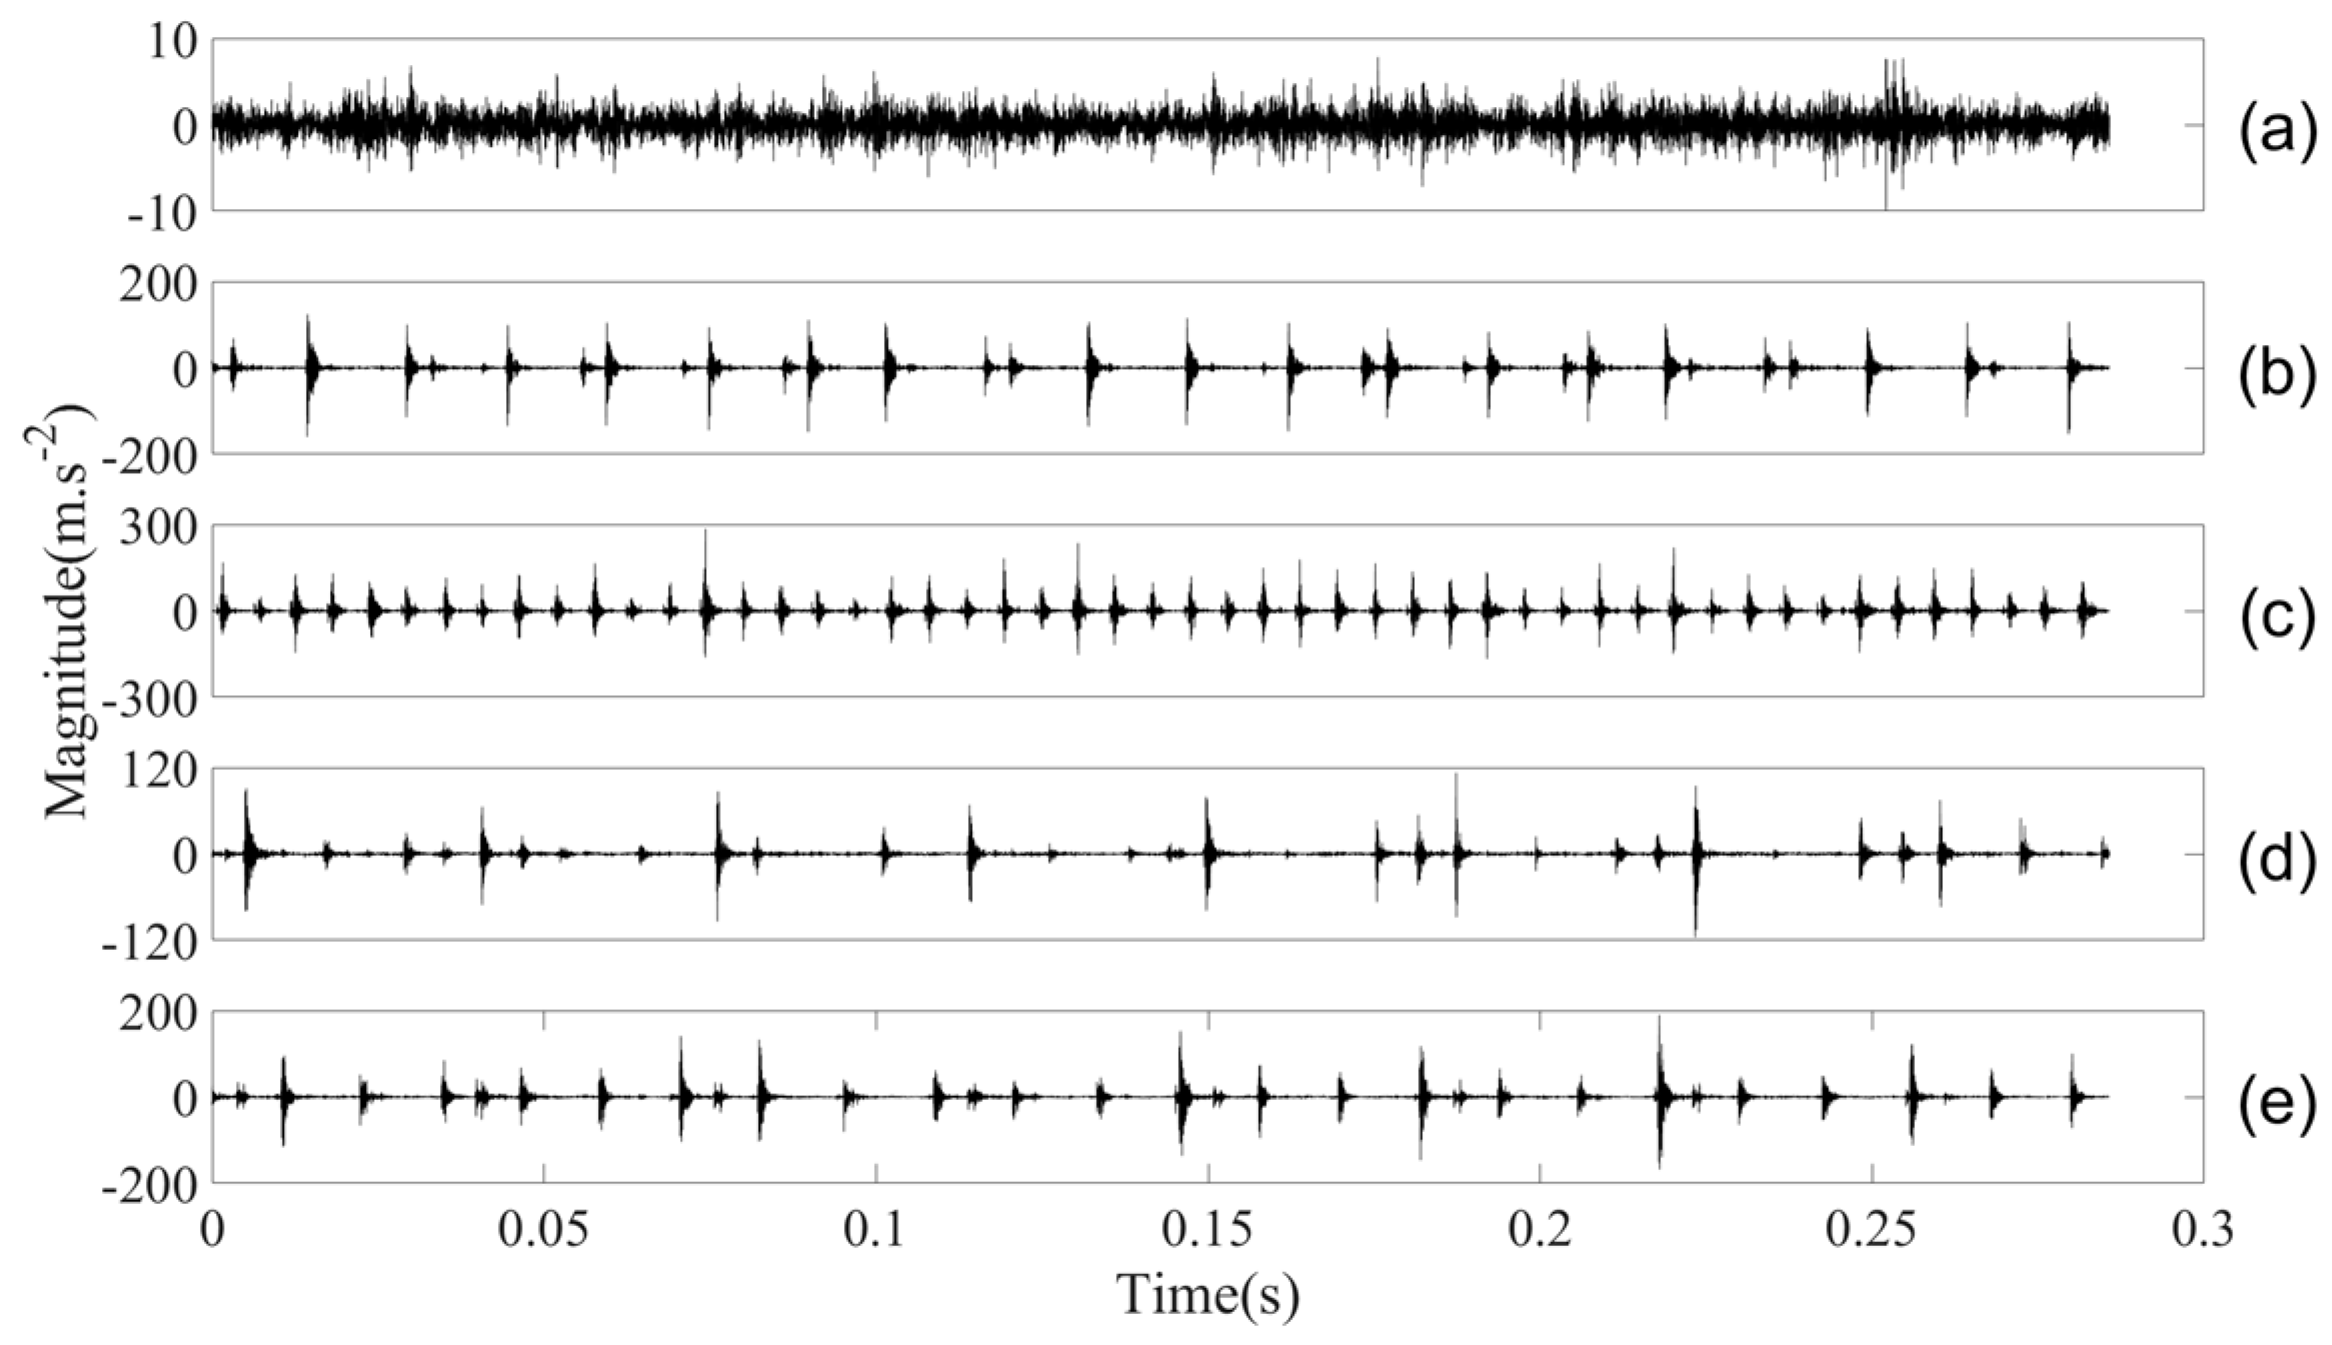
The performance of the proposed method was assessed further using roller-bearing vibration data collected from the roller-bearing test rig described in Figure 13. As shown in Figure 13, the shaft, driven by a 346 W AC motor by a step pulley, was supported by two bearings at both ends [27,28,29]. A 2 kg disc was fixed in the middle of the shaft and a vertical load was applied to the bearing by a lever [27,28,29]. The roller-bearing vibration data were gathered from the top of the bearing housing by an accelerometer. In the roller-bearing experiment, five types of roller-bearing conditions were taken into account: normal, inner-race faults with a fault width of 0.43 mm (IR), outer-race faults with a fault width of 1.55 mm (OR), roller faults with a fault width of 0.49 mm (RO1), and roller faults with a fault width of 2.12 mm (RO2). Here, two similar types of roller faults, i.e., RO1 and RO2, were specially introduced for evaluating the effectiveness of the proposed method. Fifty-two pieces of data were acquired for each of these five types of bearing conditions, each piece with a sampling frequency of 70,000 Hz and a data size of 20,000. These five types of bearing vibration data are shown in Figure 14.
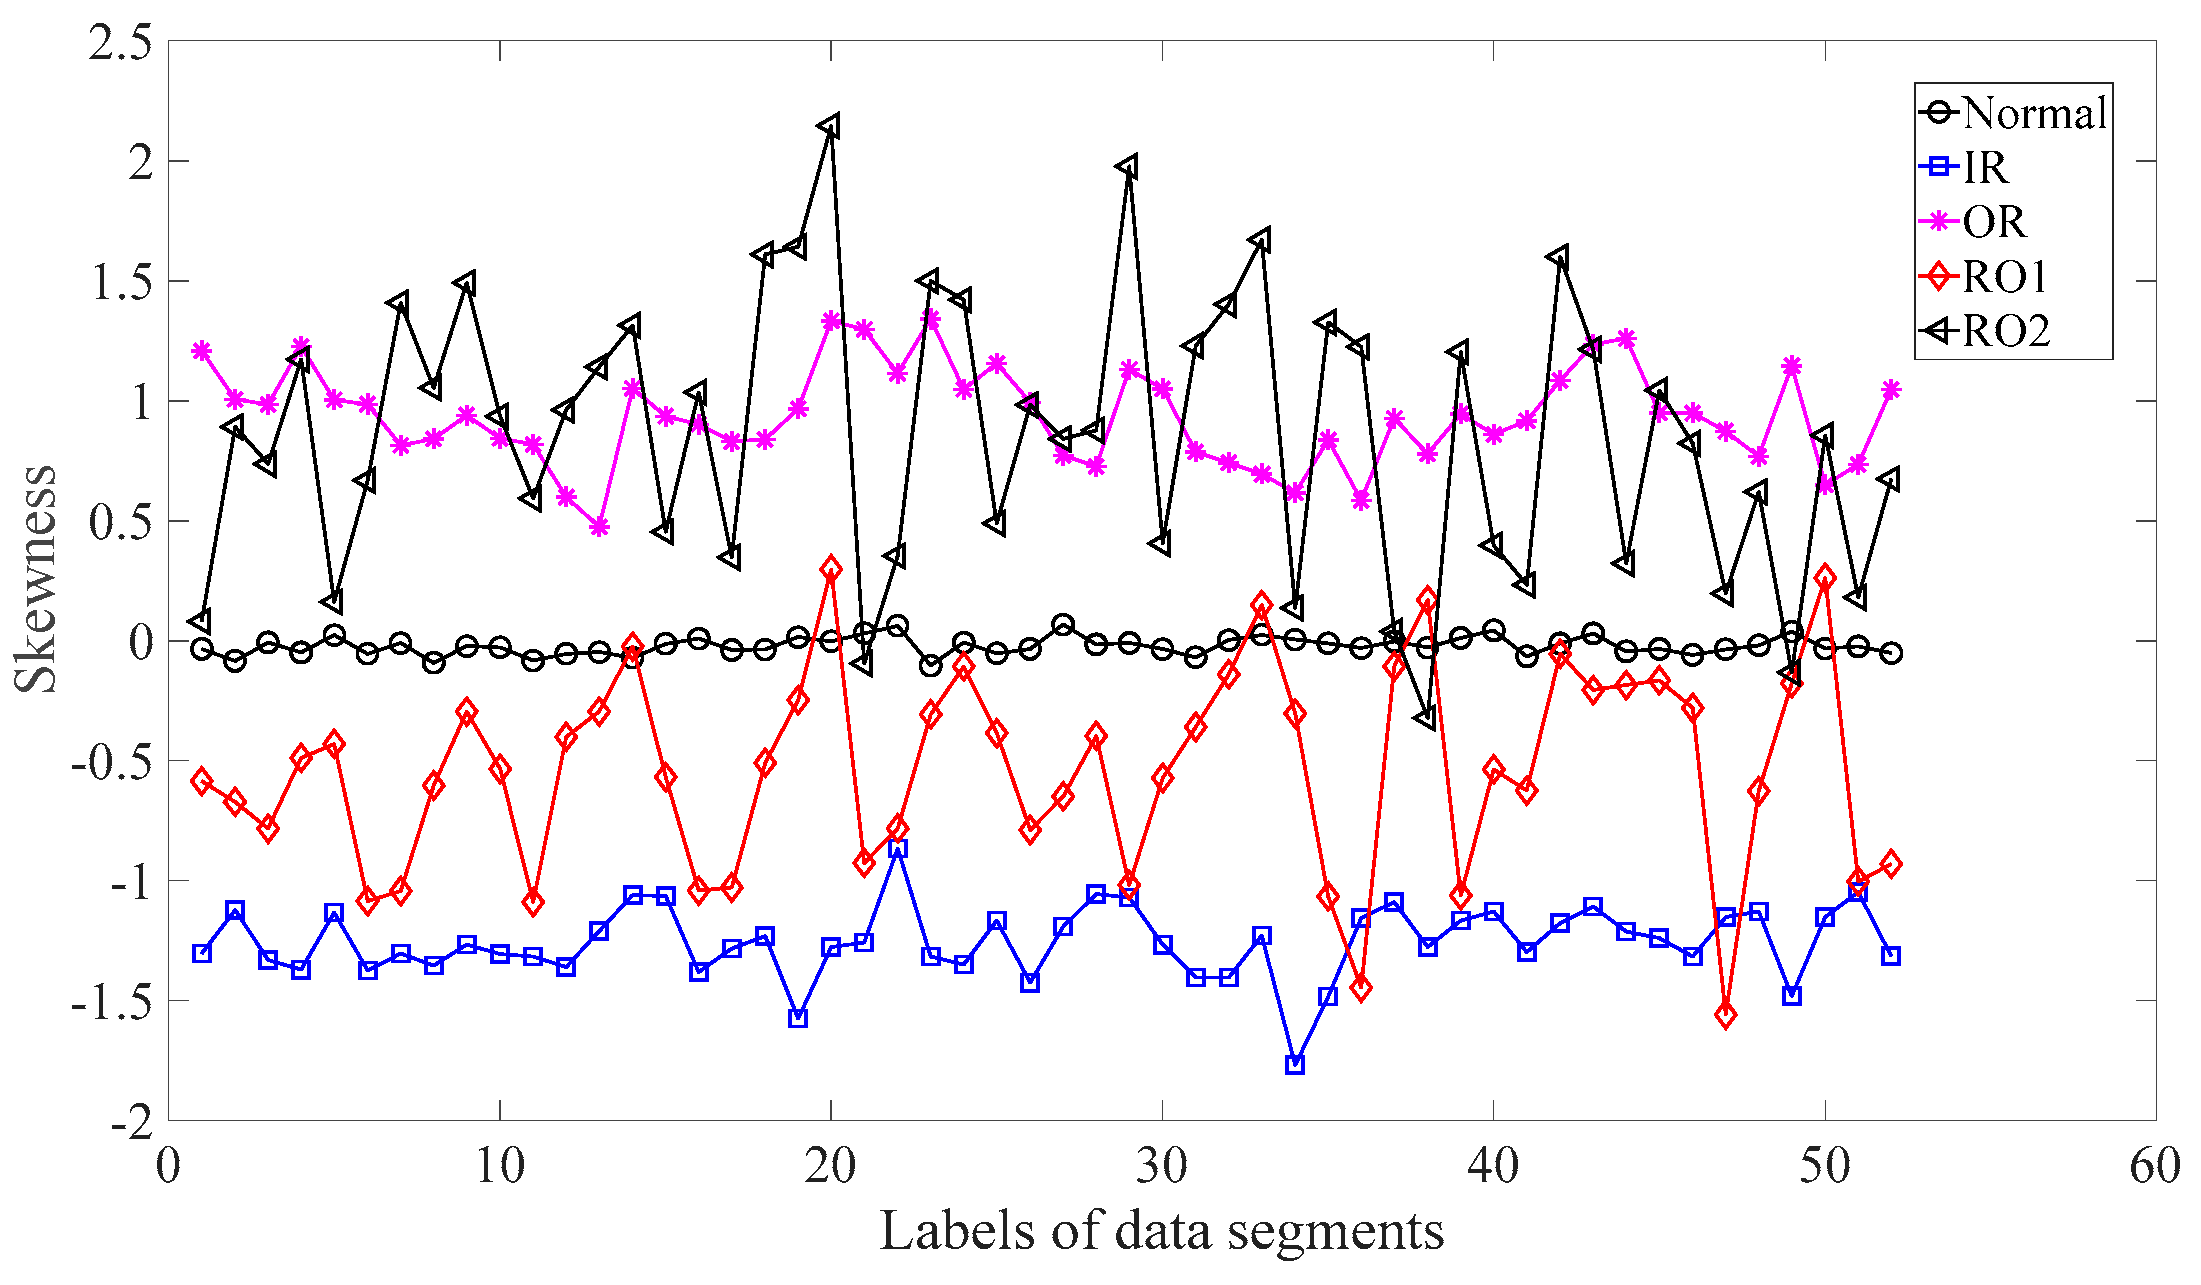
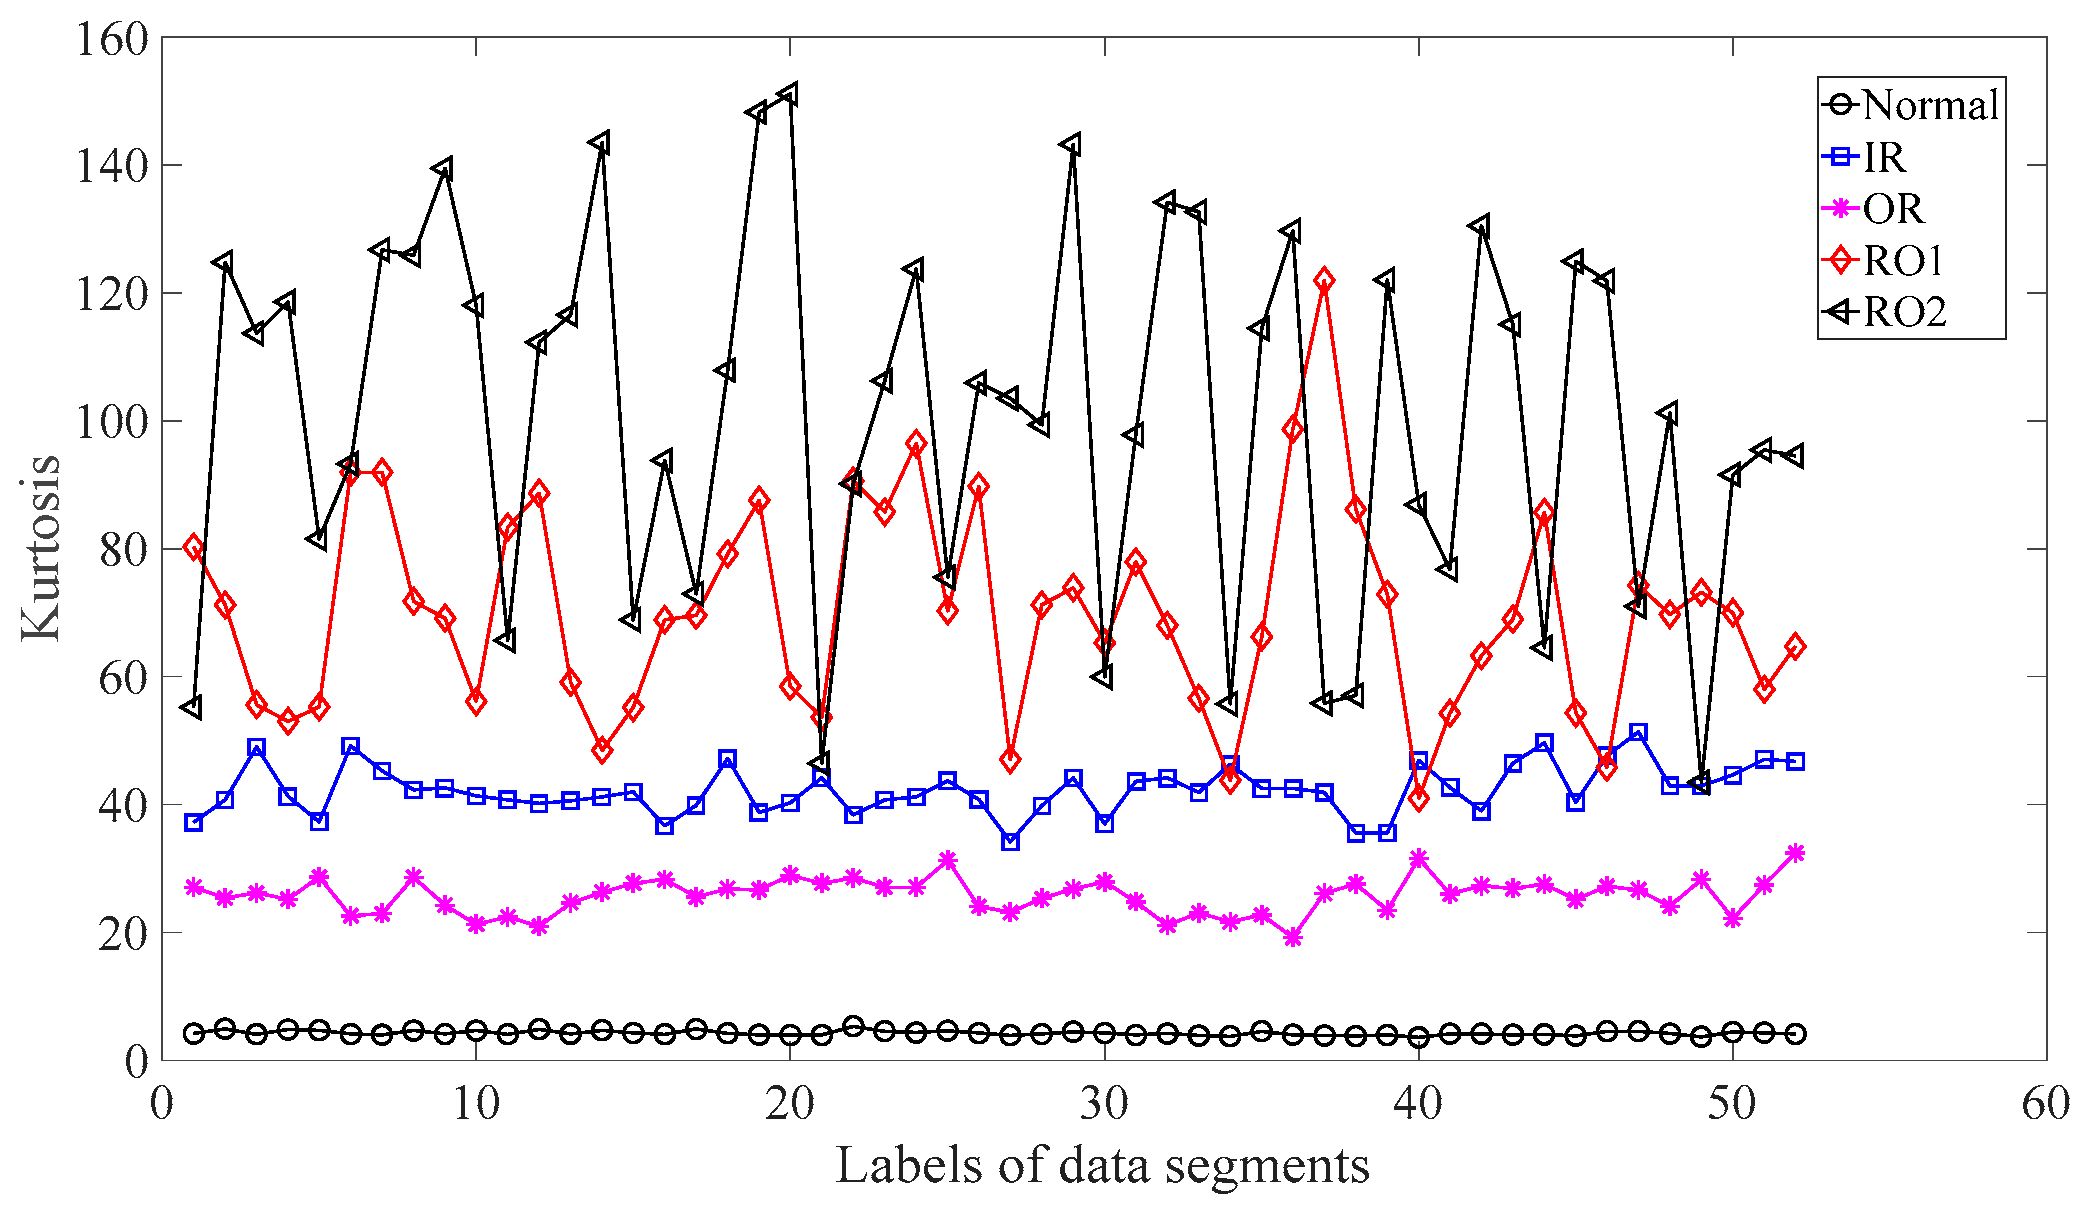
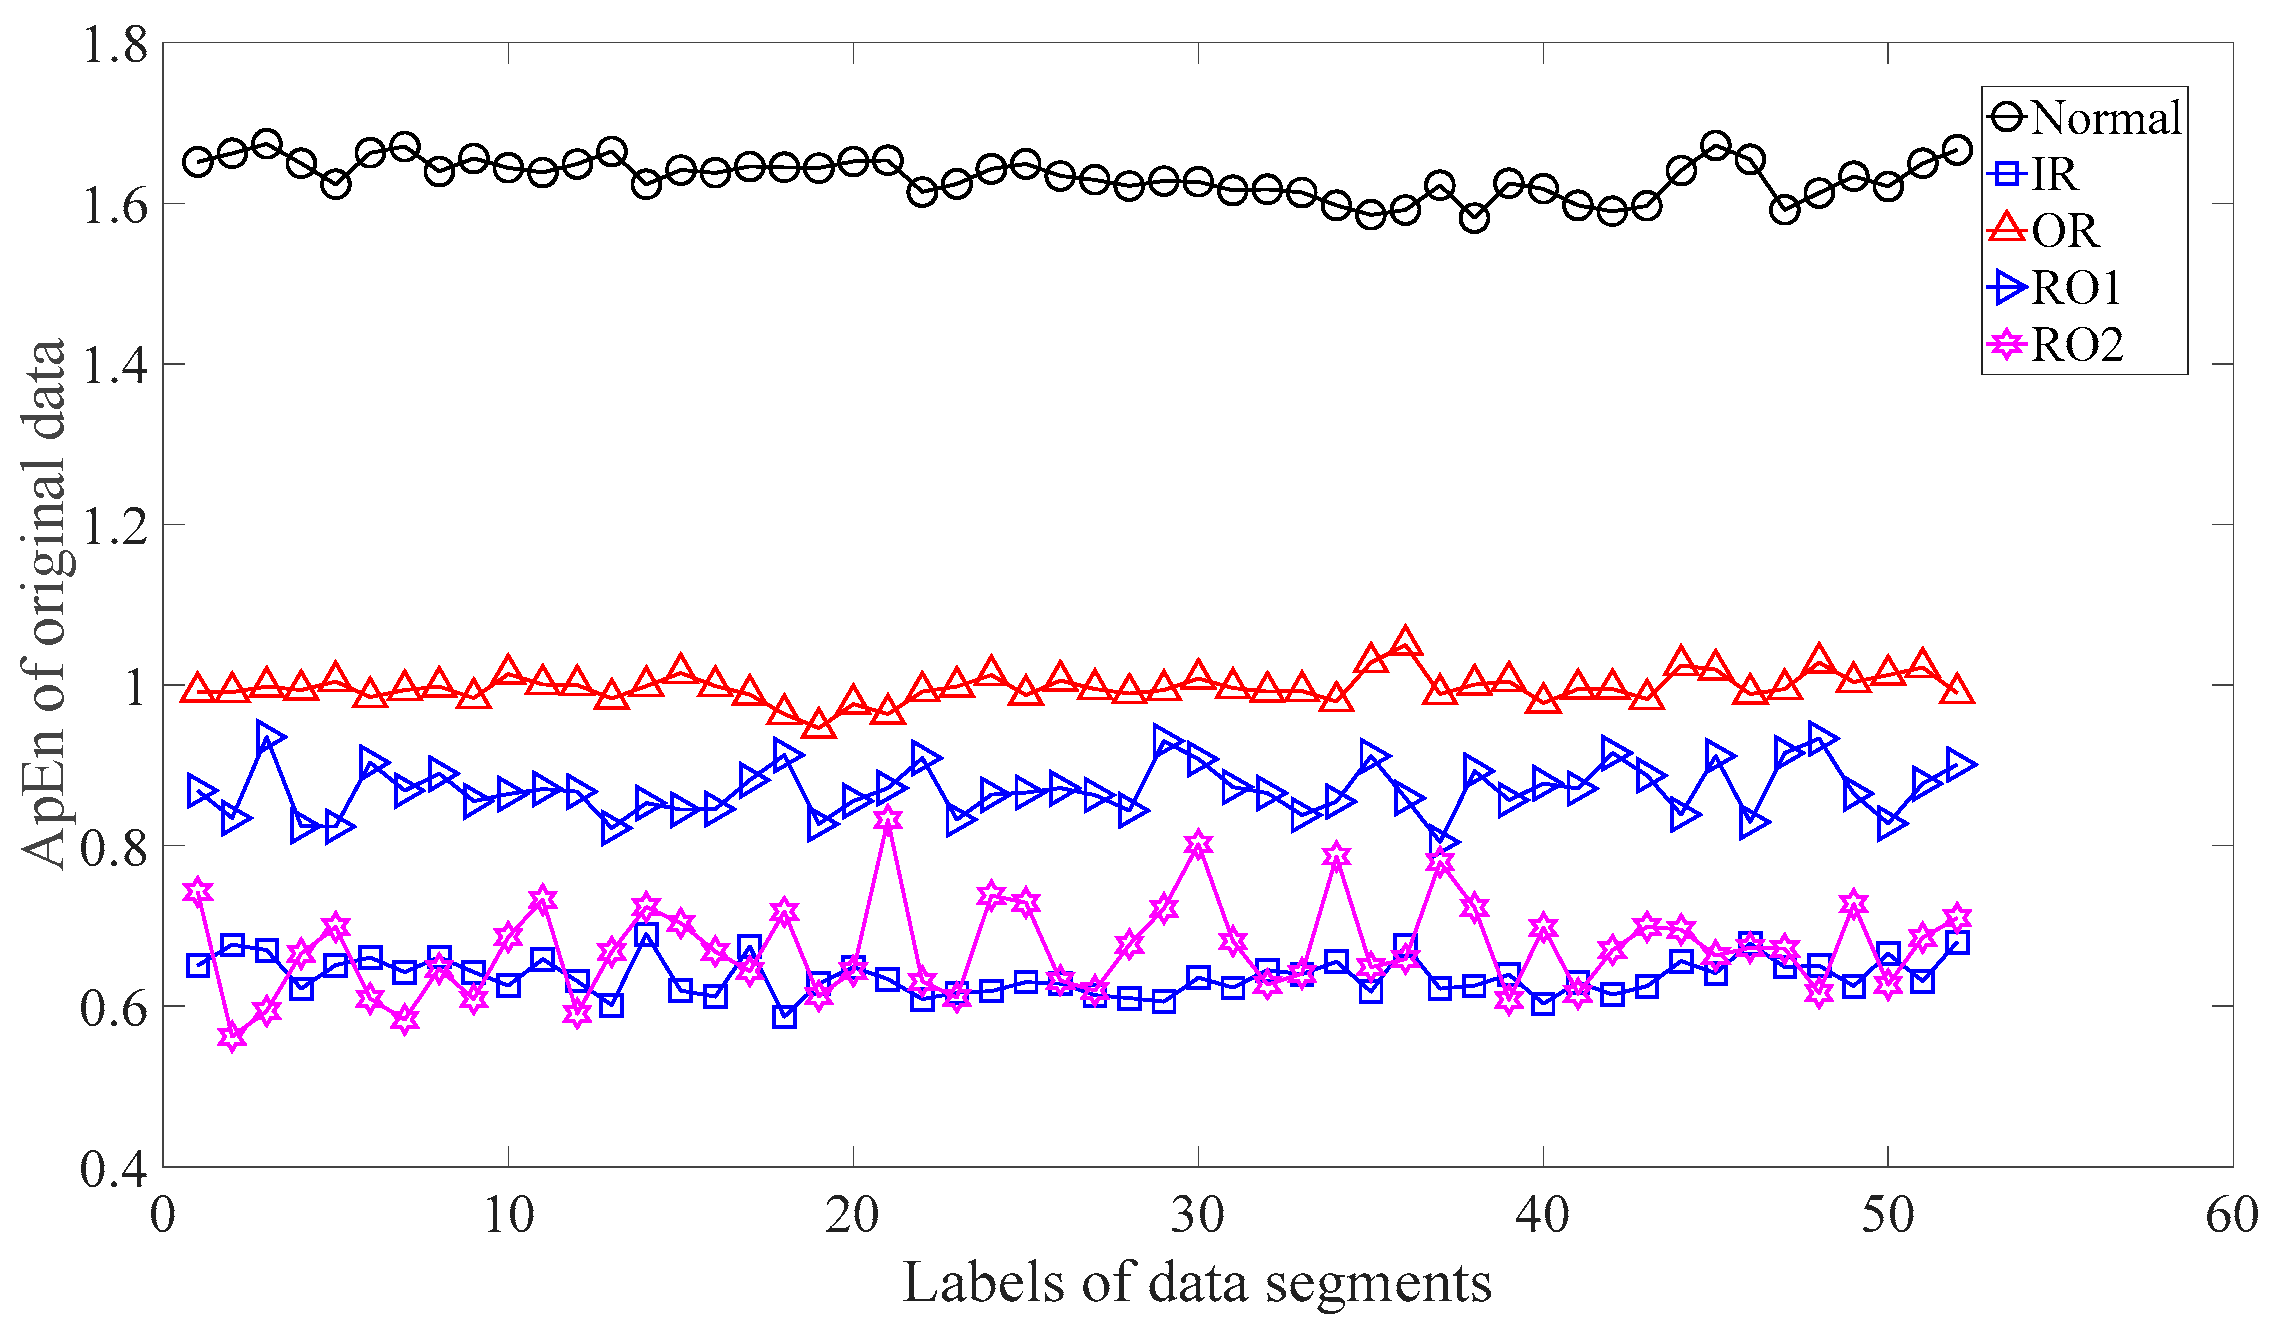
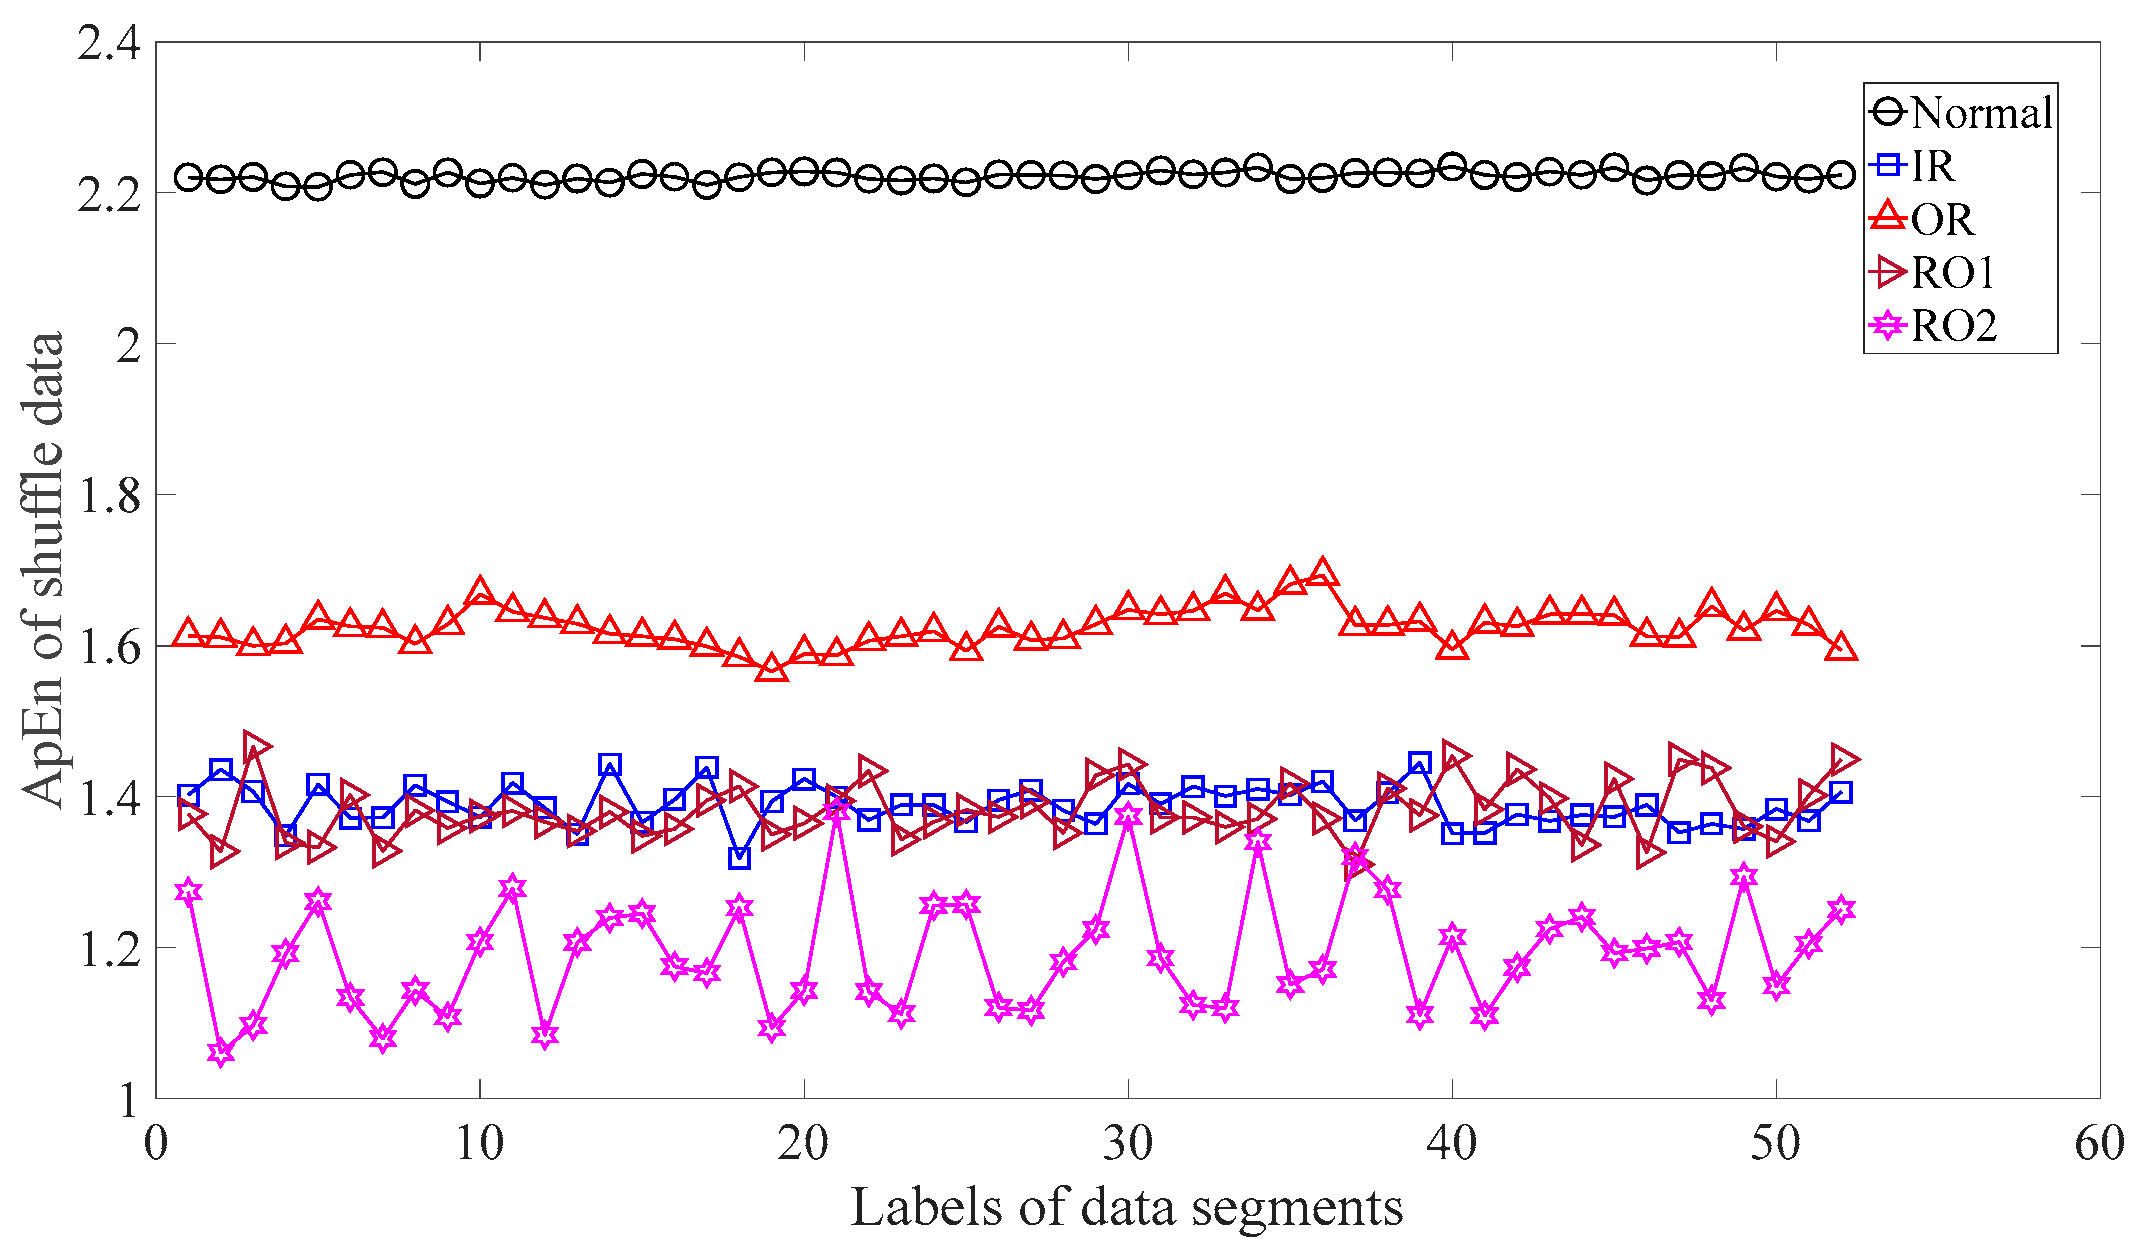
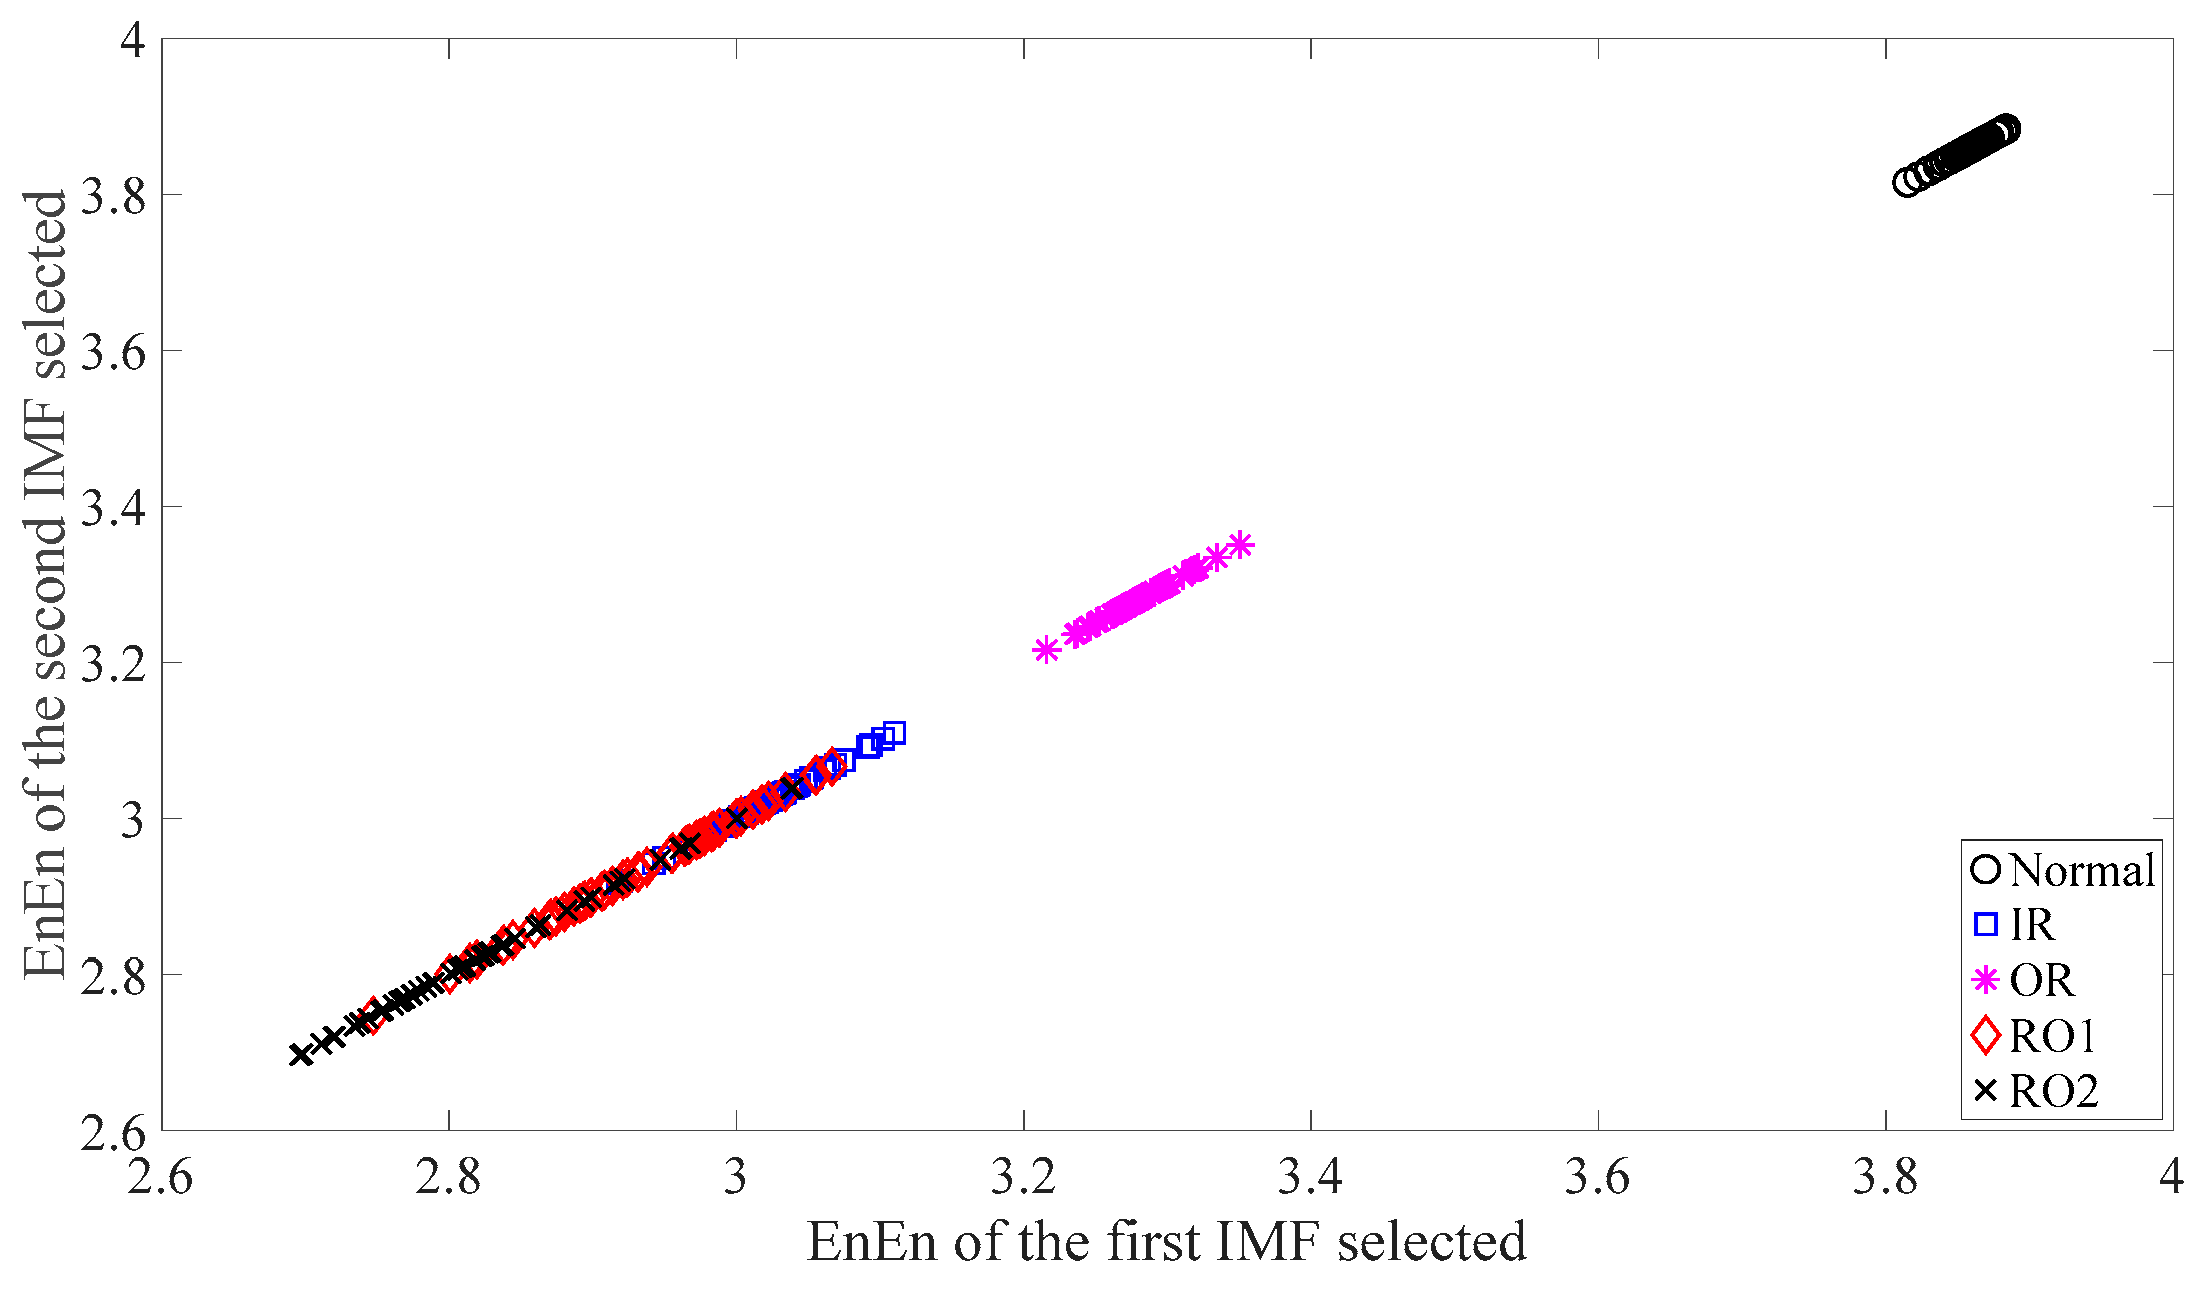
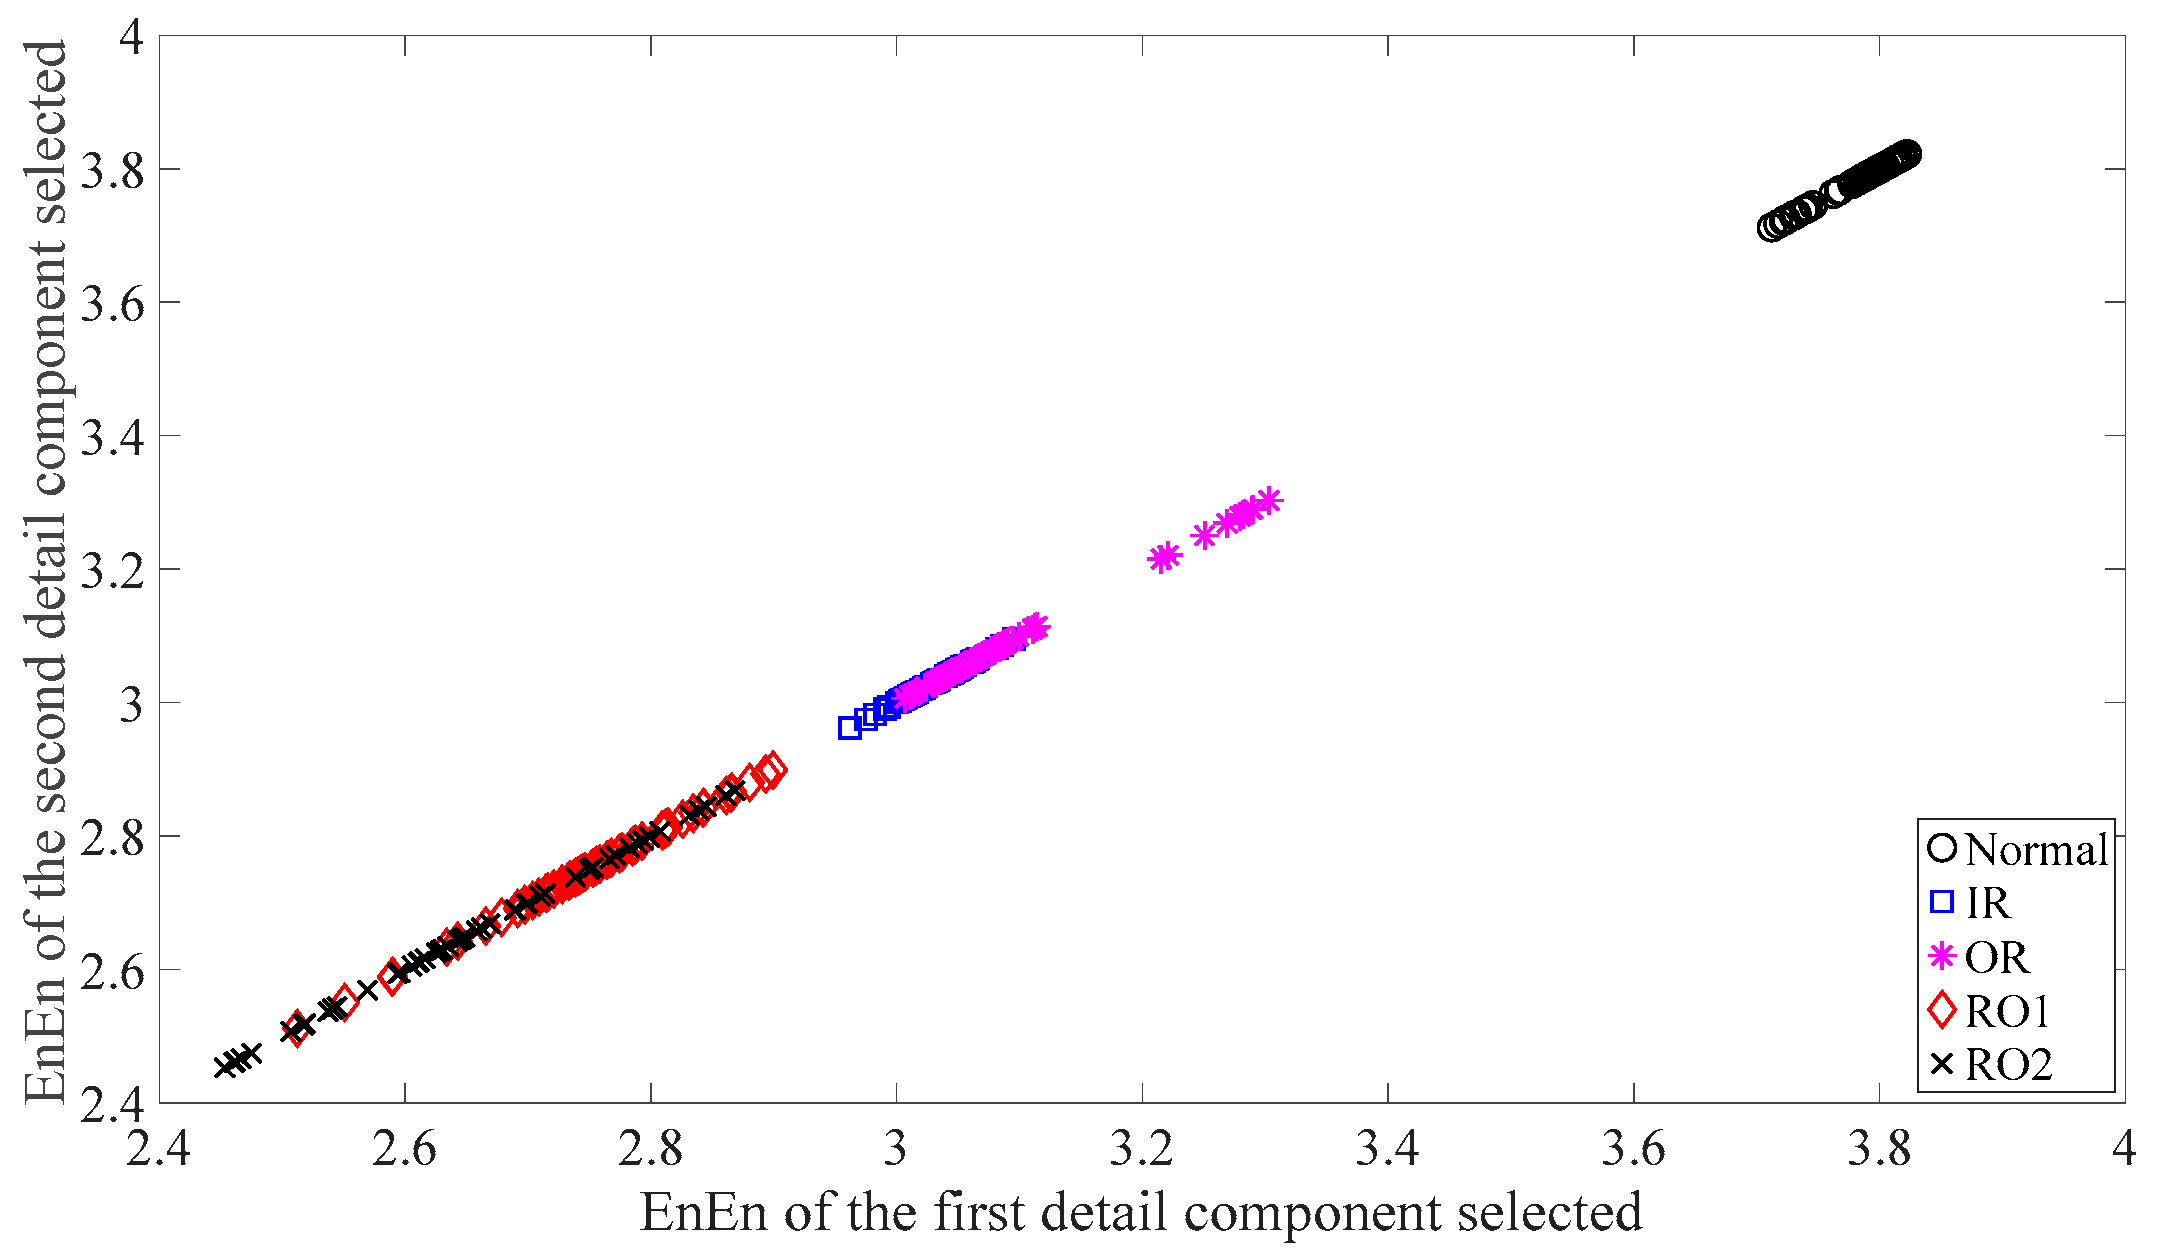
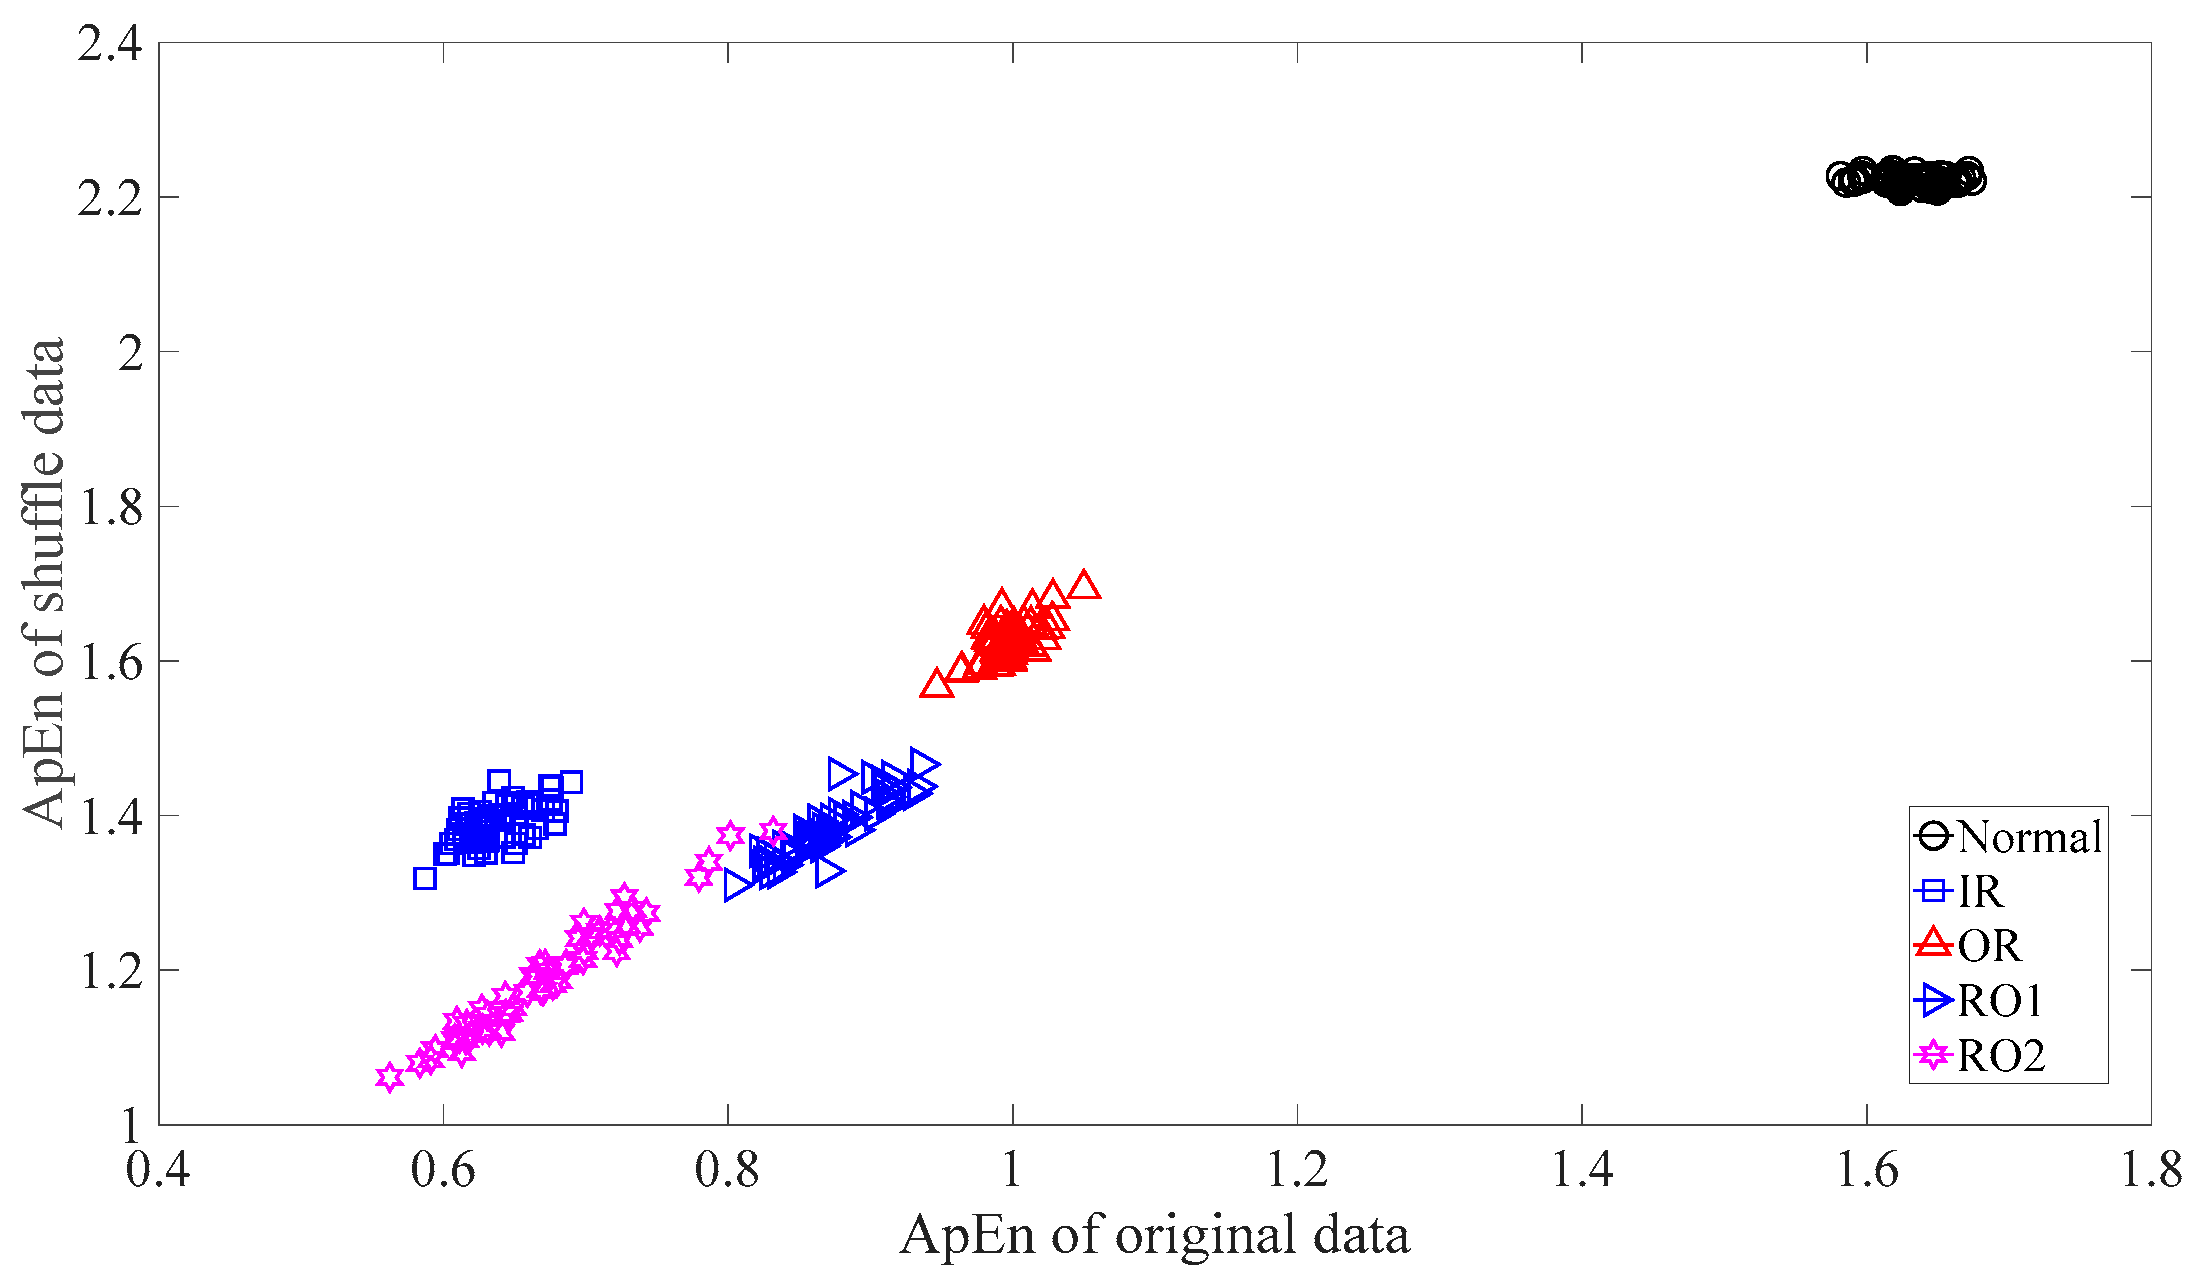
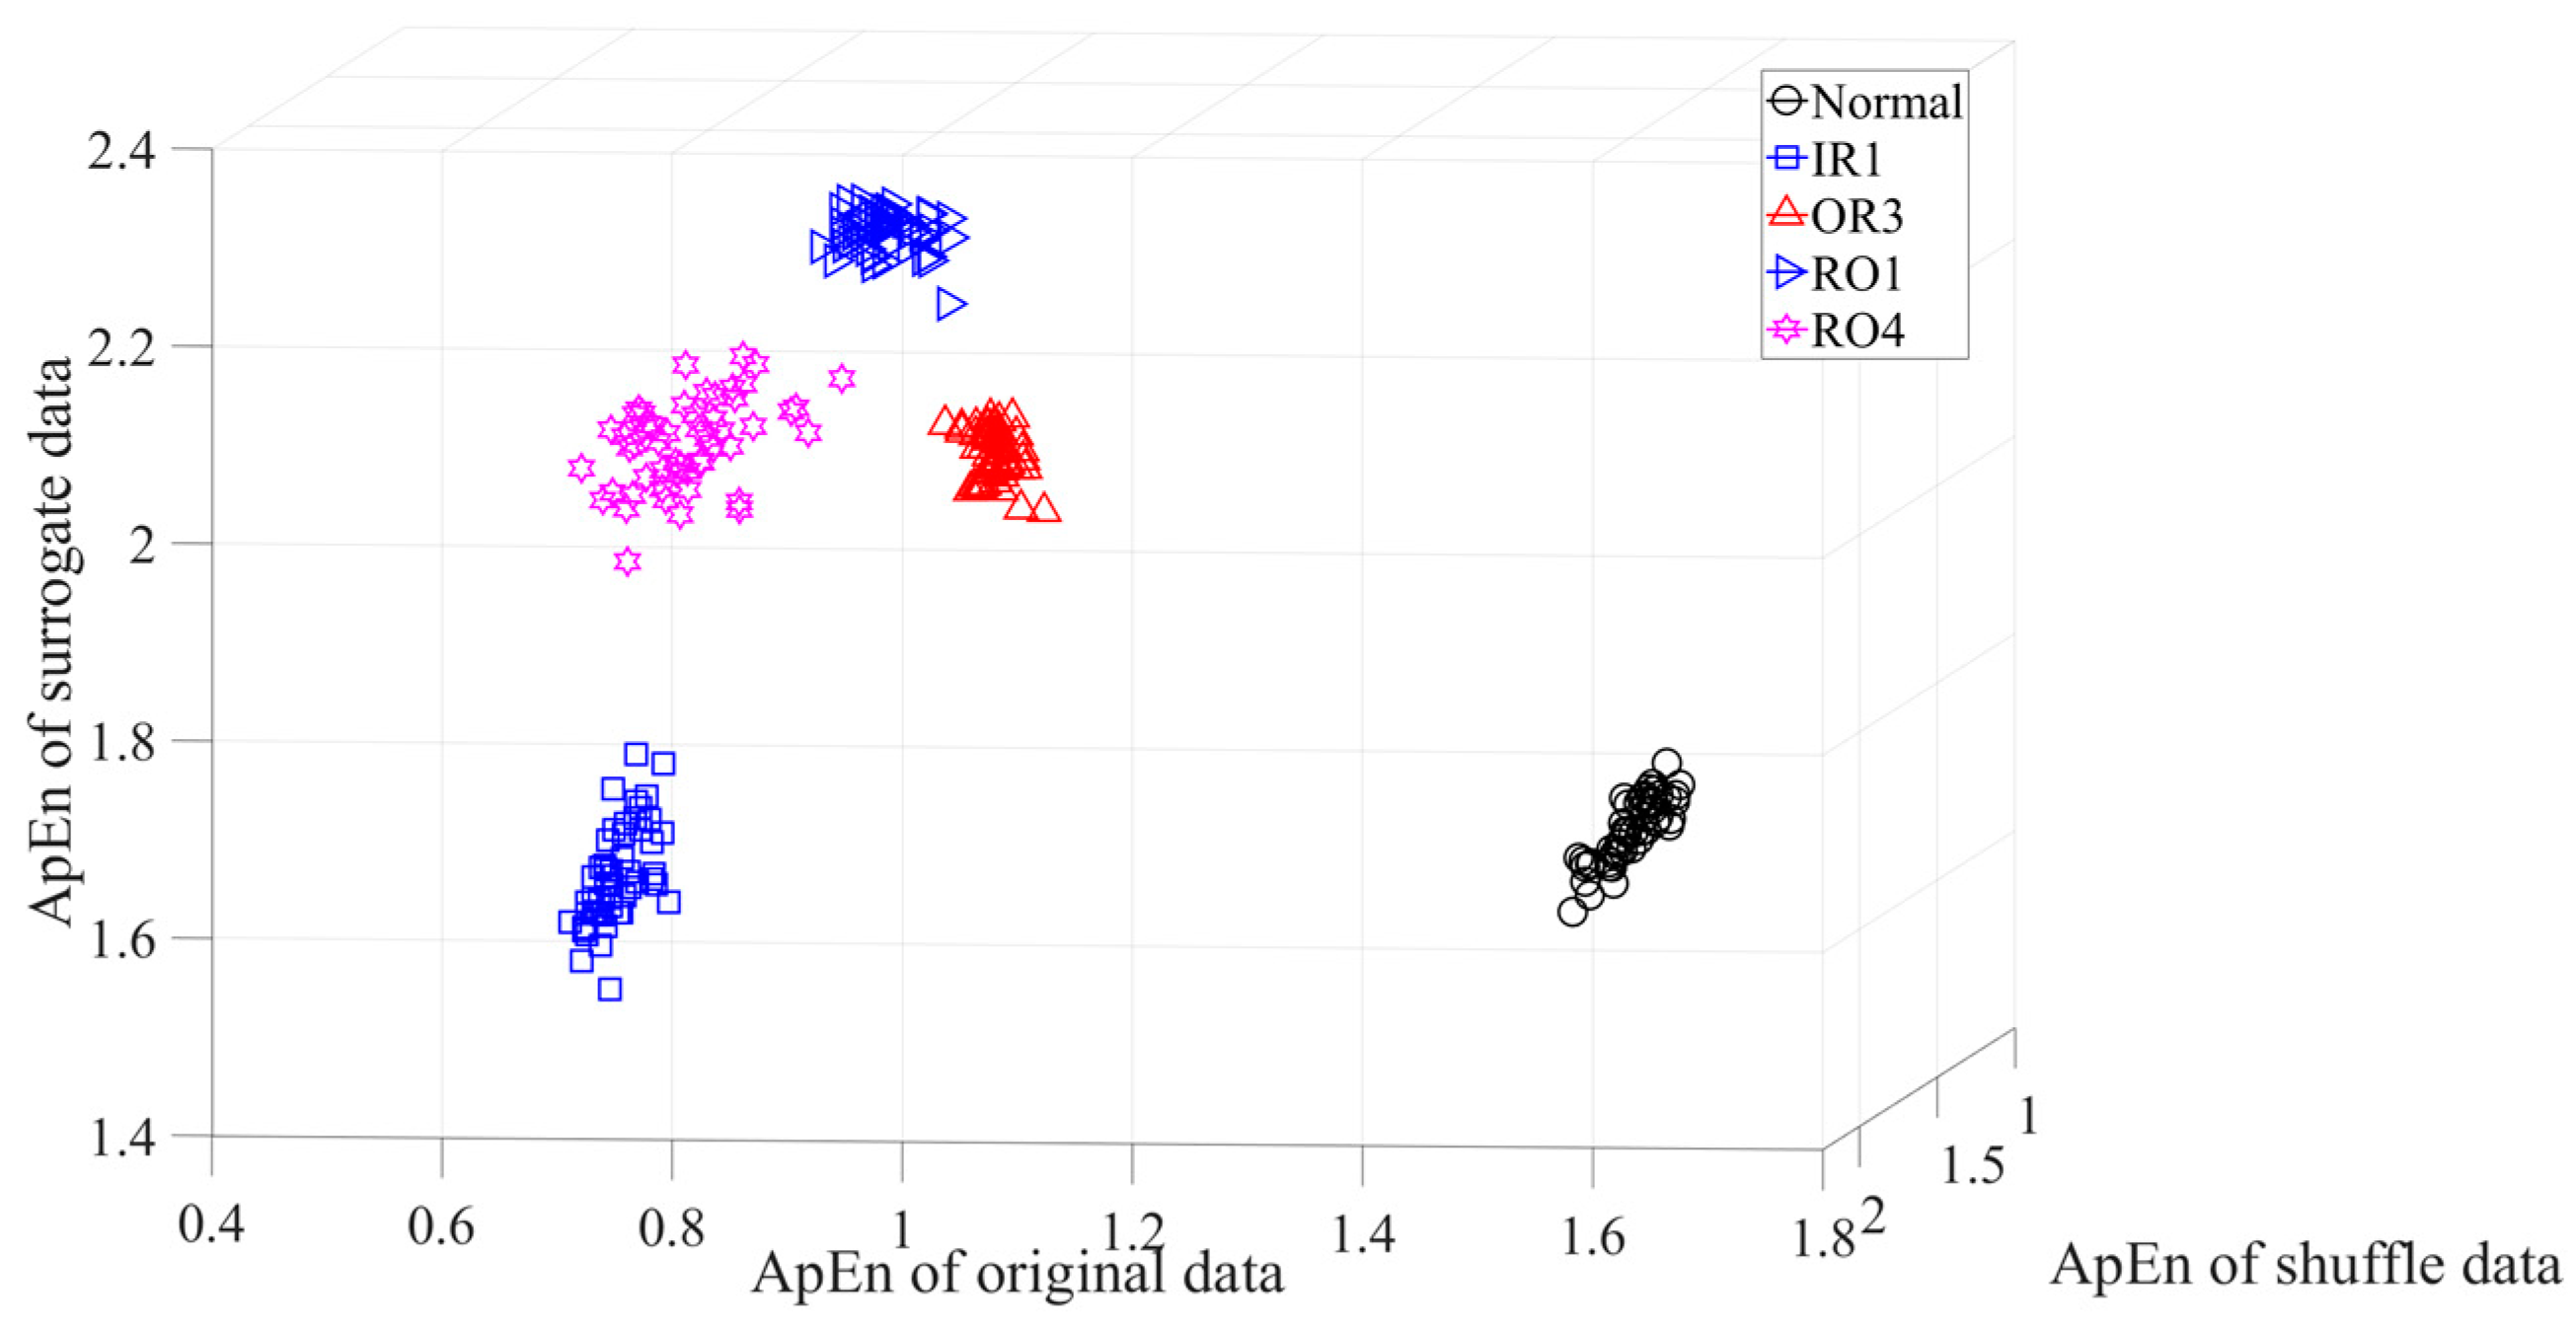
Subsequently, skewness was used to investigate these bearing vibration data and the results are shown in Figure 15. As Figure 15 shows, these five types of bearing conditions are hard to separate by skewness. Next, kurtosis was employed to examine these bearing vibration data and the results are displayed in Figure 16. As Figure 16 shows, the kurtosis for the RO1 and RO2 conditions changes considerably over time and overlaps considerably with each other. Therefore, RO1 and RO2 conditions are hardly separated by kurtosis. Next, Figure 17 gives the ApEn of the original versions of these bearing vibration data. As Figure 17 shows, because the ApEn for the RO2 condition fluctuates considerably and overlaps with that for the IR and RO1 conditions, the IR, RO1, and RO2 conditions are scarcely classified by ApEn of the original data. Figure 18 shows the ApEn of the shuffle versions of these bearing vibration data. As demonstrated in Figure 18, the ApEn for the IR, RO1, and RO2 conditions overlap considerably with each other. As a consequence, the IR, RO1, and RO2 conditions are hardly segregated by ApEn of the shuffle data. In what follows, Figure 19 illustrates ApEn of the surrogate version of these bearing vibration data. As Figure 19 shows, the ApEn for the OR and RO2 conditions overlap considerably with each other. Accordingly, the OR and RO2 conditions are hard to separate by ApEn of the surrogate data. Next, EMD was employed to probe these roller-bearing vibration data. Each piece of bearing vibration data was decomposed adaptively into nine IMFs and a trend. Then, EnEn of the two IMFs most correlated with the original data was employed to describe the original data and the results are shown in Figure 20. As Figure 20 shows, the IR, RO1, and RO2 conditions cannot be separated by the two-dimensional EnEn relating to EMD. WD was also used to explore these bearing vibration data. Similarly, for ease of comparison, each piece of bearing vibration data was decomposed into nine detail components and one approximate component using the ‘db2′ wavelet. Next, EnEn of the two detail components most correlated with the original data served to depict the original data and the results are shown in Figure 21. As Figure 21 shows, the IR, OR, RO1, and RO2 conditions are difficult to separate by the two-dimensional EnEn relating to WD. Figure 22 shows a joint distribution of the ApEn of the original and shuffle data. As Figure 22 shows, the results for the RO1 conditions overlap those of the RO2 conditions. Therefore, the RO1 and RO2 conditions fail to be segregated by the binary ApEn. Finally, Figure 23 shows the ternary ApEn of these bearing vibration data. These five types of bearing conditions can be clearly separated by the ternary ApEn. Therefore, comparing the results in Figure 23 with those in Figure 14, Figure 15, Figure 16, Figure 17, Figure 18, Figure 19, Figure 20, Figure 21 and Figure 22, this paper demonstrates that the ternary ApEn approach outperforms the other methods in classifying bearing conditions.

4. Discussion

In Section 3, the performance of the ternary ApEn was benchmarked against traditional temporal statistics, traditional ApEn, the two-dimensional EnEn based on EMD or WD, and the binary ApEn using both gear vibration data and roller-bearing vibration data containing different types and severity of faults. The results showed that none of the traditional temporal statistics, traditional ApEn, the two-dimensional EnEn based on EMD or WD, and the binary ApEn approaches were successful in discriminating between different types and severity of faults. In contrast, the ternary ApEn was able to clearly separate the different types and severity of faults. Accordingly, the proposed method provides an advantage over the other approaches in the fault classification of rotating machinery.
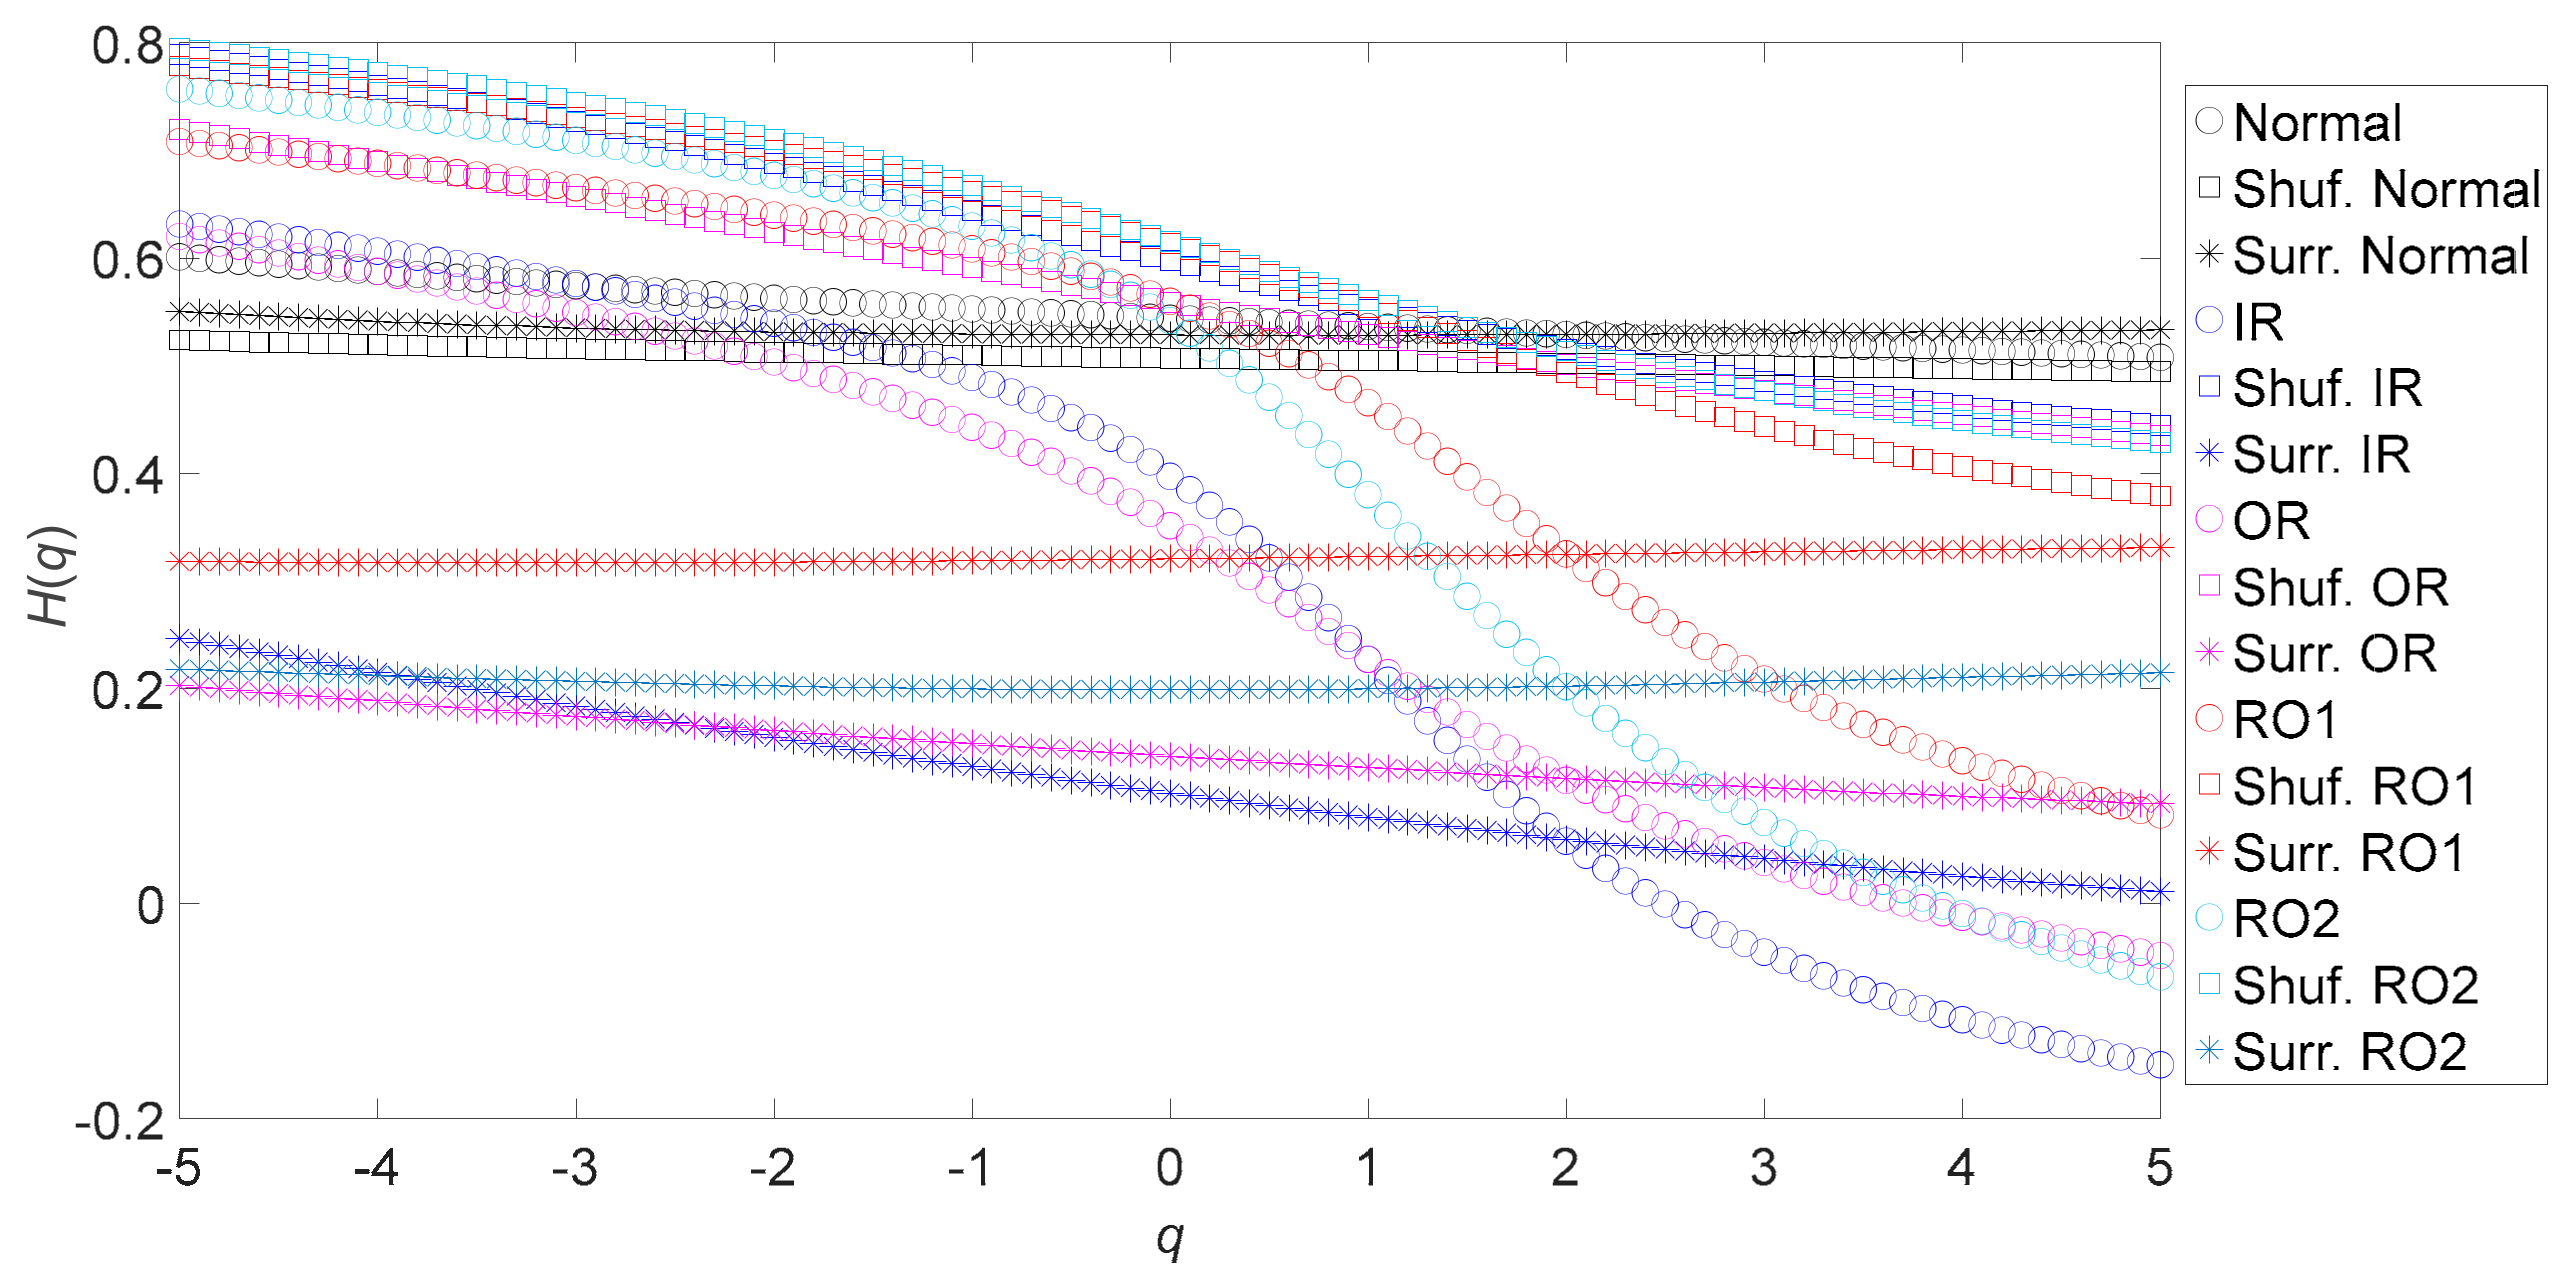
The principal contribution of this paper is to develop the ternary entropy approach by integrating ApEn of original, shuffle, and surrogate data into a three-dimensional vector for characterizing the properties of complex data. Indeed, the shuffle and surrogate methods of treating data, distinct from EMD or WD, can take the original data apart [15,16,22,23,30,31]. In this way, shuffle data and surrogate data simply contain PDF information and spectral information of the original data, respectively. As a result, original, shuffle, and surrogate data have distinctly different natures. To prove this assertion, this paper compares the dynamics of original, shuffle, and surrogate data by applying MFDFA to both gear vibration data and bearing vibration data. Figure 24 shows the generalized Hurst exponents of the original, shuffle, and surrogate versions of the gear vibration data. As demonstrated in Figure 24, the original, shuffle, and surrogate data for an identical gear condition show significantly different dynamics. Moreover, the shuffle and surrogate data for different gear conditions show rather different dynamics. Figure 25 shows the generalized Hurst exponents of the original, shuffle, and surrogate versions of the bearing vibration data. As Figure 25 shows, the original, shuffle, and surrogate data for an identical bearing condition show significantly different dynamics. In addition, the original, shuffle, and surrogate data for different bearing conditions show markedly different dynamics. This seemingly justifies the above assertion.
The feasibility of the proposed method, which performs well in classifying machinery conditions in this paper, needs evaluating further in noisier environments. In addition, other entropic methods, such as SaEn and PeEn, can serve to estimate the complexities and irregularities of complex data. Owing to limited space, this paper does not assess the performance of other ternary entropy approaches. These valuable works will be carried out in the future.

5. Conclusions

This paper exploits the shuffle and surrogate methods of treating data to separate the PDF information of the original data from the correlation information of the original data. Additionally, ApEn is pioneered in measuring the complexities and irregularities of the shuffle and surrogate data in addition to the original data. Consequently, this paper proposes a novel ternary ApEn approach by integrating the ApEn of the original, shuffle, and surrogate data into a three-dimensional vector for describing the nature of complex data. Furthermore, the performance of the proposed method is benchmarked against traditional temporal statistics, the traditional ApEn and the two-dimensional EnEn based on EMD or WD, and the binary ApEn using both gear vibration data and roller-bearing vibration data containing different types and severity of machinery faults. The results indicate that the proposed method in this paper outperforms the others in the fault classification of rotating machinery. Thus, this paper contributes a potentially promising scheme for describing the nature of the complex vibration data of rotating machinery.

Author Contributions

Conceptualization, C.D., J.L. and L.G.; methodology, J.L. and C.D.; software, J.L. and C.D.; validation, J.L. and C.D.; formal analysis, C.D. and L.G.; investigation, C.D., J.L. and L.G.; resources, J.L.; data curation, J.L.; writing—original draft preparation, L.G. and J.L.; writing—review and editing, C.D. and J.L.; visualization, C.D.; supervision, J.L.; project administration, J.L.; funding acquisition, J.L. All authors have read and agreed to the published version of the manuscript.

Funding

This research was funded by Innovation Capability Improvement Project of Small and Medium-sized Sci-tech Enterprises of Shandong Province, grant number 2022TSGC2354, Shandong Provincial Natural Science Foundation, grant number ZR2012EEL07 and Innovation Capability Improvement Project of Small and Medium-sized Sci-tech Enterprises of Weifang City, grant number 2022TS1033.

Data Availability Statement

Datasets analyzed during the study can be found from the link https://drive.google.com/file/d/1sk_3NQyAS0tdaWNrNN_IBsU2zar0ECEr/view?usp=sharing.

Acknowledgments

Authors would like to kindly thank Kayvan J. Rafiee and Anil Kumarfor for sharing vibration data of defective gears and defective roller bearings, respectively.

Conflicts of Interest

The authors declare no conflict of interest.

Appendix A

  • function shufData = shuffle(data)
  • N=length(data);
  • shuf=randperm(N);
  • shufData=data(shuf);
  • end

Appendix B

  • function surrData=surrogate(data)
  • data=data(:);
  • N=length(data);
  • Coef=fft(data);
  • Amp=abs(Coef);
  • Ang=angle(Coef);
  • i=sqrt(-1);
  • half=floor(N/2);
  • if rem(N,2)==0
  • Angran=rand(half-1,1)*2*pi;
  • Ang(2:N)=[Angran’ Ang(half+1) -flipud(Angran)’];
  • Amp=[Amp(1:half+1);flipud(Amp(2:half))];
  • else
  • Angran=rand(half,1)*2*pi;
  • Ang(2:N)=[Angran -flipud(Angran)];
  • end
  • surrPhase=Amp.*exp(i*Ang);
  • surrData =real(ifft(surrPhase));
  • end

Appendix C

  • function energyEntropy = EnEn(data)
  • N=length(data);
  • probVec=data.^2/sum(data.^2);
  • energyEntropy=0;
  • for jElement=1:N
  • energyEntropy=energyEntropy-probVec(jElement)*log10(probVec(jElement));
  • end
  • end

References

  1. Jalayer, M.; Orsenigo, C.; Vercellis, C. Fault detection and diagnosis for rotating machinery: A model based on convolutional LSTM, Fast Fourier and continuous wavelet transforms. Comput. Ind. 2021, 125, 103378. [Google Scholar] [CrossRef]
  2. Patange, A.D.; Jegadeeshwaran, R. A machine learning approach for vibration-based multipoint tool insert health prediction on vertical machining centre (VMC). Measurement 2021, 173, 108649. [Google Scholar] [CrossRef]
  3. Patange, A.D.; Jegadeeshwaran, R. Application of bayesian family classifiers for cutting tool inserts health monitoring on CNC milling. Int. J. Progn. Health Manag. 2020, 11, 16. [Google Scholar] [CrossRef]
  4. Zhang, K.; Ma, C.; Xu, Y.; Chen, P.; Du, J. Feature extraction method based on adaptive and concise empirical wavelet transform and its applications in bearing fault diagnosis. Measurement 2021, 172, 108976. [Google Scholar] [CrossRef]
  5. Sun, Y.; Li, S.; Wang, Y.; Wang, X. Fault diagnosis of rolling bearing based on empirical mode decomposition and improved manhattan distance in symmetrized dot pattern image. Mech. Syst. Signal Process. 2021, 159, 107817. [Google Scholar] [CrossRef]
  6. He, X.; Zhou, X.; Yu, W.; Hou, Y.; Mechefske, C.K. Adaptive variational mode decomposition and its application to multi-fault detection using mechanical vibration signals. ISA Trans. 2021, 111, 360–375. [Google Scholar] [CrossRef]
  7. Huang, N.E.; Shen, Z.; Long, S.R.; Wu, M.L.C.; Shih, H.H.; Zheng, Q.N.; Yen, N.C.; Tung, C.C.; Liu, H.H. The empirical mode decomposition and the Hilbert spectrum for nonlinear and non-stationary time series analysis. Proc. R. Soc. London Ser. A Math. Phys. Eng. Sci. 1998, 454, 903–995. [Google Scholar] [CrossRef]
  8. Pincus, S.M. Approximate entropy as a measure of system complexity. Proc. Natl. Acad. Sci. USA 1991, 88, 2297–2301. [Google Scholar] [CrossRef] [Green Version]
  9. Lake, D.E.; Richman, J.S.; Griffin, M.P.; Moorman, J.R. Sample entropy analysis of neonatal heart rate variability. Am. J. Physiol.-Regul. Integr. Comp. Physiol. 2002, 283, R789–R797. [Google Scholar] [CrossRef] [Green Version]
  10. Bandt, C.; Pompe, B. Permutation entropy: A natural complexity measure for time series. Phys. Rev. Lett. 2002, 88, 174102. [Google Scholar] [CrossRef]
  11. Li, K.; He, S.; Li, B.; Liu, H.; Mao, X.; Shi, C. A novel online chatter detection method in milling process based on multiscale entropy and gradient tree boosting. Mech. Syst. Signal Process. 2020, 135, 106385. [Google Scholar] [CrossRef]
  12. Aziz, W.; Arif, M. Multiscale permutation entropy of physiological time series. In Proceedings of the 2005 Pakistan Section Multitopic Conference, Karachi, Pakistan, 24–25 December 2005; pp. 1–6. [Google Scholar]
  13. He, Y.; Fu, Y.; Qiao, Z.; Kang, Y. Chaotic resonance in a fractional-order oscillator system with application to mechanical fault diagnosis. Chaos Solitons Fractals 2021, 142, 110536. [Google Scholar] [CrossRef]
  14. Zhang, Y.; Ren, G.; Wu, D.; Wang, H. Rolling bearing fault diagnosis utilizing variational mode decomposition based fractal dimension estimation method. Measurement 2021, 181, 109614. [Google Scholar] [CrossRef]
  15. Lin, J.; Dou, C.; Liu, Y. Feature extraction based on generalized permutation entropy for condition monitoring of rotating machinery. Nonlinear Dynam. 2021, 107, 855–870. [Google Scholar] [CrossRef]
  16. Lin, J.; Dou, C.; Liu, Y. Multifractal detrended fluctuation analysis based on optimized empirical mode decomposition for complex signal analysis. Nonlinear Dynam. 2021, 103, 2461–2474. [Google Scholar] [CrossRef]
  17. Peng, C.K.; Havlin, S.; Stanley, H.E.; Goldberger, A.L. Quantification of scaling exponents and crossover phenomena in nonstationary heartbeat time series. Chaos 1995, 5, 82–87. [Google Scholar] [CrossRef]
  18. Kantelhardt, J.W.; Zschiegner, S.A.; Koscielny-Bunde, E.; Havlin, S.; Bunde, A.; Stanley, H.E. Multifractal detrended fluctuation analysis of nonstationary time series. Phys. A Stat. Mech. Its Appl. 2002, 316, 87–114. [Google Scholar] [CrossRef] [Green Version]
  19. Lei, Y.; Yang, B.; Jiang, X.; Jia, F.; Li, N.; Nandi, A.K. Applications of machine learning to machine fault diagnosis: A review and roadmap. Mech. Syst. Signal Process. 2020, 138, 106587. [Google Scholar] [CrossRef]
  20. Iqbal, R.; Maniak, T.; Doctor, F.; Karyotis, C. Fault detection and isolation in industrial processes using deep learning approaches. IEEE Trans. Ind. Inform. 2019, 15, 3077–3084. [Google Scholar] [CrossRef]
  21. Hoang, D.-T.; Kang, H.-J. A survey on deep learning based bearing fault diagnosis. Neurocomputing 2019, 335, 327–335. [Google Scholar] [CrossRef]
  22. Lin, J.; Chen, Q. Fault diagnosis of rolling bearings based on multifractal detrended fluctuation analysis and Mahalanobis distance criterion. Mech. Syst. Signal Process. 2013, 38, 515–533. [Google Scholar] [CrossRef]
  23. Dou, C.; Wei, X.; Lin, J. Fault diagnosis of gearboxes using nonlinearity and determinism by generalized Hurst exponents of shuffle and surrogate data. Entropy 2018, 20, 364. [Google Scholar] [CrossRef] [Green Version]
  24. Sadegh Movahed, M.; Jafari, G.; Ghasemi, F.; Rahvar, S.; Reza Rahimi Tabar, M. Multifractal detrended fluctuation analysis of sunspot time series. J. Stat. Mech. -Theory Eperiment 2006, 2006, P02003. [Google Scholar] [CrossRef]
  25. Rafiee, J.; Tse, P. Use of autocorrelation of wavelet coefficients for fault diagnosis. Mech. Syst. Signal Process. 2009, 23, 1554–1572. [Google Scholar] [CrossRef]
  26. Rafiee, J.; Arvani, F.; Harifi, A.; Sadeghi, M. Intelligent condition monitoring of a gearbox using artificial neural network. Mech. Syst. Signal Process. 2007, 21, 1746–1754. [Google Scholar] [CrossRef]
  27. Kumar, A.; Zhou, Y.; Gandhi, C.; Kumar, R.; Xiang, J. Bearing defect size assessment using wavelet transform based Deep Convolutional Neural Network (DCNN). Alex. Eng. J. 2020, 59, 999–1012. [Google Scholar] [CrossRef]
  28. Kumar, A.; Kumar, R. Enhancing weak defect features using undecimated and adaptive wavelet transform for estimation of roller defect size in a bearing. Tribol. Trans. 2017, 60, 794–806. [Google Scholar] [CrossRef]
  29. Kumar, A.; Gandhi, C.; Zhou, Y.; Tang, H.; Xiang, J. Fault diagnosis of rolling element bearing based on symmetric cross entropy of neutrosophic sets. Measurement 2020, 152, 107318. [Google Scholar] [CrossRef]
  30. Lin, J.; Chen, Q. A novel method for feature extraction using crossover characteristics of nonlinear data and its application to fault diagnosis of rotary machinery. Mech. Syst. Signal Process. 2014, 48, 174–187. [Google Scholar] [CrossRef]
  31. Lin, J.; Dou, C. The diagnostic line: A novel criterion for condition monitoring of rotating machinery. ISA Trans. 2015, 59, 232–242. [Google Scholar] [CrossRef]
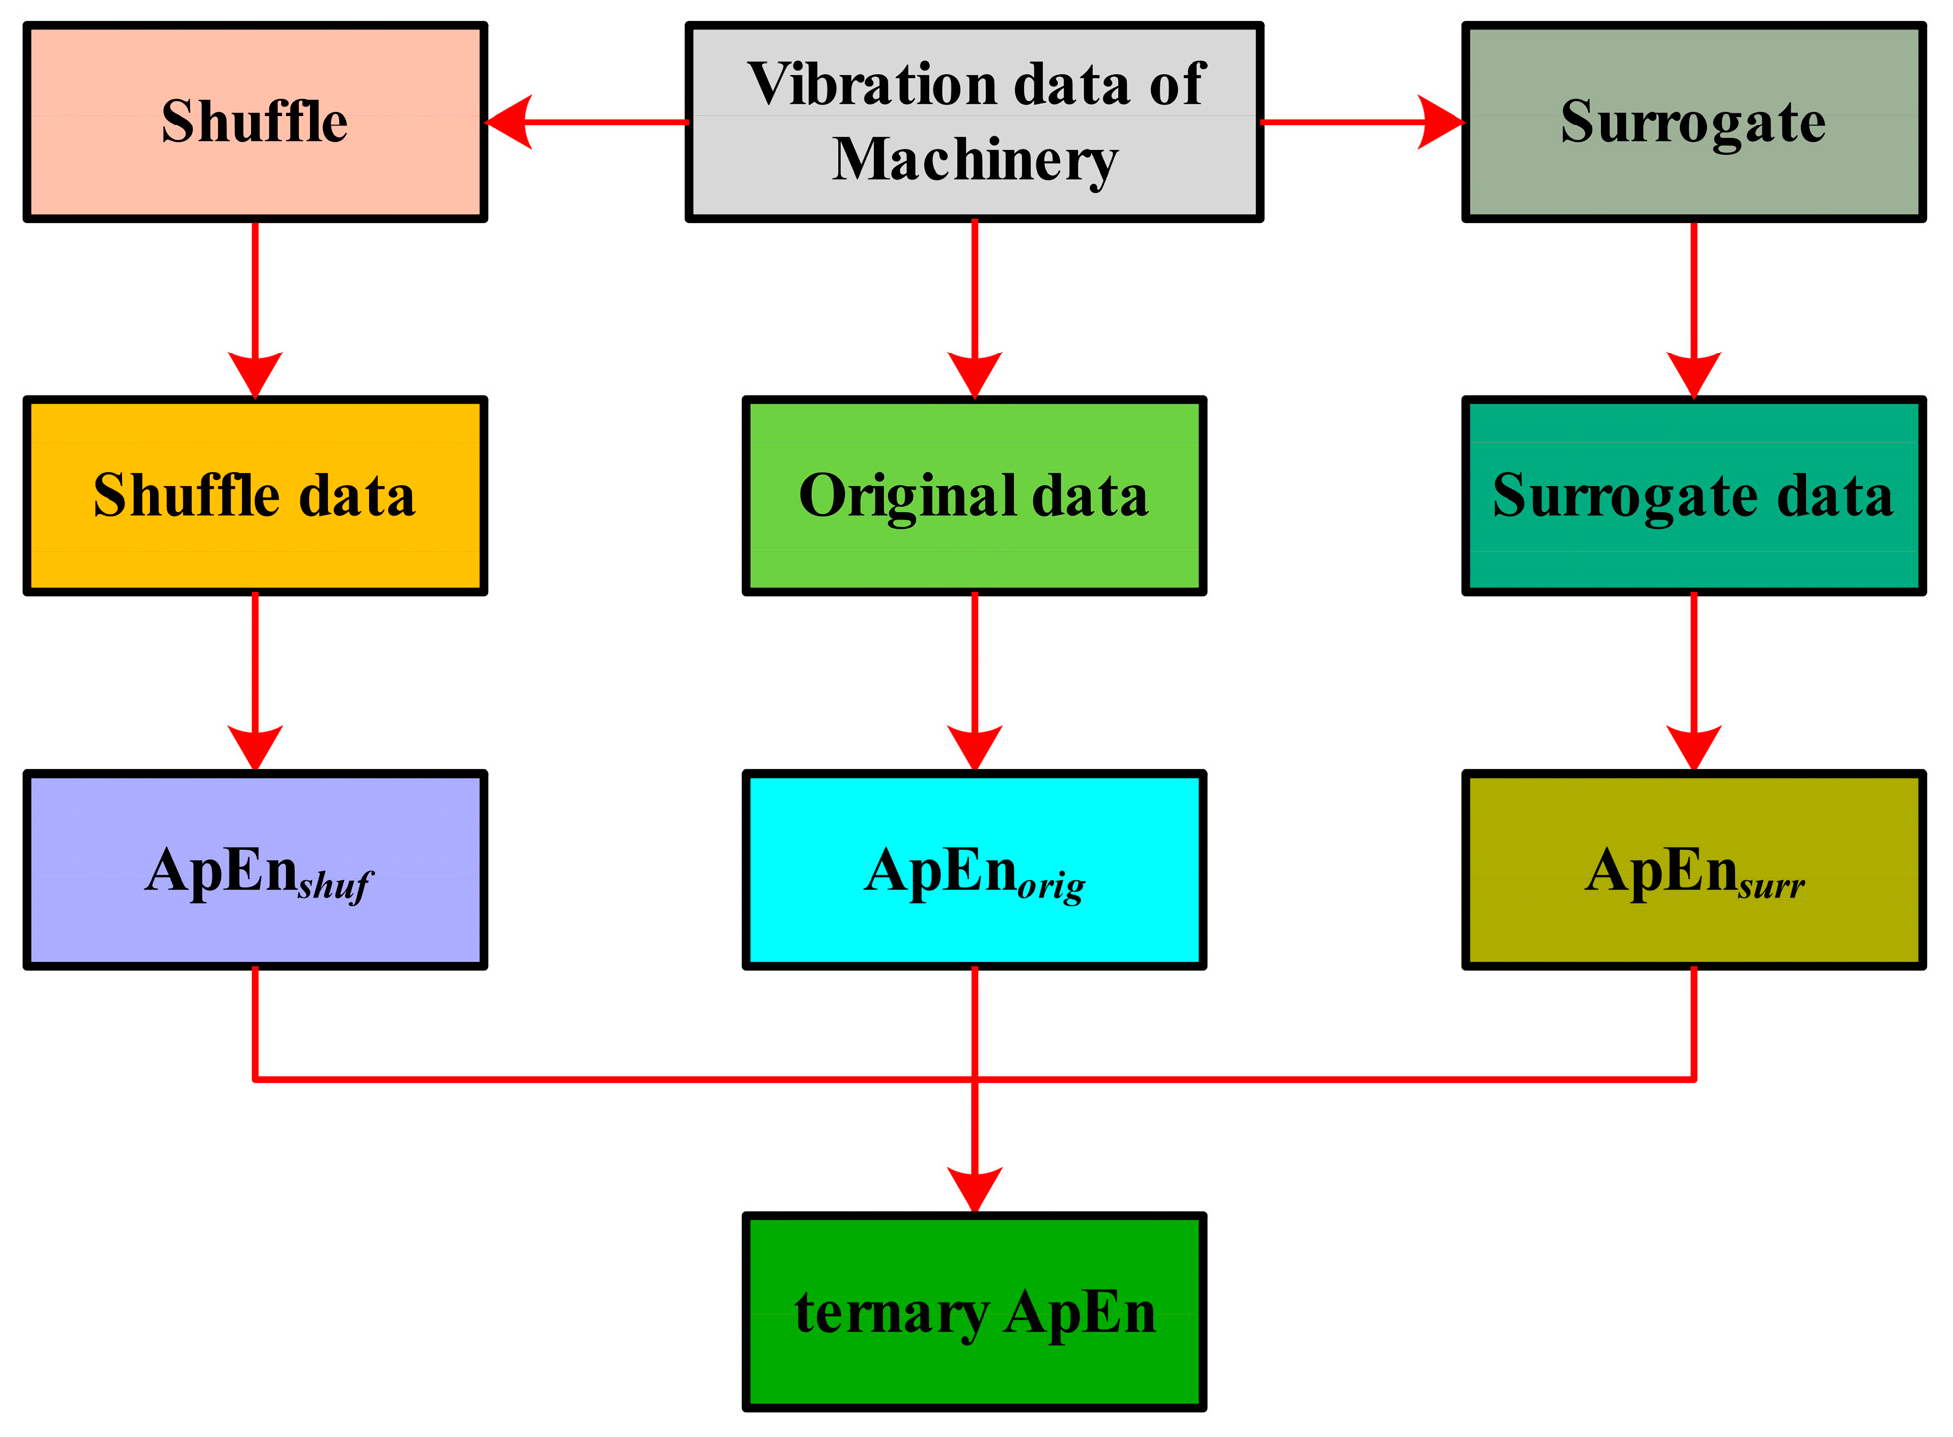
Figure 1. An illustration of the ternary ApEn approach.
Machines 11 00172 g001
Figure 2. Experimental rig for simulations of gear faults, (A) experimental rig, (B) accelerometer location, (C) broken tooth, and (D) slightly worn tooth [25,26].
Machines 11 00172 g002
Figure 3. Four types of gear vibration data, where (ad) are for normal, slightly worn, medium-worn, and broken-tooth conditions, respectively.
Machines 11 00172 g003
Figure 4. Skewness of the four types of gear vibration data.
Machines 11 00172 g004
Figure 5. Kurtosis of the four types of gear vibration data.
Machines 11 00172 g005
Figure 6. ApEn of the original versions of the four types of gear vibration data.
Machines 11 00172 g006
Figure 7. ApEn of the shuffle versions of the four types of gear vibration data.
Machines 11 00172 g007
Figure 8. ApEn of the surrogate versions of the four types of gear vibration data.
Machines 11 00172 g008
Figure 9. Two-dimensional EnEn of the two IMFs most correlated with the original data for each of the four types of gear condition. In this case, the first two IMFs are selected for use.
Machines 11 00172 g009
Figure 10. Two-dimensional EnEn of the two detail components most correlated with the original data for each of the four types of gear condition. In this case, the first detail components are selected for use.
Machines 11 00172 g010
Figure 11. Binary ApEn of the original and shuffle versions of the four types of gear vibration data.
Machines 11 00172 g011
Figure 12. Ternary ApEn of the gear vibration data.
Machines 11 00172 g012
Figure 13. Test rig for simulations of roller-bearing faults, (a) photograph of a typical view of the test rig, (b) schematic of test rig for measuring roller fault width [27,28,29].
Machines 11 00172 g013
Figure 14. Five types of roller-bearing vibration data, where (ae) are for normal, IR, OR, RO1, and RO2 conditions, respectively.
Machines 11 00172 g014
Figure 15. Skewness of the five types of roller-bearing vibration data.
Machines 11 00172 g015
Figure 16. Kurtosis of the five types of roller-bearing vibration data.
Machines 11 00172 g016
Figure 17. ApEn of the original versions of the five types of roller-bearing vibration data.
Machines 11 00172 g017
Figure 18. ApEn of the shuffle versions of the five types of roller-bearing vibration data.
Machines 11 00172 g018
Figure 19. ApEn of the surrogate versions of the five types of roller-bearing vibration data.
Machines 11 00172 g019
Figure 20. Two-dimensional EnEn of the two IMFs most correlated with the original data for each of the five types of roller-bearing condition. In this case, the first IMFs are selected for use.
Machines 11 00172 g020
Figure 21. Two-dimensional EnEn of the two detail components most correlated with the original data for each of the five types of roller-bearing condition. In this case, the first detail components are selected for use.
Machines 11 00172 g021
Figure 22. Binary ApEn of the original and shuffle versions of the five types of roller-bearing vibration data.
Machines 11 00172 g022
Figure 23. Ternary ApEn of the rolling-bearing vibration data.
Machines 11 00172 g023
Figure 24. Generalized Hurst exponents of the original, shuffle, and surrogate versions of the four types of gear vibration data.
Machines 11 00172 g024
Figure 25. Generalized Hurst exponents of the original, shuffle, and surrogate versions of the five types of roller-bearing vibration data. Here, the abbreviations shuf. and surr. indicate shuffle and surrogate, respectively.
Machines 11 00172 g025
Disclaimer/Publisher’s Note: The statements, opinions and data contained in all publications are solely those of the individual author(s) and contributor(s) and not of MDPI and/or the editor(s). MDPI and/or the editor(s) disclaim responsibility for any injury to people or property resulting from any ideas, methods, instructions or products referred to in the content.