1. Introduction
While stone stands as one of the most ancient materials known to humanity, the demand for stone-based products exhibits a persistent upward trajectory, according to market analysts [
1,
2,
3]. Stone is a heterogeneous and anisotropic material, distinguished by its mineral composition, texture, and overall structure. Significant variations in properties across diverse stone types contribute to the complexity of the machining process. Heterogeneity causes deviations in cutting forces and vibrations. Their potentially excessive and dynamically changing values have a negative impact on machine safety, product quality, productivity, and tool life. In order to overcome the negative influences of heterogeneity while at the same time enhancing all aforementioned aspects of the CNC machining process, cutting tools for stone machining have to be improved.
Drilling is one of the most utilized CNC machining processes. Drill bits commonly used in conventional stone drilling in shop floor environments do not have internal cooling capabilities, despite the fact that axial force increases with the drilling depth due to the inadequate removal dynamics of stone particles from the cutting zone. The application of internally cooled drill bits in stone machining probably has not gained traction in industrial practice so far due to the specific characteristics of stone, such as its hardness, brittleness, and tendency to produce abrasive dust during drilling. However, their usage could potentially be useful in specific applications within the stone machining industry, especially when working with particularly hard or heat-sensitive stone types or in cases where extended tool life and improved surface finish are crucial.
Therefore, a comparative analysis of cutting forces and tool wear dynamics achieved by commercially available industrial drill bit without cooling capabilities and its modified version with a built-in cooling channel was conducted in this experimental study. Due to the expected positive influence of internally cooled drill bits on the dynamics of particle formation and friction reduction in the cutting zone [
4,
5,
6,
7], the aim of this study was to determine to what extent the cooling medium affects the reduction of cutting forces and tool wear in stone drilling.
Another potentially positive outcome of fast workpiece particle removal from the cutting zone using the cooling medium is the reduction of vibrations, which significantly impacts all aspects of the machining process. This effect has been confirmed in numerous studies related to different types of workpiece materials, machining processes, and parameters [
8,
9,
10]. On the other hand, vibration signals have exhibited promising results in the real-time monitoring of stone hardness during CNC drilling with conventional drilling bits [
11]. Hence, it seems interesting to analyze whether vibration signals can also be employed for the monitoring of stone hardness in scenarios involving reduced machine vibrations.
Generally speaking, the determination of hardness, as well as other physico-mechanical parameters, within the realm of non-homogeneous and anisotropic stone structures presents a formidable challenge. Hardness is one of the most important stone properties with a strong influence on cutting forces. Its variations within the cutting zone frequently increase the wear dynamics of the cutting tool, potentially resulting in the breakage of either the tool itself or the workpiece. Besides the utilization of vibration signals in the hardness monitoring during CNC stone drilling, several indirect techniques and parameters have also been proposed for estimating stone physico-mechanical properties during drilling with conventional drill bits. Among the most commonly employed process parameters are drilling rates (feed velocity) and axial force, as well as cutting forces and current signals from servomotor drives.
In [
12], Billim investigates the relationships between mechanical properties and penetration rates of natural stones. This study demonstrated an inversely proportional correlation between the hardness of the processed stone and the drill’s rotational speed at a constant axial force. Hoseinie et al. [
13] also investigated the influence of rock material hardness on drilling rate. The results of this study have confirmed once again that with an increase in Mohs hardness, the drilling rate decreases exponentially. Additionally, the relationship between drilling rate and Mohs hardness is logarithmic in soft rocks and liner in hard rocks.
Exadaktylos et al. [
14] demonstrated that thrust and torque measurements during drilling under specified operative conditions (drill bit material and geometry, hole diameter, penetration rate, and rotational speed) may be used to characterize the angle of friction and uniaxial compressive strength of stones. Valentini et al. [
15] and Pamplona et al. [
16] identified a correlation between compressive strength, axial force, and feed velocity, while Al-Naddaf et al. [
17] compared the impact of stone porosity on axial force during stone drilling. They pointed out a significant potential for error when using direct methods to measure stone porosity due to its non-homogeneous structure. Yurdakul and Akdas [
18] investigated the optimum feed rate regardless of the type of stone being cut. Since the most significant factors that affect the feed rate during cutting processes are the physico-mechanical and mineralogical–petrographic properties of the natural stone, they tried to define the relationship between the feed rate and those properties. In their study, they have confirmed that the required motor current of the cutter decreases in parallel with the decrease in stone hardness.
Based on the aforementioned and similar research studies from this field, it can be concluded that the development of hardness monitoring systems for stone machining in shop floor environments is still practically in its beginning stages. Considering the negative influence of variations of hardness and other physico-mechanical properties within the cutting zone and the overall limited efforts to develop comprehensive process monitoring systems [
19], the utilization of vibration signals in stone hardness classification during drilling with internally cooled drill bits has also been analyzed as an additional part of this study.
All experiments were performed using compressed air as the cooling medium at a pressure of 0.2 bar, which corresponds to an approximate flow rate of 22.7 cm3/s. Three distinct types of stone samples, varying in hardness, were drilled using nine combinations of cutting speed and feed rate. During the machining process, cutting forces and vibrations were recorded for every combination of analyzed process parameters. The cutting edges of the drill bits were inspected after a specific number of drilling cycles using a vision system. A hardness classification model was constructed based on features extracted from vibration signals, which were then processed using an artificial neural network.
The results achieved in this study unequivocally indicate that the proposed drill bit with an internally cooling channel outperformed conventional industrial drill bit in the following aspects:
Significantly reduced cutting forces;
Balanced cutting dynamics, which is reflected in low-variant cutting forces;
Substantial reduction in tool wear dynamics;
Preservation of the potential for stone hardness monitoring using features extracted from vibration signals despite the lower energy content of such signals.
In other words, this research strongly emphasizes the negative effects of the removed stone particles on cutting and tool wear dynamics, with a further strong and negative potential influence on the temperature rise in the cutting zone, which still needs to be established. Therefore, it suggests the introduction and frequent utilization of internally cooled drill bits in stone CNC machining practice.
A detailed description of the experiment and the obtained results are presented in the subsequent sections.
2. Materials and Methods
2.1. Experimental Setup and Parameters
All experiments were conducted using three distinct types of stone samples, each distinguished by its principal constituents or their relative abundance:
Limestone intramicrite (composed of a micritic matrix at 60% and sparitic calcite at 35%)—denoted as S1;
Dolomite limestone (with dolomite comprising 80.9% and calcite 18.6%)—denoted as S2;
Dolomite marble (consisting of dolomite at 97.8% and calcite at 2.1%)—referred to as S3.
Those three stone types were chosen based on their frequent use on the market and diverse structural and physico-mechanical properties. Stone S1 has a relatively uniform structure, but the presence of thin veins of sparitic calcite with increased hardness (up to 2800 MPa, measured by Knoop hardness test) makes it exceptionally challenging for processing in terms of machinability. Stone S2 has a relatively homogeneous structure and consistent hardness, making it easily machined, while stone S3 was chosen due to its granular structure (homogeneous grain size ranges from 90 to 850 µm) and significant variations in hardness (1400–4100 MPa, measured by Knoop hardness test). The physico-mechanical properties of these stone samples are detailed in
Table 1.
During the preparation of stone samples, larger pieces of stone were cut into smaller samples measuring 200 × 90 × 30 mm.
The hardness values presented in
Table 1 represent median values that have been calculated based on a total of 1440 measurements (480 for each stone sample). These measurements were conducted using a custom-made hardness testing device, which was positioned on a CNC testbed’s
z-axis instead of the main spindle (
Figure 1). Unlike many commercially available hardness testers, this device was constructed as a self-contained instrument that incorporated a vision system for the selection of the measurement area based on stone texture, an indentation feed drive, and a second vision system for conducting the actual indentation measurements. The measurements were conducted following the Knoop hardness test (EN 14205:2003) and are more comprehensively detailed in [
11].
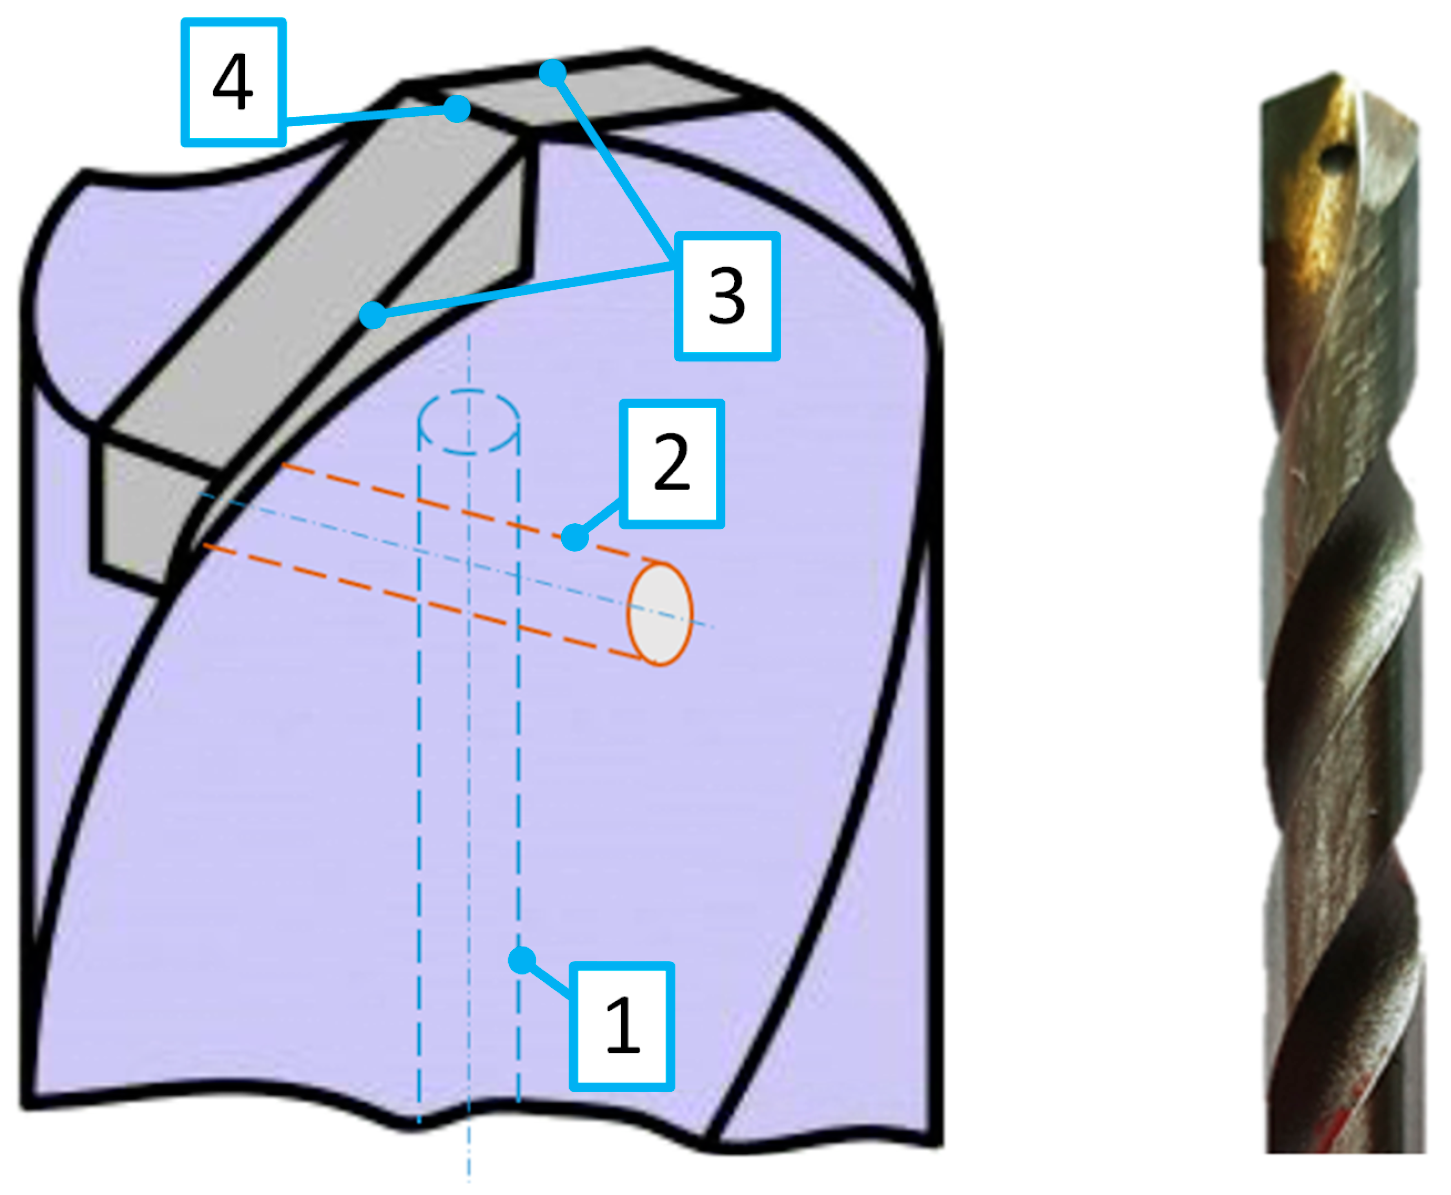
Two variants of drill bits were employed in the experiments. The first type was a 5 mm twist drill bit characterized by a 120-degree point angle and equipped with cemented carbide inserts (Officina Martello di GIORGI F.LLI s.r.l., Broni, Italy). This drill bit is commonly employed in the industry for stone drilling and conforms to conventional practices, i.e., it did not incorporate internal cooling capabilities. The second type of drill bit was a modified version of the first, involving the integration of a cooling channel manufactured using the Electrical Discharge Machining (EDM) process. The channel was round-shaped and had a diameter of 0.4 mm. It was positioned axially along the length of the drill bit (70 mm), extending from one side of the tool practically up to the end point of drill bit on the other side. Perpendicular to this axial channel, an additional channel with a diameter of 0.8 mm was created. This channel was connected to the main one and positioned radially across the drill bit within the flutes section (
Figure 2). This additional channel was designed to facilitate the exit of the cooling medium, allowing it to flow over the flank and rake surfaces of the drill bit into the cutting zone.
A total of nine combinations of cutting parameters were utilized, encompassing cutting speeds of 10, 15, and 20 m/min, along with feed rates of 0.03, 0.06, and 0.09 mm/rev. These parameter configurations were chosen in accordance with the guidance provided by the tool manufacturer. Drilling depth for each hole was set at 15 mm.
Drillings were conducted on a customized triaxial milling machine (
Figure 3) adapted specifically for stone drilling research. The machine was outfitted with 0.4 kW permanent magnet synchronous motors (Model APM-SB04A, LS Mecapion, Daegu, Republic of Korea), servomotor drives (Models DPCANIE-030A400 and DPCANIE-060A400, Advanced Motion Control, Camarillo, CA, USA), and ball screw assemblies (Model R16-5B1, Hiwin Technologies Co., Taichung, Taiwan). It was operated using a Linux-based, open-architecture CNC system—LinuxCNC [
20].
2.2. Data Acquisition and Signal Processing
This study involved the measurement and analysis of several types of process signals—specifically, cutting forces, vibrations, and images of the cutting edges of drill bits.
2.2.1. Cutting Forces
All three orthogonal components of the cutting process—FX, FY, and FZ—were measured using a triaxial Kistler piezoelectric dynamometer 9257B, which was paired with a charge amplifier 5017B at a sampling rate of 1 kHz. The measurements started before the drill bit entered into the material and concluded after the hole was completely drilled and the drill bit had exited from the hole.
Subsequent to the measurements, all signals were filtered using a Butterworth low-pass filter with a cut-off frequency of 2 Hz. As in previous studies [
11] and in the present one (see
Section 3), it was observed that the force components
FX and
FY were significantly smaller compared to the vertical component
FZ. This was in accordance with the vertical tool movement, which was characteristic of the utilized drilling process. Nevertheless, the influence of all force components of each measurement was encompassed by the resultant cutting force calculated as
. Filtered signals of the resultant cutting force underwent further processing to extract the maximum force values, which were then used for the purpose of comparing the drill bits.
2.2.2. Vibration Signals
Vibration signals were acquired using a triaxial Kistler piezoelectric accelerometer 8688A50, combined with an appropriate signal conditioner 5134B. The accelerometer was positioned near the front bearing of the main spindle motor (
Figure 3), which also represented the nearest location of the sensor placement to the cutting zone. Measurements were taken along the
x-,
y-, and
z-axis directions, and the signals were captured using a 4-channel acquisition board (PCI-DAS4020/12, Measurement Computing, Norton, MA, USA). All signals were sampled at a frequency of 100 kHz for a duration of two seconds after the cutting edges had completely entered the workpiece.
The feature extraction and analysis method employed in this study was initially developed for tool wear monitoring, as described in detail in [
21]. Subsequently, its effectiveness was demonstrated in the context of stone hardness classification during drilling with a conventional industrial drill bit without cooling capabilities, as discussed in [
11]. The process starts with converting the raw sampled vibration signals from the time domain to the frequency domain through the Fast Fourier Transformation (FFT). The power spectrum range of the transformed signals was confined within the measurement range of the sensor, spanning from 5 Hz to 5 kHz. Following the transformation, each signal’s power spectrum was divided into several samples, contingent on the selected bandwidth. A total of 23 bandwidths, including 5, 10, 20, …, 100, 200, …, 1000, 1500, 2500, and 5000 Hz, were chosen for the analysis. For instance, employing a 1000 Hz bandwidth divided the signal power spectrum into five samples, each associated with a distinct frequency range: 5–1005, 1005–2005, 2005–3005, 3005–4005, and 4005–5000 Hz. The upper-frequency value of the last sample was adjusted to not exceed 5 kHz.
Upon determining all samples of the analyzed vibration signal within the chosen bandwidth, the energy (
ψ2) of each sample was computed using the following equation [
22]:
where
S represents the one-sided power spectrum density function of the analyzed vibration signal, and
fL and
fU are the lower and upper frequencies of the sample for which the energy is being calculated. Along with the corresponding machining parameters (cutting speed and feed rate), the energies derived from the vibration signals were employed as features in the classification of the stone hardness. For example, with the 5 Hz bandwidth, each signal was represented by 999 vibration feature energies. Conversely, the 5000 Hz bandwidth resulted in just one feature per signal. The intention of this analysis was to ascertain the minimum number of features per signal necessary for adequately identifying stone hardness during drilling.
Features were assessed for each individual type of vibration signal (
x-,
y-, and
z-axis) both individually and in various combinations. In total, eight distinct groups of features, i.e., energies of different frequency ranges, were scrutinized, as detailed in
Table 2.
2.2.3. Tool Wear Determination
In addition to the measurements of cutting forces and vibration signals, direct observations of tool wear on the cutting edges of the drill bits were also conducted. To facilitate this, a vision system incorporating an industrial camera DMK41AF02 paired with telecentric lenses TC2309 was utilized.
Tool wear was quantified using two standard wear parameters: maximum flank wear width (VBMAX) and the surface of flank wear area (VBSURF). To obtain quantified values of wear parameters from the images, the CATIA software package was utilized, specifically the “Sketch Tracer” and the “Product Engineering Optimizer” modules. Images depicting the initial states of both cutting edges of the sharp drill were used to establish reference contours of the flank surface. Subsequent images were based on the original (reference) coordinate system, and a manually drawn curve was superimposed on each image to represent the boundary of wear on the flank surface. The positions of individual curves were compared relative to the reference contour of the flank surface in order to quantify those two wear parameters.
2.3. Measurement Procedure
Cutting forces and vibrations were measured separately for both drill bits in four iterations. In the initial stage, utilizing completely sharp drill bits, cutting edges were first inspected by the vision system. After that, a total of 189 holes were drilled, during which measurements were taken for all three orthogonal force and vibration signal components. These holes were drilled in three different stone samples using nine combinations of machining parameters (cutting speed and feed rate). Measurements for each combination of machining parameters were repeated seven times in a randomized manner. After all hole-drilling procedures were finished, wear of both cutting edges was re-evaluated using the vision system.
Prior to initiating the second stage of measurements, an additional set of 1000 holes was drilled using the stone sample with the highest hardness level (S3). The process signals were not recorded during this phase. The second stage again started with the vision inspection of cutting edges, after which 189 new holes were drilled, during which both types of process signals were acquired again. This procedure was repeated in a total of four cycles. Altogether, a total of 3756 holes were drilled, encompassing both types of drill bits, through the course of these iterations.
The experiment aimed to explore the interplay of cutting forces and tool wear dynamics while drilling under varying conditions encompassing machining parameters, stone samples, and drill bit types. The vision inspections conducted before and after drilling provided insights into the condition of the drill bits and their correlation with fluctuations in cutting forces.
2.4. Algorithms for Stone Hardness Classification
2.4.1. Radial Basis Function Neural Network
Along with the specific combination of cutting speed and feed rate characteristic for each measurement, the features extracted from vibration signals (energies) were processed by an artificial neural network algorithm. Artificial neural networks are widely used algorithms in machining process monitoring due to their capacity to implicitly identify intricate nonlinear connections between features extracted from process signals and monitoring parameters. The effectiveness of each selected feature combination in this study to accurately classify stone hardness during rock drilling was assessed using a well-known Radial Basis Function Neural Network (RBF NN) [
23]. Given that the method for feature selection discussed hereafter and described in [
21] involved the evaluation of numerous combinations of feature combinations, the utilized variant of the RBF NN algorithm was selected due to its ability to learn classification problems in a single step and quickly adapt the structure of the network hidden layer.
The RBF NN is structured with three layers in a feed-forward configuration. The neurons in the hidden layer are connected to neurons in the output layer through a weight matrix
c. This matrix is established during the training phase using the following expression:
where
y signifies the matrix containing the desired output values, and
H represents the matrix comprising the values of the RBF activation functions (outputs of the hidden layer neurons).
The choice of a Gaussian function as the activation function led to the determination of the matrix
H through the following formula:
where
rij symbolizes the Mahalanobis distance between a vector constructed from the
i-th element of all input vectors and the
j-th hidden layer neuron. The number of hidden layer neurons was, in this study, equal to the number of input vectors or training sets (
K = N). Consequently, matrix
H was defined in a quadratic format (
N × N). The squared Mahalanobis distance is defined as follows:
where
Σj is a covariance matrix associated with the group of training samples connected to the
j-th hidden layer neuron;
xi denotes the
L-dimensional input vector related to the
i-th set of
N total sets of neural network inputs or stone hardness classification features; and
tj represents the
L-dimensional vector of the center of the
j-th hidden layer neuron. The centers of the hidden layer neurons are formed from the
L-dimensional input vectors, such that each input vector
xi serves as the center of the corresponding hidden layer neuron (
K = N).
The covariance matrix
Σj is a quadratic matrix with non-zero elements (squared components of the
σ vector) on the main diagonal and zeroes elsewhere:
The elements of the vector
σ are computed as half of the absolute value of the minimal distance between all training samples and the
j-th hidden layer neuron center, calculated for each of the
L dimensions separately.
where
xgi is the
g-th element of the
i-th input vector, and
tgj is the
g-th element of the
j-th hidden layer neuron center.
All input values in the RBF NN for training and testing purposes were normalized to fall within the range of 0 and 1. The output values were assigned either “0” or “1” based on the type of stone sample, i.e., stone hardness level associated with the training or testing sample. During the testing phase, the output matrix
y was derived from the following equation:
A more detailed explanation of the aforementioned algorithm can be found in reference [
23].
2.4.2. Features Selection and Classification
The classification of stone hardness was conducted in two steps. In the first step, the features were analyzed individually for each of the 23 analyzed frequency bandwidths within the measurement range of 5 Hz to 5 kHz. The results are presented in terms of the Classification Success Rate (CSR), which represents the ratio of correctly classified samples to the total number of tested samples corresponding to the analyzed type of stone. Features that satisfied predefined condition CSR ≥ CSRMIN were subsequently combined and subjected to further analysis in the second step of the stone hardness classification procedure. All features utilized in those combinations were associated with non-overlapping frequency ranges. In cases where energies were extracted from two or more overlapping ranges, the one with the highest CSR value was selected for subsequent analysis.
As mentioned earlier, for each of the nine combinations of machining parameters (cutting speed and feed rate), four drill bit wear levels, and three stone types (hardness levels), seven randomly repeated measurements were performed. Due to the low intensity of tool wear dynamics, as presented hereinafter in
Section 3, only the initial (sharp drill) and the highest observable tool wear level in this experiment were utilized in the stone hardness classification. However, the low tool wear intensity observed in this study, caused by the utilization of the cooled drill bit, should not impact the overall conclusion about the utility of vibration signals in the classification of stone hardness. According to [
11], features extracted from vibration signals achieved high classification precision in the case of conventional industrial drill bits, regardless of the degree of tool wear.
From seven randomly repeated measurements for each combination of the experimental parameters, four were assigned to the RBF NN training data set and the remaining three to the testing data set. Hence, from the total number of 756 measurements of vibration signals, half of them were used in stone hardness monitoring. Out of these 378 measurements, 216 were used for the training phase, while the remaining 162 measurements were used in the testing phase of the RBF NN. Data used in the testing phase were further divided into three equal groups, each belonging to one of three tests (T1–T3).
Every training/testing data set consisted of feature values belonging to both drill bit wear levels, all related combinations of machining parameters, and the analyzed energies of different frequency bandwidths of vibration signals, which were also defined by the feature group presented in
Table 2 and the CSR ≥ CSR
MIN condition. This means that in the first step of hardness classification, and, for example, in the case of energies extracted from 5 Hz bandwidths of the vibration signals measured in the
y-axis direction (feature group labeled as Y in
Table 2), RBF NN was trained and tested 999 times, using machine parameters and energies belonging to each individual frequency bandwidth. In other words, only in the first step of the hardness classification procedure, where features were analyzed individually for each of the 23 analyzed frequency bandwidths, there were 2560 training/testing cycles for each of the eight groups of features (
Table 2).
3. Results and Discussion
3.1. Tool Wear and Cutting Forces
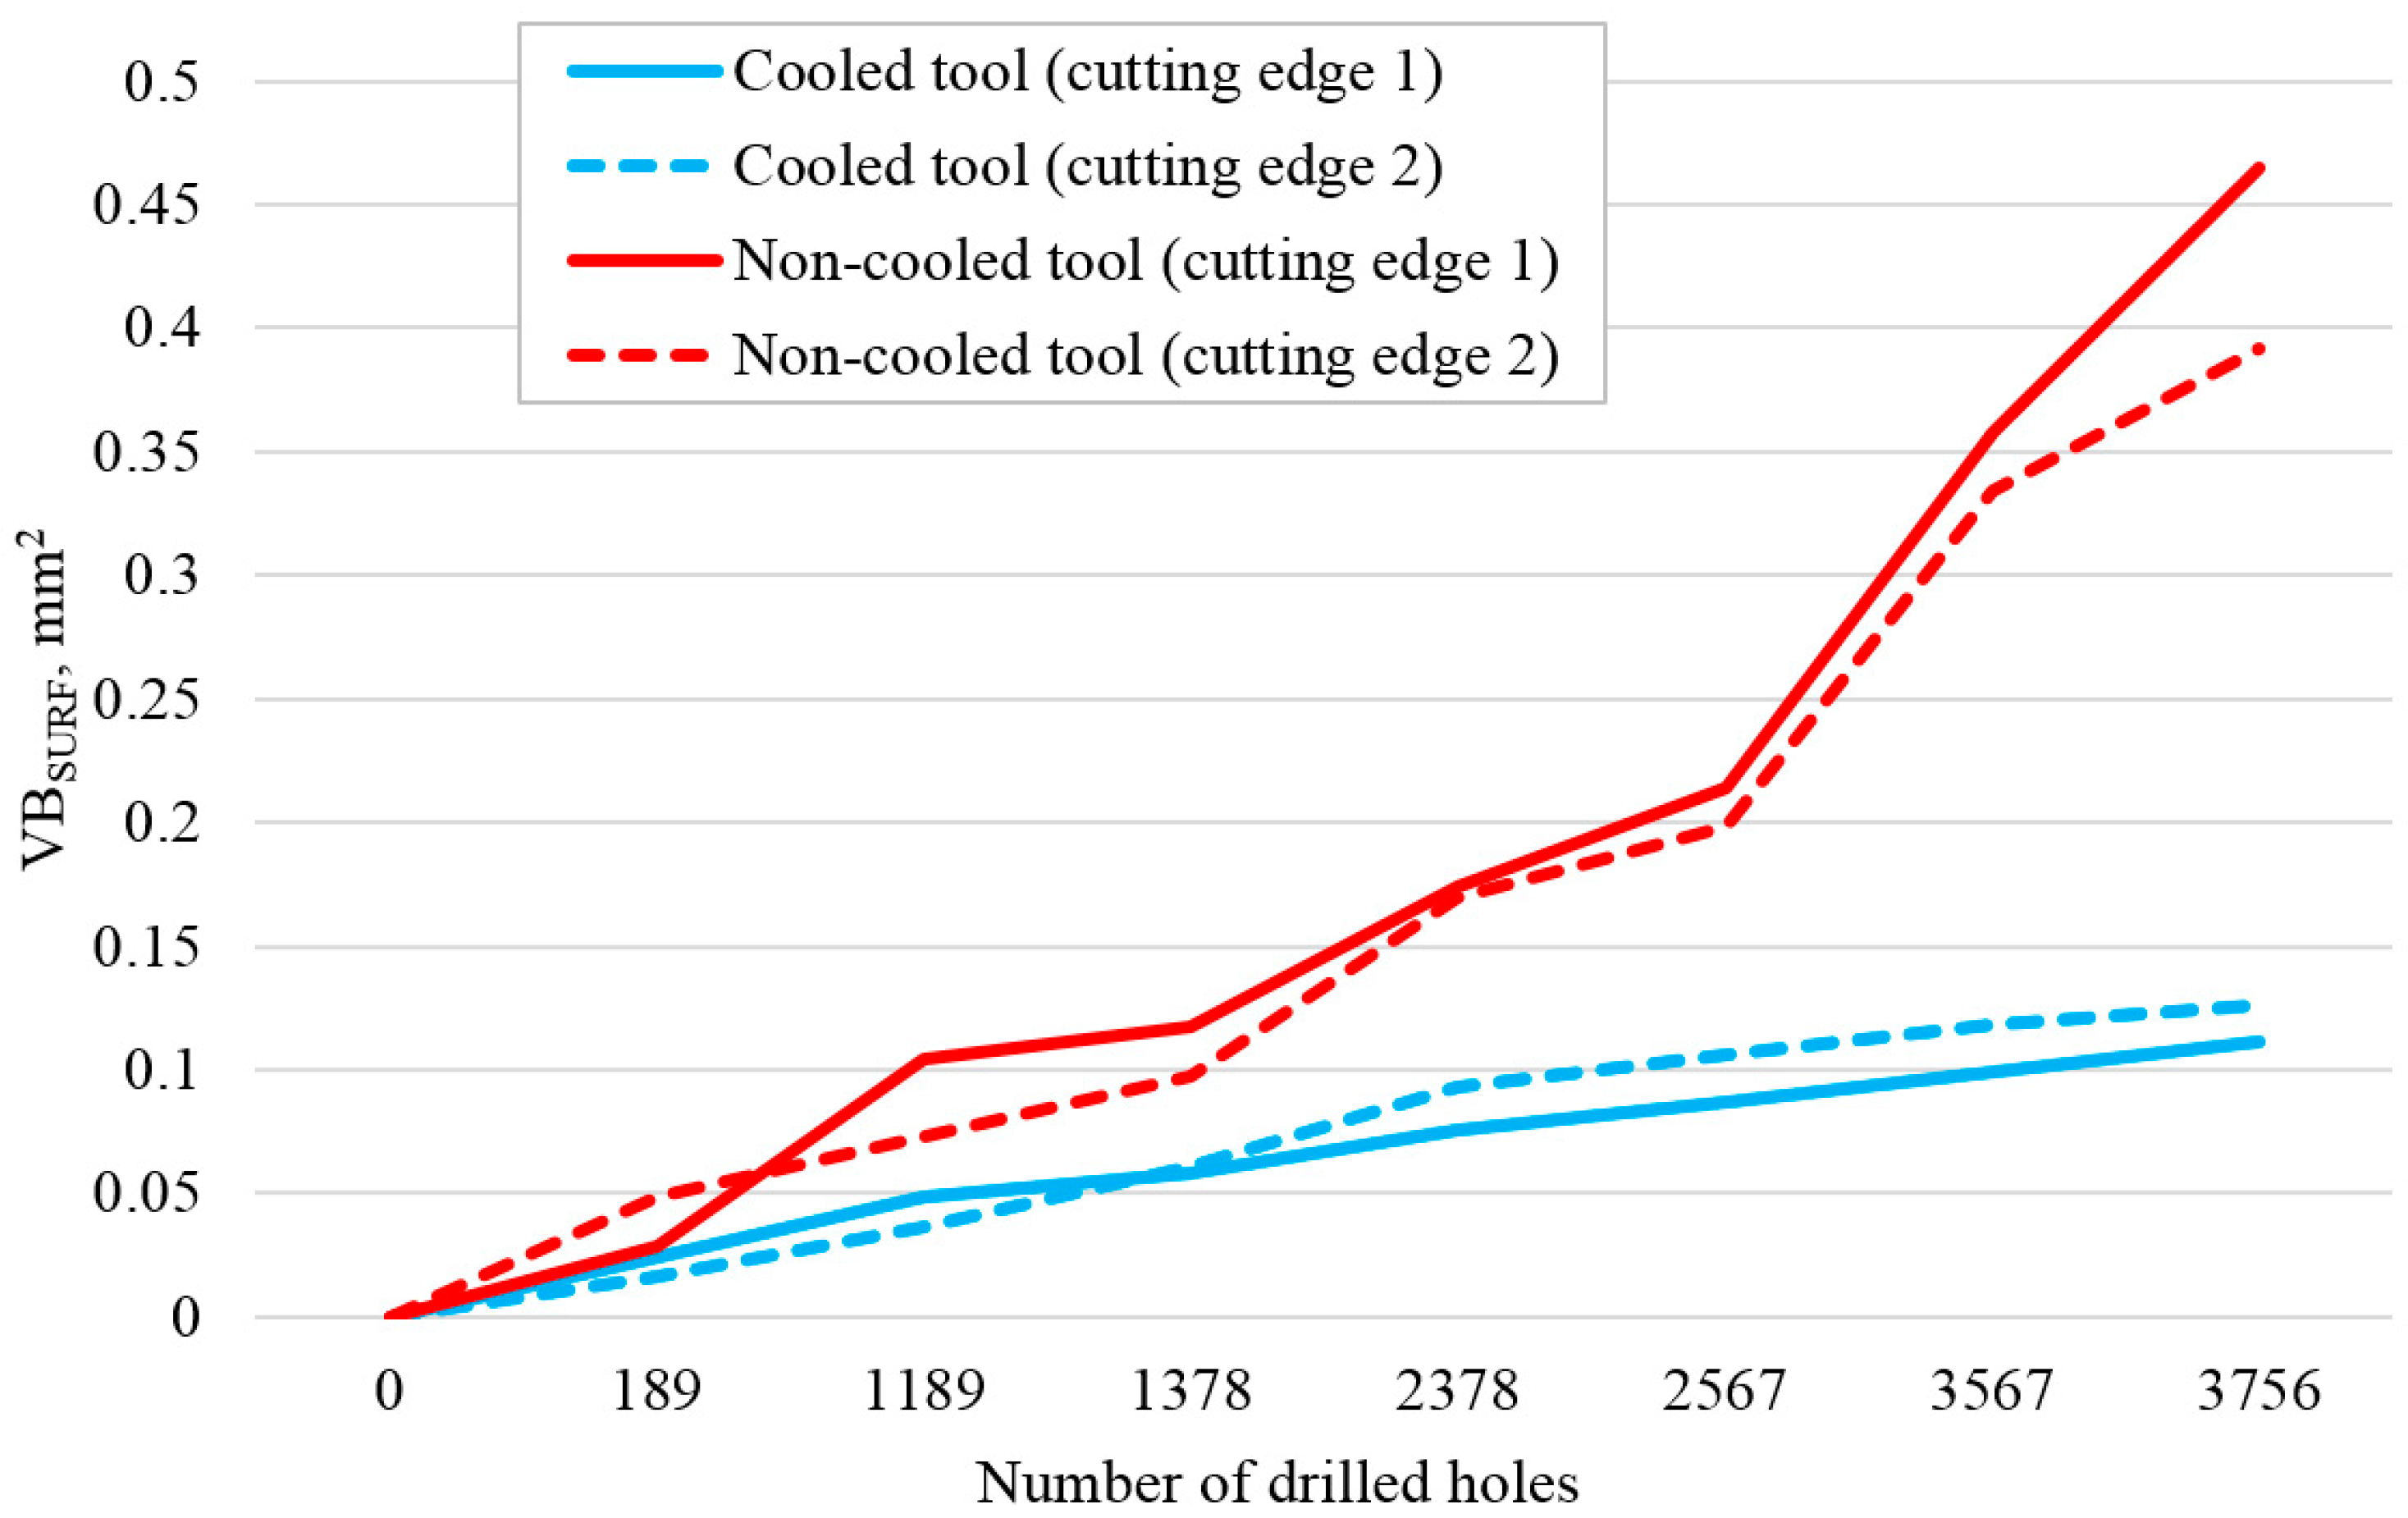
Values of both analyzed tool wear parameters for the cooled (C) and the non-cooled (NC) drill bits obtained during the drilling of all three stone samples using all combinations of machining parameters are presented in
Table 3. Additionally, the
VBSURF parameter is also graphically presented in
Figure 4.
These results demonstrate a substantial reduction in tool wear dynamics when using the cooled drill bit. This same conclusion is evident from the images of the drill bit flanks presented in
Table 4. After 3756 drilled holes, the cooled drill bit practically did not even reach 0.1 mm of flank wear width. These findings underscore the significance of removed particles in influencing wear dynamics during stone drilling.
Based on these results and the well-established correlation between cutting forces and tool wear, it was logical to assume a similar positive influence of cooling media on reducing cutting forces. The results for both types of drill bits and all three stone samples (S1, S2, and S3) are presented in
Table 5,
Table 6, and
Table 7, respectively. The results are expressed as the maximum values of resultant cutting forces, averaged over seven repeated measurements for each combination of drilling parameters. Before determining these maximum values, the force signals underwent filtration using a low-pass Butterworth filter, as detailed in
Section 2.2.1.
To eliminate the influence of tool wear on cutting forces, we conducted a comparative analysis using force signals measured under similar tool wear conditions for both types of drill bits. This involved comparing force signals recorded during the initial drilling of the first 189 holes with both types of drill bits. These signals were characterized by VBSURF parameter values for both cutting edges within the range of 0–0.024 mm2 for the cooled drill bit and 0–0.049 mm2 for the non-cooled drill bit.
Additionally, cutting force signals measured with the cooled drill bit during the final 189 holes, characterized by VBSURF parameter values for both cutting edges within the range of 0.099–0.126 mm2, were compared with the cutting force signals measured with the non-cooled drill bit worn to the similar wear level, which were described by VBSURF parameter values for both cutting edges falling in the range of 0.073–0.117 mm2.
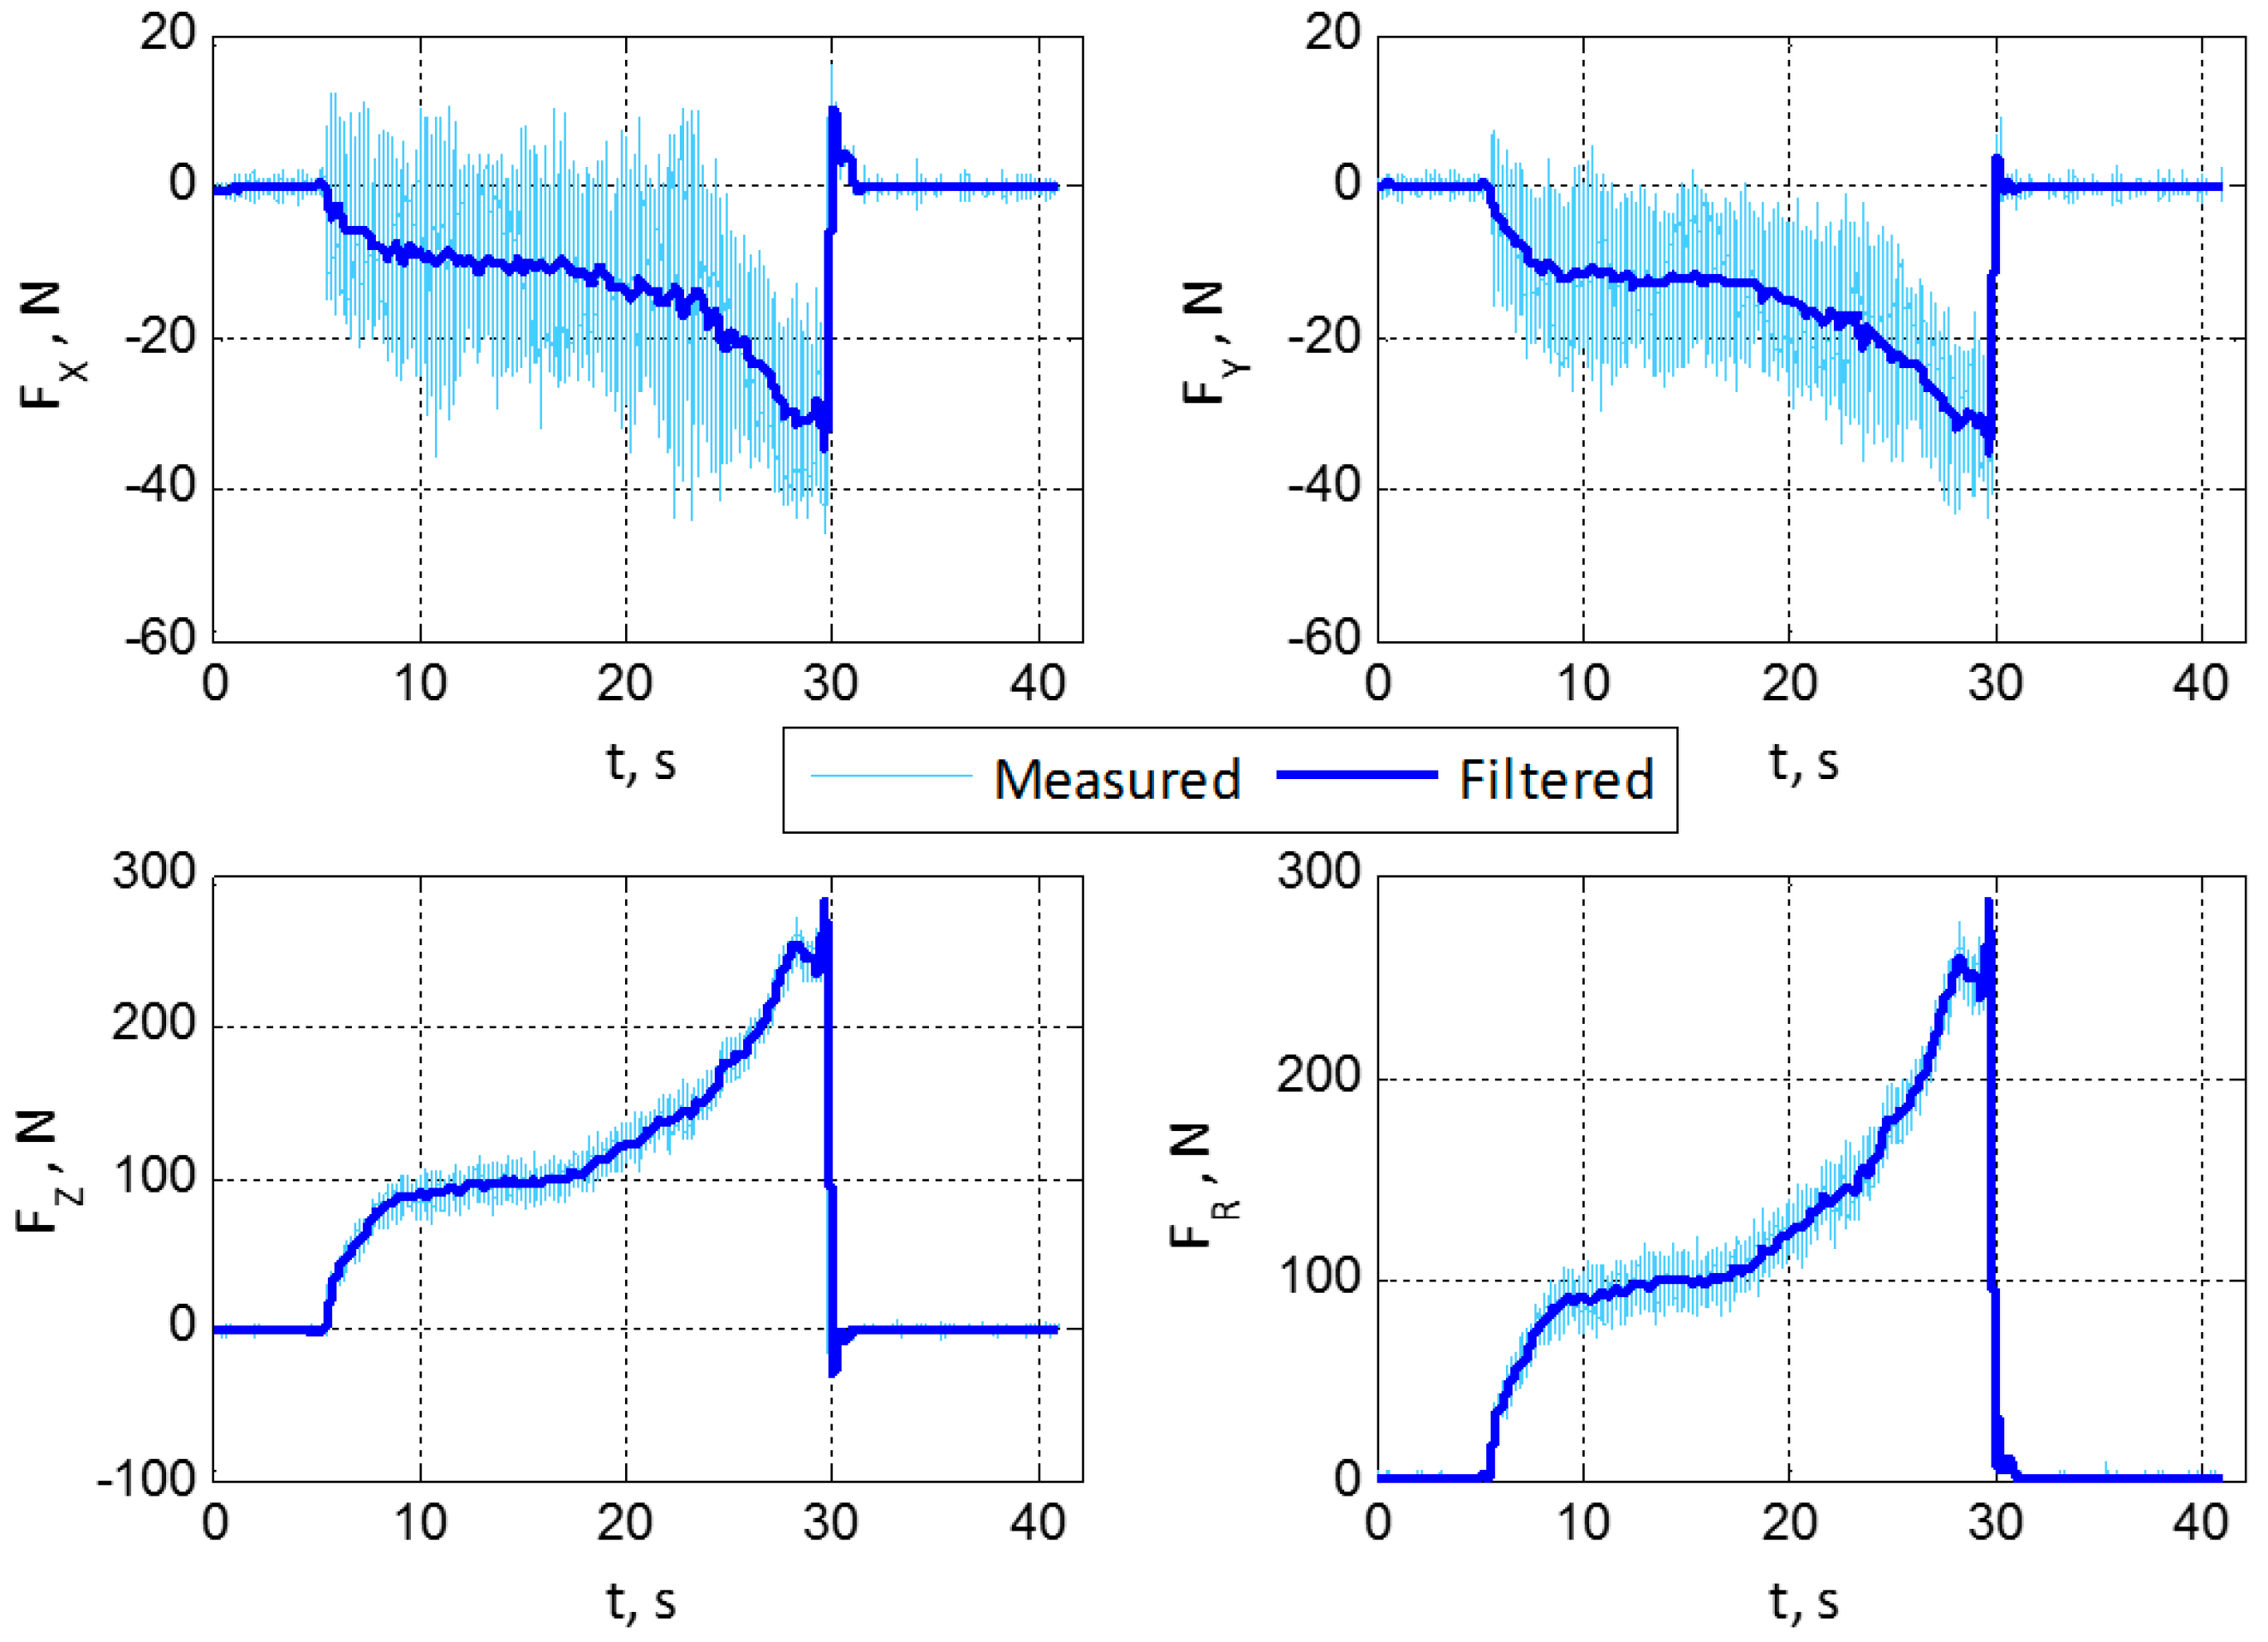
The average resultant forces achieved with the cooled drill bit were several times lower than those associated with the non-cooled drill bit (
Figure 5 and
Figure 6). The higher cutting forces observed with the non-cooled drill bit can be attributed to the negative influence of removed particles in the cutting zone. As the tool progresses through the workpiece, this influence becomes more pronounced due to the more challenging exit of particles from the hole (resulting from an increased quantity of particles combined with a longer exit path). This effect is clearly visible in
Figure 5, where the
FZ component exhibits a sudden increase in value around the midpoint of the hole. This signal pattern is characteristic of forces obtained with a non-cooled drill bit. In contrast, forces measured during drilling with the cooled drill bit exhibit practically constant dynamics once both cutting edges have entered the workpiece, as shown in
Figure 6.
The challenging and less intense removal of stone particles during drilling with conventional drill bits for stone machining is also attributed to the fact that the diameter of their body is smaller than the diameter of the cutting part of the tool, which includes both cutting edges (0.5 mm in this research). Difficult and low-intensity particle removal leads to an increased particle concentration in the cutting zone, with a particular impact on the flank surface of the tool. It results in a significant increase in friction between the cutting edges and the workpiece material, further leading to an increase in cutting forces.
Higher forces consequently influence the temperature rise in the cutting zone, and those two parameters, in combination with the abrasive effect of stone particles, negatively affect the dynamics of tool wear. In addition to having a negative impact on the dynamics of the flank wear, an increase in cutting forces can affect the chipping and fracture of cutting edges. On the other hand, an increase in cutting forces and temperature can also adversely affect the structure of the workpiece material in the cutting zone, potentially leading to delamination at the exit of through holes.
3.2. Stone Hardness Classification
In order to first analyze the impact of the internal cooling process on the intensity of vibration signals, the energy content of vibration signals generated by both cooled and non-cooled drill bits was established and compared. This comparison was made by calculating the Root Mean Square (RMS) of all signals. The RMS values for both types of drill bits were compared under identical combinations of machining parameters, vibration signal types (measured in the
x-,
y-, or
z-axis), stone types, and tool wear levels (determined by the intervals of
VBSURF parameter values presented in
Table 5,
Table 6 and
Table 7).
For 64% of signals, the RMS values of vibration signals from the cooled drill bit were lower than those from the non-cooled drill bit. The most significant differences in RMS values were observed when comparing vibration signals measured in the z-axis, where nearly 89% of signals exhibited lower RMS values for the cooled drill bit. This result aligns with our expectations, given that the highest stresses on the drill bit in this vertical drilling experiment occurred on the vertical or z-axis.
Classification of stone hardness was initially conducted independently for each of the eight feature groups (see
Table 2,
Section 2.2.2) and for each of the 23 selected and analyzed frequency bandwidths (
Section 2.4.2.). After analyzing 2560 energy values for each feature group, using CSR
MIN thresholds of 55%, 60%, and 65%, the results for each group of features are presented in
Table 8 and
Table 9. The choice of a minimum CSR value was based on the observation that for CSR
MIN values of 70% or higher, the number of features significantly decreased, consequently affecting CSR.
Table 8 presents the number of frequency bandwidths whose energies met the CSR ≥ CSR
MIN condition. The largest number of features meeting this criterion belonged to the group of features (XYZ) related to vibration signals measured in all three directions (x-, y-, and
z-axis). The best result for each group of features achieved using one of those energies is presented in
Table 9. These results demonstrate that individual features (energies) achieved relatively high precision (70–80%) in stone hardness classification.
In the next step, energies that satisfied the CSR ≥ CSR
MIN condition were further combined for each feature group. Given that vibrations related to the
z-axis had dominantly lower energy content for the cooled drill bit, the results for feature group Z, as well as the results for the best feature group, are presented in
Table 10. Results are presented as CSR for all three tests (T1, T2, and T3) and also separately for each type of stone (S1, S2, and S3). As expected, combinations of features achieved higher classification precision than individual features, reaching up to 90%. These results are entirely comparable to those achieved using the non-cooled drill bit [
11].
Although the energy content of vibration signals was lower in the case of the redesigned drill bit, these signals evidently retained information about the stone hardness. The selected features of the vibration signals remained strongly and unambiguously correlated with the hardness of the stone samples used in the experiment, achieving even greater precision in stone hardness classification.
4. Conclusions
The main focus of this research was a comparative analysis of cutting forces and tool wear achieved using the modified cooled drill bit and the industrially conventional non-cooled drill bit for stone machining in shop floor environments. The signals measured for both types of drill bits in nearly identical conditions revealed substantial reductions in cutting forces and tool wear dynamics when using cooled drill bits. Therefore, it can be concluded that drill bits with internally built-in cooling channels have significant potential in stone machining, as they greatly impact cutting dynamics, resulting in improved efficiency, lower cutting forces, and reduced tool wear. The positive effect of their industrial application can also be seen in shorter setup and finishing times due to cleaner processing, i.e., the absence of the need for additional workpiece cleaning after processing, as well as machine tool cleaning before mounting fixtures or clamping new workpieces.
On the other hand, virtually every type of machining process will eventually need to be upgraded with some form of monitoring system. These systems can revolutionize the machining process by enabling real-time adjustments, predictive maintenance, and data-driven insights for continuous improvement. Keeping this in mind and considering the positive results in stone hardness monitoring using vibration signals and a standard industrial non-cooled drill bit from a previous study, we conducted additional analysis with the cooled drill bit. Utilizing the same methodology for feature extraction and processing, the results showed the high potential of vibration signals in stone hardness classification. This potential remained high even in cases where vibration signals had lower energy content, thanks to the positive influence of the cooling channel.
All the mentioned results will serve as a solid foundation for the further development of monitoring systems. This includes the creation of multi-sensor systems for monitoring workpiece hardness and drill wear in stone drilling operations with the cooled drill bits.


